Profiling for Government Schools - RSU Sindh
110
19 Profiling for Government Schools School Education & Literacy Department Government of Sindh Infographical Reports, No. of Schools, Enrollment, Teachers, Basic Key Indicators, Ratio
-
Upload
khangminh22 -
Category
Documents
-
view
0 -
download
0
Transcript of Profiling for Government Schools - RSU Sindh
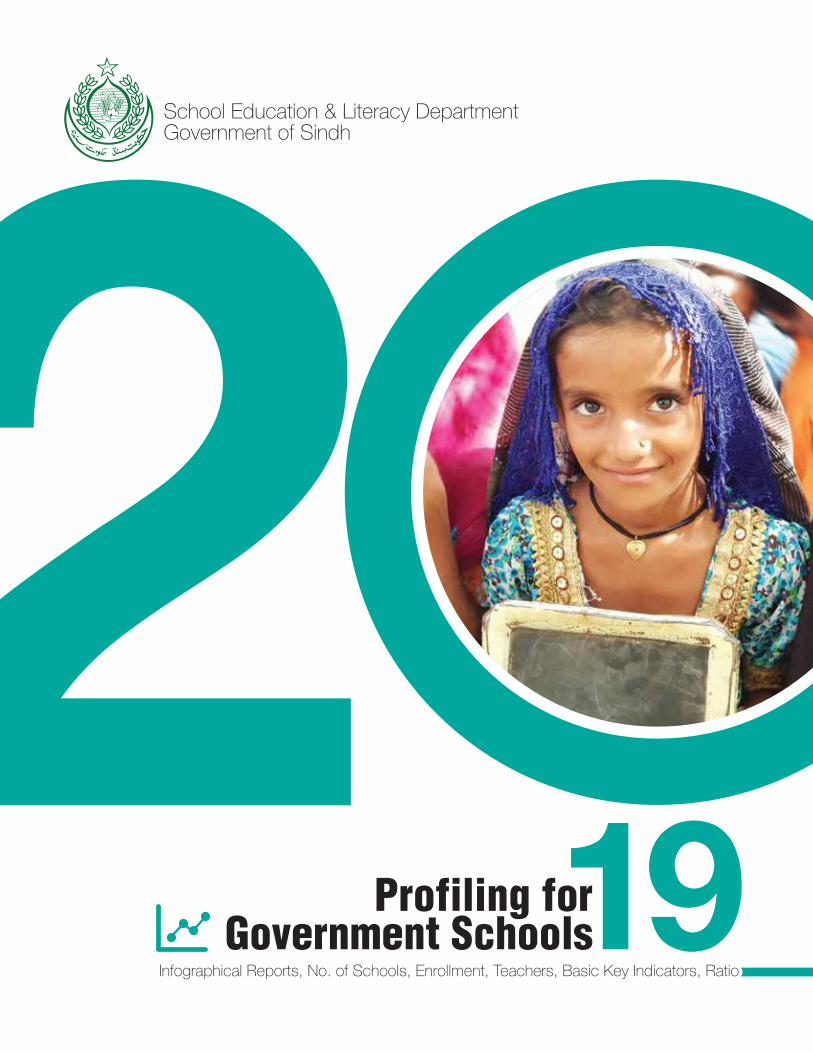
19Profiling forGovernment Schools
School Education & Literacy DepartmentGovernment of Sindh
Infographical Reports, No. of Schools, Enrollment, Teachers, Basic Key Indicators, Ratio


TABLE OF CONTENTS
01
02
03
Minister for Education, Sindh
Secretary School Education & Literacy Department, Govt. of Sindh
Chief Program Manager, Reform Support Unit, SELD, GoS
Messages01
Introduction02Preamble
Profiling of Government Schools
Process Flow of PGS 2019
Utilization of Profiling 2019 Data
04
07
0809
All Key Indicators03
Region wise Campus Schools 20
Level wise Student Classroom Ratio 19
Level wise Student School Ratio 18
Level wise Student Teacher Ratio 17
Availability of Basic Facilities 16
Teachers 15
Enrollment 14
Schools (Category wise) 13
Excutive Summary for
Public School04
Medium and Level wise Schools 27
Location and Level wise Schools 26
Shift wise Schools 25
Level and Status wise Schools 24
Level and Gender wise Schools 23
Level and Gender wise Teachers
Gender and Designation wise Teachers
34
35
Teachers06Level and Gender wise Enrollment in Public Schools
Class and Gender wise Enrollment in Public Schools
30
31
Students’ Enrollment05
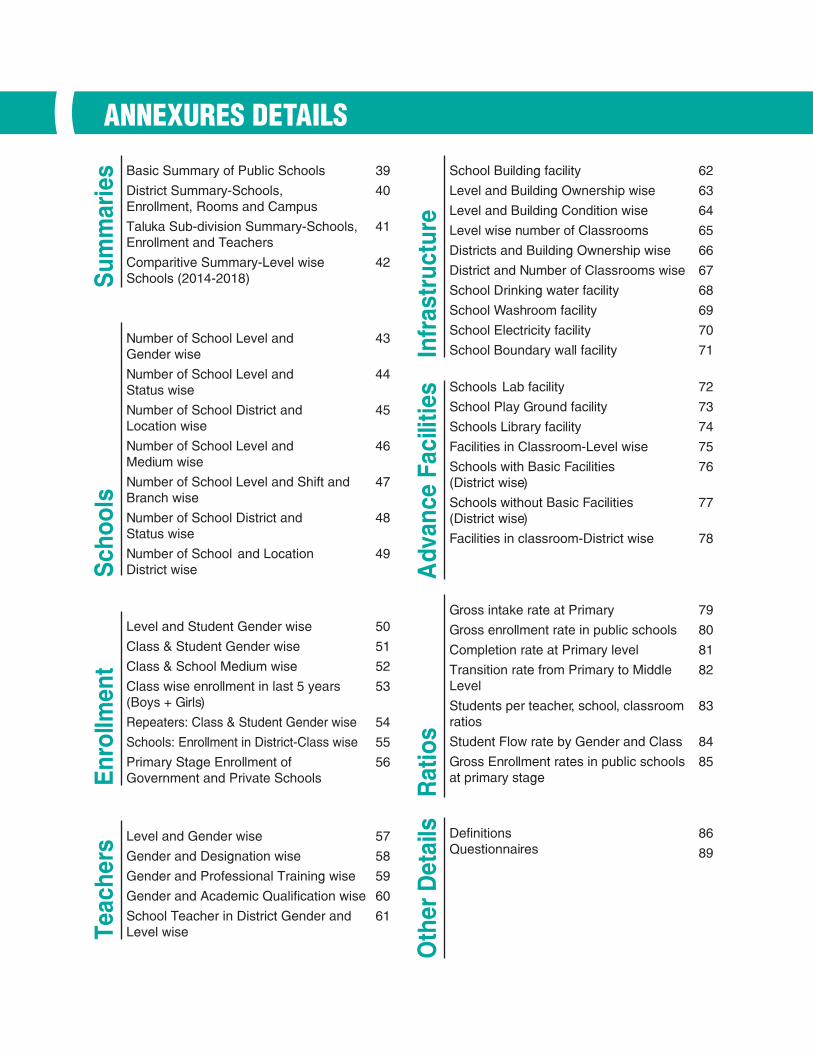
ANNEXURES DETAILSS
umm
arie
s Basic Summary of Public Schools
District Summary-Schools, Enrollment, Rooms and Campus
Taluka Sub-division Summary-Schools,Enrollment and Teachers
Comparitive Summary-Level wiseSchools (2014-2018)
39
40
41
42
Enr
ollm
ent
Level and Student Gender wise
Class & Student Gender wise
Class & School Medium wise
Class wise enrollment in last 5 years(Boys + Girls)
Repeaters: Class & Student Gender wise
Schools: Enrollment in District-Class wise
Primary Stage Enrollment of Government and Private Schools
50
51
52
53
54
55
56
Infr
astr
uctu
re
School Building facility
Level and Building Ownership wise
Level and Building Condition wise
Level wise number of Classrooms
Districts and Building Ownership wise
District and Number of Classrooms wise
School Drinking water facility
School Washroom facility
School Electricity facility
School Boundary wall facility
62
63
64
65
66
67
68
69
70
71
Rat
ios
Gross intake rate at Primary
Gross enrollment rate in public schools
Completion rate at Primary level
Transition rate from Primary to Middle Level
Students per teacher, school, classroomratios
Student Flow rate by Gender and Class
Gross Enrollment rates in public schoolsat primary stage
79
80
81
82
83
84
85
Sch
ools
Number of School Level and Gender wise
Number of School Level and Status wise
Number of School District and Location wise
Number of School Level and Medium wise
Number of School Level and Shift and Branch wise
Number of School District and Status wise
Number of School and Location District wise
43
44
45
46
47
48
49
Teac
hers
Level and Gender wise
Gender and Designation wise
Gender and Professional Training wise
Gender and Academic Qualification wise
School Teacher in District Gender and Level wise
57
58
59
60
61
Adv
ance
Fac
ilitie
s Schools Lab facility
School Play Ground facility
Schools Library facility
Facilities in Classroom-Level wise
Schools with Basic Facilities (District wise)
Schools without Basic Facilities (District wise)
Facilities in classroom-District wise
72
73
74
75
76
77
78
Oth
er D
etai
ls DefinitionsQuestionnaires
86
89

79
82
83
656667686970
71
PGS 2019 ACRONYMS
Annual Development PlanAssociate Diploma in EngineeringAccountant GeneralAnnual School CensusAcademic and TrainingBasic Education Community CentreBachelors of EducationBureau of CurriculumBasic Pay SacleCommmunity Mobilization ProgramContinuous Professional DevelopmentCertificate of TeachingCurruculum WingDistrict OfficerEarly Childhood TeacherEngineering WorksGeograhic Information SystemGovernment of SindhGlobal Positioning SystemGirl's StipendHead Master/Head MistressHuman Resource Management Information SystemHigh School TeacherHead TeacherInternal Communication SystemInformation TechnologyJunior Elementary School Teacer Karachi Municipal Corporation/District Municipal CorporationLocal Support UnitMasters of Education Monitoring & EvaluationMonitoring & Repair/requiredMaster TrainersNational Commission for Human DevelopmentNational Education Management Inforamtion SystemNon Formal EducationPlanning and Development Finance
ADPADEAGASCA&TBECCB EDBOCBPSCMPCPDCTCWDOECTEWGISGOSGPSGSHMHRMIS HSTHTICSITJEST KMC/DMC LSUM ED M&E M&R/R MT NCHD NEMIS NFE PDF
SHORTS CODE DESCRIPTION

PGS 2019 ACRONYMS
Primary,elementary and Middle SchoolsProvincial Institute of Teacher EducationProfiling of Government SchoolPublic Private PartnershipPrimary School TeacherPrimary Teaching CertificateSecondary and Higher Secondary SchoolsSindh Annual School Census (Mobile Application)Standarized Achievement TestSindh Basic Education ProgramSchool ConsolidationStudent Classroom RatioSustainable Development RatioSustainable Development GoalSEMIS CodeSchool Education & Literacy DepartmentSindh Education Maganement Information SystemSindh Education Reform ProgramSindh Education Sector PlanSchool Infrastructure DevelopmentSchool Management CommiteeShort Message ServiceScheduled New ExpendtureStandard Operating ProcedureSindh Reading ProjectSchool Specific BudgetStudent School RatioSindh Text Book BoardSindh Techincal Education & Development AuthorityStudent Teacher RatioTaluka Education OfficerTeachers RecruitmentTeachers Recruitment PolicyTracking IdUnion CouncilThe United States Agency for International DevelopmentWorld Bank
P/E/MPITEPGSPPPPSTPTCSEC /H. SECSASCSATSBEPSCSCRSDRSDGSCSELDSEMISSERPSESPSIDSMCSMSSNESOPSRPSSB SSRSTBBSTEDASTRTEOTRTRPTIDUCUSAIDWB
SHORTS CODE DESCRIPTION


04
PREAMBLE
The objective of SELD is to provide equal opportunity of quality education to all children and the youth of Sindh to realize their full potential and contribute to the development of society and economy creating a sense of nationhood and inculcating values of tolerance, social justice and democracy.
The department makes integrated efforts to enhance the service delivery by upgrading the departmental capacity at all levels, by forming effective system of governance and by incorporating technology to improve quality in outcomes at the grass-root level.
Minister Education & Literacy
Secretary School Education & Literacy
SpecialSecretary I
(School)
AdditionalSecretary I
(School)
AdditionalSecretary
A&T
AdditionalSecretary
GA
AdditionalSecretaryJudicial
AdditionalSecretary II
(School)
AdditionalSecretary III
(School)
AdditionalSecretary
SpecialSecretary II
(A&T)
SpecialSecretary III
(LAW)

05
PREAMBLE
Allied Institutions / Agencies
SecretarySchool Education & Literacy
Reform Support Unit Reginal Directorate
of School
Provincial CurriculumWing
Directorate of Non-FormalBasic Education
Sindh EducationFoundation
Sindh BasicEducation Program
Directorate ofHR & Training
Directorate of M&E
Sindh Text Book Board
Sindh Teachers EducationDevelopment Authority
Provincial Institute of Teacher Education
PREAMBLE
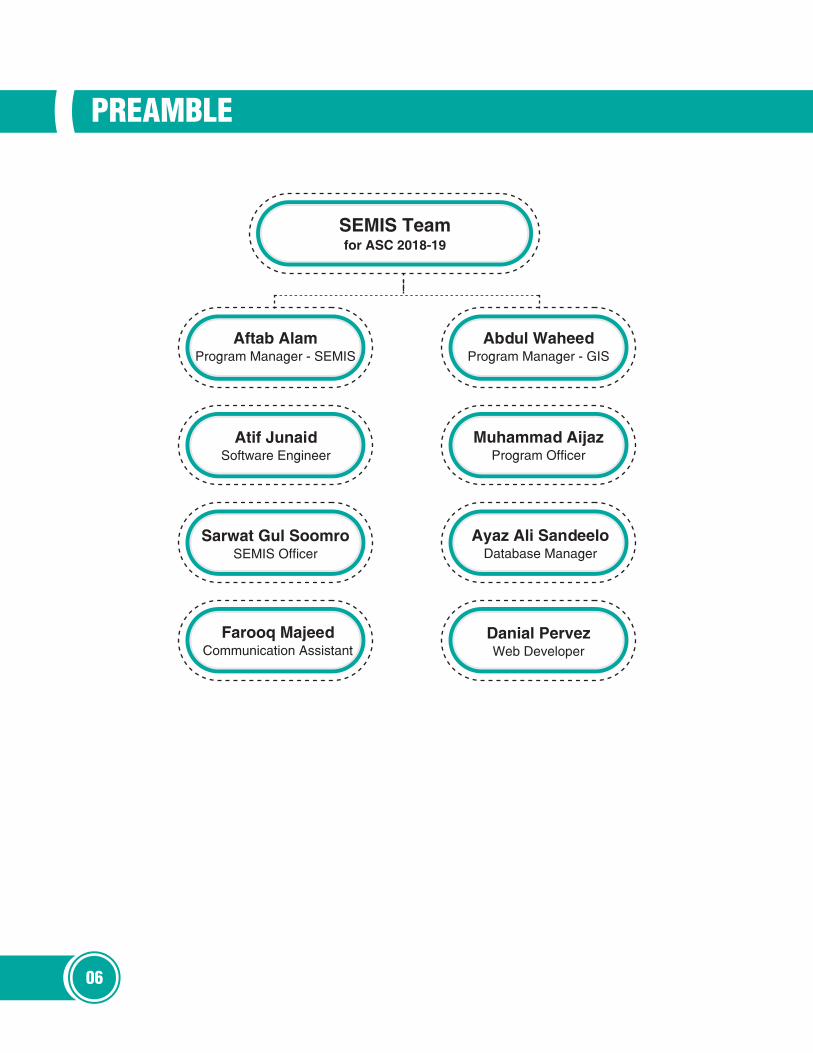
06
Abdul WaheedProgram Manager - GIS
Danial PervezWeb Developer
Ayaz Ali SandeeloDatabase Manager
Muhammad AijazProgram Officer
Aftab AlamProgram Manager - SEMIS
Atif JunaidSoftware Engineer
Sarwat Gul SoomroSEMIS Officer
Farooq MajeedCommunication Assistant
SEMIS Teamfor ASC 2018-19

07
Profiling of GOVERMENT SCHOOLS
School Education and Literacy Department (SELD) initiated the exercise of “Profiling for Government Schools (PGS) 2019”. The purpose of Profiling of schools (Annual School Census) is to collect information regarding School Enrollment, detail of existing Human Resources , School Clustering & Consolidation, Infra-structure including Basic & Advance Facilities etc. This information will enable the decision makers of Education Sector to develop the result based policies with proper planning and their actionable plans.
This information is used as a baseline for the Sindh Education sector plan and roadmap SESP&R 2019-2024 which broadly covers School Infrastructure Development (SID), Annual Development Plan (ADP), Teacher Recruitment, Free Text Books, School Management Committees (SMCs), Standardized Achievement Test (SAT), Girls Stipend (GS) and other reform initiatives as well as this data is also used for proper allocation distribution of funds.
It is pertinent to mention that the this huge and exhaustive exercise of Public school profiling has been conducted through the resources of SELD and by incorporating technology to attain the reliable results. Further, a detailed proforma was designed for data collection and an online application was developed to enter the data at “Regional/District Data Centers”. Local Support Unit (LSU) and SESP regional Coordinators (RCs) were given the responsibility of facilita-tors to support and guide the users/operators in data collection.
The data for 49,103 schools were collected and digitized by the Head Masters and Mistresses after an extensive training at the district level. In this overall activity the Directorate of Monitoring and Evaluation immensely supported the team by assigning their task force (Monitoring Assistants) especially in district Tharparkar, Sujawal and Thatta. Further, about fifteen thousand teachers were deployed to validate the school data by through the physical verification and collecting the evidences through a mobile application developed by the technical team of SELD.
During the current ASC 2018-19, Tracking ID (Non-SEMIS Code) schools were also surveyed & their Data have also been included in the current ASC. It is to be noted that the Tracking ID is a temporary arrangement for identification of non-SEMIS Code schools. The Tracking ID will be shifted to SEMIS system, when the competent forum approves the allotment of SEMIS Code after fulfillment of required codal formalities. It is important to mention here that due to inclusion of the data of Tracking ID schools (3,470) and the data of previously parked schools (3,172) in the current ASC 2018-19, some significant variations in some data field(s)/report(s) may be found, as compared to the trend of previous ASC reports.

08
Process Flow of PGS 2019
PGS 2019 Proforma.GPS Coodinates.Online Entry.Conducted by IBA/MAs.
Data Collection Submission of PGS Form
Submission of Clean& Finalized Data
Submission of Final Data to RSU Form Returns to
IBA HMs & MAs
Data Validationof Entered Data
Data Cleaning& Error Correction
Submission ofPGS Form
Submission of PGS Form
Data Cleaning.Data Compilation.
Submission of PhysicalForms.Archiving of PhysicalForm
If Error Found in Forms.
Data Validation of 10%data through MobileApps by NTS Teachers.
Data Error Correctedonline throughInconsistency Checks.
Online Data Entry ofform by IBA HMs/MAs
Physical Forms.Proforma Submittedto District LSU office (IPGS).
Forms Submitted to District Data Centre.Online Entry of HPs Schools by DIOs.

09
Utilization of PGS Data
The Directorate of Monitoring and valuation has been set up in the School Education and Literacy Department to monitor and evaluate the teachers’ attendance and other school indicators. Through monitoring students’ enrollment, infrastructure availability and teachers’ presence is being tracked. Under this initiative District Monitoring Units are being established.
The School Education and literacy Department, Government of Sindh, initiated distribution of stipends since 2001-2002under the Sindh Structural Adjustment Credit (SAAC). The Reform Support Unit took this responsibility form 2005. Initially, the stipend was distributed through money orders. Over the passage of years, new interventions were introduced and now through branchless banking bio-metric system girls’ stipend is being disbursed in a transparent manner.
SMCs are formed in every main and functional school for development of school education through community ownership. Under the committee, the funds are utilized for the repair and maintenance transport and cleanliness (sweeper) of school.
Monitoring & Evaluation Girl’s Stipend
School ManagementCommittee
Human Resource ManagementInformation System
To rationalize government school facilities and resources school consolidation policy is being implemented. Under the policy, consolidated schools are operated as Campus school (single school), It covers three types of schools; adjoining schools, embedded / same premise schools and school that are within a stipulated distance of each other.
School Consolidation /Clustering
School Education & Literacy Department bring continuous improvements in SSMS by increasing the reach of school monitors and enhancing the application to ensure reliability in the real time data.
Sindh School MonitoringSystem (SSMS)
Standardized Achievement Test
Administrator of the SAT on a regular basis, accompanied by third party review to strengthen the reliability and validity of the test results of class V and VIII in science, mathematics and language.
The new initiative of advanced and intigrat-ed HRMIS has been taken by the School Education and Literacy Department, Government of Sindh which will allow the department to keep the track and update information of human resources at the provincial level.
Free Textbook
Every year free text books are distributed among public schools. Earlier, Books were distributed to primary classes only but since 2006 books are being distributed from katchi till class X.

PGS 2019KEY
INDICATORS


Executive Summary for ALL KEY INDICATORS
Total Schools
45,633
49,103
SC
TID
3,470
Number increaseddue to inclusion oftracking ID schools
Total Schools45,555
Non-ViableSchools3,172
Tracking IDsSchools3,470
Schoolswith
SEMIS Code45,633Viable
Schools42,383
Total Schools49,103
13
Prim
ary
44,2
96
Mid
dle
1,89
5
Ele
men
tary
817
Sec
onda
ry
1,77
7
Hig
her
Sec
onda
ry
318
Tracking ID is a temporary arrangement for identification of Non-SEMIS code schools

Enrollment
4,561,140
4,229,128
2,812,000
62%
1,749,140
Boys38%Girls
Total 4,561,140
332,012 7%The enrollment of public schools
have increased by 7%
PGS 2019
ASC 2016-17
1,000,0000 2,000,000 3,000,000 4,000,000 5,000,000
14
Executive Summary for ALL KEY INDICATORS

Teachers
17,711 13%The number of teacher decreased
moslty due to super annuationand voluntary retirement
Total133,076
68%Male
32%Female
90,207 42,869
ASC 2018-19
ASC 2016-17
133,076
150,787
30,0000 60,000 90,000 120,000 150,000
15
Executive Summary for ALL KEY INDICATORS

Avaiblibilty of Basic Facilities in Public Schools
Total Surveyed Schools 49,103
22,843
47% 35% 60% 55% 13%
Water Electricity Toilet Boundary Wall Hand Wash
17,231 29,634 27,144 5,773
16
Executive Summary for ALL KEY INDICATORS

Rate & Ratio Student Teacher RatioStudent Teacher
7,836
185,047
918,706
33,407
Primary38
Middle24
4,311
140,032
Elementary32
397,493
9,711Higher Secondary41
Overall STR
Secondary28
Students4,561,140
34Students per Teacher
Teachers133,076
77,811
2,919,862
17
Executive Summary for ALL KEY INDICATORS

Rate & RatioStudent School Ratio
Student School
1,895
185,047
918,706
1,777
Primary66
Middle98
817
140,032
Elementary171
397,493
318Higher Secondary1,250
Overall SSR
Secondary517
Students4,541,160
93Students per School
Schools49,103
2,919,862
44,296
18
Executive Summary for ALL KEY INDICATORS

Rate & Ratio Student Classroom RatioStudent Classroom
6,579
185,047
918,706
19,082
Primary39
Middle28
4,100
140,032
Elementary34
397,493
5,339Higher Secondary74
Overall SCR
Secondary48
Students4,561,140
41Students per Classroom
Classrooms 110,715
2,919,862
75,615
19
Executive Summary for ALL KEY INDICATORS

Region wise Campus School
Hyderabad Region930 schools have been merged and 381 schools decleared as Campus Schools
Karachi Region689 schools have been merged and 251schools decleared as Campus Schools
Larkana Region318 schools have beenmerged and 198 schoolsdecleared as Campus Schools
Sukkur Region253 schools have been merged and 213 schools decleared as Campus Schools
Mirpurkhas Region220 schools have been merged and 102 schools decleared as Campus Schools
Shaheed Benazirabad Region 336 schools have beenmerged and 204 schoolsdecleared as Campus Schools
381
251
198
213
Campus Schools
1,349
102
204
20
Executive Summary for ALL KEY INDICATORS

PGS 2019SCHOOLS


PGS 2019 PUBLIC SCHOOLS
Level and Gender wise Schools
7,712 17.41%
5,46812.34%
31,116 70.25%
290 15.30%
467 24.64%
1,138 60.05%
12415.18%
20424.97%
48959.85%
418 23.52%
472 26.56%
887 49.92%
7322.96%
7423.27%
171 53.77%
44,296
1,895
817
1,777
318
Middle
Elementary
Primary
Higher Secondary
Secondary
Boys Girls MixedTotal
8,617
17.55% 13.61% 68.84%
6,685 33,801 49,103
23

PGS 2019 PUBLIC SCHOOLS
Category wise School Status
24
schools

PGS 2019 PUBLIC SCHOOLS
Level and Shift wise Schools
Gender and Shift wise Schools
Afternoon / Morning Shift
8361.68%
Morning Shift48,02397.84%
Both Shift244
0.48%
15.71%
8,317
Boys
Girls
Mixed
6,504
33,20070.82%
274
Boys
Girls
Mixed
158
402
24
Boys
Girls
Mixed
21
199
Morning Shift Afternoon / Morning Shift
Both Shift
72
0/
//
/.5
//
4/2
7/3055
0
21*366
/*561
532
/*3711.3
25

PGS 2019 PUBLIC SCHOOLS
Middle ElementaryPrimary Higher SecondarySecondary
Location and Level wise Schools
Location and Gender wise Schools
40,557 91.55%
3,739 8.45%
316 16.68%
238 28.64%
759 42.71%
127 39.94%
1,579 83.32%
579 71.36%
1,018 57.29%
19160.06%
Boys
Urban
GirlsMixed
Boys
Rural
GirlsMixed
994 19%
1,012 20%
3,171 61%
30,630 70%
43,92489.45%
5,17911.55%
5,689 13%
7,605 17%
5,179 Urban Rural43,924
26

PGS 2019 PUBLIC SCHOOLS
Medium and Level wise Schools
Urdu Mixed
Sindhi English
122 4#
21/#
1,748 70#
4:/#
Middle
Urdu Mixed
Sindhi English
4,176 7%
136 <1%
39,970 93%
14<1%
Primary
Urdu Mixed
Sindhi English
342#
5/#
777 73#
1:/#
Elementary
Urdu Mixed
Sindhi English
24 6#
8806#
205 42#
1:/#
Hi. Secondary
Urdu Mixed
Sindhi English
823#
1175#
1,574 67#
4:/#
Secondary
27


PGS 2019Enrollment


PGS 2019 ENROLLMENT
Level and Gender wise Enrollment
1,797,818 40# 1,122,044 16#
75,089 2/#
62,461 23#
359,686 17#
129,860 11#
109,958 37#
77,571 33#
559,020 4/#
267,633 45#
2,812,000 40# 1,749,140 16#
Middle
Elementary
Primary
Higher Secondary
Secondary
2,919,862
185,047
140,032
918,706
397,493
Total Enrollment 4,561,140
30

-
100,000
200,000
300,000
400,000
500,000
600,000
Kachi Class I Class II Class III Class IV Class V Class VI Class VII Class VIII Class IX Class X Class XI Class XIIClasses
Class and Gender wise Enrollment
2,812,000 [62%] 1,749,140 [38%]Total
Enrollment4,561,140
31
Pre-Primary
Student Gender Kachi Class I Class II Class III Class IV Class V Class VI Class VII Class VIII Class IX Class X Class XI Class XII
Boys 516,498 378,964 337,928 303,693 267,060 235,605 158,941 146,164 128,445 129,526 118,872 46,396 43,908
Girls 368,745 241,143 209,177 191,108 165,037 143,978 90,277 86,302 80,399 70,273 63,887 19,720 19,094
Total 885,243 620,107 547,105 494,801 432,097 379,583 249,218 232,466 208,844 199,799 182,759 66,116 63,002
Primary Middle Secondary Higher Sec
PGS 2019 ENROLLMENT

PGS 2019Teacher


PGS 2019 TEACHER
Level and Gender wise Teacher
77,811
20,6
81
57,1
30
2,70
0 5,
136
1,88
4 2,
427
14,1
03
19,3
04
3,50
1 6,
210
7,836 4,311 33,407 9,711
Total133,076
68%Male
32%Female
90,207 42,869
34

PGS 2019 TEACHER
Designation and Gender wise Teachers
90,207 Male Teacher Female Teacher42,869
Primary School Teacher 86,307
Junior Elementary School Teacher 11,796
High School Teacher 16,986
Subject Specialist581
Physical Training Instructor 1,522
Workshop Instructor Teacher 523
Head Master / Mistress 4,406
Drawing Teacher 1,595
Others5,980
*Non-Government Teacher3,301
No Info79
59,519
26,788
6,445
5,351
10,906
6,080
392
189
1,143
379
501
22
3,416
990
1,145
450
4,432
1,548
2,250
1,051
58
21
35
*Non-Government Teachers refers to the service of teachers provided by donor agencies, NGOs etc,who work on temporary basis.

PGS 2019Annexures


39
Basic Summary of Government Schools (Profiling 2019)
Note : Total schools including that merged in campus schools is consolidation program.
Sindh Province
School Level Boys Girls Co-Edu. Total Total Male Female Total Rooms Classrooms
Primary 7,712 5,468 31,116 44,296 1,797,818 62% 1,122,044 38% 2,919,862 57,130 20,681 77,811 93,207 75,615
Middle / Elementary 414 671 1,627 2,712 187,529 58% 137,550 42% 325,079 7,563 4,584 12,147 15,686 10,679
Secondary 418 472 887 1,777 559,020 61% 359,686 39% 918,706 19,304 14,103 33,407 31,168 19,082
Higher Secondary 73 74 171 318 267,633 67% 129,860 33% 397,493 6,210 3,501 9,711 9,263 5,339
Total 8,617 6,685 33,801 49,103 2,812,000 62% 1,749,140 38% 4,561,140 90,207 42,869 133,076 149,324 110,715
TeachersEnrolmentNumber of Institutes Number of Rooms and Classrooms
Boys Girls

40
Note : Total schools including schools that merged in campus schools in schools consolidation program.
District Summary : Schools, Enrollment, Teachers and etcCampus
Div District Name Boys Girls Mixed Total Boys Girls Total Male Female Total Rooms Classrooms Schools
Badin 365 364 2,398 3,127 143,321 69,897 213,218 4,246 1,117 5,363 6,414 4,862 57 Dadu 257 335 1,484 2,076 141,682 90,471 232,153 4,668 1,501 6,169 6,378 5,007 37 Hyderabad 143 144 620 907 100,229 84,902 185,131 4,129 4,054 8,183 6,362 4,413 112 Thatta 552 182 873 1,607 50,854 27,580 78,434 1,727 663 2,390 3,476 2,501 20 Jamshoro 147 100 595 842 56,730 38,866 95,596 2,006 861 2,867 3,446 2,534 52 Mitiari 55 105 811 971 65,898 37,161 103,059 2,378 713 3,091 3,416 2,546 34 Tando Allah Yar 226 90 519 835 59,574 31,039 90,613 1,395 494 1,889 2,920 2,039 23 Tando Muhammad 224 144 798 1,166 44,282 23,074 67,356 1,629 479 2,108 2,735 2,063 30 Sujawal 508 195 1,126 1,829 46,726 22,135 68,861 1,551 269 1,820 2,702 2,183 16 Central Karachi 162 120 339 621 44,318 52,301 96,619 1,711 4,308 6,019 5,718 3,798 35 East Karachi 70 52 163 285 22,578 28,381 50,959 885 2,184 3,069 3,107 2,116 43 South Karachi 90 83 181 354 26,610 35,728 62,338 982 2,187 3,169 3,789 2,692 53 West Karachi 132 95 372 599 40,623 46,201 86,824 1,401 1,685 3,086 4,285 2,837 36 Malir Karachi 112 129 504 745 36,527 32,950 69,477 1,425 1,147 2,572 3,747 2,383 33 Korangi Karachi 83 77 272 432 40,440 52,344 92,784 1,048 3,116 4,164 4,542 2,958 51Jacobabad 200 248 1,107 1,555 94,359 54,085 148,444 3,601 1,011 4,612 3,563 2,900 23 Larkana 193 215 879 1,287 152,861 113,114 265,975 4,755 2,172 6,927 6,019 4,661 112 Shikarpur 337 190 847 1,374 98,172 53,649 151,821 3,306 899 4,205 4,713 3,149 28 Kashmore 237 233 1,211 1,681 104,287 43,176 147,463 3,209 613 3,822 3,123 2,512 25 Kambar-Shahdadkot 426 280 1,011 1,717 119,194 79,757 198,951 3,854 1,249 5,103 4,986 3,975 10 Khairpur Mirs 471 483 2,663 3,617 217,215 133,396 350,611 6,805 2,246 9,051 10,689 8,064 130 SUKKUR 234 184 857 1,275 112,273 73,966 186,239 3,237 1,332 4,569 5,711 3,903 62 Ghotki 453 289 1,489 2,231 140,122 62,762 202,884 3,862 843 4,705 5,381 4,089 21 Mirpur Khas 637 304 1,370 2,311 115,618 55,826 171,444 3,270 1,418 4,688 5,808 4,239 36Tharparkar 489 585 3,195 4,269 119,087 59,705 178,792 4,162 531 4,693 7,599 6,073 33 Umerkot 738 509 1,498 2,745 96,680 41,208 137,888 2,945 738 3,683 5,394 4,239 33Sanghar 454 322 2,574 3,350 177,287 89,938 267,225 5,629 1,724 7,353 7,893 6,167 54 Naushero Feroze 190 254 2,108 2,552 171,515 110,412 281,927 5,626 1,683 7,309 7,537 5,822 51 Shaheed Benazirabad 432 374 1,937 2,743 172,938 105,116 278,054 4,765 1,632 6,397 7,871 5,990 99
8,617 6,685 33,801 49,103 2,812,000 1,749,140 4,561,140 90,207 42,869 133,076 149,324 110,715 1,349
SBA at NS
No. of Schools Enrolment Teachers
Provincial Total
No. of Rooms and Classrooms
Hyderabad
KarachiLarkana
SukkurM
irpurkhas

41
Taluka / Sub-Division Summary : Number of Schools, Enrolment and TeachersTaluka Schools Enrolment Teachers Taluka / Sub Division Schools Enrolment Teachers Taluka Schools Enrolment Teachers
Badin 833 53,563 1,422 Liaquatabad 111 17,932 1,101 Faiz Ganj 492 36,194 837Golarchi-S.F.Rao 576 32,354 716 Gulberg 127 16,227 1,319 Gambat 317 34,580 894Matli 691 58,582 1,596 Nazimabad 130 18,475 1,232 Khairpur Mirs 398 63,457 1,954Tando Bago 731 46,903 1,061 North Nazimabad 88 13,237 826 Kingri 371 51,836 1,294Talhar 296 21,816 568 New Karachi 165 30,748 1,541 Kot Diji 567 52,290 1,324Dadu 640 78,803 2,585 Ferozabad 128 22,709 1,374 Mirwah 813 56,477 1,500Johi 509 35,116 895 Jamshed Quarters 76 13,381 902 Nara 386 20,229 443K N Shah 472 51,353 1,300 Gulshan-e-Iqbal 32 6,401 406 Sobhodero 273 35,548 805Mehar 455 66,881 1,389 Gulzar-e-Hijri 49 8,468 387 Pano Akil 562 59,148 1,397Hyderabad 508 56,308 1,461 Saddar 40 5,675 389 Rohri 354 47,794 1,005Hyderabad City 167 62,478 3,363 Arambagh 24 2,027 151 City Sukkur 61 23,354 1,134Latifabad 159 47,396 2,395 Civil Line 36 8,607 353 Salehpat 170 16,640 228Qasimabad 73 18,949 964 Garden 96 12,797 826 New Sukkur 128 39,303 805Ghorabari 309 9,163 239 Lyari 158 33,232 1,450 Ghotki 562 64,782 1,602Keti Bundar 103 3,072 82 Harbour 67 10,987 340 Mirpur Mathelo 520 41,538 1,200Mirpur Sakro 545 26,447 787 Maripur 69 7,449 205 Ubauro 443 46,687 791Thatta 650 39,752 1,282 Orangi 74 13,450 489 Khan Garh 205 17,427 370Kotri 161 34,677 1,157 Mominabad 120 17,679 682 Daharki 501 32,450 742Sehwan 330 33,455 1,051 SITE 110 12,403 628 Digri 392 26,861 989Thana Bula Khan 196 11,400 282 Baldia 98 15,101 499 Kot Ghulam Mohd 455 33,674 762Manjhand 155 16,064 377 Manghopir 61 9,755 243 Mirpur Khas 124 29,921 1,037Hala 234 35,143 1,235 Bin Qasim Town 89 10,489 275 Jhuddo 329 23,153 501Mitiari 423 40,825 1,043 Ibrahim Hyderi 167 25,523 785 Sindhri 496 22,643 471Saeedabad 314 27,091 813 Shah Mureed 50 2,902 81 Hussain Bux Mari 259 15,012 392Tando Allah Yar 246 37,624 945 Gadap Town 226 7,425 335 Shujaabad 256 20,180 536Jhando Mari 299 28,193 524 Airport 17 2,339 145 Chachro 849 30,681 773Chamber 290 24,796 420 Murad Memon 196 20,799 951 Diplo 560 21,022 643Tando Mohd Khan 310 29,654 1,035 Model Colony 70 14,115 972 Mithi 654 38,418 1,217Tando Ghulam Hyde 425 17,935 484 Shah Faisal 115 16,489 1,109 Nagarparkar 658 27,392 558Bulri Shah Karim 431 19,767 589 Korangi 105 37,473 1,011 Islamkot 620 26,152 600Jati 488 12,382 331 Landhi 142 24,707 1,072 Dalhi 513 19,957 458Kharo Chann 29 313 6 Garhi Khairo 406 32,221 1,047 Kaloi 415 15,170 444Mirpur Bithoro 613 22,015 597 Jacobabad 383 52,796 1,732 Samaro 310 18,481 375Shah Bundar 219 10,129 210 Thull 766 63,427 1,833 Umerkot 1,673 77,264 2,271Sujawal 480 24,022 676 Dokri 219 43,536 977 Pithoro 338 12,176 306
Larkana 428 114,015 3,330 Kunri 424 29,967 731Rato Dero 370 67,520 1,654 Jam Nawaz Ali 195 16,646 295Bakrani 270 40,904 966 Khipro 753 35,642 863Garhi Yasin 432 40,490 1,105 Sanghar 708 52,291 1,564Khanpur 307 21,371 584 Shahdadpur 744 68,651 2,042Lakhi 317 38,857 1,001 Sinjhoro 608 50,621 1,342Shikarpur 318 51,103 1,515 Tando Adam 342 43,374 1,247Kandhkot 377 44,103 1,210 Bhirya 426 50,703 1,191Kashmore 626 56,456 1,321 Kandiaro 480 60,893 1,658Tangwani 678 46,904 1,291 Moro 674 68,609 1,795Kambar 416 56,824 1,485 Naushero Feroz 612 57,991 1,583Miro Khan 184 19,130 402 Mehrabpur 360 43,731 1,082Shahdadkot 228 30,117 934 Kazi Ahmed 691 59,634 1,182Warrah 316 37,300 971 Nawab Shah 403 58,753 1,809Qubo Saeed Khan 198 10,327 248 Sakrand 672 74,277 1,806
Schools Enrolment Teachers Naseerabad 183 28,960 737 Daur 977 85,390 1,600Total Sindh Province 49,103 4,561,140 133,076 Sijawal Junejo 192 16,293 326

42
Comparative Summary : School Census 2014 to 2018
School Level Year Boys Girls Mixed Total Boys Girls Total Male Female Total
Primary 2014 9,402 5,851 26,471 41,724 1,615,555 1,030,313 2,645,868 64,892 22,193 87,085
2015 9,271 5,711 26,149 41,131 1,648,607 1,039,794 2,688,401 68,428 24,514 92,942
2016 5,309 4,303 28,520 38,132 1,686,546 1,048,610 2,735,156 67,695 23,397 91,0922017
Estimated 5,303 4,301 28,551 38,155 1,742,756 850,240 2,592,996 68,759 22,342 91,101
2018 7,712 5,468 31,116 44,296 1,797,818 1,122,044 2,919,862 57,130 20,681 77,811Middle / Elementary 2014 504 616 1,196 2,316 137,750 115,074 252,824 7,588 4,690 12,278
2015 513 593 1,223 2,329 147,898 117,948 265,846 8,395 5,215 13,610
2016 319 545 1,377 2,241 160,716 129,725 290,441 8,116 5,119 13,235
2017Estimated 334 555 1,392 160,470 160,470 108,879 269,349 8,261 4,339 12,600
2018 414 671 1,627 2,712 187,529 137,550 325,079 7,563 4,584 12,147Secondary 2014 513 593 1,223 2,329 147,898 117,948 265,846 8,395 5,215 13,610
2015 319 545 1,377 2,241 160,716 129,725 290,441 8,116 5,119 13,235
2016 618 512 576 1,706 470,633 334,498 805,131 20,244 14,344 34,5882017
Estimated 414 466 886 533,802 533,802 352,448 886,250 18,993 14,413 33,406
2018 418 472 887 1,777 559,020 359,686 918,706 19,304 14,103 33,407
2014 513 593 1,223 2,329 147,898 117,948 265,846 8,395 5,215 13,610
2015 319 545 1,377 2,241 160,716 129,725 290,441 8,116 5,119 13,235
2016 90 79 124 293 221,010 119,643 340,653 6,769 3,450 10,219
2017Estimated 66 75 150 291 251,453 123,985 375,438 5,982 3,327 9,309
2018 73 74 171 318 267,633 129,860 397,493 6,210 3,501 9,711Total 2014 10,932 7,653 30,113 48,698 2,049,101 1,381,283 3,430,384 89,270 37,313 126,583
2015 10,422 7,394 30,126 47,942 2,117,937 1,417,192 3,535,129 93,055 39,967 133,022
2016 6,336 5,439 30,597 42,372 2,538,905 1,632,476 4,171,381 102,824 46,310 149,1342017
Estimated 6,117 5,397 30,979 42,493 2,688,481 1,435,552 4,124,033 101,995 44,421 146,416
2018 8,617 6,685 33,801 49,103 2,812,000 1,749,140 4,561,140 90,207 42,869 133,076
No. of Schools Enrolment Teachers
Higher Secondary

-
5,000
10,000
15,000
20,000
25,000
30,000
35,000
Primary Middle/Elem Secondary Higher Sec.
Schools
Level of Schools
Level and Gender wise Number of Schools
Boys
Girls
Mixed
43
Number of Schools : Level and Gender wise (Number and Percentages)
School Level Boys Girls Mixed Total Boys Girls Mixed Total
Primary 7,712 5,468 31,116 44,296 16% 11% 63% 90%
Middle/Elem 414 671 1,627 2,712 1% 1% 3% 6%
Secondary 418 472 887 1,777 1% 1% 2% 4%
Higher Sec. 73 74 171 318 0% 0% 0% 1%
Total 8,617 6,685 33,801 49,103 18% 14% 69% 100%
Numbers (# ) Percentage (%)
Level and Gender wise Schools

44
Number of Schools : Level and Status wise (Number and Percentages)
School Level Functional Grand Functional Grand
Temporary Dysfunctional
Viable Dysfunctional
Permanent Dysfunctional
Non-Viable Total Total Temporary Dysfunctional
Viable Dysfunctional
Permanent Dysfunctional
Non-Viable Total Total
Primary 32,433 4,076 1,278 2,428 4,081 11,863 44,296 66% 8% 3% 5% 8% 24% 90%
Middle/Elem 2,200 165 41 108 198 512 2,712 4% 0% 0% 0% 0% 1% 6%
Secondary 1,732 26 2 8 9 45 1,777 4% 0% 0% 0% 0% 0% 4%
Higher Sec. 294 15 4 - 5 24 318 1% 0% 0% 0% 0% 0% 1%
Total 36,659 4,282 1,325 2,544 4,293 12,444 49,103 75% 9% 3% 5% 9% 25% 100%
Level and Status wise Schools
Numbers (# ) Percentage (%)
Closed Closed
-
5,000
10,000
15,000
20,000
25,000
30,000
35,000
Primary Middle/Elem Secondary Higher Sec.
Schools
Level of Schools
Level and Gender wise Number of Schools
Boys
Girls
Mixed

45
Number of Schools : Level and Location wise (Number and Percentages)
School Level Urban Area Rural Ares Total Urban Area Rural Ares Total
Primary 3,739 40,557 44,296 8% 83% 90%
Middle/Elem 554 2,158 2,712 1% 4% 6%
Secondary 759 1,018 1,777 2% 2% 4%
Higher Sec. 127 191 318 0% 0% 1%
Total 5,179 43,924 49,103 11% 89% 100%
Level and Location wise Schools
Numbers (# ) Percentage (%)
-
10,000
20,000
30,000
40,000
50,000
Primary Middle/Elem Secondary Higher Sec.
Schools
Level of Schools
Level and Location wise Number of Schools
Urban Area
Rural Ares

46
Number of Schools : Level and Medium wise ( Number and Percentages)
School Level Urdu Sindhi English Mixed Total Urdu Sindhi English Mixed Total
Primary 4,176 39,970 14 136 44,296 9% 81% 0% 0% 90%
Middle/Elem 156 2,525 5 26 2,712 0% 5% 0% 0% 6%
Secondary 82 1,574 4 117 1,777 0% 3% 0% 0% 4%
Higher Sec. 24 205 1 88 318 0% 0% 0% 0% 1%
Total 4,438 44,274 24 367 49,103 9% 90% 0% 1% 100%
Level and Medium wise Schools
Numbers (# ) Percentage (%)
- 5,000
10,000 15,000 20,000 25,000 30,000 35,000 40,000
Primary Middle/Elem Secondary Higher Sec.
Schools
Level of Schools
Level and Medium wise Number of Schools
Urdu
Sindhi
English
Mixed
47
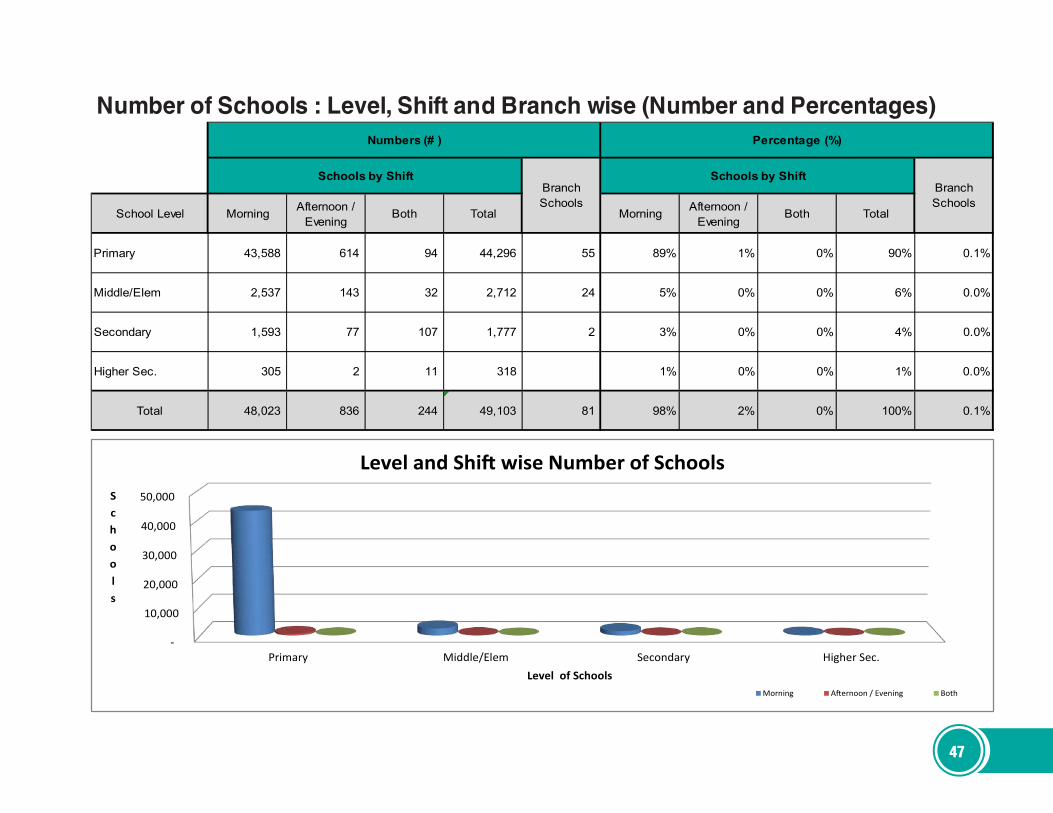
Number of Schools : Level, Shift and Branch wise (Number and Percentages)
School Level Morning Afternoon / Evening
Both Total Morning Afternoon / Evening
Both Total
Primary 43,588 614 94 44,296 55 89% 1% 0% 90% 0.1%
Middle/Elem 2,537 143 32 2,712 24 5% 0% 0% 6% 0.0%
Secondary 1,593 77 107 1,777 2 3% 0% 0% 4% 0.0%
Higher Sec. 305 2 11 318 1% 0% 0% 1% 0.0%
Total 48,023 836 244 49,103 81 98% 2% 0% 100% 0.1%
Numbers (# ) Percentage (%)
Branch Schools
Schools by ShiftBranch Schools
Schools by Shift
-
10,000
20,000
30,000
40,000
50,000
Primary Middle/Elem Secondary Higher Sec.
Schools
Level of Schools
Level and Shift wise Number of Schools
Morning Afternoon / Evening Both

48Number of Schools : District and Status wise (Number and Percentages)
Functional Grand Functional GrandTemporary
DysfunctionalViable
DysfunctionalPermanent
Dysfunctional Non-Viable Total TotalTemporary
DysfunctionalViable
DysfunctionalPermanent
Dysfunctional Total Total
Badin 2,527 389 39 86 86 600 3,127 5.1% 0.8% 0.1% 0.2% 1.2% 6.4%Dadu 1,540 221 53 146 116 536 2,076 3.1% 0.5% 0.1% 0.3% 1.1% 4.2%Hyderabad 819 62 4 9 13 88 907 1.7% 0.1% 0.0% 0.0% 0.2% 1.8%Thatta 908 214 144 187 154 699 1,607 1.8% 0.4% 0.3% 0.4% 1.4% 3.3%Jamshoro 630 56 21 15 120 212 842 1.3% 0.1% 0.0% 0.0% 0.4% 1.7%Mitiari 788 82 21 29 51 183 971 1.6% 0.2% 0.0% 0.1% 0.4% 2.0%Tando Allah Yar 637 102 5 66 25 198 835 1.3% 0.2% 0.0% 0.1% 0.4% 1.7%Tando Muhammad Khan 789 186 27 101 63 377 1,166 1.6% 0.4% 0.1% 0.2% 0.8% 2.4%Sujawal 964 258 39 325 243 865 1,829 2.0% 0.5% 0.1% 0.7% 1.8% 3.7%Central Karachi 538 24 17 4 38 83 621 1.1% 0.0% 0.0% 0.0% 0.2% 1.3%East Karachi 254 7 6 2 16 31 285 0.5% 0.0% 0.0% 0.0% 0.1% 0.6%South Karachi 298 21 4 28 3 56 354 0.6% 0.0% 0.0% 0.1% 0.1% 0.7%West Karachi 533 14 20 20 12 66 599 1.1% 0.0% 0.0% 0.0% 0.1% 1.2%Malir Karachi 613 51 11 49 21 132 745 1.2% 0.1% 0.0% 0.1% 0.3% 1.5%Korangi Karachi 394 20 2 16 - 38 432 0.8% 0.0% 0.0% 0.0% 0.1% 0.9%Jacobabad 1,166 202 60 35 92 389 1,555 2.4% 0.4% 0.1% 0.1% 0.8% 3.2%Larkana 1,123 61 10 56 37 164 1,287 2.3% 0.1% 0.0% 0.1% 0.3% 2.6%Shikarpur 971 39 35 2 327 403 1,374 2.0% 0.1% 0.1% 0.0% 0.8% 2.8%Kashmore 1,222 191 24 106 138 459 1,681 2.5% 0.4% 0.0% 0.2% 0.9% 3.4%Kambar-Shahdadkot 1,292 86 28 31 280 425 1,717 2.6% 0.2% 0.1% 0.1% 0.9% 3.5%Khairpur Mirs 3,032 221 58 158 148 585 3,617 6.2% 0.5% 0.1% 0.3% 1.2% 7.4%Sukkur 1,050 91 24 25 85 225 1,275 2.1% 0.2% 0.0% 0.1% 0.5% 2.6%Ghotki 1,718 142 32 79 260 513 2,231 3.5% 0.3% 0.1% 0.2% 1.0% 4.5%Mirpur Khas 1,694 218 48 243 108 617 2,311 3.4% 0.4% 0.1% 0.5% 1.3% 4.7%Tharparkar 2,777 366 304 136 686 1,492 4,269 5.7% 0.7% 0.6% 0.3% 3.0% 8.7%Umerkot 1,527 427 82 188 521 1,218 2,745 3.1% 0.9% 0.2% 0.4% 2.5% 5.6%Sanghar 2,477 320 98 193 262 873 3,350 5.0% 0.7% 0.2% 0.4% 1.8% 6.8%Naushero Feroze 2,181 105 37 130 99 371 2,552 4.4% 0.2% 0.1% 0.3% 0.8% 5.2%Shaheed Benazirabad 2,197 106 72 79 289 546 2,743 4.5% 0.2% 0.1% 0.2% 1.1% 5.6%
Total 36,659 4,282 1,325 2,544 4,293 12,444 49,103 74.7% 8.7% 2.7% 5.2% 25.3% 100.0%
District Name
District and Status wise SchoolsNumbers (# ) Percentage (%)
Closed Closed

49
Number of Schools : District and Location wise (Number and Percentages)
District Name Urban Area Rural Ares Total Urban Area Rural Ares TotalBadin 93 3,034 3,127 0.2% 6.2% 6.4%Dadu 122 1,954 2,076 0.2% 4.0% 4.2%Hyderabad 400 507 907 0.8% 1.0% 1.8%Thatta 68 1,539 1,607 0.1% 3.1% 3.3%Jamshoro 108 734 842 0.2% 1.5% 1.7%Mitiari 66 905 971 0.1% 1.8% 2.0%Tando Allah Yar 97 738 835 0.2% 1.5% 1.7%Tando Muhammad Khan 74 1,092 1,166 0.2% 2.2% 2.4%Sujawal 23 1,806 1,829 0.0% 3.7% 3.7%Central Karachi 619 2 621 1.3% 0.0% 1.3%East Karachi 277 8 285 0.6% 0.0% 0.6%South Karachi 351 3 354 0.7% 0.0% 0.7%West Karachi 508 91 599 1.0% 0.2% 1.2%Malir Karachi 188 557 745 0.4% 1.1% 1.5%Korangi Karachi 427 5 432 0.9% 0.0% 0.9%Jacobabad 130 1,425 1,555 0.3% 2.9% 3.2%Larkana 159 1,128 1,287 0.3% 2.3% 2.6%Shikarpur 79 1,295 1,374 0.2% 2.6% 2.8%Kashmore 61 1,620 1,681 0.1% 3.3% 3.4%Kambar-Shahdadkot 85 1,632 1,717 0.2% 3.3% 3.5%Khairpur Mirs 113 3,504 3,617 0.2% 7.1% 7.4%SUKKUR 172 1,103 1,275 0.4% 2.2% 2.6%Ghotki 89 2,142 2,231 0.2% 4.4% 4.5%Mirpur Khas 139 2,172 2,311 0.3% 4.4% 4.7%Tharparkar 141 4,128 4,269 0.3% 8.4% 8.7%Umerkot 151 2,594 2,745 0.3% 5.3% 5.6%Sanghar 174 3,176 3,350 0.4% 6.5% 6.8%Naushero Feroze 78 2,474 2,552 0.2% 5.0% 5.2%Shaheed Benazirabad 187 2,556 2,743 0.4% 5.2% 5.6%
Total 5,179 43,924 49,103 10.5% 89.5% 100.0%
District and Location wise Schools
Numbers (# ) Percentage (%)

50
Enrollment : Level and Student Gender wise (Number and Percentages)
School Level Boys Girls Total Boys Girls Total
Primary 1,797,818 1,122,044 2,919,862 39% 25% 64%
Middle/Elem 187,529 137,550 325,079 4% 3% 7%
Secondary 559,020 359,686 918,706 12% 8% 20%
Higher Sec. 267,633 129,860 397,493 6% 3% 9%
Total 2,812,000 1,749,140 4,561,140 62% 38% 100%
Level and Student Gender wise Enrollment
Numbers (# ) Percentage (%)
- 200,000 400,000 600,000 800,000
1,000,000 1,200,000 1,400,000 1,600,000 1,800,000
Primary Middle/Elem Secondary Higher Sec.
Enroll
ment
Level of Schools
Level and Student Gender wise Enrollment
Boys
Girls

51
Enrollment : Class and Student Gender wise (Number and Percentages)
Pre-Primary
Student Gender Kachi Class I Class II Class III Class IV Class V Class VI Class VII Class VIII Class IX Class X Class XI Class XII Total
Boys 516,498 378,964 337,928 303,693 267,060 235,605 158,941 146,164 128,445 129,526 118,872 46,396 43,908 2,812,000
Girls 368,745 241,143 209,177 191,108 165,037 143,978 90,277 86,302 80,399 70,273 63,887 19,720 19,094 1,749,140
Total 885,243 620,107 547,105 494,801 432,097 379,583 249,218 232,466 208,844 199,799 182,759 66,116 63,002 4,561,140
Boys 11% 8% 7% 7% 6% 5% 3% 3% 3% 3% 3% 1% 1% 62%
Girls 8% 5% 5% 4% 4% 3% 2% 2% 2% 2% 1% 0% 0% 38%
Total 19% 14% 12% 11% 9% 8% 5% 5% 5% 4% 4% 1% 1% 100%
Class and Student Gender wise Enrollment
Numbers (# )
Percentage (%)
Primary Middle Secondary Higher Sec
-
100,000
200,000
300,000
400,000
500,000
600,000
Kachi Class I Class II Class III Class IV Class V Class VI Class VII Class VIII Class IX Class X Class XI Class XII
Enroll
ment
Classes
Class and Student Gender wise Enrollment
Boys Girls

52
Enrollment : Class and School Medium wise ( Number and Percentages)
Pre-Primary
School Medium Kachi Class I Class II Class III Class IV Class V Class VI Class VII Class VIII Class IX Class X Class XI Class XII Total
Urdu 14,704 11,729 10,307 9,931 8,875 7,903 11,206 10,530 10,100 12,366 11,570 4,543 4,026 127,790
Sindhi 860,081 598,798 528,356 476,930 415,925 364,619 204,876 190,099 170,268 151,012 138,201 40,224 38,799 4,178,188
English 521 541 428 417 434 370 381 373 409 481 534 257 - 5,146
Mixed 9,937 9,039 8,014 7,523 6,863 6,691 32,755 31,464 28,067 35,940 32,454 21,092 20,177 250,016
Total 885,243 620,107 547,105 494,801 432,097 379,583 249,218 232,466 208,844 199,799 182,759 66,116 63,002 4,561,140
Urdu 0% 0% 0% 0% 0% 0% 0% 0% 0% 0% 0% 0% 0% 3%
Sindhi 19% 13% 12% 10% 9% 8% 4% 4% 4% 3% 3% 1% 1% 92%
English 0% 0% 0% 0% 0% 0% 0% 0% 0% 0% 0% 0% 0% 0%
Mixed 0% 0% 0% 0% 0% 0% 1% 1% 1% 1% 1% 0% 0% 5%
Total 19% 14% 12% 11% 9% 8% 5% 5% 5% 4% 4% 1% 1% 100%
Percentage (%)
Class and Medium wise Enrollment
Primary Middle Secondary Higher Sec
Numbers (# )
- 100,000 200,000 300,000 400,000 500,000 600,000 700,000 800,000 900,000
Kachi Class I Class II Class III Class IV Class V Class VI Class VII Class VIII Class IX Class X Class XI Class XII
Enroll
ment
Classes
Class and Medium wise EnrollmentUrdu
Sindhi
English
Mixed

53
Class wise Enrollment in last 5 years (Boys + Girls)
0
100,000
200,000
300,000
400,000
500,000
600,000
700,000
800,000
900,000
1,000,000En
rolm
ent Stages
2014
2015
2016
2017
2018
Pre Primary
Year Kachi i ii iii iv v vi vii viii ix x xi xii
2014 585,718 634,930 528,133 471,376 410,283 343,287 208,415 201,743 202,928 192,031 174,981 49,412 41,239
2015 641,038 671,004 552,627 469,739 420,145 316,406 209,122 205,555 187,753 187,721 179,980 55,013 49,116
2016 751,744 628,329 530,476 466,330 411,904 361,553 219,520 204,307 200,918 188,397 172,300 49,110 44,240
2017 711,392 545,563 524,273 450,605 400,503 350,128 242,386 213,745 196,999 199,579 169,785 62,882 56,193
2018 885,243 620,107 547,105 494,801 432,097 379,583 249,218 232,466 208,844 199,799 182,759 66,116 63,002
Pre Primary
Stages 885,243 671,004 671,004 671,004 671,004 671,004 249,218 249,218 249,218 199,799 199,799 66,116 66,116
Primary Middle Secondary Higher Secondary
Primary Middle Secondary Higher Secondary

54
Repeaters : Class and Student Gender wise (Number and Percentages)
Pre-Primary
School Level Kachi Class I Class II Class III Class IV Class V Class VI Class VII Class VIII Class IX Class X Class XI Class XII Total
Boys - - - - 2,878 1,560 1,751 1,426 1,180 827 863 216 372 11,073
Girls - - - - 1,620 835 912 661 589 226 150 20 52 5,065
Total - - - - 4,498 2,395 2,663 2,087 1,769 1,053 1,013 236 424 16,138
Boys 0% 0% 0% 0% 18% 10% 11% 9% 7% 5% 5% 1% 2% 69%
Girls 0% 0% 0% 0% 10% 5% 6% 4% 4% 1% 1% 0% 0% 31%
Total 0% 0% 0% 0% 28% 15% 17% 13% 11% 7% 6% 1% 3% 100%
Percentage (%)
Class and Student Gender wise Repeaters
Primary Middle Secondary Higher Sec
Numbers (# )
-
500
1,000
1,500
2,000
2,500
3,000
Kachi Class I Class II Class III Class IV Class V Class VI Class VII Class VIII Class IX Class X Class XI Class XII
Repeaters
Classes
Class and Student Gender wise Repeaters
Boys Girls

55
Schools : Enrollment in District - Class wisePre-Prim
Kachi Class I Class II Class III Class IV Class V Total Class VI Class VII Class VIII Total Class IX Class X Total Class XI Class XII Total
Badin 48,626 32,453 26,974 22,767 19,766 16,507 118,467 10,897 10,115 8,274 29,286 6,921 6,277 13,198 1,745 1,896 3,641 213,218
Dadu 48,688 26,555 26,708 26,883 23,734 21,384 125,264 11,963 11,080 10,333 33,376 9,149 8,601 17,750 3,540 3,535 7,075 232,153
Hyderabad 27,719 23,771 21,293 18,794 15,989 14,044 93,891 11,832 11,011 9,986 32,829 12,264 11,375 23,639 4,025 3,028 7,053 185,131
Thatta 11,003 17,386 11,544 8,839 7,094 5,619 50,482 3,751 3,369 2,681 9,801 2,604 2,244 4,848 1,274 1,026 2,300 78,434
Jamshoro 18,800 11,971 11,713 10,072 8,778 7,721 50,255 5,636 5,036 4,588 15,260 4,474 4,093 8,567 1,376 1,338 2,714 95,596
Mitiari 20,610 15,195 12,808 11,215 9,917 8,731 57,866 5,858 5,193 4,433 15,484 3,986 3,639 7,625 752 722 1,474 103,059
Tando Al lah Yar 20,758 12,068 9,950 8,679 7,389 6,835 44,921 5,462 4,855 3,873 14,190 3,936 3,191 7,127 1,922 1,695 3,617 90,613
Tando Muhammad Khan 12,872 10,626 10,073 8,207 6,980 5,786 41,672 3,261 2,961 2,358 8,580 1,964 1,660 3,624 316 292 608 67,356
Sujawal 9,218 15,390 11,791 9,047 7,226 5,579 49,033 2,683 2,188 1,981 6,852 1,618 1,182 2,800 581 377 958 68,861
Centra l Karachi 9,948 10,569 9,916 9,389 8,483 7,505 45,862 7,994 7,467 7,198 22,659 8,268 7,676 15,944 1,294 912 2,206 96,619
East Karachi 7,391 5,986 5,403 4,761 4,089 3,699 23,938 4,005 3,777 3,630 11,412 4,019 3,772 7,791 307 120 427 50,959
South Karachi 9,875 7,391 6,824 6,450 5,566 4,982 31,213 4,750 4,310 3,946 13,006 4,127 3,627 7,754 292 198 490 62,338
West Karachi 10,362 13,444 11,291 9,467 8,066 6,401 48,669 6,199 5,477 5,165 16,841 5,543 5,224 10,767 138 47 185 86,824
Mal i r Karachi 11,257 10,645 8,504 7,009 5,485 4,701 36,344 4,413 3,944 3,561 11,918 3,950 3,566 7,516 1,124 1,318 2,442 69,477
Korangi Karachi 7,909 10,032 9,451 9,091 7,866 7,251 43,691 8,304 7,603 7,688 23,595 8,237 7,595 15,832 941 816 1,757 92,784
Jacobabad 32,197 20,818 17,359 16,666 13,467 12,906 81,216 6,711 6,882 6,821 20,414 5,283 4,636 9,919 2,354 2,344 4,698 148,444
Larkana 45,993 32,383 30,323 29,844 28,098 25,711 146,359 15,453 14,464 13,318 43,235 12,581 11,548 24,129 3,163 3,096 6,259 265,975
Shikarpur 20,440 20,458 19,219 17,506 16,002 13,969 87,154 9,032 8,436 7,705 25,173 6,508 6,111 12,619 3,220 3,215 6,435 151,821
Kashmore 32,473 19,647 18,078 16,170 13,772 12,493 80,160 6,237 6,498 6,359 19,094 5,131 4,648 9,779 2,908 3,049 5,957 147,463
Kambar-Shahdadkot 42,269 23,765 22,813 22,333 19,829 17,540 106,280 10,969 10,101 9,565 30,635 8,189 7,320 15,509 2,175 2,083 4,258 198,951
Khairpur Mirs 91,655 35,346 38,033 35,298 31,190 26,736 166,603 17,747 17,560 16,158 51,465 15,501 14,913 30,414 4,949 5,525 10,474 350,611
Sukkur 29,423 24,819 23,376 21,821 19,470 16,676 106,162 10,285 9,455 9,079 28,819 7,996 7,680 15,676 3,134 3,025 6,159 186,239
Ghotki 44,235 24,593 25,354 24,039 21,162 19,826 114,974 9,056 8,886 8,191 26,133 7,495 6,426 13,921 1,896 1,725 3,621 202,884
Mirpur Khas 28,031 28,071 21,793 17,952 15,574 13,149 96,539 9,616 8,835 7,289 25,740 7,608 6,618 14,226 3,683 3,225 6,908 171,444
Tharparkar 12,371 47,285 27,085 21,414 18,542 15,667 129,993 8,922 7,999 6,759 23,680 5,323 4,816 10,139 1,346 1,263 2,609 178,792
Umerkot 23,062 27,856 18,557 15,084 13,115 10,916 85,528 6,379 5,959 4,632 16,970 4,439 4,184 8,623 1,669 2,036 3,705 137,888
Sanghar 57,356 34,658 33,043 29,653 25,567 22,426 145,347 13,271 12,318 10,101 35,690 10,663 9,914 20,577 4,296 3,959 8,255 267,225
Naushero Feroze 77,787 28,701 27,745 27,524 24,587 22,343 130,900 14,167 13,844 12,187 40,198 11,342 10,221 21,563 5,934 5,545 11,479 281,927
Shaheed Benazi rabad 72,915 28,225 30,084 28,827 25,294 22,480 134,910 14,365 12,843 10,985 38,193 10,680 10,002 20,682 5,762 5,592 11,354 278,054
Province Total 885,243 620,107 547,105 494,801 432,097 379,583 2,473,693 249,218 232,466 208,844 690,528 199,799 182,759 382,558 66,116 63,002 129,118 4,561,140
District Name Grand TotalMiddle Classes Secondary Classes H. Secondary ClassesPrimary Classes

56 Primary Stage Enrollment of Government and Private Schools
District Total Boys Girls Total Boys Girls Total Boys GirlsBadin 118,467 79,164 39,303 12,422 7,545 4,877 130,889 86,709 44,180 Dadu 125,264 75,228 50,036 21,624 13,445 8,179 146,888 88,673 58,215 Hyderabad 93,891 52,654 41,237 107,048 59,675 47,373 200,939 112,329 88,610 Thatta 50,255 29,876 20,379 16,664 6,241 10,423 66,919 36,117 30,802 Jamshoro 57,866 36,302 21,564 10,693 6,661 4,033 68,559 42,963 25,597 Mitiari 49,033 32,823 16,210 41,655 23,493 18,162 90,688 56,316 34,372 Tando Allah Yar 44,921 29,591 15,330 41,919 23,648 18,271 86,840 53,239 33,601 Tando Muhammad Khan 41,672 27,394 14,278 35,333 20,141 15,192 77,005 47,535 29,470 Sujawal 50,482 32,449 18,033 15,382 5,762 9,621 65,864 38,211 27,654 Central Karachi 45,862 22,180 23,682 373,659 201,969 171,690 419,521 224,149 195,372 East Karachi 23,938 10,961 12,977 227,446 122,938 104,508 251,384 133,899 117,485 South Karachi 43,691 20,158 23,533 308,674 166,844 141,831 352,365 187,002 165,364 West Karachi 36,344 19,596 16,748 259,937 140,501 119,436 296,281 160,097 136,184 Malir Karachi 31,213 13,183 18,030 97,475 52,687 44,789 128,688 65,870 62,819 Korangi Karachi 48,669 23,511 25,158 357,413 193,188 164,226 406,082 216,699 189,384 Jacobabad 81,216 51,517 29,699 9,588 6,068 3,520 90,804 57,585 33,219 Larkana 106,280 62,485 43,795 9,832 6,268 3,564 116,112 68,753 47,359 Shikarpur 80,160 56,059 24,101 7,368 5,005 2,363 87,528 61,064 26,464 Kashmore 146,359 81,987 64,372 8,801 5,715 3,087 155,160 87,702 67,459 Kambar-Shahdadkot 87,154 54,866 32,288 9,530 6,142 3,388 96,684 61,008 35,676 Khairpur Mirs 114,974 78,877 36,097 51,571 28,941 22,630 166,545 107,818 58,727 Sukkur 166,603 101,079 65,524 42,516 24,790 17,727 209,119 125,869 83,251 Ghotki 106,162 62,772 43,390 21,717 15,018 6,699 127,879 77,790 50,089 Mirpur Khas 96,539 66,965 29,574 45,934 25,775 20,159 142,473 92,740 49,733 Tharparkar 129,993 84,121 45,872 6,738 2,134 4,604 136,731 86,255 50,476 Umerkot 85,528 59,416 26,112 11,185 6,422 4,763 96,713 65,838 30,875 Sanghar 130,900 78,116 52,784 38,917 22,989 15,928 169,817 101,105 68,712 Naushero Feroze 145,347 96,906 48,441 20,329 12,763 7,566 165,676 109,669 56,007 Shaheed Benazirabad 134,910 83,014 51,896 34,431 19,273 15,158 169,341 102,287 67,054
Total 2,473,693 1,523,250 950,443 2,245,801 1,232,039 1,013,762 4,719,494 2,755,289 1,964,205
Public Private Grand Total
Note: Enrolment of Government School includes enrolment from class I to Class V. Enrolment of Private Schools is projected 5% per year up to year 2018 reported in Pakistan Statistical Year Book 2002 ( Page 395 ) and include enrolement only from Primary Section.
57
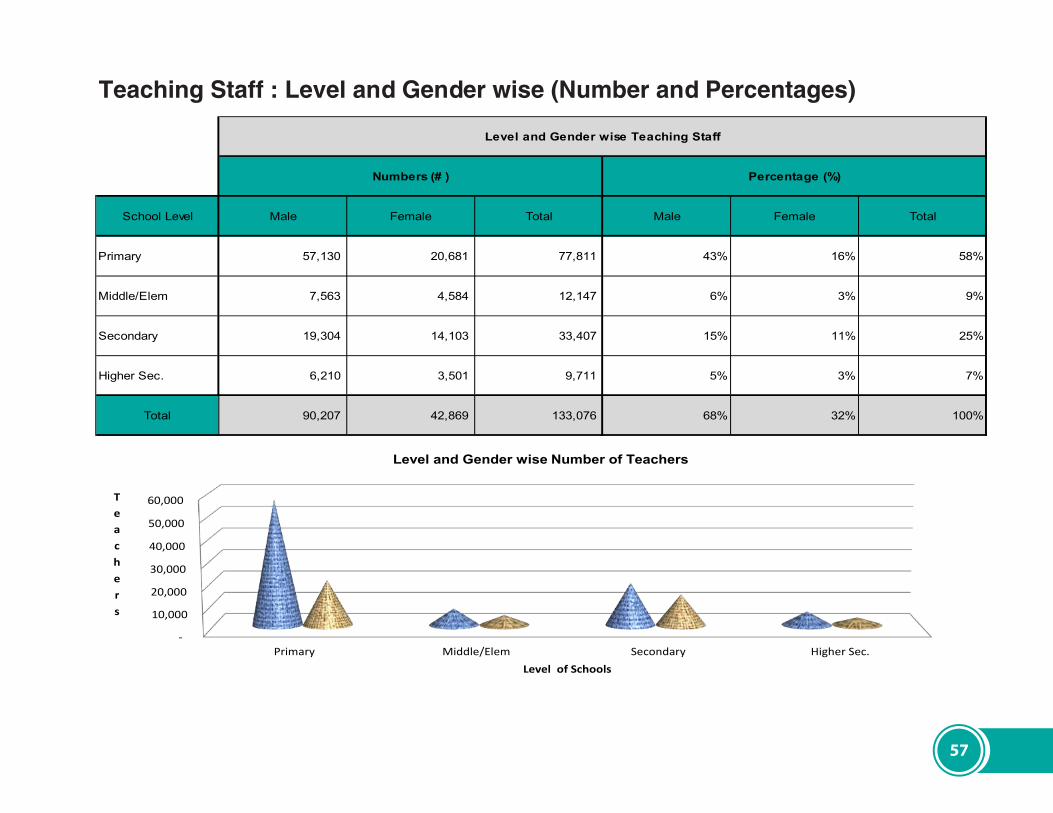
Teaching Staff : Level and Gender wise (Number and Percentages)
School Level Male Female Total Male Female Total
Primary 57,130 20,681 77,811 43% 16% 58%
Middle/Elem 7,563 4,584 12,147 6% 3% 9%
Secondary 19,304 14,103 33,407 15% 11% 25%
Higher Sec. 6,210 3,501 9,711 5% 3% 7%
Total 90,207 42,869 133,076 68% 32% 100%
Level and Gender wise Teaching Staff
Numbers (# ) Percentage (%)
-
10,000
20,000
30,000
40,000
50,000
60,000
Primary Middle/Elem Secondary Higher Sec.
Teachers
Level of Schools
Level and Gender wise Number of Teachers
Male
Female

58
Teachers : Gender and Designation wise (Number and Percentages)
Gender PST JST HST SS PTI WIT HMs DT Others Non-Govt No Info Total
Male 59,519 6,445 10,906 392 1,143 501 3,416 1,145 4,432 2,250 58 90,207
Female 26,788 5,351 6,080 189 379 22 990 450 1,548 1,051 21 42,869
Total 86,307 11,796 16,986 581 1,522 523 4,406 1,595 5,980 3,301 79 133,076
Male 45% 5% 8% 0% 1% 0% 3% 1% 3% 2% 0% 68%
Female 20% 4% 5% 0% 0% 0% 1% 0% 1% 1% 0% 32%
Total 65% 9% 13% 0% 1% 0% 3% 1% 4% 2% 0% 100%
Gender and Designation wise Teachers
Numbers (# )
Percentage (%)
0%
5%
10%
15%
20%
25%
30%
35%
40%
45%
PST JST HST SS PTI WIT HMs DT Others Non-Govt No Info
Teachers
Designation
Gender and Designation wise Teachers
Male Female

59
Teachers : Gender and Professional Training wise (Number and Percentages)
Gender P.T.C C.T B.Ed M.Ed ECE ADE Other Untrained No Info Total
Male 22,988 3,001 30,711 23,198 714 441 3,962 3,227 1,965 90,207
Female 9,129 2,182 15,256 12,359 511 245 1,019 1,278 890 42,869
Total 32,117 5,183 45,967 35,557 1,225 686 4,981 4,505 2,855 133,076
Male 17% 2% 23% 17% 1% 0% 3% 2% 1% 68%
Female 7% 2% 11% 9% 0% 0% 1% 1% 1% 32%
Total 24% 4% 35% 27% 1% 1% 4% 3% 2% 100%
Gender and Professional Training wise Teachers
Percentage (%)
Numbers (# )
0%
5%
10%
15%
20%
25%
P.T.C C.T B.Ed M.Ed ECE ADE Other Untrained No Info
Teachers
Professional Training
Gender and Professional Training wise Teachers
Male Female

60
Teachers : Gender and Academic Qualification wise ( Number and Percentages)
Gender Doctorate Post Graduate Graduate Under Graduate Matric Under Matric Total
Male 518 36,336 38,446 11,467 3,254 186 90,207
Female 343 18,420 17,283 4,957 1,816 50 42,869
Total 861 54,756 55,729 16,424 5,070 236 133,076
Male 0% 27% 29% 9% 2% 0% 68%
Female 0% 14% 13% 4% 1% 0% 32%
Total 1% 41% 42% 12% 4% 0% 100%
Gender and Academic Qualification wise Teachers
Numbers (# )
Percentage (%)
0%
5%
10%
15%
20%
25%
30%
Doctorate Post Graduate Graduate Under Graduate Matric Under Matric
Teachers
Academic Qualification
Gender and Academic Qualification wise Teachers
Male Female

61
Schools : Teachers in Districts - Gender and Level wiseGrand
District Name Primary Middle / Elem.
Secondary Higher Secondary
Total Primary Middle / Elem.
Secondary Higher Secondary
Total Total
Badin 2,982 274 772 218 4,246 586 75 344 112 1,117 5,363
Dadu 3,084 318 1,002 264 4,668 923 117 377 84 1,501 6,169
Hyderabad 1,671 612 1,369 477 4,129 1,333 687 1,538 496 4,054 8,183
Thatta 1,093 115 385 134 1,727 306 55 265 37 663 2,390
Jamshoro 1,064 198 554 190 2,006 384 71 256 150 861 2,867
Mitiari 1,488 150 679 61 2,378 411 40 230 32 713 3,091
Tando Allah Yar 835 121 360 79 1,395 244 47 125 78 494 1,889
Tando Muhammad Khan 996 153 439 41 1,629 201 37 241 - 479 2,108
Sujawal 1,234 75 181 61 1,551 164 27 47 31 269 1,820
Central Karachi 697 211 715 88 1,711 1,797 519 1,756 236 4,308 6,019
East Karachi 339 76 433 37 885 709 99 1,190 186 2,184 3,069
South Karachi 319 118 463 82 982 704 252 1,144 87 2,187 3,169
West Karachi 726 173 464 38 1,401 828 176 641 40 1,685 3,086
Malir Karachi 827 148 343 107 1,425 518 162 410 57 1,147 2,572
Korangi Karachi 343 69 574 62 1,048 1,213 260 1,560 83 3,116 4,164
Jacobabad 2,514 356 499 232 3,601 544 148 207 112 1,011 4,612
Larkana 3,163 269 891 432 4,755 1,360 146 453 213 2,172 6,927
Shikarpur 2,163 219 665 259 3,306 496 76 257 70 899 4,205
Kashmore 2,044 217 554 394 3,209 348 49 130 86 613 3,822
Kambar-Shahdadkot 2,584 230 867 173 3,854 826 108 190 125 1,249 5,103
Khairpur Mirs 4,037 602 1,631 535 6,805 1,217 296 609 124 2,246 9,051
Sukkur 1,733 374 918 212 3,237 459 231 453 189 1,332 4,569
Ghotki 2,842 288 510 222 3,862 573 125 71 74 843 4,705
Mirpur Khas 2,166 249 600 255 3,270 775 92 297 254 1,418 4,688
Tharparkar 3,044 516 443 159 4,162 358 43 120 10 531 4,693
Umerkot 2,128 185 331 301 2,945 525 27 141 45 738 3,683
Sanghar 4,087 260 897 385 5,629 1,049 236 264 175 1,724 7,353
Naushero Feroze 3,713 611 864 438 5,626 1,004 208 294 177 1,683 7,309
Shaheed Benazirabad 3,214 376 901 274 4,765 826 175 493 138 1,632 6,397
Province Total 57,130 7,563 19,304 6,210 90,207 20,681 4,584 14,103 3,501 42,869 133,076
Female Teaching Staff by School LevelMale Teaching Staff by School Level

62
Schools Building Facilities (Number and Percentages)
School Level Schools Availability Boys Girls Mixed Total Boys Girls Mixed Total
Primary 44,296 With 5,790 4,392 26,686 36,868 12% 9% 54% 75%
Without 1,922 1,076 4,430 7,428 4% 2% 9% 15%
Middle/Elem 2,712 With 352 589 1,496 2,437 1% 1% 3% 5%
Without 62 82 131 275 0% 0% 0% 1%
Secondary 1,777 With 409 463 883 1,755 1% 1% 2% 4%
Without 9 9 4 22 0% 0% 0% 0%
Higher Sec. 318 With 71 74 165 310 0% 0% 0% 1%
Without 2 - 6 8 0% 0% 0% 0%
Total 49,103 With 6,622 5,518 29,230 41,370 13% 11% 60% 84%
All Schools Without 1,995 1,167 4,571 7,733 4% 2% 9% 16%
Level and Gender wise Schools
Numbers (# ) Percentage (%)
-
10,000
20,000
30,000
40,000
Primary Middle/Elem Secondary Higher Sec.
Schools
Level of Schools
Level and Building Facilities wise Number of Schools
With
Without

63
Schools : Level and Building Ownership wise ( Number and Percentages)
Note : Closed Schools are Included
School Level OWN Govt Building Other Govt School Building ( SHARED ) RENTED OTHER Building No Building /
Shelterless Total
Primary 34,324 861 126 1,557 7,428 44,296
Middle / Elem. 2,121 251 18 47 275 2,712
Secondary 1,638 74 20 23 22 1,777
Higher Sec. 307 1 - 2 8 318
Total 38,390 1,187 164 1,629 7,733 49,103
Primary 70% 2% 0% 3% 15% 90%
Middle / Elem. 4% 1% 0% 0% 1% 6%
Secondary 3% 0% 0% 0% 0% 4%
Higher Sec. 1% 0% 0% 0% 0% 1%
Total 78% 2% 0% 3% 16% 100%
Schools Building by Ownership
Numbers (# )
Percentage (%)
-
10,000
20,000
30,000
40,000
OWN Govt Building Other Govt SchoolBuilding ( SHARED )
RENTED OTHER Building No Building /Shelterless
Schools
Building Ownership
Schools by Building Ownership

64
Schools : Level and Building Condition wise (Number and Percentages)
Note : Closed Schools are Included
-
5,000
10,000
15,000
Satisfactory (Govt) Needs Repair (Govt) Dangerous (Govt) Rented and OtherOwnerships
No Building /Shelterless
Schools
Building Condition
Schools by Building Condition
School Level Satisfactory (Govt) Needs Repair (Govt) Dangerous (Govt) Rented and Other Ownerships
No Building / Shelterless Total
Primary 13,004 13,435 7,885 2,544 7,428 44,296
Middle / Elem. 1,000 781 340 316 275 2,712
Secondary 852 608 178 117 22 1,777
Higher Sec. 131 153 23 3 8 318
Total 14,987 14,977 8,426 2,980 7,733 49,103
Primary 26% 27% 16% 5% 15% 90%
Middle / Elem. 2% 2% 1% 1% 1% 6%
Secondary 2% 1% 0% 0% 0% 4%
Higher Sec. 0% 0% 0% 0% 0% 1%
Total 31% 31% 17% 6% 16% 100%
Schools Building by Condition
Numbers (# )
Percentage (%)

65
Schools : Level and Number of Classrooms wise (Number and Percentages)
School Level Zero / Shelterless One Two Three Four Five Six Seven Eight Nine Ten and
MoreTotal
Schools
Primary 7,428 10,432 18,281 2,586 1,466 972 1,033 543 453 257 845 44,296
Middle / Elem. 275 113 245 118 221 471 471 167 122 110 399 2,712
Secondary 22 1 8 7 11 39 99 79 99 76 1,336 1,777
Higher Sec. 8 - - 1 1 1 1 - 2 2 302 318
Total 7,733 10,546 18,534 2,712 1,699 1,483 1,604 789 676 445 2,882 49,103
Primary 15% 21% 37% 5% 3% 2% 2% 1% 1% 1% 2% 90%
Middle / Elem. 1% 0% 0% 0% 0% 1% 1% 0% 0% 0% 1% 6%
Secondary 0% 0% 0% 0% 0% 0% 0% 0% 0% 0% 3% 4%
Higher Sec. 0% 0% 0% 0% 0% 0% 0% 0% 0% 0% 1% 1%
Total 16% 21% 38% 6% 3% 3% 3% 2% 1% 1% 6% 100%
Number of Schools having Rooms
Numbers (# )
Percentage (%)
-
5,000
10,000
15,000
20,000
Zero /Shelterless
One Two Three Four Five Six Seven Eight Nine Ten andMore
Schools
Number of Classrooms
Schools by Number of Classrooms

66Schools : District and Building Ownership wise
District Name OWN Govt Building Other Govt School Building ( SHARED ) RENTED OTHER Building No Building /
Shelterless Total
Badin 2,256 72 2 111 686 3,127
Dadu 1,675 34 10 32 325 2,076
Hyderabad 790 61 8 26 22 907
Thatta 1,363 19 - 64 161 1,607
Jamshoro 755 6 - 15 66 842
Mitiari 867 12 3 46 43 971
Tando Allah Yar 739 18 4 29 45 835
Tando Muhammad Khan 914 21 2 66 163 1,166
Sujawal 1,225 12 - 94 498 1,829
Central Karachi 386 140 30 38 27 621
East Karachi 170 55 27 17 16 285
South Karachi 223 87 3 18 23 354
West Karachi 434 105 4 14 42 599
Malir Karachi 581 47 8 39 70 745
Korangi Karachi 342 46 2 28 14 432
Jacobabad 1,041 38 8 88 380 1,555
Larkana 1,118 47 2 9 111 1,287
Shikarpur 1,150 15 5 200 4 1,374
Kashmore 958 14 1 16 692 1,681
Kambar-Shahdadkot 1,443 38 7 16 213 1,717
Khairpur Mirs 3,170 21 4 160 262 3,617
Sukkur 1,099 17 3 31 125 1,275
Ghotki 1,542 31 1 44 613 2,231
Mirpur Khas 1,751 39 5 77 439 2,311
Tharparkar 3,550 42 - 37 640 4,269
Umerkot 2,177 15 3 12 538 2,745
Sanghar 2,465 53 4 86 742 3,350
Naushero Feroze 1,956 46 15 174 361 2,552
Shaheed Benazirabad 2,250 36 3 42 412 2,743
Total 38,390 1,187 164 1,629 7,733 49,103
Schools Building by Ownership

67
Schools : District and Number of Rooms wise
District Name Zero / Shelterless One Two Three Four Five Six Seven Eight Nine Ten and
MoreTotal
SchoolsBadin 686 899 1,134 128 49 55 54 11 12 15 84 3,127
Dadu 325 263 980 112 83 45 69 29 28 19 123 2,076
Hyderabad 22 53 337 94 51 51 47 31 29 27 165 907
Thatta 161 655 521 100 21 33 35 14 19 10 38 1,607
Jamshoro 66 62 420 69 45 33 37 7 13 8 82 842
Mitiari 43 125 493 97 52 42 19 12 13 12 63 971
Tando Allah Yar 45 116 393 85 59 32 20 18 9 10 48 835
Tando Muhammad Khan 163 292 490 64 48 27 27 6 5 3 41 1,166
Sujawal 498 703 478 54 18 17 17 7 8 5 24 1,829
Central Karachi 27 28 12 24 30 54 115 60 43 31 197 621
East Karachi 16 7 3 13 12 19 51 22 29 13 100 285
South Karachi 23 7 9 7 16 25 47 54 29 24 113 354
West Karachi 42 33 54 27 37 52 102 49 46 30 127 599
Malir Karachi 70 57 202 58 46 53 66 44 37 20 92 745
Korangi Karachi 14 24 12 5 18 30 84 38 39 11 157 432
Jacobabad 380 338 531 65 44 53 37 37 14 10 46 1,555
Larkana 111 70 578 113 89 55 55 21 20 17 158 1,287
Shikarpur 4 333 638 76 59 57 61 23 24 12 87 1,374
Kashmore 692 209 540 50 34 48 33 12 12 3 48 1,681
Kambar-Shahdadkot 213 220 822 140 70 62 61 24 21 12 72 1,717
Khairpur Mirs 262 1,133 1,328 240 155 87 95 41 45 30 201 3,617
Sukkur 125 204 437 109 63 65 52 29 25 20 146 1,275
Ghotki 613 211 960 113 64 75 58 29 17 12 79 2,231
Mirpur Khas 439 487 913 131 74 62 53 24 19 17 92 2,311
Tharparkar 640 1,751 1,319 211 116 93 50 20 9 11 49 4,269
Umerkot 538 803 1,035 120 53 50 44 15 16 7 64 2,745
Sanghar 742 588 1,461 117 116 65 66 34 28 10 123 3,350
Naushero Feroze 361 458 1,086 159 106 79 79 45 43 20 116 2,552
Shaheed Benazirabad 412 417 1,348 131 71 64 70 33 24 26 147 2,743
Total 7,733 10,546 18,534 2,712 1,699 1,483 1,604 789 676 445 2,882 49,103
Number of Schools having Rooms

68
Schools Drinking Water Facilities ( Number and Percentages
School Level Schools Availability Boys Girls Mixed Total Boys Girls Mixed Total
Primary 44,296 With 2,380 1,930 15,103 19,413 5% 4% 31% 40%
Without 5,332 3,538 16,013 24,883 11% 7% 33% 51%
Middle/Elem 2,712 With 230 387 1,011 1,628 0% 1% 2% 3%
Without 184 284 616 1,084 0% 1% 1% 2%
Secondary 1,777 With 362 416 740 1,518 1% 1% 2% 3%
Without 56 56 147 259 0% 0% 0% 1%
Higher Sec. 318 With 67 69 148 284 0% 0% 0% 1%
Without 6 5 23 34 0% 0% 0% 0%
Total 49,103 With 3,039 2,802 17,002 22,843 6% 6% 35% 47%
All Schools Without 5,578 3,883 16,799 26,260 11% 8% 34% 53%
12,444 With 334 256 946 1,536 1% 1% 2% 3%
Without 3,834 2,164 4,910 10,908 8% 4% 10% 22%
Level and Gender wise Schools
Numbers (# ) Percentage (%)
Only Closed Schools
-
5,000
10,000
15,000
20,000
25,000
Primary Middle/Elem Secondary Higher Sec.
19,413
1,628 1,518 284
24,883
1,084 259 34
Schools
Level of Schools
Level and Drinking Water Facilities wise Number of Schools
With
Without

69
Schools Washroom Facilities (Number and Percentages)
School Level Schools Availability Boys Girls Mixed Total Boys Girls Mixed Total
Primary 44,296 With 3,439 3,014 19,058 25,511 7% 6% 39% 52%
Without 4,273 2,454 12,058 18,785 9% 5% 25% 38%
Middle/Elem 2,712 With 289 504 1,316 2,109 1% 1% 3% 4%
Without 125 167 311 603 0% 0% 1% 1%
Secondary 1,777 With 396 458 857 1,711 1% 1% 2% 3%
Without 22 14 30 66 0% 0% 0% 0%
Higher Sec. 318 With 68 74 161 303 0% 0% 0% 1%
Without 5 - 10 15 0% 0% 0% 0%
Total 49,103 With 4,192 4,050 21,392 29,634 9% 8% 44% 60%
All Schools Without 4,425 2,635 12,409 19,469 9% 5% 25% 40%
12,444 With 859 716 1,828 3,403 2% 1% 4% 7%
Without 3,309 1,704 4,028 9,041 7% 3% 8% 18%
Level and Gender wise Schools
Numbers (# ) Percentage (%)
Only Closed Schools
-
5,000
10,000
15,000
20,000
25,000
30,000
Primary Middle/Elem Secondary Higher Sec.
25,511
2,109 1,711 303
18,785
603 66 15
Schools
Level of Schools
Level and Washroom Facilities wise Number of Schools
With
Without
70
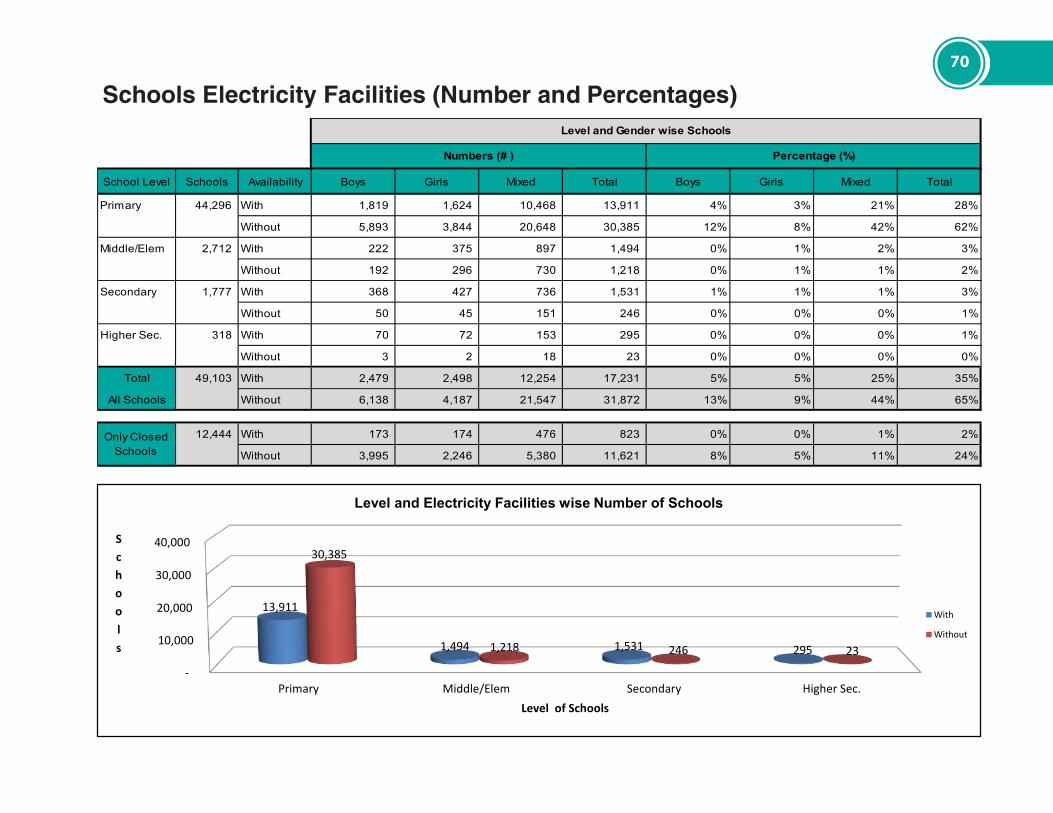
Schools Electricity Facilities (Number and Percentages)
School Level Schools Availability Boys Girls Mixed Total Boys Girls Mixed Total
Primary 44,296 With 1,819 1,624 10,468 13,911 4% 3% 21% 28%
Without 5,893 3,844 20,648 30,385 12% 8% 42% 62%
Middle/Elem 2,712 With 222 375 897 1,494 0% 1% 2% 3%
Without 192 296 730 1,218 0% 1% 1% 2%
Secondary 1,777 With 368 427 736 1,531 1% 1% 1% 3%
Without 50 45 151 246 0% 0% 0% 1%
Higher Sec. 318 With 70 72 153 295 0% 0% 0% 1%
Without 3 2 18 23 0% 0% 0% 0%
Total 49,103 With 2,479 2,498 12,254 17,231 5% 5% 25% 35%
All Schools Without 6,138 4,187 21,547 31,872 13% 9% 44% 65%
12,444 With 173 174 476 823 0% 0% 1% 2%
Without 3,995 2,246 5,380 11,621 8% 5% 11% 24%
Level and Gender wise Schools
Numbers (# ) Percentage (%)
Only Closed Schools
-
10,000
20,000
30,000
40,000
Primary Middle/Elem Secondary Higher Sec.
13,911
1,494 1,531 295
30,385
1,218 246 23
Schools
Level of Schools
Level and Electricity Facilities wise Number of Schools
With
Without

71
Schools Boundary Wall Facilities (Number and Percentages)
School Level Schools Availability Boys Girls Mixed Total Boys Girls Mixed Total
Primary 44,296 With 3,370 3,193 16,604 23,167 7% 7% 34% 47%
Without 4,342 2,275 14,512 21,129 9% 5% 30% 43%
Middle/Elem 2,712 With 306 528 1,214 2,048 1% 1% 2% 4%
Without 108 143 413 664 0% 0% 1% 1%
Secondary 1,777 With 385 457 804 1,646 1% 1% 2% 3%
Without 33 15 83 131 0% 0% 0% 0%
Higher Sec. 318 With 65 74 144 283 0% 0% 0% 1%
Without 8 - 27 35 0% 0% 0% 0%
Total 49,103 With 4,126 4,252 18,766 27,144 8% 9% 38% 55%
All Schools Without 4,491 2,433 15,035 21,959 9% 5% 31% 45%
12,444 With 1,035 874 1,781 3,690 2% 2% 4% 8%
Without 3,133 1,546 4,075 8,754 6% 3% 8% 18%
Level and Gender wise Schools
Numbers (# ) Percentage (%)
Only Closed Schools
-
5,000
10,000
15,000
20,000
25,000
Primary Middle/Elem Secondary Higher Sec.
23,167
2,048 1,646 283
21,129
664 131 35
Schools
Level of Schools
Level and Boundary Facilities wise Number of Schools
With
Without

72Schools Labortory Facilities (Number and Percentages)
School Level Schools Availability Science Lab
Biology Lab
Chemistry Lab
Physics Lab
Home Eco. Lab
Computer Lab
Science Lab
Biology Lab
Chemistry Lab
Physics Lab
Home Eco. Lab
Computer Lab
Primary 44,296 With 7 5 1 2 - 54 0% 0% 0% 0% 0% 0%
Without 44,289 44,291 44,295 44,294 44,296 44,242 90% 90% 90% 90% 90% 90%
Middle/Elem 2,712 With 72 27 25 25 18 99 0% 0% 0% 0% 0% 0%
Without 2,640 2,685 2,687 2,687 2,694 2,613 5% 5% 5% 5% 5% 5%
Secondary 1,777 With 935 499 500 502 107 489 2% 1% 1% 1% 1% 1%
Without 842 1,278 1,277 1,275 1,670 1,288 2% 3% 3% 3% 3% 3%
Higher Sec. 318 With 229 167 172 170 39 182 0% 0% 0% 0% 0% 0%
Without 89 151 146 148 279 136 0% 0% 0% 0% 0% 0%
Total 49,103 With 1,243 698 698 699 164 824 3% 1% 1% 1% 1% 2%
All Schools Without 47,860 47,860 47,860 47,860 47,860 47,860 97% 97% 97% 97% 97% 97%
12,444 With 8 7 5 5 1 2 0% 0% 0% 0% 0% 0%
Without 12,436 12,437 12,439 12,439 12,443 12,442 25% 25% 25% 25% 25% 25%
Level and Gender wise Schools
Numbers (# ) Percentage (%)
Only Closed Schools
0%
20%
40%
60%
80%
100%
Science Lab Biology Lab Chemistry Lab Physics Lab Home Eco. Lab Computer Lab
Schools
Lab Category
Lab Category Facilities wise Number of Schools

73
Schools Play Ground Facilities (Number and Percentages)
School Level Schools Availability Boys Girls Mixed Total Boys Girls Mixed Total
Primary 44,296 With 1,267 1,151 8,025 10,443 3% 2% 16% 21%
Without 6,445 4,317 23,091 33,853 13% 9% 47% 69%
Middle/Elem 2,712 With 134 251 611 996 0% 1% 1% 2%
Without 280 420 1,016 1,716 1% 1% 2% 3%
Secondary 1,777 With 255 312 496 1,063 1% 1% 1% 2%
Without 163 160 391 714 0% 0% 1% 1%
Higher Sec. 318 With 59 60 102 221 0% 0% 0% 0%
Without 14 14 69 97 0% 0% 0% 0%
Total 49,103 With 1,715 1,774 9,234 12,723 3% 4% 19% 26%
All Schools Without 6,902 4,911 24,567 36,380 14% 10% 50% 74%
12,444 With 167 147 502 816 0% 0% 1% 2%
Without 4,001 2,273 5,354 11,628 8% 5% 11% 24%
Level and Gender wise Schools
Numbers (# ) Percentage (%)
Only Closed Schools
-
10,000
20,000
30,000
40,000
Primary Middle/Elem Secondary Higher Sec.
10,443
996 1,063 221
33,853
1,716 714 97
Schools
Level of Schools
Level and Play Ground Facilities wise Number of Schools
With
Without

74
Schools Library Facilities (Number and Percentages)
School Level Schools Availability Boys Girls Mixed Total Boys Girls Mixed Total
Primary 44,296 With 34 52 271 357 0% 0% 1% 1%
Without 7,678 5,416 30,845 43,939 16% 11% 63% 89%
Middle/Elem 2,712 With 13 28 59 100 0% 0% 0% 0%
Without 401 643 1,568 2,612 1% 1% 3% 5%
Secondary 1,777 With 158 129 258 545 0% 0% 1% 1%
Without 260 343 629 1,232 1% 1% 1% 3%
Higher Sec. 318 With 47 39 96 182 0% 0% 0% 0%
Without 26 35 75 136 0% 0% 0% 0%
Total 49,103 With 252 248 684 1,184 1% 1% 1% 2%
All Schools Without 8,365 6,437 33,117 47,919 17% 13% 67% 98%
12,444 With 3 4 13 20 0% 0% 0% 0%
Without 4,165 2,416 5,843 12,424 8% 5% 12% 25%
Level and Gender wise Schools
Numbers (# ) Percentage (%)
Only Closed Schools
-
10,000
20,000
30,000
40,000
50,000
Primary Middle/Elem Secondary Higher Sec.
357 100 545 182
43,939
2,612 1,232 136
Schools
Level of Schools
Level and Library Facilities wise Number of Schools
With
Without

75
Facilities in Classroom : Level wise (Numbers and Percentages)
School LevelBlack/ White/ Smart/ Soft
BoardsStudent Chairs Student
Desks/BenchesTeachers Tables Teachers Chairs Fans Almirahs Computers
Primary 90,870 90,428 566,121 62,691 124,920 91,182 30,855 1,118
Middle / Elem. 12,919 23,575 86,535 8,863 20,273 17,967 4,656 771
Secondary 24,174 75,958 224,411 20,005 51,455 54,103 16,479 6,717
Higher Secondary 6,659 37,376 68,067 5,466 16,058 17,261 5,728 3,206
Total 134,622 227,337 945,134 97,025 212,706 180,513 57,718 11,812
Primary 68% 40% 60% 65% 59% 51% 53% 9%
Middle / Elem. 10% 10% 9% 9% 10% 10% 8% 7%
Secondary 18% 33% 24% 21% 24% 30% 29% 57%
Higher Secondary 5% 16% 7% 6% 8% 10% 10% 27%
Grand Total 100% 100% 100% 100% 100% 100% 100% 100%
Numbers ( # )
Percentage ( % )

76
Schools with Basic Facilities : Districts wise
Note : Closed Schools Included SMC=School Management Committee
District Schools Electricity Washroom Drinking Water Boundary Wall Lab/Science Lab Library Play Ground SMCBadin 3,127 857 1,776 1,543 1,290 41 36 1,098 2,730 Dadu 2,076 1,001 1,425 983 1,285 42 38 712 1,204 Hyderabad 907 582 735 539 764 68 55 420 708 Jamshoro 842 331 538 290 641 25 33 272 578 Mitiari 971 620 735 646 744 20 27 448 691 Sujawal 1,829 137 497 204 430 10 12 194 752 Tando Allah Yar 835 424 608 402 624 25 13 179 591 Tando Muhammad Khan 1,166 163 710 529 664 6 5 262 782 Thatta 1,607 181 701 322 639 24 32 394 966 Central Karachi 621 485 544 478 564 138 67 425 526 East Karachi 285 246 259 223 259 70 54 155 243 Korangi Karachi 432 353 395 276 402 96 53 305 371 Malir Karachi 745 364 554 311 593 51 37 316 547 South Karachi 354 309 320 260 337 65 34 155 292 West Karachi 599 406 480 281 527 63 55 328 498 Jacobabad 1,555 375 781 428 657 19 17 331 935 Kambar-Shahdadkot 1,717 636 954 550 992 25 20 296 1,029 Kashmore 1,681 315 638 907 594 28 13 326 935 Larkana 1,287 867 1,067 1,045 1,126 45 49 372 1,005 Shikarpur 1,374 546 808 760 783 40 40 368 671 Ghotki 2,231 521 1,342 1,417 1,192 36 54 629 1,521 Khairpur Mirs 3,617 1,842 2,591 2,609 2,117 90 101 1,096 2,700 SUKKUR 1,275 458 903 905 856 66 64 377 901 Mirpur Khas 2,311 571 1,213 699 965 63 47 569 1,489 Tharparkar 4,269 694 2,108 445 1,725 35 24 418 2,600 Umerkot 2,745 476 1,429 684 1,271 27 30 243 1,484 Naushero Feroze 2,552 1,410 1,785 1,910 1,478 49 44 622 1,874 Sanghar 3,350 752 1,911 1,460 1,804 57 53 673 2,099 Shaheed Benazirabad 2,743 1,309 1,827 1,737 1,821 64 77 740 1,931
Grand Total 49,103 17,231 29,634 22,843 27,144 1,388 1,184 12,723 32,653
31,872 19,469 26,260 21,959 47,715 47,919 36,380 16,450
Schools having Advance FacilitiesSchools having Basic Facilities
Without Facilities / No Info

77
Schools without Basic Facilities : District wise
District Schools Electricity Washroom Drinking Water Boundary Wall Lab/Science Lab Library Play Ground SMCBadin 3,127 1,219 300 533 786 3,086 3,091 2,029 397 Dadu 2,076 2,126 1,702 2,144 1,842 2,034 2,038 1,364 872 Hyderabad 907 325 172 368 143 839 852 487 199 Jamshoro 842 511 304 552 201 817 809 570 264 Mitiari 971 351 236 325 227 951 944 523 280 Sujawal 1,829 1,692 1,332 1,625 1,399 1,819 1,817 1,635 1,077 Tando Allah Yar 835 1,183 999 1,205 983 810 822 656 244 Tando Muhammad Khan 1,166 672 125 306 171 1,160 1,161 904 384 Thatta 1,607 985 465 844 527 1,583 1,575 1,213 641 Central Karachi 621 136 77 143 57 483 554 196 95 East Karachi 285 39 26 62 26 215 231 130 42 Korangi Karachi 432 1 (41) 78 (48) 336 379 127 61 Malir Karachi 745 235 45 288 6 694 708 429 198 South Karachi 354 123 112 172 95 289 320 199 62 West Karachi 599 339 265 464 218 536 544 271 101 Jacobabad 1,555 1,306 900 1,253 1,024 1,536 1,538 1,224 620 Kambar-Shahdadkot 1,717 919 601 1,005 563 1,692 1,697 1,421 688 Kashmore 1,681 1,059 736 467 780 1,653 1,668 1,355 746 Larkana 1,287 850 650 672 591 1,242 1,238 915 282 Shikarpur 1,374 741 479 527 504 1,334 1,334 1,006 703 Ghotki 2,231 2,829 2,008 1,933 2,158 2,195 2,177 1,602 710 Khairpur Mirs 3,617 901 152 134 626 3,527 3,516 2,521 917 SUKKUR 1,275 2,094 1,649 1,647 1,696 1,209 1,211 898 374 Mirpur Khas 2,311 704 62 576 310 2,248 2,264 1,742 822 Tharparkar 4,269 1,537 123 1,786 506 4,234 4,245 3,851 1,669 Umerkot 2,745 3,141 2,188 2,933 2,346 2,718 2,715 2,502 1,261 Naushero Feroze 2,552 2,859 2,484 2,359 2,791 2,503 2,508 1,930 678 Sanghar 3,350 1,559 400 851 507 3,293 3,297 2,677 1,251 Shaheed Benazirabad 2,743 1,436 918 1,008 924 2,679 2,666 2,003 812
Grand Total 49,103 31,872 19,469 26,260 21,959 47,715 47,919 36,380 16,450
17,231 29,634 22,843 27,144 1,388 1,184 12,723 32,653
Schools Without/No Info Advance FacilitiesSchools Without / No Info Basic Facilities
With Facilities
Note : Closed Schools Included SMC=School Management Committee

78
Facilities in Classroom : Districts wise
District Names Black Boards Student Chairs Student Desks/Benches
Teachers Tables Teachers Chairs Fans Almirahs Computers
Badin 5,926 11,237 44,527 5,250 10,600 7,327 3,428 994 Dadu 5,195 3,113 41,994 4,237 10,054 7,100 1,707 294 Hyderabad 5,327 12,752 41,635 4,359 10,254 10,754 2,822 634 Jamshoro 2,153 3,627 17,155 1,991 3,420 1,503 1,347 319 Mitiari 2,628 3,964 19,242 2,095 4,248 4,647 1,248 224 Sujawal 2,873 4,395 21,788 2,384 5,227 5,133 1,356 206 Tando Allah Yar 2,465 2,035 18,986 1,694 3,264 4,021 1,038 171 Tando Muhammad Khan 2,101 3,764 13,972 1,506 3,023 2,009 930 198 Thatta 1,874 1,651 14,628 1,624 2,946 903 939 133 Central Karachi 4,900 5,263 43,174 3,066 7,723 8,142 3,145 613 East Karachi 2,743 3,295 21,261 1,602 3,806 5,074 1,367 451 Korangi Karachi 4,165 8,053 31,398 2,303 4,893 6,155 1,905 491 Malir Karachi 4,250 2,730 31,792 1,822 4,255 4,614 1,492 237 South Karachi 3,043 4,433 23,929 2,185 4,298 3,731 1,678 255 West Karachi 3,453 3,369 33,941 2,010 5,199 5,351 1,865 364 Jacobabad 2,858 3,829 20,273 1,972 4,971 2,518 850 271 Kambar-Shahdadkot 5,854 6,704 45,349 5,059 11,999 11,757 1,970 418 Kashmore 3,304 9,602 25,623 2,531 5,692 5,460 1,377 374 Larkana 2,477 7,021 17,121 1,741 4,309 2,298 543 201 Shikarpur 3,783 3,280 27,212 2,833 7,336 5,101 970 217 Ghotki 9,847 36,574 67,842 8,034 17,289 15,334 4,228 938 Khairpur Mirs 7,093 17,934 37,551 4,263 8,539 8,905 2,713 784 SUKKUR 8,913 4,709 36,112 3,728 8,554 6,592 1,966 505 Mirpur Khas 4,837 15,617 35,309 4,437 9,306 5,996 2,883 316 Tharparkar 6,090 11,753 27,143 4,125 7,547 3,130 2,676 397 Umerkot 3,891 6,688 24,968 3,118 6,545 4,286 1,831 362 Naushero Feroze 6,827 12,311 50,472 6,009 12,889 9,976 3,075 307 Sanghar 7,225 7,854 54,892 5,540 12,730 10,611 3,125 368 Shaheed Benazirabad 8,527 9,780 55,845 5,507 11,790 12,085 3,244 770
Grand Total 134,622 227,337 945,134 97,025 212,706 180,513 57,718 11,812

79
Gross Intake Rates at Primary LevelD
istr
ict
Bad
in
Dad
u
Hyd
erab
ad
Tha
tta
Jam
shor
o
Miti
ari
Tan
do A
llah
Yar
Tan
do M
. Kha
n
Suj
awal
Cen
tral
Kar
achi
Eas
t Kar
achi
Sou
th K
arac
hi
Wes
t Kar
achi
Mal
ir K
arac
hi
Kor
angi
Kar
achi
Jaco
baba
d
Lark
ana
Shi
karp
ur
Kas
hmor
e
Kam
bar-
Sha
hdad
kot
Kha
irpur
Mirs
Suk
kur
Gho
tki
Mirp
ur K
has
Tha
rpar
kar
Um
erko
t
San
ghar
Nau
sher
o F
eroz
e
Sha
heed
B
enaz
iraba
d
All
Sin
dh
Boy
s
63 44 45 38 56 78 67 68 64 9 8 10 13 20 11 57 38 53 88 36 29 78 44 67 88 86 39 83 63 42
Gir
ls
37 35 38 31 38 46 39 40 42 9 8 10 12 26 12 39 30 29 85 26 17 59 34 33 72 46 30 50 46 30
Tota
l
51 40 42 34 47 63 54 55 53 9 8 10 12 23 12 49 34 42 87 31 23 69 39 51 81 67 35 68 55 36
5140 42 34
4763
54 55 53
9 8 10 1223
12
4934 42
87
31 23
69
3951
8167
35

80
Gross Enrollment Rate in Government Schools (Profiling 2019)
Stages of ClassesAge
Group in Years
Boys Girls Total Boys Girls Total Boys Girls Total Boys Girls Total
Pre-Primary 4 5,082,603 4,593,843 9,676,446 516,498 368,745 885,243 10% 8% 9% 90% 92% 91%
Primary 5 - 9 4,170,753 3,738,145 7,908,898 1,523,250 950,443 2,473,693 37% 25% 31% 63% 75% 69%
Middle 10 - 12 2,328,698 1,944,287 4,272,985 433,550 256,978 690,528 19% 13% 16% 81% 87% 84%
Secondary 13 - 14 1,124,171 960,647 2,084,818 248,398 134,160 382,558 22% 14% 18% 78% 86% 82%
Higher Secondary 15 - 16 1,022,607 882,228 1,904,835 90,304 38,814 129,118 9% 4% 7% 91% 96% 93%
13,728,832 12,119,150 25,847,982 2,812,000 1,749,140 4,561,140 20% 14% 18% 80% 86% 82%Grand Total
Gross Out of Govt SchoolsGER in Govt SchoolsProjected Population Enrolment
0%
20%
40%
60%
80%
100%
Pre-Primary Primary Middle Secondary Higher Secondary
9%31%
16% 18%7%
91%69%
84% 82%93%
GER
Enrolment Stages
Gross Out of Govt Schools
GER in Govt Schools

81
Completion Rates at Primary Level D
istr
ict
Bad
in
Dad
u
Hyd
erab
ad
Tha
tta
Jam
shor
o
Miti
ari
Tan
do A
llah
Yar
Tan
do M
. Kha
n
Suj
awal
Cen
tral
Kar
achi
Eas
t Kar
achi
Sou
th K
arac
hi
Wes
t Kar
achi
Mal
ir K
arac
hi
Kor
angi
Kar
achi
Jaco
baba
d
Lark
ana
Shi
karp
ur
Kas
hmor
e
Kam
bar-
Sha
hdad
kot
Kha
irpur
Mirs
Suk
kur
Gho
tki
Mirp
ur K
has
Tha
rpar
kar
Um
erko
t
San
ghar
Nau
sher
o F
eroz
e
Sha
heed
B
enaz
iraba
d
All
Sin
dh
Boy
s
60 69 35 44 54 52 61 66 41 6 5 7 7 14 6 65 54 65 129 51 49 99 52 49 51 57 52 95 89 40
Gir
ls
32 54 30 33 39 27 35 38 28 8 7 10 6 22 7 48 42 33 134 35 25 68 39 24 30 26 38 56 62 27
Tota
l
47 62 33 39 47 40 49 53 35 7 6 8 6 18 7 58 48 51 131 44 38 85 46 37 41 43 45 78 76 34
4762
33 39 47 40 49 5335
7 6 8 618 7
58 48 51
131
44 38
85
46 37 41 43 45
78 76
(Boys+Girls) Primary Completion Rates by District

82
Transition Rates From Primary to Middle Level D
istr
ict
Badi
n
Dad
u
Hyd
erab
ad
That
ta
Jam
shor
o
Mitia
ri
Tand
o Al
lah
Yar
Tand
o M
. Kha
n
Suja
wal
Cen
tral K
arac
hi
East
Kar
achi
Sout
h Ka
rach
i
Wes
t Kar
achi
Mal
ir Ka
rach
i
Kora
ngi K
arac
hi
Jaco
baba
d
Lark
ana
Shik
arpu
r
Kash
mor
e
Kam
bar-
Shah
dadk
ot
Khai
rpur
Mirs
Sukk
ur
Gho
tki
Mirp
ur K
has
Thar
park
ar
Um
erko
t
Sang
har
Nau
sher
o Fe
roze
Shah
eed
Bena
zira
bad
All S
indh
Boy
s
65 67 87 77 86 35 85 55 56 87 96 139 63 68 83 53 51 52 111 62 41 120 45 67 54 60 62 72 70 66
Girl
s
88 62 107 110 68 20 82 67 40 121 120 167 57 150 90 59 50 28 179 55 35 148 65 100 54 74 97 74 82 80
Tota
l
70 65 96 87 80 31 84 58 51 105 109 155 60 102 87 55 50 44 130 60 39 129 51 75 54 63 71 72 73 70
70 6596 87 80
31
8458 51
105 109
155
60
102 8755 50 44
130
6039
129
5175
54 63 71 72 73
(Boys+Girls) Primary to Middle Transition Rates by District

83
Students (Pupil) per teacher, school, classroom ratios Division
Dis
tric
t
Bad
in
Dad
u
Hyd
erab
ad
Tha
tta
Jam
shor
o
Miti
ari
Tan
do A
llah
Yar
Tan
do M
uham
ma d
K
han
Suj
awal
Cen
tral
Kar
achi
Eas
t Kar
achi
Sou
th K
arac
hi
Wes
t Kar
achi
Mal
ir K
arac
hi
Kor
angi
Kar
achi
Jaco
baba
d
Lark
ana
Shi
karp
ur
Kas
hmor
e
Kam
bar-
Sha
hdad
kot
Kha
irpur
Mirs
SU
KK
UR
Gho
tki
Mirp
ur K
has
Tha
rpar
kar
Um
erko
t
San
ghar
Nau
sher
o F
eroz
e
Sha
heed
B
enaz
iraba
d
All
Sin
dh
Pup
il /
Tea
cher
40 38 23 33 33 33 48 32 38 16 17 20 28 27 22 32 38 36 39 39 39 41 43 37 38 37 36 39 43 34
Pup
il /
Sch
ool
68 112 204 49 114 106 109 58 38 156 179 176 145 93 215 95 207 110 88 116 97 146 91 74 42 50 80 110 101 93
Pup
il /
Cla
ssro
om
44 46 42 31 38 40 44 33 32 25 24 23 31 29 31 51 57 48 59 50 43 48 50 40 29 33 43 48 46 41
Mirpur Khas SBA at N'shahHyderabad Karachi Larkana Sukkur
0
50
100
150
200
250
Rat
ios
P/T P/S P/C

84
Students Flow Rates By Gender and Class (Cohort Student Flow Method) at Primary Stage
Boys Flow Rates by Class
2017-2018 1 to 2 2 to 3 3 to 4 4 to 5 Graduate Average 5 Yr
Promotion Rate 93.2% 86.8% 87.2% 86.2% 99.3% 90.5%
Repeatition Rate 0.0% 0.0% 0.0% 1.1% 0.7% 0.3%
Dropout Rate 6.8% 13.2% 12.8% 12.7% 0.0% 9.1%
Girls Flow Rates by Class
2017-2018 1 to 2 2 to 3 3 to 4 4 to 5 Graduate Average 5 Yr
Promotion Rate 114.3% 109.6% 110.8% 111.0% 99.3% 109.0%
Repeatition Rate 0.0% 0.0% 0.0% 1.3% 0.7% 0.4%
Dropout Rate -14% -9.6% -10.8% -12.3% 0.0% -9.4%
( Boys+Girls ) Flow Rates by Class
2017-2018 1 to 2 2 to 3 3 to 4 4 to 5 Graduate Average 5 Yr
Promotion Rate 100.3% 94.4% 94.9% 94.2% 99.3% 96.6%
Repeatition Rate 0.0% 0.0% 0.0% 1.1% 0.7% 0.4%
Dropout Rate -0.3% 5.6% 5.1% 4.7% 0.0% 3.0%
100.
3%
94.4
%
94.9
%
94.2
%
99.3
%
0.0%0.0% 0.0% 1.1%
0.7%
-0.3
%
5.6%
5.1%
4.7% 0.
0%
-20%
0%
20%
40%
60%
80%
100%
1 to 2 2 to 3 3 to 4 4 to 5 Graduate
Perc
enta
ges
Classes
( Boys+Girls ) Flow Rates at Primary Stage
Dropout Rate Repeatition Rate Promotion Rate
Note : To calculate Student Flow Rates we use Cohort Student Flow Method. Taking Classwise Enrollment of 2017-18 and 2018-19 and Repeaters of 2018-19

85
Gross Enrolment Rates in Government Schools at Primary Stage(District wise) 2018-19
Note: 1. Population included the age group 5 to 9 Years (Projected for year 2018)2. Enrolment included the classess of Primary stage i.e I to V (Government)3. In newly created district we have not exact population breakup.
District Name Boys Girls Total Boys Girls Total Boys Girls Total Boys Girls TotalBadin 154,769 137,855 292,624 79,164 39,303 118,467 51% 29% 40% 49% 71% 60%Dadu 155,296 134,631 289,927 75,228 50,036 125,264 48% 37% 43% 52% 63% 57%Hyderabad 140,756 130,547 271,303 52,654 41,237 96,891 37% 32% 35% 63% 68% 65%Thatta 85,443 75,087 160,530 32,449 18,033 50,482 38% 24% 31% 62% 76% 69%Jamshoro 76,912 66,380 143,292 29,876 20,379 50,255 39% 31% 35% 61% 69% 65%Mitiari 55,409 50,049 105,458 36,302 21,564 57,866 66% 43% 55% 34% 57% 45%Tando Allah Yar 55,780 50,349 106,129 29,591 15,330 44,921 53% 30% 42% 47% 70% 58%Tando Muhammad Khan 47,506 41,866 89,372 27,394 14,278 41,672 58% 34% 47% 42% 66% 53%Sujawal 79,377 66,752 146,129 32,823 16,210 49,033 41% 24% 34% 59% 76% 66%Central Karachi 305,840 289,510 595,350 22,180 23,682 45,862 7% 8% 8% 93% 92% 92%East Karachi 185,036 175,157 360,193 10,961 12,977 23,938 6% 7% 7% 94% 93% 93%South Karachi 249,607 236,281 485,888 13,183 18,030 31,213 5% 8% 6% 95% 95% 94%West Karachi 213,673 202,263 415,936 23,511 25,158 48,669 11% 12% 12% 89% 88% 88%Malir Karachi 81,128 76,796 157,924 19,596 16,748 36,344 24% 22% 23% 76% 78% 77%Korangi Karachi 288,047 272,669 560,716 20,158 23,533 43,691 7% 9% 8% 93% 91% 92%Jacobabad 102,666 87,082 189,748 51,517 29,699 81,216 50% 34% 43% 50% 66% 57%Larkana 156,587 141,381 297,968 81,987 64,372 146,359 52% 46% 49% 48% 54% 51%Shikarpur 110,834 94,134 204,968 54,866 32,288 87,154 50% 34% 43% 50% 66% 57%Kashmore 96,646 76,295 172,941 56,059 24,101 80,160 58% 32% 46% 42% 68% 54%Kambar-Shahdadkot 153,481 134,309 287,790 62,485 43,795 106,280 41% 33% 27% 59% 67% 63%Khairpur Mirs 244,861 212,540 457,401 101,079 65,524 166,603 41% 31% 36% 59% 69% 64%Sukkur 122,399 109,931 232,330 62,772 43,390 106,162 51% 39% 46% 49% 61% 54%Ghotki 158,916 139,612 298,528 78,877 36,097 114,974 50% 26% 39% 50% 74% 61%Mirpur Khas 136,951 124,356 261,307 66,965 29,574 96,539 49% 24% 37% 51% 76% 63%Tharparkar 159,647 123,737 283,384 84,121 45,872 129,933 53% 37% 46% 47% 63% 54%Umerkot 106,732 94,717 201,449 59,416 26,112 85,528 56% 28% 42% 44% 72% 58%Sanghar 209,005 186,600 395,605 96,906 48,441 145,347 46% 26% 37% 54% 74% 63%Naushero Feroze 118,595 102,929 221,524 78,116 52,784 130,900 66% 51% 59% 34% 49% 41%Shaheed Benazirabad 118,854 104,330 223,184 83,014 51,896 134,910 70% 50% 60% 30% 50% 40%
Province Total 4,170,753 3,738,145 7,908,898 1,523,250 950,443 2,473,693 37% 25% 31% 63% 75% 69%
Out of Govt SchoolsGER in Govt SchoolsProjected Population Enrolment

PGS 2019 DEFINITIONS
86
Adoption of a public school through public private partnership for improving the physical condition and standard of learning outcomes of student through quality education.Records student’s presence at or participation in course-related sessions, additional information during the course of time, are recordedSchool under administrative authority of district education officers. (male), generally having boys enrolmentBasic Pay Scale that a government employee has in actualBasic pay scale of an employee/or salary amount at the time of appointmentA basic pay scale that is increase during a course of time, after every 9 yearsSchools opened as a branch of some other high or higher secondary school and administratively report to the parent to the parent school. Only teachers are provided by the education department, and all other facilities are arranged and maintained by the communityThe single school under various school are merged under school consolidation policyIndependent code allocated by Finance department to school for incurring expensesSchool building condition is fully damaged or near to devastatedDrawing Disbursement Officer Code (Secondary & Higher Secondary school have their own DDO code, but mostly all primary schools have TEO wise codes)District Officers Elementary ( Some schools are functional as masjid schools- only in Karachi) District officer local bodies (Schools belong to city district govt. & KMC).Pupils leaving school before the completion of a given grade of education or leaving at some intermediate or non-terminal point in cycle of schoolingThe level school from Pre-primary/ECE to eight classSchool that are conducting classes regularly and where both teachers and students are recorded in the census dataThe register that contains of details of students admission/transfer/dropout/pass outSchool under administrative authority of district education officer (female) generally having girl enrolment.
ADOPTED SCHOOL
ATTENDANCE REGISTER
BOYS SCHOOL
BPS BPS AT THE TIME OF APPOINTMENTBPS TIME SCALE
BRANCH SCHOOL
CAMPUS SCHOOL
COST CENTRE
DANGEROUSDDO CODE
DO ELEMENTARY (MASJID SCHOOL)DO LOCAL BODIES
DROPOUT RATE
ELEMENTARY SCHOOLFUNCTIONAL
GENERAL REGISTER
GIRLS SCHOOL
TERMS DEFINITIONS

PGS 2019 DEFINITIONS
87
Schools offerings grades XI and XII these intermediate classes are also offered by the colleges, which are not included Its belong to highest degree/certificate/diploma from a public or private institutes School building are made up of wood/mud/straw and dry leaves Those school merged into campus schoolThe level of school from class VI to VIIIThe construction of school building is partially constructed and some part are constructed as katcha constructionSchool having mixed enrolment of boys and girls both, under the jurisdiction of district education maleSchools, which are reported continuously closed in the => 4 years consecutively and have less/weak potential to transform into viable schools. Only after proper physical survey by team of engineers and field offices, will propose/ determine their utilization purpose. Community Donated/Other Department Building/OtaqueSchool building is either rental, donated etc. but not provided by the governmentSchools which are reported closed in last 3 consecutive years
Percentage of population attending corresponding school grade according to their individual ages. Ages 5 to 9 in primary grades (1 to 5)Ages 10 to 12 in middle grades (6 to 8)Ages 13 to 14 in secondary grades (9 to 10) Ages 15 to 16 in higher secondary grades (11 to 12)The participation rates presented in this profiles does not include enrolment data in the private sectorA serial no. that is allotted to public sectors employees by provincial accountant general office it contain eight digits like “99999999” Facilities like; electricity, water, toilets, classrooms, libraries, desks and chairsPromoting private school in Rural Sindh- A school project by Sindh education foundation by public partnership-in 10 districts of SindhA word, letter, or number placed before anotherA school where children receive pre-primary/ECE till class V from the age of about four to nine, and before middle schoolSchool location in a district or union council (below a town committee) levelSchool building not requiring any repairs
TERMS DEFINITIONS
HIGHER SECONDARY SCHOOL HIGHEST ACADEMIC QUALIFICATIONKATCHAMERGED SCHOOLMIDDLE SCHOOLMIXED CONSTRUCTION TYPEMIXED SCHOOL
NON-GOVT TEACHER
OTHER BUILDINGOTHER OWNERSHIP
PERMANENT DYSFUNCTIONALPARTICIPATION RATE
PERSONAL AG NUMBERPHYSICAL FACILITIES
PPRS
PREFIXPRIMARY SCHOOL
RURAL AREA SCHOOLSSATISFACTORY BUILDING

PGS 2019 DEFINITIONS
88
Schools conducting classes in open-air and having no building and no branch school also schools which are operating in rental buildingsThe level of school from class katchi to class 10, or class 6 to class 10, or it can be only class 9 & 10.One floor of a building or some rooms used by other school. Only SEMIS coded schools can share the same buildingScheduled New Expenditure- no. of all sanctioned posts (like teaching & Non-teaching Staff)Part of village as per revenue markingSchools which are reported closed in the current year census (2016-2017) only, but were functional in previous yearTeacher(s) possessing any training certificate/degree (PTC, CT, B.Ed, M.Ed).Teacher(s) not having training certificate (PTC, CT, B.Ed, andM.Ed). These teachers are not given any promotion in their profes-sional life until they qualify as a trained teachersSchool locations in town or Municipal Committee level (above committee). A sherwan or union council in Pakistan is an elected local govern-ment body consisting of 21 councillors, and headed by a namiz now called chairman (which is equivalent to a mayor ) and a aib nazim now called Vice chairman (deputy) Schools, which are reported as open, functions smoothly and have potential to overcome any challenges of closure or facilities in case reported.School which are reported non-consecutive closed in 2 years or greater than 2 years but less than 5 years, in last 5 years census. Meaning by, remained functional schools for some time period/-years, during the indicated total term. Approved schools to be opened by the education department, but are not opened due to non-appointment to staff and unavailability of building, furniture etc.School which have the SEMIS CodeTracking ID SchoolSchool Education and Literacy Department
TERMS DEFINITIONS
SHELTER LESS SCHOOLSECONDARY SCHOOL
SHARED BUILDING
SNE
TAPPA TEMPORARY DYSFUNCTIONALTRAINED TEACHER
UNTRAINED TEACHER
URBAN AREA SCHOOLS UNION COUNCIL
VIABLE
VIABLE DYSFUNCTIONAL
WITHOUT SNE SCHOOLS
SCTIDSELD

PGS 2019 QUESTIONNAIRES
89
Profiling of Government Schools 2019 For Primary to Higher Secondary Schools
Sindh Educa�on Management Informa�on System School Educa�on & Literacy Department, RSU,
Government of Sindh
Profiling Month
GPS Coordinates
Form Serial No #
Form Filling / Visit Date Lon (E)
1. SEMIS Code / Tracking ID Lat (N)
D D D M M . M M M M
2. Valid 9 Digit SEMIS code Displayed on Main Gate or Visible Loca�on? 1. Yes 2. No
3. School Name with Prefix
4. Year of Establishment 5. Phone
6. Address:
7a. Village / Mohalla
7b. Deh 7c. Tappa
7d. Union council / Union Commi�ee / Town Commi�ee / Municipal Commi�ee
7e. Taluka / Sub-division 7f. District
8. Na�onal Assembly (NA)
9. Provincial Assembly (PS)
.
Indicator Code
10. Loca�on 1. Urban 2. Rural
11. Level 1. Primary 2. Middle 3. Elementary4. Secondary 5. Higher Secondary
*6. With permission to run middle / Secondary / Higher Secondary classes* [School having permission to run next level of classes should mention option 6]
12a. Has school upgraded to next level from October 2017 �ll Profile filling date? 1. Yes 2. No
12b. If yes then write upgraded level. 2. Middle 3. Elementary 4. Secondary 5. Higher Secondary
Sec�on A - General Informa�on

PGS 2019 QUESTIONNAIRES
90
Indicator Code
13. Gender / Category 1. Boys School 2. Girls School 3. Mixed /Co-Educa�on
14. Shi� 1. Morning 2. A�ernoon 3. Both Shi�s
15. School Administra�on1. Taluka Educa�on Officer (Male) 2. Taluka Educa�on Officer (Female)3. DO Local Bodies 4. Bureau of Curriculum 5. Other___________________________
16. School Status
Indicator Code
a. Status Detail 1. Func�onal 2. Temporary Dysfunc�onal 3. Viable Dysfunc�onal4. Permanent Dysfunc�onal 5. Non-Viable
b. For ‘Temporary Dysfunc�onal’, ‘Viable Dysfunc�onal’, ‘Permanent Dysfunc�onal’ and‘Non-Viable’, write the day, month and Year of Dysfunc�onal/closure
DD-MM-YYYY
c. Write code for major reason.1. Non-availability of Teacher 2. No Popula�on / No Enrollment 3. School ceases to func�onlong �me ago and no record available for this school (Not in existence) 4. Due to li�ga�on5. Due to Law and order situa�on 6. Any Other Specify ______________________________
Consolida�on, Clustering, Surrounding and Branch School(s) Informa�on
Indicator Code
17a. Is this Branch School? 1. Yes 2. No
17b. If Yes then Main School Name_____________________________________ & SEMIS_______________
18a. Is this a Campus or Hub School? 1. Yes 2. No (Note: If yes then fill detail “Sec�on I - Proforma for Campus / Cluster Schools”
18b. If yes then write how many schools are merged? No. of Merge Schools______________________
19. List of surrounding Government schools [Schools within same premises OR Adjacent schools OR wheredistance within 500 meters (Half Kilometer)
S.# SEMIS code School Name (Prefix + Name) Type of school*
(See codes)
Distance in meters
1
2
3
4
* Codes for “Type of school”: 1. Same premises 2. Adjacent 3. within 500 meters

PGS 2019 QUESTIONNAIRES
91
20. Total No. of surrounding Sindh Educa�on Founda�on (SEF) & Private schools within distance of 1.5 K.M
No. of SEF schools No. of private schools Total surrounding schools
21. School adop�on detail
Indicator Code
a. Is this school adopted? 1. Yes 2. No
b. If Yes then who Is the school adopter?1. Under Educa�on Management Organiza�on (EMO) 2. Sindh Educa�on Founda�on (SEF)
3. Other Specify_____________________________________________________________
c. If Yes then men�on school adopter detail.
(i) Name of adopter______________________________________ (ii) Contact:______________________
22. School Building Detail
Indicator Code
a. Availability of Building 1. Yes 2. No
b. If Yes, write the relevant code1. Government Building 2. SHARED with Other Gov’t School Building, SEMIS ID: ___________
3. RENTED 4. OTHER Building, Specify______________________________________________
c. If No, write the relevant code 1. Under Tree 2. Under Chhapra3. Hut 4. Chourah
d. Type of building 1. Pakka / RCC / Tier guarder 2. Katcha 3. Mixed
e. Condi�on of Building 1. Sa�sfactory 2. Needs Repair 3. Dangerous
Indicator Number
f. School total AREA in square feet?
g. Total number of rooms
h. Total number of rooms used as classrooms
Indicator Code
i.(i). Does School has fully func�onal ECE classroom 1. Yes 2. No
i.(ii). If Yes then number of rooms used for ECE Classes:________________
j. Write the total No. of rooms u�lized for the purpose other than Learning / Teaching1. HM Office 2. Staff Room 3. NGO 4. District Administra�on Offices5. Occupied by Villager 6. Community Centre 7. Voca�onal Training Centre
8. Other specify________________________________________________
Sec�on B - Infrastructure

PGS 2019 QUESTIONNAIRES
92
Major / Minor Repair and Construc�on Work Detail
Indicator Code
23a. Has this School awarded any (minor) repair and maintenance work (from Nov 2017 to �ll the date of filling form)? 1. Yes 2. No
23b. If yes, men�on repair detail___________________________________________________________
24a. Has this School awarded construc�on (Civil work) from Nov 2017 to �ll the date of filling form? 1. Yes 2. No
24b. If yes then what was constructed? 1. New building 2. Addi�onal Room(s) 3. Washrooms(s) 4. Boundary wall5. Other (Specify)_____________________________________________________
24c. If yes then has work completed? 1. Yes 2. No
25. Basic Facili�es
Indicator Code
a.(i). Drinking water facility 1. Yes 2. No
a.(ii). if Yes then it is Func�onal or Non-Func�onal? 1. Func�onal 2. non-func�onal
a.(iii). If func�onal then type of water facility 1. Ground 2. Surface
a.(iv). If Ground then what is the source? 1. Hand Pump 2. Borehole 3. Motorized Pump
a.(v). If Surface, then what is the source? 1. Water Connec�on 2. Tap Stand 3. Directly Taken from Canal
a.(vi). Any other___________________________________________________________________________
b. Electricity 1. Yes 2. No
c. Condi�on of Boundary-wall1. Sa�sfactory 2. Needs Repair 3. Dangerous 4. No Boundary Wall
d.(i). Toilet facility 1. Yes 2. No
d.(ii). If Yes then No. of Func�onal Toilets & Non-Func�onal Toilets
No: of Func�onal Toilets________________, No. of Non Func�onal Toilets________________
e. Availability of proper lock system for Toilet Doors 1. Yes 2. No
f. Are the Students able to lock the door from inside? 1. Yes 2. No
g. In case if school has both boys and girls enrolment than No. of Separate Toilets for Girls?
No: of Func�onal Toilets________________, No. of Non Func�onal Toilets________________
h.(i). Do the Toilets have easy access for physically challenged persons (including blind). 1. Yes 2. No
h.(ii) If Yes, please write the details __________________________________________________________
i.(i). Is it clean or not? 1. Yes 2. No
Sec�on C - Basic & Advance Facili�es

PGS 2019 QUESTIONNAIRES
93
Indicator Code
i.(ii). Not clean inside the Latrine/on walls/on floor 1. Yes 2. No
j. Who is responsible for Cleaning the Toilets?1. Children 2. School Staff (Peon / Sweeper)
k.(i). Hand Wash Facility 1. Yes 2. No
k.(ii). Availability of Soap at Hand Wash Facility 1. Yes 2. No
l.(i). MHM Facility (In Case of post-primary Girls Schools) 1. Yes 2. No
l.(ii) Disposal for Sanitary Pad/Napkin 1. Disposed to Open Area2. Thrown into dustbins
26a. Which of the lab facility is available in the School?
Indicator Code
a. Computer Lab 1. Available & func�onal 2. Available but not func�onal 3. Not Available
b. Science Lab 1. Available & func�onal 2. Available but not func�onal 3. Not Available
c. Chemistry Lab 1. Available & func�onal 2. Available but not func�onal 3. Not Available
d. Physics Lab 1. Available & func�onal 2. Available but not func�onal 3. Not Available
e. Biology Lab 1. Available & func�onal 2. Available but not func�onal 3. Not Available
f. Home Economics Lab1. Available & func�onal 2. Available but not func�onal 3. Not Available
26b. Which of the following facili�es are available in the School? Indicator Code
a. Medical / First Aid Box1. Available & func�onal 2. Available but not func�onal 3. Not Available
b. Playground 1. Available & func�onal 2. Available but not func�onal 3. Not Available
c. Library 1. Available & func�onal 2. Available but not func�onal 3. Not Available
d. Sports Equipments1. Available & func�onal 2. Available but not func�onal 3. Not Available
e. Tree / Planta�on Area1. Available & func�onal 2. Available but not func�onal 3. Not Available
f. Solar System1. Available & func�onal 2. Available but not func�onal 3. Not Available

PGS 2019 QUESTIONNAIRES
94
27. Write Total No. of following facili�es available in SchoolItems Total Working Repairable
a. Blackboard(s)
b. White board(s)
c. Smart board(s)
d. So� board(s)
e. Student Chair(s) / Single desk(s)
f. Two-seater student desk(s)
g. Three-seater student desk(s)
h. Student Bench(es)
i. Teacher Chair(s)
j. Teacher Table(s)
k. Electric Fan(s)
l. Solar Fan(s)
m. Solar / Electric (Bulbs / Tube- lights)
n. Almirah(s)
o. Computer(s) (In Office + in Labs)
p. Water Pump (Electric Motor)
q. Chart(s)
28. Enrollment Status at the �me of visit
28a. Source of enrollment (Tick Any one)
1. General Register 2. A�endance Register
3. Other Record available at School, Specify
4. No formal record
28b. Medium [Mul� Tick Allowed] & medium wise enrollment
Urdu Medium Sindhi Medium English Medium
Enrolment Enrolment Enrolment
Sec�on D - Enrollment

PGS 2019 QUESTIONNAIRES
95
28c. Elementary Enrollment
Class Boys Girls Total
Katchi / ECE
I
II
III
IV
V
VI
VII
VIII
Total
28d. Secondary Enrollment
Class Group Boys Girls Total
IX
Arts / General
Science Computer
Biology
Commerce
Other
X
Arts / General
Science Computer
Biology
Commerce
Other
Total

PGS 2019 QUESTIONNAIRES
96
28e. Higher Secondary Enrollment Class Group Boys Girls Total
XI
Arts / General
Science
Computer
Pre- Med:
Pre-Eng:
Commerce
Other
XII
Arts / General
Science
Computer
Pre- Med:
Pre-Eng:
Commerce
Other
Total
29. Repeaters
Class Boys Girls Total
IV
V
VI
VII
VIII
IX
X
XI
XII
Total

PGS 2019 QUESTIONNAIRES
97
30a. During the last 06 months please men�on on which day and month a�endance register shows maximum student are/were present in the school.
(i) Day_________ Month____________________Year______________
(ii) Number of maximum students Present ________________________
30b. On the day of visit Headcount of students:________________________
30c. Permanent Absent
Class Boys Girls Total
I
II
III
IV
V
VI
VII
VIII
IX
X
XI
XII
Total

PGS 2019 QUESTIONNAIRES
98
Indicator Code
31a. Is this school has approved Scheduled of New Expenditure (SNE) 1. Yes 2. No (Note: if informa�on is not available at school then this column will be filled by concerned TEO)
31b. If Yes then fill the following.
SNE Staff Sanc�oned Filled (Gov’t Employees only) Vacant
Teaching
Non-Teaching
32. Total No. of working Teaching staff
Government Teacher(s) Non-Government Teacher(s)
Total Teachers
Male Female Male Female
Note: For Details of Working Teaching Staff Please Fill Section F
33. Total No. of Non-teaching staff
Male Female Total
Sec�on E – Teaching and Non-Teaching Informa�on

PGS 2019 QUESTIONNAIRES
99
34a. Scho
ol Na
me _
____
____
____
____
____
____
____
____
__, 3
4b. S
EMIS Co
de__
____
____
____
____
____
___, 34
c.Write T
otal
No. o
f Tea
ching
Staff
____
____
____
_, [P
lease
note: C
odes
detail a
re ov
erlea
f]
34d.
Teac
hers
Detail:
S. No.
Full N
ame a
nd CN
IC Nu
mbe
r
Gend
er
Perso
nal
Numbe
r fro
m AG
offi
ce
Date
of Bi
rth
Desig
. Co
de
BPS
BPS
BPS
Date
of En
try in
th
is Go
vern
men
t Service
Co
de fo
r typ
e of
post
Highest Academic Qualifica�on Code
Subject Specializa�on Code
Professional Qualifica�on / Training Code
On Detailment
Visit Day A�endance
Has Biometric Captured
Cont
act n
o:
1=Male 2=Female
DD
MM
YY
(at th
e �m
e of
appo
int-
tmen
t)
(Tim
e Scale
) (C
urre
nt
Scale
) DD
M
M
YY
1=Yes 2=No
1=Presen
t 2=
Abse
nt
3=Leave
1=Ye
s 2=
No
1 2
3 4
5 6
7a
7b
7c
8 9
10
11
12
13
14
15
16
Note: T
his sh
eet to b
e fille
d for
TEAC
HING
STAF
F, for D
etails o
f Cod
e See
Code
List ov
erlea
f, Do n
ot in
clude
staff
who
are g
one t
o other
scho
ol/offi
ces on
detailm
ent.
Do no
t write B
PS fo
r Non
-Gov
t Staff(s).
Sec�
on F
- Workin
g Tea
ching
Staff
Detail

PGS 2019 QUESTIONNAIRES
100
Code
s and
instr
uc�o
ns fo
r fillin
g 34d
. "Wo
rking
Teachin
g Staff
" Ins
truc�
ons s
heet
for co
ding s
chem
e Co
de fo
r high
est level o
f qua
lifica�
on (C
olumn
10)
Desig
na�o
n Cod
e (Co
lumn 6
) Su
bject
Spec
ializa
�on (
Colum
n 11)
Write
Scho
ol Na
me a
nd SE
MIS C
ode
Quali
fica�
on
Code
s Qu
alifica�
onCo
des
Desig
na�o
nCo
des
Subje
ct: Ge
neral
& Co
mmerc
e Grou
p Co
des
Colum
n #
Instru
c�on
s Do
ctorat
eMa
tric
PST
1Arab
ic 20
1
Colum
n 2:
Write
clearl
y Full
Name
of st
aff m
embe
rs wi
th the
ir CNIC
Nu
mbers
, If CN
IC is n
ot avail
able
then w
rite ol
d NIC
and
indica
te wi
th a "
X" in
the S
# Colu
mn. (C
olumn
1).
Ph.D
101
Matri
c (Ar
ts)
501
JST
2 Au
di�ng
20
2 M.
Phil
102
Matri
c (Sci
ence
) 50
2 HS
T 3
Busin
ess Ad
minis
tra�o
n 20
3 Po
st Gr
adua
te Ma
tric(C
omme
rce)
503
SS
4 Bu
siness
Comm
unica
�on
204
Colum
n 3:
Write
1 for
male
, 2 fo
r fema
le MA
201
Matri
c (Te
chnic
al)50
4PT
I5
Educa�
on
205
Colum
n 4:
Write
Perso
nnel Nu
mber
from
Acco
untan
t Gen
eral (A
G) offi
ce
M.Sc
202
Unde
r Matr
ic WI
T 6
Econ
omics
20
6 M.
Com
203
Midd
le 60
1 HM
7
English
20
7 Co
lumn 5
: Wr
ite da
te of
birth
in dd
/mm/
yy for
mat.
MCS
204
Prima
ry Level C
er�f.
602
DT8
Gene
ral Hi
story
208
Colum
n 6:
Write
a de
signa
�on c
ode f
rom th
e give
n list
MS20
5 Ot
her
603
Othe
r9
Geog
raphy
20
9
Colum
n 7a:
Write
Basic
Pay S
cale (
BPS)
at the
appo
intme
nt e.g
. 9, 1
2 etc
MBA
206
Code
s for
Profes
siona
l Trai
ning
(Colum
n 12)
Non-G
ov’t
10Ge
ology
21
0 Ot
her
207
Subje
ct Sp
ecializa
�on
(Colum
n 11)
Civics
21
1 Co
lumn 7
b: Wr
ite Ba
sic Pa
y Scal
e (BP
S) Tim
e Scale
e.g. 1
4, 16
etc
Grad
uate
ECE
1 Fin
ance
21
2 Co
lumn 7
c: Wr
ite Ba
sic Pa
y Scal
e (BP
S) Cu
rrent
Scale
e.g. 1
6, 17
etc
B.A
301
ADE
2 Sci
ence
Grou
p I
Healt
h & Ph
ysical
Educ
a�on
21
3 Co
lumn 8
: Wr
ite th
e Date
on w
hich fi
rst go
vernm
ent jo
b was
joine
d B.S
c 30
2 PT
C3
Subje
ct Co
de
Home
Econ
omics
21
4 Co
lumn 9
: Wr
ite th
e cod
e of ty
pe of
post fro
m the
table
B.C
om
303
CT4
Biolog
y 10
1 Isla
mic H
istory
21
5
Colum
n 10:
Write
High
est level o
f qua
lifica�
on co
des from
the t
able
given
BC
S 30
4 B.E
d5
Bio Ch
emistry
102
Intern
a�on
al Re
la�on
s 21
6 BB
A 30
5 M.
Ed6
Botan
y 10
3 Lib
rary S
cienc
e 21
7
Colum
n 11:
Write
the c
ode o
f from
Subje
ct Sp
ecializa
�on C
ode t
he ta
ble
LLB
306
Othe
r7
Chem
istry
104
Mass
Comm
unica
�on
218
B.E
307
Untra
ined
8 Ge
ne�c
s 10
5 Ph
ilosoph
y 21
9
Colum
n 12:
Write
high
est Pr
ofessi
onal Tra
ining
Code
s from
the t
able
given
B.T
ech
308
Type
of Po
st
(Colum
n 9)
Mathe
ma�c
s 10
6 Psych
ology
22
0 Ot
her
309
Micro
Biolo
gy
107
Publi
c Adm
inistr
a�on
22
1
Colum
n 13:
Write
1=Ye
s if te
acher
is pos
ted an
other
schoo
l and
work
ing on
De
tailm
ent in
this s
choo
l, othe
rwise
writ
e 2=N
o Un
der G
radua
te Go
vernm
ent R
egula
r1
Zoolo
gy
108
Sindh
i 22
2 Int
er (Ar
ts)
401
Governm
ent C
ontra
ct2
Physi
cs 10
9 So
ciolog
y 22
3
Colum
n 14:
Head
coun
t on t
he da
y of v
isit an
d men
�on t
he a�
enda
nce
Inter
(Scien
ce)
402
SMC
3 Co
mpute
r Sci
ence
11
0 So
cial W
ork
224
Inter
(Comm
erce)
403
UNICE
F4
Sta�s�c
s 22
5
Colum
n 15:
Write
1=Ye
s if biom
etric c
aptur
ed, o
therw
ise m
en�o
n 2=N
o Ot
her D
onor
5 Sp
ecial
Educ
a�on
22
6 DA
E 40
4 Vo
luntee
r6
Urdu
22
7 Co
lumn 1
6: Wr
ite pe
rsona
l cellu
lar/m
obile
phon
e con
tact n
umbe
r(s)
Othe
r 40
5 Go
vt. lo
cal Bo
dies
7 Ot
hers
228
Code
s and
instr
uc�o
ns fo
r fillin
g 34d
. "Wo
rking
Teachin
g Staff
" Ins
truc�
ons s
heet
for co
ding s
chem
e Co
de fo
r high
est level o
f qua
lifica�
on (C
olumn
10)
Desig
na�o
n Cod
e (Co
lumn 6
) Su
bject
Spec
ializa
�on (
Colum
n 11)
Write
Scho
ol Na
me a
nd SE
MIS C
ode
Quali
fica�
on
Code
s Qu
alifica�
onCo
des
Desig
na�o
nCo
des
Subje
ct: Ge
neral
& Co
mmerc
e Grou
p Co
des
Colum
n #
Instru
c�on
s Do
ctorat
eMa
tric
PST
1Arab
ic 20
1
Colum
n 2:
Write
clearl
y Full
Name
of st
aff m
embe
rs wi
th the
ir CNIC
Nu
mbers
, If CN
IC is n
ot avail
able
then w
rite ol
d NIC
and
indica
te wi
th a "
X" in
the S
# Colu
mn. (C
olumn
1).
Ph.D
101
Matri
c (Ar
ts)
501
JST
2 Au
di�ng
20
2 M.
Phil
102
Matri
c (Sci
ence
) 50
2 HS
T 3
Busin
ess Ad
minis
tra�o
n 20
3 Po
st Gr
adua
te Ma
tric(C
omme
rce)
503
SS
4 Bu
siness
Comm
unica
�on
204
Colum
n 3:
Write
1 for
male
, 2 fo
r fema
le MA
201
Matri
c (Te
chnic
al)50
4PT
I5
Educa�
on
205
Colum
n 4:
Write
Perso
nnel Nu
mber
from
Acco
untan
t Gen
eral (A
G) offi
ce
M.Sc
202
Unde
r Matr
ic WI
T 6
Econ
omics
20
6 M.
Com
203
Midd
le 60
1 HM
7
English
20
7 Co
lumn 5
: Wr
ite da
te of
birth
in dd
/mm/
yy for
mat.
MCS
204
Prima
ry Level C
er�f.
602
DT8
Gene
ral Hi
story
208
Colum
n 6:
Write
a de
signa
�on c
ode f
rom th
e give
n list
MS20
5 Ot
her
603
Othe
r9
Geog
raphy
20
9
Colum
n 7a:
Write
Basic
Pay S
cale (
BPS)
at the
appo
intme
nt e.g
. 9, 1
2 etc
MBA
206
Code
s for
Profes
siona
l Trai
ning
(Colum
n 12)
Non-G
ov’t
10Ge
ology
21
0 Ot
her
207
Subje
ct Sp
ecializa
�on
(Colum
n 11)
Civics
21
1 Co
lumn 7
b: Wr
ite Ba
sic Pa
y Scal
e (BP
S) Tim
e Scale
e.g. 1
4, 16
etc
Grad
uate
ECE
1 Fin
ance
21
2 Co
lumn 7
c: Wr
ite Ba
sic Pa
y Scal
e (BP
S) Cu
rrent
Scale
e.g. 1
6, 17
etc
B.A
301
ADE
2 Sci
ence
Grou
p I
Healt
h & Ph
ysical
Educ
a�on
21
3 Co
lumn 8
: Wr
ite th
e Date
on w
hich fi
rst go
vernm
ent jo
b was
joine
d B.S
c 30
2 PT
C3
Subje
ct Co
de
Home
Econ
omics
21
4 Co
lumn 9
: Wr
ite th
e cod
e of ty
pe of
post fro
m the
table
B.C
om
303
CT4
Biolog
y 10
1 Isla
mic H
istory
21
5
Colum
n 10:
Write
High
est level o
f qua
lifica�
on co
des from
the t
able
given
BC
S 30
4 B.E
d5
Bio Ch
emistry
102
Intern
a�on
al Re
la�on
s 21
6 BB
A 30
5 M.
Ed6
Botan
y 10
3 Lib
rary S
cienc
e 21
7
Colum
n 11:
Write
the c
ode o
f from
Subje
ct Sp
ecializa
�on C
ode t
he ta
ble
LLB
306
Othe
r7
Chem
istry
104
Mass
Comm
unica
�on
218
B.E
307
Untra
ined
8 Ge
ne�c
s 10
5 Ph
ilosoph
y 21
9
Colum
n 12:
Write
high
est Pr
ofessi
onal Tra
ining
Code
s from
the t
able
given
B.T
ech
308
Type
of Po
st
(Colum
n 9)
Mathe
ma�c
s 10
6 Psych
ology
22
0 Ot
her
309
Micro
Biolo
gy
107
Publi
c Adm
inistr
a�on
22
1
Colum
n 13:
Write
1=Ye
s if te
acher
is pos
ted an
other
schoo
l and
work
ing on
De
tailm
ent in
this s
choo
l, othe
rwise
writ
e 2=N
o Un
der G
radua
te Go
vernm
ent R
egula
r1
Zoolo
gy
108
Sindh
i 22
2 Int
er (Ar
ts)
401
Governm
ent C
ontra
ct2
Physi
cs 10
9 So
ciolog
y 22
3
Colum
n 14:
Head
coun
t on t
he da
y of v
isit an
d men
�on t
he a�
enda
nce
Inter
(Scien
ce)
402
SMC
3 Co
mpute
r Sci
ence
11
0 So
cial W
ork
224
Inter
(Comm
erce)
403
UNICE
F4
Sta�s�c
s 22
5
Colum
n 15:
Write
1=Ye
s if biom
etric c
aptur
ed, o
therw
ise m
en�o
n 2=N
o Ot
her D
onor
5 Sp
ecial
Educ
a�on
22
6 DA
E 40
4 Vo
luntee
r6
Urdu
22
7 Co
lumn 1
6: Wr
ite pe
rsona
l cellu
lar/m
obile
phon
e con
tact n
umbe
r(s)
Othe
r 40
5 Go
vt. lo
cal Bo
dies
7 Ot
hers
228

PGS 2019 QUESTIONNAIRES
101
35a. Write the Cost Centre / DDO code of this school___________________________ 35b. Budget Detail (amount in Rs.)
(i) Alloca�on________________ (ii) Released________________ (iii) U�lized________________
36a. School Specific Budget (SSB) 2017-18 alloca�on Rs._________________________Indicator Code
b. Has this school u�lized School Specific Budget (SSB) in Year 2017-18? 1. Yes 2. No
c. if yes then men�on the total amount u�lized Rs.________________________________________________
d. If budget u�lized then fill head-wise detail of amount u�lized Rs.In Class Material
& Supplies Library /
Laboratory Co-Curricular Ac�vi�es Sports Traveling
Allowance Sta�onary Furniture
37. Girls' S�pend (This is only applicable to those schools where girls enrollment from class 6-10)
Indicator Code
a. Did this school received Girls' S�pend in last academic Year?1. Yes 2. No 3. Not Applicable;
b. if Yes then men�oned the following detail.
Class 6 to 10 Girls Enrolled Eligible Girls Received S�pend
38. School Management Commi�ee (SMC)
Indicator Code
a. Is SMC Func�onal? 1. Yes 2. No
b. Has this School got SMC Funds in 2017-18? 1. Yes 2. No
c. SMC Account Detail
SMC A/C Title
SMC A/C No.
Bank Name
Name of Branch and Branch code
.
d. Total SMC Funds Received Rs.________________________ e. U�lized Rs._________________________f. if u�lized then fill head-wise detail of amount u�lized Rs.
Minor Repair & Maintenance Cleanliness Transport fare for school girls or small children
.
Sec�on G – Funds & U�liza�on

PGS 2019 QUESTIONNAIRES
102
Indicator Code
39. Has SAT Conducted in school? 1. Yes 2. No
40. Does School have Mid-term Student Assessment Record? 1. Yes 2. No
41a. Has the school received Free Textbooks in last academic year? 1. Yes 2. No
41b. If Yes then were Textbooks delivered to all students with relevant medium? 1. Yes 2. No
42a. Canteen facility available for student? 1. Yes 2. No
42b. if yes, where canteen situated? 1. within school premises 2. Outside of School premises
43. Informa�on Providera. Name: b. CNIC:
c. Contact No. (Tele/Mob): d. Email-Address:
Indicator Code
e. Designa�on 1. Principal /HM 2. In-charge 3. Teacher 4. Other___________
f. Gender 1. Male 2. Female
Data Collector Head of the school / Data provider (if Head of the school is not available /not posted)
Signature with stamp
Signature with stamp
Name Name
CNIC No. CNIC No.
Designa�on 1=IBA-HM; 2=MA; 3=Other Contact No.
Contact No. Date (DD/MM/YYYY)
Taluka Educa�on Officer (TEO) / District Educa�on Officer (DEO) Office Address: Reform, Support Unit, School
Educa�on & Literacy Department, Government of Sindh, 47-E/1 - 48th Street,Block-6, PECHS, Nursery, Shahrah-e-Faisal, Karachi
Note: In case you want to share more informa�on or clarify given informa�on then please contact to Sindh -EMIS Office, Reform Support Unit; Contacts:021-34320241-5
Signature with stamp
Name
CNIC No.
Contact No.
Date (DD/MM/YYYY)
Sec�on H – Miscellaneous

PGS 2019 QUESTIONNAIRES
103
44a. Scho
ol Na
me _
____
____
____
____
____
____
____
____
____
____
____
____
, 44
b. SE
MIS
Code
____
____
____
____
____
___,
44c:
Campu
s / Cl
uste
r Schoo
ls de
tail:
S. # Scho
ol Na
me &
Prefi
x SE
MIS
ID
Type of School
Type of Merging
Status of School
School Building
Shi�
Level
Medium
Gender
DDO
/ Co
st Ce
nter
Total N
o. of
Te
achin
g Staff
Total N
o. of
No
n-Te
achin
g Staff
Stud
ent E
nroll
men
t
Total No. Rooms
Number of Classrooms
Basic
Facili�e
s EC
E / K
achi
1-12
Clas
ses
Male
Female
Male
Female
Boys
Girls
Bo
ys
Girls
Condi�on of Boundary
Wall
Washrooms
Drinking Water
Electricity
1 2
3 4
5 6
7 8
9 10
11
12
13
14
15
16
17
18
19
20
21
INST
RUCT
IONS
FOR T
HE CO
DING
SCHE
ME
Write M
ain Sc
hool
Nam
e and
New
SEM
IS in
the s
paces P
rovid
edab
ove
Colum
n 8: W
rite 1
for M
ornin
g, 2 f
or A�e
rnoo
n, 3 for B
oth S
hi�s
Colum
n 13:
Writ
e total
num
ber o
f Non
-teac
hing s
taff
gend
er w
ise (M
ale
& Fe
male
) Co
lumn 1
: Writ
e Seq
uen�
al Seria
l num
ber
Colum
n 2: W
rite t
he na
me a
nd Pr
efixe
s of M
erge
d / Ca
mpu
s or C
luster /
Hub
Scho
ols
Colum
n 9: W
rite 1
for P
rimary,
2 for
Midd
le, 3 for E
lemen
tary, 4
for S
econ
dary
, 5 fo
r High
er Se
cond
ary a
nd 6 for P
rimar
y with
pe
rmiss
ion to
run n
ext l
evel
of cl
asse
s
Colum
n 15:
Writ
e Enroll
men
t of G
irls a
nd Bo
ys
Colum
n 16:
Writ
e total
num
ber o
f roo
ms
Colum
n 3: W
rite t
he SE
MIS
Code
for m
erge
d / Ca
mpu
s or C
luster/
Hub S
choo
lCo
lumn 1
7: Writ
e num
ber o
f clas
sroom
s Co
lumn 4
: Writ
e 1 fo
r CAM
PUS,
2 for
MER
GED,
3 for H
UB sc
hools
and 4
for C
LUST
ER
scho
ol Co
lumn 1
8: Writ
e 1 fo
r Sa�
sfacto
ry, 2
for N
eeds
Repa
ir, 3 for D
angero
us
and 4
for N
o Bou
ndar
y Wall
Co
lumn 1
0: Writ
e 1 fo
r Urd
u, 2 f
or Si
ndhi,
3 for E
nglis
h and
4 for
Mixe
d Med
ium Sc
hools
Co
lumn 5
: Writ
e 1 Sa
me P
rem
ises,
2 for
adjac
ent,
3 for
with
in 50
0 meter
s, 4 f
or >5
00
meters
Colum
n 19:
Writ
e 1 fo
r Yes
and 2
for N
o Co
lumn 1
1: Writ
e 1 fo
r Boy
s Schoo
l, 2 f
or G
irls S
choo
l and
3 for
Mixe
d/Co
-Educ
a�on
Scho
ol Co
lumn 2
0: Writ
e 1 fo
r Yes
and 2
for N
o Co
lumn 6
: Writ
e 1 fo
r Fun
c�on
al, 2 for T
empo
rary
Dys
func�o
nal, 3
for V
iable
Dysfu
nc�o
nal, 4
for P
erman
ent D
ysfunc�o
nal, 5
for N
on-V
iable
Colum
n 21:
Writ
e 1 fo
r Yes
and 2
for N
o Co
lumn 1
2: Writ
e DDO
Code
/ Co
st Ce
nter
for S
choo
lNo
te: S
EMIS code
s of M
erge
d Schoo
ls ha
ve be
en de
leted
as pe
r Scho
ol Co
nsoli
da�o
n poli
cy whil
e clus
ter schoo
ls SE
MIS code
are
remain
sam
e Co
lumn 7
: Writ
e 1 fo
r Gov
ernm
ent B
uildin
g, 2 for S
HARE
D wi
th O
ther
Gov
ernm
ent
Scho
ol Bu
ilding
, 3 fo
r REN
TED,
4=OT
HER B
uildin
g and
5=N
o Buil
ding
Colum
n 13:
Writ
e total
num
ber o
f Tea
ching
staff
gend
er w
ise
(Male
& Fe
male
)
Sec�
on I -
Prof
orm
a for
Campu
s / Cl
uster S
choo
ls