Online Index Recommendations for High-Dimensional Databases Using Query Workloads
Upload
khangminh22Category
view
0download
0
Argonne Leadership Computing Facility1
Profiling Deep Learning Workloads
Murali Emani,Data Science group, ALCF
Argonne Leadership Computing Facility1
Argonne Leadership Computing Facility2
Introduction
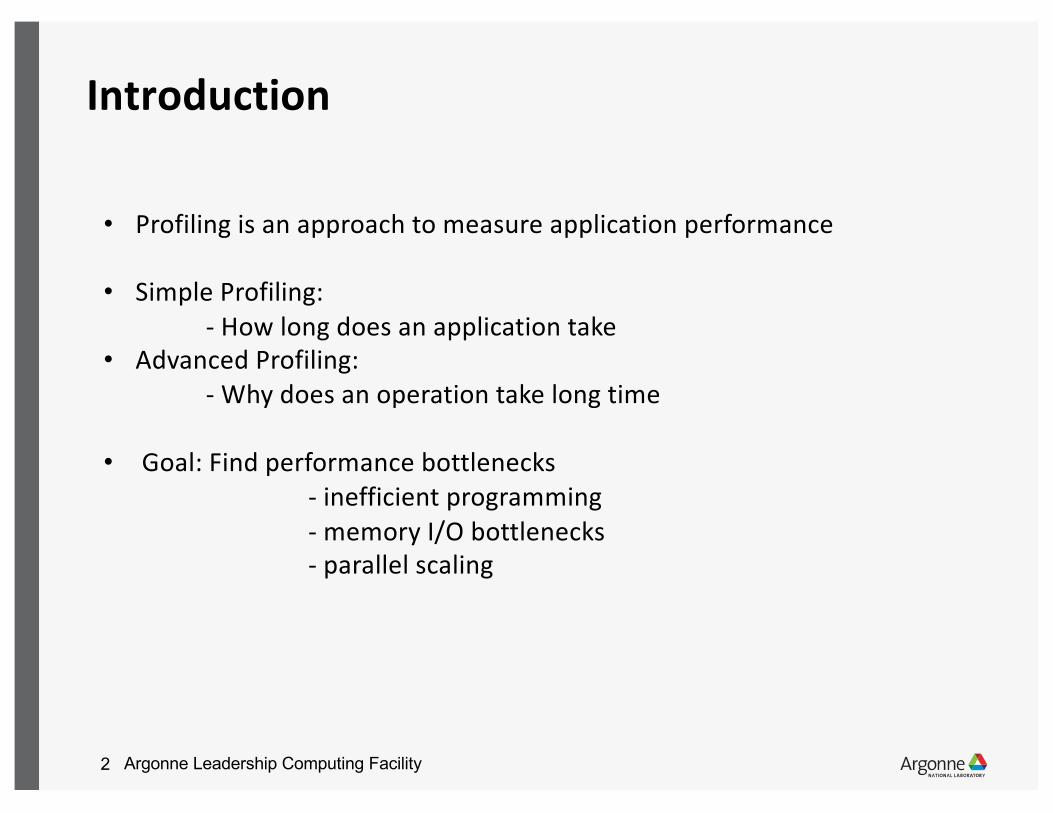
• Profiling is an approach to measure application performance
• Simple Profiling:- How long does an application take
• Advanced Profiling:- Why does an operation take long time
• Goal: Find performance bottlenecks- inefficient programming- memory I/O bottlenecks- parallel scaling
Argonne Leadership Computing Facility3
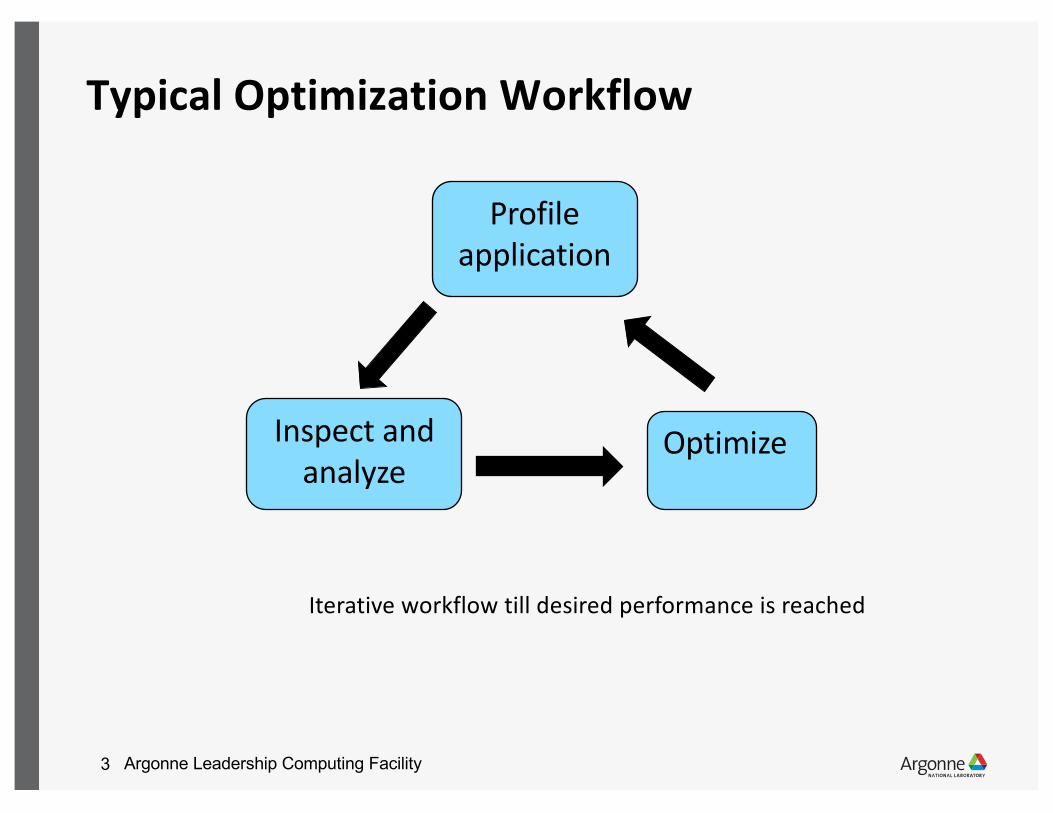
Typical Optimization Workflow
Profile application
Inspect and analyze
Optimize
Iterative workflow till desired performance is reached
Argonne Leadership Computing Facility4
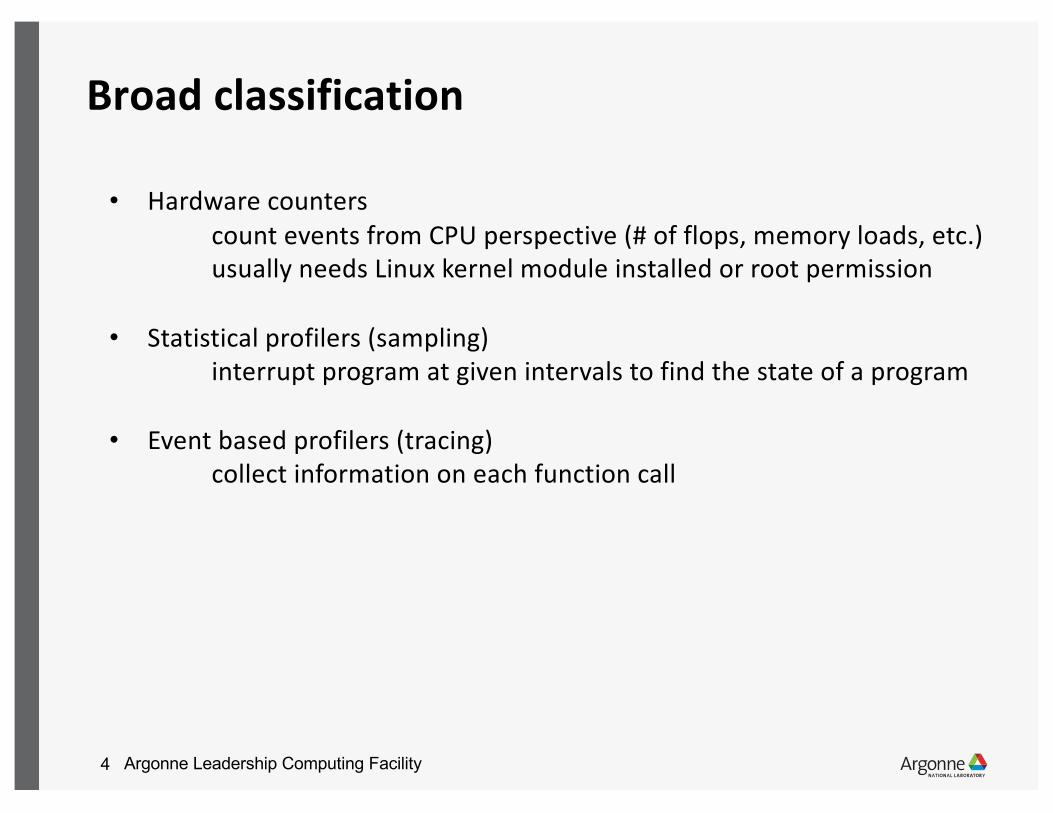
Broad classification
• Hardware counters count events from CPU perspective (# of flops, memory loads, etc.) usually needs Linux kernel module installed or root permission
• Statistical profilers (sampling) interrupt program at given intervals to find the state of a program
• Event based profilers (tracing)collect information on each function call
Argonne Leadership Computing Facility5
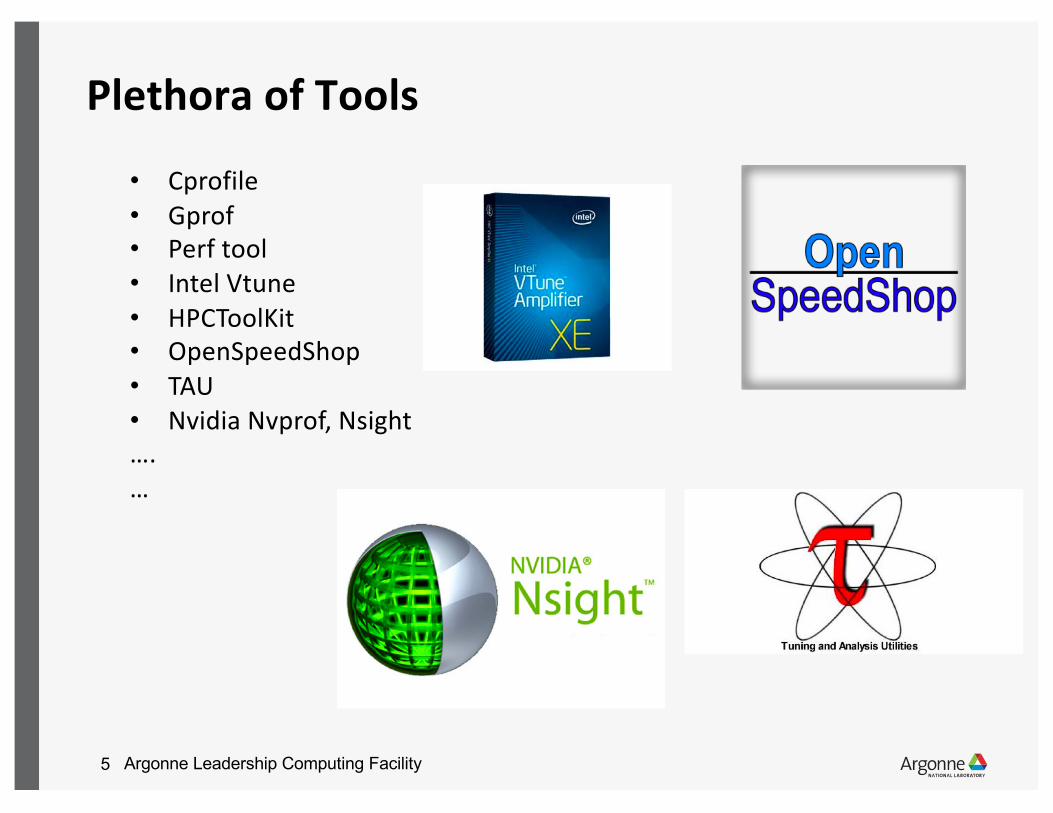
Plethora of Tools• Cprofile• Gprof• Perf tool• Intel Vtune• HPCToolKit• OpenSpeedShop• TAU• Nvidia Nvprof, Nsight….…
Argonne Leadership Computing Facility6
Profiling DNN workloads• Critical to understand workload performance
• Machine learning and deep learning models are implemented on a variety of hardware
• Most applications are written in Python using standard ML frameworks
• The frameworks generate kernels based on hardware and customized installation and libraries (MKL-DNN, CuDNN etc.)
Argonne Leadership Computing Facility7
Challenges
• Profiling is hard, cumbersome and time-consuming
• Profiling tools generate lot of data and hard to understand
• The problem is further compounded with large, complex models with large volumes of data
• Need strategies to use right tools and detailed insights to how to analyze the profile data
Argonne Leadership Computing Facility8
Profiling on Nvidia GPUs
Argonne Leadership Computing Facility9
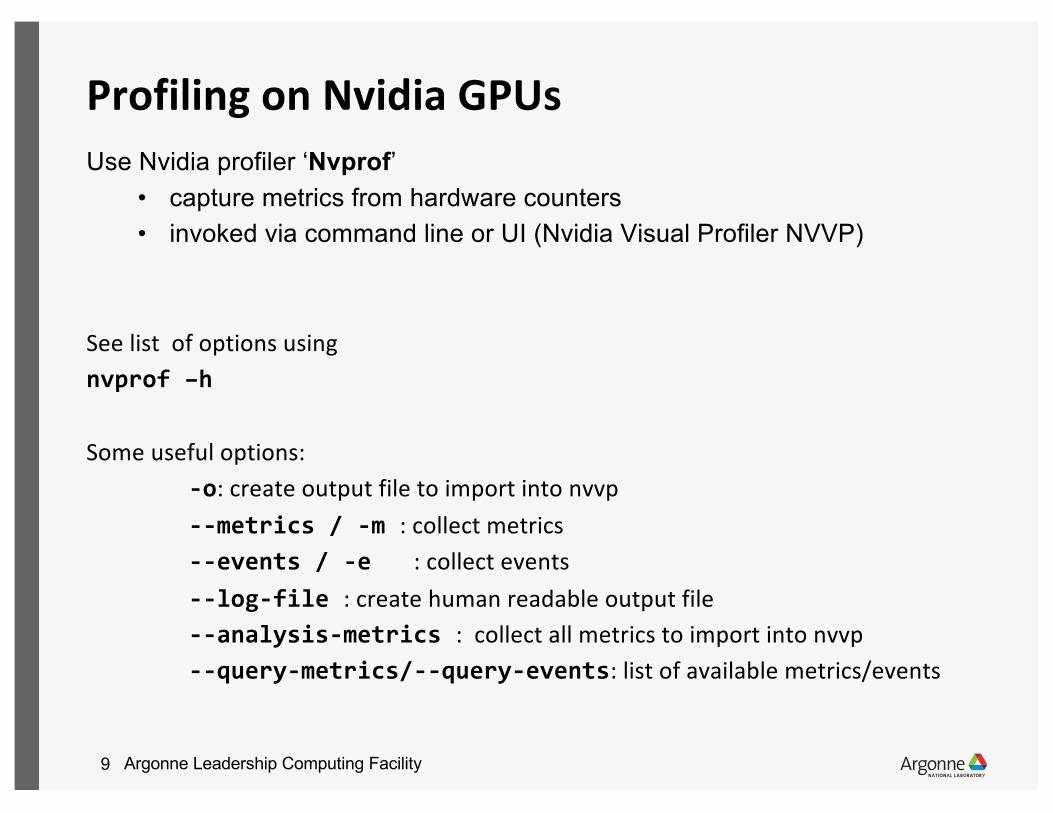
Profiling on Nvidia GPUsUse Nvidia profiler ‘Nvprof’
• capture metrics from hardware counters• invoked via command line or UI (Nvidia Visual Profiler NVVP)
See list of options usingnvprof –h
Some useful options:-o: create output file to import into nvvp--metrics / -m : collect metrics--events / -e : collect events--log-file : create human readable output file--analysis-metrics : collect all metrics to import into nvvp--query-metrics/--query-events: list of available metrics/events
Argonne Leadership Computing Facility10
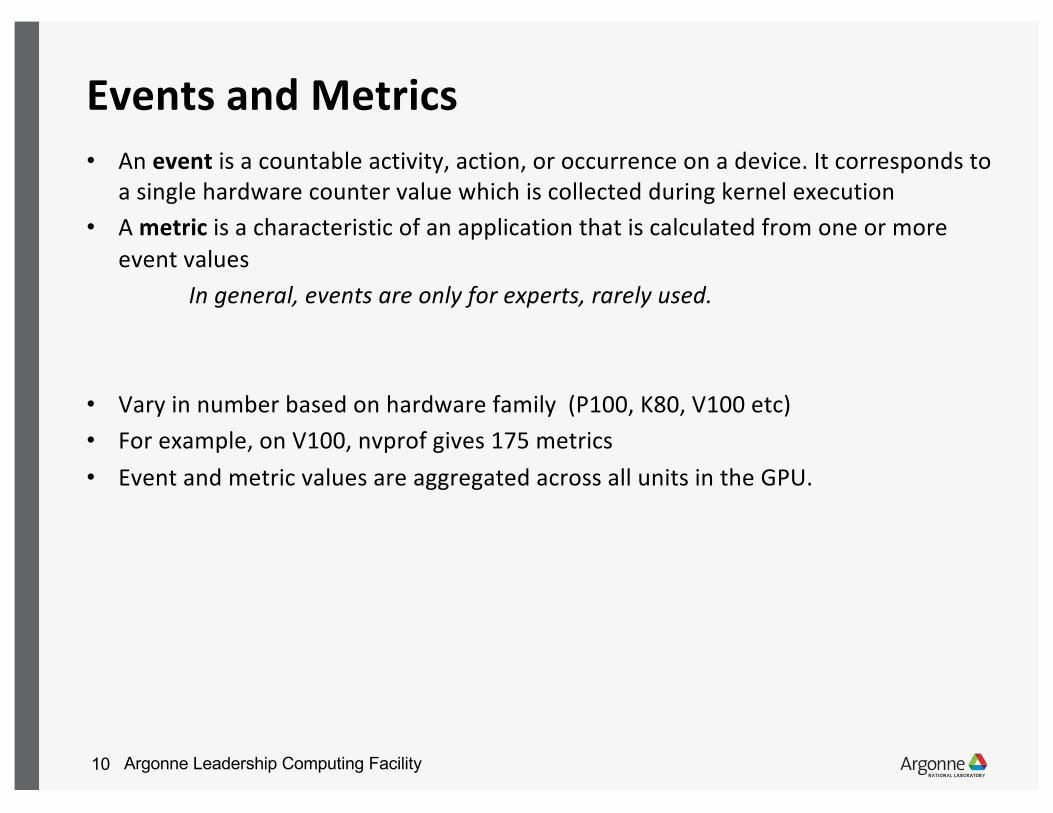
Events and Metrics• An event is a countable activity, action, or occurrence on a device. It corresponds to
a single hardware counter value which is collected during kernel execution• A metric is a characteristic of an application that is calculated from one or more
event valuesIn general, events are only for experts, rarely used.
• Vary in number based on hardware family (P100, K80, V100 etc)• For example, on V100, nvprof gives 175 metrics• Event and metric values are aggregated across all units in the GPU.
Argonne Leadership Computing Facility11
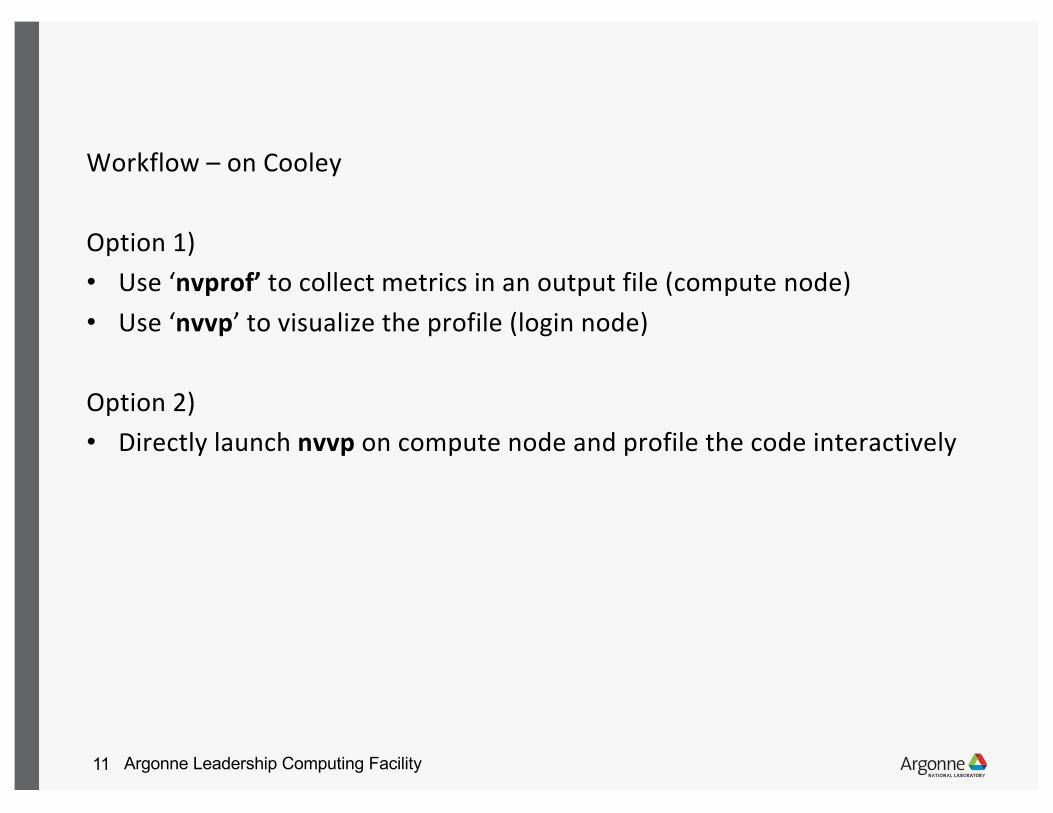
Workflow – on Cooley
Option 1)• Use ‘nvprof’ to collect metrics in an output file (compute node)• Use ‘nvvp’ to visualize the profile (login node)
Option 2)• Directly launch nvvp on compute node and profile the code interactively
Argonne Leadership Computing Facility12
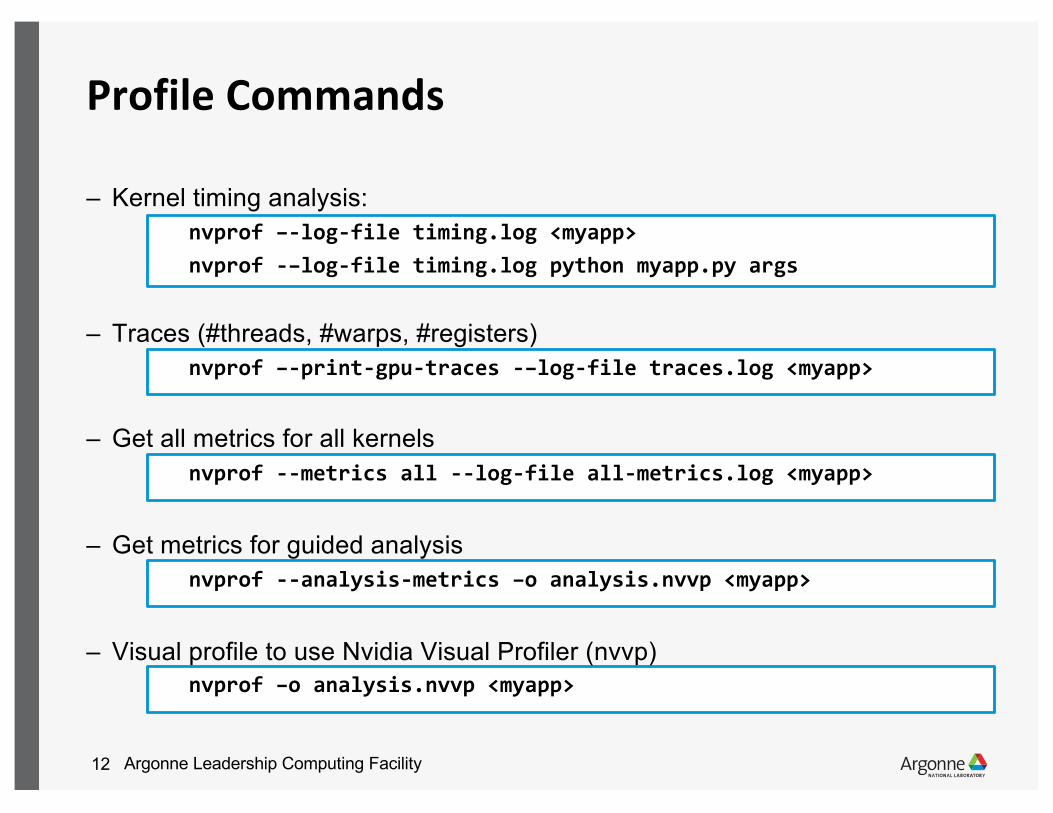
Profile Commands
– Kernel timing analysis: nvprof –-log-file timing.log <myapp>nvprof -–log-file timing.log python myapp.py args
– Traces (#threads, #warps, #registers)nvprof –-print-gpu-traces -–log-file traces.log <myapp>
– Get all metrics for all kernelsnvprof --metrics all --log-file all-metrics.log <myapp>
– Get metrics for guided analysisnvprof --analysis-metrics –o analysis.nvvp <myapp>
– Visual profile to use Nvidia Visual Profiler (nvvp)nvprof –o analysis.nvvp <myapp>
Argonne Leadership Computing Facility13
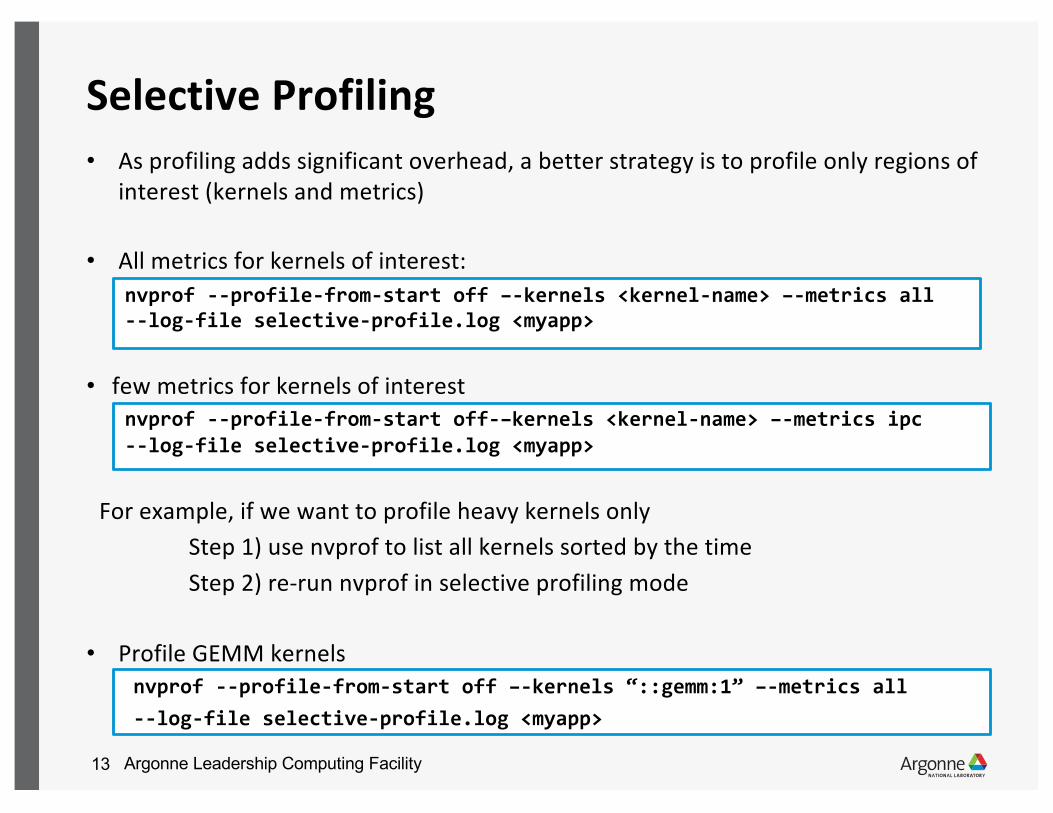
Selective Profiling• As profiling adds significant overhead, a better strategy is to profile only regions of
interest (kernels and metrics)
• All metrics for kernels of interest: nvprof --profile-from-start off –-kernels <kernel-name> –-metrics all --log-file selective-profile.log <myapp>
• few metrics for kernels of interestnvprof --profile-from-start off-–kernels <kernel-name> –-metrics ipc--log-file selective-profile.log <myapp>
For example, if we want to profile heavy kernels onlyStep 1) use nvprof to list all kernels sorted by the timeStep 2) re-run nvprof in selective profiling mode
• Profile GEMM kernelsnvprof --profile-from-start off –-kernels “::gemm:1” –-metrics all --log-file selective-profile.log <myapp>
Argonne Leadership Computing Facility14
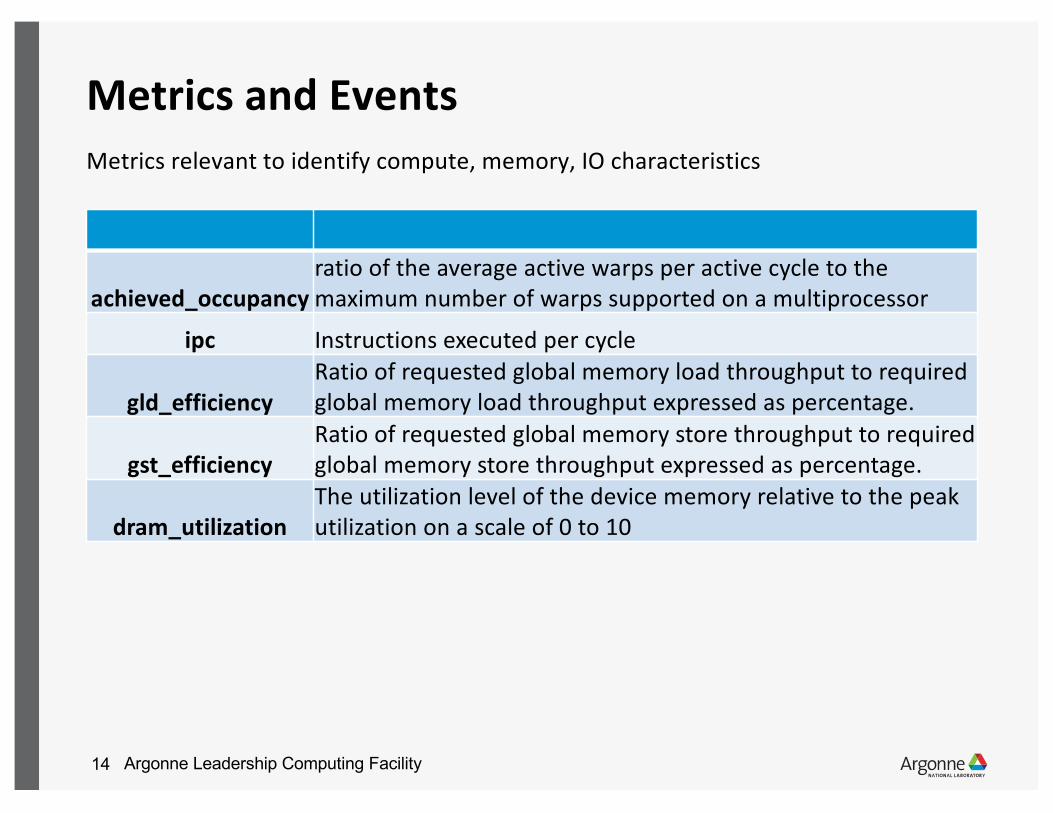
Metrics and EventsMetrics relevant to identify compute, memory, IO characteristics
achieved_occupancyratio of the average active warps per active cycle to the maximum number of warps supported on a multiprocessor
ipc Instructions executed per cycle
gld_efficiencyRatio of requested global memory load throughput to required global memory load throughput expressed as percentage.
gst_efficiencyRatio of requested global memory store throughput to required global memory store throughput expressed as percentage.
dram_utilizationThe utilization level of the device memory relative to the peak utilization on a scale of 0 to 10
Argonne Leadership Computing Facility15
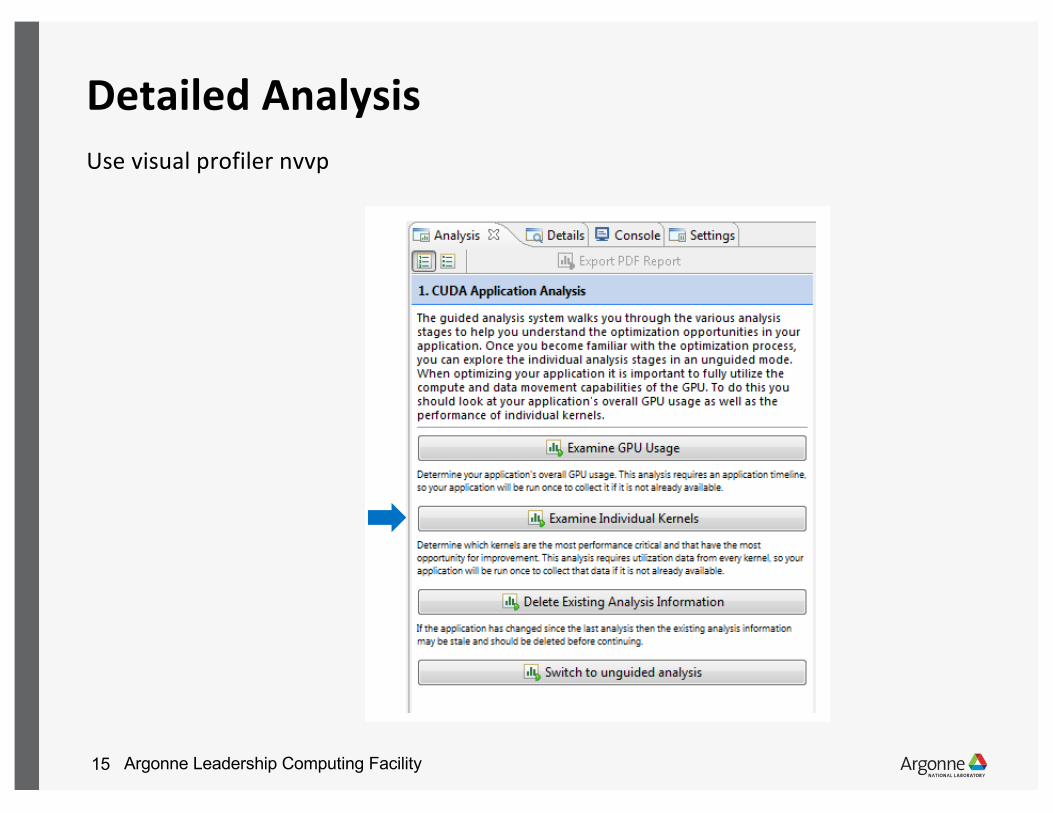
Detailed AnalysisUse visual profiler nvvp
40
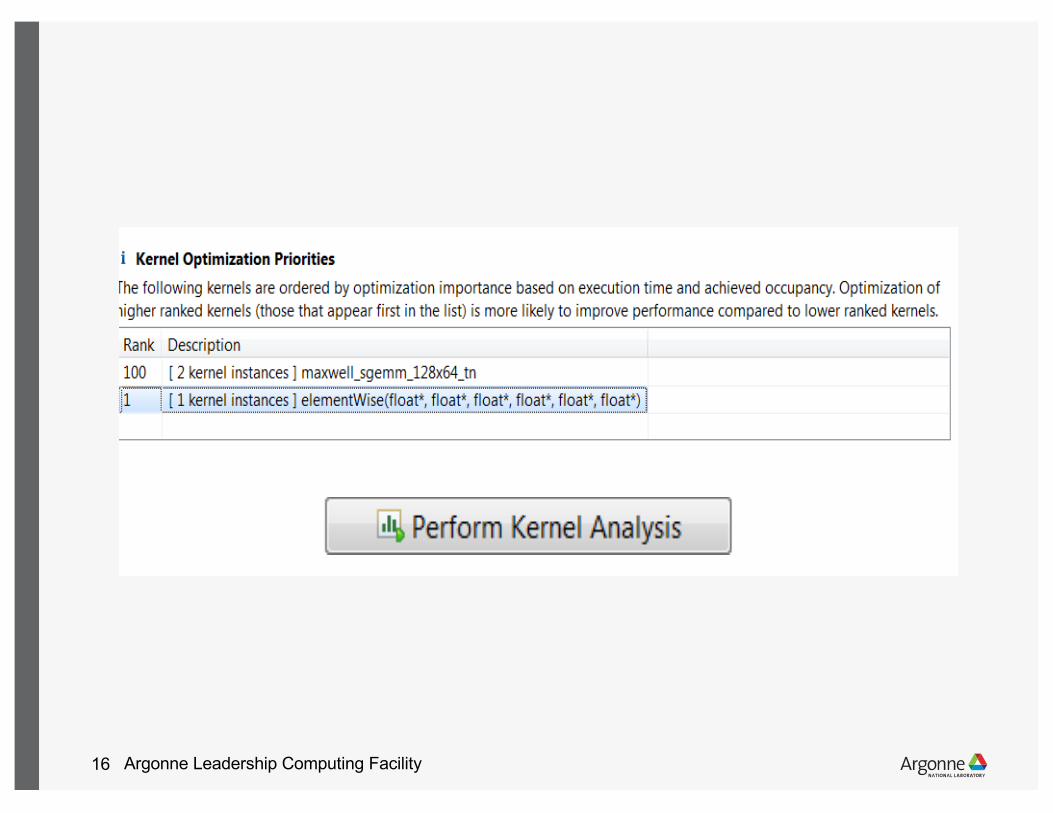
More details Deep dive into a kernel
• The profilers let us dig much deeper into individual kernels
• Moving from “it is going slow?” to “why is it going slow?”
• Let’s dive into the elementwise operation
• Requires interactive nvvp session, or output from --analysis-metrics
Argonne Leadership Computing Facility16
41
Argonne Leadership Computing Facility17
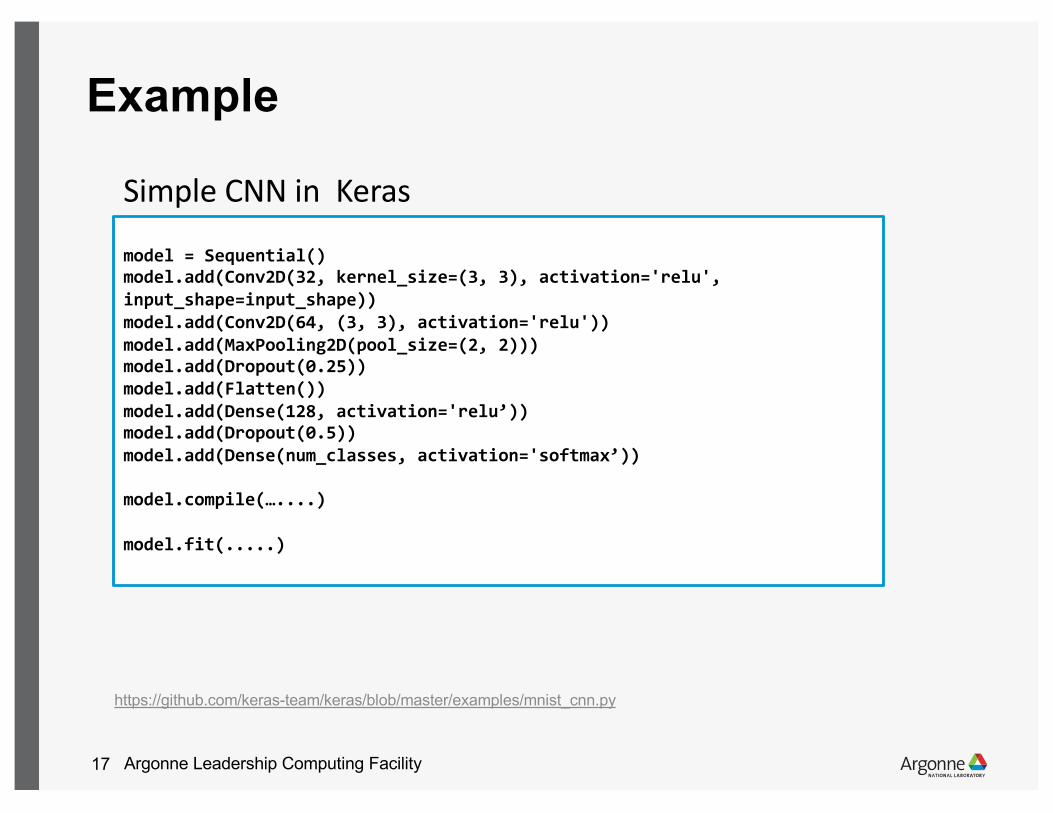
Example
model = Sequential()model.add(Conv2D(32, kernel_size=(3, 3), activation='relu', input_shape=input_shape)) model.add(Conv2D(64, (3, 3), activation='relu')) model.add(MaxPooling2D(pool_size=(2, 2))) model.add(Dropout(0.25)) model.add(Flatten()) model.add(Dense(128, activation='relu’)) model.add(Dropout(0.5))model.add(Dense(num_classes, activation='softmax’))
model.compile(…....)
model.fit(.....)
Simple CNN in Keras
https://github.com/keras-team/keras/blob/master/examples/mnist_cnn.py
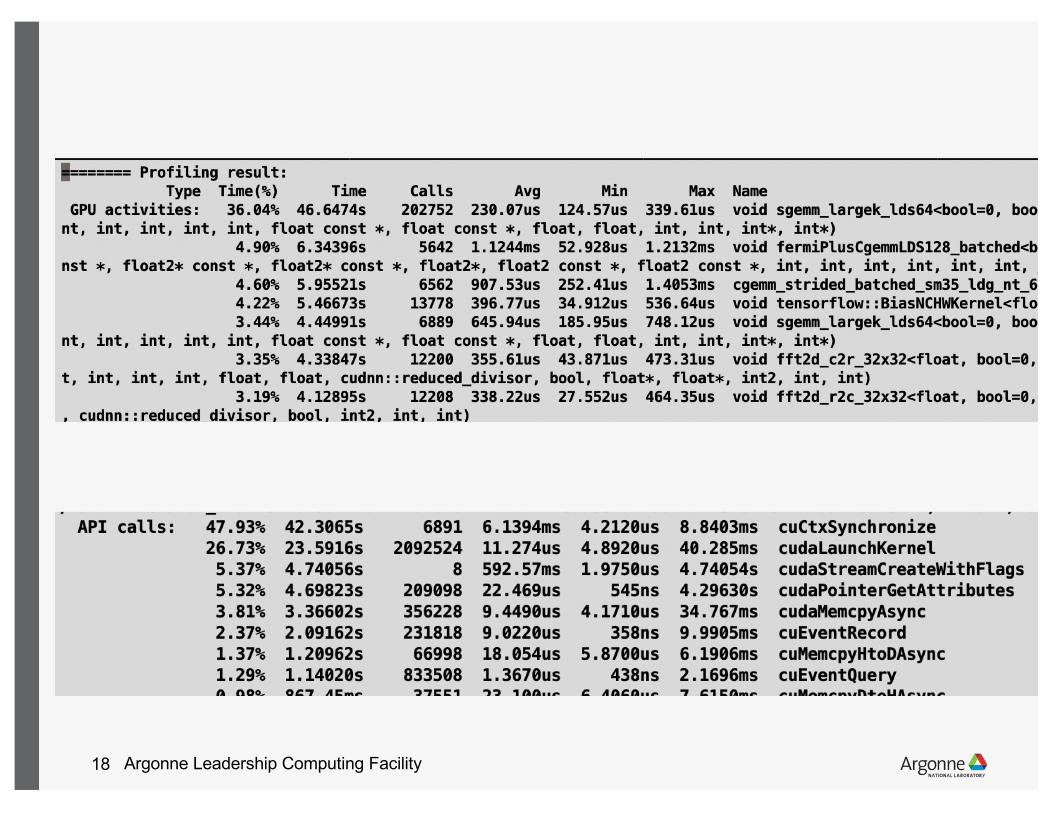
Argonne Leadership Computing Facility18
Argonne Leadership Computing Facility19
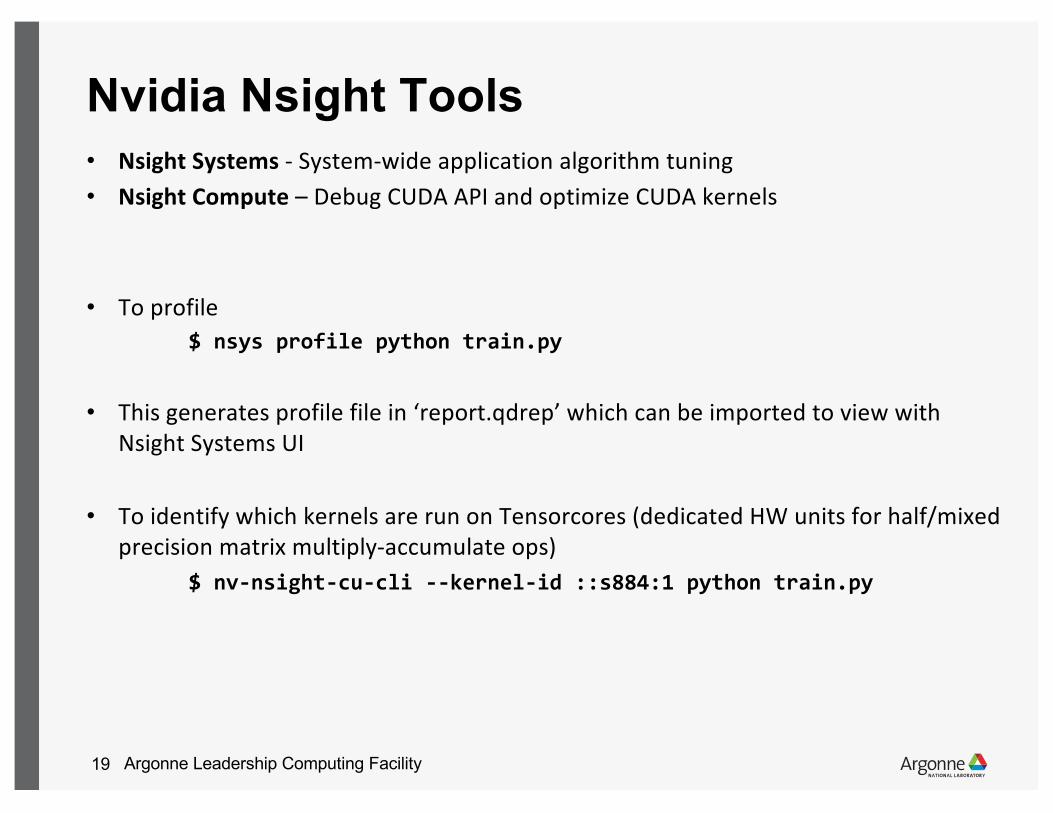
Nvidia Nsight Tools• Nsight Systems - System-wide application algorithm tuning • Nsight Compute – Debug CUDA API and optimize CUDA kernels
• To profile$ nsys profile python train.py
• This generates profile file in ‘report.qdrep’ which can be imported to view with Nsight Systems UI
• To identify which kernels are run on Tensorcores (dedicated HW units for half/mixed precision matrix multiply-accumulate ops)
$ nv-nsight-cu-cli --kernel-id ::s884:1 python train.py
Argonne Leadership Computing Facility20
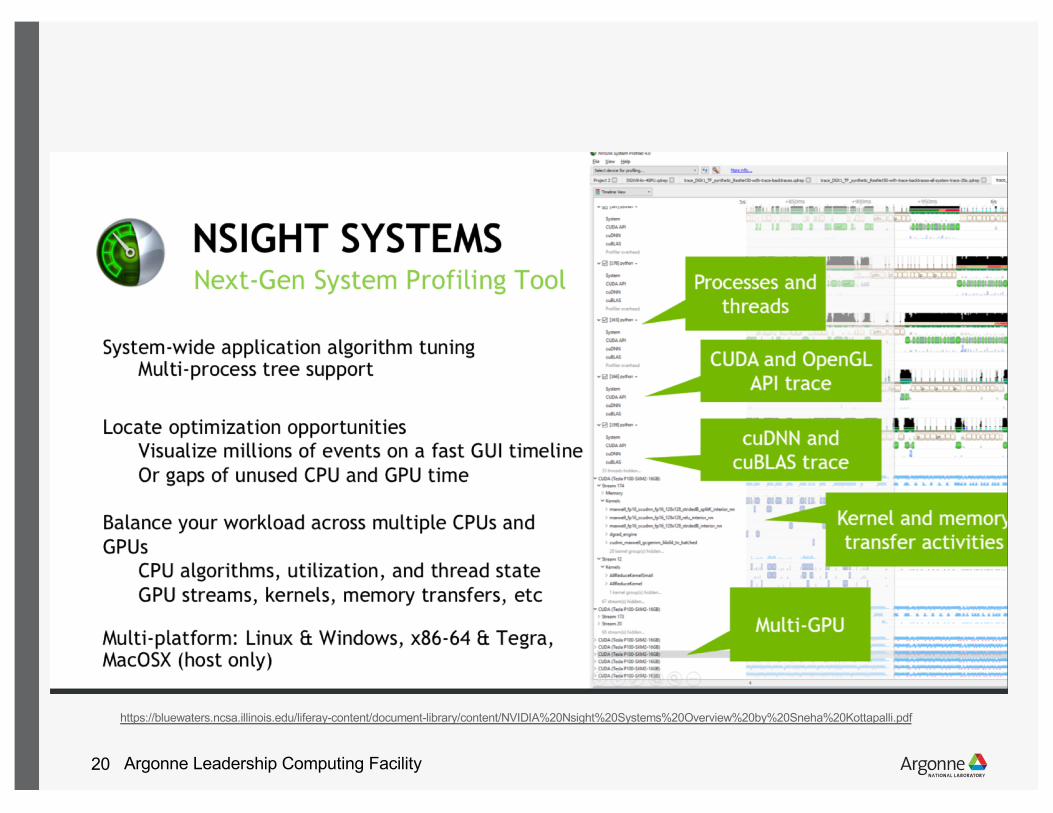
https://bluewaters.ncsa.illinois.edu/liferay-content/document-library/content/NVIDIA%20Nsight%20Systems%20Overview%20by%20Sneha%20Kottapalli.pdf
Argonne Leadership Computing Facility21
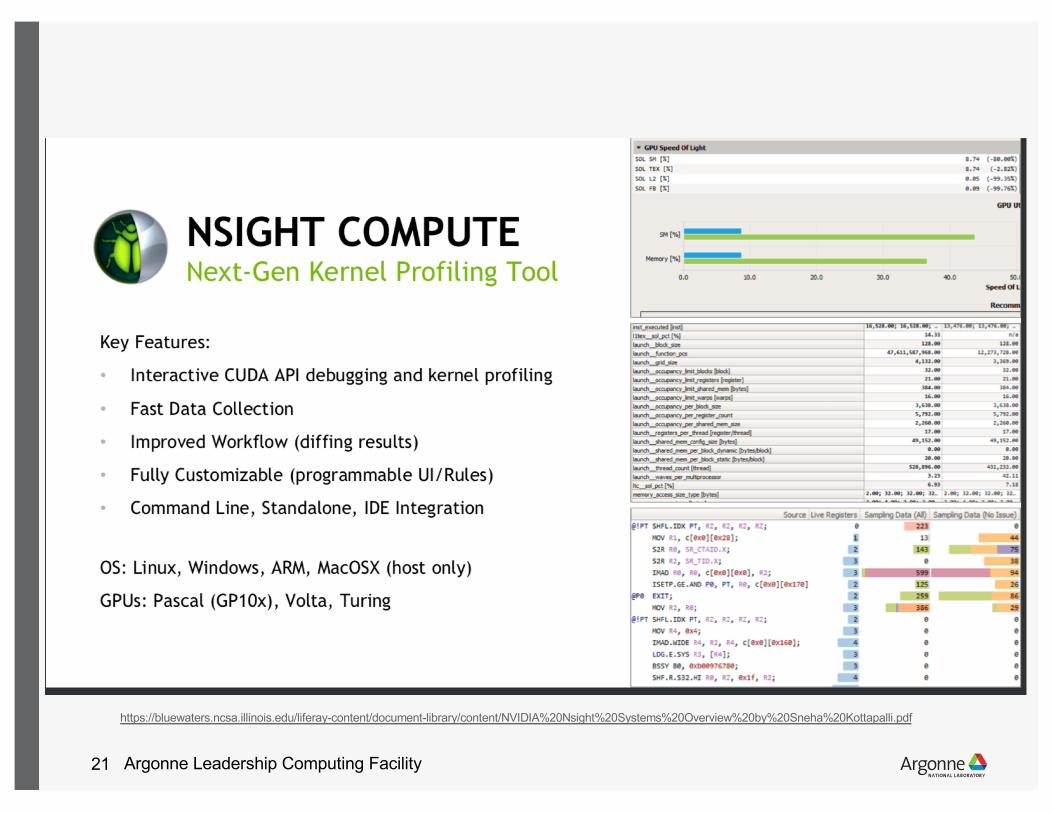
https://bluewaters.ncsa.illinois.edu/liferay-content/document-library/content/NVIDIA%20Nsight%20Systems%20Overview%20by%20Sneha%20Kottapalli.pdf
Argonne Leadership Computing Facility22
Profiling on CPUs using Intel Vtune
Argonne Leadership Computing Facility23
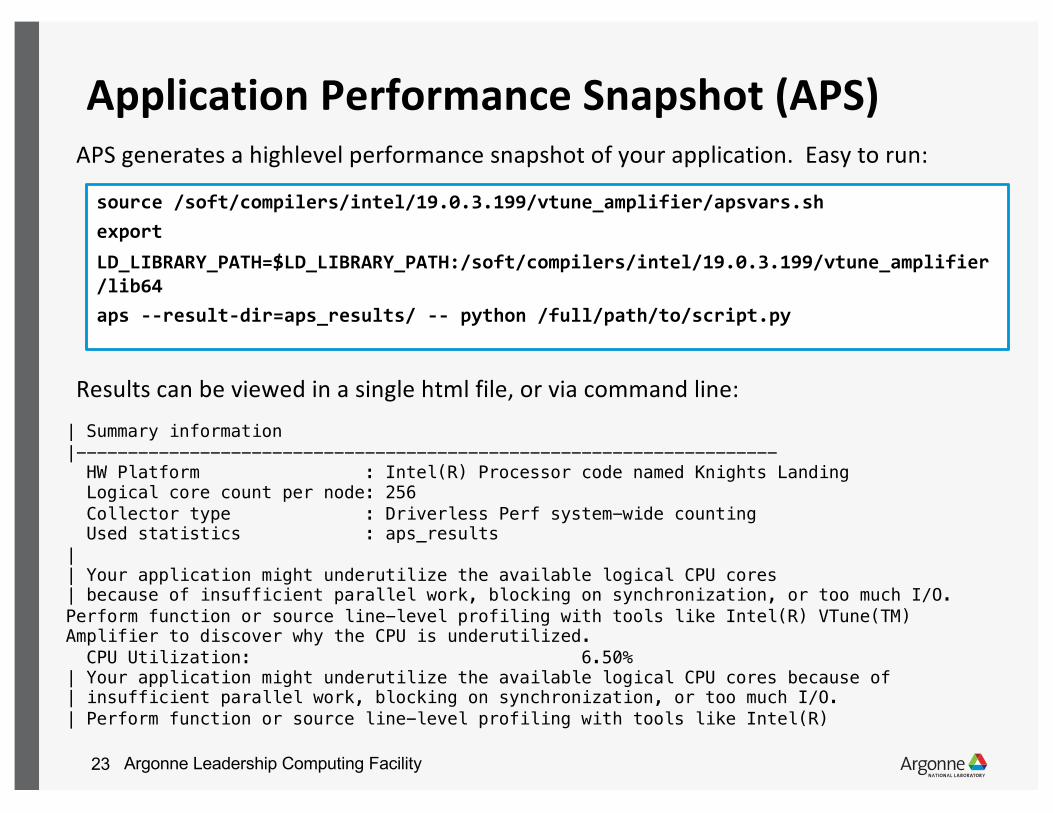
Application Performance Snapshot (APS)APS generates a highlevel performance snapshot of your application. Easy to run:
Results can be viewed in a single html file, or via command line:| Summary information|--------------------------------------------------------------------HW Platform : Intel(R) Processor code named Knights LandingLogical core count per node: 256Collector type : Driverless Perf system-wide countingUsed statistics : aps_results
|| Your application might underutilize the available logical CPU cores| because of insufficient parallel work, blocking on synchronization, or too much I/O. Perform function or source line-level profiling with tools like Intel(R) VTune(TM) Amplifier to discover why the CPU is underutilized.CPU Utilization: 6.50%
| Your application might underutilize the available logical CPU cores because of| insufficient parallel work, blocking on synchronization, or too much I/O.| Perform function or source line-level profiling with tools like Intel(R)
source /soft/compilers/intel/19.0.3.199/vtune_amplifier/apsvars.shexport LD_LIBRARY_PATH=$LD_LIBRARY_PATH:/soft/compilers/intel/19.0.3.199/vtune_amplifier/lib64aps --result-dir=aps_results/ -- python /full/path/to/script.py
Argonne Leadership Computing Facility24
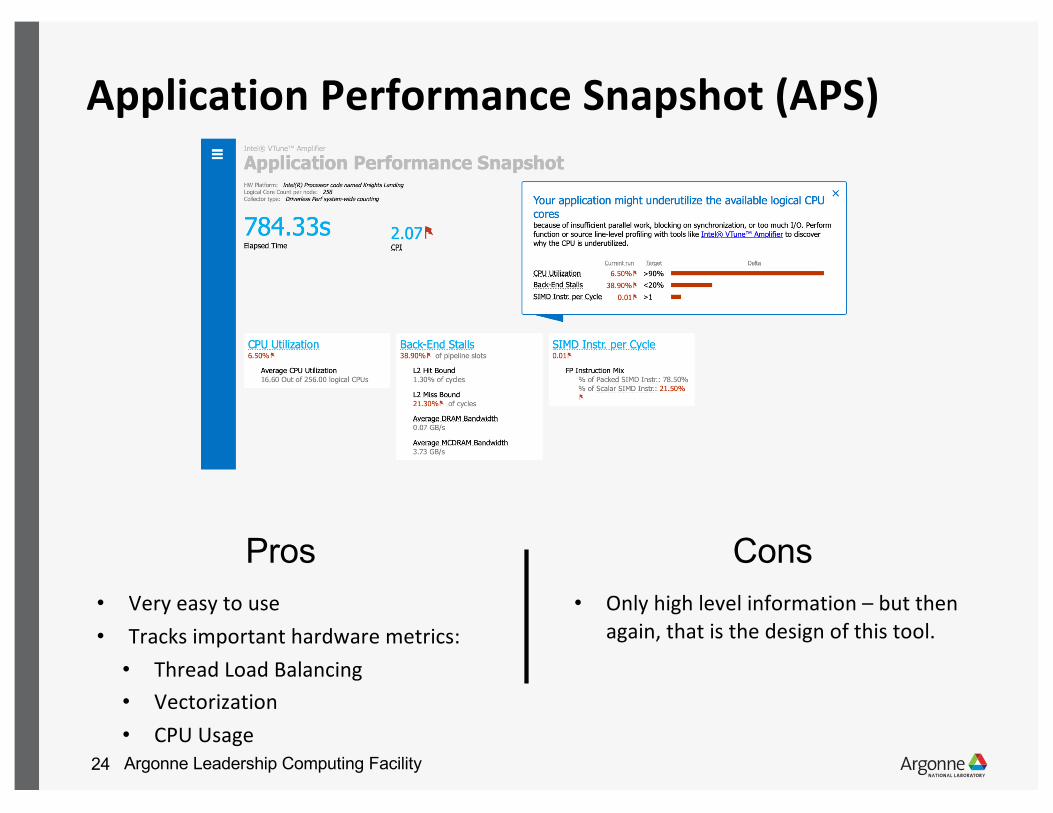
Application Performance Snapshot (APS)
• Very easy to use• Tracks important hardware metrics:
• Thread Load Balancing• Vectorization• CPU Usage
Pros Cons• Only high level information – but then
again, that is the design of this tool.

Argonne Leadership Computing Facility25
Intel Vtune – Hotspots
sampling-mode=sw - User-Mode Sampling (default) used for profiling:• Targets running longer than a few seconds• A single process or a process-tree• Python and Intel runtimes
sampling-mode=hw - (Advanced hotspots) Hardware Event-Based Sampling used for profiling:
• Targets running less than a few seconds• All processes on a system, including the kernel
Argonne Leadership Computing Facility26
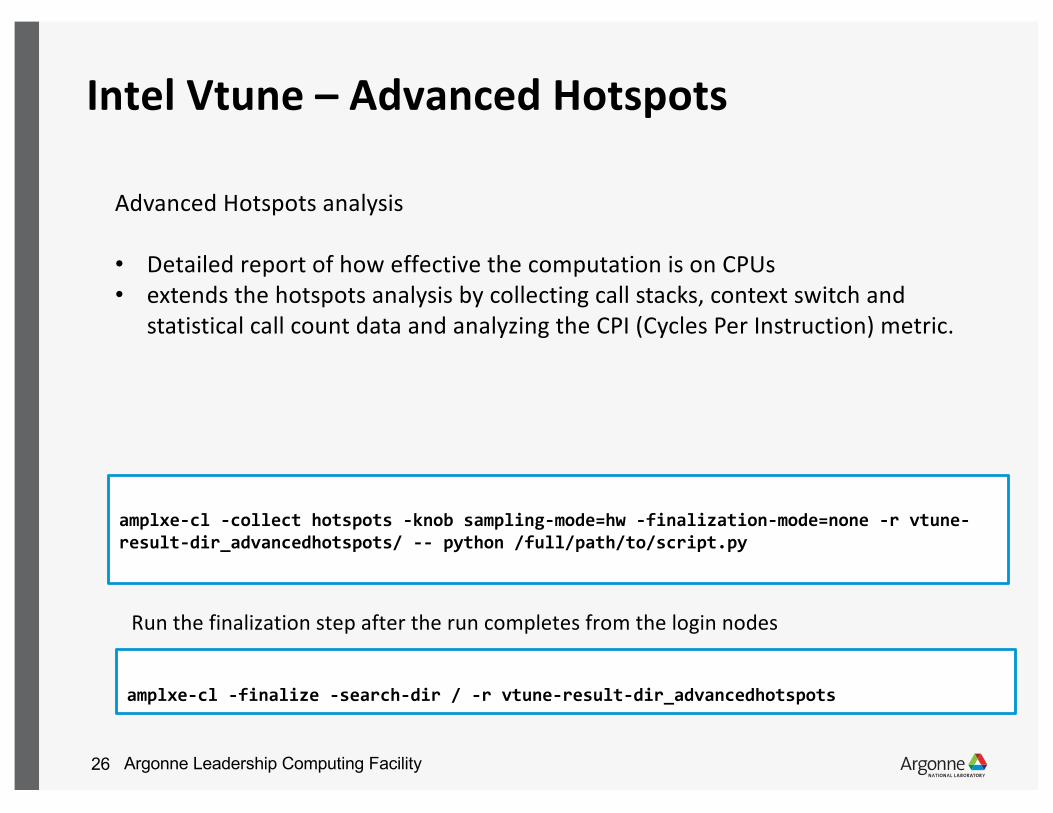
Intel Vtune – Advanced Hotspots
amplxe-cl -collect hotspots -knob sampling-mode=hw -finalization-mode=none -r vtune-result-dir_advancedhotspots/ -- python /full/path/to/script.py
Advanced Hotspots analysis
• Detailed report of how effective the computation is on CPUs• extends the hotspots analysis by collecting call stacks, context switch and
statistical call count data and analyzing the CPI (Cycles Per Instruction) metric.
Run the finalization step after the run completes from the login nodes
amplxe-cl -finalize -search-dir / -r vtune-result-dir_advancedhotspots
Argonne Leadership Computing Facility27
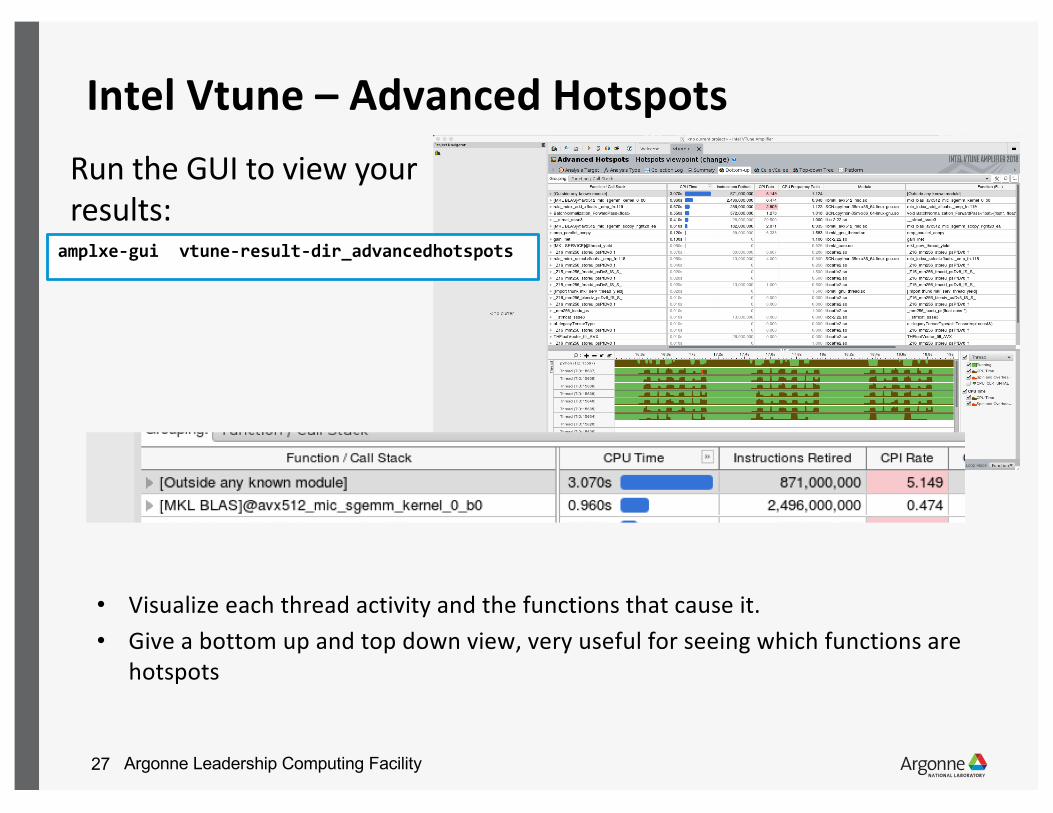
Intel Vtune – Advanced Hotspots
• Visualize each thread activity and the functions that cause it.• Give a bottom up and top down view, very useful for seeing which functions are
hotspots
amplxe-gui vtune-result-dir_advancedhotspots
Run the GUI to view your results:
Argonne Leadership Computing Facility28
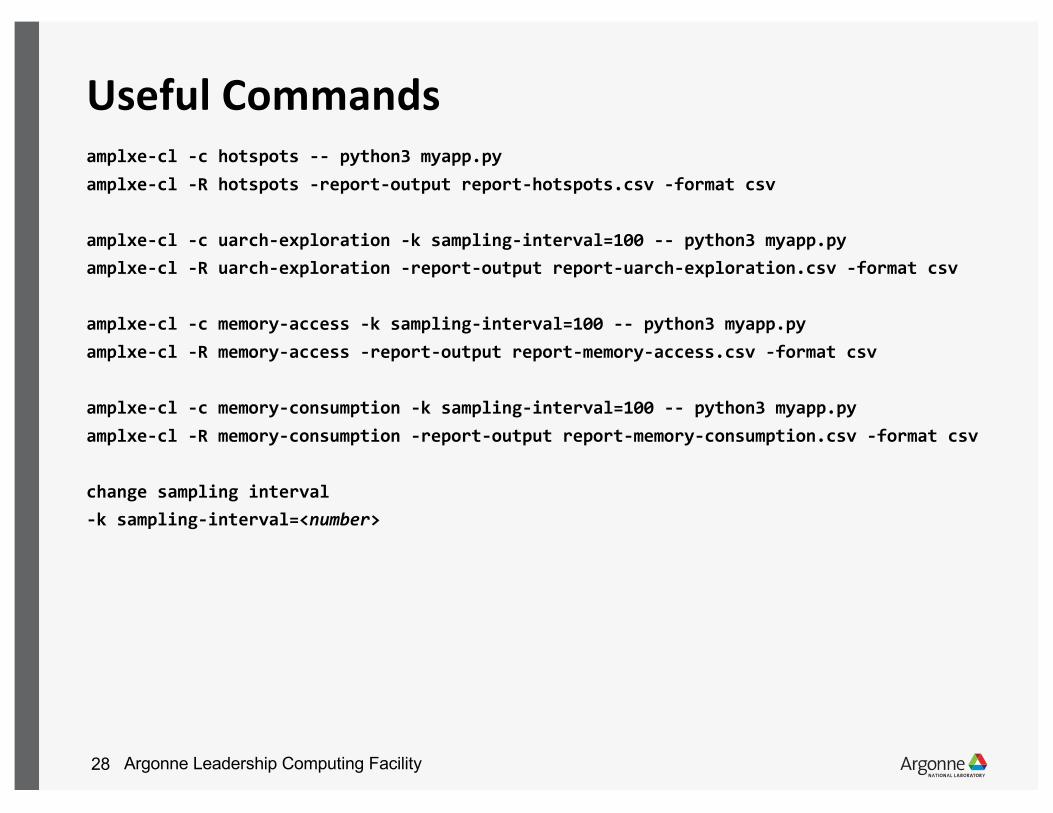
Useful Commandsamplxe-cl -c hotspots -- python3 myapp.pyamplxe-cl -R hotspots -report-output report-hotspots.csv -format csv
amplxe-cl -c uarch-exploration -k sampling-interval=100 -- python3 myapp.pyamplxe-cl -R uarch-exploration -report-output report-uarch-exploration.csv -format csv
amplxe-cl -c memory-access -k sampling-interval=100 -- python3 myapp.pyamplxe-cl -R memory-access -report-output report-memory-access.csv -format csv
amplxe-cl -c memory-consumption -k sampling-interval=100 -- python3 myapp.pyamplxe-cl -R memory-consumption -report-output report-memory-consumption.csv -format csv
change sampling interval-k sampling-interval=<number>
Argonne Leadership Computing Facility29
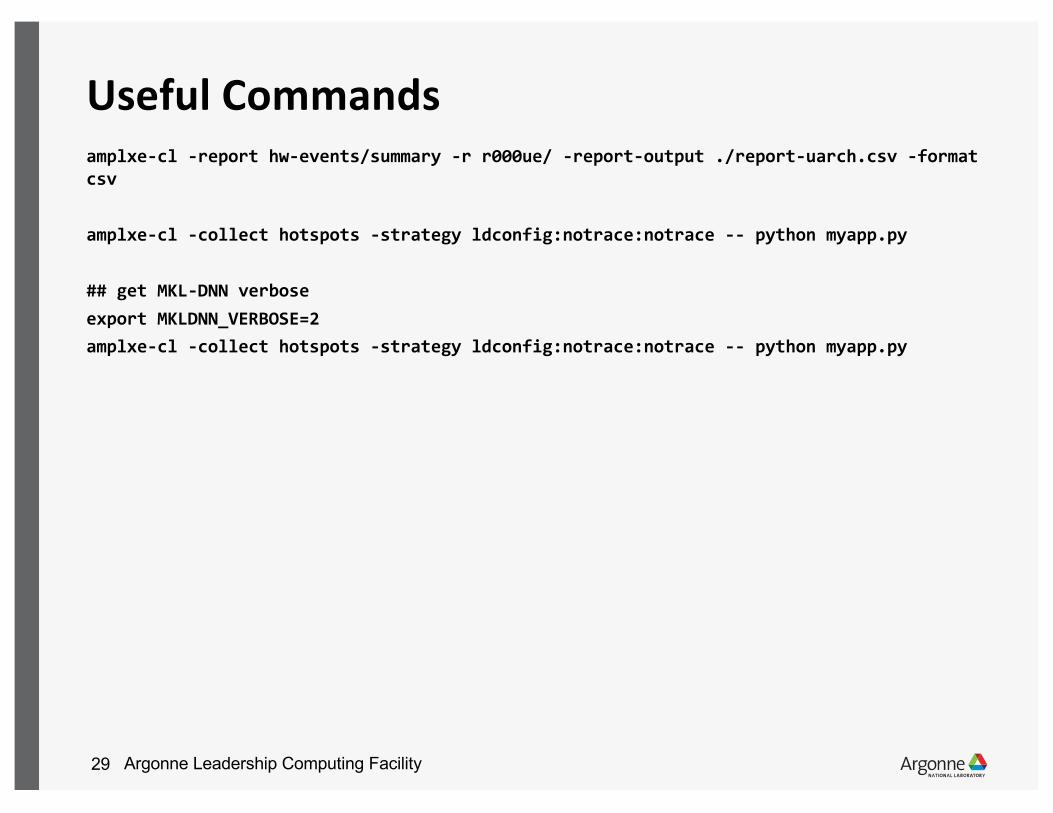
Useful Commandsamplxe-cl -report hw-events/summary -r r000ue/ -report-output ./report-uarch.csv -format csv
amplxe-cl -collect hotspots -strategy ldconfig:notrace:notrace -- python myapp.py
## get MKL-DNN verboseexport MKLDNN_VERBOSE=2amplxe-cl -collect hotspots -strategy ldconfig:notrace:notrace -- python myapp.py
Argonne Leadership Computing Facility30
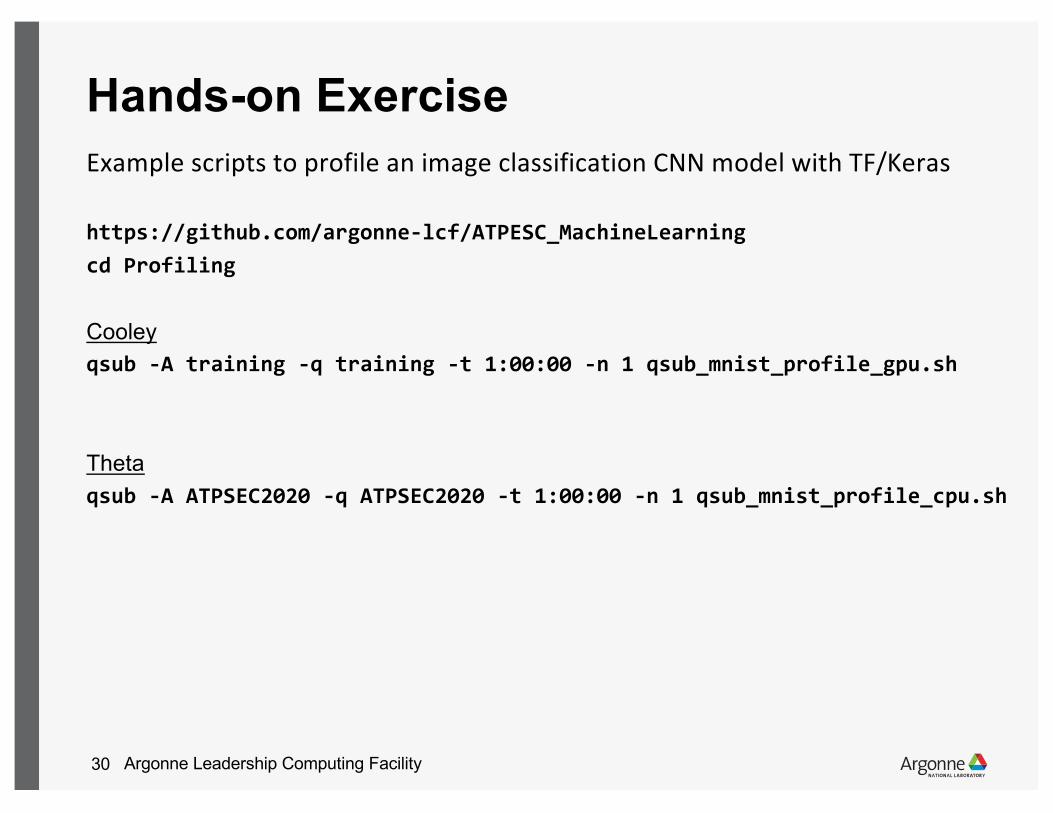
Hands-on ExerciseExample scripts to profile an image classification CNN model with TF/Keras
https://github.com/argonne-lcf/ATPESC_MachineLearningcd Profiling
Cooleyqsub -A training -q training -t 1:00:00 -n 1 qsub_mnist_profile_gpu.sh
Thetaqsub -A ATPSEC2020 -q ATPSEC2020 -t 1:00:00 -n 1 qsub_mnist_profile_cpu.sh
Argonne Leadership Computing Facility31
Thank you!
Argonne Leadership Computing Facility31
Argonne Leadership Computing Facility32
backup
Argonne Leadership Computing Facility33
Operations on backward weights, data have stalls à high memory requirements– Convolution layer is sensitive to compute units, memory and cachelines– Dense layer is sensitive to communication -> bandwidth
Argonne Leadership Computing Facility34
Argonne Leadership Computing Facility27
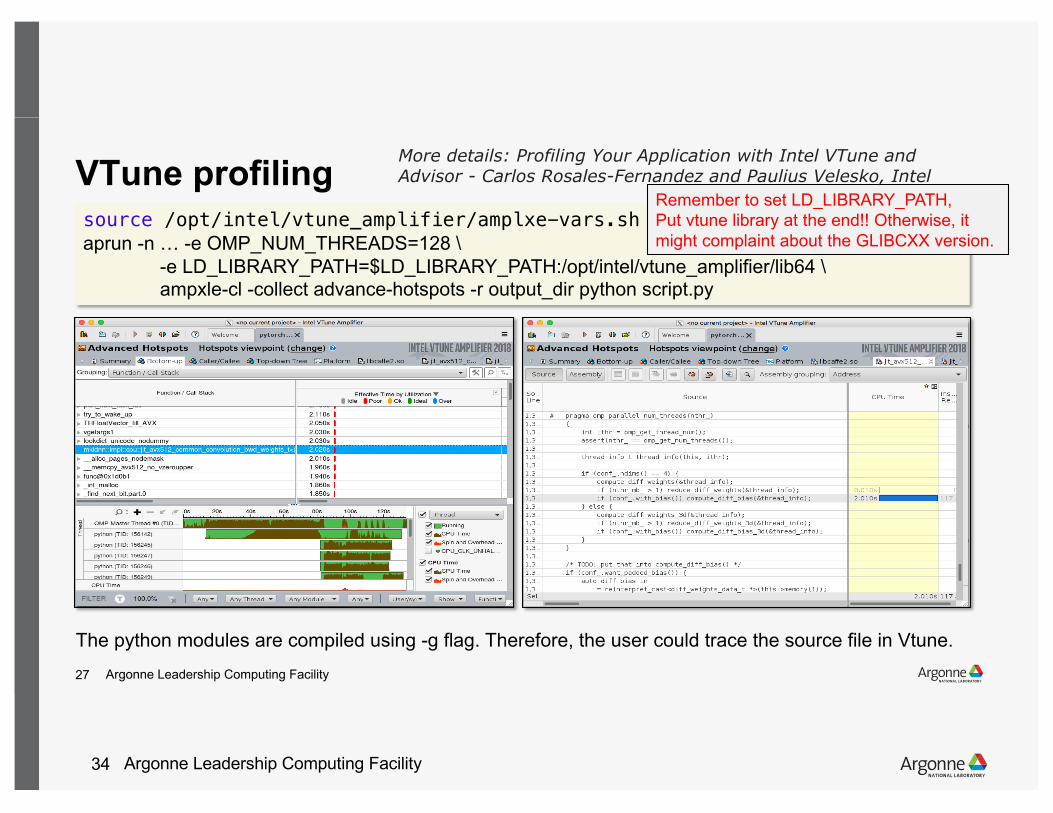
VTune profiling source /opt/intel/vtune_amplifier/amplxe-vars.shaprun -n … -e OMP_NUM_THREADS=128 \
-e LD_LIBRARY_PATH=$LD_LIBRARY_PATH:/opt/intel/vtune_amplifier/lib64 \ampxle-cl -collect advance-hotspots -r output_dir python script.py
The python modules are compiled using -g flag. Therefore, the user could trace the source file in Vtune.
Remember to set LD_LIBRARY_PATH, Put vtune library at the end!! Otherwise, it might complaint about the GLIBCXX version.
More details: Profiling Your Application with Intel VTune and Advisor - Carlos Rosales-Fernandez and Paulius Velesko, Intel

Argonne Leadership Computing Facility35
GPU Memory - metrics
1.dram_read_throughput, dram_read_transactions2.dram_write_throughput, dram_write_transactions3.sysmem_read_throughput, sysmem_read_transactions4.sysmem_write_throughput, sysmem_write_transactions5.l2_l1_read_transactions, l2_l1_read_throughput6.l2_l1_write_transactions, l2_l1_write_throughput7.l2_tex_read_transactions, l2_texture_read_throughput8.texture is read-only, there are no transactions possible on this path9.shared_load_throughput, shared_load_transactions10.shared_store_throughput, shared_store_transactions11.l1_cache_local_hit_rate12.l1 is write-through cache, so there are no (independent) metrics for this path - refer to other local metrics13.l1_cache_global_hit_rate14.see note on 1215.gld_efficiency, gld_throughput, gld_transactions16.gst_efficiency, gst_throughput, gst_transactions
https://stackoverflow.com/questions/37732735/nvprof-option-for-bandwidth
GPU Memory

Argonne Leadership Computing Facility36
GEMM – 2*m*n*k operationsm, k – hidden layer size n = minibatch size
2 * 512 * 512 * 64 = 0.03 GFLOP
Peak upper limit = 6000 GFLOP/s
Runtime ~ 5.6 usec
18
SGEMM Performance
• GEMM performs ~2mnk floating point operations
• In this case, m and k are the hidden layer size, n is the minibatch size
• 512 * 512 * 64 * 2 = 0.034 GFLOP
• The GPU I’m using can perform ~6,000 GFLOP per second
• Best GEMM runtime is therefore: 5.7us
• 72us => ~500 GFLOP/s
Back of the envelope
Time(%) Time Calls Avg Min Max Name 93.93% 575.72us 8 71.964us 70.241us 78.945us maxwell_sgemm_128x64_tn

Argonne Leadership Computing Facility37
Optimization
22
[A1][h] = [x1]
[A2][h] = [x2]
[A3][h] = [x3]
[A4][h] = [x4]
SGEMM Performance Improvement #1
• As our matrix operations share inputs we can combine them
A [h] = x
23
Combined Matrices Improvement #1
Time(%) Time Calls Avg Min Max Name 93.93% 575.72us 8 71.964us 70.241us 78.945us maxwell_sgemm_128x64_tn
Time(%) Time Calls Avg Min Max Name 84.40% 198.11us 2 99.057us 98.177us 99.937us maxwell_sgemm_128x64_tn
• From ~500 GFLOP/s to ~1350 GFLOP/s
2.5x performance gain
Copyright © 2022 FDOKUMEN