Biomechanical Profiling and Physiological Responses to ...
285
Biomechanical Profiling and Physiological Responses to Eccentric Quasi-Isometric Loading Dustin Jay Oranchuk Bachelor of Kinesiology - University of Calgary Master of Science - Adams State University A thesis submitted to Auckland University of Technology in fulfillment of the degree of Doctor of Philosophy 15 th of April 2021 Primary Supervisor - Professor John B. Cronin Associate Supervisors - Doctors Adam G. Storey and André R. Nelson Sports Performance Research Institute New Zealand. School of Sport and Recreation. Auckland University of Technology, Auckland New Zealand
-
Upload
khangminh22 -
Category
Documents
-
view
1 -
download
0
Transcript of Biomechanical Profiling and Physiological Responses to ...

Biomechanical Profiling and Physiological Responses to
Eccentric Quasi-Isometric Loading
Dustin Jay Oranchuk
Bachelor of Kinesiology - University of Calgary
Master of Science - Adams State University
A thesis submitted to Auckland University of Technology in fulfillment of the
degree of Doctor of Philosophy
15th of April 2021
Primary Supervisor - Professor John B. Cronin
Associate Supervisors - Doctors Adam G. Storey and André R. Nelson
Sports Performance Research Institute New Zealand.
School of Sport and Recreation.
Auckland University of Technology, Auckland New Zealand

i
Abstract
Muscle structure and function are important to quality of life and physical performance.
With eccentric and isometric resistance training established for improving muscle size and
strength, eccentric quasi-isometric (EQI) contractions, defined as “holding a position until
isometric failure and maximally resisting the subsequent eccentric phase”, are the focus of this
thesis. The primary aims were to answer the overarching research question: “What are the
acute, and long-term effects of EQI loading on muscle form and function?”. Systematic and
narrative reviews were conducted, followed by the evaluation and optimization of testing
methods, culminating in acute and short-term experimental studies.
Reviews of the literature established that isometric training at longer muscle lengths
produced greater hypertrophy than volume-equated shorter muscle length training (0.1-
1.0%·week-1, effect size (ES) = 0.05-0.2·week-1), and transferred better to full range of motion
(ROM) performance. Ballistic intent resulted in greater increases in rate of torque development
(RTD) and neuromuscular activation (-1.5-3.6%·week-1, ES = 0.03-0.28·week-1). Hypertrophy
and strength improvements were not related to isometric training intensity, however,
contractions ≥ 70% were likely required to improve tendon qualities. While there is a lack of
studies directly examining EQIs, they may provide a practical means of increasing metabolic
and hormonal factors, while safely applying large quantities of mechanical tension. EQI
training appears to be effective for improving musculotendinous morphological and
performance variables with low injury risk.
To be confident in the primary findings of the PhD, it was important to test and
determine an optimized assessment battery for the acute and long-term effects and adaptations
to EQI loading. Repeated between-day testing determined that ultrasound derived muscle
thickness (MT) and subcutaneous fat corrected echo intensity (EI) had low variability in all
quadriceps muscles and regions. Pennation angle (PA) and extended field-of-view fascicle
length (FL) could only be reliably assessed in the vastus lateralis. Concentric torque and
impulse were reliable between 90-20° of knee-flexion. Maximal voluntary isometric torque
(MVIT), and RTD and impulse from 0-200 ms can be confidently assessed regardless of joint
angle. Correlational analysis revealed that the isometric length-tension relationship was
minimally associated with regional architecture and that the middle and distal architecture were
the strongest predictors of MVIT.

ii
When comparing impulse-equated bouts of EQI and isokinetic eccentric loading
(ECC), physiological responses were similar in 21/56 variables. EQIs resulted in greater vastus
intermedius swelling (7.1-8.8%, ES = 0.20-0.29), whereas ECC resulted in greater soreness at
the distal and middle vastus lateralis and distal rectus femoris (16.5-30.4%, ES = 0.32-0.54)
and larger echogenicity increases at the distal rectus femoris and lateral vastus intermedius
(11.9-15.1%, ES = 0.26-0.54). Furthermore, ECC led to larger reductions in concentric (8.3-
19.7%, ES = 0.45-0.62) and isometric (6.3-32.3%, ES = 0.18-0.70) torque and RTD at medium-
long muscle lengths. There were substantial differences in the number of contractions required
to impulse-match the conditions (ECC: 100.8 ± 54 vs EQI: 3.85 ± 1.1). Mean contraction
velocity over four contractions was 1.34º·s-1 with most (62.5 ± 4.9%) impulse produced
between 40-70º. Most between-contraction changes in total angular impulse, contraction
velocity, and time-under-tension occurred between 30-50º (ES = 0.53 ± 0.31, 60 ± 52%), while
kinetics and kinematics relatively constant between 50-100º (ES = 0.10 ± 0.26, 14.3 ± 24.6%).
Findings suggest that EQI loading could be an alternative to traditional resistance-training,
possibly for individuals suffering from, or susceptible to musculoskeletal injury. Practitioners
could shift the loading distribution to longer muscle lengths by prescribing a greater number
of contractions, reducing rest periods, or implementing EQI contractions towards the end of a
traditional training session where fatigue may be present.
Although extensive future research is required to understand underlying mechanisms
and long-term adaptations, the thesis provided novel and original information on the
biomechanics and physiological effects of EQI loading. With the benefits of time-efficiency
and minimal negative effects, EQI training is likely best applied in rehabilitation, general
preparatory, unloading, or transition periods of the periodized plan.

iii
Table of contents
Abstract .................................................................................................................................. i
Table of contents................................................................................................................. iii
List of figures ....................................................................................................................... ix
List of tables ......................................................................................................................... xi
Attestation of authorship ................................................................................................... xii
Co-authored works ........................................................................................................... xiii
Acknowledgments............................................................................................................... xv
Ethical approvals ............................................................................................................ xviii
Chapter 1 - Introduction ..................................................................................................... 1
Rationale and significance of the thesis ...................................................................................................... 1
Muscle morphology ................................................................................................................................... 1
Contractile performance ............................................................................................................................ 2
Biomechanical profiling ............................................................................................................................ 3
Potential applications ................................................................................................................................. 3
Originality of the thesis ............................................................................................................................... 3
Research aims ............................................................................................................................................... 4
Structure of the thesis .................................................................................................................................. 4
Literature reviews ...................................................................................................................................... 6
Methodological considerations .................................................................................................................. 6
Acute and short-term effects ...................................................................................................................... 6
Long-term effects ...................................................................................................................................... 7
Section 1 – Review of literature ................................................................................................ 8
Chapter 2 - Isometric training and long-term adaptations: Effects of muscle length,
intensity, and intent: A systematic review ......................................................................... 9
Reference ...................................................................................................................................................... 9
Author contribution ..................................................................................................................................... 9
Prelude .......................................................................................................................................................... 9
Introduction ................................................................................................................................................ 10
Methods ...................................................................................................................................................... 11
Literature search methodology ................................................................................................................ 11
Statistical analysis ................................................................................................................................... 12
Results ......................................................................................................................................................... 13
Discussion ................................................................................................................................................... 27
Morphological adaptations ...................................................................................................................... 27
Neurological adaptations ......................................................................................................................... 32
Performance enhancement ....................................................................................................................... 34
Applications ............................................................................................................................................. 37
iv
Limitations and directions for future research ......................................................................................... 39
Perspectives ................................................................................................................................................ 40
Chapter 3 - Scientific basis for eccentric quasi-isometric resistance training: A
narrative review.................................................................................................................. 42
Reference .................................................................................................................................................... 42
Author contribution ................................................................................................................................... 42
Prelude ........................................................................................................................................................ 42
Introduction ................................................................................................................................................ 43
Defining eccentric quasi-isometric training ............................................................................................. 43
Methods ...................................................................................................................................................... 44
Literature search methodology ................................................................................................................ 44
Statistical analysis ................................................................................................................................... 44
Eccentric quasi-isometrics and morphological adaptations ................................................................... 44
Contractile element .................................................................................................................................. 45
Series elastic component ......................................................................................................................... 52
Parallel elastic component ....................................................................................................................... 55
Eccentric quasi-isometric contractions and neurological qualities ........................................................ 56
Contraction intent .................................................................................................................................... 57
Contraction intensity ............................................................................................................................... 58
Joint angle ................................................................................................................................................ 59
Applications to performance and rehabilitation ..................................................................................... 59
Performance ............................................................................................................................................. 59
Rehabilitation .......................................................................................................................................... 63
Limitations ............................................................................................................................................... 66
Practical applications................................................................................................................................. 66
Section 2 – Methodological considerations............................................................................ 68
Chapter 4 - Variability of regional quadriceps architecture in trained men assessed by
B-mode and extended field-of-view ultrasonography ..................................................... 69
Reference .................................................................................................................................................... 69
Author contribution ................................................................................................................................... 69
Prelude ........................................................................................................................................................ 69
Introduction ................................................................................................................................................ 70
Methods ...................................................................................................................................................... 71
Experimental design ................................................................................................................................ 71
Participants .............................................................................................................................................. 71
Testing procedures ................................................................................................................................... 71
Statistical analysis ................................................................................................................................... 74
Results ......................................................................................................................................................... 74
Discussion ................................................................................................................................................... 78
Practical applications ............................................................................................................................... 79

v
Conclusions ................................................................................................................................................. 79
Chapter 5 - Variability of regional quadriceps echo intensity in active young men with
and without subcutaneous fat correction ......................................................................... 80
Reference .................................................................................................................................................... 80
Author contribution ................................................................................................................................... 80
Prelude ........................................................................................................................................................ 80
Introduction ................................................................................................................................................ 81
Methods ...................................................................................................................................................... 82
Experimental design ................................................................................................................................ 82
Participants .............................................................................................................................................. 82
Testing procedures ................................................................................................................................... 82
Statistical analysis ................................................................................................................................... 85
Results ......................................................................................................................................................... 86
Discussion ................................................................................................................................................... 92
Conclusions ................................................................................................................................................. 94
Chapter 6 - Variability of concentric angle-specific isokinetic torque and impulse
assessments of the knee extensors ..................................................................................... 95
Reference .................................................................................................................................................... 95
Author contribution ................................................................................................................................... 95
Prelude ........................................................................................................................................................ 95
Introduction ................................................................................................................................................ 96
Methods ...................................................................................................................................................... 97
Experimental design ................................................................................................................................ 97
Subjects ................................................................................................................................................... 97
Testing procedures ................................................................................................................................... 98
Statistical analysis ................................................................................................................................... 99
Results ......................................................................................................................................................... 99
Discussion ................................................................................................................................................. 103
Conclusions ............................................................................................................................................... 105
Chapter 7 - Variability of multiangle isometric force-time characteristics in trained
men..................................................................................................................................... 106
Reference .................................................................................................................................................. 106
Author contribution ................................................................................................................................. 106
Prelude ...................................................................................................................................................... 106
Introduction .............................................................................................................................................. 107
Methods .................................................................................................................................................... 108
Experimental approach to the problem .................................................................................................. 108
Subjects ................................................................................................................................................. 109
Testing procedures ................................................................................................................................. 109
Statistical analysis ................................................................................................................................. 110

vi
Results ....................................................................................................................................................... 111
Discussion ................................................................................................................................................. 114
Practical applications............................................................................................................................... 115
Section 3 – Correlational analyses ....................................................................................... 117
Chapter 8 - The effect of regional quadriceps anatomical parameters on angle-specific
isometric torque expression ............................................................................................. 118
Reference .................................................................................................................................................. 118
Author contribution ................................................................................................................................. 118
Prelude ...................................................................................................................................................... 118
Introduction .............................................................................................................................................. 119
Materials and Methods ............................................................................................................................ 120
Experimental design .............................................................................................................................. 120
Participants ............................................................................................................................................ 121
Testing procedures ................................................................................................................................. 121
Data processing and analysis ................................................................................................................. 124
Statistical analysis ................................................................................................................................. 126
Results ....................................................................................................................................................... 128
Reliability .............................................................................................................................................. 128
Correlational analysis ............................................................................................................................ 129
Discussion ................................................................................................................................................. 136
Limitations and future research directions............................................................................................. 139
Conclusions ............................................................................................................................................... 141
Section 4 – Short-term effects and biomechanical profiling of eccentric quasi-isometric
resistance-exercise ................................................................................................................ 142
Chapter 9 – Short-term neuromuscular, morphological, and architectural responses to
eccentric quasi-isometric muscle actions........................................................................ 143
Reference .................................................................................................................................................. 143
Author contribution ................................................................................................................................. 143
Prelude ...................................................................................................................................................... 143
Introduction .............................................................................................................................................. 144
Methods .................................................................................................................................................... 145
Experimental design .............................................................................................................................. 145
Participants ............................................................................................................................................ 146
Testing procedures ................................................................................................................................. 146
Exercise procedures ............................................................................................................................... 149
Data processing and analysis ................................................................................................................. 151
Statistical analysis ................................................................................................................................. 154
Results ....................................................................................................................................................... 154
Exercise sessions ................................................................................................................................... 154
Acute effects and recovery .................................................................................................................... 156

vii
Discussion ................................................................................................................................................. 161
Exercise conditions ................................................................................................................................ 161
Muscle soreness ..................................................................................................................................... 162
Muscle morphology and architecture .................................................................................................... 163
Neuromuscular performance ................................................................................................................. 165
Limitations and directions for future research ....................................................................................... 167
Practical applications ............................................................................................................................. 168
Conclusions ............................................................................................................................................... 168
Chapter 10 – Kinetic and kinematic profile of eccentric quasi-isometric loading ..... 170
Reference .................................................................................................................................................. 170
Author contribution ................................................................................................................................. 170
Prelude ...................................................................................................................................................... 170
Introduction .............................................................................................................................................. 171
Methods .................................................................................................................................................... 172
Experimental design .............................................................................................................................. 172
Participants ............................................................................................................................................ 172
Testing procedures ................................................................................................................................. 172
Data processing and analysis ................................................................................................................. 174
Statistical analysis ................................................................................................................................. 175
Results ....................................................................................................................................................... 176
Time-normalized angle-time kinetics .................................................................................................... 176
Absolute torque-angle characteristics .................................................................................................... 177
Discussion ................................................................................................................................................. 179
Limitations and directions for future research ....................................................................................... 181
Conclusions ............................................................................................................................................... 182
Section 5 – Conclusions ........................................................................................................ 183
Chapter 11 – Summary, practical applications, limitations, and future research
directions ........................................................................................................................... 184
Summary .................................................................................................................................................. 184
Key findings .......................................................................................................................................... 184
Practical applications............................................................................................................................... 186
Limitations and directions for future research ..................................................................................... 187
Conclusions ............................................................................................................................................... 188
Section 6 – References and appendices ................................................................................ 189
References ......................................................................................................................... 190
Appendices ........................................................................................................................ 224
Appendix 1. Study quality scoring system ............................................................................................ 224
Appendix 2. Study quality ratings ......................................................................................................... 225
Appendix 3. Isometrically trained joint angle and hypertrophic adaptations ........................................ 226

viii
Appendix 4. Isometrically trained joint angle and strength adaptations ................................................ 227
Appendix 5. Regional quadriceps architecture averaged over three sessions ........................................ 228
Appendix 6. Differences in adjusted simple correlations (adjR2), with compatibility limits and
magnitude-based decisions, between normalized maximal voluntary isometric torque and regional
quadriceps measures .............................................................................................................................. 229
Appendix 7. Differences in adjusted multiple correlations (adjR2), with compatibility limits and
magnitude-based decisions, between normalized maximal voluntary isometric torque and regional
quadriceps measures .............................................................................................................................. 232
Appendix 8. Differences in adjusted multiple correlations (adjR2), with compatibility limits and
magnitude-based decisions, between lateral (vastus lateralis + lateral vastus intermedius) and anterior
(rectus femoris + anterior vastus intermedius) quadriceps muscle thickness ........................................ 235
Appendix 9. Raw pressure-pain threshold values at each time-point with custom effect of between-
condition deltas ...................................................................................................................................... 236
Appendix 10. Raw muscle thickness values at each time-point with custom effect of between-condition
deltas ...................................................................................................................................................... 237
Appendix 11. Raw vastus lateralis pennation angle and fascicle length values at each time-point with
custom effect of between-condition deltas ............................................................................................ 239
Appendix 12. Raw echo intensity values at each time-point with custom effect of between-condition deltas
............................................................................................................................................................... 240
Appendix 13. Raw angle specific concentric peak torque, total impulse, and angle specific impulse values
at each time-point with custom effect of between-condition deltas ....................................................... 242
Appendix 14. Raw angle specific maximal voluntary isometric torque and rate of torque development
values at each time-point with custom effect of between-condition deltas ........................................... 244
Appendix 15. Comparison of angular impulse (Nm.s-1) between contractions ...................................... 245
Appendix 16. Comparison of time-under-tension (seconds) between contractions ............................... 246
Appendix 17. Comparison of velocity (degrees per second) between contractions .............................. 247
Appendix 18. Ethical approval for Chapters 4-10 ................................................................................. 248
Appendix 19. Participant information sheet for Chapters 4-10 ............................................................. 249
Appendix 20. Consent form for Chapters 4-10 ...................................................................................... 252
Appendix 21. Advertisement for Chapters 4-10 .................................................................................... 253
Appendix 28. Additional peer-reviewed journal outputs since starting the PhD ................................... 254
Appendix 29. Peer-reviewed conference proceedings since starting the PhD ....................................... 256
Appendix 30. Chapter 2 abstract ........................................................................................................... 257
Appendix 31. Chapter 3 abstract ........................................................................................................... 258
Appendix 32. Chapter 4 abstract ........................................................................................................... 259
Appendix 33. Chapter 5 abstract ........................................................................................................... 260
Appendix 34. Chapter 6 abstract ........................................................................................................... 261
Appendix 35. Chapter 7 abstract ........................................................................................................... 262
Appendix 36. Chapter 8 abstract ........................................................................................................... 263
Appendix 37. Chapter 9 abstract ........................................................................................................... 264
Appendix 38. Chapter 10 abstract ......................................................................................................... 265
The end .................................................................................................................................. 266

ix
List of figures
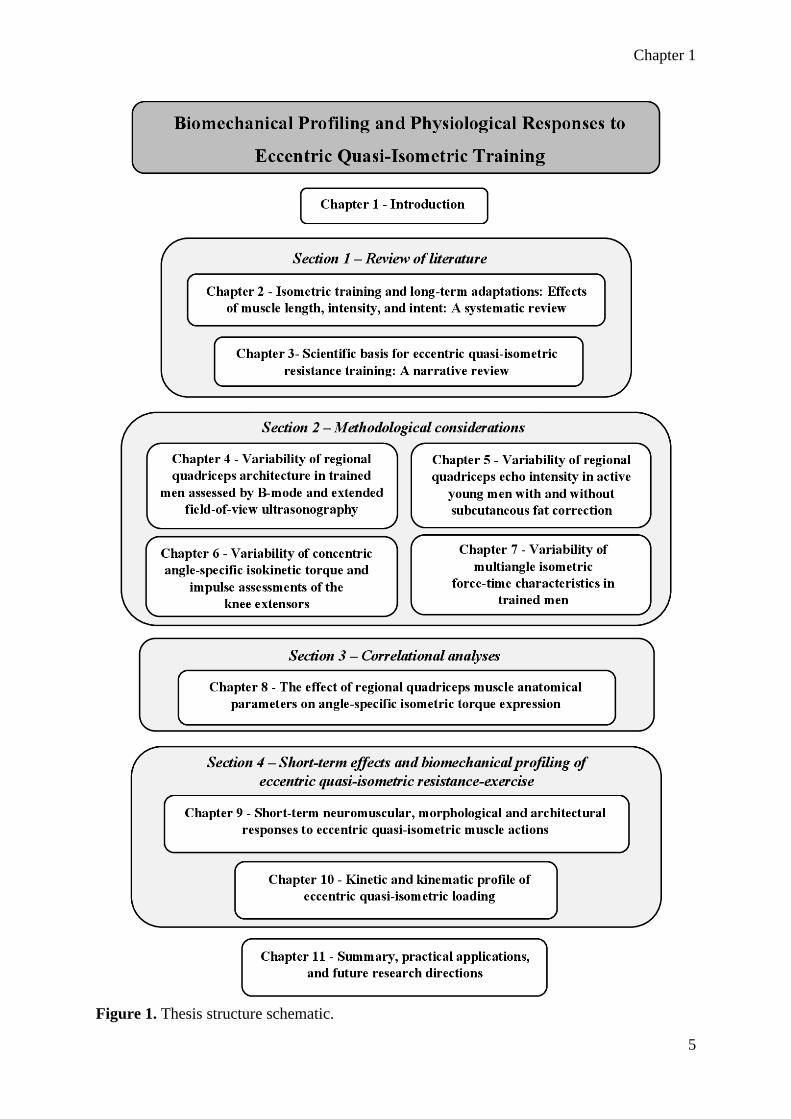
Figure 1. Thesis structure schematic. ........................................................................................ 5
Figure 2. Search strategy. ........................................................................................................ 12
Figure 3. Isometrically trained joint angle and hypertrophic adaptations ............................... 25
Figure 4. Isometric training intensity and hypertrophic adaptations ...................................... 26
Figure 5. Isometric training intensity and force production.................................................... 27
Figure 6. The three-component model of force transmission. ................................................ 45
Figure 7. The three-component model of force transmission in a muscle contracting at short
and long muscle lengths. .......................................................................................................... 48
Figure 8. The initial quasi-isometric hold and final position after a maximal eccentric
contraction in the single-leg leg press. ..................................................................................... 61
Figure 9. The initial quasi-isometric hold and final position after a maximal eccentric
contraction in the snatch pull. .................................................................................................. 63
Figure 10. Eccentric quasi-isometric incline biceps curl. ....................................................... 64
Figure 11. (A) B-mode ultrasound image of the mid VL and LVI. (B) Extended field-of-view
image of the VL. ...................................................................................................................... 73
Figure 12. Representative B-mode ultrasound image of the proximal, middle, and distal vastus
lateralis (top muscle) and lateral vastus intermedius (bottom muscle) (A). Representative B-
mode ultrasound image of the proximal, middle, and distal rectus femoris (top muscle) and
anterior vastus intermedius (bottom muscle) (B). .................................................................... 84
Figure 13. Individual regional uncorrected echo intensity of the quadriceps. ........................ 87
Figure 14. Individual regional subcutaneous fat thickness corrected quadriceps echo intensity
of the quadriceps. ..................................................................................................................... 88
Figure 15. Markings and scanning probe position for the lateral (panel A) and anterior (panel
B) quadriceps femoris. ........................................................................................................... 122
Figure 16. Representative proximal, middle, and distal B-mode ultrasound images of the lateral
(top) and anterior (bottom) quadriceps muscles. ................................................................... 123
Figure 17. Representative extended field-of-view images of the vastus lateralis with proximal,
middle, and distal fascicle lengths (A). Typical extended field-of-view image of the rectus
femoris (B) ............................................................................................................................. 125
Figure 18. Adjusted simple correlations with bootstrapped 90% compatibility limits of
normalized maximal voluntary isometric torque at 40º, 70º, and 100º of knee flexion with
regional quadriceps architecture. ........................................................................................... 130
Figure 19. (A) Study timeline. (B) Evaluation session timeline. (C) Exercise session timeline.
................................................................................................................................................ 147
Figure 20. Representative extended field-of-view ultrasound evaluation of regional vastus
lateralis fascicle length PRE and POST eccentric quasi-isometric condition. ....................... 152
Figure 21. Individual participant total angular impulse for each exercise condition, and the
impulse difference between conditions. ................................................................................. 155
Figure 22. Mean percentage of total angular impulse through eight range of motion brackets
during the eccentric (ECC) and eccentric quasi-isometric (EQI) bouts. ............................... 156
Figure 23. The region-specific pressure-pain threshold (PPT) of the vastus lateralis (panels A-
C) and rectus femoris (panels D-F), before and following eccentric or eccentric quasi-isometric
exercise. ................................................................................................................................. 157

x
Figure 24. Region-specific muscle thickness (MT) of the vastus lateralis (panels A-C), lateral
vastus intermedius (panels D-F), rectus femoris (panels G-I), and anterior vastus intermedius
(panels J-L), before and following eccentric or eccentric quasi-isometric exercise. ............. 158
Figure 25. Concentric peak torque (panel A) and total concentric impulse (panel B) before and
following eccentric or eccentric quasi-isometric exercise. .................................................... 159
Figure 26. Concentric angle-specific impulse before and following eccentric or eccentric
quasi-isometric exercise. ........................................................................................................ 160
Figure 27. Joint-angle specific maximal voluntary isometric torque (MVIT) (panels A-C) and
rate of torque development (RTD 0-200) (panels D-F), before and following eccentric or
eccentric quasi-isometric exercise. ........................................................................................ 161
Figure 28. Start (panel A) and end (panel B) position for the eccentric quasi-isometric
contractions. ........................................................................................................................... 174
Figure 29. Time normalized angle-time curve comparison of eccentric quasi-isometric
contractions one, and four. ..................................................................................................... 176
Figure 30. Mean difference in time normalized angle-time curves. ..................................... 177
Figure 31. Change in total angular impulse between contractions. ...................................... 178
Figure 32. Angle-specific eccentric quasi-isometric impulse from contraction one (C1),
contraction two (C2), contraction three (C3) and contraction four (C4). .............................. 179

xi
List of tables
Table 1. Joint angle ................................................................................................................. 15
Table 2. Contraction intensity ................................................................................................. 18
Table 3. Contraction intent ...................................................................................................... 20
Table 4. Other independent variables ...................................................................................... 22
Table 5. Theoretical potential of dynamic, eccentric, isometric, and eccentric quasi-isometric
resistance training to benefit musculotendinous morphology and performance ..................... 60
Table 6. Hypothetical resistance training program for an athlete recovering from patellar
tendonitis .................................................................................................................................. 65
Table 7. Test-retest variability of ultrasonographic derived muscle thickness over three
repeated measures. ................................................................................................................... 75
Table 8. Test-retest variability of ultrasonographic derived pennation angle over three repeated
measures. .................................................................................................................................. 76
Table 9. Test-retest variability of ultrasonographic derived calculated and extended field-of-
view fascicle length over three repeated measures. ................................................................. 77
Table 10. Test-retest variability of regional quadriceps uncorrected echo intensity over three
repeated measures. ................................................................................................................... 89
Table 11. Test-retest variability of regional quadriceps corrected echo intensity over three
repeated measures. ................................................................................................................... 91
Table 12. Test-retest variability of Isokinetic (60º·s-1) knee extension torque production over
three repeated measures. ........................................................................................................ 100
Table 13. Test-retest variability of Isokinetic (60º·s-1) knee extension angular impulse over
three repeated measures. ........................................................................................................ 102
Table 14. Test-retest variability of isometric knee extension force production over three
repeated measures. ................................................................................................................. 112
Table 15. Multiple correlations (R2) and adjusted multiple correlations (adjR2), with
compatibility limits and magnitude-based decisions, between normalized maximal voluntary
isometric torque and combined regional quadriceps measures (MT + PA + FL). ................. 131
Table 16. Multiple correlations (R2) and adjusted multiple correlations (adjR2), with
compatibility limits and magnitude-based decisions, between normalized maximal voluntary
isometric torque and combined regional quadriceps measures (VLMT + PA + FL + LVIMT).
................................................................................................................................................ 132
Table 17. Multiple correlations (R2) and adjusted multiple correlations (adjR2), with
compatibility limits and magnitude-based decisions, between normalized maximal voluntary
isometric torque and combined regional muscle thickness.................................................... 134

xii
Attestation of authorship
I hereby declare that this submission is my own work and that, to the best of my
knowledge and belief, it contains no material previously published or written by another person
(except where explicitly defined in the acknowledgements), nor material which to a substantial
extent has been submitted for the award of any other degree or diploma of a university or other
institution of higher learning.
Chapters 2 to 10 represent separate papers that have either been published or have been
submitted to peer-reviewed journals for consideration for publication. My contribution and the
contributed by the various co-authors to each of these papers are outlined at the beginning of
each chapter. All co-authors have approved the inclusion of the joint work in this doctoral
thesis.
Dustin Jay Oranchuk
15th of April 2021

xiii
Co-authored works
Chapter 2. Oranchuk DJ, Storey AG, Nelson AR, and Cronin JB. Isometric
training and long-term adaptations: Effects of muscle length,
intensity, and intent: A systematic review. Scand J Med Sci Sports
29: 484-503, 2019.
DJO: 80%,
AGS: 5%,
ARN: 5%,
JBC: 10%
Chapter 3. Oranchuk DJ, Nelson AR, Storey AG, and Cronin JB. Scientific
basis of eccentric quasi-isometric resistance training: A narrative
review. J Strength Cond Res 33: 2846-2859, 2019.
DJO: 80%,
ARN: 10%,
AGS: 5%,
JBC: 5%
Chapter 4. Oranchuk DJ, Nelson AR, Storey AG, and Cronin JB. Variability
of regional quadriceps architecture in trained men assessed by B-
mode and extended-field-of-view ultrasonography. Int J Sports
Physiol Perform 15: 430-436, 2020.
DJO: 80%,
ARN: 5%,
AGS: 5%,
JBC: 10%
Chapter 5. Oranchuk DJ, Stock MS, Nelson AR, Storey AG, and Cronin JB.
Variability of regional quadriceps echo intensity in active young men
with and without subcutaneous fat correction. Appl Physiol Nutr
Metab 45: 745-752, 2020.
DJO: 80%,
MSS: 8%,
ARN: 4%,
AGS: 4%,
JBC: 4%
Chapter 6. Oranchuk DJ, Neville JG, Nelson AR, Storey AG, and Cronin
JB. Variability of concentric angle-specific isokinetic torque and
impulse assessments of the knee extensors. Physiol Meas 41:
01NT02, 2020.
DJO: 80%,
JGN: 8%
ARN: 4%,
AGS: 4%,
JBC: 4%
Chapter 7. Oranchuk DJ, Storey AG, Nelson AR, Neville JG, and Cronin
JB. Variability of multiangle isometric force-time characteristics in
trained men. J Strength Cond Res Ahead of print, 2019.
DJO: 80%,
AGS: 8%
ARN: 4%,
JGN: 4%,
JBC: 4%
Chapter 8. Oranchuk DJ, Hopkins WG, Nelson AR, Storey AG, and Cronin
JB. The effect of regional quadriceps anatomical parameters on
angle-specific isometric torque expression. Appl Physiol Nutr Metab
46: 368-378, 2021.
DJO: 80%,
WGH: 10%,
ARN: 4%,
AGS: 3%,
JBC: 3%
Chapter 9. Oranchuk DJ, Nelson AR, Storey AG, Diewald SN, and Cronin
JB. Short-term neuromuscular, morphological, and architectural
responses to eccentric quasi-isometric muscle actions. Eur J Appl
Physiol 121: 141-158, 2021.
DJO: 80%,
ARN: 6%,
AGS: 4%,
SND: 5%,
JBC: 5%
Chapter 10. Oranchuk DJ, Diewald SN, McGrath JW, Nelson AR, Storey
AG, and Cronin JB. Kinetic and kinematic profile of eccentric quasi-
isometric loading. Sports Biomech Ahead of print, 2021.
DJO: 80%,
SND: 8%,
JWM: 4%,
ARN: 2%,
AGS: 2%,
JBC: 4%

xiv
We, the undersigned, agree to the percentages of participation to the aforementioned chapters.
Supervisors
Prof John B Cronin
PhD
Primary
Dr Adam G Storey
PhD
Secondary
Dr André R Nelson
PhD
Tertiary
Collaborators
Prof Matt S Stock
PhD
Chapter 5
Dr Jono G Neville
PhD
Chapter 6 and 7
Prof Will G Hopkins
PhD
Chapter 8
Shelley N Diewald
PGradDip
Chapter 9 and 10
Dr Joey W McGrath
PhD
Chapter 10

xv
Acknowledgments
Many people played an important role in my PhD journey and life in general. While the
time enrolled in the Doctoral program is the first to come to mind, the years prior must be
recognized. To my mom, you have demonstrated so much love and strength. You always made
me believe that I could accomplish whatever I wanted if I was willing to put in the required
efforts. Dad, your work ethic, and quiet, steady determination over the years have been
influential. When life is hard, and I felt like complaining or quitting, I thought about what you
might do. The answer was to keep my eyes on the prize, and work until it got a little closer. I
miss our cross-country road trips, and I look forward too many more! Maria, you are a
wonderful person, it is hard to imagine anyone more generous than you. Grandma, you are a
very special woman, and one of the most consistent presences in my life. Never once have you
wavered from your positive outlook, loving words, or generosity towards anyone in need.
The road to AUT, SPRINZ, and my Doctoral journal was full of twists and turns.
Michael Souster, you offered me my first job in the field, and introduced me to applied sports
science and strength and conditioning. The start of my post-secondary education was shaky, to
say the least, mostly due to a lack of direction, motivation, and apparent relevance to my future
goals. Professor Mark Lafave, your kind, yet no-nonsense approach during my first year at
Mount Royal College was critical to my future academic success. To Doug Crashley and Andre
Benoit, your support and encouragement after my stint at the Canadian Sport Institute led to
one of the most enjoyable and valuable summers of my life. Coaching at Prentiss Hockey
Performance on the other side of the continent was my first time away from Calgary, where I
made many friends and memories. I never would have made it to Adams State University if
not for my friend and fellow strength coach, Jason Mannerberg. Thank you for helping me find
a master’s program and bringing me to Colorado; I would never have had the opportunity to
make so many treasured memories. Professor Tracey Robinson not only were you a fantastic
master’s supervisor, but you also gave me my first opportunity to teach at a University level,
thus changing my career arc towards academia. Eric Birch, I am so happy for your
accomplishments and value your support and deep conversations; you are a friend for life.
Alamosa can be cold and lonely, especially during the Christmas break when nearly everyone
leaves except the Canadian graduate student who lost his passport. It was during these times
when Professor Ed Crowler welcomed me into his home and treated me like family. I will never
forget our mornings of ‘heavy weights and high rates of force development’ followed by

xvi
‘copious amounts of animal protein’. While applying to doctoral programs, I was lucky enough
to utilize my education and expand my knowledge and experiences back at the University of
Calgary. Thank you, Professor Gui Millet, for the privilege of joining the Neuromuscular
Fatigue Laboratory. Not only did we publish papers and build my curriculum vitae, but the
time in your lab prepared me to succeed at AUT. I am also thankful to my lab partners and
friends, Professor Gustavo Mota, and Doctor Jerome Koral. I loved my time with the Dino’s
football team. The coaches and support staff were all amazing and I learned so much. To each
student and athlete whom I had the pleasure of working with, I wish you all the best.
SPRINZ and AUT Millennium are home to advanced sports science and strength and
conditioning facilities, but more importantly, to amazing people. To Professor John Cronin,
from our first video call, nearly 2 years before I arrived in New Zealand, I knew that you would
be a fantastic supervisor. You have a way of leading your students towards the important
questions and answers, without taking over. I always felt respected, valued, and appreciated,
and I hope you felt the same. I appreciate all of the little conversations about life, and I look up
to you as a researcher and a man. Adam Storey, your hands-on experience was invaluable
during our projects, and your humour and wit were always refreshing. Thank you for all the
support and for putting me on the spot during lifting sessions.
Doctor André Nelson, you deserve a paragraph of your own. You added a terrific depth
of insight to each PhD chapter. You also provided a window into life as a lecturer at another
university, which enabled me to increase my teaching experience, and exposed me to new
methods of data collection and analyses. However, allowing me to stay in your home
throughout my stay in Melbourne, especially during the Covid-19 pandemic, will never be
forgotten. Thanks for the roof over my head, a place to work, the Xbox, and the puppy to
maintain sanity. I am not sure how, but I will repay your kindness someday.
Our SPRINZ engineers, Doctor Jono Neville and Shelley Diewald were critical to the
PhD. You two are extremely valuable members of SPRINZ. The general research environment
and productivity of the department would not compare without you! ‘M.C. Guigz’, thanks for
the stimulating conversations and encouragement. Eric Harbour, you are a fantastic
collaborator, workout partner, scientist, musician, athlete, chef, and friend. You really “do all
the things”. Shout outs to Enora ‘cycopath’ Le Flao, Richard Sylvester, Sylvia North, Aaron
Uthoff, Andrew Pichardo, Lesley Sommerfield, James Forster, Joey McGrath, Josh McGeown,

xvii
Frank Bourgeois, (and many more), for the conversations, road-trips, dance-parties, barbeques,
and video game nights.
The most important piece of advice I can offer to incoming graduate students would be
to make friends with people outside of your department, and ideally outside of academia. In
this regard I was blessed to have several non-SPRINZ friends. Leslie Chisholm, you have
become one of my closest friends and I am truly grateful for our lifting sessions, barbeques,
video games nights, and of course being by your side on your wedding day! Lina’s not too
shabby either. Tracey Lambrechs, thanks for the lunches, movie nights, and mid-day walking
breaks. Adam Brakey, thanks for showing me around Auckland and pumping me up when
needed. Thanks to Ian Harris and Terry Han for your friendship, parties, and being great lifting
partners. Alice Lukas and Jaden Buckley, I cannot thank you enough for all the weekend
festivities in Melbourne. Being in a great a place with terrific people, awesome food, and cute
puppies during the monotony of lock-down can never be repaid.
Thank you to each of my collaborators, PhD, or otherwise, over the past three years,
including: Eric Drinkwater, Will Hopkins, Matt Stock, Martino Franchi, Riki Lindsay, Scott
Brown, Eric Helms, Rosie Twomey, James Wrightson, Jose Mira, Rolland van den Tillaar,
Bernardo Ide (and many more mentioned in the above paragraphs). I have learned so much
from each of you! None of this would have been possible without the financial support of the
AUT Vice-Chancellors Doctoral Scholarship. Finally, thank you to the reviewers of each
journal publication, and Professors Michael McGuigan and Anthony Blazevich for their
constructive and detailed examination of the PhD. Your time and insight are greatly appreciated
and furthered my knowledge and doctoral experience.

xviii
Ethical approvals
Ethical approval was granted by the Auckland University of Technology Ethics Committee
(AUTEC) until the 18th of September 2021.
• Ethics application 18/232: The effect of eccentric quasi-isometric training on the
muscle morphology and performance of healthy males
Ethical approval was granted by the Victoria University (Melbourne) Human Research Ethics
Committee (VUHREC) until the 1st of October 2022.
• Ethics application HRE19-110: Acute and chronic physiological, neuromuscular, and
morphological responses to eccentric quasi-isometric training.

Chapter 1
1
Chapter 1 - Introduction
Rationale and significance of the thesis
Muscle form and function are of utmost importance to ensure a high quality of life and
optimal performance. Therefore, sport and rehabilitation professionals constantly search for
new methods and applications that will improve these physiological qualities. Scientists and
practitioners are also educated and interested in the mechanistic outcomes of training
modalities, which serve to improve the evidence base of exercise physiology, biomechanics,
and motor control. While educated practitioners stay up to date with the latest research, several
training methods are commonly utilized and have significant anecdotal backing, but little to no
peer-reviewed data to support their use. Variations of eccentric and isometric resistance
training, including eccentric quasi-isometric (EQI) contractions (coined by Yuri
Verkhoshansky (377)), are such methods, with the latter providing the focus of this thesis. For
this thesis, EQIs is defined as “holding a position until isometric failure and maximally resisting
the subsequent eccentric phase”. As very little literature exists on EQIs, a background into the
morphological and neuromuscular adaptations and the importance of their biomechanical
characteristics are briefly discussed below.
Muscle morphology
Mechanical tension is produced by force generation and stretch, both of which are
effective in promoting muscular hypertrophy (308). While eccentric contractions have the
highest potential for muscular force production, isometric muscle actions can be easily
prescribed to specific points in the range of motion and are less likely to result in muscle
damage due to the less calcium ion influx into muscle cells and subsequent activation of calpain
when compared to lengthening contractions (399). Strength gains are joint-angle specific (205),
however, increases in muscular hypertrophy, at longer muscle lengths (228), tend to transfer to
all joint angles (9, 188, 250, 251). Although static contractions result in less muscle damage
and less dramatic muscular-tendinous adaptations compared to maximal eccentrics, isometrics
at long muscle lengths produce greater acute muscle damage and soreness compared to short
muscle length (11).
Cumulative tension and total workload are key determinants of hypertrophic adaptation
regardless of contraction type (236). This was demonstrated by Moore et al. (236) who

Chapter 1
2
compared the effects of load matched concentric and eccentric resistance training. Despite the
40% greater time efficiency of the eccentric training, there were no significant differences in
torque or muscle thickness adaptations between groups (236). Acute hypoxia and metabolic
stress are two additional mechanisms thought responsible for hypertrophy (207). While low
intensity single-joint isometric contractions have been found to result in blood flow restriction,
the effects of multi-joint isometric and quasi-isometric contractions have yet to be examined.
Exercise-induced muscle damage is another important factor to consider. Eccentric muscle
actions typically result in a greater degree of acute myofibril micro-trauma and delayed onset
muscle soreness as determined by elevated serum creatine kinase, myoglobin, and skeletal
troponin-1 levels (72). At least in the short term, these markers coincide with a temporary
reduction in muscle force, rate of force development, and power (72). While the
aforementioned effects of eccentric and isometric loading in isolation are known, the effects of
EQI loading on muscle morphology are not.
Contractile performance
As previously mentioned, the larger morphological and architectural adaptations
following long muscle length isometric and eccentric loading are presumably due, at least in
part to the greater degree of fascicle stretch, which results in greater muscle damage and altered
length-tension relationships (11, 59). This increase in sarcomere compliance, is demonstrated
by acute and long-term shifts in the length-tension relationship (135). These shifts are proposed
to reduce injury potential, and joint-angle-specific performance (55, 211).
Contraction duration and intent are other factors to consider when evaluating the effect
of resistance training (74). Although a variety of isometric training and exercise methods have
been described (122, 157, 305), the majority of isometric literature utilized maximally
contracting against an immovable object. Researchers have demonstrated that “yielding”
isometrics, with the intent of preventing eccentric contraction, create different fatigue and
neuromuscular characteristics compared to “pushing” isometrics with a consensus of yielding
contraction leading to faster task failure and greater antagonist and synergist activation (122,
157, 300, 305). Whether “yielding isometrics” or EQI loading/training, affects the length-
tension/torque-angle relationship are unknown and warrants investigation. As with muscle
structure and form, the potential acute and long-term changes in contractile performance,
including maximal, and joint-angle-specific outputs requires examination.

Chapter 1
3
Biomechanical profiling
As discussed above, contraction kinetics and kinematics play a major role in
determining acute morphological and performance shifts, and long-term adaptations. Several
studies have determined that fast eccentric contractions cause greater muscle damage, soreness,
and acute performance reductions, relative to slow velocities (54, 65, 66). Additionally,
researchers have examined the effects of range of motion, and contraction duration with a
consensus supporting longer time-under-tensions (164, 344), and larger ranges of motion when
aiming to improve muscle size and performance (310). Therefore, it is important to characterize
the above biomechanical variables when examining new contractions, or altered loading
parameters, including EQIs.
Potential applications
While the above factors are important to understand, implementable, practical
applications must be established. Several training models account for hypertrophy focused
periods or plans for individual exercises or sets within a training program. While heavy loading,
including supra-maximal eccentric training, offers a strong stimulus to promote muscular
growth, training volume is the most important factor (236, 308).
There is no one-size-fits-all approach to injury rehabilitation protocols. However,
injuries to any of the structures involved in force transmission require mechanical overload at
some point in the rehabilitation process. Isometric and quasi-isometric exercises are already
commonplace in the initial phases of muscular and tendon rehabilitation protocols as they allow
for tight control over the range of motion and intensity (178, 293-295, 357); likely as peak joint
forces would typically be lower than other loading strategies including eccentric contractions
or stretch-shortening cycle activity (288). Furthermore, while progressive mechanical tension
is crucial (172, 174), slow movement velocities should be prescribed to stimulate damaged
fibers (22). Therefore, the combined static and lengthening phases of EQI contractions may
serve the dual purpose of providing an analgesic effect while also stimulating connective tissue
reformation in a time-efficient manner.
Originality of the thesis
Researchers pride themselves on being on the cutting edge of knowledge. However,
athletes and practitioners often utilize training methods that have not been scientifically

Chapter 1
4
validated but are practically beneficial. Therefore, it is common for “novel” scientific findings
to confirm, contradict, or reshape what coaches had been practicing. Therefore, the topic of
EQI loading is extremely original as no current peer reviewed research, acute, long-term, or
otherwise, exists examining this hybrid contraction type. The thesis is also original as several
of the morphological, architectural, and neuromuscular evaluations are expanded and
optimized versions of pre-existing methodological approaches. This thesis is also one of the
first to use total angular impulse to match conditions, a method that may assist in similar future
research. Finally, the use of resistance-trained participants is original as the vast majority of
the relevant literature is exclusive to untrained, or ‘physically active’ populations.
Research aims
Given the above factors, the overarching research question of the thesis is: “What are
the acute, and long-term effects of EQI loading on muscle form and function?”. To address
these questions, the following aims were identified.
1) Critically review the relevant literature to determine the possible outcomes of EQI
loading and identify best practices and current methodological limitations for
performing such research.
2) Test and determine an optimized assessment battery to determine the acute and
long-term effects and adaptations to EQI loading.
3) Define the biomechanical profile of EQI contractions, while determining between-
contraction kinetic and kinematic shifts.
4) Determine the short-term effects of EQI contractions on delayed onset muscle
soreness, muscle structure, and neuromuscular performance relative to a typical
bout of eccentric contractions.
5) Compare the acute hormonal, physiological and morphological effects, and long-
term structural and neuromuscular adaptations to EQI resistance-training.
Structure of the thesis
The structure of the thesis is summarized in Figure 1.
Chapter 1
5
Figure 1. Thesis structure schematic.

6
Literature reviews
Chapters 2 and 3 present literature reviews on EQIs and adjacent training
methodologies. As there are currently no studies examining EQI loading or training, a
systematic review of isometric training, arguably the most similar established contraction type,
was performed (Chapter 2). The systematic search, critical evaluation, and synthesis of findings
aided in determining the likely effects of specific EQI relevant training variables, including
muscle length, and contraction duration, intensity, and intent. Additionally, the systematic
review provided a detailed overview of current study designs, methods, and measurements used
to determine contraction characteristics and track adaptations to the musculotendinous system
and alterations in contractile and neuromuscular performance.
With the long-term adaptations to different isometric training established, a narrative
review speculating on the biomechanical profile, and acute, short-term, and long-term effects
of eccentric quasi-isometric loading was performed (Chapter 3). A search of relevant
biomechanical, physiological, and biological scientific research was performed, synthesized,
and critically evaluated. The purpose was multi-faceted, including developing a context
relevant rationale for the value of EQI training, determining potential practical applications,
and highlighting areas for research and appropriate methods and research designs.
Methodological considerations
The literature reviews highlighted several common evaluations of muscle structure and
function, with the potential for these methods to be improved, assisting the identification of
acute changes and long-term training adaptations. Therefore, chapters 4-7 focused on the
determination of measurement variability and optimization. Thus, several regional muscle-
specific, and joint-angle-specific evaluations of muscle structure and function were examined.
Finally, while each evaluation could be useful, it was important to determine which evaluations
were most practically useful in the context of this thesis. Therefore, a correlational analysis
between several of the examined evaluations was performed (Chapter 8).
Acute and short-term effects
While gathering information, introducing EQIs to the scientific literature, and
establishing a robust battery of tests were important features of the thesis, the main purpose
was to be the first to directly study EQI loading. Therefore, a short-term investigation was
implemented to compare the effects and recovery of isotonically loaded EQIs with an impulse-

7
equated bout of isokinetic eccentric contractions (Chapter 9). The short-term study intended to
determine the effect of EQIs on contractile performance, morphological and architectural
shifts, and muscle soreness, offering a snapshot of the effects of EQIs in comparison to the
well-studied eccentric contraction. Thus, practitioners could be informed as to when, where,
and how to implement EQI training.
Chapter 10 was an acute investigation that was performed to further categorize EQI
contractions, and to better inform future training studies where possible. The purpose of the
acute session was to determine the biomechanical profile of EQI loading and to analyze
changes in the kinetic and kinematic characteristics over a series of contractions. The kinetic
and kinematic analysis would guide the implementation of EQI loading through a single session
to inform researchers as to the between-set drop in performance, informing long-term training
studies. Furthermore, the study aimed to propose total angular impulse, throughout the ROM,
as a means of tracking training load and comparing EQI loading with other training modes;
something that could be utilized when comparing contractions of all varieties.
Long-term effects
Once informed on the background scientific literature, and the short-term effects, the
final proposed study was primarily designed to determine the medium to long-term effects of
EQI training. While short-term studies are important to understanding exercise, it is difficult to
predict the long-term effects of training without performing a training intervention. Therefore,
the purpose of the proposed training intervention was to determine the effect of EQI training
on the isometric and isokinetic force-time characteristics throughout the length-tension
relationship and to examine the effects of training on region-specific muscle morphology and
architecture. Like the short-term study, isokinetic eccentric training was proposed as the second
experimental condition due to its frequent use in research and strength and conditioning circles.
As a secondary purpose, blood and biopsy measures were to be taken following the initial and
final sessions of EQIs and eccentric contractions to examine the correlation between acute
physiological shifts and long-term morphological adaptations.
Unfortunately, the Covid-19 situation forced an abrupt stop to the longitudinal study,
and the continued closure of Australian laboratories rendered the analysis of any acute blood
and biopsy measures impossible.

8
Section 1 – Review of literature

Chapter 2
9
Chapter 2 - Isometric training and long-term adaptations: Effects
of muscle length, intensity, and intent: A systematic review
Reference
Oranchuk DJ, Storey AG, Nelson AR, and Cronin JB. Isometric training and long-term
adaptations: Effects of muscle length, intensity, and intent: A systematic review. Scand J Med
Sci Sports 29: 484-503, 2019.
Author contribution
Oranchuk DJ, 80%; Storey AG, 5%; Nelson AR, 5%; Cronin JB, 10%.
Prelude
The distinct lack of literature examining eccentric quasi-isometric resistance-training,
made performing a systematic review on the topic impossible. However, the ability to collect,
evaluate and understand existing and eccentric quasi-isometric relevant data was an important
step in the process of examining the unique muscle action. Understanding these training
variables and their effects on muscular hypertrophy, neural characteristics and performance
alterations forms the base of the thesis and allows for the discovery of important questions to
be addressed in the proceeding chapters. Additionally, the systematic review was performed to
identify relevant research designs and methodologies to robustly examine training induced
physiological, musculoskeletal, and neuromuscular characteristics and adaptations. Therefore,
chapter two utilized a systematic search and review of literature to improve the understanding
of isometric training variables including muscle length, intensity, duration, and contraction
intent.

Chapter 2
10
Introduction
Resistance training is widely utilized as a component of physical preparation for
populations ranging from elite strength and power athletes to injured members of the general
public (180). Commonly documented resistance training adaptations include increased muscle
mass (79), tendon quality (76, 175, 218), strength, power, and range of motion (239), delaying
muscular fatigue (1, 350), and improving voluntary activation (3). Dynamic movements
incorporating the stretch-shortening cycle comprise the overwhelming majority of resistance
training programs (179). However, isolated concentric, eccentric and isometric contractions
have specific advantages when improving musculoskeletal properties and neuromuscular
function (58, 185, 219), and are increasing in popularity (86). Isometric contractions (where
the muscle-tendon unit remains at a constant length) and their role as a training option provide
the focus of this chapter.
Training with isometric contractions has been purported to have several advantages.
First, isometric training allows for a tightly controlled application of force within pain-free
joint angles in rehabilitative settings (140, 182). Second, isometric training provides a means
to induce force overload as maximal isometric force is greater than that of concentric
contractions (4). Third, a practitioner who understands the physical demands of a sport may be
able to utilize isometric training to focus on specific weak points in a range of motion that can
positively transfer to performance (361) and injury prevention (367). Isometric contractions
can also be used to provide an acute analgesic effect and allow for pain-free dynamic loading
(293, 295) by altering excitatory and inhibitory functions in the corticomotor pathways (131).
Additionally, isometric contractions are a highly reliable means of assessing and tracking
changes in force production (242, 243, 390). However, the ability of isometric assessments to
predict dynamic performance is questionable (242, 243, 390), despite multi-joint appraisals
showing promise (92, 168, 226, 266).
Isometric training can elicit changes in physiological qualities including muscle
architecture (9), tendon stiffness and health (188, 295), joint angle-specific torque (188, 250,
251), and metabolic functions (314). As with any mode of resistance training, several variables
can be manipulated to alter the stimulus. The most common isometric training variations
include altering joint angles (9, 35, 188, 205, 231, 250, 251, 289, 335, 353) and contraction
intensity or duration (19, 21, 32, 164, 169, 231, 314, 344, 354). Less frequently researched

Chapter 2
11
variations include contraction intent (eg. ramp vs ballistic) (32, 216, 354) and incorporating
special methods such as blood flow restriction (83, 327), vibration (104, 325), and electrical
stimulation (8). Additionally, emerging research has demonstrated unique neuromuscular
characteristics between “pushing” (i.e., exerting force against an immovable object) and
“holding” (i.e., maintaining a joint position while resisting an external force) isometric
contractions (122, 157, 299-301, 305, 320). Understanding the loading parameters that achieve
a desired adaptive response in muscle and tendon would be of benefit to practitioners.
Therefore, the purpose of this review was to systematically evaluate research directly
comparing the outcomes of isometric training variations and to provide training guidelines for
a variety of desired outcomes.
Methods
The systematic review conformed to the “Preferred Reporting Items for Systematic
Reviews and Meta-Analyses” (PRISMA) guidelines (203). Therefore, no Institutional Review
Board approval was necessary.
Literature search methodology
An electronic search was conducted utilizing MEDLINE, SPORTDiscus, PubMed, and
CINAHL databases from inception to March 2018. Key terms were searched for within the
article title, abstract, and keywords using conjunctions ‘OR’ and ‘AND’ with truncation ‘*.’
Combinations of the following Boolean phrases comprised the search terms: (Isometric train*)
AND (strength* OR stiff*); (Isometric train*) AND (muscle* OR tendon*); (Isometric train*)
AND (session* OR week*).
Inclusion and exclusion criteria
Studies were included in the review based on the following criteria: 1) full text available
in English; 2) peer-reviewed journal publications or doctoral dissertations; and 3) the study
compared two or more variations of isometric training. Studies were excluded if they; 1) were
conference papers/posters/presentations; 2) focused on small joints or muscles such as fingers
or toes; 3) primary dependent variables were related to cardiovascular health; 4) non-human
subjects; 5) in-vitro; 6) the intervention period was less than three weeks in duration, 7)
included variables such as blood restriction, vibration or electrical stimulation. Search strategy
and inclusion/exclusion results are summarized in Figure 2.

Chapter 2
12
Figure 2. Search strategy.
Quality assessment
Studies that met the inclusion criteria were assessed to determine their quality based on
established scales utilized in the fields of sport and exercise science, kinesiology, health care,
and rehabilitation. Adapted from a systematic review by Brughelli et al. (56), the scale
developed for the current review is illustrated in Appendix 1. Ten items were scored as zero
(clearly no), one (maybe), or two (clearly yes) based on this scoring rubric (56). Therefore,
each study received a quality score ranging from zero to 20. Two researchers completed the
quality assessments of each paper with a third researcher settling any discrepancies in scoring.
Statistical analysis
Percent change and Cohen’s d effect sizes (ES) were calculated wherever possible to
indicate the magnitude of the practical effect. Effect sizes were averaged across the length of

Chapter 2
13
an intervention where applicable. As recommended by Rhea (292), ESs were interpreted as:
trivial < 0.35, small = 0.35-0.80, medium = 0.80-1.50 and large > 1.5 for recreationally active
participants (292). Where possible, data were pooled and average ES change and percentage
change (pre-post) per week were calculated. All reported ESs and percentage changes are pre-
post within–group, unless otherwise stated.
Results
A total of 26 studies with a mean quality score of 14.3/20 (range = 10-18) met the
inclusion criteria for the review (Appendix 2). A total of 713 participants (463 male, 250
female) were recruited with an average sample size of 27.4 ± 28.1 (4-120). Of the accepted
investigations, the mean age of the reported participants was 24.3 ± 3.3 years (19.3-31.8); seven
studies failed to report participant mean age. Most studies (16/26) recruited untrained
participants, while the remainder (11/26) utilized “active” or “recreationally trained”
participants. None of the accepted studies examined competitive athletes or well-trained
participants. All 26 accepted investigations clearly stated independent and dependent variables,
and 10 included a non-exercise control group. The mean length of intervention was 8.4 ± 3.6
(range = 3-14) weeks, with an average of 3.5 ± 0.96 (range = 2-7) sessions per week for an
average of 28.6 ± 13.2 (range = 15-56) total training sessions. Interventions were volume
equated in 17/26 studies, while 10/26 studies included a non-exercise control group. Closed
chain movements were only utilized in three studies, whereas 23/26 utilized single joint
contractions.
Nine published journal articles and one unpublished doctoral dissertation examining
the chronic (5-12 weeks) effects of isometric training at varying joint angles fulfilled the
inclusion criteria (Table 1) (9, 35, 49, 188, 205, 250, 251, 289, 335, 353). Of the ten included
studies, eight centred on the knee extensors (9, 35, 49, 188, 205, 250, 251, 335), with two
utilizing the elbow flexors (289, 353). Six published articles examining the effect of contraction
intensity (Table 2) fulfilled the inclusion criteria (19, 21, 164, 169, 344, 396). Of these studies,
three examined plantar flexors (19, 21, 396), one examined knee extensors (344), while single
studies examined the elbow flexors (169) and extensors, respectively (164). Training variations
outside of joint position or contraction intensity were also included. These variations include;
1) intent of contraction which included “progressive” vs “rapid” (216, 389) and “explosive” vs

Chapter 2
14
“sustained” (32, 225, 354) contractions (Table 3); 2) total volume (231); 3) contraction duration
(185, 314); 4) rest period duration (385); and 5) periodization schemes (362) (Table 4).

Chapter 2
15
Table 1. Joint angle
Study, year
(quality)
Subjects
Intervention
Mechanical and neural adaptations
(p < 0.05, ES ≥ 0.50)
Performance effect
(p < 0.05, ES ≥ 0.50)
Alegre, Ferri-Morales,
Rodriguez-Casares, &
Aguado, 2014 (9)
(18/20)
Healthy, untrained
university students
M = 22
F = 7
19.3 years
Isometric knee extension
SML = 50°
LML = 90°
~74% of MVIC
8 wks, 2-3/wk
SML:
↑VL thickness at 25% and 50% muscle
length (5.2-6.1%, ES = 0.23-0.24)
↑isokinetic EMG at 60-70° (ES = 1.0)
and 50-60° (p = 0.21, ES = 0.77)
LML:
↑VL thickness at 25%, 50%, and 75%
muscle length (9-13.5%, ES = 0.31-
0.65)
↑VL pennation angle (11.7%, ES =
0.45)
SML:
↓Optimum angle (7.3%, ES = 0.91)
LML:
↑Concentric torque at 60°·s-1
(22.6%, ES = 1.1)
↑Optimum angle (14.6%, ES = 1.38)
Bandy & Hanten, 1993
(35)
(18/20)
Healthy, untrained,
university students
F = 107
23.9 years
Isometric knee extension
SML = 30°
MML = 60°
LML = 90°
100% of MVIC
8 wks, 4/wk
SML:
↑EMG at 15°, 30°, 45° and 60° vs
↑EMG in control (ES = 0.87-1.65)
MML:
↑EMG at 15°, 30°, 45°, 60° and 70° vs
↑EMG control (ES = 0.36-2.26)
LML:
↑EMG at 30°, 45°, 60°, 75°, 90°, and
105° vs ↑EMG in control (ES = 0.74-
2.28)
SML:
↑MVIC at 15°, 30°, 45° and 60° (ES
= 0.88-1.94)
MML:
↑MVIC at 15°, 30°, 45°, 60° and 75°
(ES = 1.01-2.25)
LML:
↑MVIC at 15°, 30°, 45°, 60°, 75°,
90°, and 105° (ES = 0.94-3.26)
Bogdanis et al., 2018 (49)
(15/20)
Healthy, active
university students
M = 15
21.5 ± 2.1 years
Isometric leg press
(+ countermovement jumps)
SML = 35° of knee flexion
LML = 95° of knee flexion
100% of MVIC
6 wks, 3/wk
SML:
↓Optimum angle (9.7%, ES = 1.77)
↑MVIC at 18° (22%, ES = 0.88) and
34° (57.4%, ES = 2.41)
↓RFD 0-200 ms and 0-300 ms at 80°
(11.8-13.8%, ES = 0.51-0.60)
↑RFD 0-200 ms and 0-300 ms at 18°
(40.7-45.4%, ES = 1.2-1.52) and 34°
(17.9-20.9%, ES = 0.62-0.77)
↑1-RM squat (9.6%, ES = 0.61)
↑CMJ height (7.2%, ES = 0.66)

Chapter 2
16
LML:
↑MVIC (main time effect: p = 0.028)
at all joint angles (18-98°) (~12.3%)
*↑RFD 0-300 ms at 34° (14.4%, ES
=0.52)
↑1-RM squat (11.9%, ES = 0.64)
↑CMJ height (8.4%, ES = 0.51)
Kubo et al., 2006 (188)
(11/20)
Healthy university
students
M = 9
24 ± 1 years
Isometric knee extension
SML = 50°
LML = 100°
70% of MVIC
12 wks, 4/wk
SML:
↑Quadriceps muscle volume (10%, ES
= 0.82)
↑EMG at all joint angles (3.1-7.5%, ES
= 0.25-0.44)
LML:
↑Quadriceps muscle volume (11%, ES
= 1.06)
↑Tendon stiffness (50.86%, ES = 1.22)
↓Tendon elongation (-14.01%, ES =
0.62)
↑EMG at all joint angles (7-8.84%, ES
= 0.45-0.72)
SML:
↑MVIC at 40°, 50°, 60°, 70° and 80°
LML:
↑MVIC at 40°, 50°, 60°, 70°, 80°,
90°, 100° and 110°
Lindh, 1979 (205)
(13/20)
Healthy
F = 10
26.5 years
Isometric knee extension
SML = 15°
LML = 60°
100% of MVIC
5 wks, 3/wk
SML:
↑MVIC in SML at 15° (32%)
↑MVIC at 60° (14%)
↑Con torque at 30°·s-1
LML:
↑MVIC at 15° (11%)
↑MVIC at 60° (31%)
↑Con torque at 30°·s-1
Noorkoiv, Nosaka, &
Blazevich, 2014 (250)
(17/20)
Healthy, untrained
M = 16
23.7 ± 4.0 years
Isometric knee extension
SML = 38.1 ± 3.7°
LML = 87.5 ± 6.0°
100% of MVIC
6 wks, 3/wk
SML:
↑Mid VL fascicle length (5.6%, ES =
0.63)
LML:
↑Voluntary activation at 50° (ES =
0.53) and 60° (ES = 1.02)
↑Total quadriceps muscle volume
(5.2%, ES = 0.19)
SML:
↑MVIC at 40° and 50° (8.0-14.2%,
ES = 0.34-0.54)

Chapter 2
17
↑Distal VL fascicle length (5.8%, ES =
0.33)
Noorkoiv, Nosaka, &
Blazevich, 2015 (251)
(17/20)
Healthy, untrained
M = 16
23.7 ± 4.0 years
Isometric knee extension
SML = 38.1 ± 3.7°
LML = 87.5 ± 6.0°
100% of MVIC
6 wks, 3/wk
LML:
↑Concentric torque at 30, *60, *90,
and 120°·s-1 (10.1-13%, ES = 0.55-
0.70)
Rasch & Pierson, 1964
(289)
(13/20)
Healthy, untrained
university students
M = 29
Isometric elbow flexion
Single angle = 3 sets at 90°
Multi-angle = 1 set at 60°, 90°
and 120°
100% of MVIC
5 wks, 5/wk
Sterling, 1969 (335)
(18/20)
University physical
education students
M = 120
Isometric “hip press”
SML = 25°
MML = 55°
LML = 85°
100% MVIC
7 wks, 3/wk
SML:
↑MVIC at 25° and 55° (21-37.2%)
MML:
↑MVIC at 25° and 55° (15.4-51.4%)
LML:
↑MVIC at 85° (3.1%)
Thepaut-Mathieu, Van
Hoecke, & Maton, 1988
(353)
(11/20)
Untrained
M = 24
31.8 years
Isometric elbow flexion
SML = 60°
MML = 100°
LML = 155°
80% MVIC
5 wks, 3/wk
SML, MML & LML:
↑EMG at all angles
SML:
↑MVIC at 60° and 80° (10-25%)
MML:
↑MVIC at 60-155° (22-30%)
LML:
↑MVIC at 80-155° (24-54%)
SML = short muscle length. MML = medium muscle length. LML = long muscle length. MVIC = Maximal voluntary isometric contraction. EMG = electromyography. Con
= concentric. VL = vastus lateralis, VM = vastus medialis, RF = rectus femoris. 1-RM = one-repetition maximum. CMJ = Countermovement jump. ES = effect size (Cohen’s
d). *Denotes p > 0.05.

Chapter 2
18
Table 2. Contraction intensity
Study, year
(quality)
Subjects
Intervention
Mechanical and neural adaptations
(p < 0.05, ES ≥ 0.50)
Performance effect
(p < 0.05, ES ≥ 0.50)
Arampatzis,
Karamanidis, &
Albracht, 2007 (19)
(14/20)
Healthy, untrained
university students
M = 7
F = 14
28 years
Isometric plantar flexion
LI = 55% MVIC (24 contractions)
HI = 90% MVIC (16 contractions)
14 wks, 4/wk
LI:
↑Tendon elongation (16.2%, ES = 0.56)
↑Tendon strain (17.4%, ES = 0.57)
↑Calculated maximum tendon force
(28.4%, ES = 1.76)
HI:
↑Tendon stiffness (36%, ES = 1.57)
↑Tendon cross-sectional area at 60% and
70% of tendon length
↑Calculated maximum tendon force
(43.6%, ES = 2.04)
Arampatzis, Peper,
Bierbaum, & Albracht,
2010 (21)
(14/20)
Healthy, untrained
university students
M = 11
23.9 years
Isometric plantar flexion
LI = 55% MVIC (20 contractions)
HI = 90% MVIC (12 contractions)
14 wks, 4/wk
LI:
↑Tendon elongation (14%, ES = 0.84)
↑Tendon strain (13.7%, ES = 0.67)
↑Calculated maximum tendon force
(11.7%, ES = 0.89)
HI:
↑Tendon stiffness (17.1%, ES = 0.82)
↑Calculated maximum tendon force
(11.9%, ES = 0.81)
Kanehisa et al., 2002
(164)
(16/20)
Healthy, untrained
M = 12
27.5 years
Isometric elbow extension
LI = 60% MVIC (4 x 30s)
HI = 100% MVIC (12 x 6s)
10 wks, 3/wk
LI:
↑Muscle volume (5.3%, ES = 0.26)
HI:
↑Muscle volume (12.4%, ES = 0.28)
LI:
↑MVIC (61%, ES = 1.91)
HI:
↑MVIC (60.3%, ES = 2.71)
Khouw & Herbert, 1998
(169)
(11/20)
51 untrained
university students
M = 18
F = 33
Isometric elbow flexion
Each subject assigned to an
individual intensity between 0%
and 100% in 2% increments
6 wks, 3/wk
Greater ↑MVIC (slope = 0.19, 5.3%,
p = 0.006) when training closer to
100%

Chapter 2
19
Szeto, Strauss, De
Domenico, & Sun Lai,
1989 (344)
(11/20)
University students
M = 6
F = 12
Isometric knee extension
LI = 25% MVIC
MI = 50% MVIC
HI = 100% MVIC
3 wks, 5/wk
LI:
*↑MVIC (22.3%, ES = 0.61)
MI:
↑MVIC (31.3%, ES = 1.14)
HI:
↑MVIC (45.7%, ES = 1.44)
Young, McDonagh, &
Davies, 1985 (396)
(12/20)
Healthy
M = 4
20.5 years
Isometric plantar flexion
LI = 30% MVIC (7-15 x 60s)
HI = 100% MVIC (3s contractions
HI, 5 wks; and LI, 8 wks, 7/wk
LI:
↑MVIC (3.3%/wk)
↑MVIC (30.2%, ES = 2.22)
↑Fatigue index (19.4%, ES = 1.72)
HI:
↑MVIC (5.5%/wk
↑MVIC (21.2%, ES = 1.67)
LI = low intensity. MI = medium intensity. HI = high intensity. MVIC = maximal voluntary isometric contraction. ES = effect size (Cohen’s d). *Denotes p > 0.05.

Chapter 2
20
Table 3. Contraction intent
Study, year
(quality) Subjects Intervention
Mechanical and neural adaptations
(p < 0.05, ES ≥ 0.50)
Performance effect
(p < 0.05, ES ≥ 0.50)
Balshaw, Massey,
Maden-Wilkinson,
Tillin, & Folland, 2016
(32)
(15/20)
Healthy, untrained
M = 43
Isometric knee extension
MST = 1s build to 75% of
MVIC, hold for 3s (40
contractions)
EST = rapidly built to ≥ 80%
of MVIC and hold for 1s (40
contractions)
12 wks, 3/wk
MST:
↑Muscle volume (8.1%, ES = 0.50)
↑EMG at MVIC (27.8%, ES = 0.67)
↑EMG 0-150 ms (14.3%, ES = 0.36)
EST:
↑EMG 0-100 and 0-150 ms (12.5-31.3%,
ES = 0.26-0.67)
MST:
↑MVIC (23.4%, ES = 1.19)
↑Force at 150 ms (12.1%, ES = 0.74)
EST:
↑MVIC (17.2%, ES = 1.24)
↑Force at 50, 100, 150 ms (14.4-
32.6%, ES = 0.65-1.06)
Maffiuletti & Martin,
2001 (216)
(17/20)
Healthy untrained
M = 21
Isometric knee extension
RC = 4 seconds to reach
MVIC
BC = 1 second to reach MVIC
7 wks, 3/wk
RC:
↓VL EMG
BC:
↑Peak twitch (29.8%)
↓Contraction time
↓Maximal twitch relaxation
RC:
↑MVIC at 55°, 65° (15.7%) and 75°
↑Eccentric torque at 60°.s-1 (15.6%)
↑Concentric torque at 60°.s-1 and
240°.s-1
BC:
↑MVIC at 55°, 65° (27.4%) and 75°
↑Eccentric torque at 60°.s-1 (18.3%)
↑Concentric torque at 60°.s-1 and
240°.s-1
Massey, Balshaw,
Maden-Wilkinson,
Tillin, & Folland, 2018
(225)
(18/20)
Healthy untrained
M = 42
MST = 25 ± 2 years
EST = 25 ± 2 years
CON = 25 ± 3 years
Isometric knee extension
MST = 1s build to 75% of
MVIC, hold for 3s (~ 10
contractions)
EST = rapidly built to ~80%
of MVIC (~ 10 contractions)
12 wks, 3/wk
MST:
↑Muscle volume (8.1%, ES = 0.47)
↑VL aponeurosis area (5.9%, ES = 0.34)
↑Tendon stiffness (14.3%, ES = 0.79)
↑Young’s modulus (14.4%, ES = 0.60)
↑Tendon-aponeurosis stiffness (22.7%,
ES = 0.54)
EST:
↑VL aponeurosis area (4.4%, ES = 0.38)
↓Tendon CSA (2.8%, ES = 0.31)
↓Tendon elongation (11%, ES = 0.75)
↑Tendon stiffness (19.9%, ES = 0.95)
MST:
↑MVIC (23.6%, ES = 1.17)
EST:
↑MVIC (16.7%, ES = 1.23)

Chapter 2
21
↓Tendon strain (11.8%, ES = 0.56)
↑Young’s modulus (21.1%, ES = 1.13)
↑Tendon-aponeurosis elongation (16%,
ES = 1.0)
Tillin & Folland, 2014
(354)
(12/20)
Healthy, recreationally
active male university
students
N = 19
MST = 20.9 ± 1.1 years
EST = 20.2 ± 2.4 years
Isometric knee extension
MST = 1s build to 75% of
MVIC, hold for 3s (10
contractions)
EST = rapidly built to ≥ 90%
of MVIC and hold for 1s (10
contractions)
4 wks, 4/wk
MST:
↑M-wave at MVIC (28.1%, ES = 1.28)
↓%EMG at 50 and 150 ms (11.7-22.1%,
ES = 0.59-0.79)
EST:
↑M-wave at 50 and 100 ms (25-42%, ES
= 0.95-1.05)
MST:
↑MVIC (20.5%, ES = 1.46)
↑MVIC at 50, 100 and 150 ms (3.09-
7.39%, ES = 0.084-0.52)
EST:
↑MVIC (10.6%, ES = 0.56)
↑MVIC at 50, 100 and 150 ms (13.1-
53.7%, ES = 0.96-1.2)
Williams, 2011 (389)
(15/20)
Healthy, untrained
university students
M = 11
F = 12
Ramp = 9
Ballistic = 8
22.8 years
Isometric knee extension
RC = 4 seconds to reach
MVIC
BC = 1 second to reach MVIC
6 wks, 3/wk
RC:
↑Ramp VA (7.7%, ES = 1.99)
↑Ballistic VA (8.3%, ES = 1.75)
*↑150 ms VA (9.82%, ES =0.74)
BC:
↑Ramp VA (4.1%, ES = 1.07)
↑Ballistic VA (7.9%, ES = 1.50)
↑150 ms VA (31.6%, ES = 1.84)
RC:
↑Ramp MVIC (20%, ES = 1.95)
↑Ballistic MVIC (17.8%, ES = 1.56)
*↑150 ms force (14.3%, ES = 1.10)
BC:
↑Ramp MVIC (15.7%, ES = 0.75)
↑Ballistic MVIC (18.9%, ES = 0.88)
↑150 ms force (48.8%, ES = 3.66)
MST = maximal strength training. EST = explosive strength training. RC = ramp contraction. BC = ballistic contraction. MVIC = maximal voluntary isometric contraction.
VA = voluntary activation. EMG = electromyography. ES = effect size (Cohen’s d). *Denotes p > 0.05.

Chapter 2
22
Table 4. Other independent variables
Study, year
(quality)
Subjects
Intervention
Mechanical and neural adaptations
(p < 0.05, ES ≥ 0.50)
Performance effect
(p < 0.05, ES ≥ 0.50)
Kubo, Kanehisa, &
Fukunaga, 2001 (185)
(14/20)
Healthy, untrained
M = 8
22.6 years
Isometric knee extension
SC = 3 x 50 rapid contractions
LC = 4 x 20s
70% MVIC
12 wks, 4/wk
SC:
↑Muscle volume (7.4%, ES = 0.36)
*↑Tendon stiffness (17.5%, ES = 0.57)
↑Elastic energy (25.6%, ES = 1.85)
LC:
↑Muscle volume (7.6%, ES = 0.38)
↑Tendon stiffness (57.3%, ES = 1.38)
↑Elastic energy (12%, ES = 0.58)
SC:
↑MVIC (49%, ES = 2.47)
LC:
↑MVIC (41.6%, ES = 2.21)
Meyers, 1967 (231)
(13/20)
Healthy university
students
M = 29
Isometric elbow flexion
LV = 3 x 6s
HV = 20 x 6s
100% MVIC
6 wks, 3/wk
LV:
↑Muscle girth at 170° in trained arm
HV:
↑Muscle girth at 170° in trained and
untrained arm
↑Muscle girth at 90° in trained arm
LV:
↑MVIC at 170° (15.4%, ES =
0.93)
*↑Muscle endurance (49.7%, ES =
0.71)
HV:
↑MVIC at 170° (15.5 %, ES =
0.46)
*↑MVIC at 90° (9%, ES = 0.50)
↑Muscle endurance (42.7%, ES =
0.67)
Schott, McCully, &
Rutherford, 1995 (314)
(10/20)
Healthy, untrained
M = 1
F = 6
22.7 years
Isometric knee extension
SC = 4 x 10 x 3s
LC = 4 x 30s
70% of MVIC
14 wks, 3/wk
LC:
↑Muscle anatomical cross-sectional area
at lower (11.1%) and upper (10.1%)
femur
SC:
↑MVIC (31.5%)
↑Concentric torque at 120°·s-1 and
180°·s-1 (11.3-11.6%
LC:
↑MVIC at 90° (54.7%)
Ullrich, Holzinger,
Soleimani, Pelzer, Stening,
& Pfeiffer, 2015 (362)
(16/20)
Healthy, active
university students
F = 10
24.4 ± 3.2 years
Isometric knee extension
TP limb = 3 wks 60%, 4 wks
80%, 3 wks 60%, 2 wks 80% of
MVIC
TP:
↑Thigh circumference (6.2%, ES = 0.45)
↑VL thickness at 25%, 50%, and 75%
muscle length (15.5-18.5%, ES = 0.98-
1.23)
↑VL fascicle length (13.7%, ES = 1.17)
TP:
↑IMVC (24%)
↑Concentric torque at 60°.s-1
(19%)
DUP:
↑IMVC (23%)

Chapter 2
23
DUP limb = Alternating
sessions at 60% and 80% of
MVIC in one limb
16 wks, 2/wk
↑IMVC EMG (45%)
DUP:
↑Thigh circumference (5.0%, ES = 0.37)
↑Vastus lateralis thickness at 25%, 50%,
and 75% muscle length (12.4-19.7%, ES
= 0.72-1.01)
↑Vastus lateralis fascicle length (14.2%,
ES = 0.90)
↑IMVC EMG (46%)
↑Concentric torque at 60°.s-1
(15%)
Waugh, Alktebi, De Sa, &
Scott, 2018 (385)
(14/20)
Healthy, physically
active
M = 8
F = 10
30.1 ± 7.9 years
Isometric plantarflexion
SR = 3s between reps
LR = 10s between reps
90% MVIC
12 wks, 3/wk
SR:
↑Echo-type II (collagen re-organization)
SR & LR:
↑Stiffness
↑Tendon stress
↑Young’s modulus
↓Strain %
↓Tendon elongation
SR & LR:
↑MVIC
SC = short contraction. LC = long contraction. LV = low volume. HV = high volume. SR = short rest. LR = long rest. EMG = electromyography. TP = traditional periodization.
DUP = daily undulating periodization. MVIC = maximal voluntary isometric contraction. ES = effect size (Cohen’s d). *Denotes p > 0.05.

Chapter 2
24
When synthesising statistically significant findings, measures of muscular size
increased in nine studies (5-19.7%, ES = 0.19-1.23) by 0.84%·week-1 and 0.043 ES·week-1 (9,
32, 164, 185, 188, 225, 250, 314, 362). Maximal isometric force significantly increased in 14
studies (8-60.3%, ES = 0.34-3.26) by 4.34%·week-1 and 0.20 ES·week-1 (32, 35, 49, 164, 205,
216, 225, 250, 335, 344, 353, 354, 389, 396). The comparison between joint angle and
hypertrophic adaptation (n = 3 studies) revealed that training with joint angles ≤ 70º (46 ± 6.9º)
improved muscle size by an average of 0.47 ± 0.48%·week-1 and 0.032 ± 0.037 ES·week-1,
compared to 1.16 ± 0.46%·week-1 and 0.067 ± 0.032·week-1 when training at > 70º of flexion
(Figure 3) (9, 188, 250). When comparing the nine studies that reported training joint angle
and hypertrophic adaptations, training with joint angles ≤ 70º (59.8 ± 11.1º) improved muscle
size by an average of 0.61 ± 0.42%·week-1 and 0.045 ± 0.034 ES·week-1, compared to 0.88 ±
0.8%·week-1 and 0.046 ± 0.027 ES·week-1 when training at > 70º (88.6 ± 6º) of flexion
(Appendix 3) (9, 32, 164, 185, 188, 225, 250, 314, 362). The comparative effects of training
intensity on muscular hypertrophy were that intensities ≤ 70% (68.9 ± 3.3%) of MVIC
improved muscle size by 0.77 ± 0.26%·week-1 and 0.13 ± 0.12 ES·week-1, compared to 0.70 ±
0.55%·week-1 and 0.13 ± 0.21 ES·week-1 when training at > 70% (85.3 ± 12%) of MVIC
(Figure 4) (9, 32, 164, 185, 188, 225, 250, 314, 362). The comparisons of training intensity and
improvements in isometric force (n = 3 studies) found that training at ≤ 70% (41.3 ± 16.5%) of
MVIC improved muscle size by 6.8 ± 3%·week-1 and 0.32 ± 0.13 ES·week-1, compared to 8.9
± 5.5%·week-1 and 0.36 ± 0.11 ES·week-1 when training at > 70% (100 ± 0%) of MVIC (Figure
5) (164, 344, 396). The joint angle-isometric force comparison (n = 7) showed that training at
≤ 70º (42.8 ± 16.4º) resulted in MVIC improvements of 4 ± 2.1%·week-1 and 0.15 ± 0.1
ES·week-1, compared to 3.4 ± 4.2%·week-1 and 0.15 ± 0.17 ES·week-1 when training at > 70º
(101.8 ± 24.2º) of flexion (Appendix 4) (35, 49, 188, 205, 250, 335, 353).
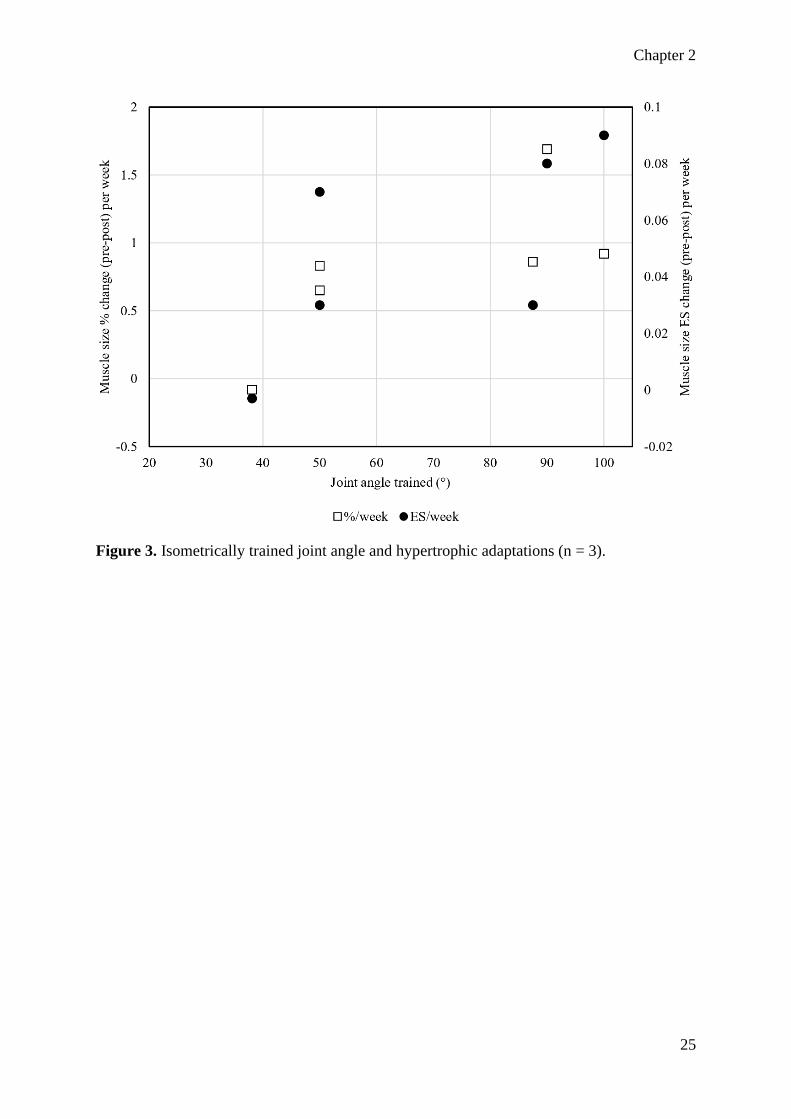
Chapter 2
25
Figure 3. Isometrically trained joint angle and hypertrophic adaptations (n = 3).

Chapter 2
26
Figure 4. Isometric training intensity and hypertrophic adaptations (multiple comparison. n =
9).

Chapter 2
27
Figure 5. Isometric training intensity and force production (n = 3).
Discussion
Morphological adaptations
Adaptations to the physical structure of tissues can be caused by several factors,
including mechanical, metabolic, and hormonal factors, and often results in altered function.
The morphology of the musculoskeletal system is of relevance to this review and provides the
focus for subsequent discussion.
Muscle volume
While most methods of progressive resistance training can result in increased muscular
size, it is important to understand how to optimally alter variables including intensity,
frequency, and duration of each training method for maximal efficiency. Isometric resistance

Chapter 2
28
training has been demonstrated to induce significant hypertrophy (9, 32, 164, 185, 188, 231,
250, 314).
When comparing adaptations in muscle volume between isometric training variations
several patterns emerged, conforming to accepted dynamic training principles. Of the studies
comparing isometric training at differing joint angles (Table 1), only three evaluated muscle
volume or thickness (9, 188, 250). All three studies found that isometric training at long muscle
lengths (LML) was superior to equal volumes of training at short muscle lengths (SML) for
increasing muscle size (9, 188, 250). These findings are not surprising as a large portion of the
existing literature has demonstrated that dynamic training through a large range of motion is
beneficial when hypertrophy is desired (36, 136, 224). Additionally, contractions at LML tend
to produce higher quantities of muscle damage, likely by altering the joint moment arm and
increasing mechanical tension when compared to a SML (11). Contractions at LML also result
in greater blood flow occlusion, rates of oxygen consumption, and metabolite build-up when
compared to SML contractions (83). These metabolic factors are well established to contribute
to muscular hypertrophy (82, 207).
While volume equated isometric training leads to greater improvements in hypertrophy
when performed at LML (9, 250, 251), the magnitude of hypertrophy was not significantly
different in any of the seven included studies investigating/reporting training intensity (9, 32,
164, 185, 188, 250, 314). Interestingly, the pooled data of included study outcomes suggest
that training intensity has a small effect on hypertrophy, and explains little of the variation in
hypertrophic adaptation (Figure 4). For example, Kubo et al. (185) compared the effects of load
equated isometric contractions held for short (~1 s) or long (20 s) periods. While both long and
short duration contractions led to small, but significant increases muscle thickness, there was
little difference (p > 0.05) between groups (7.6%, ES = 0.38, p = 0.023 vs 7.4%, ES = 0.36, p
= 0.018) (185). Similarly, Kanehisa et al. (164) employed ten weeks of volume equated
isometric training at either low (60%) or high (100%) intensity. While both low and high-
intensity training programs significantly increased triceps brachii hypertrophy, there was no
statistical between-group difference (p = 0.061) in anatomical cross-sectional area (low: 12.1%,
ES = 1.72 vs high: 17.1%, ES = 1.65) (164). However, high intensity training had a greater
effect on muscle volume than the lower intensity (12.4%, ES = 0.28 versus 5.3%, ES = 0.26; p
= 0.039) despite nearly identical ESs (164). These findings are in close agreement with recent
studies and meta-analyses that concluded that hypertrophic adaptations are similar if the total

Chapter 2
29
load is equated and training intensity is greater than 20% of maximal voluntary contraction
(196, 312).
When the training volume is not equated between groups, it seems higher volumes are
better for inducing muscular hypertrophy, regardless of contraction intensity. Meyers (231)
compared low (3 x 6-s MVIC) and high (20 x 6-s MVIC) volume isometric training of the
elbow flexors. Following the six-week intervention, the high-volume training program resulted
in significantly greater improvements in muscle girth compared to the low volume group (p <
0.05). Similarly, Balshaw et al. (32) and Massey et al. (225) compared “maximal strength” (40
x 3-s contractions, 75% of MVIC) and “explosive” (40 x 1-s contractions, 80% of MVIC)
isometric training. Following the 12-week interventions, the “maximal strength” training
groups experienced significant improvements in quadriceps muscle volume (8.1%, ES = 0.50,
p = 0.001) whereas the “explosive” training groups (2.6%, ES = 0.17-0.26, p = 0.195-0.247)
did not (32). Furthermore, the difference between groups was statistically significant (p < 0.05)
(32, 225). Interestingly, Schott, McCully, and Rutherford (314) found that long duration (4 x
30-second MVIC) contractions resulted in greater hypertrophic adaptations when compared to
short (4 sets x 10 x 3-second MVIC) duration contractions despite total time-under-tension
being equated between groups. Following 14 weeks, the long duration contraction group
significantly (p = 0.022) improved vastus lateralis anatomical cross-sectional area at the
proximal (10.1%) and distal (11.1%) portion of the femur, whereas no significant hypertrophic
adaptations were observed in the short duration group (p > 0.05) (314). Schott, McCully, and
Rutherford’s (314) findings are somewhat surprising as both groups underwent the same time-
under-tension. However, sustained contractions are known to restrict blood flow, reduce
muscle oxygen saturation and increase metabolite concentrations in the muscle (7, 333)
stimulating hypertrophy via multiple local and systemic mechanisms (82, 207). Additionally,
muscle contractions at LML consume more oxygen (83), which may in-part explain the
advantage of LML training when muscular hypertrophy is the primary goal.
Muscle architecture
Unlike changes in muscle volume, which is highly dependent on total training volume,
there are demonstrable differences between contraction type and alteration in fascicle length
and pennation angle (111). To date, very few studies have compared the effect of isometric
resistance training variations on changes in muscle architecture; of those that have, results are
equivocal. Noorkoiv, Nosaka, and Blazevich (250) compared isometric training at SML (38.1

Chapter 2
30
± 3.7° knee flexion) and LML (87.5 ± 6° knee flexion). Interestingly, the vastus lateralis
fascicle length at the mid-portion of the femur significantly increased following SML (5.6%,
ES = 0.63, p = 0.01), but not LML (3.8%, ES = 0.34, p = 0.20) training (250). Conversely,
LML (5.8%, ES = 0.33, p = 0.02) significantly (p = 0.01) outperformed SML training (-1.1%,
ES = 0.04, p > 0.05) for increasing distal fascicle length of the same muscle (250). Furthermore,
LML training resulted in greater (p < 0.01) physiological cross-sectional areas in three of the
four quadriceps muscles, whereas the SML training did not (p > 0.05) (250). Only one other
isometric training comparison study reported meaningful changes in muscle architecture, and
found that vastus lateralis pennation angle increased following LML (10.6%, ES = 0.45, p =
0.038), but not SML training (6.5%, ES = 0.46, p = 0.076) (9). However, Alegre et al. (9) only
measured the vastus lateralis pennation angle at the midpoint of the femur and potentially
missed out on possible adaptations at the distal portion of the muscle.
Tendon morphology
The primary function of the tendon is to transfer forces between bone and muscle,
facilitating joint motion (218). Although originally assumed to be inert, tendinous structures
can experience adaptations and are capable of significant architectural adaptations from
habitual loading and injury (76, 175, 187, 217, 218, 291). Injured tendons tend to be less stiff,
despite increased thickness (24) due to a shift in viscoelastic properties (218). Additionally,
tendinopathy negatively affects tendon structure, leading to increased vascularization and
overall thickness (24, 218). Although long-term alteration in tendon morphology is minimal in
healthy, mature human tissue (218), tendons can increase in stiffness to optimize the time and
magnitude of force transmission between muscle and bone (76, 175, 291). Conversely, healthy
increases in tendon thickness and stiffness in response to exercise, are region specific and may
have rehabilitative, pre-habilitative, and performance benefits (76, 175, 217, 291, 293). For
instance, heavy (resistance) training can lead to an increase in maximal muscular force and rate
of force development by increasing tendon stiffness, thus reducing the electromechanical delay
(184, 187, 218). Additionally, increased tendon stiffness through chronic loading can be due to
increased tendon cross-sectional area without alterations in viscoelastic properties, potentially
improving safety when performing ballistic movements (218). While widely used in
rehabilitation settings, there is a general lack of information regarding what isometric training
variables are important for triggering specific tendonous adaptations.

Chapter 2
31
Of the studies included in this review, only six directly assessed tendon structure or
function. Two studies compared contraction intensity (19, 21), with others examining the
effects of contraction length (185), intent (225), rest periods (385), and joint angle (188).
Arampatizis et al. (19, 21) compared 14-week training programs consisting of volume equated
isometric plantar flexion at low (~55%) or high (~90%) intensities. Both investigations found
increased Achilles tendon cross-sectional area and stiffness following high (17.1-36%, ES =
0.82-1.57, p < 0.05), but not low (-5.2-7.9%, ES = 0.26-0.37, p > 0.05) intensity training (19,
21). Furthermore, tendon elongation under stress (an indication of elasticity) increased
following low (14.0-16.1%, ES = 0.56-0.84, p > 0.05), but not high (-1.4-3.9%, ES = 0.06-
0.20, p > 0.05) intensity training (19, 21). Additionally, the included studies only compared
isometric training at ~55% and 90% of MVIC which leaves a large range of potential
intensities. However, previous interventions have reported large increases (17.5-61.6%, ES =
0.57-4.9, p < 0.05) in tendon stiffness following training between 70-100% of MVIC (58, 184,
185). Therefore, it might be that a minimum intensity of ~70% MVIC is required to induce
meaningful changes in tendon thickness and stiffness.
While only a single study has examined the effect of isometric training at different
muscle lengths on tendon adaptation (188), the results tend to support a paradigm of LML
training being superior to SML training. Kubo et al. (188) trained the knee extensors at either
50° or 90° of flexion and observed a significantly greater increases in tendon stiffness (p =
0.021) following LML (50.9%, ES = 1.22, p = 0.014), when compared to SML training (6.7%,
ES = 0.26, p = 0.181). Similarly, distal tendon and deep aponeurosis elongation decreased
following LML training (-14%, ES = 0.62, p = 0.034), whereas the SML group experiences a
trivial increase (3.9%, ES = 0.15, p > 0.05). When comparing isometric contraction duration
and tendon adaptations, only a single study exists (185). While both long (57.3%, ES = 1.38, p
= 0.003) and short (17.5%, ES = 0.57, p = 0.217) contraction durations increased tendon
stiffness, a significant between-group difference was reported (p = 0.045) (185). Additionally,
no significant differences in tendon elongation were present in either long (-2.2%, ES = 0.19,
p > 0.05) or short (4.1%, ES = 0.29, p > 0.05) contraction duration groups. Similarly, calculated
elastic energy absorption increased in both long (12%, ES = 0.58, p = 0.007) and short (25.7%,
ES = 1.85, p = 0.002) duration groups with no significant difference between groups (p = 0.056)
despite large differences in percent change and ESs along with a relatively low p-value. While
the total time-under-tension was equalized between groups, the one-second duration of the
short contraction group meant that a larger relative proportion of each effort would be spent

Chapter 2
32
building isometric force. Therefore, the maximal-force time-under-tension was not equalized
(185). Similar to muscle tissue, tendon adaptations are responsive to chronic changes in total
mechanical load (76, 141, 142); therefore, the potentially greater load in the long contraction
group could explain the discrepancy in tendonous adaptations.
Massey et al. (225) were the only researchers to compare contraction intent on
morphological tendon adaptations. Both “maximal strength training” and “explosive strength
training” produced significant improvements in vastus lateralis aponeurosis area (5.9%, ES =
0.34 vs 4.4%, ES = 0.38), Young’s modulus (14.4%, ES = 0.60 vs 21.1%, ES = 1.13) and
tendon stiffness (14.3%, ES = 0.79 vs 19.9%, ES = 0.95) (225). However, only the “explosive
strength training” group experienced significant increases in tendon-aponeurosis complex
elongation (16%, ES = 1.0 vs -2.96, ES = 0.10) and decreased tendon cross-sectional area (-
2.8%, ES = 0.31 vs 0.41%, ES = 0.03), tendon elongation (-11%, ES = 0.75 vs -4.95%, ES =
0.27) and tendon strain (-11.8%, ES = 0.56 vs -4.17, ES = 0.19) (225). Therefore, intent and
rate of contraction appear to be an important training consideration. Lastly, Waugh et al. (385)
compared load equated isometric plantar flexions with intra-contraction rest periods of three,
or 10 seconds. While there were differences (p > 0.05) in type-I and type-II collagen (factors
in fibre re-organization) (87, 373), there were no between-group discrepancies (p > 0.05) in
any other dependent variables following the 14-week intervention (385). These data support a
paradigm of a threshold intensity for mechanical loading to achieve tendon adaptations (141,
142).
Neurological adaptations
Of the 26 studies included in this review, 12 directly measured neural function (9, 32,
35, 185, 188, 216, 250, 353, 354, 385, 389, 396). Of these 12 studies, it is notable that one did
not report any neurological data in their results (385), while two reported no significant changes
following training, regardless of the condition (185, 396). When examining electromyographic
amplitude assessed through electromyography (EMG), a clear trend existed between the studies
comparing isometric training at different muscle lengths. Electromyographic amplitude tends
to increase by larger magnitudes and over a larger range of joint angles following LML training,
compared to training at SML. For example, Bandy and Hanten (35) examined isometric knee
extension training at SML (30°), medium muscle length (MML; 60°), and LML (90°),
assessing EMG amplitude at seven joint angles from 15-105° of flexion. Medium to large (ES
= 0.74-2.28) improvements at six joint angles were observed following LML training, whereas

Chapter 2
33
MML and SML training only improved EMG activity at five (ES = 0.36-2.26), and four (ES =
0.87-1.65) of the assessed joint angles, respectively (35). Similarly, Kubo et al. (188) observed
larger increases in EMG activity at all measured angles following LML (7-8.8%, ES = 0.45-
0.72) compared to SML (3.1-7.5%, ES = 0.25-0.44) training. Conversely, Alegre et al. (9)
reported an increase in EMG amplitude in favor of the SML training group, the only
investigation to do so. Although the magnitude of increases in EMG amplitude were medium-
large, the changes were limited to 50-60° (ES = 0.77, p = 0.205) and 60-70° (ES = 1.00, p =
0.36) of knee flexion during isokinetic knee extensions (9). These findings are consistent with
the findings of other investigations in that alterations in EMG amplitude are most specific at
shorter muscle lengths (36, 224, 353).
All four studies comparing the effects of isometric training with different contraction
intents (ballistic vs ramp) assessed neurological and neuromuscular adaptations via EMG and
peripheral nerve stimulation (32, 216, 354, 389). As expected, adaptations were specific to the
intent utilized in training. For example, Balshaw et al. (32) examined the effects of 12 weeks
of “maximal strength training” (1-s build to ~75% of MVIC and maintain for 3-s), with
“explosive strength training” (rapid build to ≥ 90% of MVIC and maintain for 1-s). The
improvements in EMG amplitude at MVIC were larger (ES = 0.36, p = 0.370) following
“maximal strength training” (27.8%, ES = 0.67, p < 0.001) compared to “explosive strength
training” (19.1%, ES = 0.44, p = 0.099). Conversely, “explosive strength training” (31.3%, ES
= 0.67, p = 0.003) increased EMG activity to a greater (p < 0.001) degree during the 0-100 ms
and 0-150 ms period of muscle contraction compared to “maximal strength training” (14.3%,
ES = 0.36, p = 0.009) (32). Additionally, only the rapid contraction group significantly
increased EMG amplitude in the first 100 ms of muscle contraction (12.5%, ES = 0.26, p =
0.048) (32). Similarly, previous investigations examining contraction intent found greater
improvements in EMG amplitude during MVIC with maximal strength training (1.28-
7%·week-1, ES = 0.06-0.33·week-1) when compared to explosive strength training (0.68-
1.31%·week-1, ES = 0.18-0.25·week-1) (216, 354, 389). Furthermore, participants training with
a ballistic intent (1.04-10.5%·week-1, ES = 0.26-0.31·week-1) achieved greater improvement in
EMG amplitude during the initial 150 ms of maximal contraction when compared to ramped
contractions (2.93-5.53%·week-1, ES = 0.03-0.07·week-1) (32, 216, 354, 389). These findings
support the principle of training specificity as only the groups who intended to produce force
quickly, improved in that regard.

Chapter 2
34
Performance enhancement
Isometric training is commonly prescribed in rehabilitation settings, or early in physical
preparation plans to increase neuromuscular, musculoskeletal, and proprioceptive function. It
is thought that the aforementioned improvements will later transfer to dynamic performance
once specific movement patterns are integrated into the physical preparation plan. Despite
existing literature reporting the benefits of isometric training on multi-joint dynamic
performance (58, 184, 189), none of the studies included in the current review included
dynamic multi-joint assessments.
Isometric peak force
Only four studies included in the present review directly compared MVIC production
between groups training at different intensities (164, 169, 344, 396). Isometric peak force is
considered a highly reliable measure, with a growing body of research reporting the validity of
isometric measurements for assessing health and athletic performance (92, 388). While training
specificity is a major factor in performance improvements, if MVIC force is the desired
outcome there does not appear to be a clear advantage to training at high or low intensities
(Figure 5). Szeto et al. (344) was the only study that reported statistically significant
improvements in MVIC force in some, but not all training groups. Szeto et al. (344) had
subjects train their knee extensors at 25%, 50%, or 100% of MVIC. Following 15 sessions over
three weeks, the group training at 25% did not experience statistically significant strength
improvements despite medium effect sizes (22.3%, ES = 0.61, p = 0.085) (344). Conversely,
large and statistically significant improvements were observed when training at 50% (31.3%,
ES = 1.14, p = 0.002) and 100% (45.7%, ES = 1.44, p = 0.013) of MVIC (344). However, time-
under-tension, not total load, was equalized between groups, meaning that the 50% training
group produced twice as much total force as the 25% group. While no data about fatigue is
presented, it could be hypothesized that the group training with maximal effort underwent
significantly greater loading than the other groups (344). Additionally, the inclusion of
perceived effort or a fatigue scale may have been valuable.
A clear pattern can be observed when comparing maximal force production following
training at different muscle lengths. Despite LML resulting in greater hypertrophic adaptations,
there is no difference in maximal force production at the trained joint angle between SML and
LML interventions when analyzing the seven studies that directly compared joint angles
(Appendix 4) (35, 49, 188, 205, 250, 335, 353). However, transfer to non-trained joint angles

Chapter 2
35
is much lower following SML training. For example, Bandy and Hanten (35), Bogdanis et al.
(49), Kubo et al. (188), and Thepaut-Mathieu, van Hoecke and Maton (353) all trained
participants at different muscle lengths and measured MVIC at numerous joint angles pre- and
post-training. Bandy and Hanten (35) observed significant (p < 0.05) improvements at four,
five, and seven of the tested joint angles following SML, MML, and LML respectively.
Bogdanis et al. (49) reported increased MVIC at two of the assessed joint angles following
SML training (22-57.4%, ES = 0.88-2.41), while the LML group improved in all six angles
(~12.3%). Similarly, the SML group in Kubo et al.’s (188) investigation significantly (p < 0.05)
improved MVIC at five angles while the LML group experienced significantly improved force
production at eight of the tested angles. Interestingly, Thepaut-Mathieu, Van Hoecke and
Maton (353) found that their LML group significantly (p < 0.05) improved at four angles,
compared to two and five angles in the SML and MML group respectively. These data suggest
that LML and MML isometric resistance training is superior to SMLs when the aim is to
improve force throughout a range of motion.
Length-tension
The length-tension relationship, typically assessed by isometric or isokinetic
contractions, is defined as the muscle length or joint angle at which peak force/torque is
produced (355). Many studies have demonstrated acute optimal angle/length shifts towards
longer muscle lengths following concentric, isometric, and eccentric exercise (11, 52, 53, 135,
278, 280, 393). Additionally, eccentric resistance training and training over a larger range of
motion are well established for increasing the optimal angle long-term (135, 136). It is plausible
that the same relationship exists between muscle length and a shift in the optimal angle
following isometric contractions. However, only a single study included in this review reported
the angle of peak isokinetic torque (9), while another examined the optimal angle through an
isometric leg-press (49). Alegre et al. (9) observed a shift of 11° (14.6%, ES = 1.1, p = 0.002)
towards longer muscle lengths following eight weeks of training at LML, whereas the SML
group experienced a shift of 5.3° (7.3%, ES = 0.91, p = 0.039) in the opposite direction.
Likewise, Bogdanis et al. (49) reported a decrease in optimal angle following SML training (-
9.7%, ES = 1.77) while the optimal angle was maintained in the LML group. While the length-
tension curve shifted toward the angle of training in several other studies, none were significant
or altered the angle at which maximal isometric force was produced (9). While a very limited
sample, the report of Alegre et al. (9) is unsurprising given that isometric exercise at LMLs is

Chapter 2
36
preferable to SMLs for acutely altering the length-tension relationship (279). Finally, it should
be noted that no included study reported any significant differences in isometric or isokinetic
length-tension curves between groups training with different intensities, contraction intents or
any other independent variable.
The rate of force development
The rate of force development (RFD) is an important measurement in sports
performance, as force application in many activities occurs over short periods (43, 86, 138,
198). Therefore, while peak force is a valid and highly reliable means of broadly monitoring
neuromuscular function, rapid force production characteristics are equally valuable and more
specific to the execution of explosive tasks (43, 79, 138, 198, 209). Unfortunately, only three
training studies examining different contraction intents reported RFD variables (32, 216, 354).
Regardless, all three studies reported that isometric training with an “explosive” or “ballistic”
intent was superior to ramping contractions for improving rapid force production (32, 354,
389). These findings align with the previously discussed alterations in EMG amplitude between
contraction intents. For example, Williams (389) compared the adaptations following ballistic
or ramp isometric training. While the ramp group experienced larger, improvements in MVIC
(ramp, 17.8-20%, ES = 1.56-1.95, p = 0.0008 vs ballistic, 15.7-18.9%, ES = 0.75-0.88, p =
0.0036), only the ballistic training group significantly improved voluntary activation (31.6%,
ES = 1.84, p = 0.0096) and force at 150 ms (48.8%, ES = 1.29, p = 0.0074) (389). Similar
findings are reported by Balshaw et al. (32) and Tillin and Folland (354) where only the ballistic
training groups significantly (p < 0.05) improved force at 50 ms and 100 ms (Table 3). These
findings are not surprising, as several researchers have reported increased rapid force and
power production, driven heavily by neurological alterations (31, 161, 391). Additionally, there
is evidence to suggest that the intent of movement may be of similar value to actual external
contraction velocity when improving RFD characteristics (41).
Dynamic performance
The transferability of isometric resistance training to dynamic performance is
questionable, despite specific isometric assessments closely relating to sports performance
(388). Likewise, the degree of transference of isokinetic contraction to real-world movements
has yet to be elucidated fully (168, 226, 243). Regardless, isokinetic testing provides a valuable
means of assessing dynamic performance. Five studies utilized isokinetic assessments with
three comparing various trained joint angles (9, 205, 216), and two studies comparing

Chapter 2
37
contraction intent (216) or length of contraction respectively (314). Maffiuletti and Martin
(216) reported similar improvements in eccentric torque at 60°·s-1 and concentric torque at slow
(60°·s-1) and faster (120°·s-1) angular velocities regardless of contraction intent. When
comparing isometric training at different muscle lengths, Alegre et al. (9) and Noorkoiv et al.
(251) observed significant (p < 0.05) improvements after training at LML, but not SML in
concentric torque at 60°·s-1 and 30°·s-1, and 60°·s-1, 90°·s-1 and 120°·s-1 respectively, despite
no significant differences in MVIC improvements between groups. Conversely, Lindh (205)
reported that neither SML nor LML training groups improved isokinetic torque at 180°·s-1
while both groups significantly (p < 0.01) improved peak torque at 30°·s-1. Finally, Bogdanis
et al. (49) observed similar improvements in one-repetition maximum squat (9.6%, ES = 0.61
vs 11.9%, ES = 0.64) and countermovement jump height (7.2%, ES = 0.66 vs 8.4%, ES = 0.51)
following SML and LML leg press training, respectively. One possible explanation for these
findings is that the LML training groups in Alegree et al. (9) and Noorkoiv et al.’s (251)
experienced larger hypertrophic adaptations than the corresponding SML participants.
Unfortunately, neither Lindh (205) or Bogdanis et al. (49) assessed morphological adaptations,
making further analysis difficult.
Applications
While the direct transfer of isometric resistance training to dynamic movements is
questionable, physiological adaptations such as increased muscle mass and improved tendon
qualities are beneficial in a variety of contexts. There is a well-established relationship between
muscle mass, strength, and functional performance in a variety of activities and populations
(102, 183, 277). While it may require specific training in a movement to optimize
neuromuscular performance (36, 160), it is clear that producing and maintaining muscle mass
and strength should be a priority for athletes and special populations alike. For this reason,
isometric contractions are regularly used in rehabilitation programs and during specific training
phases where dynamic contractions may be contraindicated.
The long-held belief that isometric resistance training should occur at the most
important angle present in a dynamic activity holds true (127, 255-257) as the largest
improvements in neuromuscular function occur at the trained angle (35, 188, 205, 250, 353).
However, large neurological discrepancies exist between isometric and dynamic movements
(390) suggesting that static training may not be an effective strategy for directly improving

Chapter 2
38
sports performance and should be primarily employed to alter morphology. Therefore,
isometric training should occur predominantly at relatively LMLs as there is a clear advantage
for improving muscle volumes (Figure 3), and strength throughout a range of motion (9, 35,
188, 250, 251, 353). Additionally, large increases in tendon stiffness following LML have been
reported, which would likely reduce electromechanical delay and therefore improve RFD (188,
218, 241). Furthermore, LML isometric training may have beneficial effects on the length-
tension relationship (9), although greater evidence is needed to solidify optimal angle as a key
variable in performance and injury prevention (355). Similarly, architectural qualities of
muscle may underpin the length-tension relationships. However, Alegre et al. (9) observed no
significant (p > 0.05) shift in fascicle length regardless of training angle, while Noorkoiv et al.
(250) reported conflicting findings depending on which quadriceps head was evaluated.
However, it must be noted that Alegre et al. (9) utilized a relatively small (5 cm) probe and
reported highly variable changes (CV = 4.7-12.7%) in fascicle length. Therefore, a greater
number of studies with robust methods are required before strong conclusions are made.
Training intensity is a key variable prescribed in intelligently designed resistance
training programs. Evidence suggests that high-intensity resistance training is superior for
improving force production (169, 312, 313). However, the studies cited in this review show a
questionable relationship between intensity and force production adaptations (Figure 5) (9, 32,
164, 185, 188, 250, 314, 344, 396). Consistent with recent original research and meta-analyses,
isometric training intensity does not appear to affect hypertrophic adaptations (196, 312).
While the lack of relationship between contraction intensity and force production is somewhat
surprising, previous literature has reported that submaximal intensities can produce similar
strength improvements when taken to failure, or when the volume is equated between groups
(196, 236). These findings suggest that isometric training intensity is not important when
aiming to improve force production or alter muscle morphology. Therefore, increasing
contraction durations (314), increasing total volume, or shifting to longer muscle lengths (9,
35, 188, 205, 250) are likely more efficient means of progressing isometric resistance training
if strength and muscle size are a priority. Conversely, high-intensity (≥ 70% of MVIC)
isometric contraction exclusively produced increased tendon thickness and stiffness (19, 21).
As overly compliant tendons are often an issue in untrained and injured populations,
progressively increasing intensity during isometric contractions may be a safe and efficient
means of preparing tendinous tissue for future dynamic loading (219, 291). Additionally, sports

Chapter 2
39
requiring a high degree of reactive strength require relatively stiff tendinous structures to
optimize performance (118, 186, 189).
Isometric training, like other modes of resistance exercise, should be executed in a way
that most closely relates to the primary outcome goal. When muscular hypertrophy or maximal
force production is the priority, the evidence demonstrates that there is little difference between
contractions completed with a ballistic, or a gradual ramp to the prescribed intensity (32, 216,
354, 389). However, if rapid force production takes precedence, as it would in several sports,
then isometric contractions should be performed as such (32, 354, 389). Conversely, ballistic
contractions may be contra-indicated or cause excessive pain in rehabilitative or special
populations (293), despite the potential to provide unique morphological tendon adaptations
(225). Therefore, while ballistic contractions offer unique neuromuscular benefits, sustained
contractions generally offer similar or greater morphological adaptations that are likely of
interest to a wider variety of trainees (32, 216, 389).
Limitations and directions for future research
While trends, or lack thereof, are evident in many of the key independent variables
discussed in the current review, several limitations exist. While the widely homogeneous
populations inter, and intra-study allowed for simple analysis, none of the included studies
utilized special populations such as patients with tendon disorders, high-performance athletes,
or experienced resistance trainees. Likewise, while several studies have demonstrated positive
effects of isometric training with neuromuscular electrical stimulation (42), the present review
included only voluntary contractions. Researchers and practitioners alike need to be cognizant
of these limitation if wishing to generalize findings. Similarly, very few of the included studies
examined the effect of isometric training on dynamic performance, and only one utilized
closed-chain or functional performance tasks in their testing batteries. Finally, while 26 studies
were included, the large variety of independent and dependent variables made extensive inter-
study analysis difficult and hence definitive conclusions problematic.
While the limitations present are broad, several directions for interesting future research
exist. Isometric resistance training is often utilized by strength and conditioning coaches early
in a training plan with the intent of preparing muscle and tendon morphologies for future
dynamic loading. However, to the authors’ knowledge, no published studies have examined
the effect of a proceeding isometric training phase on dynamic or ballistic training periods

Chapter 2
40
despite a rise in popularity with this approach (86). On a related note, a limited number of
studies have examined isometric training with free-weights. Isometric contraction intensity
does not play a large role in driving morphological or neuromuscular adaptations, and total
volume is likely a more important variable. However, resistance training modes have specific
load cut-off points for altering tissue or neural properties (179, 180). As such, future studies
should aim to establish approximate weekly loading guidelines for a variety of populations,
muscle groups, and dependent variables. Another interesting direction is determining whether
isometric training can improve dynamic muscular endurance. Unfortunately, only a single
included study evaluated fatigue (396), and no studies examined fatigue during dynamic or
stretch-shortening cycle activities such as cycling or running.
Another avenue for research geared towards rehabilitative populations is a multivariate
examination of contraction intensity and joint angles. Physical therapists often prescribe
isometric training to stimulate morphological adaptations and improve neuromuscular function
while tightly maintaining a pain-free range of motion. Anecdotally, therapists often limit
isometric contractions to moderate joint angles as the increased ligament strain and pressure
synonymous with maximal contraction intensities at large degrees of joint flexion may cause
unwanted pain and inhibition (140, 182). However, training at LML is superior to SML training
for producing morphological and neuromuscular adaptations. Therefore, it would be
fascinating to compare the effects of submaximal isometric training at LMLs with maximal
isometric training at SMLs. As previously mentioned, the body of literature examining the
characteristics of “pushing”, “holding” and “quasi” isometric actions is growing (122, 157,
299-301, 305, 320, 333). However, there is a paucity of long-term experimental studies
examining these isometric contraction subsets.
Perspectives
Despite a relatively limited quantity of studies to base conclusions upon, the specificity
of training applies to isometric resistance training as it does to traditional dynamic resistance
training. Therefore, isometric training should be prescribed in line with the primary outcome
goals. Training at LML and with sustained contractions have been found to beneficial for
improving muscle morphology, while high-intensity contractions (> 70% MVC) are likely
required to substantially improve tendon structure and function (e.g., tendon stiffness).
Similarly, ballistic intent has been found to improve rapid force production even though

Chapter 2
41
movement velocity is zero. Finally, a greater number of studies, with a broader application of
isometric training variations are needed to determine optimal applications for altering the
morphology and improving dynamic performance in athletic, rehabilitative, and special
populations alike.

Chapter 3
42
Chapter 3 - Scientific basis for eccentric quasi-isometric
resistance training: A narrative review
Reference
Oranchuk DJ, Nelson AR, Storey AG, and Cronin JB. Scientific basis of eccentric quasi-
isometric resistance training: A narrative review. J Strength Cond Res 33: 2846-2859, 2019.
Author contribution
Oranchuk DJ, 80%; Nelson AR, 10%; Storey AG, 5%; Cronin JB, 5%.
Prelude
The previous chapter gathered and synthesized research designs, methodologies, and
characteristics and adaptations of isometric training while exposing gaps in the existing
literature. As it was impossible to perform a systematic review on a topic as novel as eccentric
quasi-isometric resistance-training, it was imperative to gather information and knowledge
adjacent to the thesis topic. Unlike the previous chapter, the importance of understanding the
acute, short-term, and long-term effects and adaptations of eccentric quasi-isometric adjacent
exercise and training was a high priority. Therefore, the primary objective of chapter three was
to synthesize and critically analyze relevant biological, physiological, and biomechanical
research, and develop a rationale for the value of eccentric quasi-isometric training.
Additionally, this review aimed to provide potential practical applications, highlight future
areas of research, and determine appropriate research design.

Chapter 3
43
Introduction
Apparently coined by Yuri Verkhoshansky (378), eccentric quasi-isometric (EQI)
contractions, also known as yielding, holding, or eccentric isometrics (122, 157, 305), have
many variations and proposed applications. However, for this review, EQIs will be defined as
“holding a position until isometric failure and maximally resisting the subsequent eccentric
phase”. Theoretically, the prolonged quasi-isometric and eccentric components enable a large
accumulation of mechanical tension and metabolic stress that would contribute to
improvements in work capacity, muscle size, and connective tissue health. While traditional
high-intensity isometric contractions and eccentric muscle actions are commonly used by
practitioners, with well-established value in the modern scientific literature (89, 101, 103, 172,
193, 268), EQIs remain relatively unexplored. Therefore, this review aims to synthesize and
critically analyze relevant research and subsequently develop a rationale for the value of EQI
training, and highlight potential areas of future research.
Defining eccentric quasi-isometric training
Prior to the EQI contraction, a submaximal (being hereafter relative to one-repetition
maximum (1-RM)) eccentric contraction is performed, where the muscle-tendon unit
undergoes an active lengthening. Once the prescribed joint position is met, the trainee shifts to
yielding isometric muscle action and attempts to hold the position for as long as possible. The
final phase occurs as fatigue accumulates, and an eccentric contraction commences while the
trainee attempts to resist muscle lengthening maximally. Some practitioners contend that this
second lengthening phase places additional strain on the musculotendinous system similar to
supramaximal eccentric training (238, 316). Practitioners have recommended a wide range of
loads, with the goal of holding the quasi-isometric contraction for 5-90 seconds (238, 316).
Consistent with traditional resistance training, greater intensities and shorter contraction
durations are recommended for strength and power athletes while lower loads and longer
contractions may be advantageous for oxidative or rehabilitative purposes (238, 316).
Anecdotally, increased muscle thickness, improved range of motion (ROM), altered force-
angle relationships, and improved tendon health, have been reported following EQI training
(238, 316). Although quasi-isometric muscle actions have been used to describe sport-specific
and stabilizing positions in sailing, speed-skating, cycling, and sprinting gait (51, 210, 333,
340, 369, 371, 372, 378), there is no published empirical data on EQIs, and much of the related
literature utilizes animal models.
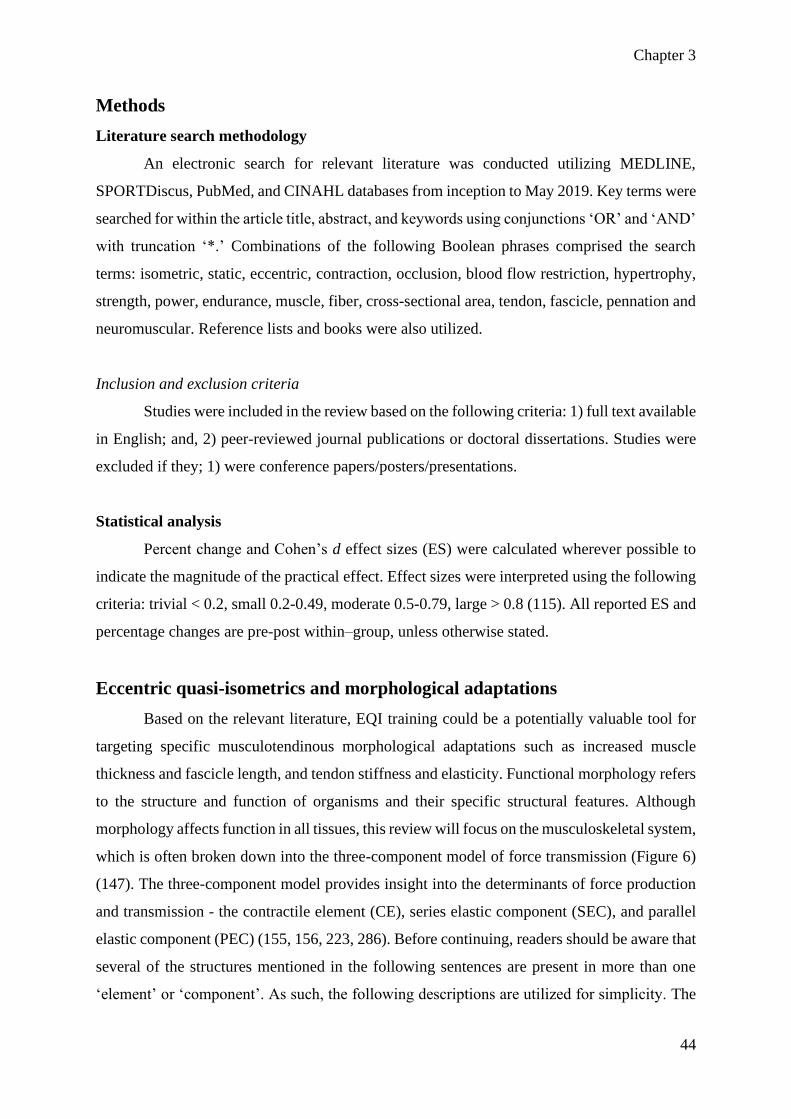
Chapter 3
44
Methods
Literature search methodology
An electronic search for relevant literature was conducted utilizing MEDLINE,
SPORTDiscus, PubMed, and CINAHL databases from inception to May 2019. Key terms were
searched for within the article title, abstract, and keywords using conjunctions ‘OR’ and ‘AND’
with truncation ‘*.’ Combinations of the following Boolean phrases comprised the search
terms: isometric, static, eccentric, contraction, occlusion, blood flow restriction, hypertrophy,
strength, power, endurance, muscle, fiber, cross-sectional area, tendon, fascicle, pennation and
neuromuscular. Reference lists and books were also utilized.
Inclusion and exclusion criteria
Studies were included in the review based on the following criteria: 1) full text available
in English; and, 2) peer-reviewed journal publications or doctoral dissertations. Studies were
excluded if they; 1) were conference papers/posters/presentations.
Statistical analysis
Percent change and Cohen’s d effect sizes (ES) were calculated wherever possible to
indicate the magnitude of the practical effect. Effect sizes were interpreted using the following
criteria: trivial < 0.2, small 0.2-0.49, moderate 0.5-0.79, large > 0.8 (115). All reported ES and
percentage changes are pre-post within–group, unless otherwise stated.
Eccentric quasi-isometrics and morphological adaptations
Based on the relevant literature, EQI training could be a potentially valuable tool for
targeting specific musculotendinous morphological adaptations such as increased muscle
thickness and fascicle length, and tendon stiffness and elasticity. Functional morphology refers
to the structure and function of organisms and their specific structural features. Although
morphology affects function in all tissues, this review will focus on the musculoskeletal system,
which is often broken down into the three-component model of force transmission (Figure 6)
(147). The three-component model provides insight into the determinants of force production
and transmission - the contractile element (CE), series elastic component (SEC), and parallel
elastic component (PEC) (155, 156, 223, 286). Before continuing, readers should be aware that
several of the structures mentioned in the following sentences are present in more than one
‘element’ or ‘component’. As such, the following descriptions are utilized for simplicity. The
Chapter 3
45
PEC, synonymous with the extracellular matrix, includes the elastic tissues surrounding the
myofibrils (the endo, peri, and epimysium) as well as the sarcolemma and fascia. These tissues
are thought to contribute to sensations of pressure, and although yet to be fully quantified, may
play a meaningful role in force transmission between joints and body segments (155, 156, 223).
The SEC encompasses the spring-like tissues in series with actin and myosin, the tendon and
aponeurosis being most obvious. Controversy exists regarding the exact function of the titin
myofilament, which appears to play a role in both active and passive force transmission (94,
144, 153). For example, titin was originally thought to be somewhat innate and only contributes
to passive tension in a fully stretched sarcomere (153). However, contemporary research has
demonstrated that titin is activated by calcium ions and adenosine triphosphate, contributing to
not only active force transmission, but also production (94, 144, 202). Finally, the CE consists
of the myofibril, and more specifically, the myofilaments of actin and myosin.
Figure 6. The three-component model of force transmission. CE = contractile element; SEC
= series elastic element; PEC = parallel elastic element.
Contractile element
Muscle length and joint angle
Typically initiated at long muscle length (LML) or held through full ROM, EQIs fulfill
the scientifically based criteria of mechanical stretch and tension for improving muscular
hypertrophy and function. Produced by force generation and stretch, mechanical tension is
effective in promoting muscular hypertrophy regardless of contraction type (26, 129, 308). In
animal models, prolonged mechanical tension has been shown to produce dramatic increases

Chapter 3
46
in muscle size. For instance, extreme increases in muscle mass (318%), muscle length (51%),
mean fiber thickness (39%), and fiber number (82%) were reported following loaded stretching
of avian wings over 28 days (17). Similarly, Tabary et al. (345) reported that cat soleus muscles
immobilized in a lengthened position had 20% more serial sarcomeres whereas a shortened
soleus group had 40% fewer sarcomeres in series than normal muscle, respectively (345). An
increase in muscle hypertrophy of up to 30%, with an increase of up to 250% RNA content in
four days was observed following electrically induced overload in stretched rabbit tibialis
anterior muscles (129). The effect of mechanical tension on skeletal hypertrophy was examined
by Ashida et al. (26) utilizing electrically induced contractions in mice. Peak torque and torque-
time integrals were highly correlated with increased muscle mass and mTOR regulating p7S6k
phosphorylation in isometric contractions and eccentric muscle actions (26). Thus, animal
models suggest that loaded stretching may provide a unique stimulus for inducing gene
transcription and muscular hypertrophy (129).
Recently, loaded stretch training with human subjects has grown in popularity (18, 143,
326). For example, following six weeks of loaded (20-45% of maximal voluntary contraction
(MVC)) stretching for five, 3-minute sessions per week, fascicle length (25%), ROM (14.9%),
and muscle thickness (5.6%) significantly increased, while the pennation angle of the lateral
gastrocnemius significantly decreased (7.1%) (326). However, no change (p = 0.94, ES = 0.08)
in MVIC or voluntary activation (p > 0.05, ES = 0.13) was present (326), despite several cross-
sectional investigations supporting the relationship between muscle architecture and
performance (6, 13, 48, 190, 263, 360). Yet, the causal relationship between alterations in
muscle architecture and muscular strength has become a hot topic in contemporary literature
(81, 254). Additionally, the concept of constant-torque versus constant angle-stretching has
been recently examined (18, 143). For example, Herda et al. (143) examined the short-term
effects of acute knee flexor stretching at a constant-angle, or under constant-torque where the
muscle was initially held at a point of mild discomfort followed by additional muscle-tendon
unit lengthening via “muscle creep,” and stretch-induced analgesia occurred. While both
groups experienced similar improvements in passive ROM and passive torque, only the
constant-torque treatment resulted in decreased muscle-tendon-unit stiffness (p < 0.001) (143).
Unfortunately, Herda et al. (143) did not report any performance measures, a trend that is
common in stretching research (18). From these results, it appears that, in young males, loaded
stretching can provide sufficient stimulus to affect musculotendonous architecture, viscoelastic
properties and likely, acute pain thresholds (18, 143, 326). As variants of loaded stretching

Chapter 3
47
utilize extended periods at or near end ROM, the results of the aforementioned research lend
credence to the hypothesis that EQI training may be a valuable training methodology for
improving acute and chronic flexibility and musculotendonous function. However, there is a
dearth of stretch research elucidating the ideal stretching intensity and the efficacy of loaded
stretching to improve muscular or athletic performance (18).
Although eccentric muscle actions have the highest potential for muscular force
production, isometric muscle actions are the only contraction type that has no ROM dependent
endpoint. Isometric training is also easily implemented as simply flexing (co-contracting the
agonists and antagonists of a limb) can increase muscle size and strength in active men (214,
398); though the value of co-contraction training in a well-trained population has yet to be
elucidated. Additionally, isometric contractions enable training at specific joint angles and,
therefore, muscle-tendon lengths. While strength improvements are joint-angle specific (205),
increases in muscular hypertrophy, which is larger following full ROM and LML training,
(228), transfer to all joint angles (9, 188, 250, 251). McMahon et al. (228) compared the effects
of dynamic resistance training executed with full or partial ROM. The full ROM group
experienced significantly greater improvements in the distal anatomical cross-sectional area
(59% vs 16%), fascicle length (23% vs 10%), and isometric force at all seven (30-90° of
flexion) measured knee joint angles (11-30% vs -1-6%) (228) when compared to the partial
ROM group. Although isometric contractions resulted in less muscle damage and less dramatic
muscular-tendinous adaptations compared to maximal eccentrics, maximal voluntary isometric
contractions (MVICs) at LML increased markers of acute muscle damage and soreness relative
to MVICs at short muscle length (SML) despite lower torque outputs (11). Isometric training
at LML produces greater hypertrophy, force production at different joint angles, and dynamic
performance benefits compared to training at SML following long-term trials (9, 35, 188, 250,
251, 353). The systematic review in Chapter 2 delved into effects of isometric training
variations (268), and determined that isometric training at LML produced greater increases in
muscular hypertrophy than volume-equated SML training, (0.86-1.69%·week-1, ES·week-1 =
0.03-0.09; and 0.08-0.83%·week-1, ES·week-1 = -0.003-0.07, respectively) (268) likely due to
increased mechanical tension throughout all tissues involved in force transmission (Figure 7).

Chapter 3
48
Figure 7. The three-component model of force transmission in a muscle contracting at short
and long muscle lengths.
The larger architectural and functional adaptations following LML training might be
due, at least in part, to the greater initial fascicle length, which results in increased muscle
damage, and sarcomere compliance, demonstrated by acute optimal angle shifts towards longer
muscle lengths (11, 59). Although more dramatic following eccentric muscle actions, these
angle shifts have also been observed following concentric contractions at long fascicle lengths
(135). For example, Guex et al. (136) examined the effect of three weeks of maximal eccentric
knee flexions at either LML or SML on fascicle length and optimal angle. While fascicle length
increased in both groups (SML, 4.9%, ES = 0.57: and LML; 9.3%, ES = 0.89), the SML group
only experienced a shift in the optimal concentric angle (8.8°), whereas the LML group
experienced optimal angle shifts in both concentric contractions and eccentric muscle actions
(17.3° and 10.7°, respectively) (136). There is evidence to support the principle that mechanical
tension can increase muscle volume, and that isometric training at LML leads to greater
hypertrophy and a shift in the optimal angle.

Chapter 3
49
Contraction intensity and duration
Cumulative tension and total workload are key determinants of hypertrophic
adaptation, regardless of contraction type (236). Moore et al. (236) found that changes in torque
and muscle thickness were not significantly different between load-matched concentric and
eccentric resistance training groups, despite the eccentric group requiring 40% fewer
contractions to match training load. Morphological adaptations to isometric resistance training
are similar between work matched high and low-intensity training (268). While much of the
literature recommends high-load over low-load resistance training for strength development
(220), many periodization models emphasize muscular hypertrophy and general muscular
endurance early in macro and mesocycles (75, 378). Accordingly, EQI training emphasizing
time under tension with the application of practitioner-recommended intensities of 30-80% of
1-RM may be a useful training method to alter muscle size.
Metabolic factors
Total time under tension, acute hypoxia, and metabolic stress are mechanisms that
contribute to morphological adaptations (57, 117, 123, 268, 281, 314, 348, 349). Several studies
have reported significant reductions in oxygen availability from submaximal isometric
contractions at 30-50% of MVC (7, 333). Additionally, blood flow does not appear to decrease
linearly with intensity (229). Isometric contractions at 60% of MVIC result in greater short-
term blood flow restriction relative to 30% and 100% MVICs, as the moderate-intensity
contraction could be sustained for a significantly greater duration than 100% while the tension
created by the 30% contraction was insufficient to reduce blood flow and metabolite clearance
(229). This occlusion has several potential effects, including increased metabolite build-up and
post-contraction blood flow, both of which stimulate muscular hypertrophy (208). Several
studies have examined the impact of blood flow restriction on hormones and hypertrophic
markers in humans (117, 281, 348, 349). Fujita et al. (117) examined the metabolic and
hormonal effects of blood flow restriction during low-intensity resistance training and found
46% greater mTOR regulated muscle protein synthesis, via significantly greater S6K1
phosphorylation markers compared to the exercise-only group. Gentil et al. (123) also found
that both isometric contractions and vascular occlusion resulted in greater blood lactate
responses which can increase muscle cell myogenesis, satellite cell activation, and
phosphorylation of mTOR and P70SK (244). Additionally, acute ischemia combined with low-
intensity muscular contraction can significantly increase growth hormone, insulin-like growth
factors, and mechano-growth factor production (95), which are physiological responses to

Chapter 3
50
decreased muscle and blood pH (281, 348, 349). Occlusion may also reduce the amount of
oxygen available for the oxidative type-1 motor units, potentially resulting in earlier
recruitment of fast-twitch fibers at relatively low intensities (237). Long-term morphological
adaptations to blood flow restriction training include increased muscle thickness and function
in a variety of training circumstances (208, 351, 383).
Though sparse, a few studies have examined the effect of blood flow and metabolites
during isometric training (83, 314). de Ruiter et al. (83) examined the oxygen consumption
characteristics of isometric contractions at several knee angles. Isometric contractions at LML
(60° and 90°) consumed more oxygen than SML contractions (30°) at 10%, 30%, and 50% of
MVC (83). These findings may, in part, explain why long-term isometric training at LML has
a greater effect on muscle thickness and strength, compared to SML training at least in
“healthy”, or “recreationally active” subjects (9, 35, 188, 205, 250, 251, 268). Schott, McCully,
and Rutherford (314) compared the metabolic response and adaptations to short (four sets of
10 x three-second contractions) or long (four contractions of 30 seconds) duration isometric
contractions at 70% MVC. Although blood flow was not measured, the long-contraction limbs
experienced greater changes in metabolites and larger decreases in pH (314). Muscle thickness
also significantly increased in the upper (10.1%) and lower (11.1%) portions of the quadriceps
in the long-contraction, but not short-contraction limb (314). Although blood flow restriction
has many benefits in older and injured populations, it does not appear to offer any additional
adaptations in healthy well-trained athletes (315). Furthermore, while low intensity single-joint
isometric contractions have been found to result in blood flow restriction, the effects of multi-
joint isometric and quasi-isometric contractions have yet to be examined.
Exercise-induced muscle damage
Although exercise-induced muscle damage is not needed to promote muscular
hypertrophy (308), emerging research suggests that exercise-induced muscle damage may play
some role in morphological adaptations (309). When exposed to a novel stimulus, acute
myofibril micro-trauma occurs as an abundance of Ca2+ enters and remains in the myofibril
(78). Eccentric muscle actions typically result in a greater degree of acute trauma as evidenced
by elevated serum creatine kinase, myoglobin, and skeletal troponin-1 levels, and delayed onset
muscle soreness (72). These markers typically coincide with a temporary reduction in muscle
force and power (72). While detrimental to short-term performance, exercise-induced muscle
damage is associated with changes in a variety of chemokines that attract inflammatory cells,

Chapter 3
51
which influence muscle hypertrophy remodeling associated with phagocytosis, free radical
production, and circulating cytokines and growth factors (173). Additionally, a novel delayed
onset muscle soreness inducing stimulus may lead to increased sarcoplasmic reticulum re-
uptake of Ca2+ by altering t-tubule structure (78) and increasing the concentrations of proteins
such as calsequestrin (40) and dysferlin (167). These proteins function to promote debris
clearance and increased concentrations of IGF-1, fibroblast growth factor, nerve growth factor,
and interleukin-6, which increase satellite cell proliferation (34, 37) and rates of protein and
collagen synthesis (166). Although acute increases in myofibril protein synthesis do not
necessarily correlate with long-term hypertrophy (233), these increased synthesis rates,
theoretically result in thicker, stronger tissues that are less susceptible to future damage (103).
The repeated bout effect refers to the substantial reduction in muscle damage from
subsequent training (227). While most commonly observed following eccentric exercise (103,
227), the protective effects have also been found to occur following isometric exercise (5),
especially at LML (11, 69). Isometric training at LML results in greater delayed onset muscle
soreness and acute performance decrements (11) as well as chronic adaptations, compared to
isometrics at SML (9, 188, 250, 251, 268, 353). Likewise, greater exercise-induced muscle
damage and delayed onset muscle soreness are reported following maximal effort high-velocity
(210°·s-1) isokinetic eccentric muscle actions when compared to an equal volume bout at low-
velocity (30°·s-1) (65). As a greater number of high vs low-velocity eccentric muscle actions
are needed to equalize volume, the difference in muscle damage and soreness is likely due to
increasing the total number of sarcomere bonds and therefore calcium ion influx and
subsequent activation of calpain (399). Additionally, higher velocity eccentrics may
preferentially recruit high-threshold, type-II motor-unitis, which are more suseptable to muscle
damage in comparison to the type-I fibers (245). Similarly, eight weeks of maximal high-
velocity (180°·s-1) eccentric training resulted in greater hypertrophic adaptations when
compared to maximal low-velocity (30°·s-1) training (101). Conversely, submaximal (70% 1-
RM) slow velocity (~3 s) eccentric muscle actions during the barbell bench press have been
found to stimulate higher blood lactate and endogenous human growth hormone, by promoting
a hypoxic environment (61). While EQIs may lead to substantial levels of local fatigue due to
a potential lack of blood flow and high metabolite levels, it is unlikely that the low-velocity
eccentric component would produce exercise-induced muscle damage (65).

Chapter 3
52
Series elastic component
Tendon, the primary tissue of the SEC, can undergo morphological and functional
adaptations through inactivity, injury, sporting activities, and resistance training (24, 187, 218,
291). Tendon and other connective tissues comprised of specifically aligned collagen fibers
have significant resistance to mechanical strain (218). Optimal performance requires the
efficient transfer of force from muscle to bone (218, 249) necessitating transmission via a
tendon that is sufficiently stiff to minimize electromechanical delay while avoiding rupture
(218). Properly executed dynamic, eccentric and isometric training can improve tendon
structure and function (19, 21, 174, 175, 185, 187, 193, 218, 291).
Joint angle
A single study has directly investigated the effect of joint angle on tendon morphology
by comparing volume-equated isometric knee flexion training at LML (100°) or SML (50°)
(188). While both SML (10%, ES = 0.82) and LML (11%, ES = 1.06) groups improved
quadriceps volume, only LML training resulted in significant tendon stiffness improvements
(50.9%, ES = 1.22) (188). While the sparse results of the preceding studies expose a gap in
existing literature, they tend to support holding prolonged isometric contractions at LML with
near maximal loads if tendon structural adaptations are paramount.
The titin myofilament, although thought to be a secondary structure to a tendon in the
SEC has several important functions and is likely partly responsible for the residual force
enhancement following an active stretch (107, 145, 283, 318, 319, 321, 323). Titin adds
stability, stiffness, and passive and active force transmission at LMLs (144, 284) and is a likely
factor in injury prevention. Several studies have found titin to regulate muscle force and length
in mechanically lengthened fibers (202, 284). Baumert et al. (39) examined the relationship
between force production, delayed onset muscle soreness, and genotyping related to titin
stiffness (39). Subjects with the allele linked to greater titin stiffness (TRIM63 A-allele) had
greater MVICs (35%, ES = 1.42, p = 0.006) and recovered more quickly (ES = 1.14 , p = 0.022)
compared to the other subjects (TRIM63 G-allele) (39). Titin protein fragments have been
found in the urine of healthy young males following bouts of a dynamic calf-raise exercise and
were strongly correlated with traditional markers of exercise-induced muscle damage (163).
While the eccentric muscle action following a fatiguing isometric contraction with EQIs is
unlikely to produce significant muscle damage due to low velocities (65), it is plausible that
titin may be activated. Although occurring at a range of joint angles (318), residual force
Chapter 3
53
enhancement magnitude is greater at LMLs (323), suggesting that LML training may
preferentially utilize titin (145). Thus, it may be prudent to examine the effects of quasi-
isometric holds in the lengthened position on markers of breakdown and expression of titin.
Movement velocity and muscle action
The SEC appears to be affected differently by movement velocity. The impact of
movement velocity on titin is difficult to determine as many questions remain regarding the
myofilaments' contributions to phenomena such as residual force enhancement (162, 321).
While studies have observed the breakdown of titin following resistance training movements,
which tend to be relatively slow when compared to activities such as sprinting or jumping
(163), there are conflicting data regarding the velocity of stretch and residual force
enhancement. Although the majority of residual force enhancement examinations utilize
eccentric angular velocities between 30°.s-1 and 60°.s-1 (107, 283, 319, 323), Lee and Herzog
(200) compared stretch angular velocities of 10°.s-1, 20°.s-1, and 60°.s-1. While eccentric force
during the stretch increased with velocity, there was no significant difference in proceeding
isometric force between the three protocols (200). Though the above research is intriguing as
the effect of velocity on titin is unknown due to several confounding variables, including
different neuromuscular strategies and contributions from the CE and PEC (98, 273).
The relationship between velocity, residual force enhancement, and titin is not yet
determined; however, the effect of movement velocity on the tendon holds greater clarity.
Acutely, it appears that isometric contractions provide superior analgesic effects compared to
dynamic resistance exercise (293, 295, 357). Rio et al. (293), examined patellar tendon pain
during a decline squat exercise in six male volleyball players with tendonitis. The pain was
evaluated before and after performing either slow isotonic leg extensions for four sets at an
8RM load or five sets of 45s isometric knee extensions at 70% of MVIC (293). While both the
isometric (-97%, ES = 3.6) and dynamic (-40%, ES = 0.67) groups significantly reduced pain
acutely, pain reduction only remained significant at the 45 minutes mark following isometric
exercise (293). Loaded between 30% and 80% of 1-RM (305, 378), and maintained for similar
periods as Rio et al.’s (293-295), the zero to low-velocity EQI contractions may have the
potential to reduce tendon pain, despite recent controversy (132).
Long-term changes in tendon morphology seem minimal in healthy, mature human
tissue (172, 218). However, injured tendinous tissue can undergo dramatic adaptations (172,

Chapter 3
54
305). Tendon adaptation is independent of contraction type, so long as a minimum mechanical
load threshold is reached (141, 142, 156), which likely explains why traditional exercises with
an eccentric emphasis have been found to be superior to dynamic contractions in tendon
rehabilitation (174, 193, 218). However, movement velocity is critical as healthy tendon fibers
will “spare” the damaged tissue by transmitting a greater portion of the load when high
velocities are utilized (22, 218). Conversely, damaged tendon tissue can undergo sufficient
loading during slow contractions (22, 218). For example, Kongsgaard et al. (174) compared 12
weeks of single-leg decline squats with an eccentric emphasis, bilateral heavy and slow (three-
second eccentric and concentric phases) resistance training, and corticosteroid injections.
While both resistance training groups experienced significant improvements in several
measures of performance and architectural and physiological markers, the heavy and slow
resistance training group reported greater satisfaction of clinical outcomes (70%) compared to
the eccentric (42%) group (174). The researchers theorized that the decreased tendon pain,
tendon collagen content, and voluntary force production were due to the greater intensity-
induced mechanical overload throughout the training period (174). These data demonstrate that
tendon adaptation can be achieved via relatively slow movement velocities and that maximal
or supramaximal eccentric exercise is not necessarily required. As EQI contractions are slow
and submaximal, they may be a viable tool for treating diseased tendonous tissues.
Contraction intensity and duration
Contraction intensity, duration, and type have different effects on tendon properties.
Kubo et al. (184) compared the effects of 12 weeks of isometric and plyometric training on
muscle and tendon stiffness. Active muscle stiffness at 30%, 50% and 70% of MVIC only
increased significantly following plyometric training (38.1-69.6%, ES = 1.35-2.57 vs 12.4-
23.6%, ES = 0.46-0.75) whereas ballistic and ramp tendon stiffness increased exclusively
following isometric training (23.7-42.1%, ES = 0.92-1.21) (184). Likewise, Burgess and
colleagues (58) compared the effects of isometric and plyometric training on the plantar
flexors. While no statistically significant difference between groups were present (p < 0.05),
the isometric group experienced very large increases (61.6%, ES = 4.91) in tendon stiffness
when compared to the plyometric group (29.4%, ES = 1.44) (58). Interestingly, no significant
differences between the isometric and plyometric groups were apparent for concentric-only
jump height (64.3%, ES = 2.87 vs 58.6%, ES = 2.85), or rate of force development (28.1%, ES
= 1.89 vs 14.6%, ES = 1.38); however, no measures of stretch-shortening cycle function were
included (58). These findings demonstrate that while isometric contractions are effective in

Chapter 3
55
improving tendon stiffness (thereby reducing electromechanical delay) and improving tendon
health (24, 293), improvements in stretch-shortening cycle performance likely require specific
training to increase ultrasonically assessed elasticity (187-189), suggesting that isometric
contractions are an effective addition to traditional resistance training.
In regards to contraction intensity, Kongsgaard et al. (175) examined the effect of a 12-
week, work-equated dynamic isotonic leg extension training program using either “heavy”
(70% 1-RM) or light loads. The “heavy” group experienced thickening of the distal (4%, p <
0.05) and proximal (6%, p < 0.05) patella tendon, whereas the light group only saw significant
proximal hypertrophy (7%, p < 0.05) (175). Additionally, tendon stiffness significantly
improved following “heavy” resistance training (14.6%, ES = 1.37), whereas the light load
group experienced a non-significant decrease (-9.18%, ES = 0.83) (175). Similarly,
Arampatizis et al. (19, 21) compared 14 week training programs consisting of volume equated
isometric plantar flexion at low (~55% MVIC) or high (~90% MVIC) intensities. Only the high
intensity training groups improved Achilles tendon cross-sectional area and stiffness (17.1-
36%, ES = 0.82-1.57, p < 0.05. vs -5.2-7.9%, ES = 0.26-0.37, p > 0.05) (19, 21). Furthermore,
tendon elasticity only increased following low intensity training (14-16.1%, ES = 0.56-0.84, p
> 0.05. vs -1.4-3.9%, ES = 0.06-0.20, p > 0.05) intensity training (19, 21). Though the
aforementioned studies investigated different tendons and utilized different training intensities,
both point to the superiority of high over low-intensity contractions when an improvement in
tendon stiffness is desired. While unlikely to directly improve plyometric performance, high-
intensity isometric training may be a valuable tool in improving tendon thickness and stiffness
which may decrease injury rates, and improve performance when included as a supplement to
traditional resistance training (58, 184, 187, 189).
Parallel elastic component
The effect of resistance training on the PEC and extracellular matrix is lacking, due to
the methodological challenge of separating connective tissue from intrafibrillar elements to
evaluate their relative contributions to force transmission (296). Subjective measures such as
pain and ROM are limited in utility, as they contain confounding variables and often manifest
gradually (296). However, we do know that the PEC is comprised primarily of collagen fibers
(286) and that adding collagen around the myofibrils leads to an increase in stiffness and
transmission of force to the passive structures of the extracellular matrix (125). Thus, it is

Chapter 3
56
postulated that the increase in extracellular matrix stiffness is a contributing factor to more
energy-efficient eccentric muscle actions (331).
Several studies have examined resistance training and collagen formation in healthy
humans (159, 172, 174, 175, 193, 218). In-situ investigations by Mass et al. (222) and Gomez
et al. (130) have reported that damaged tendons and ligaments healing under tension had higher
collagen contents compared to passively healing controls. It is understood that damaged
tendons experience more efficient healing when factors including transforming growth-factor
ß1, platelet-derived growth factor, and IGF-1 are elevated (204). Therefore, resistance training,
which places a tissue under tension, increases hormonal and molecular signaling factors,
providing optimal extracellular matrix maintenance in the elderly (331). Additionally,
resistance training can cause exercise-induced muscle damage and increase local inflammation
(72, 331). Muscle damage following unaccustomed loading has been observed to acutely
increase collagen synthesis and extracellular matrix remodeling (158, 347), while chronic
resistance training has resulted in increased intramuscular collagen (159). Interestingly,
eccentric and concentric contractions appear equally proficient for increasing collagen
synthesis when total work is equated (235). However, eccentric muscle actions enable greater
force production or greater work performed at the same load (90) and therefore lead to greater
adaptation when total sets and repetitions are equal (148).
In summary, EQI training theoretically offers a time and energy-efficient means of
triggering morphological adaptations in all primary components of force transmission.
Therefore, implementation of EQI training could likely be beneficial for increasing muscle size
and improving tendon, and other connective tissue health. However, these hypotheses must be
empirically tested.
Eccentric quasi-isometric contractions and neurological qualities
Eccentric quasi-isometric training could be expected to improve muscle function at low,
but not high velocities. Although a few acute studies are examining and describing EQI
exercise on musculotendinous (51, 210, 333, 340) and neuromuscular adaptations (7, 369), the
lack of any long-term investigations makes any definitive conclusions problematic. However,
there is a significant amount of research examining fatiguing contractions (229, 303), yielding
isometrics (7, 122, 157, 299-301, 305), slow tempo resistance training (351, 381-383, 394),

Chapter 3
57
and joint angle (83, 250, 251, 303, 343) that allow conjecture and identify areas for future
research.
Contraction intent
Contraction intent is an important factor to consider when evaluating the effect of
resistance training (74). Although the intent of the trainee during EQIs is to maintain a
movement velocity of zero, once isometric failure occurs at low velocity, lengthening follows
despite maximal effort due to accumulated fatigue (238, 316). Though a variety of isometric
training and exercise methods have been described (122, 157, 305), the vast majority of
experiments have utilized maximal contractions against an immovable object. While maximal
isometrics serves as a valuable and highly reliable means of evaluating neuromuscular function
(91, 266), results from these studies are difficult to apply to EQI exercise. Recently, researchers
have demonstrated that “yielding” (resisting an external force) isometrics, with the intent of
preventing eccentric muscle action, create different fatigue and neuromuscular characteristics
compared to “pushing” (exerting force against an immovable object) isometrics (122, 157, 299-
301, 305). Hunter et al. (157) compared time to task failure and neuromuscular function when
maintaining a constant force (pushing) of 15% of MVIC, or by supporting an equivalent inertial
load while maintaining a constant joint angle (holding). Pushing resulted in significantly
greater time to failure (1402 ± 728 s) than holding (702 ± 582 s) (157). Similarly, Schaefer et
al. (305) examined pushing and holding isometric actions at 80% of MVIC and found that
subjects could maintain the target force for twice as long when pushing (41 ± 24 s vs 19 ± 8 s).
Hunter et al. (157), Schaefer et al. (305), and other investigators (122, 299-301) have also
demonstrated that agonist activation at failure is greater when pushing, while co-activation of
antagonist and synergist muscles are greater when holding (122, 299-301, 305). While the
increased co-activation during position tasks are a likely cause of the decreased endurance time
(122, 157, 300, 305), it is plausible that position task training may lead to superior joint
stabilization and thus carry value in rehabilitative settings (299). Additionally, several activities
and sporting actions involve bracing to avoid dynamic muscle action (199, 371). Therefore,
while pushing isometrics likely allow for greater morphological adaptations, due to larger
forces and time under tension, training with the intent to maintain specific positions instead of
exerting force against an immovable object may provide improved carry over to specific tasks
that involve maintaining specific joint angles or postures due to the similarity of neural
characteristics (199, 372).
Chapter 3
58
Ballistic and ramp contractions are additional means of distinguishing movement intent
(268). When comparing the result of several isometric training studies directly comparing
contraction intents, Oranchuk et al. (268) determined that training with ballistic intent resulted
in constantly greater improvements in muscular activation (3/4 studies) (1.04-10.5%·week-1,
ES = 0.02-0.31 vs 1.64-5.53%·week-1, ES·week-1 = 0.03-0.20) and rapid (0-150 ms) force
production (3/3 studies) (1.2-13.4%·week-1, ES·week-1 = 0.05-0.61 vs 1.01-8.13%·week-1,
ES·week-1 = 0.06-0.22). Furthermore, Behm and Sale (41) compared the effects of isometric
contractions performed with ballistic intent, and high angular velocity (240°.s-1) concentric
contractions. Both concentric and isometric training lead to similar (all p < 0.01) improvements
in peak isometric force, rate of force development and relaxation and peak torque at 14.9°.s-1,
29.8°.s-1, 59.6°.s-1, 88.8°.s-1, 173°.s-1 and 240°.s-1 (41). These results highlight the importance
of contraction intent, and not necessarily movement velocity, on neurological qualities and
performance alterations. Although comparing the above results with EQI training is difficult,
given that EQIs are non-ballistic, it is reasonable to suggest that they would be unlikely to
improve explosive neuromuscular performance. Thus, a progressive resistance training
program to improve explosive performance would avoid incorporating EQIs in late training
cycles; they may be best positioned early in a periodized plan, likely as an adjunct to traditional
resistance training.
Contraction intensity
While research on isometric contraction intensity is emerging, the only long-term
training investigations examining neurological adaptations utilize traditional, pushing
isometrics. Investigations directly comparing isometric training intensity have determined that
little difference in morphological or performance adaptations exists if the total volume is
equated (268). While little evidence exists regarding different isometric contraction intensities
on neurological adaptations, the wealth of data on dynamic contractions may provide insight.
High load dynamic training has been found to increase coordination (358) and reduce
neuromuscular inhibition (2), which is valuable when optimal performance is desired (74).
Additionally, a significant portion of the existing literature has determined that high-intensity
dynamic resistance training is superior for improving neuromuscular function and sports
performance when compared to lower intensity methods (74).

Chapter 3
59
Joint angle
Motor-unit activation and muscle inhibition are strongly affected by the joint angle
(249, 303, 343). The strain sensing organelles of the Golgi tendon organ and muscle spindles
undergo different levels of stimulation at varying muscle-tendon lengths (249, 303). For
example, Suter and Herzog (343) examined muscle inhibition and joint angle by comparing
voluntary force and force produced by superimposed femoral nerve stimulation at 15°, 30°,
45°, 60°, and 90° of knee flexion. While muscle inhibition was present at all assessed joint
angles, the largest superimposed twitches were present at LMLs (343). Greater muscular
stretch, patellofemoral pressure, and ligament strain at knee angles between 45° and 60° of
flexion are theorized to underpin the greater degree of muscle inhibition (343); however, these
observations are not necessarily applicable for all joints or movements to differing tendon
structural properties, fascicle lengths and co-contraction dynamics (15, 46, 139, 170, 197, 392).
Although muscle inhibition is necessary for extreme situations, improving muscular activity is
important when returning to activity or when optimizing performance (74, 249).
Advantages of LML isometric training for improving muscle size and force production
throughout a full ROM exist (9, 35, 188, 250, 251, 268, 353). Interestingly, studies
investigating the effect of restricted ROM resistance training have determined that limiting
dynamic contractions to LML does not result in meaningful changes in the length-tension
relationship (363, 364). While EQI contractions utilize a full ROM, they are inherently low
velocity. Therefore, EQI training should be implemented early in a yearly training plan to
improve morphology and improve position-specific functions.
Applications to performance and rehabilitation
Performance
Performance in sport is dependent on a variety of physical qualities. As such, training
methodologies have differing utility and value depending on the type of sport, proximity to
competition, individual training age, and a multitude of additional factors. With few exceptions
(199, 372, 378), quasi-isometric and EQI contractions have not been widely utilized in training
plans. However, although no direct investigations on EQI contraction or training exist, relevant
research, (e.g., isometric, eccentric, time under tension, blood flow restriction) suggest that
EQIs may have a place in intelligently designed programs. The theoretical potential of EQIs
concerning dynamic (eccentric and concentric), eccentric only, and isometric resistance
training are summarized in Table 5 (based on (342)).

Chapter 3
60
Table 5. Theoretical potential of dynamic, eccentric, isometric, and eccentric quasi-isometric resistance training to benefit musculotendinous
morphology and performance
Training outcome Training method Contractile element Series elastic component Parallel elastic component
Morphology
Dynamic ++++ + +
Eccentric +++++ ++ ++
Isometric ++ ++ +
EQI ++++ ++ ++
Endurance
Dynamic ++++ + +
Eccentric ++ +++ ++
Isometric +++ ++ +
EQI +++++ ++ ++
Strength
Dynamic +++ + +
Eccentric +++++ +++ ++
Isometric ++++ ++ +
EQI +++ ++ ++
Power
Dynamic +++++ + +
Eccentric ++++ ++ ++
Isometric ++ ++ +
EQI + + ++
Ranked on a scale from + (low potential) to +++++ (high potential). Adapted from Suchomel et al., (342) . EQI = eccentric quasi-isometric.

Chapter 3
61
Muscular endurance
A systematic increase in the exposure to the total volume that a muscle or muscle-group
undergoes is a common means of improving muscular endurance (178, 378). Training with
EQIs may have the potential to provide a unique stimulus for promoting muscular endurance,
as a primary aim is to increase the amount of time that the prescribed position is maintained.
Additionally, while a high volume of submaximal dynamic contractions is commonly
employed to improve muscular endurance, the constant muscular tension present in isometric
and quasi-isometric contractions can alter blood flow and muscle oxygenation (7, 333).
Although far from conclusive, this mild, and temporary alteration in oxygenation may lead to
alterations in aerobic and anaerobic enzymes and significant, yet temporary increases in several
anabolic signaling factors (237, 349). Furthermore, muscular endurance training may lead to
adaptations to the t-tubule structure and increase Ca2+ re-uptake (78), therefore offering a
protective effect from delayed onset muscle soreness and short-term performance decrements
that may occur from future high-load training (67, 69).
Eccentric quasi-isometric training may also offer a novel sport-specific training
stimulus to athletes that undergo regular, sustained quasi-isometric contractions. While actual
sports participation offers the greatest level of sport-specific adaptation, utilizing quasi-
isometric or EQI contractions in a controlled environment such, as a weight-room, offers the
ability to apply focused overload. For example, a speed skater wishing to increase lower-body
muscular endurance in a skating specific ROM, via morphological adaptations, may wish to
experiment with quasi-isometric or EQI training by utilizing a leg-press (Figure 8).
Figure 8. The initial quasi-isometric hold and final position after a maximal eccentric
contraction in the single-leg leg press.

Chapter 3
62
Hypertrophy
Muscle mass is highly related to strength (126) and is, therefore, an important factor in
sports performance. While heavy loading, including supra-maximal eccentric training, offers a
strong stimulus, total work and training volume are the most important determinants of
hypertrophic adaptation (196, 236, 308, 312). While moderate resistance training allows for a
time-efficient means of accumulating volume, EQIs may be superior in specific circumstances.
Depending on the intensity, initial joint angle, and other factors, EQI contractions can expose
a muscle group to a substantial total load in a relatively short period. Eccentric quasi-isometric
contractions also offer a likely advantage over dynamic training when it comes to accumulating
volume as shortening contractions are less energetically and mechanically efficient (236).
While a non-linear, inverse relationship exists between intensity and time under tension (178,
378), exclusion of the less efficient concentric phase allows for higher intensities throughout a
set duration, or more work at the same intensities (89, 236). Therefore, a single EQI contraction
would likely impart greater time under tension than a similarly loaded set of dynamic
contractions when both are taken to failure. Likewise, similar set durations could be met with
a greater external load applied to an EQI contraction compared to a dynamic alternative.
Additionally, EQIs are likely to reduce muscle oxygenation and metabolite clearance (7, 333)
which may lead to preferential recruitment of type-II muscle fibers with increased capacity to
increase cross-sectional area and force production, and signal anabolic hormones known to
contribute to the hypertrophic response (208, 314, 349).
Strength and power
A variety of morphological and neurological factors including muscle size, muscle fiber
type, and motor-unit recruitment characteristics determine strength and power (13, 74, 75, 89,
98, 116, 199, 249, 342, 360, 383, 398). While EQI contractions may be a viable tool for
improving total hypertrophy, an abundance of evidence supports the use of high-velocity
contractions and maximal to supra-maximal loads for preferentially targeting type-II muscle
fibers (116, 270). From a neurological perspective, the ability to express maximal force and
power is contingent on several factors. While isometric and eccentric resistance training can
lead to the neurological and neuromuscular adaptations of rate-coding, agonist, antagonist, and
synergist activation and co-activation, the adaptations above are highly specific (2). As EQI
contractions are inherently submaximal and intentionally low velocity, it is likely that direct
carry over to high threshold activities would be minimal. However, the slow, relatively high
accumulated loading synonymous with EQI contractions, may potentially lead to improved

Chapter 3
63
rates of collagen synthesis and stiffness of the SEC and PEC (174, 193, 218). There is reason
to believe that these morphological adaptations may improve force transmission by decreasing
the electromechanical delay, therefore improving the rate of force development and stretch-
shortening cycle function (125, 218). Quasi-isometric and EQI contractions are postulated to
build position-specific strength and potentially reduce injury risk (371, 372). Verkhoshansky
and Siff (378), described weightlifters utilizing EQI training to strengthen key positions in their
weightlifting pulls. For example, a weightlifter who struggles to maintain an ideal position
throughout the “first pull” (339) may wish to experiment with EQI contractions (Figure 9).
Figure 9. The initial quasi-isometric hold and final position after a maximal eccentric
contraction in the snatch pull.
Rehabilitation
Injuries to any of the three components of force transmission require mechanical
overload at some point in the rehabilitation process (218). Isometric and quasi-isometric
exercises are already commonplace in the initial phases of muscular and tendon rehabilitation
protocols as they enable tight control over ROM and intensity (128, 178, 293-295, 357).
Sustained submaximal isometric contractions avoid large peak forces and acutely reduce
tendon pain, potentially allowing for periods of pain-free dynamic exercise (294, 295, 357).
Furthermore, while progressive mechanical tension is crucial (172, 174), slow movement
velocities should be prescribed to stimulate damaged fibers (22). Therefore, the combined static
and lengthening phases of EQI contractions may provide an analgesic effect while stimulating
connective tissue reformation. In the case of serious injuries, such as bone fractures or severe

Chapter 3
64
connective tissue strains, patients may undergo a period of full or partial immobilization. These
periods of immobilization often result in significant muscle atrophy and fascicle shortening
(345). Eccentric quasi-isometric exercise may offer a submaximal means of improving tendon
morphology, work capacity, muscle thickness, and neuromuscular function while returning
fascicles to a normal length (218). Eccentric quasi-isometric contractions can be performed
with a wide range of loads and can be easily implemented through a specific ROM. For
example, a patient may experiment with EQI contractions by performing an EQI elbow flexion,
with the torso inclined, until the elbow reaches the end ROM (Figure 9). At this point, a second
EQI with a focus on the shoulder flexors can be initiated to impart further mechanical loading,
metabolic stress to the target tissues (Figure 10). While currently highly speculative, a
hypothetical training plan including EQIs for an athlete recovering from patellar tendonitis is
provided in table 6.
Figure 10. Eccentric quasi-isometric incline biceps curl.

Chapter 3
65
Table 6. Hypothetical resistance training program for an athlete recovering from patellar tendonitis
Day 1 Day 2
Exercise Sets x Reps Intensity Tempo ROM Exercise Sets x Reps Intensity Tempo ROM
Phase 1: Pain and load management
Isometric Wall-squat 4 x 30-60s BW N/A 30-60º Isometric knee extension 4 x 30-60s 70% MVIC N/A 30-60º
Mini-band hip-thrust 3 x 15-20 BW 2-1-2-1 Full 1-leg DB Romanian deadlift 3 x 10-12 Moderate 3-0-1-0 Full
Clam shells 3 x 10-15 Band 2-1-2-1 Full Mini-band side shuffle 3 x 10-15 Band 1-0-1-0 0-30º
EQI knee extension 2 x 60-90s 50-60% 1-RM N/A Pain free EQI knee extension 2 x 60-90s 50-60% 1-RM N/A Pain free
Phase 2: Morphological restoration
1-leg hip-thrust 3 x 10-20 BW 2-0-2-1 Full 1-leg back extension 3 x 10-20 BW 2-0-1-1 Full
Hamstring curls 3 x 8-12 Heavy 3-0-2-0 Full ECC 1-leg decline squat 3 x 10-15 BW 4-0-1-0 0-75º
Knee extensions 3 x 8-12 70-80% 1-RM 2-0-2-1 Full 1-leg press 3 x 15-20 60-70% 1-RM 2-0-1-1 Full
EQI knee extension 3 x 30-60s 70-80% 1-RM N/A 15-90º EQI 1-leg press 2 x 30-60s 70-80% 1-RM N/A 45-90º
Phase 3: Strength and functional improvement
Mini-band march 2 x 20 Band 1-0-1-0 Full BB hip-thrust 3 x 8-10 Heavy 2-1-2-1 Full
BB back squat 4 x 6-8 Heavy 3-1-3-1 Full BB front squat 4 x 5-6 Heavy 3-1-3-1 Full
Glute-ham raise 4 x 6-8 BW 3-0-1-0 Full BB Romanian deadlift 4 x 8-10 Heavy 2-0-1-1 Full
EQI skater squat 3 x 15-30s Moderate N/A 75º-floor EQI DB Bulgarian split squat 3 x 15-30s Moderate N/A 45º-floor
Each phase = 2-3 weeks. Tempo = eccentric-pause-concentric-pause. Reps = repetitions. ROM = range of motion. BW = bodyweight. N/A = not applicable. MVIC = maximal voluntary
isometric contraction. EQI = eccentric quasi-isometric. s = seconds. 1-RM = one-repetition maximum. DB = dumbbell. ECC = eccentric. BB = barbell.

Chapter 3
66
Limitations
Due to the lack of any long-term investigations regarding EQI or quasi-isometric
resistance training, limitations are abundant in this review. Like many methods of resistance
training, EQIs can be applied with an endless combination of variables including intensity,
contraction duration, repetitions, sets, rest periods, frequencies, and exercise selection. Any
adjustment to the aforementioned parameters will alter the resemblance of EQI to traditional
methods. Similarly, much is left to be determined regarding established training methods such
as isometrics. For example, while the characteristics of “pushing” and “holding” isometric
contractions differ (122, 157, 299-301, 305), there is a paucity of research examining long-
term consequences to such altered loading parameters. Researchers and practitioners need to
progress the knowledge and understanding of the acute and short-term neuromuscular,
biomechanical, and metabolic effects of quasi-isometric and EQI contractions (122, 157, 299-
301, 305). Furthermore, long-term investigations are needed to compare the potential structural
and functional adaptations to established training methods.
Practical applications
It is common for “novel” training methods to precede evidence-based practice. While
there are limited data on long-term adaptations, short-term investigations, anecdotal evidence,
and relevant scientific knowledge make a strong case for the investigation of EQI loading and
training. Based on the existing literature, the value of EQIs appears to relate most strongly to
triggering morphological rather than neuromuscular adaptations and are likely best applied
early in a periodized training plan, distal to high threshold neuromuscular work. Quasi-
isometric and EQI training may also hold value in pre and rehabilitation contexts to modify
muscle-tendon structures, provide analgesic effects, and closely match functional movements
from a neurological perspective. Finally, EQIs appear to have the potential to provide an
efficient means of increasing total load and volumes in specific positions.
Examination of EQI muscle actions and training is required due to the complete lack of
direct empirical evidence investigating this area. As such, several foci for potential research
exist. From an acute standpoint, EQI contractions may involve unique neuromuscular
activation and muscular contraction dynamics that would be worthy of investigation.
Researchers may also wish to compare the short-term effects of EQI exercise with volume
equated modalities such as dynamic or isokinetic contractions on neuromuscular fatigue,

Chapter 3
67
delayed onset muscle soreness, or the repeated bout effect. Furthermore, long-term training
studies are required to determine optimal loading parameters and exercise selection, as well as
whether adaptation is population specific.

68
Section 2 – Methodological considerations

Chapter 4
69
Chapter 4 - Variability of regional quadriceps architecture in
trained men assessed by B-mode and extended field-of-view
ultrasonography
Reference
Oranchuk DJ, Nelson AR, Storey AG, and Cronin JB. Variability of regional quadriceps
architecture in trained men assessed by B-mode and extended field-of-view ultrasonography.
Int J Sports Physiol Perform 15: 430-436, 2020.
Author contribution
Oranchuk DJ, 80%; Nelson AR, 5%; Storey AG, 5%; Cronin JB, 10%.
Prelude
Ultrasound evaluated muscle thickness, pennation angle, and fascicle length were
commonly utilized measures identified in chapters two and three. Additionally, evaluating
these measures of muscle morphology and architecture in different regions (proximal, middle,
and distal) of a muscle are increasingly common, and show dichotomous adaptations following
different exercises modes including contraction type and range of motion, and are therefore
highly relevant to eccentric quasi-isometric exercise and training. However, little is known
about the variability of regional muscle thickness, pennation angle and fascicle length
measurements in the rectus femoris, vastus lateralis and anterior and lateral vastus intermedius;
thus, quantifying this variability provides the purpose of chapter four.

Chapter 4
70
Introduction
Ultrasonographic examination of skeletal muscle architecture in different regions (i.e.,
proximal, middle, distal) has become common as a non-invasive means to assess physiological
adaptations (111, 221, 250, 268). While the links with performance remain unclear,
architectural evaluations of muscle thickness (MT), pennation angle (PA) and fascicle length
(FL) have several uses that may be important to researchers and practitioners (6, 190, 268). For
example, Abe et al. (6) and Kumagi et al. (190) found significant (p < 0.05) relationships
between 100-meter sprint performances and FL of the lower body musculature in male (r =
0.43-0.57) and female (r = 0.44-0.51) sprinters, respectively. Similarly, while not
interchangeable (109), MT, muscle volume, and cross-sectional area of specific muscles were
found to be correlated with maximal voluntary isometric force production in several cross-
sectional investigations (r = 0.45-0.77) of untrained or recreationally trained participants (13,
48, 360). Additionally, differing regional architectural adaptations have been found following
resistance training with specific contraction types (eccentric vs concentric) and ranges of
motion, with eccentric and full range training, preferentially increasing distal MT and force
production at long muscle lengths (108, 111, 250, 268, 317).
Two-dimensional B-mode ultrasonography is commonly utilized to assess MT and PA,
and calculate FL. Additionally, the extended field of view (EFOV) function; where a panoramic
view of a muscle is formed, is becoming an increasing common means of assessing FL (110,
250). However, variability data is spread across several populations, muscles and methods (6,
13, 48, 190, 360). For example, of the previously cited publications, only two examined more
than a single quadriceps head (13, 360), while Trezise et al. (360) was the only group to utilize
the EFOV function. Additionally, the sample sizes were relatively small (N = 11-22) (6, 13,
48, 190) in all but one investigation (360), and no researchers have used resistance trained
populations. Furthermore, while one study had more than two sessions, only intraclass
correlation coefficients (ICC) were reported (360), which raise some issues. For example, while
it is the most commonly reported reliability statistic, the ICC is overly reliant on between-
subject variability, whereas typical error of measure (TEM) and coefficient of variation (CV)
are minimally affected by this (149, 285). Additionally, there is a dearth of information
regarding the reliability of quadriceps architecture at different regions (191). Considering this
information, this paper aims to address these limitations by quantifying the test-retest
variability associated with region-specific MT, PA, and FL ultrasonographic measurements,

Chapter 4
71
with a large sample of homogeneous, well-trained participants, over multiple testing occasions
using a full statistical analysis including ICC, CV, and TEM.
Methods
Experimental design
Using a repeated measures design, we examined quadriceps muscle architecture at
proximal, middle, and distal regions of the vastus lateralis, rectus femoris and the anterior and
lateral vastus intermedius using B-mode and EFOV ultrasonography. Each participant was
tested on three separate occasions, separated by 5-8 days and the ICC, TEM and CV were used
to provide insight into the variability of the measurements.
Participants
Twenty-six healthy, resistance-trained males (28.8 ± 4.8 years, 180.2 ± 7.7 cm, 81.8 ±
11.8 kg) volunteered. To minimize training effects from the testing procedures, all subjects
were required to have at least six months (4.9 ± 3.8 years, range = 0.75 – 16 years) of at least
twice weekly resistance training experience (2.53 ± 0.76 sessions·week-1, range = 2-6
sessions·week-1), and be free of musculoskeletal injuries in the three months before data
collection. Participants were instructed to maintain their current level of physical activity
throughout the data collection period. The Auckland University of Technology Research Ethics
Committee approved the study (18/232), and all participants gave informed consent. All
participants were instructed to refrain from strenuous physical activity and avoid alcohol,
caffeine, and other ergogenic aids for at least 72 hours before each session.
Testing procedures
Muscle architecture
Participants were positioned in a supine position on a massage table for 15 minutes, to
allow for inter- and intra-cellular fluid re-distribution with knees and hips fully extended with
a foot strap used to prevent excessive external rotation (250). A certified ISAK Level-2
anthropometrist measured the length of the lateral and anterior aspect of the thigh, per the
instructions of Noorkoiv et al. (250). Thigh lengths were recorded, and markings were made
with an indelible pen, at 30% (proximal), 50% (middle) and 70% (distal) of the lateral and
anterior distances, respectively (221). The vastus medialis was excluded as it can be further

Chapter 4
72
broken down into the obliquus and longus portions, with deep and superficial fiber bundles
(63).
In vivo muscle architecture was determined via 2-dimensional B-mode ultrasonography
(Figure 11A) using an ultrasound transducer and built-in software (45 mm linear array, 12
MHz; GE Healthcare, Vivid S5, Chicago, IL, USA). The following trigonometric equation
calculated muscle FL (119): FL = MT × (sin θ)-1. Fascicle length was also measured by the
EFOV function as detailed extensively elsewhere (110, 250). In brief, the ultrasound probe is
moved across a muscle, while a texture mapping algorithm merges the sequence of images into
a composite image (Figure 11B) (110). A water-soluble gel was applied to the scanning head
of the ultrasound probe to achieve acoustic coupling, with care taken to avoid deformation of
muscle architecture. The probe was oriented perpendicular to the skin and parallel to the
estimated fascicle direction (110). On each occasion, two samples were captured and averaged
to give mean MT, PA, and FL.

Chapter 4
73
Figure 11. (A) B-mode ultrasound image of the mid VL and LVI. (B) Extended field-of-view
image of the VL. VL = vastus lateralis; LVI = lateral vastus intermedius; MT = muscle
thickness; PA = pennation angle; FL = fascicle length.
Data processing and analysis
Images were analyzed via digitizing software (ImageJ; National Institutes of Health,
USA). Muscle thickness (cm) was defined as the perpendicular distance between the deep and
superficial aponeurosis, and PA was defined as the angle of the fascicles relative to the deep
aponeurosis (110). Due to the depth of the muscle, the fascicles of the vastus intermedius were
not consistently visible. Therefore, PA and FL were not recorded for the lateral and anterior
vastus intermedius. As the rectus femoris is complex, in that there are distinctly different
directions of pennation, only 24/52 of distal rectus femoris measurements were able to be
determined (97, 250). Additionally, a single participant suffered a quadriceps injury during the
data collection period. Therefore, a total of 51 limbs were analysed.
Chapter 4
74
Statistical analysis
Mean, and standard deviation (SD) are reported for all variables. All data were log-
transformed to correct for heteroscedastic effects and analysed using an Excel spreadsheet.
Intersession analysis was performed on the session mean for each variable. The ICC and CV
were used to explore relative and absolute variability. An ICC < 0.67 and CV > 10% were
deemed as having large variability, moderate variability was determined from either an ICC >
0.67 or a CV < 10%, but not both, and an ICC > 0.67 and CV < 10% were deemed as having
small variability (201). Variability was also examined via TEM to provide the reader with a
practical inference of the magnitude of error expected for any change in the mean, therefore
reflecting the smallest worthwhile effect. Magnitudes for variability effects were calculated by
doubling the TEM result (201, 328) with thresholds of 0.2-0.6 (small), 0.6-1.2 (moderate), 1.2-
2.0 (large), 2.0-4.0 (very large) and > 4.0 (extremely large) (152, 201).
Results
Means, SDs, and variability data of MT measurements for all quadriceps muscles and
regions are found in Table 7, while PA data of the vastus lateralis and rectus femoris are found
in Table 8. Data for both calculated and EFOV derived FL are presented in Table 9.

Chapter 4
75
Table 7. Test-retest variability of ultrasonographic derived muscle thickness over three repeated measures.
Mean muscle thickness (cm) Days 1 - 2 Days 2 - 3
Region Day 1 Day 2 Day 3 TEM TEM
x 2
TEM
inference CV ICC
CV/ICC
inference TEM
TEM
x 2
TEM
inference CV ICC
CV/ICC
inference
Vastus lateralis
Proximal 2.5 ± 0.35 2.5 ± 0.35 2.51 ± 0.36 0.23 0.46 Small 3.1 0.95 Small 0.26 0.52 Small 3.4 0.94 Small
Middle 2.78 ± 0.43 2.8 ± 0.43 2.79 ± 0.41 0.15 0.30 Small 2.4 0.98 Small 0.20 0.40 Small 3.0 0.96 Small
Distal 2.22 ± 0.37 2.21 ± 0.36 2.19 ± 0.35 0.22 0.44 Small 3.8 0.96 Small 0.23 0.46 Small 3.8 0.95 Small
Mean 0.20 0.40 Small 3.1 0.96 Small 0.23 0.46 Small 3.4 0.95 Small
Rectus femoris
Proximal 2.75 ± 0.3 2.78 ± 0.3 2.74 ± 0.29 0.24 0.48 Small 2.7 0.95 Small 0.24 0.48 Small 2.7 0.95 Small
Middle 2.69 ± 0.32 2.70 ± 0.32 2.67 ± 0.32 0.23 0.46 Small 2.7 0.95 Small 0.27 0.54 Small 3.2 0.93 Small
Distal 1.98 ± 0.33 1.97 ± 0.3 1.96 ± 0.32 0.47 0.94 Moderate 3.7 0.95 Small 0.26 0.52 Small 4.1 0.94 Small
Mean 0.31 0.62 Moderate 3.0 0.95 Small 0.26 0.52 Small 3.3 0.93 Small
Lateral vastus intermedius
Proximal 2.01 ± 0.5 2.04 ± 0.52 2.03 ± 0.49 0.37 0.72 Moderate 9.3 0.88 Small 0.30 0.60 Moderate 7.7 0.92 Small
Middle 2.07 ± 0.55 2.09 ± 0.51 2.06 ± 0.56 0.17 0.34 Small 4.3 0.97 Small 0.17 0.34 Small 4.2 0.97 Small
Distal 1.92 ± 0.5 1.89 ± 0.51 1.89 ± 0.49 0.14 0.28 Small 3.5 0.98 Small 0.16 0.32 Small 3.9 0.98 Small
Mean 0.23 0.46 Small 5.7 0.94 Small 0.21 0.42 Small 5.3 0.96 Small
Anterior vastus intermedius
Proximal 3.0 ± 0.48 3.0 ± 0.45 3.0 ± 0.45 0.19 0.38 Small 3.0 0.97 Small 0.18 0.36 Small 2.8 0.97 Small
Middle 2.28 ± 0.5 2.29 ± 0.48 2.3 ± 0.51 0.25 0.50 Small 5.7 0.94 Small 0.21 0.42 Small 5.0 0.96 Small
Distal 1.84 ± 0.41 1.84 ± 0.4 1.83 ± 0.41 0.20 0.40 Small 3.1 0.95 Small 0.18 0.36 Small 3.4 0.94 Small
Mean 0.21 0.42 Small 4.5 0.96 Small 0.19 0.38 Small 4.0 0.97 Small
TEM = typical error of measure. CV = coefficient of variation (%). ICC = intraclass correlation coefficient.

Chapter 4
76
Table 8. Test-retest variability of ultrasonographic derived pennation angle over three repeated measures.
Mean pennation angle (°) Days 1 - 2 Days 2 - 3
Region Day 1 Day 2 Day 3 TEM
TEM
x 2
TEM
inference CV ICC
CV/ICC
inference TEM
TE
M x
2
TEM
inference CV ICC
CV/ICC
inference
Vastus lateralis
Proximal 16.9 ± 3.35 16.7 ± 3.3 17 ± 2.75 0.42 0.84 Moderate 8.0 0.85 Small 0.42 0.84 Moderate 7.1 0.86 Small
Middle 20.6 ± 3.04 20.5 ± 2.65 20.5 ± 2.58 0.75 1.50 Large 8.8 0.65 Moderate 0.71 1.42 Large 7.6 0.67 Small
Distal 22.2 ± 3.16 22.5 ± 2.62 23.1 ± 3.75 0.83 1.66 Large 3.8 0.96 Small 0.66 1.32 Large 3.3 0.95 Small
Mean 0.67 1.34 Large 6.9 0.82 Small 0.60 1.20 Moderate 6.0 0.83 Small
Rectus femoris
Proximal 18.8 ± 3.78 18.9 ± 3.69 18.9 ± 3.43 0.63 1.26 Large 11.4 0.73 Moderate 0.73 1.46 Large 12.0 0.66 Large
Middle 14.3 ± 2.97 14.7 ± 1.53 15.3 ± 2.9 0.61 1.22 Large 11.4 0.74 Moderate 1.29 2.58 Very large 17.3 0.38 Large
Distal 10.1 ± 2.41 10.1 ± 2.50 10.7 ± 2.27 0.71 1.42 Large 15.6 0.67 Moderate 0.91 1.82 Large 18.5 0.55 Large
Mean 0.65 1.30 Large 12.8 0.71 Moderate 0.98 1.96 Large 15.9 0.53 Large
TEM = typical error of measure. CV = coefficient of variation (%). ICC = intraclass correlation coefficient.

Chapter 4
77
Table 9. Test-retest variability of ultrasonographic derived calculated and extended field-of-view fascicle length over three repeated
measures.
Mean fascicle length (cm) Days 1 - 2 Days 2 - 3
Region Day 1 Day 2 Day 3 TEM TEM
x 2
TEM
inference CV ICC
CV/ICC
inference TEM
TEM
x 2
TEM
inference CV ICC
CV/ICC
inference
Vastus lateralis calculated
Proximal 8.82 ± 1.77 8.96 ± 1.89 8.73 ± 1.5 0.44 0.88 Moderate 7.5 0.84 Small 0.46 0.92 Moderate 7.5 0.83 Small
Middle 8.02 ± 1.47 8.06 ± 1.2 8.03 ± 1.18 0.64 1.28 Large 9.3 0.71 Small 0.55 1.10 Moderate 7.4 0.77 Small
Distal 5.91 ± 0.93 5.8 ± 0.84 5.64 ± 0.9 0.59 1.18 Moderate 8.2 0.75 Small 0.55 1.10 Moderate 7.7 0.77 Small
Mean 0.56 1.12 Moderate 8.3 0.77 Small 0.52 1.04 Moderate 7.5 0.79 Small
Vastus lateralis EFOV
Proximal 7.7 ± 0.69 7.84 ± 0.81 7.65 ± 0.74 0.55 1.10 Moderate 4.8 0.78 Small 0.44 0.88 Moderate 4.1 0.84 Small
Middle 8.18 ± 0.77 8.21 ± 0.86 8.11 ± 0.88 0.55 1.10 Moderate 4.9 0.78 Small 0.41 0.82 Moderate 4.1 0.86 Small
Distal 7.11 ± 0.89 7.13 ± 0.96 7.22 ± 1.01 0.39 0.78 Moderate 4.7 0.87 Small 0.54 1.08 Moderate 6.6 0.78 Small
Mean 0.50 1.00 Moderate 4.8 0.81 Small 0.46 0.92 Moderate 4.9 0.83 Small
Rectus femoris calculated
Proximal 8.85 ± 1.86 8.87 ± 1.83 8.66 ± 1.58 0.58 1.16 Moderate 10.7 0.75 Moderate 0.69 1.38 Large 11.6 0.69 Moderate
Middle 11.3 ± 2.48 11 ± 2.0 10.8 ± 2.39 0.62 1.24 Large 11.2 0.73 Moderate 1.33 2.66 Very large 17.9 0.37 Large
Distal 11.8 ± 2.97 11.9 ± 3.17 11 ± 2.61 0.70 1.40 Large 16.0 0.68 Moderate 0.92 1.84 Large 19 0.55 Large
Mean 0.63 1.26 Large 12.6 0.72 Moderate 0.98 1.96 Large 16.2 0.54 Large
Rectus femoris EFOV
Proximal 8.14 ± 0.95 8.13 ± 0.83 8.19 ± 0.73 0.52 1.04 Moderate 5.4 0.80 Small 0.54 1.08 Moderate 4.8 0.78 Small
Middle 10.2 ± 1.48 10.2 ± 1.52 9.83 ± 1.48 0.51 1.02 Moderate 7.1 0.80 Small 0.88 1.76 Large 10.5 0.57 Large
Distal 12.1 ± 2.29 12.6 ± 2.5 11.8 ± 2.41 0.26 0.52 Small 5.2 0.94 Small 0.65 1.30 Large 11.5 0.72 Moderate
Mean 0.43 0.86 Moderate 5.9 0.85 Small 0.69 1.38 Large 8.9 0.69 Small
TEM = typical error of measure. CV = coefficient of variation (%). ICC = intraclass correlation coefficient. EFOV = extended field-of-view

Chapter 4
78
Magnitudes of variability were small to moderate for all measures of MT (ICC = 0.88-
0.98, CV = 2.4-9.3%, TEM = 0.16-0.47). Pennation angle of the vastus lateralis was found to
have small to large variabilities (ICC = 0.65-0.96, CV = 3.8-8.8%, TEM = 0.42-0.83).
Conversely, rectus femoris was found to have moderate to large variability regardless of region
(ICC = 0.38-0.74, CV = 11.4-18.5%, TEM = 0.61-1.29). The EFOV technique (ICC = 0.57-
0.94, CV = 4.1-11.5%, TEM = 0.26-0.88) demonstrate smaller variability than
trigonometrically derived (ICC = 0.37-0.84, CV = 7.4-17.9%, TEM = 0.44-1.33) measurements
of FL, across all regions.
Discussion
The variability associated with regional MT, PA and calculated and EFOV-derived FL
of vastus lateralis, rectus femoris and lateral and anterior vastus intermedius in resistance
trained males, was important to determine given the identified limitations in the existing
literature. The main findings were: 1) MT variability was small in all quadriceps muscle heads
and regions, 2) only rectus femoris PA and FL measurements were found highly variable; and
3) the EFOV technique should be utilized to assess FL where possible.
The MT of all measured quadriceps heads, at all regions, had low variability (ICC =
0.88-0.98, CV = 2.4-9.3%, TEM = 0.16-0.47). These results are similar to previous findings
that report low variability of ultrasound-derived MT (13, 110, 221). Therefore, it would seem
MT is a stable measurement and can be used with confidence by researchers and practitioners,
at least over a period of 5-8 days.
In terms of PA, rectus femoris was found to have moderate to large variability
regardless of region (ICC = 0.38-0.74, CV = 11.4-18.5%, TEM = 0.61-1.29). However, more
than half of the distal rectus femoris images were unusable, dramatically lowering statistical
power, and likely contributing to the large variabilities. The variability of the PA for the vastus
lateralis regions was found to be acceptable (ICC = 0.65-0.96, CV = 3.3-8.8%, TEM = 0.42-
0.83). These findings support the proclivity of researchers exclusively evaluating PA in the
vastus lateralis (6, 48, 190).
The EFOV technique (ICC = 0.57-0.94, CV = 4.1-11.5%, TEM = 0.26-0.88) was found
to have less variability than trigonometrically-derived (ICC = 0.37-0.84, CV = 7.4-17.9%,

Chapter 4
79
TEM = 0.44-1.33) measurements of FL, across all muscles and regions, which was similar to
previous reports (110). Calculated vastus lateralis FL demonstrated reasonably low variability,
suggesting that vastus lateralis FL can be consistently derived via trigonometric calculation
when the EFOV function is not available. However, it must be noted that while both show
acceptable variability, distal vastus lateralis FL measures were dissimilar between the
trigonometric and EFOV methods. This can be attributed to irregular pennation angle and
muscle thickness changes, and to the fact that the trigonometric equation neglects curvature.
Conversely, calculated rectus femoris FL had moderate to very large variability.
Practical applications
The results of this study provide insight regarding which ultrasound-derived regional
quadriceps architectural measures can be studied with confidence. While MT can be relied
upon for all muscles and regions, PA of all muscles and regions, and rectus femoris FL should
be interpreted with caution. Furthermore, while both EFOV and trigonometric methods
resulted in acceptable variabilities of regional vastus lateralis FL, the two methods should not
be used interchangeably as both reliability and validity are required before a measurement
technique can be deemed useful.
While the report fulfils its primary purpose, limitations and future research direction
exist. Firstly, between-practitioner experience and technical training may result in differing
degrees of variability (110). Similarly, different equipment specifications, including probe size
could most certainly alter variability (110). Muscle architecture variability should be examined
in other homogenous populations, including resistance-trained women.
Conclusions
When evaluating muscle architecture, researchers and practitioners can be confident in
MT assessments regardless of quadriceps head or region. However, PA and FL of the rectus
femoris had consistently larger TEMs, CVs and smaller ICCs when compared to the vastus
lateralis. Therefore, larger changes to the architecture of rectus femoris are required for
practitioners to be confident that training-induced adaptation has occurred. Finally, the EFOV
function should be the method of choice when evaluating FL in the proximal, middle, or distal
regions of the vastus lateralis and rectus femoris.

Chapter 5
80
Chapter 5 - Variability of regional quadriceps echo intensity in
active young men with and without subcutaneous fat correction
Reference
Oranchuk DJ, Stock MS, Nelson AR, Storey AG, and Cronin JB. Variability of regional
quadriceps echo intensity in active young men with and without subcutaneous fat correction.
Appl Physiol Nutr Metab 45: 745-752, 2020.
Author contribution
Oranchuk DJ, 80%; Stock MS, 8%; Nelson AR, 4%; Storey AG, 4%; Cronin JB, 4%.
Prelude
While chapter four focused on the most traditional measures of muscle morphology and
architecture, the relatively novel ultrasonographic measure of echo intensity, a proposed
measure of muscle quality, is becoming increasingly popular. In brief, echo intensity refers to
the brightness of an ultrasound image and as fat infiltrates, metabolic waste products and
connective tissues are known to increase brightness, it is likely that regional echogenicity may
provide an interesting means of evaluating and comparing the effects of eccentric quasi-
isometric resistance-training, and other contraction types. Additionally, long-term adaptations
may relate to acute echo intensity changes. However, the variability of regional (proximal,
middle, distal) echo intensity of the vastus lateralis, rectus femoris, and lateral and anterior
vastus intermedius had yet to be determined. Furthermore, the effect of adjusting echo intensity
for an individual’s subcutaneous fat thickness required further examination.

Chapter 5
81
Introduction
Ultrasonographic evaluations are widely reported and utilized to assess acute (67) and
long-term effects of training (221), the ageing process (240), and the relationship between
muscular qualities and performance (60, 63, 336). While most ultrasonographic evaluations
focus on architectural measures such as thickness, pennation angle and fascicle length, echo
intensity (EI) has become commonly utilized (60, 67, 77, 253, 336). While not yet conclusive,
EI is thought to be a non-invasive means of evaluating the current quality of a muscle, as
elevated echogenicity is related to muscle damage (67, 253), collagen (282), fat infiltration
(395), and oedema (62).
The examination of regional (proximal, middle, distal) muscle architecture has become
increasingly common (263) as specific modes of resistance training may result in region-
specific adaptations (111, 221, 250, 268). Furthermore, correlations of muscle architecture and
morphology to performance differ based on the assessed region (360). However, with few
exceptions (221, 395), EI evaluation in different regions has not yet been widely adopted by
researchers or practitioners, leaving a fascinating area for future investigation. For example,
different modes of exercise may cause acute, region-specific alterations in hormonal and
metabolic factors that may correlate to long-term adaptations (112, 346); which could aid in
further understanding the underlying mechanisms of region-specific morphological alterations.
Furthermore, muscles tend to increase in collagen with age and injury (400); therefore,
evaluating regional EI may provide insight into the ageing process without resorting to invasive
methods such as biopsies.
Several recent reports have examined the reliability, interchangeability of methods, and
optimal collection procedures of EI (62, 80, 356, 374-376). However, many studies examining
EI report no reliability data (60, 253), while others report the coefficient of variation (CV) (67)
or intraclass correlation coefficient (ICC) in isolation (77, 240), which raises some issues. For
example, while it is the most commonly reported reliability statistic, the ICC is overly reliant
on between-subject variability, whereas typical error of measure (TEM) and CV are minimally
affected by this (285). Additionally, no studies have examined the variability of EI over more
than two testing sessions. Moreover, while subcutaneous fat tissue can affect the quality of
ultrasonographic imaging and reduce the ability of EI to predict muscle function (338), studies
examining regional muscle EI have not adjusted for fat thickness (221), and/or have not

Chapter 5
82
examined the deep musculature of the vastus intermedius (221, 395). Similarly, the single study
comparing the reliability of EI with and without subcutaneous fat correction only examined the
middle region of the vastus lateralis, during a single session i.e., within session reliability
(374). Therefore, the primary purpose of this study was to robustly determine the variability of
EI, with and without correction for subcutaneous fat thickness, assessed over three sessions, in
three distinct regions (proximal, middle, distal) of the superficial and deep knee extensor
muscles. Furthermore, we aimed to compare corrected EI in different regions of each
quadriceps muscle.
Methods
Experimental design
Using a repeated measures design, we examined quadriceps muscle EI at proximal,
middle, and distal regions of the vastus lateralis, rectus femoris and the anterior and lateral
vastus intermedius using B-mode ultrasonography, collected in the longitudinal plane, with and
without subcutaneous fat thickness corrections. Each participant was tested on three separate
occasions, separated by seven days and the ICC, TEM, and CV were used to provide insight
into the intersession variability of the measurement. The interchangeability of each muscle
region was also examined.
Participants
Twenty healthy, resistance-trained males (26.9 ± 5.2 years, 1.78 ± 0.07 m, 80.5 ± 10.7
kg, 25.2 ± 5.2 kg/m2) volunteered. As determined via questionnaire, all participants were
required to have at least six months (4.1 ± 3.5 years, range = 1.2 – 16 years) of resistance
training experience (2.71 ± 0.56 sessions·week-1, range = 2-5 sessions·week-1) and were free
of musculoskeletal injuries in the three months before data collection. Participants were
instructed to maintain their current level of physical activity throughout the data collection
period. The Auckland University of Technology Research Ethics Committee approved the
study (18/232), and all participants gave informed consent. All participants were instructed to
refrain from strenuous physical activity for at least 48 hours before each session.
Testing procedures
During the initial visit to the laboratory, the subjects’ height and body mass were
recorded using a stadiometer (Holtain Ltd, Crymych, United Kingdom) and a digital scale

Chapter 5
83
(Weightec, Auckland, New Zealand). At each session, participants were positioned in a supine
position on a massage table for 10 minutes, to allow for inter- and intra-cellular fluid re-
distribution (356) with knees and hips fully extended with a foot strap used to prevent excessive
external rotation (250). A certified ISAK Level-2 anthropometrist measured the length of the
lateral and anterior aspect of the thigh, per the instructions of Noorkoiv et al. (250). The length
of the lateral aspect of the thigh was determined by measuring the distance from the superior
border of the greater trochanter to the inferior border of the lateral condyle of the femur. The
anterior aspect of the thigh was determined by measuring the distance between the superior
border of the patella and the inferior border of the anterior, superior iliac spine. Thigh lengths
were recorded, and markings were made with an indelible pen, at 30% (proximal), 50%
(middle) and 70% (distal) of the lateral and anterior distances, respectively (221). The vastus
lateralis and lateral vastus intermedius (Figure 12A), and rectus femoris and anterior vastus
intermedius (Figure 12B) were collected in the same image, respectively. The vastus medialis
was excluded as it can be further broken down into the obliquus and longus portions, with deep
and superficial fiber bundles (63).
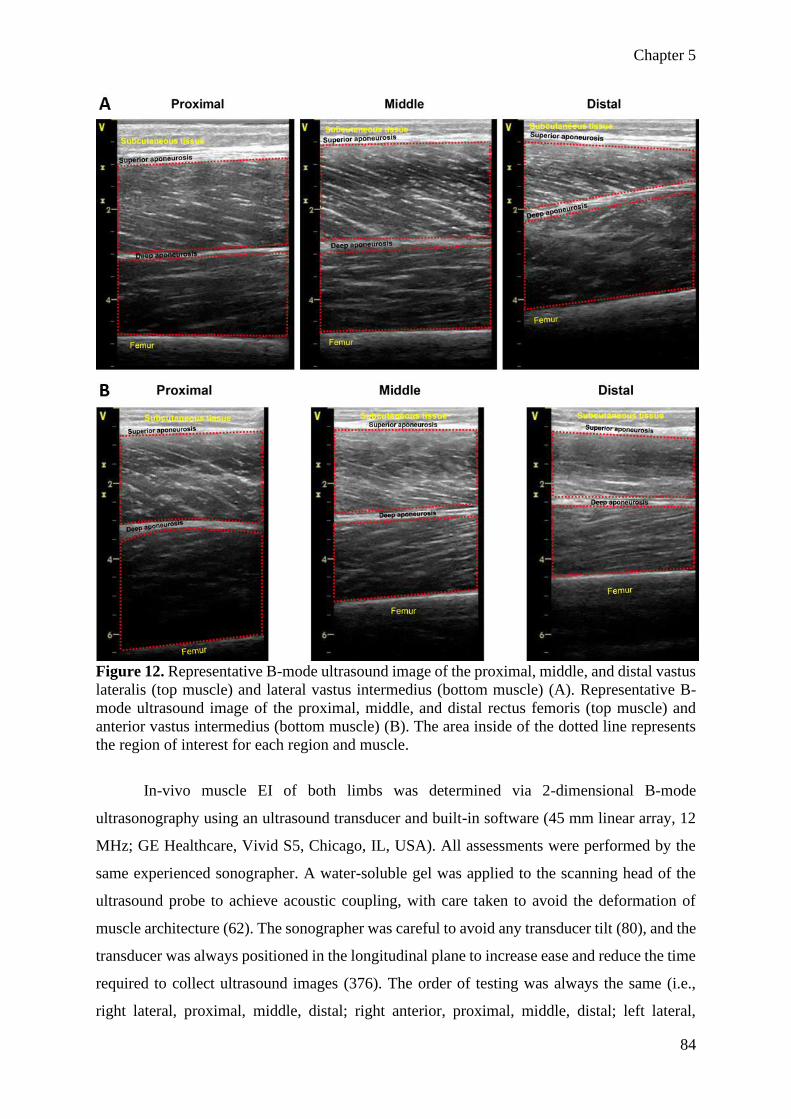
Chapter 5
84
Figure 12. Representative B-mode ultrasound image of the proximal, middle, and distal vastus
lateralis (top muscle) and lateral vastus intermedius (bottom muscle) (A). Representative B-
mode ultrasound image of the proximal, middle, and distal rectus femoris (top muscle) and
anterior vastus intermedius (bottom muscle) (B). The area inside of the dotted line represents
the region of interest for each region and muscle.
In-vivo muscle EI of both limbs was determined via 2-dimensional B-mode
ultrasonography using an ultrasound transducer and built-in software (45 mm linear array, 12
MHz; GE Healthcare, Vivid S5, Chicago, IL, USA). All assessments were performed by the
same experienced sonographer. A water-soluble gel was applied to the scanning head of the
ultrasound probe to achieve acoustic coupling, with care taken to avoid the deformation of
muscle architecture (62). The sonographer was careful to avoid any transducer tilt (80), and the
transducer was always positioned in the longitudinal plane to increase ease and reduce the time
required to collect ultrasound images (376). The order of testing was always the same (i.e.,
right lateral, proximal, middle, distal; right anterior, proximal, middle, distal; left lateral,

Chapter 5
85
proximal, middle, distal; left anterior, proximal, middle, distal). While supine rest time may
alter muscle architecture and radiological density of muscle (44), the difference in EI between
right and left limbs were considered small (ES = 0.13) and the values were highly correlated (r
= 0.98). Two consecutive scans were acquired for each muscle and region. The two images
were averaged for further analysis. Ultrasound settings (Frequency: 12MHz, Brightness:
maximum, gain: 60 dB, dynamic range: 70) were kept consistent across participants. Due to
large differences in muscle thickness, scanning depth was individualized for each participant,
muscle and region, and recorded and maintained through all collections (62).
Data processing and analysis
Images were analyzed via digitizing software (ImageJ; National Institutes of Health,
USA). The region of interest was defined as the perpendicular distance between the deep and
superficial aponeurosis of each muscle (Figure 12) and extended to each end of the B-mode
image (62, 375). The polygon function was utilized to define the region of interest. Great care
was taken to ensure the largest possible region of interest was captured, without the inclusion
of aponeurosis or bone (62, 375). The straight-line function was utilized to assess the
subcutaneous fat thickness of each image. Subcutaneous fat thickness was determined from the
average of the proximal, middle and distal values of each image (302). All images were
inspected and analysed by the sonographer. Corrected EI was calculated as uncorrected EI +
(subcutaneous fat thickness [cm] × 40.5278) (395).
Statistical analysis
Mean, and standard deviation (SD) were reported for all variables. All data were log-
transformed to correct for heteroscedastic effects and analysed using an Excel spreadsheet
(149). The test-retest analysis was performed on the session mean for each variable. Sessions
one-two, two-three and one-three were compared. The ICC (type 3,1) and CV were used to
explore relative and absolute variability. An ICC < 0.67 and CV > 10% were deemed as having
large variability, moderate variability was determined from either an ICC > 0.67 or a CV <
10%, but not both, and an ICC > 0.67 and CV < 10% were deemed as having small variability
(263). Variability was also examined via TEM to provide the reader with a practical inference
of the magnitude of error expected for any change in the mean (263). Magnitudes for variability
effects were calculated by doubling the TEM result with thresholds of 0.2-0.6 (small), 0.6-1.2
(moderate), 1.2-2.0 (large), 2.0-4.0 (very large) and > 4.0 (extremely large) (152, 263).

Chapter 5
86
The following statistical analyses were performed using the SPSS statistical analysis
software (Version 25, IBM Corporation, Armonk, NY). An initial statistical analysis showed
nearly identical corrected EI values for the dominant and non-dominant limbs (p = 0.273, ES
= 0.071, r = 0.973). As such, data from both limbs were combined to create a single variable.
A two-way (muscle [vastus lateralis, lateral vastus intermedius, rectus femoris, anterior vastus
intermedius] × location [proximal, middle, distal]) repeated-measures analysis of variance
(ANOVA) was used to detect differences in EI values among the regions and muscles, with the
mean of the three sessions utilized for analysis. In the event of a significant (p < 0.05) two-way
interaction, the data were further decomposed into separate repeated measures ANOVAs across
muscle and location. Significant main effects were further evaluated with Bonferroni pairwise
comparisons. Cohen’s d effect size (ES) were calculated to measure the magnitude of effect
using these criteria: trivial < 0.2, small = 0.2-0.49, moderate = 0.5-0.79, and large > 0.8 (115).
To determine interchangeability and quantify the degree of shift in muscle EI along the length
of each muscle, a correlational analysis was performed between each adjacent region (proximal
vs middle, middle vs distal) using a Pearson (r) product-moment correlation test. Correlation
coefficients of 0.10-0.29, 0.30-0.49, 0.50-0.69, 0.70-0.89 and ≥ 0.90 were considered small,
moderate, large, very large and nearly perfect, respectively (152). Individual participant data
were displayed using previously published Excel templates (387).
Results
For uncorrected EI, statistically significant differences were found for all four muscles
(p < 0.001). Apart from the proximal and middle regions of the lateral vastus intermedius (p =
0.676), all regional comparisons were significant (p ≤ 0.004) and showed that EI values
increased as the measurement sites moved distally (proximal < middle < distal; Figure 13). The
effect sizes for the proximal-to-middle comparisons were as follows: vastus lateralis ES = 0.19
(trivial); rectus femoris ES = 0.33 (small); lateral vastus intermedius ES = 0.10 (trivial);
anterior vastus intermedius ES = 0.88 (large). The middle-to-distal comparisons were: vastus
lateralis ES = 0.50 (moderate); rectus femoris ES = 0.22 (small); lateral vastus intermedius ES
= 0.58 (moderate); anterior vastus intermedius ES = 0.82 (large). Very large to nearly perfect
correlations were found between all adjacent regions of each muscle (r = 0.78-0.96).

Chapter 5
87
Figure 13. Individual regional uncorrected echo intensity of the quadriceps.
The results of the two-way repeated-measures ANOVA indicated that there was a
significant muscle × location interaction (p < 0.001) for corrected EI. Follow-up analyses
demonstrated that, for a given region, there were significant differences among all four muscles
(p < 0.026, ES = 0.22-2.29), with the only exception being a non-significant difference at the
proximal regions of the rectus femoris and vastus lateralis (p = 1.0, ES = 0.07). However,
differences among locations for each muscle were more variable (Figure 14). Whereas the
vastus lateralis, lateral vastus intermedius, and anterior vastus intermedius all showed
differences among the proximal, middle, and distal regions, the rectus femoris displayed similar
corrected EI values along its length (p = 0.143, ES = 0.02-0.11). For the vastus lateralis,
corrected EI was lower at the middle than both the proximal (p < 0.001, ES = 0.43) and distal
ends (p < 0.001, ES = 0.38). The lateral vastus intermedius displayed significant differences (p
≤ 0.038, ES = 0.35-0.82) among all locations (proximal > distal > middle). For the anterior
vastus intermedius, similar corrected EI values were found at the proximal and middle ends
(ES = 0.11), while both regions were significantly lower than the distal end (p < 0.001, ES =
0.54-0.63). Finally, corrected EI of adjacent regions (e.g., middle, and distal vastus lateralis)
were very large to nearly perfectly correlated (r = 0.89-0.96) for the vastus intermedius and
rectus femoris, and moderate to very large for the lateral and anterior vastus intermedius (r =
0.61-0.79).

Chapter 5
88
Figure 14. Individual regional subcutaneous fat thickness corrected quadriceps echo intensity
of the quadriceps.
Session means and SD, and intersession variability data of uncorrected EI
measurements for all quadriceps muscles and regions are found in Table 10. Small to moderate
variability was found in all regions of the vastus lateralis, rectus femoris, lateral vastus
intermedius, and proximal and middle portions of the anterior vastus intermedius (ICC = 0.83-
0.98, CV = 7.7-41.7%, TEM = 0.14-0.47). However, distal anterior vastus intermedius had
moderate to large variability (ICC = 0.69-0.85, CV = 32.8-42.7%, TEM = 0.45-0.68).

Chapter 5
89
Table 10. Test-retest variability of regional quadriceps uncorrected echo intensity over three repeated measures.
Echo intensity (au) Days 1 - 2 Days 2 - 3 Days 1-3
Region Day 1 Day 2 Day 3 TEM TEM
x 2
TEM
inference CV ICC
CV/ICC
inference TEM
TEM
x 2
TEM
inference CV ICC
CV/ICC
inference TEM
TEM
x 2
TEM
inference CV ICC
CV/ICC
inference
Vastus lateralis
Proximal 50.3 ± 11.9 50.1 ± 12.2 50.7 ± 12.3 0.23 0.46 Small 12.7 0.95 Moderate 0.26 0.52 Small 15 0.94 Moderate 0.21 0.42 Small 11.9 0.96 Moderate
Middle 54.4 ± 10.5 55.6 ± 11.2 54.8 ± 11.3 0.27 0.54 Small 12.9 0.94 Moderate 0.26 0.52 Small 13.2 0.94 Moderate 0.22 0.44 Small 11.6 0.95 Moderate
Distal 67.7 ± 13.7 68.9 ± 13.8 67.9 ± 13.7 0.14 0.28 Small 7.7 0.98 Small 0.17 0.34 Small 9.1 0.97 Small 0.15 0.30 Small 8.4 0.98 Small
Mean 0.21 0.42 Small 11.1 0.96 Moderate 0.23 0.46 Small 12.4 0.95 Moderate 0.19 0.38 Small 10.6 0.96 Moderate
Rectus femoris
Proximal 52.6 ± 16.3 53.7 ± 16 52.6 ± 16 0.24 0.48 Small 13.1 0.95 Moderate 0.29 0.58 Small 16.8 0.92 Moderate 0.20 0.40 Small 12 0.96 Moderate
Middle 61.5 ± 13.8 61.8 ± 13.8 61.3 ± 12.9 0.22 0.44 Small 10.8 0.96 Moderate 0.15 0.30 Small 10.8 0.98 Moderate 0.16 0.32 Small 7.9 0.98 Small
Distal 68.2 ± 15.7 67.2 ± 16.3 68.6 ± 16 0.24 0.48 Small 15.5 0.95 Moderate 0.21 0.42 Small 12.8 0.96 Moderate 0.25 0.50 Small 15.7 0.95 Moderate
Mean 0.23 0.46 Small 13.1 0.95 Moderate 0.22 0.44 Small 13.5 0.90 Moderate 0.20 0.41 Small 11.9 0.96 Moderate
Lateral vastus intermedius
Proximal 13.9 ± 11.1 13.8 ± 10.2 14.5 ± 10.9 0.35 0.70 Moderate 35.1 0.90 Moderate 0.42 0.84 Moderate 41.7 0.86 Moderate 0.32 0.64 Moderate 31 0.91 Moderate
Middle 15.1 ± 11.3 15 ± 10.1 15.4 ± 12.2 0.44 0.88 Moderate 39.3 0.84 Moderate 0.32 0.64 Moderate 30 0.91 Moderate 0.44 0.88 Moderate 40.8 0.85 Moderate
Distal 23.7 ± 12.5 23.4 ± 10 23 ± 10.1 0.31 0.62 Moderate 22.9 0.92 Moderate 0.37 0.74 Moderate 27.1 0.88 Moderate 0.36 0.72 Moderate 27.6 0.89 Moderate
Mean 0.37 0.74 Moderate 32.4 0.89 Moderate 0.37 0.74 Moderate 32.9 0.88 Moderate 0.37 0.75 Moderate 31.1 0.88 Moderate
Anterior vastus intermedius
Proximal 7.9 ± 5.3 7.8 ± 6.8 7.8 ± 5.5 0.39 0.78 Moderate 26.3 0.87 Moderate 0.38 0.76 Moderate 24.9 0.88 Moderate 0.42 0.84 Moderate 26.9 0.86 Moderate
Middle 15.4 ± 7.7 14.9 ± 7.2 15.5 ± 7.6 0.41 0.82 Moderate 26.6 0.86 Moderate 0.47 0.94 Moderate 30.5 0.83 Moderate 0.49 0.98 Moderate 30.5 0.82 Moderate
Distal 26.4 ± 9.1 28.1 ± 12.5 25.5 ± 7 0.55 1.10 Moderate 37.5 0.77 Moderate 0.68 1.36 Large 42.7 0.69 Moderate 0.45 0.72 Moderate 32.8 0.85 Moderate
Mean 0.45 0.90 Moderate 30.1 0.83 Moderate 0.51 1.02 Moderate 32.7 0.80 Moderate 0.42 0.85 Moderate 26.7 0.86 Moderate
au = arbitrary units. TEM = typical error of measure. CV = coefficient of variation (%). ICC = intraclass correlation coefficient. All statistics are log-transformed.
Chapter 5
90
Session means and SD, and intersession variability data of corrected EI measurements
for all quadriceps muscles and regions are found in Table 11. Small variability was found in
all regions of the vastus lateralis and rectus femoris (ICC = 0.95-0.98, CV = 4.5-8.3%, TEM =
0.13-0.24). Small to moderate intersession variability was found in the lateral and anterior
vastus intermedius (ICC = 0.81-0.95, CV = 7.1-16.8%, TEM = 0.23-0.49).

Chapter 5
91
Table 11. Test-retest variability of regional quadriceps corrected echo intensity over three repeated measures.
Echo intensity (au) Days 1 - 2 Days 2 - 3 Days 1-3
Region Day 1 Day 2 Day 3 TEM TEM
x 2
TEM
inference CV ICC
CV/ICC
inference TEM
TEM
x 2
TEM
inference CV ICC
CV/ICC
inference TEM
TEM
x 2
TEM
inference CV ICC
CV/ICC
inference
Vastus lateralis
Proximal 85.3 ± 27.1 86.1 ± 28.3 86.2 ± 28.1 0.18 0.36 Small 5.9 0.97 Small 0.24 0.48 Small 8.2 0.95 Small 0.23 0.46 Small 7.7 0.95 Small
Middle 73.7 ± 24.5 75.6 ± 24.8 74.7 ± 24.9 0.22 0.44 Small 7.7 0.96 Small 0.23 0.46 Small 8.2 0.95 Small 0.22 0.44 Small 8.2 0.95 Small
Distal 84.1 ± 28.3 85.3 ± 27.9 84.8 ± 28.5 0.17 0.34 Small 6.2 0.97 Small 0.18 0.36 Small 6.8 0.97 Small 0.18 0.36 Small 6.5 0.97 Small
Mean 0.19 0.38 Small 6.6 0.97 Small 0.22 0.44 Small 7.7 0.96 Small 0.21 0.42 Small 7.5 0.96 Small
Rectus femoris
Proximal 86.9 ± 30.9 88.1 ± 29.9 87.7 ± 31.8 0.20 0.40 Small 7.6 0.96 Small 0.24 0.48 Small 9.1 0.95 Small 0.19 0.38 Small 7.4 0.97 Small
Middle 87.1 ± 29 87.5 ± 30.3 86.9 ± 30.1 0.19 0.38 Small 6.6 0.97 Small 0.15 0.30 Small 5.1 0.98 Small 0.13 0.26 Small 4.5 0.98 Small
Distal 91.6 ± 33.2 90.6 ± 33.8 92.2 ± 33.2 0.20 0.40 Small 8.3 0.96 Small 0.20 0.40 Small 7.9 0.97 Small 0.19 0.38 Small 7.5 0.97 Small
Mean 0.20 0.40 Small 7.5 0.96 Small 0.20 0.40 Small 7.4 0.97 Small 0.17 0.34 Small 6.5 0.97 Small
Lateral vastus intermedius
Proximal 48.8 ± 21 49.8 ± 21.2 50 ± 21.5 0.26 0.52 Small 8.9 0.94 Small 0.26 0.52 Small 8.9 0.94 Small 0.23 0.46 Small 8 0.95 Small
Middle 34.4 ± 13.2 35 ± 13.5 35.3 ± 12.8 0.33 0.66 Moderate 11.9 0.90 Moderate 0.28 0.56 Small 9.6 0.93 Small 0.27 0.54 Small 9.6 0.93 Small
Distal 40.1 ± 17.5 39.7 ± 16.1 39.9 ± 15.3 0.29 0.58 Small 11.3 0.93 Moderate 0.36 0.72 Moderate 12.8 0.89 Small 0.38 0.76 Moderate 14.7 0.88 Moderate
Mean 0.29 0.58 Small 10.7 0.92 Moderate 0.30 0.60 Moderate 10.4 0.92 Moderate 0.29 0.58 Small 10.8 0.92 Moderate
Anterior vastus intermedius
Proximal 42.1 ± 13.1 42.2 ± 13.4 42.9 ± 13.5 0.25 0.50 Small 7.8 0.94 Small 0.23 0.46 Small 7.1 0.95 Small 0.29 0.58 Small 8.9 0.93 Small
Middle 41 ± 14.6 40.6 ± 13.1 41 ± 13.4 0.31 0.62 Moderate 9.8 0.92 Small 0.32 0.64 Moderate 10.1 0.91 Moderate 0.27 0.54 Small 8.8 0.92 Small
Distal 49.8 ± 20 51.4 ± 20.4 49.1 ± 18 0.47 0.94 Moderate 11.3 0.83 Moderate 0.49 0.98 Moderate 16.8 0.81 Moderate 0.40 0.80 Moderate 13.2 0.85 Moderate
Mean 0.38 0.76 Moderate 6.9 0.90 Small 0.35 0.70 Moderate 11.3 0.86 Moderate 0.32 0.64 Moderate 10.3 0.90 Moderate
au = arbitrary units. TEM = typical error of measure. CV = coefficient of variation (%). ICC = intraclass correlation coefficient. All statistics are log-transformed.

Chapter 5
92
Discussion
A comprehensive analysis of the intersession variability associated with EI at multiple
regions of the superficial and deep quadriceps femoris musculature was previously lacking.
Additionally, no studies had examined the effect of subcutaneous fat thickness correction on
intersession variability of EI. The present investigation’s primary findings were: 1) that
intersession variability of regional quadriceps EI was reasonably low in all muscles and regions
except of the distal anterior vastus intermedius; 2) intersession variability of regional EI was
substantially reduced following subcutaneous fat correction and, 3) with the exception of the
rectus femoris, corrected EI nearly always increased as measurements moved away from the
mid-region. Therefore, correction for subcutaneous fat thickness should be utilized before EI
measures can be used with confidence; additionally, careful delineation of muscular regions is
necessary.
The most pertinent finding of the present investigation was that intersession variability
was considerably lower in corrected (ICC = 0.81-0.98, CV = 4.5-16.8%, TEM = 0.13-0.49)
versus raw (ICC = 0.69-0.98, CV = 7.7-42.7%, TEM = 0.14-0.68) EI values; a finding that has
not been previously reported. While the lack of previous research on regional differences make
direct, region-to-region comparison difficult, EI variability in the middle region of a variety of
muscles have been reported (62, 67, 221, 240, 384). In this study, the superficial muscles
(vastus lateralis and rectus femoris) were observed to have small to moderate variability with
raw EI (ICC = 0.92-0.98, CV = 7.7-16.8%, TEM = 0.15-0.29) and small variability once
corrected (ICC = 0.95-0.98, CV = 4.5-9.1%, TEM = 0.13-0.25). These findings are similar to
those of previous studies that reported CVs ranging from 6.8-7.4% and correlations between
0.74-0.97 in the superficial quadriceps or elbow-flexors (62, 67, 221, 240, 384). However, it
should be noted that only Mota and Stock (240) corrected for subcutaneous fat.
While subcutaneous fat correction slightly reduced intersession variability of the
superficial compartments, a more dramatic improvement was present in the vastus intermedius.
When examining raw EI values, the ICC (0.84-0.94) and TEM (0.31-0.47) were reasonably
acceptable in the proximal and middle vastus intermedius, while CVs were notably greater
(26.3-30.5%) than the superficial musculature. Additionally, larger variabilities were found for
the distal anterior vastus intermedius (ICC = 0.69-0.85, CV = 32.8-42.7%, TEM = 0.45-0.68).
However, once corrected for subcutaneous fat thickness, intersession variability of the lateral

Chapter 5
93
and anterior vastus intermedius were small to moderate (ICC = 0.81-0.95, CV = 7.1-16.8%,
TEM = 0.23-0.49) regardless of region. Unfortunately, to our knowledge, the only investigation
reporting vastus intermedius EI variability did not include TEM or CV statistics. Additionally,
variability was only determined within a session, making a direct comparison to our study
difficult; however, the variability reported (ICC ≥ 0.95) is similar to our data (77). Additionally,
Cruz-Montecinos et al. (77) reported lower (p = 0.048) EI in the anterior vastus intermedius
when compared to the rectus femoris, in agreement with the present findings.
When examining the corrected EI values, apart from the proximal vastus lateralis (85.5
± 27.4) and proximal rectus femoris (87.6 ± 30.4), there were significant (p < 0.026, ES = 0.22-
2.29) between-muscle differences for a given location (proximal, middle, distal). Additionally,
EI was always lower in the deep musculature of the lateral and anterior vastus intermedius
when compared to the more superficial vastus lateralis and rectus femoris, in agreement with
Cruz-Montecinos et al. (77) who reported lower (p = 0.048) EI in the anterior vastus
intermedius when compared to the rectus femoris. While corrected EI of the rectus femoris did
not differ between regions p = 0.143, ES = 0.02-0.11), the opposite was true for the vastus
muscles. Corrected EI at proximal and distal regions was greater than the middle for both the
vastus lateralis and lateral vastus intermedius, while the distal anterior vastus intermedius was
greater than the middle. In contrast, raw EI nearly always increased as the measurements
approached the knee, most likely due to noticeably different subcutaneous fat thickness at the
proximal (lateral = 0.88 ± 0.6 cm; anterior = 0.85 ± 0.34 cm), middle (lateral = 0.49 ± 0.29;
anterior = 0.63 ± 0.22), and distal (lateral = 0.41 ± 0.15 cm; anterior = 0.58 ± 0.2 cm), regions.
As such, image quality was likely degraded by larger magnitudes as measures approached the
hip, highlighting the importance of correcting for subcutaneous fat thickness when assessing
the echogenicity of multiple regions of a muscle, or throughout a longitudinal intervention
where changes in fat thickness are expected. To our knowledge, this is the first study to
demonstrate increasing EI towards the proximal and distal portion of a muscle. However, this
finding can be supported as muscles tend to gradually increase in collagen content as they
approach and transition to the myotendinous junctions (341).
While the primary aim of this investigation was achieved, readers should be aware of
several limitations and directions for future research. Firstly, differences in machine
specifications and brightness, gain, depth, and dynamic range settings do not allow for the
utilization of EI as normative data. Additionally, readers should be aware that we collected our

Chapter 5
94
images in the longitudinal, and not the transverse plane, which is not interchangeable (p =
0.002) despite being largely correlated (r = 0.68) (376). Readers should also be cognisant that
the present study only examines physically active males, therefore our results may not translate
to elderly, obese or clinical populations. Furthermore, muscular glycogen and hydration status
may alter echogenicity, thus intersession variability may be improved by tightly controlling
physical activity and fluid intake before EI assessments. Finally, while precedence exists for
the specific inference cut-offs in this article (201, 263, 265, 269, 328), it is important to note
that consensus to such thresholds is not universal (149, 285). Consequently, readers may wish
to apply their own inferences based on their specific contexts. Future research should examine
the variability of regional EI in other muscle groups. Furthermore, researchers may wish to
examine the effects of specific modes of exercise on the EI of different regions. Finally, long-
term tracking of regional EI may lead to new insights into the ageing process.
Conclusions
This was the first paper to examine the variability, and absolute differences in EI
collected in different regions of the quadriceps femoris. Corrected quadriceps EI was
substantially more consistent than non-corrected EI, especially in the vastus intermedius.
Therefore, researchers should adjust for subcutaneous fat thickness, even in acute, or cross-
sectional study designs. Additionally, EI almost always increases as the measures approach the
proximal or distal regions, and therefore, cannot be used interchangeably, likely due to an
increase in fibrous content towards the myotendinous junctions of each muscle.

Chapter 6
95
Chapter 6 - Variability of concentric angle-specific isokinetic
torque and impulse assessments of the knee extensors
Reference
Oranchuk DJ, Neville JG, Nelson AR, Storey AG, and Cronin JB. Variability of concentric
angle-specific isokinetic torque and impulse assessments of the knee extensors. Physiol Meas
41: 01NT02, 2020.
Author contribution
Oranchuk DJ, 80%; Neville JG, 8%; Nelson AR, 4%; Storey AG, 4%; Cronin JB, 4%.
Prelude
While peak torque and optimal angle are commonly reported in the relevant literature,
chapters two and three highlighted the importance of evaluating muscle function throughout
the entire range of motion. This observation is especially true when examining the acute effects
and long-term adaptations of different modes of resistance-training including eccentric quasi-
isometrics, eccentric contractions, or contractions at different muscle lengths. However, little
is known about the variability of isokinetic measurements besides peak torque and optimal
angle. Therefore, Chapter 6 examined the variability of angle-specific concentric torque and
impulse.

Chapter 6
96
Introduction
Isokinetic assessments are frequently utilized in a variety of settings, including sports
performance (85), rehabilitation (165, 355) and musculoskeletal and neuromuscular research
(52, 96, 251, 280, 393). For example, determining the optimal angle (i.e., the angle of peak
torque) via isokinetic assessments has been proposed as a proxy for changes in muscle fascicle
length and injury prediction (355), as many injuries occur at, or near, full knee extension (100,
211), and end-range of motion (ROM) strength is a strong indicator of recovery following
anterior cruciate ligament reconstruction (64). Additionally, the concentric optimal angle has
been widely used as a non-invasive means of estimating exercise-induced muscle damage (52,
280, 393). For instance, Philippou et al. (280) reported that 50 maximal eccentric knee
extensions caused significant shifts towards longer quadriceps muscle lengths, lasting up to 16
days, using concentric optimal angle assessment. Similarly, Yeung and Yeung (393) reported
greater increases in quadriceps optimal angle and soreness, and reductions in peak torque, in
the eccentric vs concentric limb following a bout of step-ups.
While the peak torque and the optimal angle have traditionally been the focus of
isokinetic assessments, the optimal angle may have high variability and is a poor predictor of
performance or injury risk (355). Alternatively, multiple-angle maximal voluntary isometric
contractions allow for reliable and robust length-tension assessments and the quantification of
the rate of force development and impulse (269). Additionally, isometric assessments are
commonly utilized to examine muscular activation and the variability of maximal and
submaximal motor outputs (195, 258, 332). However, obtaining a full isometric length-tension
profile requires an extensive number of contractions (250, 268). For example, Noorkoiv et al.
(250) evaluated knee-extension force at eight angles, totalling 16 maximal isometric
contractions per limb, with one and two minutes of rest between contractions and joint-angles,
respectively. While robust, the aforementioned evaluation may be excessively time-consuming
(~23 minutes per limb after warmup), thereby limiting practicality, and potentially inducing a
training stimulus (134).
A potential solution to the limitations with isometric length-tension assessments would
be to implement angle-specific isokinetic (torque-angle) evaluations throughout the ROM).
Additionally, the angular impulse may provide better diagnostic information to the practitioner,
and therefore deliver more informative programming information for athletic and clinical

Chapter 6
97
populations. However, while concentric peak torque is highly reliable (355), little is known
regarding the between-session variability of angle-specific torque outputs. For example, recent
studies examining angle-specific torque reported no reliability data (85, 96), while others report
the coefficient of variation (CV) (165) or intraclass correlation coefficient (ICC) (23) in
isolation, which fail to provide a robust assessment of variability as the ICC is overly reliant
on between-subject variability, whereas typical error of measure (TEM) and CV are minimally
affected by this (149, 285). Finally, to the authors' knowledge, there are currently no reports
outlining the variability of angle-specific impulse measures. Therefore, the primary purpose of
this note was to determine isokinetic derived angle-specific concentric torque and angular
impulse intersession variability, through the entire knee-joint ROM, and determine the need
for familiarization.
Methods
Experimental design
Using a repeated measures design, isokinetic concentric peak torque, angle of peak
torque, torque at 10° increments from 100-10º of knee flexion (0º = full extension), total
contraction impulse, and impulse in 10° bands from 100-10º were quantified. Both limbs of
each subject underwent unilateral testing on three separate occasions, 5-8 days (6.9 ± 0.9 days)
apart. Intersession variability of each torque and impulse measure were examined via ICC, CV,
and TEM.
Subjects
Thirty-two healthy, resistance-trained males (27.9 ± 5.3 years, 179.1 ± 7.5 cm, 81.5 ±
11.2 kg) volunteered. To minimize training effects from the testing procedures, all subjects
were required to have at least six months (4.2 ± 3.9 years, range = 0.5 – 16 years) of at least
twice weekly resistance training experience (2.54 ± 0.79 sessions·week-1, range = 2-6
sessions·week-1) and be free of musculoskeletal injuries in the three months before data
collection. Participants were instructed to maintain their current level of physical activity
throughout the data collection period apart from refraining from strenuous physical activity in
the 48 hours before each session. Additionally, participants were instructed to avoid alcohol,
caffeine, and other ergogenic aids for at least 24 hours before each session. The Auckland
University of Technology Research Ethics Committee approved the study (18/232), and all
subjects gave written informed consent after being informed of the risks and benefits of

Chapter 6
98
participation. A total of 63 limbs were tested and analysed due to a knee injury unrelated to the
study.
Testing procedures
Concentric knee-extension performance
Subjects warmed up by cycling at low to moderate resistance using a self-selected pace
for five minutes. Subjects were seated upright on the isokinetic dynamometer (CSMi; Lumex,
Ronkonkoma, NY, USA) at a hip angle of 85º, with shoulder, waist, and thigh straps to reduce
body movement during contractions. The shin-pad was positioned ~5 cm superior to the medial
malleolus of each limb. To standardize body position, subjects were required to hold handles
at the sides of the chair, while the non-working limb was positioned behind a restraining pad.
Knee alignment was determined by visual inspection and unloaded knee extensions to ensure
proper joint tracking and comfort. Dynamometer settings were recorded and matched for
subsequent sessions.
Once fitted to the dynamometer, subjects underwent a series of extensions and flexions
of the knee to determine safety stop positions and calibrate gravity correction. Subjects then
completed a standardized warmup of a single concentric contraction of 30%, 50%, 70%, 85%
and 100% of perceived maximal voluntary contraction, respectively. One minute after the
completion of the warmup contractions, subjects completed five maximal concentric knee
extensions in immediate succession at 60º·s-1. Each contraction was initiated and terminated at
105° and 5° of knee flexion, respectively. Subjects were given strong verbal encouragement
along with visual feedback of the torque-time tracing during each maximal contraction.
Data processing and analysis
Data were analyzed via a customized MATLAB (MathWorks, Natick, MA) script. Each
isokinetic contraction was analyzed by detecting and identifying the maximum (105°) and
minimum (5°) angle that signified the start and end of each contraction. Torque outputs at ten
angles (100°, 90°, 80°, 70°, 60°, 50°, 40°, 30°, 20°, 10°) were recorded. Peak torque was
detected as the highest instantaneous torque between 105°, and 5° of knee flexion, with the
corresponding angle, recorded. The angular impulse was calculated as the area under the
torque-time curve between each of the ten angles. Thus, total angular impulse throughout the
entire ROM and between nine bands (100-90°, 90-80°, 80-70°, 70-60°, 60-50º, 50-40°, 40-30°,
30-20°, 20-10°) was calculated.
Chapter 6
99
Statistical analysis
Mean, and standard deviation are reported for all variables. All data were analysed
using an Excel (version 2016; Microsoft Corporation, Redmond, WA) spreadsheet from
sportsci.org (149), utilizing log-transformation to correct for heteroscedastic effects.
Intersession analysis was performed on the mean results of the variables for each session. The
ICC (type 3,1) and CV were used to explore relative and absolute variability. An ICC < 0.67
and CV > 10% were deemed as having large variability, moderate variability when either the
ICC > 0.67 or the CV < 10%, but not both, and small variability when ICC > 0.67 and CV <
10% (263, 269, 328). Variability was also examined via the standardized TEM to provide a
practical interpretation of the magnitude of error expected for any change in the mean.
Magnitudes for effects were calculated by doubling the TEM result (263, 328) and applying
thresholds of 0.2-0.6 (small), 0.6-1.2 (moderate), 1.2-2.0 (large), 2.0-4.0 (very large) and > 4.0
(extremely large) (263, 269).
Results
Isokinetic peak torque, optimal angle, and angle-specific torque data are presented in
Table 12. Peak torque was found to have small intersession variability (ICC = 0.94-0.95, CV
= 6.2-7.4%, TEM = 0.22-0.26), whereas optimal angle was found to have moderate to large
variability (ICC = 0.58-0.64, CV = 7.3-8%, TEM = 0.76-0.86). Angle-specific torque was
observed to have small to moderate variability (ICC = 0.79-0.94, CV = 6.4-14.1%, TEM =
0.25-0.51) except for at the most extreme angles of 10° and 100° (ICC = 0.57-0.83, CV = 12.9-
42.9%, TEM = 0.40-0.89).

Chapter 6
100
Table 12. Test-retest variability of Isokinetic (60º·s-1) knee extension torque production over three repeated measures.
Mean Days 1 - 2 Days 2 - 3
Day 1 Day 2 Day 3 TEM TEM
× 2
TEM
inference CV ICC
CV/ICC
inference TEM
TEM
× 2
TEM
inference CV ICC
CV/ICC
inference
Peak torque (Nm) 211.3 ± 53 217.8 ± 53.2 213.1 ± 52 0.26 0.52 Small 7.4 0.94 Small 0.22 0.44 Small 6.3 0.95 Small
Optimal angle (º) 69.2 ± 8 68.9 ± 8.3 69.3 ± 7.5 0.86 1.72 Large 8.0 0.58 Moderate 0.76 1.52 Large 7.3 0.64 Moderate
Angle-specific torque (Nm)
Joint angle
100º 113 ± 40.6 121.5 ± 43.5 113.9 ± 39 0.89 1.78 Large 42.9 0.57 Large 0.68 1.36 Moderate 27.7 0.67 Large
90º 168.8 ± 43.9 176.8 ± 45.2 173 ± 42.7 0.35 0.70 Moderate 10 0.88 Moderate 0.34 0.68 Moderate 8.3 0.91 Small
80º 193.3 ± 48.2 198.8 ± 50.3 196.6 ± 48.2 0.25 0.50 Small 6.4 0.94 Small 0.29 0.58 Small 7.9 0.92 Small
70º 203.3 ± 51.7 207.3 ± 53.1 204.5 ± 51 0.30 0.60 Moderate 8.2 0.93 Small 0.27 0.56 Small 8.0 0.92 Small
60º 198.9 ± 54.6 202.3 ± 52.7 199.7 ± 52 0.35 0.70 Moderate 10.7 0.88 Moderate 0.28 0.59 Small 8.5 0.91 Small
50º 180.8 ± 52.8 183.7 ± 51.3 181.4 ± 50.2 0.37 0.74 Moderate 12.3 0.85 Moderate 0.30 0.60 Moderate 9.9 0.88 Small
40º 156.4 ± 47.5 158.5 ± 45.4 156.8 ± 45.7 0.40 0.80 Moderate 10.4 0.83 Moderate 0.32 0.64 Moderate 10.4 0.87 Moderate
30º 128.8 ± 40 129.9 ± 37.7 129.5 ± 39.6 0.45 0.90 Moderate 13.2 0.80 Moderate 0.37 0.74 Moderate 11.2 0.86 Moderate
20º 101.1 ± 32.4 100.7 ± 29.1 101.4 ± 32.8 0.51 1.02 Moderate 14.1 0.79 Moderate 0.39 0.78 Moderate 11.9 0.85 Moderate
10º 71.6 ± 23.5 71.9 ± 21.4 72.7 ± 24.4 0.65 1.30 Large 17.5 0.73 Moderate 0.40 0.80 Moderate 12.9 0.83 Moderate
Mean 0.45 0.90 Moderate 14.5 0.82 Moderate 0.36 0.72 Moderate 11.7 0.86 Moderate
TEM = standardized typical error of measure. CV = coefficient of variation (%). ICC = intraclass correlation coefficient. Nm = newton-meters. All reliability statistics are log-transformed.

Chapter 6
101
The isokinetic angular impulse data can be observed in Table 13. The variability of total
impulse through the entire ROM was found to be small to moderate (ICC = 0.93-0.97, CV =
6.4-8.1%, TEM = 0.20-0.31). Like angle-specific torque, the variability of all angular impulse
bands was found to be small to moderate (ICC = 0.78-0.96, CV = 6.6-13.6%, TEM = 0.27-
0.53), except for the most extreme angles (100-90° and 20-10°) (ICC = 0.75-0.85, CV = 11-
16.5%, TEM = 0.36-0.60).

Chapter 6
102
Table 13. Test-retest variability of Isokinetic (60º·s-1) knee extension angular impulse over three repeated measures.
Mean Days 1 - 2 Days 2 – 3
Day 1 Day 2 Day 3 TEM TEM
× 2
TEM
inference CV ICC
CV/ICC
inference TEM
TEM
× 2
TEM
inference CV ICC
CV/ICC
inference
Total (100-10º) impulse (Nm.s) 240.1 ± 63.1 246 ± 61.7 242.2 ± 62.2 0.31 0.62 Moderate 8.1 0.93 Small 0.20 0.40 Small 6.4 0.96 Small
Angle-specific impulse (Nm.s)
Joint angle
100-90º 24.9 ± 6.9 26.4 ± 7.1 25.5 ± 6.6 0.58 1.16 Large 16.5 0.76 Moderate 0.36 0.72 Moderate 11 0.85 Moderate
90-80º 30.5 ± 7.8 31.7 ± 8 31.2 ± 7.7 0.28 0.56 Small 6.6 0.94 Small 0.30 0.60 Moderate 7.5 0.92 Small
80-70º 32.8 ± 9.2 33.5 ± 9.6 32 ± 10.7 0.27 0.54 Small 7 0.96 Small 0.28 0.56 Small 7.8 0.92 Small
70-60º 33.8 ± 8.9 34.4 ± 8.8 33.9 ± 8.6 0.32 0.64 Moderate 9.1 0.90 Small 0.27 0.54 Small 8.1 0.93 Small
60-50º 31.9 ± 9 32.3 ± 8.7 31.9 ± 8.5 0.36 0.72 Moderate 11.8 0.85 Moderate 0.31 0.62 Moderate 9 0.90 Small
50-40º 28.2 ± 8.4 28.7 ± 8.1 28.3 ± 8 0.50 1.00 Moderate 12.9 0.82 Moderate 0.35 0.70 Moderate 9.9 0.88 Small
40-30º 23.9 ± 7.3 24.1 ± 6.9 23.9 ± 7.1 0.51 1.02 Moderate 13.5 0.80 Moderate 0.42 0.84 Moderate 12.8 0.86 Moderate
30-20º 19.2 ± 6 19.3 ± 5.6 19.3 ± 6.1 0.53 1.06 Moderate 13.6 0.78 Moderate 0.41 0.82 Moderate 11.3 0.85 Moderate
20-10º 14.5 ± 4.7 14.4 ± 4.2 14.5 ± 4.8 0.60 1.20 Large 15.3 0.75 Moderate 0.41 0.82 Moderate 12 0.84 Moderate
Mean 0.44 0.88 Moderate 11.8 0.84 Moderate 0.34 0.68 Moderate 9.9 0.88 Small
TEM = standardized typical error of measure. CV = coefficient of variation (%). ICC = intraclass correlation coefficient. Nm·s = newton-meter seconds. All reliability statistics are log-
transformed.
Chapter 6
103
Discussion
A comprehensive understanding of the variability associated with isokinetic torque and
angular impulse across multiple angles, in a homogenous resistance-trained population, was
previously lacking. As such, the main purpose of the study was to examine the intersession
variability of traditional isokinetic assessments (i.e., peak torque, optimal angle), and the
potentially more consistent diagnostic metrics of angle specific torque and angular impulse.
Our primary findings were: 1) variability was minimal for isokinetic peak torque and total
impulse throughout the quadriceps ROM: 2) optimal angle demonstrates moderate to large
variability and, 3) angle-specific isokinetic torque and angular impulse were found to have
small to moderate variability, except for the ends of ROM.
Minimal variability was associated with concentric peak torque (ICC = 0.94-0.95, CV
= 6.3-7.4%, TEM = 0.22-0.26), enabling the use of this metric without necessarily reporting
optimal angle (251, 268). Interestingly, while the mean optimal angle was nearly identical
between sessions, moderate to large viabilities were found (ICC = 0.58-0.64, CV = 7.3-8.0%,
TEM = 0.76-0.86), likely due to between-subject changes in rank-order. The aforementioned
result question the common practice of analysing the optimal angle, especially as it is likely
that clinical populations would have greater biological variability than the population of
resistance-trained men used in this study. Furthermore, this finding may explain the generally
lack of substantial optimal angle changes in longitudinal investigations and highlights the need
for researchers to determine their own test-retest variability. The much less studied angle-
specific isokinetic torque was found to be small to moderate in variability at 90-20° of knee
flexion (ICC = 0.79-0.94, CV = 6.4-14.1%, TEM = 0.25-0.51) while 100° and 10° were more
variable (ICC = 0.57-0.83, CV = 12.9-42.9%, TEM = 0.40-0.89). These results suggest that
even healthy, resistance-trained subjects may have difficulty in consistently initiating and
completing isokinetic contractions. These findings are important to consider as peak anterior
cruciate ligament loading typically occurs between 10-30° of knee flexion (100). While a direct
investigation is required, it would be expected that rehabilitative populations would have
greater difficulty consistently initiating and completing contractions (64), thus resulting in
more variable torque and impulse outputs near end ROM. Therefore, isometric contractions,
with lower movement variability, may prove a more reliable measurement of injured
populations.

Chapter 6
104
Variabilities reported here are similar to those of Arnold, Perrin, and Hellwig (23) (ICC
= 0.83-0.87) and are more consistent when compared to Kannus and Yasuda (165) (CV = 35-
47%); although these authors report across two sessions at only 30°, 60° and 75°, and 15° and
75° of knee-flexion, respectfully. Furthermore, to our knowledge, this is the first paper
reporting angle-specific angular impulse, the reliability of which was more consistent (mean
ICC = 0.84-0.88, CV = 9.9-11.8%, TEM = 0.34-0.44) as compared to angle-specific torque
(mean ICC = 0.82-0.86, CV = 11.7-14.5%, TEM = 0.36-0.45). Additionally, all angular
impulse brackets held small to moderate variabilities between sessions two and three,
suggesting that only a single familiarization session is required to confidently evaluate the
entire length-tension relationship. Alternatively, while the variability of angle-specific torque
was more consistent for sessions two-three (mean ICC = 0.88, CV = 9.9%, TEM = 0.38) versus
one-two (mean ICC = 0.84, CV = 11.8%, TEM = 0.44), variation at 100º remained moderate
to large, suggesting that more than one familiarization session may be required to adequately
detect small changes at long muscle lengths. Thus, we recommend utilizing bracketed ranges
over torque at a single point in the ROM when practitioners must be sure that a change has
occurred, especially when evaluating the knee extensors near full extension or flexion.
While the primary aim of this paper was accomplished, it is important to note
limitations and directions for future research. We did not account for limb dominance, which
may have altered intersession variability. However, it is common practice to evaluate both
limbs in research (e.g., within-participant parallel conditions) and clinical (e.g., inter-limb
asymmetry) settings. A complex relationship between fatigue, adaptations, and performance
exists. As such, it is possible that each testing session could have led to small adaptations and/or
resulted in residual fatigue, potentially affecting our results. However, while familiarization
effects can be conferred in fewer than 10 maximal contractions (134), it is unlikely that
noticeable levels of fatigue remained by the second and third testing sessions as even high
responders have been shown to recover upwards of 80% of maximal voluntary isometric
contraction just four days following 50 maximal eccentric contractions in untrained participants
(154).
This study only examined the knee extensors; therefore, muscle groups such as the knee
flexors, or humeral rotators must be directly examined before researchers and practitioners can
understand the utility of angle-specific torque or impulse measurements at other muscle groups
and joints. Furthermore, the utility of assessing agonist/antagonist strength ratios via angle-

Chapter 6
105
specific torque or impulse analyses remains unknown. Similarly, studies examining the
variability of submaximal and maximal motor-outputs and muscle activation during non-
isometric contractions should be undertaken. Additionally, the reader needs to be cognizant
that only males with substantial resistance training experience were recruited for this
investigation. Thus, the response of untrained, youth, elderly, female and rehabilitative
populations could be different. Future researchers will also need to determine the variability of
eccentric contractions and contractions at different velocities to gain a full understanding of the
utility of these measures in a comprehensive torque-angle profile. Most importantly, future
researchers should determine the validity of angle specific torque and impulse to predict injury
and monitor recovery processes. Finally, while precedence exists for the specific inference cut-
offs in this article (263, 269, 328), it is important to note that consensus to such thresholds is
not universal (149, 285). Consequently, readers may wish to apply their own inferences based
on their specific contexts.
Conclusions
Isokinetic concentric torque and angular impulse have low to moderate variability at all
but extreme joint angles. Additionally, angle-specific angular impulse intersession variability
at long muscle length is relatively low, and therefore could be used instead of angle-specific
torque when multiple familiarization sessions are not practical and/or different diagnostic
information is sought. Depending on the methodological purpose, researchers and practitioners
can utilize angle-specific concentric torque or angular impulse as a time-efficient evaluation of
contractile and neuromuscular qualities when the quantification of the rate of force
development is not required.

Chapter 7
106
Chapter 7 - Variability of multiangle isometric force-time
characteristics in trained men
Reference
Oranchuk DJ, Storey AG, Nelson AR, Neville JG, and Cronin JB. Variability of multiangle
isometric force-time characteristics in trained men. J Strength Cond Res Ahead of print, 2019.
Author contribution
Oranchuk DJ, 80%; Storey AG, 8%; Nelson AR, 4%; Neville JG, 4%; Cronin JB, 4%.
Prelude
While Chapter 6 established the intersession variability of concentric muscle function,
isometric contractions allow for truer measures of peak contractile force, and the evaluation of
rate of force development and impulse. All of these variables may be important in determining
the effects of eccentric quasi-isometric training. However, little is known about the variability
of these measurements at multiple angles, over repeated testing occasions in a homogenous,
resistance-trained population. Thus, determining the intersession variability of multi-angle
isometric force-time characteristics provided the purpose of this chapter.

Chapter 7
107
Introduction
Traditionally, the evaluation of the length-tension relationship has been completed via
isokinetic derived angle of peak torque (i.e., optimal-angle) (355). However, in Chapter 6 we
determined that the optimal angle holds relatively high variability, even in resistance-trained
men (265). Additionally, dynamic contractions do not allow for reliable rate of force
development (RFD) metrics to be calculated, and eccentric evaluations require extensive
familiarization and may be excessively strenuous if regular testing is required (355). As such,
isometric evaluations of force, RFD and impulse are popular in general (268), athletic (92,
266), and rehabilitative (16, 70, 181) populations due to the ease of use and a high degree of
safety (390). Additionally, isometric evaluations are regularly utilized to gain insight regarding
neural drive and pain-induced inhibition via the rapid application of force (215), which is
valuable in a variety of contexts (16, 92, 181, 390). For example, Angelozzi et al. (16) reported
that while peak force returned to baseline six-months after anterior cruciate ligament
reconstruction, early-stage (from contraction onset to a pre-determined time interval; e.g., 0-
30 ms, 0-50 ms, 0-90 ms) RFD remained measurably depressed 12 months post reconstruction.
Furthermore, late-stage (100-200 ms) RFD is a more sensitive means of indirectly evaluating
exercise-induced muscle damage than peak force, providing value in research settings (276).
Isometric contractions at multiple joint angles are commonly included in testing
batteries (49, 188, 250) as morphological and functional adaptations to training appear to be
joint angle specific (268). For example, Kubo et al. (188) observed that isometric training at
long muscle lengths resulted in significantly improved isometric force from 40-110° of knee-
flexion, whereas short muscle length training only improved force production from 40-80°.
Thus, no between-group differences would have been detected if force production had been
evaluated at a single joint angle of ≤ 80° (188). Furthermore, strength and rapid force
production at specific joint angles may provide beneficial information to athletic and
rehabilitative populations. For instance, many knee and hamstring injuries occur at, or near,
full extension (100), and strength near the end-range of motion is a strong indicator of recovery
(64). Alternatively, high force outputs at long muscle lengths critical to performance for
athletes such as weightlifters (339). Therefore, isometric evaluation of muscle properties
should take place at multiple angles, i.e., whole muscle length-tension relationship (355).

Chapter 7
108
While multi-angle isometric assessments have the potential to be useful in athletic and
rehabilitation settings, several limitations have been identified by researchers. For example,
nine of 26 papers included in a recent systematic review of isometric resistance training
included multi-angle isometric assessments (268). However, only six reported reliability, and
in three, variability was only derived from a single session (i.e., within-trial variation) (268),
which has limited application to test-retest methodologies. Additionally, each study in the
review (268), and the earlier cited lack original reliability statistics (70, 181, 266, 276), or
report only a single statistic, with a mixture of intraclass coefficient correlation (ICC) (16, 49),
or the coefficient of variation (CV) (188, 250). Moreover, while peak force was highly reliable
(ICC = 0.80-0.99) across seven accepted studies, a systematic review of closed-chain isometric
assessments (92) only reported pooled ICCs, which raises some issues. For example, while it
is the most commonly reported reliability statistic, the ICC is overly reliant on between-subject
variability, which minimally affects typical error of measure (TEM) and CVs (149, 285).
Another limitation was the distinct lack of resistance-trained subjects as none of the papers
included in the aforementioned systematic review included subjects with any substantial
strength training history (268). Furthermore, the variability of RFD and impulse are seldom
reported (16, 49). Therefore, the primary purpose of this technical report is to provide a
comprehensive analysis of the variability of a multi-angle isometric knee extension assessment
over three testing sessions in resistance-trained subjects. The findings of this report will provide
greater insight into isometric measures that can be used with confidence in test-retest
methodologies that are quantifying longitudinal changes.
Methods
Experimental approach to the problem
Isometric force-time characteristics of the knee extensors were examined using a
repeated measures study design. Subjects were tested on three separate occasions, with 5-8
days between sessions. Each session followed identical sequencing of testing including a series
of isometric contractions at short (40º), medium (70º), and long (100º) muscle lengths (0º=full
extension). Intersession variability of peak force, early (0-50 ms) and late-stage (0-100 ms, 0-
200 ms, 100-200 ms) RFD and impulse were examined via ICC, CV, and TEM.

Chapter 7
109
Subjects
Twenty-six healthy, resistance-trained males (28.8 ± 4.8 years, 180.2 ± 7.7 cm, 81.8 ±
11.8 kg) volunteered. To minimize training effects from the testing procedures, all subjects
were required to have at least six months (4.9 ± 3.8 years, range = 0.75 – 16 years) of at least
twice weekly resistance training experience (290) (2.53 ± 0.76 sessions·week-1, range = 2-6
sessions·week-1), and be free of musculoskeletal injuries in the three months before data
collection. Participants were instructed to maintain their current level of physical activity
throughout the data collection period apart from refraining from strenuous physical activity in
the 72 hours before each session. Additionally, participants were instructed to avoid alcohol,
caffeine, and other ergogenic aids for at least 24 hours before each session. The Auckland
University of Technology Research Ethics Committee approved the study (18/232), and all
subjects gave written informed consent after being informed of the risks and benefits of
participation.
Testing procedures
Isometric testing
Participants warmed up by cycling at a low to moderate resistance using a self-selected
pace for five minutes. Participants were seated upright on the isokinetic dynamometer (CSMi;
Lumex, Ronkonkoma, NY, USA) at a hip angle of 85º, with shoulder, waist, and thigh straps
to reduce body movement during contractions. The shin-pad force was ~5 cm superior to the
medial malleoli. Participants were required to hold the handles at the sides of the chair, and the
non-working limb was positioned behind a restraining pad. Knee alignment was determined by
visual inspection, and unloaded knee extensions were performed by the subjects to ensure
proper joint tracking. Dynamometer settings were recorded and matched for all subsequent
sessions.
Once fitted to the dynamometer, participants performed a series of extensions and
flexions of the knee to determine the safety stop positions and calibrate to the gravity
correction. Participants then completed a standardized warmup of submaximal concentric
contractions of 30%, 50%, 70%, 85% and 100% of perceived maximal voluntary contraction.
Each warm-up contraction was initiated and terminated at 105° and 5° of knee flexion,
respectively. Sixty seconds after the completion of the isokinetic warm-up, the participants'
knee was positioned at 40º of flexion where one familiarization isometric knee extension at
50% of maximal voluntary isometric contraction (MVIC) was performed. Subsequently, two

Chapter 7
110
MVICs lasting four seconds were completed with 30 seconds separating each contraction.
Participants were instructed to contract “as fast and hard as possible” following a countdown
of “3-2-1-go!” (215). All athletes were given strong verbal encouragement along with visual
feedback of the force-time tracing during each trial (215). Participants were also instructed to
avoid any pre-tension and countermovement of the knee extensors while the live force-time
trace was carefully inspected by the examiner leading up to each contraction (215). The cut-
off for pre-tension was set at 10 N. Any contractions with a clear countermovement or an
unsteady baseline were rejected and repeated (215). The subjects then completed the same
series at 70º and 100º of knee flexion with 60 seconds of rest between angles. The isometric
contractions were always performed in series from short to long muscle lengths to avoid greater
muscle damage and fatigue synonymous with contractions at long muscle lengths (250).
Following the final isometric contraction, the isokinetic warm-up and isometric assessment
were repeated on the opposite limb. Limb order was randomized throughout the three testing
sessions and counterbalanced over the sample. All isokinetic and isometric contractions were
collected, without filtering, via a custom-made software (LabVIEW; National Instruments,
New Zealand) sampling at 2000 Hz (215).
Data processing and analysis
Data were analyzed via a customized MATLAB (MathWorks, Natick, MA) script. All
force data were divided by the length of the lever arm, in meters, to normalize the difference
in shank length between subjects. Following an initial manual inspection of the raw data,
isometric forces over 200 N were identified to signify a full contraction and eliminate false
contractions. A peak detection algorithm was implemented to detect and identify the
instantaneous peak force of each contraction. The on-set of effort was determined via visual
inspection and a manual section of each force-time curve (215). The same researcher
determined on-set of effort by visually detecting the last trough before force deflected above
the range of the baseline noise (215). Rate of force development and impulse were calculated
for 0-50 ms, 0-100 ms, 0-200 ms, and 100-200 ms, based on the manual onset of effort detection
(215).
Statistical analysis
Mean, and standard deviation was calculated for all variables. All data were log-
transformed to correct for heteroscedastic effects and analysed using an Excel (version 2016;
Microsoft Corporation, Redmond, WA) spreadsheet (149, 263). Intersession analysis was

Chapter 7
111
performed on the mean results of the variables for each session. The ICC and CV were used to
explore relative and absolute variability, respectively. An ICC < 0.67 and CV > 10% were
deemed as having large variability, moderate variability when either the ICC > 0.67 or the CV
< 10%, but not both, and small variability when ICC > 0.67 and CV < 10% (201, 263).
Variability was also examined via TEM to provide the reader with a practical interpretation of
the magnitude of error expected for any change in the mean (201, 263). Magnitudes for effects
were calculated by doubling the TEM result (201, 263) with thresholds of 0.2-0.6 (small), 0.6-
1.2 (moderate), 1.2-2.0 (large), 2.0-4.0 (very large) and > 4.0 (extremely large) (152, 201, 263).
Results
Variability data for multi-angle isometric force, RFD and impulse measures are found
in Table 14.

Chapter 7
112
Table 14. Test-retest variability of isometric knee extension force production over three repeated measures.
Mean Days 1 – 2 Days 2 - 3
Joint
angle Day 1 Day 2 Day 3 TEM
TEM
× 2
TEM
inference CV ICC
CV/ICC
inference TEM
TEM
× 2
TEM
inference CV ICC
CV/ICC
inference
Peak Force (N)
40º 611.5 ± 140 601.3 ± 134 603.6 ± 133 0.45 0.90 Moderate 10.8 0.84 Moderate 0.39 0.78 Moderate 9.6 0.87 Small
70º 790 ± 201 807.2 ± 174 805.5 ± 188 0.36 0.72 Moderate 9.2 0.88 Small 0.49 0.98 Moderate 11.5 0.80 Moderate
100º 669 ± 151 679.2 ± 153 682.7 ± 149 0.28 0.56 Small 6.7 0.93 Small 0.38 0.76 Moderate 8.5 0.88 Small
Mean 0.36 0.62 Moderate 8.9 0.88 Small 0.42 0.84 Moderate 9.9 0.85 Small
RFD 0-50 (N·s-1)
40º 3894 ± 1227 3739 ± 967 3635 ± 1053 0.64 1.28 Large 22.4 0.71 Moderate 0.82 1.64 Large 23.5 0.60 Large
70º 3245 ± 1255 3003 ± 1304 2940 ± 1121 0.74 1.48 Large 32.2 0.66 Large 0.66 1.32 Large 27.2 0.70 Moderate
100º 1690 ± 998 1577 ± 827 1670 ± 1024 0.67 1.34 Large 31.9 0.70 Moderate 0.70 1.40 Large 33.7 0.68 Moderate
Mean 0.68 1.36 Large 28.8 0.69 Moderate 0.73 1.46 Large 28.1 0.66 Large
RFD 0-100 (N·s-1)
40º 3401 ± 980 3179 ± 846.8 3142 ± 868 0.57 1.14 Moderate 18.7 0.76 Moderate 0.60 1.20 Moderate 19.9 0.71 Moderate
70º 3264 ± 1061 3025 ± 1007 2977 ± 939 0.48 0.96 Moderate 18.8 0.82 Moderate 0.57 1.14 Moderate 20.1 0.76 Moderate
100º 2334 ± 761 2258 ± 471.6 2293 ± 830 0.51 1.02 Moderate 19.4 0.80 Moderate 0.57 1.14 Moderate 21.7 0.76 Moderate
Mean 0.52 1.04 Moderate 19 0.79 Moderate 0.58 1.16 Moderate 20.6 0.74 Moderate
RFD 0-200 (N·s-1)
40º 2459 ± 631 2340 ± 607.7 2297 ± 611 0.55 1.10 Moderate 15.9 0.78 Moderate 0.53 1.06 Moderate 15.6 0.79 Moderate
70º 2804 ± 790 2643 ± 755.3 2618 ± 728 0.43 0.86 Moderate 14 0.85 Moderate 0.47 0.94 Moderate 14.9 0.82 Moderate
100º 2271 ± 575 2224 ± 584 2266 ± 637 0.39 0.78 Moderate 11.8 0.87 Moderate 0.43 0.86 Moderate 13 0.85 Moderate
Mean 0.46 0.92 Moderate 13.9 0.83 Moderate 0.48 0.96 Moderate 14.5 0.82 Moderate
RFD 100-200 (N·s-1)
40º 1534 ± 460 1501 ± 446.6 1452 ± 459 0.74 1.48 Large 21.5 0.67 Moderate 0.53 1.06 Moderate 17.1 0.79 Moderate
70º 2344 ± 649 2261 ± 634.6 2259 ± 637 0.45 0.90 Moderate 13.9 0.84 Moderate 0.46 0.92 Moderate 15 0.83 Moderate
100º 2207 ± 560 2190 ± 557.1 2240 ± 558 0.39 0.78 Moderate 10.9 0.87 Moderate 0.37 0.74 Moderate 10.4 0.88 Moderate
Mean 0.53 1.06 Moderate 15.4 0.79 Moderate 0.45 0.90 Moderate 14.2 0.83 Moderate
Impulse 0-50 (N·s)
40º 10.6 ± 5.7 9.38 ± 4.3 9.19 ± 4.6 0.51 1.02 Moderate 32.9 0.80 Moderate 0.57 1.14 Moderate 32.9 0.76 Moderate
70º 8.15 ± 6 7.26 ± 5.8 6.8 ± 4.4 0.70 1.40 Large 56.2 0.68 Moderate 0.57 1.14 Moderate 42.5 0.76 Moderate
100º 2.93 ± 3.5 2.52 ± 2.6 2.86 ± 3.6 0.66 1.32 Large 61 0.70 Moderate 0.70 1.40 Large 63.1 0.68 Moderate
Mean 0.62 1.24 Large 50 0.73 Moderate 0.61 1.22 Large 46.2 0.73 Moderate
Impulse 0-100 (N·s)
40º 21.9 ± 10.6 27.3 ± 12.3 16.8 ± 12.9 0.52 1.04 Moderate 36.3 0.79 Moderate 0.52 1.04 Moderate 33.1 0.79 Moderate
70º 30.8 ± 17.4 26.7 ± 15.6 25.7 ± 14 0.43 0.86 Moderate 33.8 0.85 Moderate 0.52 1.04 Moderate 37 0.80 Moderate
100º 16.8 ± 9.2 15.7 ± 8.7 16.5 ± 10.6 0.49 0.98 Moderate 38.4 0.81 Moderate 0.53 1.06 Moderate 42.1 0.79 Moderate
Mean 0.48 0.96 Moderate 36.2 0.82 Moderate 0.52 1.04 Moderate 37.4 0.79 Moderate

Chapter 7
113
Impulse 0-200 (N·s)
40º 64.5 ± 28.7 58.7 ± 26.6 57 ± 27.1 0.51 1.02 Moderate 30.7 0.80 Moderate 0.44 0.88 Moderate 27 0.85 Moderate
70º 87.4 ± 43.9 78.1 ± 39.4 76.4 ± 38.9 0.41 0.82 Moderate 27.6 0.86 Moderate 0.45 0.90 Moderate 29.6 0.84 Moderate
100º 58.2 ± 26.1 56.2 ± 25.4 58.7 ± 30.7 0.38 0.76 Moderate 23.6 0.88 Moderate 0.41 0.82 Moderate 25.9 0.86 Moderate
Mean 0.43 0.86 Moderate 27.3 0.85 Moderate 0.43 0.86 Moderate 27.5 0.85 Moderate
Impulse 100-200 (N·s)
40º 33.9 ± 15.9 31.4 ± 15.2 30.3 ± 15.1 0.56 1.12 Moderate 33.1 0.77 Moderate 0.41 0.82 Moderate 25.8 0.86 Moderate
70º 56.5 ± 27.9 51.3 ± 25 50.6 ± 24.9 0.41 0.82 Moderate 26.9 0.86 Moderate 0.44 0.88 Moderate 29.2 0.84 Moderate
100º 41.4 ± 18.5 40.4 ± 17.8 42.2 ± 21 0.36 0.72 Moderate 21.5 0.89 Moderate 0.38 0.76 Moderate 23.1 0.88 Moderate
Mean 0.44 0.88 Moderate 27.2 0.84 Moderate 0.41 0.82 Moderate 26 0.86 Moderate
TEM = typical error of measure. CV = coefficient of variation (%). ICC = intraclass correlation coefficient. RFD = rate of force development. N·s-1 = newtons per second. N·s = newton seconds. All reliability statistics are log-transformed.

Chapter 7
114
Small to moderate variabilities were found for isometric peak force (ICC = 0.80-0.93,
CV = 6.7-11.5%, TEM = 0.28-0.49) while late-stage (0-100, 100-200, 0-200 ms) RFD (ICC =
0.67-0.88, CV = 10.4-21.5%, TEM = 0.37-0.74) and impulse (ICC = 0.77-0.89, CV = 21.5-
42.1%, TEM = 0.36-0.56) were moderately variable regardless of angle between sessions one-
two and two-three. However, moderate to large variability were found for early-stage (0-50
ms) RFD (ICC = 0.60-0.71, CV = 22.4-33.7%, TEM = 0.64-0.82) and impulse (ICC = 0.68-
0.80, CV = 32.9-63.1%, TEM = 0.51-0.70).
Discussion
A comprehensive analysis of the variability associated with isometric peak force, RFD,
and impulse at multiple angles during knee extension, in a homogenous resistance-trained
population was previously lacking. This study addressed these limitations with the primary
findings being: 1) peak force is minimally variable, 2) late-stage RFD and impulse are
moderately variable, and 3) early-stage RFD and impulse hold moderate to large variability.
Small to moderate variability (ICC = 0.80-0.93, CV = 6.7-11.5%, TEM = 0.28-0.49)
was associated with isometric peak force regardless of joint angle, meaning that practitioners
and researchers can be confident in using this metric across angles. Our findings corroborate
previous reports, in that late (ICC = 0.67-0.89, CV = 10.4-42.1%, TEM = 0.36-0.74), but not
early-stage (ICC = 0.60-0.80, CV = 22.4-63.1%, TEM = 0.51-0.82) RFD and impulse, are
relatively stable between testing occasions regardless of joint angle (215, 271). For example,
Palmer, Pineda, and Durham (271) recently reported highly reliable peak force (ICC = 0.84-
0.90, CV = 6.6-12%) and late-stage RFD (ICC = 0.81, CV = 12.3-19.4%), while peak and
early-stage RFD (ICC = 0.55-0.85, CV = 17.3-55.9%) were much less consistent across two
sessions in a multi-angle isometric squat (271). No systematic bias was observed between
sessions one-two, indicating a negligible learning effect and that the assessments need very
little familiarisation in trained subjects.
From the findings of this technical report, reporting early-stage RFD (16, 276) would
seem questionable, supporting the decisions of researchers who have declined to include rapid
force production earlier than a 100 ms threshold (49). However, it is important to note that
large intersession variability does not necessarily preclude early-stage RFD or impulse from
holding value if the smallest detectable change is known. For example, Krafft (181) and

Chapter 7
115
Angelozzi (16), reported relatively large improvements in peak (98.4-103.6%, Cohen’s d =
0.58-1.06) and early-stage RFD (20.3-41.7%, d = 0.35-0.44) throughout recovery from anterior
cruciate ligament reconstruction, which may have surpassed the smallest detectable change.
However, neither study reported the information required to calculate the smallest detectable
change in their population. Alternatively, well-trained athletic populations are unlikely to
experience large enough improvements in early-stage RFD and impulse to overcome the
moderate to large intersession variability (290).
While the primary aim of this report was achieved, readers should be cognizant of the
limitations. While two contractions per angle, per session was selected to avoid neuromuscular
adaptations and reduce assessment time, a greater number of contractions is often
recommended to improve measurement reliability (215). Furthermore, the variability of peak
force, and RFD and impulse would have likely been improved by performing ramp, and brief
rapid contractions, respectively. (215). All contractions were performed in a commercial
dynamometer, where deformation of the seat and tissues of the subject may result in small
shifts in the prescribed joint angle when compared to custom-made apparatus (20, 215). While
the slight deviation in joint angle should not affect intersession variability, practitioners should
be aware that the reported force, RFD and impulse data may not be interchangeable with other
equipment set-ups (20, 215). Future research should examine other movements (e.g., knee
flexion, dorsiflexion) and populations (e.g., females, elderly, untrained, rehabilitative) to have
a full understanding of the utility and reproducibility of multi-angle isometric force-time
characteristics. Finally, while precedence exists for the specific statistical inference cut-offs in
this article (201, 263), it is important to note that universal consensus is not possible (285, 386).
Therefore, readers may wish to apply their own inferences based on their specific contexts.
Practical applications
This was the first study to undertake a comprehensive analysis of knee extension force-
time variability across multiple joint angles and testing occasions. Peak force, and late-stage
RFD and impulse were the most stable measures at all assessed angles, indicating that the
whole muscle length-tension relationship can be determined for knee extension. However,
practitioners should avoid reporting early-stage (0-50 ms) RFD and impulse, due to moderate
to large intersession variability. Additionally, practitioners should be aware that outcome
measures with moderate to large variability require larger training-induced adaptations before

Chapter 7
116
they can be sure that real changes have occurred. It also appears that there is minimal learning
involved with the testing, so familiarisation and assessment can occur in the same session with
well-trained individuals. Readers may wish to calculate the smallest worthwhile change from
table 14; however, it is critical to realize that these data are only applicable to a resistance-
trained male population. In summary, isometric peak force, and late-stage RFD and impulse
have low to moderate variability regardless of joint angle and therefore, can be used with
confidence to demonstrate the force capability of knee extensors.

117
Section 3 – Correlational analyses

Chapter 8
118
Chapter 8 - The effect of regional quadriceps anatomical
parameters on angle-specific isometric torque expression
Reference
Oranchuk DJ, Hopkins WG, Nelson AR, Storey AG, and Cronin JB. The effect of regional
quadriceps anatomical parameters on angle-specific isometric torque expression. Appl Physiol
Nutr Metab 46: 368-378, 2021.
Author contribution
Oranchuk DJ, 80%; Hopkins WG, 10%; Nelson AR, 4%; Storey AG, 3%; Cronin JB, 3%.
Prelude
Chapters 4 to 7 examined the intersession variability of several measures of muscle
morphology, architecture, and function, while Chapters 2 and 3 presented several studies
examining the correlations between anatomical features and muscular performance. However,
the relationships between the primary measures of the thesis have not been examined in detail.
More specifically, the association between regional muscle structure and the length-tension
relationship required elucidation. Understanding these associations allows for further
understanding of what morphological and architectural parameters are most important for joint-
angle-specific neuromuscular performance; enabling a potential reduction in the number of
ultrasonic variables required to be collected in subsequent studies. Furthermore, understanding
the aforementioned relationships could aid in the interpretation of future findings. Therefore,
this chapter examined the relationship between the region and muscle-specific muscle
thickness, pennation angle and fascicle length, and angle specific maximal isometric torque
using several linear regression models.

Chapter 8
119
Introduction
The relationship of specific anatomical properties (muscle thickness (MT), volume,
cross-sectional area, pennation angle (PA), fascicle length (FL)) to performance indices of
several sports have been examined (6, 177, 190, 247, 368). Likewise, the assessment of muscle
mass and architecture has been extensively utilized to model in-vivo muscle function during
isometric and isokinetic contractions (13, 48, 73, 213, 359, 360, 379). For example, Blazevich
et al. (48) reported quadriceps muscle volume to be the best predictor of maximal isometric
force (R2 = 0.60) and slow (30º.s-1) concentric torque (R2 = 0.74), while the combination of
physiological cross-sectional area and FL was reported as a moderate predictor (R2 = 0.59) of
high-velocity (300º.s-1) concentric contractions. Similarly, MT, muscle volume, and cross-
sectional area of specific muscles were found to be moderately to very largely correlated with
isometric and isokinetic force or torque production in both cross-sectional (r = 0.45-0.904) (13,
48, 213, 360, 379) and longitudinal investigations (r = 0.53-0.89) (33, 99, 250, 359) in
untrained or recreationally trained participants.
While muscle size and structure are linked to force production, controversy remains
regarding the relative contribution of regional quadriceps muscle anatomical variables at
different joint angles and angular velocities. Ando et al. (13) examined the relationship between
architecture of the vastus lateralis, rectus femoris, vastus medialis, and lateral and anterior
vastus intermedius, and maximal knee extension force. The authors reported that while MT and
PA of all four muscles were positively correlated (r = 0.19-0.74) with maximal force
production, only MT of the anterior vastus intermedius (r = 0.74) and PA of the lateral vastus
intermedius (r = 0.68) reached statistical significance (13). Additionally, multiple linear
regression showed that 91% of the variation in force could be accounted for by the anterior
vastus intermedius MT and lateral vastus intermedius PA (13). However, Ando et al. (13) only
assessed force at 90° of knee flexion and included a relatively small sample of 11 participants.
The examination of muscle size, quality, and architecture in different regions (proximal,
middle, distal) of a muscle has become popular in contemporary research (110, 213, 250, 264,
267, 337, 359, 360). While conflicting results exist, several groups have found that eccentric
resistance training, or training at long muscle lengths, results in preferential hypertrophy of the
distal region, and leads to substantial increases in FL (250, 268). The superior adaptations to
the distal region following eccentric and long muscle length resistance training are

Chapter 8
120
accompanied by preferential improvements in force and torque outputs at long muscle lengths,
and throughout the entire range of motion (111, 268). Yet, these observations are countered by
Trezise et al. (359), who reported that proximal quadriceps cross-sectional area was the best
predictor of isometric (R2 = 0.59) and concentric (R2 = 0.58) torque production. Additionally,
a recent investigation reported that the increase in proximal vastus lateralis cross-sectional area
and PA was the best, albeit weak (R2 = 0.27), predictor for the increase in isometric torque
following 10 weeks of resistance training (359).
While the aforementioned findings are fascinating, most correlational studies do not
examine force throughout the range of motion (13, 33, 73, 99), or only report peak concentric
torque (48, 360). These limitations leave many questions unanswered as understanding force
production at specific joint angles is required for optimal performance or injury prevention
(100, 211); which is among the reasons why assessing force production at short, medium, and
long muscle lengths have become increasingly common (265, 268, 360). Additionally, other
factors, including FL and PA, are often missing from analyses (33, 99). One potential reason
for the lack of length-tension, torque-angle, and complete regional muscle size and
architectural assessments included in correlational investigations is the noticeable lack of data
providing multiple reliability statistics over several sessions. Furthermore, to our knowledge,
none of the previously cited correlational analyses have utilized a homogenous resistance-
trained population. Given the aforementioned research and limitations, the purpose of this
study was two-fold; 1) to determine the intersession reliability of regional quadriceps anatomy,
and multi-angle maximal voluntary isometric torque (MVIT), and 2) investigate the ability of
regional quadriceps MT, PA, and FL to predict MVIT at three knee joint angles in resistance-
trained men.
Materials and Methods
Experimental design
Using a repeated measures design, we examined measures of regional quadriceps
anatomical parameters and MVIT at a range of joint angles. At each session, an
ultrasonographic assessment of regional quadriceps MT, PA, and FL, followed by an isometric
assessment of MVIT at 40º, 70º, and 100º of knee flexion (0º = full extension) was completed.
Each participant was tested on three separate occasions, separated by 5-8 days.

Chapter 8
121
Participants
Twenty-four healthy males (28.5 ± 4.7 years, 180.1 ± 7.7 cm, 81.6 ± 11.8 kg)
volunteered for this study. All participants were required to have at least six months of
resistance training experience (6.73 ± 4.83, range = 1-18 years) with at least two weekly
sessions of lower-body resistance training (2.54 ± 0.75, range = 2-4 sessions.week-1) and be
free of any musculoskeletal injuries for at least three months before data collection. Participants
were instructed to maintain their current level of physical activity throughout the data collection
period apart from refraining from strenuous physical activity, alcohol, caffeine, and other
ergogenic aids for at least 48 hours before each session. The Auckland University of
Technology Research Ethics Committee approved the study (18/232), and all subjects provided
written informed consent.
Testing procedures
Ultrasonography
All ultrasound images were collected using the same transducer and built-in software
(45 mm linear array, GE Healthcare, Vivid S5, Chicago, IL). Ultrasound settings (frequency,
12 MHz; brightness, maximum; gain, 60 dB; dynamic range, 70; depth, individualized) were
recorded and kept consistent across all sessions. All assessments were performed by the same
sonographer with ~3 years of experience. Upon arrival, participants were positioned in a supine
position on a massage table for 15 minutes, to allow for fluid re-distribution (374). The
participants remained in a supine position with knees and hips fully extended with a foot strap
used to prevent excessive external rotation (267). During this period, the participants had each
thigh measured and marked by an ISAK level-2 anthropometrist. The length of the lateral
aspect of the thigh was determined by measuring the distance from the superior border of the
greater trochanter to the inferior border of the lateral condyle of the femur. The anterior aspect
of the thigh was determined by measuring the distance between the superior border of the
patella and the inferior border of the anterior, superior iliac spine (250). Thigh lengths were
recorded, and markings were made at 30% (proximal), 50% (middle), and 70% (distal) of the
lateral and anterior distances, respectively (267). The vastus lateralis was marked by
determining the most lateral aspect of the thigh (Figure 15A). Participants were instructed to
briefly tense the quadriceps so that the researcher could mark the rectus femoris (Figure 15B).
Pilot testing with our resistance-trained male cohort determined that extended field-of-view
scans of the vastus intermedius were not consistently clear. Thus, scanning depths were
adjusted to only capture the vastus lateralis and rectus femoris muscles. The vastus medialis

Chapter 8
122
was excluded as it can be further broken down into the obliquus and longus portions, with deep
and superficial fiber bundles (63). Furthermore, MT of the vastus medialis oblique and longus
have substantially smaller correlations with magnetic resonance imaging derived cross-
sectional area when compared to the vastus lateralis or rectus femoris (124). MT and PA of the
vastus lateralis and lateral vastus intermedius, and the rectus femoris and anterior vastus
intermedius were collected in the same snap-shot images, respectively. Typical proximal,
middle, and distal lateral and anterior images are provided in Figure 16.
Figure 15. Markings and scanning probe position for the lateral (panel A) and anterior (panel
B) quadriceps femoris. Arrows illustrate the direction of extended field-of-view probe sweep.
Images provided courtesy of Dr. Matt Stock (University of Central Florida).

Chapter 8
123
Figure 16. Representative proximal, middle, and distal B-mode ultrasound images of the lateral
(top) and anterior (bottom) quadriceps muscles. MT = muscle thickness. PA = pennation angle.
Fascicle length was measured by the extended field-of-view function as extensively
detailed previously (252, 263). The ultrasound probe was moved across a muscle, while a
texture mapping algorithm merged the sequence of images into a composite image (110, 252).
A water-soluble gel was applied to the scanning head of the ultrasound probe to achieve
acoustic coupling, with care taken to avoid tissue deformation (110, 252, 263). The probe was
oriented perpendicular to the skin and parallel to the estimated fascicle direction (110, 252,
263). Two images were captured for each region or extended field-of-view scan. Two measures
(MT, PA, FL) were quantified for each image and averaged. The mean from both images was
averaged to give a mean MT, PA, and FL for subsequent analysis (263).
Isometric dynamometry
Following the ultrasonographic assessment, participants warmed up by cycling at low
to moderate resistance using a self-selected pace for five minutes (269). Subjects were seated
on the isokinetic dynamometer (CSMi; Lumex, Ronkonkoma, NY) at a hip angle of 85º, with
shoulder, waist, and thigh straps to reduce body movement during contractions (265, 269). The

Chapter 8
124
shin-pad was positioned ~5 cm superior to the ankle joint malleoli (269). Subjects were
required to hold handles at the sides of the chair, while the non-working limb was positioned
behind a restraining pad (269). Knee alignment was determined by visual inspection and
unloaded knee extensions. Dynamometer settings were recorded and matched for subsequent
sessions.
Once fitted to the dynamometer, subjects underwent a series of extensions and flexions
of the knee to determine safety stop positions and calibrate gravity correction (269). Subjects
then completed a standardized warmup of concentric contractions of 30%, 50%, 70%, 85%,
and 100% of perceived MVIT (269). One minute after the completion of the warmup
contractions, the participants' knee was positioned at 40º of flexion, where one familiarization
isometric knee extension at 50% of perceived MVIT was performed (269). Sixty seconds later,
two maximal contractions lasting four seconds were completed with 30 seconds separating
each contraction (269). Participants were instructed to contract “as fast and hard as possible,”
following a countdown of “3-2-1-go!” (215, 269). All participants were given strong verbal
encouragement along with visual feedback of the force-time tracing during each trial (215,
269). Participants were instructed to avoid any pre-tension and countermovement of the knee
extensors, while the live force-time trace was carefully inspected by the examiner leading up
to each contraction (215, 269). The cut-off for pre-tension was set at 10 N (269). Any
contractions with a countermovement or an unsteady baseline were rejected and repeated (215,
269). The participants then completed the same series at 70º and 100º of knee flexion. The
isometric contractions were always performed in series from 40º to 100º to avoid greater
muscle damage and fatigue synonymous with long muscle length contractions (250). Ten
minutes following the final isometric contraction, the concentric warm-up, and isometric
assessments were repeated on the opposite limb. Limb order was randomized throughout the
testing sessions and counterbalanced over the participant group. All contractions were
collected, without filtering, via a custom-made software (LabVIEW; National Instruments,
New Zealand) sampling at 2000 Hz (215, 269).
Data processing and analysis
Ultrasonography
Images were stored and analyzed via digitizing software (ImageJ; National Institutes of
Health). Muscle thickness (cm) was defined as the perpendicular distance between the deep
and superficial aponeurosis, and PA was defined as the angle of the fascicles relative to the

Chapter 8
125
deep aponeurosis (110, 263). Due to the depth of the muscle, the fascicles on the lateral and
anterior vastus intermedius were not consistently visible (263). Therefore, PA and FL were not
recorded for the lateral and anterior vastus intermedius. As the rectus femoris is complex, in
that there are distinctly different directions of pennation (250), only 23/48 of distal rectus
femoris FL measurements were able to be determined. Representative vastus lateralis and
rectus femoris extended field-of-view images are illustrated in Figure 17A and B, respectfully.
Anatomical variables were averaged across all sessions to reduce errors arising from
sonography or participant variability.
Figure 17. Representative extended field-of-view images of the vastus lateralis with proximal,
middle, and distal fascicle lengths (A). Typical extended field-of-view image of the rectus
femoris (B); note the lack of discernible fascicles towards the distal region. FL = fascicle
length.
Isometric dynamometry
Data were analyzed via a customized MATLAB (MathWorks, Natick, MA) script. As
the moment arm substantially affects isometric outputs (133, 374), all torque data were divided
by the length of the dynamometer arm, in meters, to normalize the difference in shank length
between participants (269). Thus, all MVIT data are reported in newtons (N). Normalized
MVITs over 200 N were identified to signify a full contraction and eliminate false contractions
(269). A peak detection algorithm was implemented to detect and identify the instantaneous
peak torque of each contraction (269). The contraction with the highest instantaneous peak
torque was analyzed to minimize issues of voluntary activation. The maximum values of MVIT

Chapter 8
126
across the three sessions were utilized to reduce error arising from submaximal voluntary
activation.
Statistical analysis
Reliability
Measures of MVIT, MT, and FL were log-transformed before analysis to reduce non-
uniformity of error (149, 152) and analyzed with an Excel spreadsheet (150). To reduce bias in
the correlations between variables, only measures with sufficiently high intersession reliability
were included in the correlational analysis. Since the mean or maximum of the three sessions
was used in the correlation analysis, the relevant measure of reliability was the square root of
the intraclass correlation coefficient (ICC) of the mean of the three sessions (152). A value of
ICC > 0.90 (corresponding to between-session ICC > 0.60) was considered sufficiently
reliable since any correlation with the variable would be biased downward by a factor of 0.90
at most (152). For comparison with other studies, the between-session typical error of
measurement (TEM) was also analyzed and expressed as a percentage for MVIT, MT, and FL
(149, 152). TEM is expressed in degrees for PA, as there is an upper limit of 90º, and unlike
other measures, it would not be expected for error to change with increasing or decreasing
values (149, 152).
While not a primary aim of the study, the variability of intra-image measures (e.g., the
variability of two proximal vastus lateralis FL measures in the same image) was performed to
determine variations in quadriceps anatomy across regions and muscles. The same procedure
and interpretation as the intrasession reliability analysis. Intra-image variability statistics were
not analyzed for MVIT as the greatest value, regardless of contraction or session were utilized
for the correlational analysis.
Correlational analysis
As the primary goal of this study was to examine the effects of regional quadriceps
anatomy on MVIT, a measure was included only if it was sufficiently reliable in all three
regions (proximal, middle, distal) and knee joint angles (40º, 70º, 100º). Simple linear
regressions were used to predict angle specific MVIT with anatomical parameters in isolation
(e.g., distal vastus lateralis MT). Multiple linear regressions were used to predict MVIT with
anatomical variables from a single muscle and region (e.g., distal vastus lateralis MT + distal

Chapter 8
127
vastus lateralis PA + distal vastus lateralis FL), with lateral or anterior compartments (e.g.,
distal vastus lateralis MT + distal vastus lateralis PA + distal vastus lateralis FL + distal lateral
vastus intermedius MT), and finally, with region across all muscles (e.g., distal vastus lateralis
MT + distal vastus lateralis PA + distal vastus lateralis FL + distal lateral vastus intermedius
MT + distal rectus femoris MT+distal anterior vastus intermedius MT).
All regression analyses were performed with Proc Reg in the Statistical Analysis
Software (University Edition of SAS Studio, version 9.4, SAS Institute, Cary NC). Measures
of the ability of the regression models to predict torque were the multiple R (the correlation
between observed and predicted values), R2 (equivalent to the absolute value of Pearson’s r
for a single predictor), and the adjusted multiple R (the square-root of the R-squared, adjR2,
adjusted for degrees of freedom). The adjustment removes the upward bias in the R-squared
that occurs when any predictor is added to a model with a finite sample size. Negative values
of adjR2 were expressed as negative correlations by changing the sign before taking the square
root. Effects (adjusted multiple R, their means, and their differences) are presented with the
qualitative magnitude of their observed (sample) value and interpreted as trivial, small,
moderate, large, very large, and extremely large for values < 0.10, ≥ 0.10, ≥ 0.30, ≥ 0.50, ≥
0.70, and ≥ 0.90 respectively (152).
Sampling uncertainty in the estimates of effects is presented as 90% compatibility limits
(90%CL), which were estimated from percentiles of the effects in 10,000 bootstrapped samples
(152). The bootstrapped effects were estimated initially by performing multiple linear
regression with each bootstrapped sample, but the median values of the effects were
substantially higher than those in the original sample. Therefore, values in the bootstrapped
samples were derived as follows: the regression coefficients in the original sample were used
to predict the dependent variable in each bootstrapped sample; the correlation between the
predicted and observed values of the dependent variable in each sample was squared and
adjusted for degrees of freedom; the square root of this adjusted R-squared then provided
values of adjusted multiple R, which showed close agreement between the original and
bootstrapped median values. As a further check on the adequacy of this bootstrap method, the
analyses were performed on simulated data with a sample size of 24 and population simple
correlations between a dependent variable and two predictor variables in two limbs. One
hundred analyses each of 10,000 bootstrap samples were performed for correlations ranging

Chapter 8
128
from 0.00 to 0.70. Observed and median adjusted multiple R showed a downward bias of 0.05
to 0.10 for true correlations of 0.00-0.30, 0.04 for true correlations of 0.50, and only 0.02 for
true correlations of 0.70. Despite the bias, 90%CLs showed less than the 10% expected error
rate in their coverage of low values of true correlations and a slightly higher error rate (~12%)
for true correlations of 0.50 and 0.70. The bootstrapping was therefore judged to be trustworthy
(152).
The non-clinical version of magnitude-based decisions with a minimally informative
prior was used to interpret the uncertainty in effect magnitudes (151). Chances that the true
magnitude was a substantial negative value, a trivial value, and a substantially positive value
were derived directly from the bootstrapped samples as the proportion of sample values with
those magnitudes. Effects were deemed to be clear (to have adequate precision) if the chances
of one or other substantial true values were < 5% (i.e., the 90%CLs did not include substantial
positive and negative values). Clear effects are reported with a qualitative descriptor for the
magnitude with chances > 25% using the following scale: > 25%, possibly (*); > 75%, likely
(**); > 95%, very likely (***); and > 99.5%, most likely (****) (152). When the chances of a
substantial or trivial magnitude were > 95%, the magnitude itself is described as clear. Effects
with inadequate precision are described as unclear. Effects with adequate precision defined by
99% compatibility intervals are highlighted in bold in tables and figures; the overall error rate
for coverage of 10 independent true values with such intervals is that of a single effect with a
90%CL, and interpretation of outcomes are focused on these effects.
Results
Reliability
Intersession
Assessments of the thickness of all muscles were reliable (ICC = 0.97-1.00, TEM =
1.9-6%), regardless of limb or region. Similarly, vastus lateralis PA was reliable (ICC = 0.90-
0.92, TEM = 1.1-2.3º) regardless of limb or region. However, rectus femoris PA showed large
variability at the distal region of both limbs (ICC = 0.88-0.89, TEM = 1.5-1.9º) and in the
middle of the dominant limb (ICC = 0.87, TEM = 2.4º). Therefore, rectus femoris PA was not
included in the correlational analysis. Vastus lateralis FL was reliable (ICC = 0.95-0.97, TEM
= 3.9-7.7%), regardless of limb or region. However, rectus femoris FL could only be
confidently identified in 11 of 24 participants in all limbs and regions across all three sessions.

Chapter 8
129
Therefore, intra-image and intersession statistics were not calculated, and rectus femoris FL
was not included in the correlational analysis. Finally, MVIT was reliable (ICC = 0.94-0.98,
TEM = 6.8-12.1%), across all limbs and joint angles.
Intra-image
Intra-image MT were nearly identical (ICC = 0.98-1.00, TEM = 0.8-1.9%), regardless
of limb, muscle, or region. When comparing two fascicles per image vastus lateralis PAs were
similar (ICC = 0.94-0.98, TEM = 2.2-4.7º) regardless of limb or region. However, intra-image
rectus femoris PA was increasingly variable as measures moved distally (proximal: (ICC =
0.94-0.96, TEM = 2.4-5.4º; middle: ICC = 0.91-0.94, TEM = 2.6-5.0º; distal: ICC = 0.87-
0.90, TEM = 2.0-3.9º), regardless of limb. Conversely, intra-image vastus lateralis FL was
more variable at the proximal (ICC = 0.87-0.90, TEM = 7.8-9.2%) and distal (ICC = 0.89-
0.93, TEM = 6.7-8.9%) regions when compared to the middle (ICC = 0.93-0.94, TEM = 5.5-
8.0%).
Correlational analysis
Mean regional anatomical measures are summarized in Appendix 5. Peak normalized
MVIT for the dominant and non-dominant limbs were 684±129 N and 644 ± 142 N at 40º, 910
± 205 N and 855 ± 180 N at 70º, and 740 ± 184 N and 714 ± 133 N at 100º, respectively. All
between-limb differences in predictive ability were unclear, or possibly small; therefore, all
correlations are presented after pooling dominant and non-dominant limbs.
Simple linear regressions
Correlations and bootstrapped 90%CLs of individual measures of regional muscle
anatomy with MVIT at 40º, 70º, and 100º of knee flexion are presented in Figure 18. Vastus
lateralis MT (adjR2 = 0.18-0.64) and FL (adjR2 = 0.29-0.60) had small to large correlations,
while PA had trivial to small (adjR2 = -0.08-0.34) correlations with MVIT, regardless of joint
angle. Correlations between MVIT and rectus femoris (adjR2 = -0.01-0.49) lateral (adjR2 =
0.23-0.58) and anterior vastus intermedius MT (adjR2 = 0.06-0.32) were trivial to moderate,
small to large, and trivial to moderate, respectively. The largest simple correlation was between
middle vastus lateralis MT and MVIT at 100° of knee flexion (adjR2 = 0.64), with distal vastus
lateralis MT having the greatest mean correlation with MVIT (adjR2 = 0.61 ± 0.05).

Chapter 8
130
Conversely, proximal vastus lateralis PA had the smallest mean correlation with MVIT (adjR2
= -0.05 ± 0.03).
Figure 18. Adjusted simple correlations with bootstrapped 90% compatibility limits of
normalized maximal voluntary isometric torque at 40º, 70º, and 100º of knee flexion with
regional quadriceps architecture.
Between-region differences in simple correlations are presented in Appendix 6. Distal
and middle vastus lateralis MT had likely or very likely higher correlations with MVIT than
proximal vastus lateralis MT (ΔadjR2 = 0.29-0.43). Distal vastus lateralis PA had a likely
greater correlation with MVIT at 100º than proximal PA (ΔadjR2 = 0.37). Conversely,
proximal vastus lateralis FL had a likely greater correlation with MVIT at 100º than distal FL
(ΔadjR2 = 0.31). Middle rectus femoris MT had likely greater correlations with MVIT than

Chapter 8
131
proximal rectus femoris MT (ΔadjR2 = 0.41-0.43). Distal lateral vastus intermedius MT had
a likely greater correlation with MVIT at 100º than middle vastus intermedius MT (ΔadjR2 =
0.15). All other between-region differences were unclear, or possibly small.
Multiple linear regressions
Between-region differences in multiple linear regression correlations with angle-
specific MVIT are presented in Appendix 7.
All multiple linear regressions of the vastus lateralis MT, PA, and FL combination were
likely, very likely, or most likely moderate to large (adjR2 = 0.41-0.66) (Table 15). The largest
correlation was always found in the distal region; however, substantial between-region
differences were only likely between distal and proximal regions at 40º (ΔadjR2 = 0.25), with
all other comparisons being unclear, or possibly small (ΔadjR2 = 0.03-0.19).
Table 15. Multiple correlations (R2) and adjusted multiple correlations (adjR2), with
compatibility limits and magnitude-based decisions, between normalized maximal
voluntary isometric torque and combined regional quadriceps measures (MT + PA + FL).
Joint angle Region R2 adjR2 (90%CL) Decision
40º Proximal 0.53 0.41 (-0.06, 0.65) Moderate**
Middle 0.67 0.59 (0.20, 0.76) Large***
Distal 0.71 0.66 (0.44, 0.82) Large****
70º Proximal 0.57 0.47 (0.05, 0.68) Moderate**
Middle 0.66 0.58 (0.19, 0.75) Large***
Distal 0.69 0.65 (0.41, 0.81) Large****
100º Proximal 0.61 0.56 (0.16, 0.76) Large***
Middle 0.67 0.62 (0.36, 0.77) Large***
Distal 0.68 0.65 (0.50, 0.78) Large****
MT = muscle thickness. PA = pennation angle. FL = fascicle length. 90%CL = 90%
compatibility limits. * = possibly. ** = likely. *** = very likely. **** = most likely
substantial. Decisions in bold have acceptable precision with 99% CLs.

Chapter 8
132
Multiple linear regressions of lateral quadriceps anatomy were always greatest in the
distal region (Table 16). Distal had likely larger correlations with MVIT at 40º and 70º than
the proximal region (ΔadjR2 = 0.20-0.25), while all other between-region comparisons were
unclear or possibly small (ΔadjR2 = 0.05-0.18).
Table 16. Multiple correlations (R2) and adjusted multiple correlations (adjR2), with
compatibility limits and magnitude-based decisions, between normalized maximal
voluntary isometric torque and combined regional quadriceps measures (VLMT + PA +
FL + LVIMT).
Joint angle Region R2 adjR2 (90%CL) Decision
40° Proximal 0.56 0.40 (-0.15, 0.66) Moderate
Middle 0.68 0.58 (0.13-0.76) Large***
Distal 0.72 0.65 (0.02-0.73) Large**
70° Proximal 0.60 0.48 (0.03, 0.70) Moderate**
Middle 0.68 0.58 (0.14, 0.76) Large***
Distal 0.73 0.68 (0.48, 0.83) Large****
100° Proximal 0.65 0.59 (0.26, 0.77) Large***
Middle 0.72 0.64 (0.39, 0.78) Large****
Distal 0.73 0.69 (0.55, 0.81) Large****
VL = vastus lateralis. LVI = lateral vastus intermedius. MT = muscle thickness. PA =
pennation angle. FL = fascicle length. CL = compatibility limits. * = possibly. ** = likely.
*** = very likely. **** = most likely substantial. Decisions in bold have acceptable
precision with 99% CLs. Italicized decisions are unclear.
The combinations of lateral, and anterior quadriceps MT are presented in Table 17.
Distal lateral MT was always largely correlated to MVIT (adjR2 = 0.59-0.68) and had likely
greater correlations with MVIT than proximal lateral MT at all three joint-angles (ΔadjR2 =
0.20-0.23). Conversely, middle anterior MT was likely moderately correlated with MVIT at
70º and 100º (adjR2 = 0.42-0.49), while all other correlations were unclear. Middle anterior
MT had likely moderate-largely greater correlations than proximal anterior MT when
predicting MVIT at 40º (ΔadjR2 = 0.56), 70º (ΔadjR2 = 0.46), and 100º (ΔadjR2 = 0.35).
Comparisons between lateral and anterior MT are presented in Appendix 8. Lateral MT had
Chapter 8
133
likely moderate-largely greater correlations with MVIT at 40º (ΔadjR2 = 0.57 (proximal) and
0.42 (distal)), 70º (ΔadjR2 = 0.47 (proximal) and 0.33 (distal)), and 100º (ΔadjR2 = 0.35
(distal)) than anterior MT.
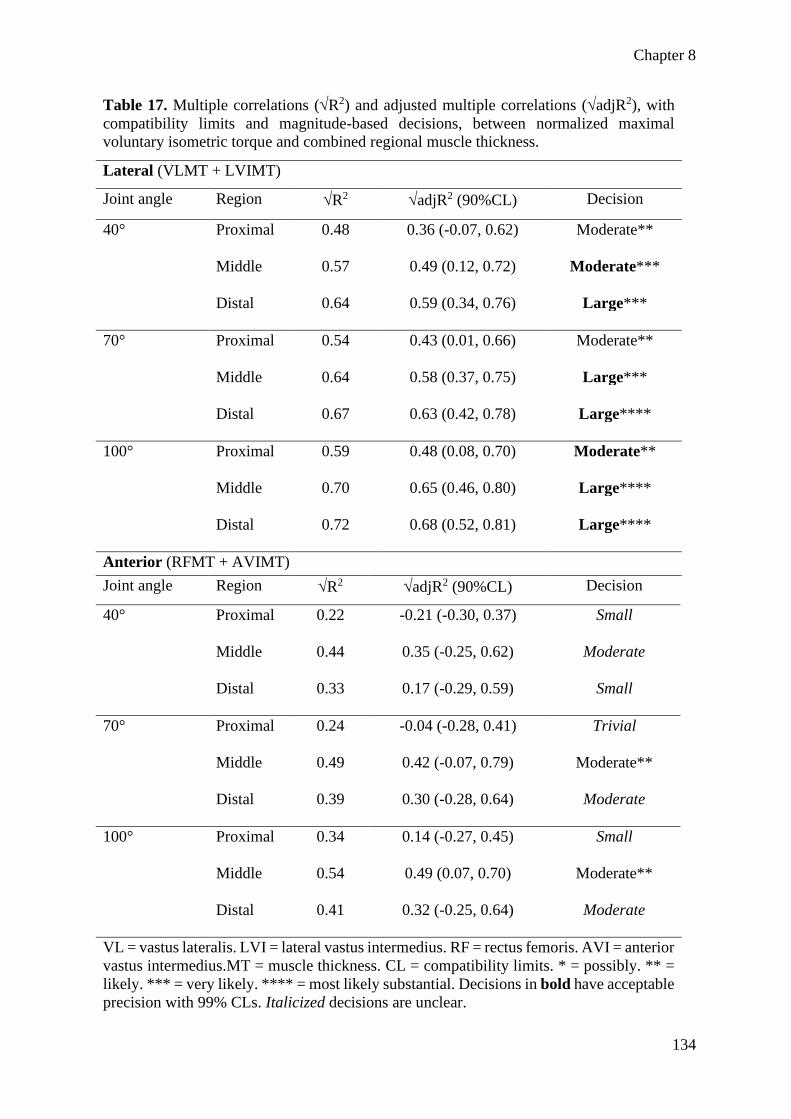
Chapter 8
134
Table 17. Multiple correlations (R2) and adjusted multiple correlations (adjR2), with
compatibility limits and magnitude-based decisions, between normalized maximal
voluntary isometric torque and combined regional muscle thickness.
Lateral (VLMT + LVIMT)
Joint angle Region R2 adjR2 (90%CL) Decision
40° Proximal 0.48 0.36 (-0.07, 0.62) Moderate**
Middle 0.57 0.49 (0.12, 0.72) Moderate***
Distal 0.64 0.59 (0.34, 0.76) Large***
70° Proximal 0.54 0.43 (0.01, 0.66) Moderate**
Middle 0.64 0.58 (0.37, 0.75) Large***
Distal 0.67 0.63 (0.42, 0.78) Large****
100° Proximal 0.59 0.48 (0.08, 0.70) Moderate**
Middle 0.70 0.65 (0.46, 0.80) Large****
Distal 0.72 0.68 (0.52, 0.81) Large****
Anterior (RFMT + AVIMT)
Joint angle Region R2 adjR2 (90%CL) Decision
40° Proximal 0.22 -0.21 (-0.30, 0.37) Small
Middle 0.44 0.35 (-0.25, 0.62) Moderate
Distal 0.33 0.17 (-0.29, 0.59) Small
70° Proximal 0.24 -0.04 (-0.28, 0.41) Trivial
Middle 0.49 0.42 (-0.07, 0.79) Moderate**
Distal 0.39 0.30 (-0.28, 0.64) Moderate
100° Proximal 0.34 0.14 (-0.27, 0.45) Small
Middle 0.54 0.49 (0.07, 0.70) Moderate**
Distal 0.41 0.32 (-0.25, 0.64) Moderate
VL = vastus lateralis. LVI = lateral vastus intermedius. RF = rectus femoris. AVI = anterior
vastus intermedius.MT = muscle thickness. CL = compatibility limits. * = possibly. ** =
likely. *** = very likely. **** = most likely substantial. Decisions in bold have acceptable
precision with 99% CLs. Italicized decisions are unclear.

Chapter 8
135
When combining all variables by region the greatest correlations were exclusively
found at the distal region, with likely small differences between the distal and proximal regions
at 40º (ΔadjR2 = 0.37) and 70º (ΔadjR2 = 0.25) (Table 18).
Table 18. Multiple correlations (R2) and adjusted multiple correlations (adjR2), with
compatibility limits and magnitude-based decisions, between normalized maximal voluntary
isometric torque and combined regional quadriceps measures (VLMT + PA + FL + LVIMT
+ RFMT + AVIMT).
Joint angle Region R2 adjR2 (90%CL) Decision
40° Proximal 0.56 0.26 (-0.39, 0.61) Small
Middle 0.68 0.51 (-0.12, 0.73) Large
Distal 0.73 0.63 (0.21, 0.81) Large***
70° Proximal 0.62 0.41 (-0.10, 0.67) Moderate
Middle 0.69 0.53 (0.01, 0.74) Large**
Distal 0.74 0.66 (0.42, 0.82) Large***
100° Proximal 0.67 0.54 (0.07, 0.75) Large****
Middle 0.72 0.61 (0.23, 0.76) Large***
Distal 0.74 0.66 (0.49, 0.80) Large****
VL = vastus lateralis. LVI = lateral vastus intermedius. RF = rectus femoris. AVI = anterior
lateral vastus intermedius. MT = muscle thickness. PA = pennation angle. FL = fascicle
length. CL = compatibility limits. * = possibly. ** = likely. *** = very likely. **** = most
likely substantial. Decisions in bold have acceptable precision with 99% CLs. Italicized
decisions are unclear.
Finally, regardless of model, single, and multiple correlations were greatest for MVIT
at 100º (adjR2 = 0.35 ± 0.19, R2 = 0.63 ± 0.12, adjR2 = 0.55 ± 0.15), and decreased at 70º
(adjR2 = 0.30 ± 0.20, R2 = 0.60 ± 0.14, adjR2 = 0.49 ± 0.18) and 40º (adjR2 = 0.25 ± 20,
R2 = 0.57 ± 0.15, adjR2 = 0.43 ± 0.23). However, the differences were either unclear or
possibly-likely trivial-small, except for a moderate likely higher correlation between proximal
anterior MT and MVIT at 100º versus 40º (Δ(adjR2) = 0.35; 90%CL = 0.03, 0.69).

Chapter 8
136
Discussion
While several studies have examined the relationship between anatomy and
performance, none have investigated the role of regional quadriceps anatomical parameters on
isometric muscle function at more than one joint angle. Additionally, none of the relevant
literature has reported measurement reliability over multiple sessions. Therefore, we aimed to
determine intersession reliability and investigate the role of regional quadriceps MT, PA, and
FL on MVIT at multiple joint angles. The main findings were: 1) while MT had high
intersession reliability regardless of muscle, region, or limb dominance, PA and FL could only
be confidently assessed in the vastus lateralis; 2) the middle and distal regions of the quadriceps
had larger correlations to MVIT than the proximal region with regards to predicting MVIT,
especially at 40º; 3) the lateral quadriceps MT had larger correlations with MVIT at all angles
when compared to anterior quadriceps MT; and, 4) the ability of quadriceps anatomy to predict
MVIT increased as muscle length increased. While not a primary aim, we determined that the
proximal and distal vastus lateralis FLs had greater intra-region variability compared to the
middle regions, while intra-region rectus femoris PA was greatest at the distal region.
To be confident in our correlational findings, intersession reliability determination of
our measures was a priority. While MT was highly reliable regardless of muscle, region, or
limb, only vastus lateralis PA and FL could be included in our models. Additionally, MVIT
had low intersession reliability at all joint angles in both dominant and non-dominant limbs.
Several correlational studies have reported intrasession (6, 48, 73, 177, 247) or intersession
reliability (13, 213, 360), while others fail to report any test-retest data (190, 368). Furthermore,
none have reported all measures, over three sessions, with their full sample size. For example,
while Trezise, Collier, and Blazevich (360) examined an impressive sample size of 56 men,
only 10 returned for a re-test. Similarly, nine participants were tested a second time by Ando
et al. (13). More importantly, both studies reported the pooled intersession ICC for all muscles
and regions, making it impossible to know the test-retest statistics of each variable (13, 360),
adding uncertainty to their primary results. It must be noted intersession reliability of
ultrasonographic measurements relates primarily to technician-related error and that our results
should not be applied to other studies.
Middle and distal quadriceps anatomy generally had greater simple and multiple
correlations to MVIT when compared to the proximal region (see Appendices 6 and 7), except

Chapter 8
137
for proximal and middle vastus lateralis FL having a likely greater correlation with MVIT at
100º than distal FL (r = 0.31). With regards to region, our finding is similar to Ando et al. (13)
who found the middle anterior vastus intermedius (r = 0.74) to be the only MT measurements
to reach large, or very large correlations with knee extensor force at 90º. However, the
investigation of Ando et al. (13) should be interpreted with caution due to a sample of N = 11
(106). Conversely, our results conflict with Trezise, Collier, and Blazevich (360) who reported
“proximal” quadriceps cross-sectional area have the single largest correlation (r = 0.77) to
maximal concentric and MVIT, with slightly lower correlations at “middle” (r = 0.72) and
“distal” (r = 0.69) regions. It is important to note that quadriceps cross-sectional area was
obtained at 50% (proximal), 40% (middle), and 30% (distal) of thigh-length by these authors
(360), making their “proximal” region more comparable to our mid-region. It is also worth
considering that the one-dimensional measure of MT does not account for muscle shape,
whereas cross-sectional area accounts for shape in two-dimensions. Trezise, Collier, and
Blazevich’s (360) sample was a mixture of endurance runners, weightlifters, recreationally-
trained, and untrained participants, whereas the present cohort was only resistance-trained men.
While Maden-Wilkinson et al. (213) recently reported little difference in the percent of the
maximal cross-sectional area across regions of the thigh between trained and untrained
participants, several interventions have shown greater hypertrophy at the distal or middle,
versus proximal regions of muscle following resistance-training (110, 268, 359). Therefore, the
larger correlations in the middle and distal versus proximal regions in our study could be
partially explained by training history.
Another key finding of this study was the substantially greater correlations between
lateral MT and MVIT versus the anterior musculature (see Appendix 8). These findings align
with Ando et al. (13), who reported a greater correlation between isometric force with the MT
of the vastus lateralis (r = 0.43) than the rectus femoris (r = 0.19). However, Coratella et al.
(73) recently reported similar correlations between mid-region vastus lateralis (r = 0.214) and
rectus femoris (r = 0.211) MT, and late-stage rate of force development at 90º of knee flexion.
Unfortunately, correlations with peak force were not reported, making direct comparison
difficult (73). Furthermore, the vastus lateralis accounts for a substantially greater portion of
the total quadriceps size than the rectus femoris (177, 213, 250, 337), almost certainly leading
to greater contribution to knee-extension performance. However, explaining the large
discrepancy between lateral and anterior vastus intermedius correlation with MVIT is more
difficult. Most of the related literature either pool multiple quadriceps muscles (177, 250, 360),

Chapter 8
138
utilize the total cross-sectional area (359), or do not specify if the vastus intermedius was
scanned from the coronal or sagittal plane (73). Additionally, the only study reporting both
lateral and anterior vastus intermedius MT had contradictory results to ours, with the anterior
portion (r = 0.74) having a greater correlation to knee-extension force than the lateral (r = 0.37)
(13). Other than the small sample size, Ando et al.’s (13) results may differ from ours as they
assessed the quadriceps with the knee flexed at 90º. It is plausible that a difference in lateral
and anterior vastus intermedius MT with a flexed knee may alter the relationship between
structure and function (374).
While not changing with different joint angles, proximal vastus lateralis FL was more
highly correlated with MVIT than distal FL. Although the regions examined by Trezise and
colleagues (359, 360) differed from ours, they still reported increasing correlation coefficients
between MVIT and FL as the measurements moved proximally, in agreement with the present
findings. Conversely, Trezise, and colleagues (359, 360) found that vastus lateralis PA had
greater correlations as the measures moved proximally, in conflict with the present study.
Additionally, numerous studies have reported PA to be strongly correlated with sport or
contractile performance (177, 359, 360, 379), whereas PA had only trivial to moderate
correlations in ours. The reason for this discrepancy is difficult to determine as our inter-session
and intra-image measures were highly repeatable. However, the substantial resistance training
experience of our volunteers could have altered the relationships between regional vastus
lateralis PA and knee-extension performance. Finally, minimal improvements in the regression
models were found when examining vastus lateralis MT or cross-sectional area, with the
incorporation of PA (359, 360); a phenomenon likely explained by PA tending to increase with
MT; making its inclusion somewhat redundant.
The correlations between MVIT and quadriceps anatomy became larger as the joint
angle increased from 40º, 70º, and 100º of knee flexion. Interestingly, vastus intermedius MT
was one of the primary contributors to the observation (Figure 18). Indeed, Saito and Akima
(303) examined the electrical activity of the four major quadriceps muscles during isometric
contractions at 30º, 60º, and 90º of flexion and determined that vastus intermedius activation
significantly increased with each joint angle, while vastus lateralis, rectus femoris and vastus
medialis activity did not greatly differ throughout the range of motion (303). On a related note,
researchers have suggested that the vastus intermedius undergoes greater mechanical strain and
damage when compared to the vastus lateralis during lengthening contractions (12, 121), likely

Chapter 8
139
due to the vastus intermedius fascicles directly attaching to the bone, whereas the vastus
lateralis fascicles attach to the intermuscular aponeurosis (14). The exclusion of the vastus
medialis is another potential reason for smaller correlations at 40º, as the vastus medialis has
been shown to exhibit its greatest electrical activity during the final 60º of knee extension (324).
Thus, the inclusion of the vastus medialis into our regression models may have resulted in more
homogenous correlations between the assessed joint angles. While exhibiting only trivial to
moderate correlations, vastus lateralis PA was another noticeable contributor to the greater
correlations at increased joint angles, whereas the relationship between FL and MVIT did not
change throughout the range of motion despite small to large simple correlations. This
observation is difficult to explain as longer fascicles are theorized to increase shortening
velocity and contractile force at longer muscle lengths (6, 190, 247), whereas, to the authors'
knowledge, no studies have found PA to differentially affect performance at different joint
angles. However, variable fascicle gearing theory and three-dimensional models of muscle
contraction (27, 28, 297) may help in understanding the present findings. For example, Azizi
and Roberts (28) report increased fascicle rotation, and architectural gearing ratios during
lengthening versus shortening contractions. More simply, increases in muscle-tendon unit
length were almost completely accommodated by PA increases, with minimal change in FL
(28).
While not the primary intention of this study, several practical applications can be
found. First, simple, and multiple correlations were consistently greater at 70º and 100º
compared to 40º. The lateral musculature also had greater correlations with MVIT when
compared to the anterior musculature. Similarly, middle, and distal anatomy had greater
correlations when compared to the proximal region. As such, time and resource-poor
researchers may wish to evaluate only the middle and distal regions of the lateral quadriceps
when aiming to predict function.
Limitations and future research directions
While the aims of this study were achieved, there are several limitations to consider.
Firstly, the use of surface or needle electromyography to determine individual muscle
activation at different joint angles was not utilized; yet similar examinations have reported
electromyography to have trivial to moderate correlations to isometric (359, 360) and cycling
performance (177), and/or contributed little to multiple regression models (133, 359, 360).
Similarly, we could only evaluate the voluntary efforts of our participants, and not the maximal

Chapter 8
140
potential of the quadriceps musculature through peripheral or transcranial stimulation
techniques (176, 194). To partially address this we used the greatest MVIT outputs over the
three collection sessions, and note that the literature has consistently reported isometric
voluntary activation of the knee extensors of > 90% in healthy young men (176, 298, 360),
with little difference in voluntary activation or electromyography amplitude with at different
knee joint angles (20, 194). While the aforementioned strategy to maximize voluntary
activation removes many limitations, the lack of joint angle order randomization may have led
to the accumulation of non-trivial fatigue levels as contractions progressed from 40º to 100º of
flexion.
Future research could include the knee joint moment arm, which can change through
the range of motion (48, 360). Likewise, compression of the dynamometer padding means that
the joint angles reported were likely overestimated. While the joint angles still corresponded
to relatively short, medium, and long muscle lengths, researchers could utilize motion-capture
or goniometric measurements to more precisely evaluate joint angles (20). Researchers may
also wish to scan the quadriceps in the same position as the isometric strength assessment to
better represent joint angle specific architecture. Though highly correlated with MT (109),
assessments of cross-sectional area or muscle volume via magnetic resonance imaging, or
panoramic or three-dimensional ultrasound may further uncover the relationship between form
and function. More experienced sonographers could have consistently produced extended
field-of-view rectus femoris and vastus intermedius FLs, allowing for further elucidation of the
relationship between regional quadriceps anatomy and angle-specific torque. Similarly,
performing several, smaller extended field-of-view scans may have allowed for improved
rectus femoris imaging, and reduced intra-image variability of proximal and distal vastus
lateralis FL. While several studies have examined inhomogeneous morphological and
architectural adaptations, very few have evaluated more than two regions of an individual
muscle (397). Therefore, we recommend that future investigations examine three or more
regions to further illuminate the effect of training, or disuse on region specific muscle
adaptations. Finally, similar research examining the effect of regional muscle anatomy in other
populations, or on dynamic contractions, at several velocities, through a full range of motion,
would be of interest.
Chapter 8
141
Conclusions
This was the first study to examine the effect of regional quadriceps anatomy on the
length-tension relationship. Our data demonstrated that the relative contribution of regional
anatomical parameters to MVIT does not change at different joint angles. However, middle,
and distal quadriceps characteristics were the strongest predictors of MVIT, apart from vastus
lateralis FL, where proximal and mid-regions were greater. Researchers can utilize our findings
to streamline evaluations of knee extensor performance and anatomy.

142
Section 4 – Short-term effects and biomechanical profiling of
eccentric quasi-isometric resistance-exercise

Chapter 9
143
Chapter 9 – Short-term neuromuscular, morphological, and
architectural responses to eccentric quasi-isometric muscle
actions
Reference
Oranchuk DJ, Nelson AR, Storey AG, Diewald SN, and Cronin JB. Short-term neuromuscular,
morphological, and architectural responses to eccentric quasi-isometric muscle actions. Eur J
Appl Physiol 121: 141-158, 2021.
Author contribution
Oranchuk DJ, 80%; Nelson AR, 6%; Storey AG, 4%; Diewald SN, 5%; Cronin JB, 5%.
Prelude
The literature reviews and methodological based chapters aimed to accumulate data and
understand the effects of eccentric quasi-isometric adjacent exercise and training. However, to
this point, there are no studies directly examining the physiological effects, or alterations in
performance due to eccentric quasi-isometric loading. Therefore, the present chapter represents
a culmination of the knowledge acquired throughout the previous sections of the thesis to
robustly compare the short-term physiological effects of the novel isotonically loaded EQI
contraction with the commonly employed isokinetic eccentric contraction.

Chapter 9
144
Introduction
Novel volumes, intensities, and modes of exercise lead to muscle damage, characterized
by acute reductions in neuromuscular output, delayed onset muscle soreness (DOMS),
muscular swelling, and altered muscular mechanical properties (112, 275, 276, 280, 393). In
addition to higher than normal volumes and intensities, fatigue, DOMS, and edema are highly
dependent on contraction type as eccentric contractions have greater neurological and energy
efficiency (93), and induce higher levels of muscle damage when compared to concentric or
isometric muscle actions (69, 90, 275). The differential adaptations between eccentric and
isometric and concentric contractions are probably due, at least in part, to the greater absolute
and cumulative mechanical loading (i.e., force) that can be imparted on the musculotendinous
unit (90). The excessive and unaccustomed loading induces a disruption in muscle cell
membranes and individual sarcomeres (111) that may contribute to reduced neuromuscular
outputs (90). For example, Peñailillo et al. (276) reported significantly greater reductions in
peak force and rate of force development following eccentric vs concentric cycling. Similarly,
ultrasound derived muscle thickness (MT) and echo intensity (EI) increased dramatically
following eccentric exercise (62, 68, 69), and several studies have reported acute and chronic
shifts in the torque-angle and length-tension relationships following eccentric loading (280,
322, 393).
In addition to large acute shifts in morphology, architecture, and neuromuscular
function, eccentric resistance training is a time and energy-efficient means of triggering
substantial chronic adaptations (90). For example, when compared to concentric contractions,
maximal and submaximal eccentric resistance training may result in earlier recruitment of high
threshold motor units (90, 93, 246) and increase fascicle length (FL) (111); theoretically
underpinning greater maximal force expression and shifting the length-tension and torque-
angle relationships to longer muscle lengths. However, while contraction mode appears to be
an important factor in the aforementioned adaptations (111), a proposed mechanism whereby
eccentric training induces greater neuromuscular adaptation is by allowing greater mechanical
loading per contraction (90, 93). Thus, practitioners regularly search for practical and context-
specific means to impart mechanical loading.
Isometric contractions can be performed at a variety of intensities and angles within a
range of motion (ROM) and can be maintained for long periods (268). Thus, isometric

Chapter 9
145
resistance training is a safe, time-efficient, and effective means of imparting mechanical
loading (268). However, adaptations from isometric training have a questionable transfer to
dynamic tasks (268). Likewise, there are clear differences in neural control between traditional
“pushing” (imparting force against an immovable object) and “holding” (resisting an external
load) isometrics, also known as “yielding” or “quasi” isometrics (157, 299, 305, 333). For
example, Schaefer et al. (305) examined pushing and holding isometric actions at 80% of
maximal voluntary isometric torque (MVIT) and found that subjects could substantially
increase their duration at the target force when pushing (41 ± 24 s vs 19 ± 8 s). Additionally,
agonist activation at failure is greater when pushing (299), while co-activation of antagonist
and synergist muscles is greater when holding (299, 305). However, holding isometrics are
unlikely to trigger substantial morphological adaptations as the contractions are terminated at
task-failure (157, 299, 305, 333). A contraction that involves both a holding isometric and
eccentric type muscle activity has been termed eccentric quasi-isometric (EQI) (262, 378).
To perform an EQI contraction, an individual initiates a holding isometric muscle action
and attempts to maintain the joint position for as long as possible, or for a prescribed duration,
before voluntarily or non-voluntarily moving to another joint-angle or cessation of effort (262,
378). When holding a position as long as possible, fatigue accumulates whereby the isometric
action transitions to an eccentric; this is then resisted as much as possible throughout the
specified ROM (262). The extended time-under-tension, combined with slow velocities (65)
and few total contractions theoretically allows for large quantities of muscular loading with
reduced joint stress and DOMS (262, 378). While exercise variations, such as isometric (268),
dynamic, eccentric, and concentric only training (65, 111, 275) at different velocities (65) and
ROM (363) have been studied, the authors are unaware of any research examining EQI
contractions. Therefore, we aimed to be the first to objectively determine EQI kinetics and
compare the acute effects of a single bout of EQI and eccentric resistance exercise on DOMS,
muscle morphology, and architecture and neuromuscular performance.
Methods
Experimental design
A within-participant, parallel conditions with repeated measures design was
implemented to compare the acute effects and recovery from eccentric and EQI contractions
on DOMS, muscle morphology, architecture, and neuromuscular performance. One week

Chapter 9
146
following a familiarization session, eccentric (ECC) and EQI conditions were unilaterally
allocated to the right or left limb in a randomized and counterbalanced manner. Regional
(proximal, middle, distal) quadriceps DOMS, muscle architecture, EI, and isokinetic torque-
angle and multi-angle MVIT-time characteristics were evaluated via pressure-pain threshold,
ultrasonography, and concentric and isometric dynamometry, respectively. All dependent
variables were evaluated at seven time points; familiarization, immediately pre- and post-
exercise (PRE and POST, respectively), and 24 h, 48 h, 72 h, and 7 d after exercise).
Participants
G*Power (v 3.1.9.4) was utilized to determine a priori sample size using a difference
between two independent means statistical test with two tails. As such a minimum sample size
of 13 limbs per condition was calculated to detect an effect size of 1.15, where α = 0.05 and 1-
β = 0.80 based on the between-condition, PRE to POST decrements in MVIT published by
Alemany et al. (10) and Doguet et al. (88). As we expected smaller between-condition changes,
a total of 15 healthy, resistance-trained, males (26.4 ± 5.2 years, 179 ± 7.8 cm, and 81.5 ± 12.1
kg) were recruited, for this study. All participants had at least six months of resistance training
experience (5.21 ± 4.1, range = 2-12 years) performing at least two weekly sessions of lower-
body resistance training (2.48 ± 0.68 sessions·week-1; range = 2-4 sessions.week-1) and were
free of any musculoskeletal injuries for at least three months before data collection. The
Auckland University of Technology Research Ethics Committee approved the study (18/232),
and all participants provided informed consent. All participants were instructed to refrain from
strenuous physical activity, anti-inflammatory medication, recovery supplements, and
practices such as foam rolling or heat or cold application throughout the single week study
period. Additionally, alcohol, caffeine, and other ergogenic aids were forbidden in the 48 hours
leading up to each session.
Testing procedures
All testing procedures were performed at each time point apart from the pressure-pain
threshold, which was not evaluated POST. Testing was always performed in the same order
(pressure-pain threshold, ultrasonography, and concentric and isometric dynamometry). The
study and individual session timelines are summarized in Figure 19.

Chapter 9
147
Figure 19. (A) Study timeline. (B) Evaluation session timeline. (C) Exercise session timeline.
Pressure-pain threshold
Upon arrival, participants were positioned supine on a massage table, with a foot strap
used to prevent excessive leg external rotation (221). Each thigh was measured and marked by
a certified ISAK level-2 anthropometrist. The length of the lateral aspect of the thigh was
determined by measuring the distance from the superior border of the greater trochanter to the
inferior border of the lateral condyle of the femur. The anterior aspect of the thigh was
determined by measuring the distance between the superior border of the patella and the
inferior border of the anterior, superior iliac spine. Thigh lengths were recorded, and markings
were made at 30% (proximal), 50% (mid), and 70% (distal) of the lateral and anterior distances,
respectively (221). A semi-permanent marker was used for markings, which participants were
instructed to reapply each day. The sites were rechecked at each visit. The pressure-pain
threshold was determined by an analog pressure algometer (FB5K, Imada CO, LTD, Japan),
with a custom made 1.25 cm diameter head. The order of testing was always the same (i.e.,
right lateral, proximal, middle, distal; right anterior, proximal, middle, distal; left lateral,
proximal, middle, distal; left anterior, proximal, middle, distal). The head of the algometer was
gradually applied to each location until the participant verbally indicated when a sensation of
pressure shifted into the slightest onset of pain, explained as a one on a ten-point visual analog

Chapter 9
148
scale (113). Each site was tested four times, separated by 10 seconds, before moving to the next
site. Each of the four algometer applications was averaged. The intersession coefficient of
variation (CV) of the proximal, middle, and distal vastus lateralis were 13.1%, 9.2%, and 8.5%,
respectively; and proximal, middle, and distal rectus femoris were 10.2%, 9.1%, and 9.8%,
respectively.
Ultrasonography
In-vivo regional MT and EI of the vastus lateralis, rectus femoris, and anterior and
lateral vastus intermedius, and pennation angle (PA) of the vastus lateralis were determined via
2-dimensional B-mode snapshots using an ultrasound transducer (45 mm linear array, 12 MHz;
GE Healthcare, Vivid S5, Chicago, IL). Regional FL was measured by the extended field-of-
view function as detailed extensively elsewhere (110, 252). In brief, the ultrasound probe is
moved across a muscle, while a texture mapping algorithm merges the sequence of images into
a composite image. The same experienced sonographer performed all assessments. A water-
soluble gel was applied to the scanning head of the ultrasound probe to achieve acoustic
coupling, with care taken to avoid the deformation of muscle architecture. For all
ultrasonographic assessments, the probe was oriented perpendicular to the skin and parallel to
the estimated fascicle direction with care to avoid transducer tilt. The transducer was always
positioned in the longitudinal plane to reduce the time required to collect ultrasound images,
and as EI collected in the longitudinal and sagittal planes are highly correlated (376).
Brightness, depth, gain, and dynamic range was recorded and simulated for each participant
through all collections (62). On each occasion, two samples were captured and averaged to
give a mean MT, PA, FL, and EI.
Concentric dynamometry
Following the ultrasonographic assessment, participants warmed up by cycling at low
to moderate resistance using a self-selected pace for five minutes. Participants were seated
upright on the isokinetic dynamometer (CSMi; Lumex, Ronkonkoma, NY, USA) at a hip angle
of 85º, with shoulder, waist, and thigh straps to reduce body movement during contractions.
The shin-pad was positioned ~5 cm superior to the medial ankle joint malleoli. Participants
were required to hold handles at the sides of the chair, while the non-working limb was
positioned behind a restraining pad. Knee alignment was determined by visual inspection,
participant feedback, and unloaded knee extensions to ensure proper joint tracking.
Dynamometer settings were recorded and matched for subsequent sessions.

Chapter 9
149
Once fitted to the dynamometer, participants underwent a series of extensions and
flexions of the knee to determine safety stop positions and calibrate gravity correction.
Participants then completed a standardized warmup of concentric contractions of 30%, 50%,
70%, 85%, and 100% of perceived maximal voluntary contraction (265). One minute after the
completion of the warmup contractions, participants completed five maximal concentric knee
extensions in immediate succession at 60º·s-1 (265). Each contraction was initiated and
terminated at 105° and 5° of knee-flexion (0º = full extension), respectively. Participants were
given strong verbal encouragement along with visual feedback of the torque-time tracing
during each maximal contraction.
Isometric dynamometry
Two minutes after the completion of the isokinetic assessment, the participants' knee
was positioned at 40º of flexion, where one familiarization isometric knee extension at 50% of
MVIT was performed (269). Following another 60 seconds of rest, two maximal isometric
contractions lasting four seconds were completed with 30 seconds separating each contraction
(269). Participants were instructed to contract “as fast and hard as possible,” following a
countdown of “3-2-1-go!” with strong verbal encouragement and visual feedback of the torque-
time tracing during each trial (215). Participants were also instructed to avoid any pre-tension
and countermovement of the knee extensors while the live torque-time trace was carefully
inspected by the examiner leading up to each contraction. The cut-off for pre-tension was set
at 10 Nm (269). Any contractions with a clear countermovement or an unsteady baseline were
rejected and repeated (215). The participants then completed the same series at 70º and 100º of
knee-flexion. The isometric contractions were always performed in series from short to long
muscle length to avoid greater muscle damage and fatigue reported with contractions at long
muscle length (250). Following the final isometric contraction, the isokinetic and isometric
assessments were repeated on the opposite limb. Limb order was randomized throughout the
three testing sessions and counterbalanced over the participant group. All isokinetic and
isometric contractions were collected, without filtering, via a custom-made software
(LabVIEW; National Instruments, New Zealand) sampling at 2000 Hz (215).
Exercise procedures
Both the ECC and EQI exercise protocols were performed on the same dynamometer
as the evaluations. Five minutes after the isometric evaluations, participants began with either

Chapter 9
150
the ECC or EQI bout. Eccentric and EQI bouts were allocated to the participants' limbs in a
randomized and counterbalanced manner. The exercise order was also randomized and
counterbalanced. Five minutes after each exercise protocol was completed, the same limb
performed the isokinetic and isometric evaluations. Ten minutes after the POST evaluation on
the first limb, the second exercise protocol was initiated on the opposite limb. The POST
ultrasonographic evaluation of each respective limb was performed 30 minutes after the
completion of the isometric evaluation.
Eccentric contractions
Eccentric contractions were initiated and terminated at 30º and 110º of knee-flexion,
respectively. Pilot testing established that approximately 20 maximal eccentric contractions
were required to impulse-match a single EQI contraction. Thus, participants performed four
sets of 20 maximal ECC contractions, with 180 seconds of rest between sets, when allocated
before the EQI bout. When allocated after the EQI bout, ECC contractions were prescribed in
sets of 20 contractions and continued with 180 seconds of rest between sets until the same total
angular impulse (integral of knee extension torque over time; Nm.s) was matched to the EQI
bout (322). The angular impulse was calculated in real-time by a custom-made software
(LabVIEW; National Instruments, New Zealand) sampling at 500 Hz. The dynamometer was
set at 60º.s-1, and each contraction was initiated when the participant achieved 30% of their
MVIT at 40º from the PRE evaluation (322). Therefore, each contraction was started with
proper pre-activation and muscle force (322). After each ECC contraction, the participant
performed an unloaded concentric contraction to return to the 30º starting position. Participants
performed five ECC contractions on each limb during the familiarization.
Eccentric quasi-isometric contractions
Eccentric quasi-isometric contractions were initiated and terminated at 30º and 110º of
knee-flexion, respectively. Based on pilot testing, participants performed four EQI contractions
when allocated before the ECC bout. When allocated after the ECC bout, EQI contractions
were repeated until the same total angular impulse was matched to the ECC bout. The
dynamometer was set to isotonic mode, and a load equivalent to 70% of each participants’
highest MVIT at PRE, regardless of joint angle, was applied based on pilot testing and
previously recommended (262). The isotonic load was gradually applied over two seconds.
The participants were instructed not to exert enough effort as to cause a concentric contraction,
but instead attempt to “brace” and “maintain joint position throughout the ROM” (262). Once

Chapter 9
151
the load was reached, the participant held the initial position until isometric failure, at which
point slow and brief changes in joint angle occurred with the participant maintaining maximal
effort throughout each contraction. While highly variable, many participants had several
periods of near-zero changes in knee flexion, followed by periods of joint angle changes until
the entire ROM was completed. After each EQI contraction, the participant rested for 180
seconds before performing an unloaded concentric contraction to return to the 30º starting
position and initiate the subsequent contraction. Participants performed a single EQI
contraction on each limb during the familiarization session.
Data processing and analysis
Ultrasonography
Images were stored and analyzed via digitizing software (ImageJ; National Institutes of
Health, USA). Muscle thickness (cm) was defined as the perpendicular distance between the
deep and superficial aponeurosis, and PA was defined as the angle of the fascicles relative to
the deep aponeurosis (110, 263). Due to the depth of the muscle, the fascicles on the lateral and
anterior vastus intermedius were not consistently visible (263). Therefore, PA and FL were not
recorded for the lateral and anterior vastus intermedius. Additionally, PA and FL were not
recorded for the rectus femoris due to large test-retest variability (263). Extended field-of-view
FL was determined by meaning two fascicles from the most proximal, middle, and most distal
portion of each scan. A typical PRE-POST extended field-of-view scan of the vastus lateralis
is provided in Figure 20. For EI, the region of interest was defined as the perpendicular distance
between the deep and superficial aponeurosis of each muscle and extended to each end of the
B-mode image (62, 375). The polygon function was utilized, and great care was taken to ensure
the broadest possible region of interest, without the inclusion of aponeurosis or bone (62, 375).
The caliper function was utilized to assess the subcutaneous fat thickness of each image.
Subcutaneous fat thickness was determined from the average of the proximal, middle, and
distal values of each image (267). All images were inspected and analyzed by the sonographer.
Corrected EI was calculated as uncorrected EI + (subcutaneous fat thickness [cm] × 40.5278)
(395).

Chapter 9
152
Figure 20. Representative extended field-of-view ultrasound evaluation of regional vastus
lateralis fascicle length PRE and POST eccentric quasi-isometric condition. The dotted marker
at the center of the images represents 1 cm.
We previously determined the intersession variability of ultrasound-derived measures
in a similar population of resistance-trained men over three weeks in Chapters 4 and 5 (263,
267). For MT, the intersession CV of the respective proximal, middle, and distal regions of
each muscle were: vastus lateralis = 3.1-3.4%, 2.4-3.0%, 3.8%; lateral vastus intermedius =
7.7-9.3%, 4.2-4.3%, 3.5-3.9%; rectus femoris = 2.7%, 2.7-3.2%, 3.7-4.1%; and anterior vastus
lateralis = 2.8-3.0%, 5.0-5.7%, 3.1-3.4%. For vastus lateralis PA: 7.1-8.0%, 7.6-8.8%, and 6.0-
6.9%, respectively. For vastus lateralis FL: 4.1-4.8%, 4.1-4.9%, and 4.7-6.6%, respectively.
For corrected EI: vastus lateralis = 5.9-8.2%, 7.7-8.2%, 6.2-6.8%; lateral vastus intermedius =
8.0-8.9%, 9.6-11.9%, 11.3-14.7%; rectus femoris = 7.4-9.1%, 4.5-6.6%, 7.5-8.3%; and anterior
vastus lateralis = 7.1-8.9%, 8.8-10.1%, 6.9-11.3%.
Concentric dynamometry
Data were analyzed via a customized MATLAB (MathWorks, Natick, MA) script. All
torque data were divided by the length of the lever arm, in meters, to normalize the difference
in shank length between participants (265). Each isokinetic contraction was analyzed by
detecting and identifying the maximum (105°) and minimum (5°) angle that signified the start
and end of each contraction. Peak concentric torque was detected as the highest instantaneous
torque during the isovelocity phase between 105° and 5° of knee-flexion. The angular impulse
was calculated as the area under the torque-time curve between each of the eight angles. Thus,
total angular impulse throughout the entire ROM and between nine bands (100-90º, 90-80°,

Chapter 9
153
80-70°, 70-60°, 60-50°, 50-40°, 40-30°, 30-20°, 20-10º) were calculated (265). Data from
Chapter 6 had previously determined intersession (one week apart) variability of the
aforementioned concentric evaluation following a familiarization session (265). Briefly,
intersession CV of concentric peak torque and total concentric impulse was 6.3-7.4%, and 6.4-
8.1%, respectively. The intersession CV of the nine aforementioned impulse bands were: 11%,
7.5%, 7.8%, 8.1%, 9%, 9.1%, 12.8%, 11.3%, and 12%, respectively.
Isometric dynamometry
Data were analyzed via a customized MATLAB (MathWorks, Natick, MA) script.
Isometric torques over 200 Nm were identified to signify a full contraction and eliminate false
contractions (269). A peak detection algorithm was implemented to detect and identify the
instantaneous MVIT of each contraction (269). The onset of effort was determined via visual
inspection and a manual section of each torque-time curve (215, 269). The same researcher
determined the onset of effort by visually detecting the last trough before torque deflected
above the range of the baseline noise (215, 269). Rate of torque development was calculated
for 0-200 ms (RTD0-200), based on the manual onset of effort detection (215, 269, 276). We had
previously determined intersession (one week apart) variability of the isometric evaluation
following familiarization (269). Chapter 7 determined the intersession CV of MVIT at 40º, 70º
and 100º were 9.6%, 11.5%, and 8.5%, respectively. While intersession CV of RTD0-200 at 40º,
70º, and 100º were 15.6%, 14.9%, and 13%.
Eccentric contractions
Data were analyzed via a customized MATLAB (MathWorks, Natick, MA) script. Peak
and mean eccentric torque, and total and angle specific angular impulse throughout each
contraction and set were quantified. Changes in torque and impulse outputs throughout the
ECC protocol were also quantified.
Eccentric quasi-isometric contractions
Data were analyzed via a customized MATLAB (MathWorks, Natick, MA) script. The
EQI contractions were quantified by calculating the mean velocity throughout the ROM and in
the ROM brackets of 30-40º, 40-50º, 50-60º, 60-70º, 70-80º, 80-90º, 90-100º and 100-110º.

Chapter 9
154
Statistical analysis
Raw data are presented as mean and standard deviation. For comparisons, reference
Bayesian inference with a uniform dispersed prior (magnitude-based decisions, MBD) was
utilized (272). Between‐condition changes were analyzed using a pre‐post parallel-group trial
spreadsheet (272). All variables were log-transformed for analysis, then back-transformed to
express effects as factors, after adjustment for the modifying effects of the total impulse of each
exercise condition. Change scores of the ECC and EQI conditions were compared at POST, 24
h, 48 h, 72 h, and 7 d post-exercise for all dependent variables. Uncertainty in the effects was
expressed as 95% compatibility intervals (95%CI). Non-clinical MBD was used since neither
ECC nor EQI contractions can be regarded as best-practice training. Magnitudes of the changes
were assessed using standardized changes (Cohen’s d effect size (ES)) of 0-0.20, 0.20-0.60,
0.60-1.20, 1.20-2.0 and 2.0-4.0 for small, moderate, large, very large and extremely large,
respectively (152). Effects with 95%CIs overlapping both a substantial increase and decrease
were deemed unclear; for clear effects, the likelihood that the true effect was substantial and/or
trivial was indicated with the following scale: 25-75%, possibly (*); 75-95%, likely (**); 95-
99.5%, very likely (***); > 99.5%, most likely (****) (152). Apart from group comparison at
baseline, only between-condition differences where the 95%CI for the change score does not
cross zero are reported in-text, due to the many dependent variables and time points. Between-
condition % and ES differences with 95%CIs and the smallest important difference are
presented in appendices.
Results
Thirteen participants completed all sessions, while two participants could not attend
testing at the 72-h time point. Therefore, changes at 72 h included only individuals that were
present at all time points.
Exercise sessions
Nearly identical (ES = 0.02) total impulses were observed for the ECC (32887 ± 16987
Nm·s) and EQI (33229 ± 17358 Nm·s) protocols, despite large inter-participant variability
(Figure 21).

Chapter 9
155
Figure 21. Individual participant total angular impulse for each exercise condition, and the
impulse difference between conditions.
Eccentric protocol
Each participant completed 100.8 ± 54 eccentric contractions across 4.8 ± 2.5 (range =
2-10) sets. The mean set duration was 57 ± 7.5 seconds. Including the 180 second intra-set rest
periods, the ECC protocol lasted 17.6 ± 8.3 (range = 5.2-31.3) minutes. Mean peak torque
through all contractions were 215 ± 54 Nm. The total time-under-tension was 135 ± 72 s. Mean
total angular impulse distribution across the ROM brackets is shown in Figure 22.

Chapter 9
156
Figure 22. Mean percentage of total angular impulse through eight range of motion brackets
during the eccentric (ECC) and eccentric quasi-isometric (EQI) bouts. Error bars denote the
standard deviation.
Eccentric quasi-isometric protocol
Participants completed 3.85 ± 1.1 (range = 1-8) EQI contractions, isotonically loaded
to 172 ± 41.5 Nm, with an average angular velocity of 1.29º·s-1. Mean contraction duration was
62.1 ± 38 seconds with the longest and shortest contraction durations of 140 (the respective
participants' first contraction) and 5.5 seconds (the respective participants' eighth contraction),
respectively. Including 180-second intra-set rest periods, the EQI protocol lasted 13 ± 9.5
(range = 3.5-28.2) minutes. EQI mean duration across ROM brackets were: 30-40º: 8.9 ± 10.8
s; 40-50º: 14.6 ± 11.9 s; 50-60º: 11.1 ± 8.3 s; 60-70º: 9.3 ± 7.1 s; 70-80º: 7.0 ± 5.5 s; 80-90º:
5.6 ± 4.5 s; 90-100º: 3.5 ± 2.8 s; and 100-110º: 2 ± 2.4 s. The total time-under-tension was 242
± 132 s. Mean total angular impulse distribution across the ROM brackets is shown in Figure
22.
Acute effects and recovery
Pressure-pain threshold
Six of 15 participants reported no pain at baseline with the maximum possible pressure.
Therefore, these six individuals were not included in the statistical analysis for pressure-pain
threshold as no baseline values were present Between-condition differences in pressure-pain
threshold with 95%CIs are presented in Appendix 9. Except for the middle rectus femoris,
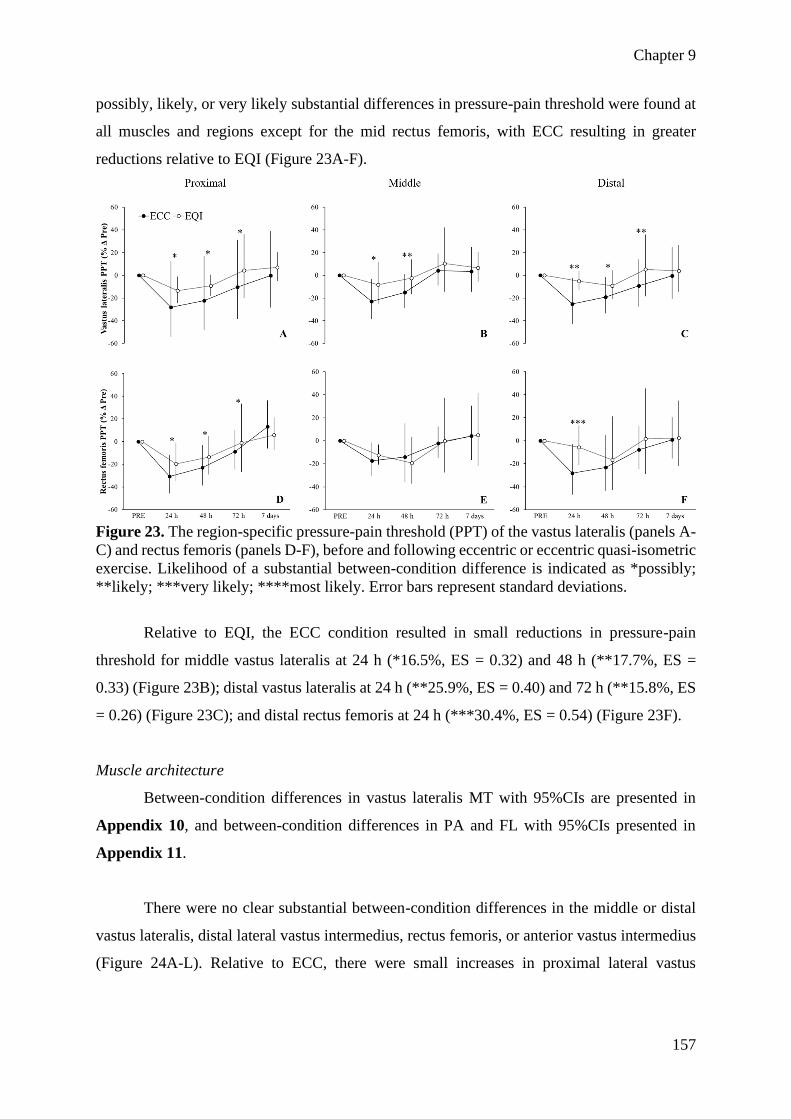
Chapter 9
157
possibly, likely, or very likely substantial differences in pressure-pain threshold were found at
all muscles and regions except for the mid rectus femoris, with ECC resulting in greater
reductions relative to EQI (Figure 23A-F).
Figure 23. The region-specific pressure-pain threshold (PPT) of the vastus lateralis (panels A-
C) and rectus femoris (panels D-F), before and following eccentric or eccentric quasi-isometric
exercise. Likelihood of a substantial between-condition difference is indicated as *possibly;
**likely; ***very likely; ****most likely. Error bars represent standard deviations.
Relative to EQI, the ECC condition resulted in small reductions in pressure-pain
threshold for middle vastus lateralis at 24 h (*16.5%, ES = 0.32) and 48 h (**17.7%, ES =
0.33) (Figure 23B); distal vastus lateralis at 24 h (**25.9%, ES = 0.40) and 72 h (**15.8%, ES
= 0.26) (Figure 23C); and distal rectus femoris at 24 h (***30.4%, ES = 0.54) (Figure 23F).
Muscle architecture
Between-condition differences in vastus lateralis MT with 95%CIs are presented in
Appendix 10, and between-condition differences in PA and FL with 95%CIs presented in
Appendix 11.
There were no clear substantial between-condition differences in the middle or distal
vastus lateralis, distal lateral vastus intermedius, rectus femoris, or anterior vastus intermedius
(Figure 24A-L). Relative to ECC, there were small increases in proximal lateral vastus

Chapter 9
158
intermedius MT with EQI at POST (**6.8%, ES = 0.28), 48 h (**7.1%; ES = 0.29), and 72 h
(*5.1%, ES = 0.22) (Figure 24D).
Figure 24. Region-specific muscle thickness (MT) of the vastus lateralis (panels A-C), lateral
vastus intermedius (panels D-F), rectus femoris (panels G-I), and anterior vastus intermedius
(panels J-L), before and following eccentric or eccentric quasi-isometric exercise. Likelihood
of a substantial between-condition difference is indicated as *possibly; **likely; ***very
likely; ****most likely. Error bars represent standard deviations.

Chapter 9
159
Relative to ECC, there was a small decrease in distal vastus lateralis PA with EQI at
POST (**8.7%, ES = 0.49). Relative to ECC, there were small to moderate decreases in
proximal vastus lateralis fascicle length at POST (**6.2%, ES = 0.49) and 24 h (***8.3%, ES
= 0.66), respectively. Conversely, EQI led to an increase in proximal rectus femoris FL at
POST (***11%, ES = 0.64) and 24 h (**6%, ES = 0.36).
Echo intensity
Between-condition differences in EI with 95%CIs are presented in Appendix 12. There
were possible to very likely greater EI increases following ECC versus EQI in 3/12 regions
with a very likely increase in distal rectus femoris EI with ECC at POST (***8.3%, ES = 0.55).
Concentric performance
Between-condition differences in peak concentric torque, total angular impulse, and
angle-specific torque with 95%CIs are presented in Appendix 13.
Relative to EQI, the ECC condition resulted in small to moderate reductions at POST
in: peak torque (**8.7%, ES = 0.50) (Figure 25A); total angular impulse (**8.3%, ES = 0.45)
(Figure 25B); and impulse 100-90º (***19.7%, ES = 0.57) (Figure 26C), 90-80º (***15.6%,
ES = 0.60) (Figure 26D), 80-70º (**11.7%, ES = 0.56) (Figure 26E), 70-60º (**10.7%, ES =
0.58) (Figure 26F); and 60-50º (**10.5%, ES = 0.62) (Figure 26G).
Figure 25. Concentric peak torque (panel A) and total concentric impulse (panel B) before and
following eccentric or eccentric quasi-isometric exercise. Likelihood of a substantial between-
condition difference is indicated as *possibly; **likely; ***very likely; ****most likely. Error
bars represent standard deviations.

Chapter 9
160
Figure 26. Concentric angle-specific impulse before and following eccentric or eccentric
quasi-isometric exercise. Likelihood of a substantial between-condition difference is indicated
as *possibly; **likely; ***very likely; ****most likely. Error bars represent standard
deviations. Panels A, B, C, D, E, F, G, H and I, represent changes in concentric angular impulse
from 100-90º, 90-80º, 80-70º, 70-60º, 60-50º, 50-40º, 40-30º, 30-20º, and 20-10º, respectively.
Isometric performance
Between-condition differences in MVIT and RTD0-200 with 95%CIs are presented in
Appendix 14.
Relative to EQI, the ECC condition resulted in small reductions in MVIT at 70º
(**10.4%, ES = 0.35) (Figure 27B) and 100º (**9.8%, ES = 0.39) (Figure 27C) at POST.
Eccentric also resulted in small to moderate reductions in RTD0-200 at 70º at POST (****32.3%,
ES = 0.70) (Figure 27E); and 100º at POST (**15.3%, ES = 0.42) (Figure 27F), relative to
EQI.

Chapter 9
161
Figure 27. Joint-angle specific maximal voluntary isometric torque (MVIT) (panels A-C) and
rate of torque development (RTD 0-200) (panels D-F), before and following eccentric or
eccentric quasi-isometric exercise. Likelihood of a substantial between-condition difference is
indicated as *possibly; **likely; ***very likely; ****most likely. Error bars represent standard
deviations.
Discussion
The purposes of this investigation were to determine the kinetic characteristics of EQI
contractions, and if bouts of EQI and ECC exercise, equated by angular impulse, resulted in
different acute changes in pain, muscle architecture and morphology, and neuromuscular
performance. The main findings were: 1) the majority (56%) of the EQI contraction time and
impulse took place between 30-60º, as compared to the identical time spent at each ROM
bracket with the isokinetic eccentric condition; 2) DOMS and EI were substantially greater
with the ECC condition, especially at the distal region of the rectus femoris; 3) muscle swelling
and architectural shifts were variable depending on the assessed muscle and region; and, 4)
while concentric and isometric torque and RTD decreased similarly at shorter muscle lengths,
decreases in voluntary outputs at long muscle lengths were greater following ECC.
Exercise conditions
Despite matched total angular impulse, EQIs distribute impulse quite differently to
widely utilized isokinetic ECC contractions. While previous studies have compared the acute
effects of isotonic and isokinetic contractions, to our knowledge, all previous investigations
utilized isotonic loads that were more than 100% of maximal voluntary contraction (10, 88,

Chapter 9
162
307). As such, the extremely low-velocity (1.29º·s-1), submaximal (70% MVIT) EQI condition
has a unique impulse distribution (Figure 22) making a direct comparison to other research
difficult. Alemany et al. (10) and Doguet and colleagues (88) compared isokinetic and isotonic
contractions loaded to 110% of MVIT and 150% of concentric maximum, respectively. While
Alemany et al. (10) reported greater changes in markers of muscle damage (DOMS, MVIT,
creatine kinase) following the isotonic condition, Doguet et al. (88) found no between-
condition difference in DOMS, force output, creatine kinase, or invoked H-reflex and M-wave
characteristics. These dichotomous findings demonstrate that acute neuromuscular and damage
marker responses to different contraction modes are not simple to predict despite the efforts of
researchers to equate repetitions and velocity.
Eccentric resistance training is often employed as a time-efficient means of exposing
the neuromuscular system to high quantities of mechanical loading, leading to substantial
morphological, architectural, and neuromuscular adaptations in healthy and well-trained
populations (90). Relative to ECC, the EQI condition was slightly shorter in duration (13 ± 9.5
and 17.6 ± 8.3 minutes) with lower peak torques, demonstrating its practicality of imparting
total impulse in a relatively brief period. Time-under-tension was equal through the ROM in
the ECC condition with the majority of the angular impulse being expressed at moderate
muscle lengths, whereas the majority of time-under-tension, and thus angular impulse (and
likely fatigue accumulation), was at short to moderate muscle lengths with the EQIs; with these
between-condition differences likely effecting regional morphology (90, 322) and angle
specific neuromuscular performance (322, 363, 365) at these lengths. It may also be speculated
that differences in velocity, impulse distribution, and possible load sharing by the series and
parallel elastic components (125), could lead to dichotomous long-term adaptations in muscle
morphology, musculotendinous stiffness, and fascial structure (158, 171). Additionally,
fascicle mechanics/dynamics of the EQI contraction were not determined. As such it is
impossible to know if true eccentric lengthening was occurring, or if there were brief periods
of little tension interspersed with isometric contractions.
Muscle soreness
The EQI condition was associated with lesser DOMS in the 48 h post-exercise,
compared to the ECC condition, evidenced by small reductions in the PPT of some quadriceps
muscles with EQI at 24 hr (distal rectus femoris and vastus lateralis, middle vastus lateralis),
and 72 hr (middle and distal vastus lateralis) of ~15-30% (Figure 23A-F). The aforementioned

Chapter 9
163
findings are not surprising given the literature on eccentric contraction velocity and muscle
soreness and damage markers (65). Chapman et al. (65) examined the elbow flexors and found
that high velocity (120°·s-1) ECC led to greater muscle soreness and creatine kinase
concentrations for up to 96 hours when compared to a slow (30°·s-1) ECC protocol. In the
present study, mean velocities throughout the ROM were 60°·s-1 and 1.29°·s-1 for ECC and EQI
groups, respectively. While speculative, the lesser DOMS associated with the EQI condition
could suggest that EQIs are predominantly isometric with brief periods of low tension causing
small changes in joint angle, opposed to any true eccentric muscle action (90, 206). Finally,
while differences in DOMS were consistent, between-condition differences were often smaller
than the intra-session CV, placing a degree of uncertainty on our results.
Interestingly, there were no apparent between-condition differences in the pressure-
pain threshold at the proximal vastus lateralis or the middle rectus femoris (though only nine
participants were included, limiting the ability to determine clear results). This suggests that
muscle damage may be most prevalent in the distal region of the quadriceps muscles, regardless
of contraction mode. Contrary to our findings, Baker, Kelly, and Eston (29) found that DOMS
was greatest towards the myotendinous junction (proximal and distal) of the quadriceps.
However, it must be noted that they utilized a down-hill running protocol to induce soreness,
suggesting that compound movements, with a stretch-shortening cycle, may lead to different
patterns of DOMS when compared to single-joint isolation movements. Taken together with
the findings of Baker et al. (29), it appears that multiple regions should be assessed when
determining the effects of an intervention on DOMS.
Muscle morphology and architecture
Changes in MT, PA, and FL are difficult to decipher due to differential findings
between the regions assessed. Firstly, while most between-condition differences in MT
(swelling) were minimal, the EQI condition resulted in substantially greater increases at POST,
24 h and 48 h at the proximal (4.8-7.1%, ES = 0.20-0.29) and at POST and 48 h at the middle
(4.8-5.9%, ES = 0.21-0.26) lateral vastus intermedius (Figure 24D-E). Interestingly, the
observation is not matched in the anterior portion of the vastus intermedius (Figure 24J-L) or
the vastus lateralis or rectus femoris. It might be speculated that EQI contractions may induce
greater recruitment of the vastus intermedius muscle; however, this is unlikely as the femoral
nerve innervates all the knee extensor muscles, and several studies have demonstrated that
preferential recruitment of the quadriceps muscles is subtle at best (329). However, it should

Chapter 9
164
be noted that all studies in the aforementioned review utilized standard surface
electromyography (329), while high density (334), or needle electromyography (230) may
elucidate the possibility of preferential, or regional recruitment further. Interestingly,
researchers have recently suggested that the vastus intermedius undergoes greater mechanical
strain and damage when compared to the vastus lateralis during ECC contractions (12, 120),
likely due to fascicles directly attaching to the bone, whereas the vastus lateralis fascicles attach
to the intermuscular aponeurosis (14). While purely speculative, the greater mechanical strain
of the vastus intermedius fascicles may be exacerbated with EQI contractions. Another possible
explanation for our findings is that the vastus intermedius has a substantially different fiber
type profile than the rectus femoris or vastus lateralis, as different fiber types are preferentially
activated based on contraction velocity (71). As a related possibility, sustained EQI
contractions are likely to induce substantial blood occlusive effects (84) potentially leading to
increased activation and swelling of type 1 fibers (47). Regardless, intra-contraction fascicle
tracking and needle electromyography of the vastus intermedius are required to fully elucidate
the between-condition differences.
Between-condition differences in vastus lateralis PA exist depending on the assessed
region, with the EQI condition resulting in a substantial decrease in PA at the distal vastus
lateralis, whereas the opposite was found in the mid-region. However, all differences were
trivial or small (0.1-8.7%, ES = 0.0-0.49). Contrastingly, several likely and very likely
between-condition differences were found when examining FL of the proximal vastus lateralis
at POST and 24 h (6.2-8.3%, ES = 0.49-0.66), and middle vastus lateralis at 24 h, 48 h and 72
h (4-5.6%, ES = 0.31-0.43) vastus lateralis. ECC resulted in an acute increase in proximal
vastus lateralis FL, whilst EQI increased FL in the middle portion. Alternatively, EQI led to
moderate and small FL increases at the proximal rectus femoris at POST (11%, ES = 0.64) and
24 h (6%, ES = 0.36), relative to ECC. These differences in resting FL length led us to speculate
that differing magnitudes of fascicle strain/stretch were present between the proximal and
middle regions of the vastus lateralis and that the EQI condition preferentially strains the
fascicles of the rectus femoris. However, intra-contraction fascicle tracking would be needed
to confirm this theory. Comparing our findings to previous works is difficult as most previous
investigations utilize trigonometric equations to estimate FL, and/or only measure FL at a
single region. Also, cross-sectional area or three-dimensional imaging may have allowed for
additional clarity as changes in fluid distribution or muscle shape could have contributed to the
complex alterations in regional MT, PA, and FL. As a final note, while the reported between-

Chapter 9
165
condition changes were always larger than the smallest important difference, the custom effects
for middle PA and FL were slightly smaller than previously reported intersession variabilities
(263).
The ECC condition resulted in greater increases in EI at POST at the middle (5.5%, ES
= 0.21) and distal (11.9%, ES = 0.54) rectus femoris and distal lateral vastus intermedius
(15.1%, ES = 0.26), relative to EQI. Additionally, EI increased by the largest magnitude
following the ECC condition in 10 of the 12 assessed sites (though only three were possible or
very likely substantial), in line with the findings of Chapman et al. (65). Furthermore,
researchers have determined that the distal rectus femoris is increasingly activated as the knee
angle increases (380), likely explaining the large between-condition difference in echogenicity.
Except for the anterior vastus intermedius, EI increased most noticeably in the distal region of
all muscles; which is supported by researchers citing that metabolic and hormonal markers
were acutely elevated predominantly at the distal portion with ECC exercise (112, 346).
Tabuchi et al. (346) recently examined calpains and calcium ion accumulation throughout rat
muscle fibers following ECC contractions and found substantially greater accumulation at the
distal region of single muscle fibers in-vitro. Franchi et al. (112) examined the acute and
chronic effects of ECC and concentric contractions on hormonal and metabolic markers with
morphological, architectural, and functional adaptations in the vastus lateralis in-vivo. The
researchers determined that ECC training resulted in substantially greater phosphorylation of
focal adhesion kinase at the distal region of the vastus lateralis (112), which may be a factor in
the preferential increase in FL and distal MT following ECC resistance training (111).
Interestingly, EI nearly exclusively peaked at POST and returned to or near baseline by 24 h,
whereas other researchers have reported elevated EI up to five days post-exercise (68, 287).
However, in contrast to the previous studies (68, 287), we utilized well-trained participants,
likely reducing muscle damage and metabolite accumulation.
Neuromuscular performance
Relative to EQI, the ECC condition resulted in similar or greater acute reductions in
concentric peak torque (8.7%, ES = 0.50), total impulse (8.3%, ES = 0.45) (Figure 25) and
impulse at most of the assessed joint angles (Figure 26). However, differences were largest at
the longest (100-70º) muscle lengths (11.7-19.7%, ES = 0.56-0.60), and became smaller
towards medium (70-40º) (8-10.7%, ES = 0.45-0.62) and short muscle lengths (40-10º) (4.7-
7.5%, ES = 0.25-0.32). While it is difficult to determine the underlying mechanisms, the ECC

Chapter 9
166
condition involved a considerably greater percentage of each contraction at long muscle length
when compared to EQI. The differences in the percentage of time-under-tension and angular
impulse contributing to joint-angle specific reductions in concentric torque are likely
neurological as all between-group differences were unclear or trivial past 24 h. Based on
underlying fatigue mechanisms (30), it is plausible that the ECC contraction resulted in greater
central fatigue, while both ECC and EQI contractions led to similar levels of disruption distal
to the neuromuscular junction. For similar reasons, the largest decreases in torque and RTD
were typically observed at POST following ECC, whereas reductions in performance were
often delayed to 24 h or 48 h in the EQI limb. This may be, in part, due to the within-participant
design resulting in cumulative fatigue affecting the whole human. While subsequent studies
employing techniques such as femoral nerve and transcranial magnetic stimulation would be
needed to determine exact mechanisms of fatigue, chronic ECC loading would likely result in
greater, and more uniform changes over the entire torque-angle relationship, whereas EQI
loading would result in greater improvements at shorter muscle lengths (322). It is also
important to recognize that all participants performed both conditions in the same session and
that any residual central fatigue would affect both limbs throughout the 7-d recovery period.
Similar to the concentric assessment, trivial between-condition differences in MVIT
were found at the short muscle length, whereas small reductions were observed with ECC at
medium (POST; 10.4%, ES = 0.35; and 48 h; 7.9%, ES = 0.27) and long (POST; 9.8%, ES =
0.39) muscle lengths, relative to EQI. The ECC condition also resulted in considerably larger
reductions in RTD0-200 (6.3-38.6%, ES = 0.33-1.39) at medium and long muscle lengths,
relative to EQI. Additionally, RTD0-200 remained depressed longer following the ECC
condition, aligning with the concentric performance reduction at POST with ECC, compared
to a delayed reduction at long muscle lengths following EQI. These findings are consistent with
Peñailillo et al. (276), who found RTD to be a more sensitive metric to estimate muscle damage
and track recovery than MVIT. A potential explanation for greater torque reductions at larger
joint angles may be due to the greater intramuscular pressure synonymous with stretched
muscles (114, 330). This greater pressure may have increased the sensation of DOMS, reducing
neural drive at longer muscle lengths (114, 330). Interestingly, the between-condition
differences in RTD0-200 mirror shifts in muscle architecture. Acute changes in FL following
contraction are due to an altered sarcomere resting length, which could increase or decrease
shortening velocity, and therefore alter RTD (111). In the current investigation, it is plausible
that the relative increase in FL at the proximal vastus lateralis with a relative decrease in FL at

Chapter 9
167
the middle vastus lateralis contributed to the conflicting RTD0-200 alterations at 40º, 70º, and
100º of knee flexion.
Limitations and directions for future research
Although there have been several studies and reviews of quasi-isometric and EQI
contractions (157, 262, 305, 333), this was the first to investigate the kinetic characteristics and
short-term effects of EQI resistance exercise. While we determined the short-term effects of
EQIs on regional muscle soreness, morphology and architectural, and isometric and concentric
performance through the length-tension relationships, there are several limitations and
directions for future research. Employing peripheral and central nervous system stimulation is
required to elucidate neuromuscular fatigue etiology. Similarly, more invasive methodologies
including blood analyses and muscle biopsies are required to directly evaluate the acute and
chronic hormonal and morphological alterations induced by EQI exercise. Analysis of intra-
contraction electromyography and fascicle tracking are also required to understand contraction
dynamics. There were large between-participant differences in total impulse due to wide-
spanning individual abilities to perform EQI and ECC contractions. While this discrepancy was
factored into our statistical analysis as a modifying prior effect, future studies may consider
performing all EQI contractions before a contrasting contraction. Future analyses could also
examine the amount of time and impulse accumulated isometrically and eccentrically during
EQI contractions. Additionally, while within-participant parallel designs have many benefits
(212), cross-education effects remain a valid methodological concern. Specifically, the
potential cross-over effect may have contributed to comparatively smaller between-condition
differences versus comparable study designs (10, 88, 276), suggesting that the present study
was underpowered despite a sample size larger than the aforementioned works. Inline, it should
be noted that a few ‘likely’ effects were smaller than previously determined intersession
variabilities (see Appendices 10, 11 and 13). Therefore, readers may wish to focus on the ‘very
likely’ or ‘most likely’ substantial effects. As fatigue was likely accumulated between 30-60º
in the EQI condition, perhaps restricting the conditions to longer muscle lengths, equating by
mean velocity, or comparing EQIs with impulse distribution matched traditional isometrics
would have made for more comparable conditions. Most importantly, practitioners need to
know how medium to long-term EQI training would translate to musculoskeletal health and
performance in a variety of populations; and if EQI may be superior to more traditional training
in specific contexts.

Chapter 9
168
As a brief aside, this study demonstrates the importance of assessing morphological and
architectural shifts in multiple muscles and regions and evaluating isokinetic and isometric
performance at multiple joint angles (260). We are one of the first to evaluate changes in EI in
multiple regions (221, 337), while past studies have demonstrated the importance of multi-
angle isokinetic and isometric evaluations (250, 322). Future research must determine the
potential relationship between acute shifts in the measured variables, and long-term
adaptations.
Practical applications
While suggesting applications based on a single short-term study is difficult, several
hypotheses can be made. Firstly, EQIs resulted in less severe DOMS compared to ECC
exercise, a finding that may be important for practitioners aiming to optimize client adherence
and prescribe resistance training around other activities. While it should not be assumed that
short-term responses will manifest into long term adaptations, based on the acute responses
observed in the present study, it may be hypothesised that EQI resistance training might
promote vastus intermedius hypertrophy, whereas EQI and ECC training might promote
similar architectural adaptations. It is likely that EQIs, as employed in this study, would
predominantly improve neuromuscular outputs at short to moderate muscle lengths due to most
of the impulse, and acute performance reductions occurring between 30-60º of flexion.
Alternatively, the ECC condition appears more likely to lead to improved torque and RTD
throughout the ROM. While not measured in the present study, it could be hypothesized that
the ‘holding’ EQI contraction could be useful for improving intermuscular coordination, and
result in larger cardiovascular responses (e.g., heart rate, blood pressure), due to greater agonist
and synergist muscle activation (299, 305). Ultimately, EQI contractions might be best suited
to special or injured populations, or general preparatory, unloading, or transition phases of
athletic populations due to the relatively low number of joint movements, modest torques, and
time-efficiency relative to ECC contractions. However, the application of EQI contractions
must be evaluated on a case-by-case basis due to large inter-individual variabilities in duration,
total impulse, and impulse distribution.
Conclusions
While the short-term effects of both conditions were mostly similar, ECC resulted in
relatively greater increases in DOMS, and larger reductions in concentric and isometric

Chapter 9
169
performance at medium and long muscle lengths. Eccentric quasi-isometric training may be a
viable alternative to traditional modes of resistance training in individuals suffering from, or
susceptible to musculoskeletal injury due to the relatively low peak torques and the total
number of repetitions required to achieve substantial neuromuscular overload. Further
comparisons and longitudinal interventions are required.

Chapter 10
170
Chapter 10 – Kinetic and kinematic profile of eccentric quasi-
isometric loading
Reference
Oranchuk DJ, Diewald SN, McGrath JW, Nelson AR, Storey AG, and Cronin JB. Kinetic and
kinematic profile of eccentric quasi-isometric loading. Sports Biomech Ahead of print, 2021.
Author contribution
Oranchuk DJ, 80%; Diewald SN, 8%; McGrath WJ, 4%, Nelson AR, 2%; Storey AG, 2%;
Cronin JB, 4%.
Prelude
Chapter 9 examined the short-term effects of eccentric quasi-isometric resistance
exercise and compared it to an impulse equated bout of eccentric contractions. One of the key
findings was that eccentric quasi-isometric contractions predominantly overloaded the initial
half of the range of motion; closely mirrored by acute and short-term reductions at short muscle
lengths when compared to isokinetic eccentric loading. However, while providing a robust
evaluation of short-term physiological effects, the biomechanical profile of eccentric quasi-
isometric loading of the knee extensors requires greater analysis, including between contraction
joint-angle-specific changes in angular impulse, time-under-tension, and angular velocity.
Understanding these kinetic and kinematic variables, and the between contraction performance
reductions are key to planning and interpreting future acute and short-term studies.
Additionally, greater knowledge regarding the biomechanics of eccentric quasi-isometric and
how fatigue and learning affect the profile is required to inform training prescription.

Chapter 10
171
Introduction
Examining loading variables (e.g., intensity; contraction type) (196, 268) and schemes
(e.g., failure, inter-set co-contraction) (105, 311) have become increasingly common as
researchers and practitioners look to optimize resistance-training induced adaptations. Among
the novel training modes, eccentric quasi-isometric (EQI) contractions have gained recent
interest in the scientific literature (248, 262, 264, 268, 366). As discussed in Chapter 3, one of
the reasons behind the surge in EQI interest is the proposed benefit and utility in rehabilitative
populations (due to slow contraction velocities) (45, 174, 248, 262, 366), and specificity to
sports that require long contraction durations or quasi-isometric muscle action, such as
sprinting, sailing, grappling, skiing or skating (262, 306, 333, 370).
While a modest number of studies have examined yielding/quasi-isometric contractions
(300, 305), one study has directly investigated the physiological effects of EQI exercise (264).
Oranchuk et al. (264) reported that a bout of EQI exercise resulted in less muscle soreness,
smaller increases in echo intensity (a proposed measure of muscle damage and intra and
intercellular metabolite accumulation), and smaller reductions in isometric and concentric
torque at long muscle lengths, when compared to an impulse-equated bout of eccentric
contractions (264). Both conditions, however, resulted in a similar decrease in voluntary torque
at shorter muscle lengths, likely due to joint-angle-specific fatigue (264). Whilst Oranchuk et
al. (264) presented an initial profile of the short-term physiological effects, the biomechanical
description of EQIs was simple and did not include contraction-by-contraction changes. By
comparison, the kinetic and kinematic characteristics (and inter-set changes) of traditional
eccentric and concentric contractions have been regularly examined (53, 135, 280).
Understanding these contraction dynamics, and the between-set changes is important for both
practitioners and researchers. For example, strength and conditioning, and rehabilitation
professionals need to understand the contraction characteristics, so that EQIs can be best used
to produce the desired musculotendinous adaptation. Likewise, researchers need to understand
the between-contraction changes so that EQIs can be compared with other contraction types in
longitudinal examinations. Therefore, the purpose of this study was to describe the kinetics
and kinematics associated with a bout (four maximal repetitions) of EQI contractions. Based
on the existing literature, it was hypothesized that the majority of angular impulse (integral of
knee extension torque over time; Nm·s) would be distributed in the initial half of the range of
motion (ROM).

Chapter 10
172
Methods
Experimental design
A cross-sectional design was implemented to determine the biomechanical
characteristics of EQI contractions via a single bout of four contractions. During a
familiarization session, each participant performed a single EQI knee extension on a single
randomly selected limb, to failure, following a detailed explanation and demonstration. Five to
seven days later, each participant performed four EQI contractions to failure separated by 180
seconds of rest with the same limb as used in the familiarization session. Time-normalized
angle-time characteristics, and absolute angular impulse, velocity, and time-under-tension,
were determined through the entire ROM, and through eight ROM brackets. Changes in the
variables were compared across the four contractions (C1, C2, C3, C4) during the session.
Participants
A total of 14 healthy, resistance-trained males (age: 27.9 ± 5.1 years, height: 179.4 ±
7.1 cm, mass: 80.5 ± 10.8 kg) volunteered for this study. All participants had at least six months
of resistance training experience (6.42 ± 3.96, range = 1.5-10 years) performing at least two
weekly sessions of lower-body resistance training (2.28 ± 0.82 sessions·week-1, range = 2-4
sessions·week-1) and were free of any musculoskeletal injuries for at least three months before
data collection. The ethical committee of the Auckland University of Technology (18/232) and
Victoria University (HRE19-110) approved this study, and all participants provided informed
consent. All participants were instructed to refrain from strenuous physical activity, anti-
inflammatory medication, recovery supplements, and practices such as foam rolling or heat or
cold application in the days between the familiarization and experimental session. Additionally,
alcohol, caffeine, and other ergogenic aids were forbidden in the 48 hours leading up to each
session.
Testing procedures
Warmup and load determination
All warm-up and dynamometric procedures before the EQI contraction testing were
explained in detail by Oranchuk and colleagues (264). In brief, after cycling at a low to
moderate resistance for 5 minutes, participants were positioned upright on the isokinetic
dynamometer (CSMi; Lumex, Ronkonkoma, NY, USA) at a hip angle of 85º, with shoulder,
waist, and thigh straps affixed to reduce body movement during contractions. The shin-pad was

Chapter 10
173
positioned ~5 cm superior to the medial malleoli of the ankle. Participants were required to
hold handles at the sides of the chair, while the non-working limb was positioned behind a
restraining pad. The handles were held as pilot testing found that the torso displaced upwards
(altering knee angles) when performing contractions while holding the straps or positioning the
hands across the chest. Knee alignment was determined by visual inspection, participant
feedback, and unloaded knee extensions to ensure proper joint tracking, and dynamometer
settings were recorded and matched for the subsequent session. Participants underwent a series
of extensions and flexions of the knee to determine safety stop positions and calibrate gravity
correction, followed by a standardized warmup of concentric contractions ranging from 30-
100% of maximal perceived effort from 105° and 5° of knee-flexion (260, 264). Two minutes
after the completion of the concentric contractions the participants performed two maximal
isometric contractions at 40º, 70º, and 100º of knee flexion. The dynamometer was then set to
isotonic mode, and per previous recommendations (262, 264), a load equivalent to 70% of each
participant’s highest maximal voluntary isometric contraction was used for the EQI
contractions.
Eccentric quasi-isometric contractions
Similar to Chapter 9, EQI contractions were initiated and terminated at 30º (Figure 28A)
and 100º (Figure 28B) of knee-flexion, respectively. To allow for pre-activation, and thus
improve adaptive force/torque (306), the isotonic load was gradually applied from 35% to 70%
of maximal voluntary isometric contraction torque over two seconds. The load then remained
at 70% of maximal voluntary isometric contraction torque for the remainder of the contraction.
The participants were instructed not to exert enough effort as to cause a concentric contraction,
but instead attempt to “brace” and “maintain joint position throughout the ROM” (262, 264).
Once the load was reached, the participant held the initial position until isometric failure, at
which point, slow and brief changes in joint-angle occurred with the participant maintaining
maximal effort throughout each contraction. While highly variable, many participants had
several periods of near-zero changes in knee flexion, followed by periods of joint angle changes
until the entire ROM was completed. As torque was held constant, the participants' ability to
maintain a constant torque output throughout the ROM was the quality of interest. To avoid
pacing, participants were not told how many contractions/sets they would perform. Strong
verbal encouragement was provided during each set.

Chapter 10
174
Figure 28. Start (panel A) and end (panel B) position for the eccentric quasi-isometric
contractions.
Like Chapter 9, the participant rested for 180 seconds after each EQI before performing
an unloaded concentric contraction to return to the 30º starting position and initiate the next
EQI (264). The exercise prescription was based on the results of Oranchuk et al., (264) who
reported reductions in concentric and isometric performance following 3.85 ± 1.1 EQI
contractions. The 180 second rest period was determined during piloting to be sufficient in
maintaining both performance and time-efficiency. Additionally, Oranchuk et al. (264)
determined that the total angular impulse of ~four EQI contractions was equal to ~100 eccentric
contractions performed at 60º.s-1; a loading scheme known to result in substantial reductions in
neuromuscular outputs and increased markers of muscle damage (234, 264, 352). Due to their
non-ballistic nature, EQI data were collected at 100 Hz.
Data processing and analysis
Data were analyzed via a customized MATLAB (2020a, MathWorks, Natick, MA)
script. The MATLAB script processed the data at 100 Hz with no filter. Position, torque, and
velocity data were taken from the raw dynamometer software, and angular impulse was
calculated using the trapezoidal method of the torque curve for each ROM band. Each EQI
contraction was analyzed by detecting and identifying the minimum (30°) and maximum (100°)
angle that signified the start and end of each contraction. To quantify differences throughout
the ROM, angular impulse (Nm.s), angular velocity (º·s-1), and time-under-tension (sec) were
calculated for the entire ROM, and between eight bands (30-40°, 40-50°, 50-60°, 60-70°, 70-

Chapter 10
175
80°, 80-90°, and 90-100°) (264, 265). For this study, short, medium, and long muscle lengths
refer to 30-50º, 50-80º, and 80-100º of flexion, respectively.
Statistical analysis
Time-normalized torque-time kinetics
Statistical parametric mapping (SPM) was utilized to compare angle-time
characteristics between contractions. One dimensional SPM (25) uses random field theory to
objectively identify field regions that co-vary significantly with the experimental design (274).
Statistical parametric mapping analysis was performed and tracings of the joint angle-time
curves with 95% compatibility limits visually examined. If visual between-condition
differences were apparent, a two-tailed, paired-sample t-test was performed on the time-
normalized data to determine the magnitude of precision of the between-condition differences.
The SPM analyses were implemented in MATLAB (MathWorks, Natick, MA) using the open-
source package located at http://www.spm1d.org/ (274).
Absolute torque-angle characteristics
Statistical analyses of the absolute torque-angle characteristics were performed with
RStudio, version 1.4.869. Shapiro-Wilk tests and visual assessments of normality probability
plots were conducted on kinetic and kinematic data. The assumption for the equality of
variances was checked via Levene’s tests. Inter-contraction differences were evaluated via one-
way analyses of variance (ANOVAs) with Bonferroni adjusted post-hoc contrasts for angular
impulse, time-under-tension, and velocity, respectively. The initial strength level, as defined
by MVIT at 70º, was utilized as a between-subject factor. An alpha level of 0.05 was used to
determine statistical significance with Omega squared (ɷ2) [‘formula 2’ (115)] used to
characterize the effect size of each ANOVA. Due to the limited sample size, qualitative
descriptors of paired Hedges’ g effect sizes (ES) (192) were assessed as: trivial < 0.2, small =
0.2-0.49, moderate = 0.5-0.79, large > 0.8 (115). ESs are reported with 95% compatibility
limits to provide readers with the magnitudes of difference while also providing statistical
significance with a cut-off of p < 0.05 (38, 292). All reported p-values are Bonferroni adjusted.
Data are reported as mean ± standard deviation unless otherwise stated.

Chapter 10
176
Results
Time-normalized angle-time kinetics
Compatibility limits overlapped throughout each contraction for the time-normalized
curves; however, 95%CIs nearly delineated between ~15-30% of contraction duration when
comparing C1 and C4 (Figure 29). Between-contraction differences increased throughout the
four EQI contractions (Figure 30). Most notably, the initial increase in the joint angle from
~30-50º (Figure 29) (~0-15%, Figure 30) tended to occur earlier as the loading protocol
progressed, while joint angle changes from 50-100º remained similar.
Figure 29. Time normalized angle-time curve comparison of eccentric quasi-isometric
contractions one, and four. The knee angle is presented in degrees with 95% compatibility
limits. The grey box highlights a near lack of compatibility limit overlap.
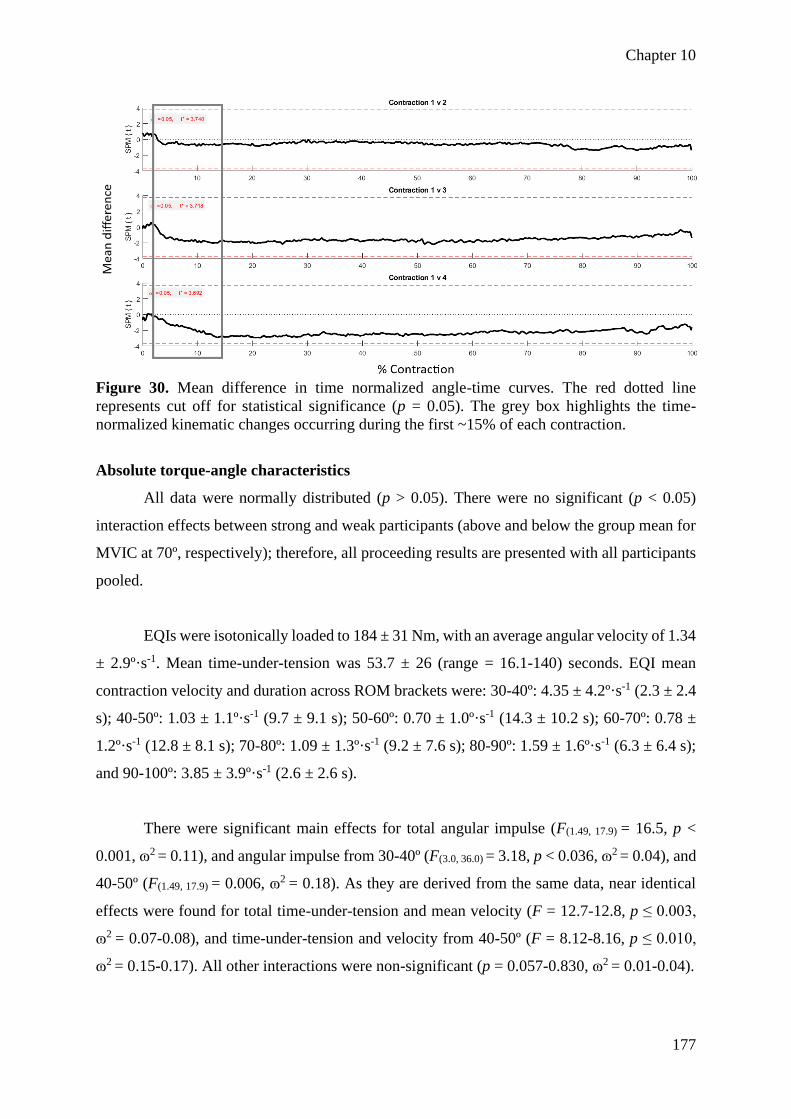
Chapter 10
177
Figure 30. Mean difference in time normalized angle-time curves. The red dotted line
represents cut off for statistical significance (p = 0.05). The grey box highlights the time-
normalized kinematic changes occurring during the first ~15% of each contraction.
Absolute torque-angle characteristics
All data were normally distributed (p > 0.05). There were no significant (p < 0.05)
interaction effects between strong and weak participants (above and below the group mean for
MVIC at 70º, respectively); therefore, all proceeding results are presented with all participants
pooled.
EQIs were isotonically loaded to 184 ± 31 Nm, with an average angular velocity of 1.34
± 2.9º·s-1. Mean time-under-tension was 53.7 ± 26 (range = 16.1-140) seconds. EQI mean
contraction velocity and duration across ROM brackets were: 30-40º: 4.35 ± 4.2º·s-1 (2.3 ± 2.4
s); 40-50º: 1.03 ± 1.1º·s-1 (9.7 ± 9.1 s); 50-60º: 0.70 ± 1.0º·s-1 (14.3 ± 10.2 s); 60-70º: 0.78 ±
1.2º·s-1 (12.8 ± 8.1 s); 70-80º: 1.09 ± 1.3º·s-1 (9.2 ± 7.6 s); 80-90º: 1.59 ± 1.6º·s-1 (6.3 ± 6.4 s);
and 90-100º: 3.85 ± 3.9º·s-1 (2.6 ± 2.6 s).
There were significant main effects for total angular impulse (F(1.49, 17.9) = 16.5, p <
0.001, ɷ2 = 0.11), and angular impulse from 30-40º (F(3.0, 36.0) = 3.18, p < 0.036, ɷ2 = 0.04), and
40-50º (F(1.49, 17.9) = 0.006, ɷ2 = 0.18). As they are derived from the same data, near identical
effects were found for total time-under-tension and mean velocity (F = 12.7-12.8, p ≤ 0.003,
ɷ2 = 0.07-0.08), and time-under-tension and velocity from 40-50º (F = 8.12-8.16, p ≤ 0.010,
ɷ2 = 0.15-0.17). All other interactions were non-significant (p = 0.057-0.830, ɷ2 = 0.01-0.04).

Chapter 10
178
Mean ± SD data, Hedges’ g ESs with 95% compatibility limits and %Δ for angular
impulse, time-under-tension, and angular velocity is provided in Appendices 15, 16, and 17,
respectively. Briefly, between-contraction decreases in total angular impulse (Figure 31) and
time-under-tension and increases in velocity were observed (ES = 0.36 ± 0.26, 22.2 ± 10.9%)
(see Appendices). Furthermore, the largest reduction in angular impulse and time-under-
tension (increase in velocity) was nearly exclusively found between 30-40º (ES = 0.35 ± 0.26,
46.0 ± 42.1%), and 40-50º (ES = 0.63 ± 0.27, 73.5 ± 58.1%), with smaller changes generally
found through the 50-100º ROM brackets (ES = 0.10 ± 0.26, 14.3 ± 24.6%) (see Appendices).
The changes in total angular impulse and impulse distribution over the four contractions are
illustrated in Figures 31 and 32, respectively. While varying in levels of significance (see
Appendix 15), increases in relative (% of total) angular impulse are apparent when examining
60-70° from C2 to C3 and C4, 70-80° from C2 to C3, and in 80-90° from C3 to C4; resulting
in a shift in relative impulse from short towards medium to long muscle lengths (Figure 32).
Figure 31. Change in total angular impulse between contractions. *p < 0.05, **p < 0.01, ***p
< 0.001. Error bars denote the standard deviations.

Chapter 10
179
Figure 32. Angle-specific eccentric quasi-isometric impulse from contraction one (C1),
contraction two (C2), contraction three (C3) and contraction four (C4). Error bars denote the
standard deviations.
Discussion
The biomechanical characteristics of EQI knee-extensions and the kinematic changes
throughout a bout of contractions were quantified. Our primary findings were that most of the
angular impulse and time-under-tension took place towards short to moderate muscle lengths,
consistent with our hypothesis. There was also a decrease in the angular impulse of ~11-18%
between contractions. We also determined that the relative proportion of angular impulse and
time-under-tension shifted towards moderate to long muscle lengths as the number of
contractions increased. The potential physiological and practical implications for practitioners
and researchers are discussed herewith.
It appears that EQI knee-extensions predominantly load the first half of the ROM,
which corresponds to the fatigue-induced decreases in concentric and isometric torque and rate
of torque development at shorter muscle lengths following similar bouts of EQIs (264).
However, in this study, a shift in angular impulse and time-under-tension from short to
medium, to medium to long muscle lengths as repetition number increased was observed
(Figure 32). For example, from C1 to C4, angular impulse from 30-60º showed small to large
decreases (ES = 0.30-0.90, 38.2-74.1%), whereas angular impulse from 60-100º (ES = -0.19-
0.41, -22.8-33.8%) remained relatively constant, and in some cases, increased through the
contractions (see Appendix 15). This finding is relevant as the joint-angle specific effects of
resistance-exercise have been previously discussed (135, 195, 322, 365) with multiple reviews
concluding that training through a full ROM or at longer muscle lengths is superior to short

Chapter 10
180
muscle length training when increases in muscle size and increased dynamic performance are
desired (268, 310).
Other unique aspects of EQIs are the extremely slow velocities/long contraction
durations at modest external torques. When compared to maximal strength training, explosive
intent results in greater improvements in the rate of force/torque development due to increases
in neural drive characteristics (354), and adaptations to a plethora of tendon and aponeurosis
functional qualities (32, 225). However, the isometric training literature suggests that training-
induced improvements in muscle size and maximal strength are not differentially affected by
contraction intent (32, 216, 225, 268, 354). Alternatively, the duration of contraction has
notable effects on training-induced morphological adaptations (262, 268, 314). For example,
Schott, McCully, and Rutherford (1995) compared time-under-tension equated isometric
training utilizing contractions of 3 or 30 s. While both groups experienced similar maximal
force increases, only the 30-second contraction group increased quadriceps cross-sectional
area, suggesting increased metabolite accumulation during the sustained contractions as a
plausible mechanism (314). Indeed, several studies have demonstrated a reduction in blood
flow and muscle oxygenation during sustained contractions (83, 146, 261) with some
researchers suggesting that contraction-induced muscle deoxygenation and metabolite
accumulation could promote muscle growth, primarily by altering muscle activation, leading
to earlier recruitment of type-II motor units (82). On a related note, it appears that substantial
blood flow restriction is possible with contractions as low as 25% of maximal voluntary
contraction (333), far below the 70% utilized in our study. Finally, as EQI loading includes an
eccentric portion through the ROM, the contraction could be maintained for substantially
longer than a fatiguing isometric contraction in isolation. Therefore, an EQI may result in
greater metabolic signalling due to greater, or at least more sustained muscle deoxygenation
and metabolite accumulation when compared to holding isometrics.
While contraction intensity (% of maximum) is questionably important for muscle
hypertrophy (268) so long as a minimum threshold is reached (196), contractions ≥ 70% may
be necessary to increase tendon stiffness and cross-sectional area (50, 268). However, the
literature also suggests that slow, or sustained contractions are at least as beneficial to tendon
remodeling and function as higher velocity, or rapid contractions (45, 174, 262, 268).

Chapter 10
181
Slow contractions, synonymous with EQIs may be better tolerated by populations with
tendon pain (45, 174, 262), despite, to our best knowledge, no studies confirming this
hypothesis, likely due to the difficulty in recruiting a meaningful sample of participants with
homogenous tendon issues/qualities. Therefore, EQI contractions would likely be valuable in
rehabilitative settings as contraction intensities ≥ 70% can be applied while maintaining low
contraction velocities (248, 262, 366). While not completely elucidated, it is also likely that the
slow eccentric portion of EQIs is especially beneficial in the rehabilitation of tendinopathies
(137, 172). Of note, it is unlikely that moderate-intensity contractions taken to failure,
synonymous with EQIs, would be as effective as briefer, high-intensity contractions for
improving the rate of motor unit activation (232). However, the study of Miller et al. (232)
included isometric contractions in isolation, and the effects of including an eccentric phase (as
in EQIs) may result in alternative findings (93). Also, the difference in the effectiveness of high
versus moderate-intensity contractions to longitudinally increase central nervous system
activation remains to be determined.
Limitations and directions for future research
While both the joint-angle-specific characteristics and between-contraction changes
were determined there are several limitations and directions for future research. From a
biomechanical standpoint, intra-contraction fascicle and tendon-aponeuroses tracking are
required to better understand the contraction mechanics and the potential load sharing of active
and passive components through the ROM (147, 286). Similarly, electromyography would be
required to elucidate the relative contribution of each quadriceps muscle and region over
different velocities and joint angles. Likewise, peripheral, and/or transcranial magnetic
stimulation would be required to determine the etiology of the observed fatigue. Also, the
variability and quantification of the individual isometric and eccentric phases were not
quantified in the present study. Thus, future research may wish to determine exactly what
proportion of the angular impulse was produced via static or lengthening contractions, perhaps
utilizing novel measuring systems (304). Finally, while it is highly likely that substantial blood
flow restriction and muscle de-oxygenation occurred during the EQI contractions (261, 333),
near-infrared spectroscopy is required to confirm this and examine the effects of rapid, small
amplitude changes in ROM that may allow for very brief periods of muscle relaxation and thus
increased substrate exchange and metabolite clearance (305). Likewise, several researchers
have examined muscle oxygenation during fatiguing isometric contractions (7, 83, 176, 261,
327), but none have determined the oxygenation kinetics of a subsequent eccentric phase.

Chapter 10
182
Researchers must also directly determine the tolerability of specific joint angles as well as
contraction velocity and intensity in participants with tendon or joint pain. Researchers may
wish to utilize SPM analyses to easily compare the kinematic qualities of contrasting
contraction types or relative intensities or velocities.
Conclusions
Total angular impulse and time-under-tension decreased by ~15% from contraction to
contraction. Additionally, most kinetic and kinematic between-contraction changes occurred
at short to moderate muscle lengths, effectively shifting the angular impulse distribution to
longer muscle lengths throughout the protocol. Researchers must be mindful of the between-
set drop-offs observed with EQI exercise and determine the same characteristics of a
comparative contraction type when attempting to match conditions over a training study.
Additionally, researchers could employ SPM analysis to compare a plethora of loading
variables (e.g., isotonic vs isokinetic; high vs low intensity; eccentric vs concentric). As
training at longer muscle lengths is beneficial for hypertrophy and strength throughout the
range of motion, it could be recommended that an EQI contraction be initiated at moderate to
long muscle lengths to avoid imparting a large proportion of the total angular impulse at shorter
muscle lengths. Practitioners could alter the impulse distribution to longer muscle lengths by
prescribing a greater number of contractions, reducing rest periods, or implementing EQI
contractions towards the end of a traditional training session where fatigue may be present
(262). The large standard deviations and compatibility limits in cumulative loading and loading
distribution (see Appendices 15, 16 and 17) highlight the need to prescribe EQI contractions
on an individual basis. Based on related findings it is plausible that EQIs could be utilized to
load abnormal (e.g., damaged, tendinopathic) tendon, alter muscle morphology, or improve
performance in similar tasks, while other training methods are likely superior for reducing
electromechanical delay and explosive performance enhancement. Of course, longitudinal
examinations are required to confirm this line of thought.

183
Section 5 – Conclusions
Chapter 11
184
Chapter 11 – Summary, practical applications, limitations, and
future research directions
Summary
The primary question of the thesis was “What are the acute, and long-term effects of
eccentric quasi-isometric (EQI) loading on muscle form and function?” The basis for the
overarching question was determined by reviewing quasi-isometric and EQI contractions in the
literature, and recognizing a paucity of scientific evidence to support their use; despite
seemingly logical anecdotal evidence supporting EQI loading in rehabilitation and sport
performance contexts. To answer the overarching question, a systematic series of literature
reviews, cross-sectional and intervention studies were performed. Thus, the following sections
form the thesis: Section 1) systematic and narrative reviews of literature; Section 2) several
methods-based investigations; Section 3) correlational analysis of muscle structure and
function; Section 4) acute and short-term investigations; and Section 5) summary.
Key findings
Section 1
As no literature directly examining EQI contractions existed, a systematic review of
isometric training interventions in humans was performed (Chapter 2), and a narrative review
of EQI adjacent biomechanical, physiological, biological, and practical literature was also
completed (Chapter 3). In Chapter 2 several important loading parameters were identified,
including muscle length/joint angle, and contraction intensity, duration, and intent. Isometric
training at longer muscle lengths produced greater muscular hypertrophy and dynamic
performance improvements than equal volumes of shorter muscle length training, while
ballistic intent resulted in greater neuromuscular activation and rapid force production (268).
Substantial improvements in muscular hypertrophy and maximal force production were
possible regardless of training intensity, however, intensities greater than 70% were required
for improving tendon structure and function (268). In Chapter 3 it was determined that EQIs
may provide a practical means of increasing total volume and metabolic and hormonal outputs
(262). At the same time, EQIs likely allow for a safe and time-efficient application of large
quantities of mechanical tension (262). However, in Chapter 3 it was also concluded that given
neuromuscular specificity it was unlikely that EQI adaptations were beneficial to power or
speed-based movements (262).

Chapter 11
185
Section 2
Section 2 consisted of four chapters, each determining the variability of extensive
evaluations of regional quadriceps muscle morphology and architecture, and joint-angle-
specific knee-extension performance that was partially identified in Section 1. Chapter 4
determined that regional quadriceps muscle thickness was a highly reliable measure, whereas
greater caution was required when examining quadriceps pennation angle, or fascicle length,
especially in the rectus femoris (263). Additionally, the extended field-of-view technique
offered greater confidence than trigonometric estimations of vastus lateralis fascicle length
(263). Key findings from Chapter 5 were that echo intensity could be relied upon in all regions
of the quadriceps muscles, however, intersession variability was reduced when utilizing a
mathematical correction for subcutaneous fat thickness (267). Furthermore, it was determined
that fat corrected echo intensity increased towards the myotendinous junctions (267). Chapter
6 examined the variability of concentric isokinetic measures of torque and impulse throughout
the range of motion (265). Key findings were that the optimal angle was highly variable, and
that impulse brackets were the most reliable means of determining the concentric torque-angle
relationship (265). Finally, in Chapter 7 the variability of short, medium, and long quadriceps
muscle length isometric evaluations were examined (269). Intersession variability of peak
torque and rate of torque development from 0-200 ms could be used with confidence, regardless
of joint angle (269). However, the rate of torque development and impulse in smaller time
frames should be utilized and interpreted with caution (269).
Section 3
Within Section 3 a single chapter was used to determine the relationship between
several of the most reliable measures found in Section 2. These correlational analyses were
performed to better understand the relationship between form and function, and therefore
inform researchers to which measures should be focused on during longitudinal interventions.
In Chapter 8 it was determined that the middle and distal regions of the vastus lateralis and
lateral vastus intermedius were the best predictors of isometric torque production, regardless
of the joint angle (260). Additionally, correlations between muscle architecture and isometric
torque increased at longer muscle lengths (260).
Section 4
Section 4 was comprised of two acute/short-term studies examining the biomechanical
profile and physiological effects of EQI loading. Chapter 9 was a within-participant design

Chapter 11
186
exposing each quadriceps to impulse-matched bouts of isotonic EQI or isokinetic eccentric
loading (264). Though several of the outcome variables were similar between-conditions, the
eccentric limb experienced greater muscle soreness, and middle-distal muscle echo intensity,
with larger reductions in concentric and isometric performance throughout the length-tension
relationship (264). Conversely, greater vastus intermedius muscle swelling occurred in the EQI
limb with similar reductions in torque outputs at shorter muscle lengths (264). While it was
found in Chapter 9 that the majority of angular impulse in the EQI contraction occurred at
shorter muscle lengths (264), Chapter 10 aimed to thoroughly define the kinetics and
kinematics of EQI loading over a series of contractions. Chapter 10 confirmed that most of the
angular impulse and time-under-tension occurred early in the range of motion, however, the
proportion of loading shifts from short to moderate muscle lengths as the number of
contractions increases (259).
Practical applications
Strength and conditioning, and rehabilitation practitioners are constantly searching for
safe, time-efficient, and effective means of imparting mechanical tension and improving
muscle size and function. Therefore, one of the aims of the thesis was to inform practitioners
of the potential benefits and drawbacks of EQI loading. Some of the main practical findings
were:
• Isometric resistance training can be utilized to induce morphological adaptations
including muscle hypertrophy and increased tendon stiffness (268).
• While isometric performance improvements are joint-angle-specific, practitioners
should prescribe isometric contractions at longer muscle lengths when increasing
muscle size, and improving performance through the range of motion is desired (268).
• Practitioners aiming to improve tendon stiffness should prescribe contractions
exceeding 70% of maximal voluntary contraction (268).
• EQI loading is a time-efficient means of imparting high mechanical tension, with
minimal delayed onset muscle soreness or short-term performance reductions (262).
• A high degree of inter-participant variability exists, therefore, EQI loading should be
applied on a case-by-case basis (259, 264).
• EQI training is likely a valuable tool for improving or maintaining muscle size and
joint-angle-specific strength (262, 264). However, EQI training is unlikely to lead to
improvements in ballistic movements (262, 264).

Chapter 11
187
• EQIs may possibly be best implemented near the end of a resistance training session
when overloading the entire range of motion is desired (259, 262).
• Training with EQIs is likely most beneficial in rehabilitation settings as a bridge
between static and dynamic movements (262).
Additionally, our thesis findings can drive better methodological understanding and
practice in several areas:
• Researchers can confidently evaluate muscle thickness of all muscles and regions of
the quadriceps, however, pennation angle and calculated fascicle length should be
interpreted with caution, especially in the rectus femoris (263).
• Researchers should utilize the extended field-of-view technique to estimate vastus
lateralis fascicle length (263).
• Echo intensity can be relied upon at all regions and muscles of the quadriceps; however,
subcutaneous fat correction improves intersession reliability (267).
• Impulse brackets are a more reliable means of evaluating the torque-angle relationship
of isokinetic concentric knee-extensions than the optimal angle, or angle-specific
torque (265).
• Isometric peak torque can be tested with high reliability across knee joint angles;
however, early-stage rate of torque development and impulse should be interpreted with
caution (269).
• Researchers may wish to focus on middle and distal lateral quadriceps architecture
when examining training or unloading induced adaptations (260).
• Angular impulse distribution should be considered when comparing between-condition
loading (264).
• Multiple points in the range of motion and regions of muscle should be evaluated to
thoroughly evaluate between-condition changes in morphological and neuromuscular
variables (259, 264).
• Statistical parametric mapping may be a simple means of comparing joint-angle
specific loading during single-joint contractions (259).
Limitations and directions for future research
This thesis was the first to directly examine EQIs, however, two planned investigations
could not be completed due to the COVID-19 lockdowns particularly in Melbourne where I

Chapter 11
188
was collecting data. Complicating this was the fact that I was unable to return to New Zealand
as the borders were closed to all non-citizens or permanent residents. Thus, several limitations
and future research directions exist.
• As knee-extension and the knee extensors were the examined movement and muscle
group of interest, future research could examine EQIs in other movements and muscle
groups.
• Similarly, resistance-trained males were the population of focus. Therefore, females
and rehabilitative populations should be examined.
• While the kinetic and kinematic profile of EQI contractions were determined, intra-
contraction fascicle tracking and region and muscle-specific electromyographical
measures are required to elucidate neural and contractile characteristics.
• Peripheral nerve and transcranial magnetic stimulation techniques could be employed
to delineate the short-term performance reductions from EQI and comparative
contraction types.
• A profile of metabolic and hormonal disruptions and muscle damage through blood and
biopsy analysis is required to understand the underlying mechanisms of the short- or
long-term effects of EQI loading.
• The largest limitation is the lack of any longitudinal investigation. Therefore, any
potential applications of EQI training are speculative. Long-term effects of EQI
resistance training must be determined to understand the regional muscle and joint-
angle-specific adaptations possible in a variety of contexts.
Conclusions
This thesis was the first to perform academic research on EQI loading, with a focus on
morphological, architectural, and contractile performance alterations in resistance-trained men.
While muscle physiologists and neuromuscular researchers can find points of value, the thesis
is most relevant to strength and conditioning and rehabilitation focused practitioners. Although
extensive future research is required to understand underlying mechanisms and long-term
adaptations, the thesis provided novel and original information on the biomechanical profile
and acute and short-term physiological effects of EQI loading. Ultimately, EQI training is
likely best applied to special or injured populations. EQI loading could play a role in general
preparatory, unloading, or transition phases of high-performance populations due to the low
number of joint movements, modest muscle soreness, and high time efficiency.

189
Section 6 – References and appendices

References
190
References
1. Aagaard P, Anderson LJ, Bennekou M, Larsson B, Olesen JL, Crameri R, Magnusson
SP, and Kjaer M. Effects of resistance training on endurance capacity and muscle fiber
composition in young top-level cyclists. Scand J Med Sci Sports 21: 298-307, 2011.
2. Aagaard P, Simonsen EB, Andersen JL, Magnusson SP, Halkjaer-Kristensen J, and
Dyhre-Poulsen P. Neural inhibition during maximal eccentric and concentric
quadriceps contraction: Effects of resistance training. J Appl Physiol 89: 2249-2257,
2000.
3. Aagaard P, Simonsen EB, Anderson JL, Magnusson P, and Dyhre-Poulsen P. Neural
adaptation to resistance training: Changes in evoked V-wave and H-reflex responses. J
Appl Physiol 92: 2309-2318, 2002.
4. Abbott BC and Wilkie DR. The relation between velocity of shortening and the tension-
length curve of skeletal muscle. J Physiol 120: 214-223, 1953.
5. Abdulaziz A, Jubeau M, McGuigan MR, and Nosaka K. Less indication of muscle
damage in the second than initial electrical muscle stimulation bout consisting of
isometric contractions of the knee extensors. Eur J Appl Physiol 108: 709-717, 2010.
6. Abe T, Fukashiro S, Harada Y, and Kawamoto K. Relationship between sprint
performance and muscle fascicle length in female sprinters. J Physiol Anthropol 20:
141-147, 2001.
7. Akima H and Ryosuke A. Oxygenation and neuromuscular activation of the quadriceps
femoris including the vastus intermedius during a fatiguing contraction. Clin Physiol
Funct Imaging 37: 750-758, 2017.
8. Alberti G and Ragazzi R. Maximum strength and vertical jump effects of
electromyostimulation versus isometric training. Med Sport (Roma) 60: 557-565, 2007.
9. Alegre LM, Ferri-Morales A, Rodriguez-Casares R, and Aguado X. Effects of isometric
training on the knee extensor moment–angle relationship and vastus lateralis muscle
architecture. Eur J Appl Physiol 114: 2437-2446, 2014.
10. Alemany JA, Delgado-Díaz DC, Mathews H, David JM, and Kostek MC. Comparison
of acute responses to isotonic or isokinetic eccentric muscle action: differential
outcomes in skeletal muscle damage and implications for rehabilitation. Int J Sports
Med 35: 1-7, 2014.
11. Allen TJ, Jones T, Tsay A, Morgan DL, and Proske U. Muscle damage produced by
isometric contractions in human elbow flexors. J Appl Physiol 124: 388-399, 2018.

References
191
12. Ando R, Nosaka K, Tomita A, Watanabe K, and Blazevich AJ. Vastus intermedius vs
vastus lateralis fascicle behaviors during maximal concentric and eccentric
contractions. Scand J Med Sci Sports 28: 1018-1026, 2018.
13. Ando R, Saito A, Umemura Y, and Akima H. Local architecture of the vastus
intermedius is a better predictor of knee extension force than that of the other
quadriceps femoris muscle heads. Clin Physiol Funct Imaging 35: 376-382, 2014.
14. Ando R, Taniguchi K, Saito A, Fujimiya M, Katayose M, and Akima H. Validity of
fascicle length estimation in the vastus lateralis and vastus intermedius using
ultrasonography. Journal of Electromyography and Kinesiology 24, 2014.
15. Andrade RJ, Lacourpaille L, Freitas SR, McNair PJ, and Nordez A. Effects of hip and
head position on ankle range of motion, ankle passive torque, and passive
gastrocnemius tension. Scand J Med Sci Sports 26: 41-47, 2016.
16. Angelozzi M, Madama M, Corsica C, Calvisi V, Properzi G, McCaw ST, and Cacchio
A. Rate of force development as an adjunctive outcome measure for return-to-sport
decisions after anterior cruciate ligament reconstruction. J Orthop Sports Phys Ther 42:
772-780, 2012.
17. Antonio J and Gonyea WJ. Progressive stretch overload of skeletal muscle results in
hypertrophy before hyperplasia. J Appl Physiol 75: 1263-1271, 1993.
18. Apostolopoulos N, Metsios GS, Flouris AD, Koutedakis Y, and Wyon MA. The
relevance of stretch intensity and position-A systematic review. Front Psychol 6: 1-25,
2015.
19. Arampatzis A, Karamanidis K, and Albracht K. Adaptational responses of the human
Achilles tendon by modulation of the applied cyclic strain magnitude. J Exp Biol 210:
2743-2753, 2007.
20. Arampatzis A, Karamanidis K, De Monte G, Stafilidis S, Morey-Klapsing G, and
Büggemann P. Differences between measured and resultant joint moments during
voluntary and artificially elicited isometric knee extension contractions. Clin Biomech
19: 277-283, 2004.
21. Arampatzis A, Peper A, Bierbaum S, and Albracht K. Plasticity of human Achilles
tendon mechanical and morphological properties in response to cyclic strain. J Biomech
43: 3073-3079, 2010.
22. Arnoczky SP, Lavagnino M, and Egerbacher M. The mechanobiological
aetiopathogenesis of tendinopathy: Is it the over-stimulation or the under-stimulation
of tendon cells? Int J Exp Pathol 88: 217-226, 2007.

References
192
23. Arnold BL, Perrin DH, and Hellwig EV. The reliability of three isokinetic knee-
extension angle-specific torques. J Athl Train 28: 227-229, 1993.
24. Arya S and Kulig K. Tendinopathy alters mechanical and material properties of the
Achilles tendon. J Appl Physiol 108: 670-675, 2010.
25. Ashburner J. SPM: A history. Neuroimage 62: 791-800, 2012.
26. Ashida Y, Himori K, Tatehayashi D, Yamada R, Ogasawara R, and Yamada T. Effects
of contraction mode and stimulation frequency on electrical stimulation-induced
skeletal muscle hypertrophy. J Appl Physiol 124: 341-348, 2017.
27. Azizi E, Brainerd EL, and Roberts TJ. Variable gearing in pennate muscles.
Proceedings of the National Academy of Sciences of the United States of America 105:
1745-1750, 2008.
28. Azizi E and Roberts TJ. Geared up to stretch: Pennate muscle behaviour during active
lengthening. Journal of Experimental Biology 217: 376-381, 2014.
29. Baker SJ, Kelly NM, and Eston RG. Pressure pain tolerance at different sites on the
quadriceps femoris prior to and following eccentric exercise. Euro J Pain 1: 229-233,
1997.
30. Balog EM. Excitation-contraction coupling and minor triadic proteins in low-frequency
fatigue. Exercise and Sport Sciences Reviews 38: 135-142, 2010.
31. Balshaw TG, Massey GJ, Maden-Wilkinson TM, Morales-Artacho AJ, McKeown A,
Appleby CL, and Folland JP. Changes in agonist neural drive, hypertrophy and pre-
training strength all contribute to the individual strength gains after resistance training.
Eur J Appl Physiol 117: 631-640, 2017.
32. Balshaw TG, Massey GJ, Maden-Wilkinson TM, Tillin NA, and Folland JP. Training-
specific functional, neural, and hypertrophic adaptations to explosive- vs. sustained-
contraction strength training. J Appl Physiol 120: 1364-1373, 2016.
33. Bamman MM, Newcomer BR, Larson-Meyer DE, Weinsier RL, and Hunter GR.
Evaluation of the strength-size relationship in vivo using various muscle size indices.
Med Sci Sports Exerc 32: 1307-1313, 2000.
34. Bamman MM, Shipp JR, Jaing J, Gower BA, Hunter GR, Goodman A, and McLafferty
CL. Mechanical load increased muscle IGF-I and androgen receptor mRNA
concentrations in humans. American Journal of Physiology Endocrinology and
Metabolism 280: E383-E390, 2001.
35. Bandy WD and Hanten WP. Changes in torque and electromyographic activity of the
quadriceps femoris muscles following isometric training. Phys Ther 73: 455-465, 1993.

References
193
36. Barak Y, Ayalon M, and Dvir Z. Transferability of strength gains from limited to full
range of motion. Med Sci Sports Exerc 36: 1413-1420, 2004.
37. Barton-Davis ER, Shoturma DI, and Sweeney HL. Contribution of satellite cells to IGF-
I induced hypertrophy of skeletal muscle. Acta Physiol Scand 167: 301-305, 1999.
38. Batterham AM and Hopkins WG. Making meaningful inferences about magnitudes. Int
J Sports Physiol Perform 1: 50-57, 2006.
39. Baumert P, Lake MJ, Drust B, Stewart C, and Erskine RM. TRIM63 (MuRF-1) gene
polymorphism is associated with biomarkers of exercise-induced muscle damage.
Physiol Genomics 50: 142-143, 2017.
40. Beard NA, Laver DR, and Dulhunty AF. Calsequestrin and the calcium release channel
of skeletal and cardiac muscle. Prog Biophys Mol Biol 85: 33-69, 2004.
41. Behm DG and Sale DG. Intended rather than actual movement velocity determines
velocity-specific training response. J Appl Physiol 74: 359-368, 1993.
42. Bekhet AH, Bochkezanian V, Saab IM, and Gorgey AS. The effects of electrical
stimulation parameters in managing spasticity after spinal cord injury: A systematic
review. Am J Phys Med Rehabil 98: 484-499, 2019.
43. Beretić I, Burovic M, Okicik T, and Dopsaj M. Relations between lower body isometric
muscle force characteristics and start performance in elite male sprint swimmers. J
Sports Sci Med 12: 639-645, 2013.
44. Berg HE, Tedner B, and Tesch PA. Changes in lower limb muscle cross-sectional area
and tissue fluid volume after transition from standing to supine. Acta Physiol Scand
148: 379-385, 1993.
45. Beyer R, Kongsgaard M, Kjaer BH, Ohlenschlaeger T, Kjaer M, and Magnusson PS.
Heavy slow resistance versus eccentric training as treatment for Achilles tendinopathy:
A randomized controlled trial. American Journal of Sports Medicine 43: 1704-1711,
2015.
46. Billot M, Simoneau EM, Ballay Y, Van Hoecke J, and Martin A. How the ankle joint
angle alters the antagonist and agonist torques during maximal efforts in dorsi- and
plantar flexion. Scand J Med Sci Sports 21: 273-281, 2011.
47. Bjørnsen T, Wernbom M, Kirketeig A, Paulsen G, Samnøy L, Bækken L, Cameron-
Smith D, Berntsen S, and Raastad T. Type 1 muscle fiber hypertrophy after blood flow-
restricted training in powerlifters. Med Sci Sports Exerc 51: 288-298, 2019.

References
194
48. Blazevich AJ, Coleman DR, Horne S, and Cannavan D. Anatomical predictors of
maximum isometric and concentric knee extensor moment. Eur J Appl Physiol 105:
869-878, 2009.
49. Bogdanis GC, Tsoukos A, Methenitis SK, Selima E, Veligekas P, and Terzis G. Effects
of low volume isometric leg press complex training at two knee angles on force-angle
relationship and rate of force development. Eur J Sport Sci 19: 345-353, 2018.
50. Bohm S, Mersmann F, and Arampatzis A. Human tendon adaptation in response to
mechanical loading: a systematic review and
meta-analysis of exercise intervention studies on
healthy adults. Sports Med Open 1: 1-18, 2015.
51. Bojsen-Moller J, Larsson B, and Aagaard P. Physical requirements in Olympic sailing.
Eur J Sport Sci 15: 220-227, 2015.
52. Bowers EJ, Morgan DL, and Proske U. Damage to the human quadriceps muscle from
eccentric exercise and the training effect. J Sports Sci 22: 1005-1014, 2004.
53. Brockett CL, Morgan DL, and Proske U. Human hamstring muscles adapt to eccentric
exercise by changing optimum length. Med Sci Sports Exerc 33: 783-790, 2001.
54. Brooks SV and Faulkner JA. Severity of contraction-induced injury is affected by
velocity only during stretches of large strain. Journal of Applied Physiology 91: 661-
666, 2001.
55. Brughelli M and Cronin J. Altering the length-tension relationship with eccentric
exercise. Sports Med 37: 807-826, 2007.
56. Brughelli M, Cronin J, Levin G, and Chaouachi A. Understanding change of direction
ability in sport: A review of resistance training studies. Sports Med 38: 1045-1063,
2008.
57. Burd NA, Andrews RJ, West DW, Little JP, Cochran AJ, Hector AJ, Cashaback JG,
Gibala MJ, Potvin JR, Baker SK, and Phillips SM. Muscle time under tension during
resistance exercise stimulates differential muscle protein sub-fractional synthetic
responses in men. J Physiol 590: 351-362, 2012.
58. Burgess KE, Connik MJ, Graham-Smith P, and Pearson SJ. Plyometric vs isometric
training influences on tendon propertied and muscle output. J Strength Cond Res 21:
986-989, 2007.
References
195
59. Butterfield TA and Herzog W. Is the force-length relationship a useful indicator of
contractile element damage following eccentric exercise? J Biomech 38: 1932-1937,
2005.
60. Cadore EL, Izquierdo M, Conceicao M, Radaelli R, Pinto RS, Baroni BM, Vaz MA,
Alberton CL, Pinto SS, Cunha G, Bottaro M, and Kruel LFM. Echo intensity is
associated with skeletal muscle power and cardiovascular performance in elderly men.
Exp Gerontol 47: 473-478, 2012.
61. Calixto RD, Verlengia R, Crisp AH, Carvalho TB, Crepaldi MD, Pereira AA, Yamada
AK, da Mota GR, and Lopes CR. Acute effects of movement velocity on blood lactate
and growth hormone responses after eccentric bench press exercise in resistance-trained
men. Biol Sport 31: 289-294, 2014.
62. Caresio C, Molinari F, Emanuel G, and Minetto MA. Muscle echo intensity: Reliability
and conditioning factors. Clin Physiol Funct Imaging 35: 393-403, 2015.
63. Castanov V, Hassan SA, Shakeri S, Vienneau M, Zabjek K, Richardson D, McKee NH,
and Agur AMR. Muscle architecture of vastus medialis obliquus and longus and its
functional implications: A three-dimensional investigation. Clin Anat 32: 515-523,
2019.
64. Cavanaugh JT and Powers M. ACL rehabilitation progression: Where are we now?
Curr Rev Musculoskelet Med 10: 289-296, 2017.
65. Chapman D, Newton M, Sacco P, and Nosaka K. Greater muscle damage induced by
fast versus slow velocity eccentric exercise. Int J Sports Med 27: 591-598, 2006.
66. Chapman DW, Newton M, McGuigan M, and Nosaka K. Effect of lengthening
contraction velocity on muscle damage of the elbow flexors. Medicine and Science in
Sports and Exercise 40: 926-933, 2008.
67. Chen H, Nosaka K, Pearce A, and Chen TC. Two maximal isometric contractions
attenuate the magnitude of eccentric exercise-induced muscle damage. Appl Physiol
Nutr Metab 37: 680-689, 2012.
68. Chen HL, Nosaka K, and Chen TC. Muscle damage protection by low-intensity
eccentric contractions remains for 2 weeks, but not 3 weeks. Eur J Appl Physiol 112:
555-565, 2012.
69. Chen TC, Lin MJ, Chen HL, Lai JH, Yu HI, and Nosaka K. Muscle damage protective
effect by two maximal isometric contractions on maximal eccentric exercise of the
elbow flexors of the contralateral arm. Scand J Med Sci Sports 28: 1354-1360, 2018.
References
196
70. Cichanowski HR, Schmitt JS, Johnson RJ, and Niemuth PE. Hip strength in collegiate
female athletes with patellofemoral pain. Med Sci Sports Exerc 39: 1227-1232, 2007.
71. Citterio G and Agostoni E. Selective activation of quadriceps muscle fibers according
to bicycling rate. J Appl Physiol Respir Enviro Exerc Physiol 57: 371-379, 1984.
72. Clarkson PM, Nosaka K, and Braun B. Muscle function after exercise-induced muscle
damage and rapid adaptation. Med Sci Sports Exerc 24: 512-520, 1992.
73. Coratella G, Longo S, Borrelli M, Christian D, Ce E, and Esposito F. Vastus
intermedius muscle architecture predicts the late phase of the knee extension rate of
force development in recreationally resistance-trained men. Journal of Science and
Medicine in Sport 23: 1100-1104, 2020.
74. Cormie P, McGuigan MR, and Newton RU. Developing maximal neuromuscular
power: Part 1 - Biological basis of maximal power production. Sports Med 41: 17-38,
2011.
75. Cormie P, McGuigan MR, and Newton RU. Developing maximal neuromuscular
power: Part 2 - Training considerations for improving maximal power production.
Sports Med 41: 125-146, 2011.
76. Couppe C, Kongsgaard M, Aagaard P, Hansen P, Bojsen-Moller J, Kjaer M, and
Magnusson SP. Habitual loading results in tendon hypertrophy and increased stiffness
of the human patellar tendon. J Appl Physiol 105: 805-810, 2008.
77. Cruz-Montecinos C, Guajardo-Rojas C, Montt E, Contreras-Brinceno F, Torres-Castro
R, Diaz O, and Cuestra-Vargas A. Sonographic measurement of the quadriceps muscle
in patients with chronic obstructive pulmonary disease: Functional and clinical
implications. J Ultrasound Med 35: 2405-2412, 2016.
78. Cully TR, Murphy RM, Roberts L, Truls R, Fassett RG, Coombes JS, Jayasinghe ID,
and Launikonis BS. Human skeletal muscle plasmalemma alters its structure to change
its Ca2+ handling following heavy-load resistance exercise. Nat Commun 8: 1-10, 2016.
79. Damas F, Phillips S, Vechin FC, and Ugrinowtsch C. A review of resistance training-
induced changes in skeletal muscle protein synthesis and their contribution to
hypertrophy. Sports Med 45: 801-807, 2015.
80. Dankel SJ, Abe T, Bell ZW, Jessee MB, Buckner SL, Mattocks KT, Mouser JG, and
Loenneke JP. The impact of ultrasound probe tilt on muscle thickness and echo-
intensity: A cross-sectional study. Journal of Clinical Densitometry 23: 630-638, 2018.

References
197
81. Dankel SJ, Buckner SL, Jessee MB, Grant Mouser J, Mattocks KT, Abe T, and
Loenneke JP. Correlations do not show cause and effect: Not even for changes in
muscle size and strength. Sports Med 48: 1-6, 2018.
82. Dankel SJ, Mattocks KT, Jessee MB, Buckner SL, Mouser JG, and Loenneke JP. Do
metabolites that are produced during resistance exercise enhance muscle hypertrophy?
Eur J Appl Physiol 117: 2125-2135, 2017.
83. de Ruiter CJ, de Boer MD, Spanjaard M, and de Haan A. Knee angle-dependent oxygen
consumption during isometric contractions of the knee extensors determined with near-
infrared spectroscopy. J Appl Physiol 99: 579-586, 2005.
84. de Ruiter CJ, Goudsmit JF, Van Tricht JA, and de Haan A. The isometric torque at
which knee-extensor muscle reoxygenation stops. Med Sci Sports Exerc 39: 443-453,
2007.
85. Delextrat A, Bateman J, Ross C, Harman J, Davis L, Vanrenterghem J, and Cohen DD.
Changes in torque-angle profiles of the hamstrings and hamstrings-to-quadriceps ratio
after two hamstring strengthening exercise interventions in female hockey players. J
Strength Cond Res 34: 396-405, 2020.
86. Dietz C and Peterson B. Triphasic training: A systematic approach to elite speed and
explosive strength performance. Hudson, WI: Dietz Sport Enterprise, 2012.
87. Docking SI, Rosengarten SD, and Cook J. Achilles tendon structure improves on UTC
imaging over a 5-month pre-season in elite Australian football players. Scand J Med
Sci Sports 26: 557-563, 2016.
88. Doguet V, Nosaka K, Plautard M, Gross R, Guilhem G, Guevel A, and Jubeau M.
Neuromuscular changes and damage after isoload versus isokinetic eccentric exercise.
Med Sci Sports Exerc 48: 2526-2535, 2016.
89. Douglas J, Pearson S, Ross A, and McGuigan M. Chronic adaptations to eccentric
training: A systematic Review. Sports Med 47: 917-941, 2017.
90. Douglas J, Pearson S, Ross A, and McGuigan M. Eccentric exercise: Physiological
characteristics and acute responses. Sports Med 47: 663-675, 2017.
91. Drake D, Kennedy R, and Wallace E. The validity and responsiveness of isometric
lower body multi-joint tests of muscular strength: A systematic review. Sports Med 3:
1-11, 2017.
92. Drake D, Kennedy R, and Wallace E. The validity and responsiveness of isometric
lower body multi-joint tests of muscular strength: A systematic review. Sports Med
Open 3: 1-11, 2017.

References
198
93. Duchateau J and Enoka RM. Neural control of lengthening contractions. J Exp Biol
219: 197-204, 2016.
94. DuVall MM, Gifford JL, Amrein M, and Herzog W. Altered mechanical properties of
titin immunoglobulin domain 27 in the presence of calcium. Eur Biophys J 42: 301-
307, 2013.
95. Ehrnborg C and Rosen T. Physiological and pharmacological basis for the ergogenic
effects of growth hormone in elite sports. Asian J Androl 10: 373-383, 2008.
96. El-Ashker S, Allardyce JM, and Carson BP. Sex-related differences in joint-angle-
specific hamstring-to-quadriceps function following fatigue. Eur J Sport Sci 19: 1053-
1061, 2019.
97. Ema R, Wakahara T, Mogi Y, Miyamoto N, Komatsu T, Kanehisa H, and Kawakami
Y. In vivo measurement of human rectus femoris architecture by ultrasonography:
Validity and applicability. Clin Physiol Funct Imaging 33: 267-273, 2013.
98. Enoka RM and Duchateau J. Rate coding and the control of muscle force. Cold Spring
Harb Perspect Med 7: pii: a029702, 2017.
99. Erskine RM, Fletcher G, and Folland JP. The contribution of muscle hypertrophy to
strength changes following resistance training. Eur J Appl Physiol 114: 1239-1249,
2014.
100. Escamilla RF, Macleod TD, Wilk KE, Paulos L, and Andrews JR. Anterior cruciate
ligament strain and tensile forces for weight-bearing and non-weight-bearing exercises:
a guide to exercise selection. J Orthop Sports Phys Ther 42: 208-220, 2012.
101. Farthing JP and Chilibeck PD. The effects of eccentric and concentric training at
different velocities on muscle hypertrophy. Eur J Appl Physiol 89: 578-586, 2003.
102. Faulkner JA, Davis CSM, C L, and Brooks SV. The aging of elite male athletes: Age-
related changes in performance and skeletal muscle structure and function. Clin J Sport
Med 18: 501-507, 2008.
103. Fernandez-Gonzalo R, Bresciani G, Souza-Teixeira Fd, Hernandez-Murua JA,
Jimenez-Jimenez R, Gonzalez-Gallego J, and de Paz JA. Effects of a 4-week eccentric
training program on the repeated bout effect in young active women. J Sports Sci Med
10: 692-699, 2011.
104. Fisher J, Van-Dongen M, and Sutherland R. Combined isometric and vibration training
does not enhance strength beyond that of isometric training alone. J Sports Med Phys
Fitness 55: 899-904, 2015.

References
199
105. Fisher JP, Blossom D, and Steele J. A comparison of volume-equated knee extensions
to failure, or not to failure, upon rating of perceived exertion and strength adaptations.
Appl Physiol Nutr Metab 41: 168-174, 2016.
106. Fisher RA. On the "Probable error" of a coefficient correlations deduced from a small
sample. Metron 1: 3-32, 1921.
107. Fortuna R, Power GA, Mende E, Seiberl W, and Herzog W. Residual force
enhancement following shortening is speed-dependent. Sci Rep 6, 2016.
108. Franchi MV, Atherton PJ, Reeves ND, Fluck M, Williams J, Mitchell WK, Selby A,
Valls RMB, and Narici MV. Architectural, functional and molecular responses to
concentric and eccentric loading in human skeletal muscle. Acta Physiol 210: 642-654,
2014.
109. Franchi MV, Longo S, Mallinson J, Quinlan JI, Taylor T, Greenhaff PL, and Narici
MV. Muscle thickness correlates to muscle cross-sectional area in the assessment of
strength training-induced hypertrophy. Scand J Med Sci Sports 28: 846-853, 2018.
110. Franchi MV, Raiteri BJ, Longo S, Sinha S, Narici MV, and Csapo R. Muscle
architecture assessment: Strengths, shortcomings and new frontiers of in vivo
techniques. Ultrasound Med Biol 44: 2492-2504, 2018.
111. Franchi MV, Reeves ND, and Narici MV. Skeletal muscle remodeling in response to
eccentric vs. concentric loading: Morphological, molecular, and metabolic adaptations.
Front Physiol 8: 1-16, 2017.
112. Franchi MV, Ruoss S, Valdivieso P, Mitchell KW, Smith K, Atherton PJ, Narici MV,
and Fluck M. Regional regulation of focal adhesion kinase after concentric and
eccentric loading is related to remodelling of human skeletal muscle. Acta Physiol 223:
e13056, 2018.
113. Frey Law LA, Evans S, Knudtson J, Nus S, Scholl K, and Sluka KA. Massage reduces
pain perception and hyperalgesia in experimental muscle pain: a randomized,
controlled trial. J Pain 9: 714-721, 2008.
114. Fridén J, Sfakianos PN, and Hargens AR. Muscle soreness and intramuscular fluid
pressure: Comparison between eccentric and concentric load. J Appl Physiol 61: 2175-
2179, 1986.
115. Fritz CO, Morris PE, and Richler JJ. Effect size estimates: Current use, calculations,
and interpretation. J Exp Psychol Gen 141: 2-18, 2012.

References
200
116. Fry AC, Schilling BK, Staron RS, Hagerman FC, Hikida RS, and Thrush JT. Muscle
fiber characteristics and performance correlates of male Olympic-style weightlifters. J
Strength Cond Res 17: 746-754, 2003.
117. Fujita S, Abe T, Drummond MJ, Cadenas JG, Dreyer HC, Sato Y, Volpi E, and
Rasmussen BB. Blood flow restriction during low-intensity resistance exercise
increases S6K1 phosphorylation and muscle protein synthesis. J Appl Physiol 103: 903-
910, 2007.
118. Fukunaga T, Kawakami Y, Kubo K, and Kanehisa H. Muscle and tendon interaction
during human movements. Exerc Sport Sci Rev 30: 106-110, 2002.
119. Fukunaga T, Miyatani M, Tachi M, Kouzaki M, Kawakami Y, and Kanehisa H. Muscle
volume is a major determinant of joint torque in humans. Acta Physiol Scand 172: 249-
255, 2001.
120. Fulford J, Eston RG, Rowlands AV, and Davies RC. Assessment of magnetic
resonance techniques to measure muscle damage 24 h after eccentric exercise. Scand J
Med Sci Sports 25: 28-39, 2015.
121. Fulford J, Eston RG, Rowlands AV, and Davies RC. Assessment of magnetic resonance
techniques to measure muscle damage 24 h after eccentric exercise. Scandinavian
Journal of Medicine and Science In Sports 25: 28-39, 2015.
122. Garner JC, Blackburn T, Wiemar W, and Campbell B. Comparison of
electromyographic activity during eccentrically versus concentrically loaded isometric
contractions. J Electromyogr Kinesiol 18: 466-471, 2008.
123. Gentil P, Oliveira E, and Bottaro M. Time under tension and blood lactate response
during four different resistance training methods. J Physiol Anthropol 25: 339-344,
2006.
124. Giles LS, Webster KE, McClelland JA, and Cook J. Can ultrasound measurements of
muscle thickness be used to measure the size of individual quadriceps muscles in people
with patellofemoral pain? Phys Ther Sport 16: 45-52, 2015.
125. Gillies AR and Lieber RL. Structure and function of the skeletal muscle extracellular
matrix. Muscle Nerve 44: 318-311, 2011.
126. Gilliver SF, Degens H, Rittweger J, Sargeant AJ, and Jones DA. Variation in the
determinants of power of chemically skinned human muscle fibres. Exp Physiol 94:
1070-1078, 2009.
References
201
127. Giorgi A, Wilson GJ, Weatherby RP, and Murphy AJ. Functional isometric weight
training: Its effects on the development of muscular function and the endocrine system
over an 8-week trianing period. J Strength Cond Res 21: 18-25, 1998.
128. Goldman RJ, Reinbold KA, Iglarsh ZA, Neustadter LM, Oatis CA, and Schumacher
HR. Phase I design and evaluation of an isometric muscle reeducation device for knee
osteoarthritis rehabilitation. J Rehabil Res Dev 40: 95-107, 2003.
129. Goldspink G, Scutt A, Martindale J, Jaenicke T, Turay L, and Gerlach GF. Stretch and
force generation induce rapid hypertrophy and myosin isoform gene switching in adult
skeletal muscle. Biochem Soc Trans 19: 368-373, 1991.
130. Gomez MA, Woo SL, Amiel D, Harwood F, Kitabayashi L, and Matyas JR. The effects
of increased tension on medial collateral ligaments. Am J Sports Med 19: 347-354,
1991.
131. Goodwill AM, Pearce AJ, and J KD. Corticomotor plasticity following unilateral
strength training. Muscle Nerve 46: 384-393, 2012.
132. Gravare Silbernagel K, Vicenzio BT, Rathleff MS, and Thorborg K. Isometric exercise
for acute pain relief: is it relevant in tendinopathy management? Br J Sports Med 53:
1330-1331, 2019.
133. Green LA and Gabriel DA. Anthropometrics and electromyography as predictors for
maximal voluntary isometric arm strength. J Sport Health Sci 1: 107-113, 2012.
134. Green LA, Parro JJ, and Gabriel DA. Quantifying the familiarization period for
maximal resistive exercise. Appl Physiol Nutr Metab 39: 275-281, 2014.
135. Guex K, Degache F, Gremion G, and Millet GP. Effect of hip flexion angle on
hamstring optimum length after a single set of concentric contractions. J Sports Sci 31:
1545-1552, 2013.
136. Guex K, Degache F, Morisod C, Sailly M, and Millet GP. Hamstring architectural and
functional adaptations following long vs. short muscle length eccentric training. Front
Physiol 7: 1-9, 2016.
137. Habets B and van Cingel REH. Eccentric exercise training in chronic mid-portion
Achilles tendinopathy: A systematic review on different protocols. Scandinavian
Journal of Medicine and Science in Sports 25: 3-15, 2015.
138. Haff GG, Carlock JM, Hartman MJ, Kilgore JL, Kawamori N, Jackson JR, Morris RT,
Sands WA, and Stone MH. Force-time curve characteristics of dynamic and isometric
muscle actions of elite women olympic weightlifters. J Strength Cond Res 19: 741-748,
2005.
References
202
139. Hahn D, Olvermann M, Richtberg J, Seiberl W, and Schwirtz A. Knee and ankle joint
torque-angle relationships of multi-joint leg extension. J Biomech 44: 2059-2065, 2011.
140. Hasler EM, Denoth J, Stacoff A, and Herzog W. Influence of hip and knee joint angles
on excitation of knee extensor muscles. Electromyogr Clin Neurophysiol 34: 355-361,
1994.
141. Heinemeier KM, Olesen JL, Haddad F, Langberg H, Kjaer M, Baldwin KM, and
Schjerling P. Expression of collagen and related growth factors in rat tendon and
skeletal muscle in response to specific contraction types. J Physiol 582: 1303-1316,
2007.
142. Heinemeier KM, Olesen JL, Schjerling P, Haddad F, Langberg H, Baldwin KM, and
Kjaer M. Short-term strength training and the expression of myostatin and IGF-1
isoforms in rat muscle and tendon: Differential effects of specific contraction types. J
Appl Physiol 102: 573-581, 2007.
143. Herda TJ, Costa PB, Walter AA, Ryan ED, and Cramer JT. The time course of the
effects of constant‐angle and constant‐torque stretching on the muscle–tendon unit.
Scand J Med Sci Sports 24: 62-67, 2012.
144. Herzog W, Duvall M, and Leonard TR. Molecular mechanisms of muscle force
regulation: A role for titin? Exerc Sport Sci Rev 40: 50-57, 2012.
145. Herzog W, Schappacher G, DuVall M, Leonard TR, and Herzog JA. Residual force
enhancements following eccentric contractions: A new mechanism involving titin.
Physiology 31: 300-312, 2016.
146. Hisaeda H, Shinohara M, Kouzaki M, and Fuckunaga T. Effect of local blood
circulation and absolute torque on muscle endurance at two different knee-joint angles
in humans. Eur J Appl Physiol 86: 17-23, 2001.
147. Hoffman BW, Lichtwark GA, Carroll TJ, and Cresswell AG. A comparison of two Hill-
type skeletal muscle models on the construction of medial gastrocnemius length-tension
curves in humans in vivo. J Appl Physiol 113: 90-96, 2012.
148. Holm L, Rahbek SK, Farup J, Vendelbo MH, and Vissing K. Contraction mode and
whey protein intake affect the synthesis rate of intramuscular connective tissue. Muscle
Nerve 55: 128-130, 2017.
149. Hopkins WG. Measures of reliability in sports medicine and science. Sports Med 30:
1-15, 2000.
150. Hopkins WG. Spreadsheets for analysis of validity and reliability. Sportscience 19: 36-
44, 2015.

References
203
151. Hopkins WG. Magnitude-based decisions. Sportscience 23, 2019.
152. Hopkins WG, Marshall SW, Batterham AM, and Hanin J. Progressive statistics for
studies in sports medicine and exercise science. Med Sci Sports Exerc 41: 2009, 2009.
153. Horowits R. Passive force generation and titin isoforms in mammalian skeletal muscle.
Biophys J 61: 392-396, 1992.
154. Hubal MJ, Rubinstein SR, and Clarkson PM. Mechanisms of variability in strength loss
after muscle-lengthening actions. Med Sci Sports Exerc 39: 461-468, 2007.
155. Huijing PA. Muscular force transmission: A unified, dual or multiple system? A review
and some explorative experimental results. Arch Physiol Biochem 107: 292-311, 1999.
156. Huijing PA. Epimuscular myofascial force transmission: A historical review and
implications for new research. J Biomech 42: 9-21, 2009.
157. Hunter SK, Ryan DL, Ortega JD, and Enoka RM. Task differences with the same load
torque alter the endurance time of submaximal fatiguing contractions in humans. J
Neurophysiol 88: 3087-3096, 2002.
158. Hyldahl RD, Nelson B, Xin L, Welling T, Groscot L, Hubal MJ, and Parcell AC.
Extracellular matrix remodeling and its contribution to protective adaptation following
lengthening contractions in human muscle. FASEB J 29: 2894-2904, 2015.
159. Jakobsen JR, Mackey AL, Knudsen AB, Koch M, Kjaer M, and Krogsgaard MR.
Composition and adaptation of human myotendinous junction and neighboring muscle
fibers to heavy resistance training. Scand J Med Sci Sports 27: 1547-1559, 2017.
160. James LP, Haff GG, Kelly VG, Connick MJ, Hoffman BW, and Beckman EM. The
impact of strength level on adaptations to combined weightlifting, plyometric, and
ballistic training. Scand J Med Sci Sports 28: 1494-1505, 2018.
161. Jenkins NDM, Maramonti AA, Hill EC, Smith CM, Cochrane-Snyman KC, Housh TJ,
and Cramer JT. Greater neural adaptations following high- vs. low-load resistance
training. Front Physiol 8: 1-15, 2017.
162. Joumaa V, Rassier DE, Leonard TR, and Herzog W. The origin of passive force
enhancement in skeletal muscle. Am J Physiol 294: C74-78, 2008.
163. Kanda K, Sakuma J, Akimoto T, Kawakami Y, and Suzuki K. Detection of titin
fragments in urine in response to exercise-induced muscle damage. PLoS One 12:
e0181623, 2017.
164. Kanehisa H, Nagareda H, Kawakami Y, Akima H, Masani K, Kouzaki M, and
Fukunaga T. Effect of equivolume isometric training programs comprising medium or
high resistance on muscle size and strength. Eur J Appl Physiol 87: 112-119, 2002.

References
204
165. Kannus P and Yasuda K. Value of isokinetic angle-specific torque measurements in
normal and injured knees. Med Sci Sports Exerc 24: 292-297, 1992.
166. Kasemkijwattana C, Menetrey J, Bosch P, Somogyi G, Moreland MS, Fu FH,
Buranapanitkit B, Watkins SS, and Huard J. Use of growth factors to improve muscle
healing after strain injury. Clin Orthop Relat Res 370: 272-285, 2000.
167. Kerr JP, Ward CW, and Bloch RJ. Dysferlin at transverse tubules regulates Ca2+
homeostasis in skeletal muscle. Front Physiol 5: 1-5, 2014.
168. Khamoui AV, Brown LE, Nguyen D, Uribe BP, Coburn JW, Noffal GJ, and Tran T.
Relationship between force-time and velocity-time characteristics of dynamic and
isometric muscle actions. J Strength Cond Res 25: 198-204, 2011.
169. Khouw W and Herbert R. Optimisation of isometric strength training intensity. Aust J
Phys Ther 44: 43-46, 1998.
170. Kim DH, Lee JH, Yu SM, and An CM. The effect of ankle position on torque and
muscle activity of the knee extensor during maximal isometric contraction. J Sport
Rehabil 29: 37-42, 2020.
171. Kjaer M. Role of extracellular matrix in adaptation of tendon and skeletal muscle to
mechanical loading. Physiol Rev 84: 649-698, 2004.
172. Kjaer M and Heinemeier KM. Eccentric exercise: Acute and chronic effects on healthy
and diseased tendons. J Appl Physiol 116: 1435-1438, 2014.
173. Koh TJ and Pizza FX. Do inflammatory cells influence skeletal muscle hypertrophy?
Front Biosci 1: 60-71, 2009.
174. Kongsgaard M, Kovanen V, Aagaard P, Doessing S, Hansen P, Laursen AH, Kaldau
NC, Kjaer M, and Magnusson SP. Corticosteroid injections, eccentric decline squat
training and heavy slow resistance training in patellar tendinopathy. Scand J Med Sci
Sports 19: 790-802, 2009.
175. Kongsgaard M, Reitelseder S, Pederson TG, Holm L, Aagaard P, Kjaer M, and
Magnusson SP. Region specific patellar tendon hypertrophy in humans following
resistance training. Acta Physiol Scand 191: 111-121, 2007.
176. Koral J, Oranchuk DJ, Wrightson JG, Twomey R, and Millet GY. Mechanisms of
neuromuscular fatigue and recovery in unilateral versus bilateral maximal voluntary
contractions. J Appl Physiol 128: 785-794, 2020.
177. Kordi M, Folland J, Goodall S, Haralabidis N, Maden-Wilkinson T, Sarika PT, Leeder
J, Barratt P, and Howatson G. Mechanical and morphological determinants of peak
power output in elite cyclists. Scand J Med Sci Sports 30: 227-237, 2020.
References
205
178. Kraemer WJ, Duncan ND, and Volek JS. Resistance training and elite athletes:
Adaptations and program considerations. J Orthop Sports Phys Ther 28: 110-119, 1998.
179. Kraemer WJ and Ratamess NA. Fundamentals of resistance training: Progression and
exercise prescription. Med Sci Sports Exerc 36: 674-688, 2004.
180. Kraemer WJ, Ratamess NA, and French DN. Resistance training for health and
performance. Curr Sports Med Rep 1: 165-171, 2002.
181. Krafft FC, Sterrer BJ, Stein T, Ellermann A, Flechtenmarcher J, Eberle C, Sell S, and
Potthast W. How does functionality proceed in ACL reconstructed subjects?
Proceeding of functional performance from pre- to six months post-ACL
reconstruction. PLoS One 12: e0178430, 2017.
182. Krebs DE, Staples WH, Cuttita D, and Zickel RE. Knee joint angle: Its relationship to
quadriceps femoris activity in normal and postarthotomy limbs. Arch Phys Med Rehabil
64: 441-447, 1983.
183. Kubo J, Chishaki T, Nakamura N, Muramatsu T, Yamamoto Y, Ito M, Saitou H, and
Kukidome T. Differences in fat-free mass and muscle thickness at various sites
according to performance level amoung judo athletes. J Strength Cond Res 20: 654-
657, 2006.
184. Kubo K, Ishigaki T, and Ikebukuro T. Effects of plyometric and isometric training on
muscle and tendon stiffness in vivo. Physiol Rep 5: 1-13, 2017.
185. Kubo K, Kanehisa H, and Fukunaga T. Effects of different duration isometric
contractions on tendon elasticity in human quadriceps muscles. J Physiol 536: 649-655,
2001.
186. Kubo K, Morimoto M, Komuro T, Tsunoda N, Kanehisa H, and Fukunaga T. Influences
of tendon stiffness, joint stiffness, and electromyographic activity on jump
performances using single joint. Eur J Appl Physiol 99: 235-243, 2007.
187. Kubo K, Morimoto M, Komuro T, Yata H, Tsunoda N, Kanehisa H, and Fukunaga T.
Effects of plyometric and weight training on muscle-tendon complex and jump
performance. Med Sci Sports Exerc 39: 1801-1810, 2007.
188. Kubo K, Ohgo K, Takeishi R, Yoshinaga K, Tsunoda N, Kanehisa H, and Fukunaga T.
Effects of isometric training at different knee angles on the muscle–tendon complex in
vivo. Scand J Med Sci Sports 16: 159-167, 2006.
189. Kubo K, Yata H, Kanehisa H, and Fukunaga T. Effects of isometric squat training on
the tendon stiffness and jump performance. Eur J Appl Physiol 96: 305-314, 2006.

References
206
190. Kumagi A, Abe T, Brechue WF, Ryushi T, Takano S, and Mizuno M. Sprint
performance is related to muscle fascicle length in male 100-m sprinters. J Appl Physiol
88: 811-816, 2000.
191. Kwah LK, Pinto RZ, Diong J, and Herbert RD. Reliability and validity of ultrasound
measurements of muscle fascicle length and pennation in humans: a systematic review.
J Appl Physiol 114: 761-769, 2013.
192. Lakens D. Calculating and reporting effect sizes to facilitate cumulative science: A
practical primer for t-tests and ANOVAs. Frontiers in Psychology 4: 1-12, 2013.
193. Langberg H, Ellingsgaard H, Madsen T, Jansson J, Magnusson S, Aagaard P, and Kjaer
M. Eccentric rehabilitation exercise increases peritendinous type I collagen synthesis
in humans with Achilles tendinosis. Scand J Med Sci Sports 17: 61-66, 2006.
194. Lanza MB, Balshaw TG, and Folland JP. Do changes in neuromuscular activation
contribute to the knee extensor angle-torque relationship? Experimental Physiology
102: 962-973, 2017.
195. Lanza MB, Balshaw TG, and Folland JP. Explosive strength: Effect of knee-joint angle
on functional, neural, and intrinsic contractile properties. Eur J Appl Physiol 119: 1735-
1746, 2019.
196. Lasevicius T, Ugrinowitsch C, Schoenfeld BJ, Roschel H, Tavares LD, De Souza EO,
Laurentino G, and Tricoli V. Effects of different intensities of resistance training with
equated volume load on muscle strength and hypertrophy. Eur J Sport Sci 18: 772-780,
2018.
197. Lauber B, Lichtwark GA, and Cresswell AG. Reciprocal activation of gastrocnemius
and soleus motor units is associated with fascicle length change during knee flexion.
Physiol Rep 2: e12044, 2014.
198. Leary BK, Statler J, Hopkins B, Fitzwater R, Kesling T, Lyon J, Phillips B, Bryner RW,
Cormie P, and Haff GG. The relationship between isometric force-time curve
characteristics and club head speed in recreational golfers. J Strength Cond Res 26:
2685-2697, 2012.
199. Lee B and McGill SM. Effect of long-term isometric training on core/torso stiffness. J
Strength Cond Res 29: 1515-1526, 2015.
200. Lee H-D and Herzog W. Force enhancement following muscle stretch of electrically
stimulated and voluntarily activated human adductor pollicis. J Physiol 545: 321-330,
2002.

References
207
201. Lenetsky S, Brughelli M, Nates RJ, Cross MR, and Lormier AV. Validity and reliability
of punching impact kinetics in untrained participants and experienced boxers. J
Strength Cond Res 32: 1838-1842, 2018.
202. Leonard TR and Herzog W. Regulation of muscle force in the absence of actin-myosin-
based cross-bridge interaction. American Journal of Physiology Cell Physiology 299:
C14-C20, 2010.
203. Liberati A, Altman DG, Tetzalaff J, Mulrow C, Gotzshche PC, Ioannidis JP, Clarke M,
Devereaux PJ, Kleijnen J, and Moher D. The PRISMA statement for reporting
systematic reviews and meta-analyses of studies that evaluate health care interventions:
Explanation and elaboration. PLoS Med 6, 2009.
204. Lie SH, Yang RS, Al-Shiakh R, and Lane JM. Collagen in tendon, ligament, and bone
healing: A current review. Clin Orthop Relat Res 318: 265-278, 1995.
205. Lindh M. Increase of muscle strength from isometric quadriceps exercises at different
knee angles. Scand J Rehabil Med 11: 33-36, 1979.
206. Lindstedt SL, LaStayo PC, and Reich TE. When active muscles lengthen: Properties
and consequences of eccentric contractions. News Physiol Sci 16: 256-261, 2001.
207. Loenneke JP and Pujol TJ. The use of occlusion training to produce muscle
hypertrophy. Strength Cond J 31: 77-84, 2009.
208. Loenneke JP, Wilson JM, Marin PJ, Zourdos MC, and Bemben MG. Low intensity
blood flow restriction training: A meta-analysis. Eur J Appl Physiol 112: 1849-1859,
2012.
209. Loturco I, Suchomel TJ, Bishop C, Kobal R, Pereira LA, and McGuigan M. One-
repetition-maximum measures or maximum bar-power output: Which is more related
to sport performance? Int J Sports Physiol Perform 14: 33-37, 2018.
210. Louis J, Billaut F, Vettoretti F, Hausswirth C, and Brisswalter J. Physiological demands
of a simulated BMX competition. Int J Sports Med 34: 491-496, 2013.
211. Lui Y, Sun Y, Zhu W, and Yu J. The late swing and early stance of sprinting are most
hazardous for hamstring injuries. J Sport Health Sci 6: 133-136, 2017.
212. MacInnis MJ, McGlory C, Gibala MJ, and Phillips SM. Investigating human skeletal
muscle physiology with unilateral exercise models: When one limb is more powerful
than two. Appl Physiol Nutr Metab 42: 563-570, 2017.
213. Maden-Wilkinson TM, Balshaw TG, Massey G, and Folland JP. What makes long-term
resistance-trained individuals so strong? A comparison of skeletal muscle morphology,
architecture, and joint mechanics. J Appl Physiol 128: 1000-1011, 2020.

References
208
214. Maeo S, Yoshitake Y, Takai Y, Fukunaga T, and Kanehisa H. Neuromuscular
adaptations following 12-week maximal voluntary co-contraction training. Eur J Appl
Physiol 114: 663-673, 2014.
215. Maffiuletti NA, Aagaard P, Blazevich AJ, Folland J, Tillin N, and Duchateau J. Rate
of force development: Physiological and methodological considerations. Eur J Appl
Physiol 116: 1091-1116, 2016.
216. Maffiuletti NA and Martin A. Progressive versus rapid rate of contraction during 7 wk
of isometric resistance training. Med Sci Sports Exerc 33: 1220-1227, 2001.
217. Magnusson PS and Kjaer M. Region-specific differences in Achilles tendon cross-
sectional area in runners and non-runners. Eur J Appl Physiol 90: 549-553, 2003.
218. Magnusson PS and Kjaer M. The impact of loading, unloading, ageing and injury on
the human tendon. J Physiol 597: 1283-1298, 2019.
219. Malliaras P, Kamal B, Nowell A, Farley T, Dhamu H, Simpson V, Morrissey D,
Langberg H, Maffulli N, and Reeves ND. Patellar tendon adaptation in relation to load-
intensity and contraction type. J Biomech 46: 1893-1899, 2013.
220. Mangine GT, Hoffman JR, Wang R, Gonzalez AM, Townsend JR, Wells AJ, Jajtner
AR, Beyer KS, Boone CH, Miramonti AA, LaMonica MB, Fukuda DH, Ratamess NA,
and Stout JR. Resistance training intensity and volume affect changes in rate of force
development in resistance-trained men. Eur J Appl Physiol 116: 2367-2374, 2016.
221. Mangine GT, Redd MJ, Gonzalez AM, Townsend JR, Wells AJ, Jajtner AR, Beyer KS,
Boone CH, La Monica MB, Stout JR, Fukuda DH, Ratamess NA, and Hoffman JR.
Resistance training does not induce uniform adaptations to quadriceps. PLoS One 13:
e0198304, 2018.
222. Mass DP, Tuel RJ, Labarbera M, and Greenwold DP. Effects of constant mechanical
tension on the healing of rabbit flexor tendons. Clin Orthop Relat Res 296: 301-306,
1993.
223. Mass H and Sandercock TG. Force transmission between synergistic skeletal muscles
through connective tissue linkages. J Biomed Biotechnol 2010: 9, 2010.
224. Massey CD, Vincent J, Maneval M, Moore M, and Johnson JT. An analysis of full
range of motion vs. partial range of motion training in the development of strength in
untrained men. J Strength Cond Res 18: 518-521, 2004.
225. Massey G, Balshaw T, Maden-Wilkinson T, Tillin N, and Folland J. Tendinous tissue
adaptation to explosive- vs. sustained-contraction strength training. Front Physiol 9: 1-
17, 2018.

References
209
226. McGuigan MR, Newton MJ, Winchester JB, and Nelson AG. Relationship between
isometric and dynamic strength in recreationally trained men. J Strength Cond Res 24:
2570-2573, 2010.
227. McHugh M, Connolly DAJ, Eston RG, and Gleim GW. Exercise-induced muscle
damage and the potential mechanisms for the repeated bout effect. Sports Med 27: 157-
170, 1999.
228. McMahon GE, Morse CI, Burden A, Winwood K, and Onambele GL. Impact of range
of motion during ecologically valid resistance training protocols on muscle size,
subcutaneous fat, and strength. J Strength Cond Res 28: 245-255, 2014.
229. McNeil CJ, Allen MD, Olympico E, Shoemaker JK, and Rice CL. Blood flow and
muscle oxygenation during low, moderate, and maximal sustained isometric
contractions. Am J Physiol 309: R475-R481, 2015.
230. Menkes DL and Pierce R. Needle EMG muscle identification: A systematic approach
to needle EMG examination. Clin Neurophysiol Pract 4: 199-211, 2019.
231. Meyers CR. Effects of two isometric routines on strength, size, and endurance in
exercised and nonexercised arms. Res Q Exerc Sport 38: 430-440, 1967.
232. Miller JD, Lippman JD, Trevino MA, and Herda TJ. Neural drive is greater for a high-
intensity contraction than for moderate-intensity contractions performed to failure. J
Strength Cond Res 34: 3013-3021, 2020.
233. Mitchell CJ, Churchward-Venne TA, Parise G, Bellamy L, Baker SK, Smith K,
Atherton PJ, and Phillips SM. Acute post-exercise myofibrillar protein synthesis is not
correlated with resistance training-induced muscle hypertrophy in young men. PLoS
One 9: e89431, 2014.
234. Molina R and Denadai BS. Dissociated time course recovery between rate of force
development and peak torque after eccentric exercise. Clin Physiol Funct Imaging 32:
179-184, 2012.
235. Moore DR, Phillips SM, Babraj JA, Smith K, and Rennie MJ. Myofibrillar and collagen
protein synthesis in human skeletal muscle in young men after maximal shortening and
lengthening contractions. American Journal of Physiology Endocrinology and
Metabolism 288: E1153-E1159, 2005.
236. Moore DR, Young M, and Phillips SM. Similar increases in muscle size and strength
in young men after training with maximal shortening or lengthening contractions when
matched for total work. Eur J Appl Physiol 112: 1587-1592, 2012.

References
210
237. Moritani T, Sherman WM, Shibata M, Matsumoto T, and Shinohara M. Oxygen
availability and motor unit activity in humans. Eur J Appl Physiol Occup Physiol 64:
552-556, 1986.
238. Morrison N. QI: The Russian training secret. Testosterone Nation, 2016.
239. Morton SK, Whitehead JR, Brinkert RH, and Caine DJ. Resistance training vs. static
stretching: Effects on flexibility and strength. J Strength Cond Res 25: 3391-3398,
2011.
240. Mota JA and Stock MS. Rectus femoris echo intensity correlates with muscle strength,
but not endurance, in younger and older men. Ultrasound Med Biol 43: 1651-1657,
2017.
241. Muraoka T, Muramatsu T, Fukunaga T, and Kanehisa H. Influence of tendon slack on
electromechanical delay in the human medial gastrocnemius in vivo. J Appl Physiol 96:
540-544, 2004.
242. Murphy AJ, Wilson G, Pryor JF, and Newton RU. Isometric assessment of muscular
function: The effect of joint angle. J Appl Biomech 11: 205-215, 1995.
243. Murphy AJ and Wilson GJ. Poor correlations between isometric tests and dynamic
performance: Relationship to muscle activation. Eur J Appl Physiol 77: 353-357, 1996.
244. Nalbandian M and Takeda M. Lactate as a signaling molecule that regulates exercise-
induced adaptations. Biology 5: E38, 2016.
245. Nardone A, Romano C, and Schieppati M. Selective recruitment of high-threshold
human motor units during voluntary isotonic lengthening of active muscles. Journal of
Physiology 409: 451-471, 1989.
246. Nardone A, Romanò C, and Schieppati M. Selective recruitment of high-threshold
human motor units during voluntary isotonic lengthening of active muscles. The
Journal of Physiology 409: 451-471, 1989.
247. Nasirzade A, Ehsanbakhsh A, Ilbeygi S, Sobhkhiz A, Argavani H, and Aliakbari M.
Relationship between sprint performance of front crawl swimming and muscle fascicle
length in young swimmers. Journal of Sports Science and Medicine 13: 550-556, 2014.
248. Nieboer M and Stockwell B. Examining the effects of corrective exercise on
neuromuscular function and joint laxity in the knee. Presented at International Journal
of Exercise Science, 2015.
249. Nigg BM and Herzog W. Biomechanics of the Musculo-skeletal System. Wiley, 2007.
250. Noorkoiv M, Nosaka K, and Blazevich AJ. Neuromuscular adaptations associated with
knee joint angle-specific force change. Med Sci Sports Exerc 46: 1525-1537, 2014.

References
211
251. Noorkoiv M, Nosaka K, and Blazevich AJ. Effects of isometric quadriceps strength
training at different muscle lengths on dynamic torque production. J Sports Sci 33:
1952-1961, 2015.
252. Noorkoiv M, Stavnsbo P, Aagaard P, and Blazevich A. In vivo assessment of muscle
fascicle length by extended field-of-view ultrasonography. J Appl Physiol 109: 1974-
1979, 2010.
253. Nosaka K, Newton M, and Sacco P. Muscle damage and soreness after endurance
exercise of the elbow flexors. Med Sci Sports Exerc 34: 920-927, 2002.
254. Nuzzo JL, Finn HT, and Herbert RD. Causal mediation analysis could resolve whether
training-induced increases in muscle strength and mediated by muscle hypertrophy.
Sports Med 49: 1309-1315, 2019.
255. O'Shea KL and O'Shea JP. Functional isometric weight training: Its effects on dynamic
and static strength. J Appl Sport Sci Res 3: 30-33, 1989.
256. O'Shea P, O'Shea K, and Wynn B. Functional isometric lifting- Part I: Theory. Natl Str
Cond Assoc J 9: 44-51, 1987.
257. O'Shea P, O'Shea K, and Wynn B. Functional isometric lifting-Part II: Application. Natl
Str Cond Assoc J 10: 60-62, 1988.
258. Ofori E, Shim J, and Sosnoff JJ. The influence of lower leg configurations on muscle
force variability. J Biomech 71: 111-118, 2018.
259. Oranchuk DJ, Diewald SN, McGrath JW, Nelson AR, Storey AG, and Cronin JB.
Kinetic and kinematic profile of eccentric quasi-isometric loading. Sports Biomech
Ahead of print, 2021.
260. Oranchuk DJ, Hopkins WG, Nelson AR, Storey AG, and Cronin JB. The effect of
regional quadriceps anatomical parameters on angle-specific isometric torque
expression. Appl Physiol Nutr Metab 46: 368-378, 2021.
261. Oranchuk DJ, Koral J, da Mota GR, Wrightson J, Soares R, Twomey R, and Millet GY.
Effect of blood flow occlusion on neuromuscular fatigue following sustained maximal
isometric contraction. Appl Physiol Nutr Metab 45: 698-706, 2020.
262. Oranchuk DJ, Nelson AR, Storey AG, and Cronin JB. Scientific basis of eccentric
quasi-isometric resistance training: A narrative review. J Strength Cond Res 33: 2846-
2859, 2019.
263. Oranchuk DJ, Nelson AR, Storey AG, and Cronin JB. Variability of regional
quadriceps architecture in trained men assessed by B-mode and extended-field-of-view
ultrasonography. Int J Sports Physiol Perform 15: 430-436, 2020.

References
212
264. Oranchuk DJ, Nelson AR, Storey AG, Diewald SN, and Cronin JB. Short-term
neuromuscular, morphological, and architectural responses to eccentric quasi-isometric
muscle actions. Eur J Appl Physiol 121: 141-158, 2021.
265. Oranchuk DJ, Neville JG, Nelson AR, Storey AG, and Cronin JB. Variability of
concentric angle-specific isokinetic torque and impulse assessments of the knee
extensors. Physiol Meas 41: 01NT02, 2020.
266. Oranchuk DJ, Robinson TL, Switaj ZJ, and Drinkwater EJ. Comparison of the hang
high-pull and loaded jump squat for the development of vertical jump and isometric
force-time characteristics. J Strength Cond Res 33: 17-24, 2019.
267. Oranchuk DJ, Stock MS, Nelson AR, Storey AG, and Cronin JB. Variability of regional
quadriceps echo intensity in active young men with and without subcutaneous fat
correction. Appl Physiol Nutr Metab 45: 745-752, 2020.
268. Oranchuk DJ, Storey AG, Nelson AR, and Cronin JB. Isometric training and long-term
adaptations; effects of muscle length, intensity and intent: A systematic review. Scand
J Med Sci Sports 29: 484-503, 2019.
269. Oranchuk DJ, Storey AG, Nelson AR, Neville JG, and Cronin JB. Variability of
multiangle isometric force-time characteristics in trained men. J Strength Cond Res
Ahead of print, 2019.
270. Paddon-Jones D, Leveritt M, Lonergan A, and Abernethy P. Adaptation to chronic
eccentric exercise in humans: The influence of contraction velocity. Eur J Appl Physiol
85: 466-471, 2001.
271. Palmer TB, Pineda JG, and Durham RM. Effects of knee position on the reliability and
production of maximal and rapid strength characteristics during an isometric squat test.
J Appl Biomech 34: 111-117, 2018.
272. Pamboris GM, Noorkoiv M, Baltzopoulos V, and Mohagheghi A. Dynamic stretching
is not detrimental to neuromechanical and sensorimotor performance of ankle
plantarflexors. Scand J Med Sci Sports 29: 200-212, 2019.
273. Pascoe MA, Holmes MR, Stuart DG, and Enoka RM. Discharge characteristics of
motor units during long-duration contractions. Exp Physiol 99: 1387-1398, 2014.
274. Pataky TC, Vanrenterghem J, and Robinson MA. The probability of false positives in
zero-dimensional analyses of one-dimensional kinematic, force and EMG trajectories.
J Biomech 49: 1468-1476, 2016.

References
213
275. Penailillo L, Blazevich A, Numazawa H, and Nosaka K. Metabolic and muscle damage
profiles of concentric versus repeated eccentric cycling. Med Sci Sports Exerc 45: 1773-
1781, 2013.
276. Penailillo L, Blazevich A, Numazawa H, and Nosaka K. Rate of force development as
a measure of muscle damage. Scand J Med Sci Sports 25: 417-427, 2015.
277. Perez-Gomez J, Redrigeuz GV, Ara I, Olmedillas H, Chavarren J, Gonzalez-Henriquez
JJ, Dorado C, and Calbet JAL. Role of muscle mass on sprint performance: gender
differences? Eur J Appl Physiol 102: 685-694, 2008.
278. Philippou A, Borgdanis GC, Nevill AM, and Maridaki M. Changes in the angle-force
curve of human elbow flexors following eccentric and isometric exercise. Eur J Appl
Physiol 93: 237-244, 2004.
279. Philippou A, Maridaki M, and Bogdanis GC. Angle-specific impairment of elbow
flexors strength after isometric exercise at long muscle length. J Sports Sci 21: 859-
865, 2003.
280. Philippou A, Maridaki M, Bogdanis GC, Halapas A, and Koutsilieris M. Changes in
the mechanical properties of human quadriceps muscle after eccentric exercise In Vivo
23: 859-865, 2009.
281. Pierce JR, Clark BC, Ploutz-Snyder LL, and Kanaley JA. Growth hormone and muscle
function responses to skeletal muscle ischemia. J Appl Physiol 101: 1588-1595, 2006.
282. Pillen S, Tak RO, Zwarts MJ, Lammens MM, Verrijp KN, Arts IM, van der Laak JA,
Hoogerbrugge PM, van Engelen BG, and Verrips A. Skeletal muscle ultrasound:
correlation between fibrous tissue and echo intensity. Ultrasound Med Biol 35: 443-
446, 2009.
283. Power GA, Rice CL, and Vandervoort AA. Increased residual force enhancement in
older adults is associated with a maintenance of eccentric strength. PLoS One 7, 2012.
284. Powers K, Schappacher-Tilp G, Jinha A, Leonard T, Nishikawa K, and Herzog W.
Titan force in enhanced in actively stretched skeletal muscle. J Exp Biol 214: 3629-
3636, 2014.
285. Prescott RJ. Editorial: Avoid being tripped up by statistics: Statistical guidance for a
successful research paper. Gait Posture 72: 240-249, 2019.
286. Purslow PP. Muscle fascia and force transmission. J Bodyw Mov Ther 14: 411-417,
2010.

References
214
287. Radaelli R, Bottaro M, Wilhelm EN, Wagner DR, and Pinto RS. Time course of
strength and echo intensity recovery after resistance exercise in women. J Strength
Cond Res 26: 2577-2584, 2012.
288. Rahmani A, Viale F, Dalleau G, and Lacour JR. Force/velocity and power/velocity
relationships in squat exercise. Eur J Appl Physiol 84: 227-232, 2001.
289. Rasch PJ and Pierson WR. One position versus multiple positions in isometric exercise.
Am J Phys Med 43: 10-12, 1964.
290. Ratamess NA, Alvar BA, Evetoch TK, Housh TJ, Kibler WB, Kraemer WJ, and Triplett
NT. American College of Sports Medicine position stand. Progression models in
resistance training for healthy adults. Med Sci Sports Exerc 41: 687-708, 2009.
291. Reeves ND, Narici MV, and Maganaris CN. Strength training alters the viscoelastic
properties of tendons in elderly humans. Muscle Nerve 28: 74-81, 2003.
292. Rhea MR. Determining the magnitude of treatment effects in strength training research
through the use of the effect size. J Strength Cond Res 18: 918-920, 2004.
293. Rio E, Kidgell D, Purdam C, Gaida J, Moseley GL, Pearce AJ, and Cook J. Isometric
exercise induces analgesia and reduces inhibition in patellar tendinopathy. Br J Sports
Med 49: 1277-1283, 2015.
294. Rio E, Purdam C, Gurdwood M, and Cook J. Isometric exercise to reduce pain in
patellar tendinopathy in-season: Is it effective "on the road?". Clin J Sport Med, 2017.
295. Rio E, van Ark M, Docking S, Moseley GL, Kidgell D, Gaida JE, van den Akker-
Scheek I, Zwerver J, and Cook J. Isometric contractions are more analgesic than
isotonic contractions for patellar tendon pain: An in-season randomized clinical trial.
Clin J Sport Med 27: 253-259, 2017.
296. Roberts TJ. Contribution of elastic tissues to the mechanics and energetics of muscle
function during movement. J Exp Biol 219: 266-275, 2016.
297. Roberts TJ, Eng CM, Sleboda DA, Holt NC, Brainerd EL, Stover KK, Marsh RL, and
Azizi E. The multi-scale, three-dimensional nature of skeletal muscle contraction.
Physiology 34: 402-408, 2019.
298. Rozand V, Sundberg CW, Hunter SK, and Smith AE. Age-related deficits in voluntary
activation: A systematic review and meta-analysis. Medicine and Science in Sports and
Exercise 52: 549-560, 2020.
299. Rudroff T, Barry BK, Stone AL, Barry CJ, and Enoka RM. Accessory muscle activity
contributes to the variation in time to task failure for different arm postures and loads.
J Appl Physiol 102: 1000-1006, 2007.

References
215
300. Rudroff T, Justice JN, Holmes MR, Matthews SD, and Enoka RM. Muscle activity and
time to task failure differ with load compliance and target force for elbow flexor
muscles. J Appl Physiol 110: 125-136, 2011.
301. Rudroff T, Kalliokoski KK, Block DE, Gould JR, Klingensmith WC, and Enoka RM.
PET/CT imaging of age- and task-associated differences in muscle activity during
fatiguing contractions. J Appl Physiol 114: 1211-1219, 2013.
302. Ryan ED, Shea NW, Gerstner GR, Barnette TJ, Tweedell AJ, and Kleinberg CR. The
influence of subcutaneous fat on the relationship between body composition and
ultrasound-derived muscle quality. Appl Physiol Nutr Metab 41: 1101-1107, 2016.
303. Saito A and Akima H. Knee joint angle affects EMG–force relationship in the vastus
intermedius muscle. J Electromyogr Kinesiol 23: 1406-1412, 2013.
304. Schaefer L, Hoff M, and Bittmann F. Measuring system and method of determining the
adaptive force. European Journal of Translational Myology 27: 152-159, 2017.
305. Schaefer LV and Bittmann FN. Are there two forms of isometric muscle action? Results
of the experimental study support a distinction between a holding and a pushing
isometric muscle function. BMC Sports Sci Med Rehabil 9: 1-13, 2017.
306. Schaefer LV and Bittmann FN. Muscular pre-activation can boost the maximal
explosive eccentric adaptive force. Frontiers in Physiology 10: 1-12, 2019.
307. Schmitz RJ and Westwood KC. Knee extensor electromyographic activity-to-work
ratio is greater with isotonic than isokinetic contractions. J Athl Train 36: 384-387,
2001.
308. Schoenfeld BJ. The mechanisms of muscle hypertrophy and their application to
resistance training. J Strength Cond Res 24: 2857-2872, 2010.
309. Schoenfeld BJ. Does exercise-induced muscle damage play a role in skeletal muscle
hypertrophy? J Strength Cond Res 26: 1441-1453, 2012.
310. Schoenfeld BJ and Grgic J. Effects of range of motion on muscle development during
resistance training interventions: A systematic review. SAGE Open Medicine:
2050312120901559, 2020.
311. Schoenfeld BJ, Grgic J, Contreras B, Delcastillo K, Alto A, Haun C, De Souza EO, and
Vigotsky AD. To flex or rest: Does adding no-load isometric actions to the inter-set rest
period in resistance training enhance muscular adaptations? A randomized-control trial.
Frontiers in Physiology 10: 1-11, 2020.

References
216
312. Schoenfeld BJ, Grgic J, Ogborn D, and Krieger JW. Strength and hypertrophy
adaptations between low- versus high-load resistance training: A systematic review and
meta-analysis. J Strength Cond Res 31: 3508-3523, 2017.
313. Schoenfeld BJ, Peterson MD, Ogborn D, Contreras B, and Sonmez GT. Effects of low-
vs. high-load resistance training on muscle strength and hypertrophy in well-trained
men. J Strength Cond Res 29: 2954-2963, 2015.
314. Schott J, McCully K, and Rutherford OM. The role of metabolites in strength training:
Short versus long isometric contractions. Eur J Appl Physiol Occup Physiol 71: 337-
341, 1995.
315. Scott BR, Peiffer JJ, and Goods PSR. The Effects of Supplementary Low-Load Blood
Flow Restriction Training on Morphological and Performance-Based Adaptations in
Team Sport Athletes. J Strength Cond Res 31: 2147-2154, 2017.
316. Seedman J. Eccentric Isometrics: The ultimate way to strength train. Advanced Human
Performance.
317. Seger JY, Arvidsson B, and Thorstensson A. Specific effects of eccentric and
concentric training on muscle strength and morphology in humans. Eur J Appl Physiol
Occup Physiol 79: 49-57, 1998.
318. Seiberl W, Power GA, and Hahn D. Residual force enhancement in humans: Current
evidence and unresolved issues. J Electromyogr Kinesiol 25: 571-580, 2015.
319. Seiberl W, Power GA, Herzog W, and Hahn D. The stretch-shortening cycle (SSC)
revisited: Residual force enhancement contributes to increased performance during fast
SSCs of human m. adductor pollicis. Physiol Rep 3: e12401, 2015.
320. Semmler JG, Kornatz KW, Dinenno DV, Zhou S, and Enoka RM. Motor unit
synchronization is enhanced during slow lengthening contractions of a hand muscle. J
Physiol 545: 681-695, 2002.
321. Shalabi N, Cornachione A, de Souza Leite F, Vengallatore S, and Rassier DE. Residual
force enhancement is regulated by titin in skeletal and cardiac myofibrils. J Physiol
595: 2085-2098, 2017.
322. Sharifnezhad A, Marzilger R, and Arampatzis A. Effects of load magnitude, muscle
length and velocity during eccentric chronic loading on the longitudinal growth of the
vastus lateralis muscle. J Exp Biol 217: 2726-2733, 2014.
323. Shim J and Garner B. Residual force enhancement during voluntary contractions of
knee extensors and flexors at short and long muscle lengths. J Biomech 45: 913-918,
2012.
References
217
324. Signorile JF, Lew KM, Stoutenberg M, Pluchino A, Lewis JE, and Gao J. Range of
motion and leg rotation affect electromyography activation levels of the superficial
quadriceps muscles during leg extension. Journal of Strength and Conditioning
Research 28: 2536-2546, 2014.
325. Silva HR, Couto BP, and Szmuchrowski LA. Effects of mechanical vibration applied
in the opposite direction of muscle shortening on maximal isometric strength. J Strength
Cond Res 22: 1031-1036, 2008.
326. Simpson CL, Kim BDH, Bourcet MR, Jones GR, and Jakobi JM. Stretch training
induces unequal adaptation in muscle fascicles and thickness in medial and lateral
gastrocnemii. Scand J Med Sci Sports 27: 1597-1604, 2017.
327. Sjogaard G, Savard G, and Carsten J. Muscle blood flow during isometric activity and
its relation to muscle fatigue. Eur J Appl Physiol Occup Physiol 57: 327-335, 1988.
328. Smith TB and Hopkins WG. Variability and predictability of finals times of elite
rowers. Med Sci Sports Exerc 43: 2155-2160, 2011.
329. Smith TO, Bowyer D, Dixon J, Stephenson R, Chester R, and Donell ST. Can vastus
medialis oblique be preferentially activated? A systematic review of electromyographic
studies. Physiother Theory Pract 25: 69-98, 2009.
330. Sonkodi B, Berkes I, and Koltai E. Have we looked in the wrong direction for more
than 100 years? Delayed onset muscle soreness is, in fact, neural microdamage rather
than muscle damage. Antioxidants 9: 212, 2020.
331. Sorensen JR, Skousen C, Holland A, Williams K, and Hyldahl RD. Acute extracellular
matrix, inflammatory and MAPK response to lengthening contractions in elderly
human skeletal muscle. Exp Gerontol 106: 28-38, 2018.
332. Sosnoff JJ, Voudrie SJ, and Ebersole KT. The effect of knee joint angle on torque
control. J Motor Behav 42: 5-10, 2010.
333. Spurway NC. Hiking physiology and the "quasi-isometric" concept. J Sports Sci 25:
1081-1093, 2007.
334. Stegeman DF, Kleine BU, Lapatki BG, and Van Dijk JP. High-density surface EMG:
Techniques and applications at a motor unit level. Biocybern Biomed Eng 32: 3-27,
2012.
335. Sterling DR. Isometric strength position specificity resulting from isometric and
isotonic training as a determinant in performance. Eugene, Ore: University of Oregon,
1969.

References
218
336. Stock MS, Mota JA, Hernandez JM, and Thompson BJ. Echo intensity and muscle
thickness as predictors of athleticism and isometric strength in middle-school boys.
Muscle Nerve 55: 685-692, 2017.
337. Stock MS, Oranchuk DJ, Burton AM, and Phan DC. Age-, sex-, and region-specific
differences in skeletal muscle size and quality. Appl Physiol Nutr Metab 45: 1253-1260,
2020.
338. Stock MS, Whitson M, Burton AM, Dawson NT, Sobolewski EJ, and Thompson BJ.
Echo intensity versus muscle function correlations in older adults are influenced by
subcutaneous fat thickness. Ultrasound Med Biol 44: 1597-1605, 2018.
339. Storey A and Smith HK. Unique aspects of competitive weightlifting: Performance,
training and physiology. Sports Med 42: 769-790, 2012.
340. Stoter IK, MachIntosh BR, Fletcher JR, Pootz S, Zijdewing I, and Hettinga FJ. Pacing
strategy, muscle fatigue, and technique in 1500-m speed-skating and cycling time trials.
Int J Sports Physiol Perform 11: 337-343, 2016.
341. Subramanian A and Schilling TF. Tendon development and musculoskeletal assembly:
emerging roles for the extracellular matrix. Development 142: 4191-4204, 2015.
342. Suchomel TJ, Nimphius S, Bellon CR, and Stone MH. The importance of muscular
strength: Training considerations. Sports Med 48: 765-785, 2018.
343. Suter E and Herzog W. Extent of muscle inhibition as a function of knee angle. J
Electromyogr Kinesiol 7: 123-130, 1997.
344. Szeto G, Strauss GR, De Domenico G, and Sun Lai H. The effect of training intensity
on voluntary isometric strength improvement. Aust J Phys Ther 34: 210-217, 1989.
345. Tabary JC, Tabary C, Tardieu C, Tardieu G, and Goldspink G. Physiological and
structural changes in the cat's soleus muscle due to immobilization at different lengths
by plaster casts. J Physiol 224: 231-244, 1972.
346. Tabuchi A, Eshima H, Tanaka Y, Nogami S, Inoue N, Sudo M, Okada H, Poole DC,
and Kano Y. Regional differences in Ca2+ entry along the proximal-middle-distal
muscle axis during eccentric contractions in rat skeletal muscle. J Appl Physiol 127:
828-837, 2019.
347. Takagi R, Ogasawara R, Tsutaki A, Nakazato K, and Ishii N. Regional adaptation of
collagen in skeletal muscle to repeated bouts of strenuous eccentric exercise. Pflügers
Archiv 468: 1565-1572, 2016.

References
219
348. Takarada Y, Nakamura Y, Aruga S, Onda T, Miyazaki S, and Ishii N. Rapid increase
in plasma growth hormone after low-intensity resistance exercise with vascular
occlusion. J Appl Physiol 88: 61-65, 2000.
349. Takarada Y, Takazawa H, Sato Y, Takebayaski S, Tanaka Y, and Ishii N. Effects of
resistance exercise combined with moderate vascular occlusion on muscular function
in humans. J Appl Physiol 88: 2097-2106, 2000.
350. Tanaka H and Swensen T. Impact of resistance training on endurance performance.
Sports Med 25: 191-200, 1998.
351. Tanimoto M, Kawano H, Gando Y, Sanada K, Yamamoto K, Ishii N, Tabata I, and
Miyachi M. Low-intensity resistance training with slow movement and tonic force
generation increases basal limb blood flow. Clin Physiol Funct Imaging 29: 128-135,
2009.
352. Tekus E, Vaczi M, Horvath-Szalai Z, Ludany A, Koszegi T, and Wilhelm M. Plasma
actin, gelsolin and orosomucoid levels after eccentric training. J Hum Kinet 56: 99-108,
2017.
353. Thepaut-Mathieu C, Van Hoecke J, and Maton B. Myoelectrical and mechanical
changes linked to length specificity during isometric training. J Appl Physiol 64: 1500-
1505, 1988.
354. Tillin NA and Folland JP. Maximal and explosive strength training elicit distinct
neuromuscular adaptations, specific to the training stimulus. Eur J Appl Physiol 114:
365-374, 2014.
355. Timmins RG, Shield AJ, Williams MD, and Opar DA. Is there evidence to support the
use of the angle of peak torque as a marker of hamstrings injury and re-injury risk.
Sports Med 46: 7-13, 2015.
356. Tomko PM, Muddle TW, Magrini MA, Colquhoun RJ, Luera MJ, and Jenkins ND.
Reliability and differences in quadriceps femoris muscle morphology using
ultrasonography: The effects of body position and rest time. Ultrasound 26: 214-221,
2018.
357. Topp R, Woolley S, Hornyak J, Khuder S, and Kahaleh B. The effect of dynamic versus
isometric resistance training on pain and functioning among adults with osteoarthritis
of the knee. Arch Phys Med Rehabil 83: 1187-1195, 2002.
358. Tracy BL, Byrnes WC, and Enoka RM. Strength training reduces force fluctuations
during anisometric contractions of the quadriceps femoris in old adults. J Appl Physiol
96: 1530-1540, 2004.

References
220
359. Trezise J and Blazevich AJ. Anatomical and neuromuscular determinants of strength
change in previously untrained men following heavy strength training. Front Physiol
10, 2019.
360. Trezise J, Collier N, and Blazevich AJ. Anatomical and neuromuscular variables
strongly predict maximum knee extension torque in healthy men. Eur J Appl Physiol
116: 1159-1177, 2016.
361. Tsoukos A, Bogdanis GC, Terzis G, and Veligekas P. Acute improvement of vertical
jump performance after isometric squats depends on knee angle and vertical jumping
ability. J Strength Cond Res 30: 2250-2257, 2016.
362. Ullrich B, Holzinger S, Soleimani M, Pelzer T, Stening J, and Pfeiffer M.
Neuromuscular responses to 14 weeks of traditional and daily undulating resistance
training. Int J Sports Med 36: 554-562, 2015.
363. Ullrich B, Kleinöder H, and Brüggemann G-P. Influence of length-restricted strength
training on athlete's power-load curves of knee extensors and flexors. J Strength Cond
Res 24: 668-678, 2010.
364. Ullrich B, Kleinoder H, and Bruggemann GP. Moment-angle relations after specific
exercise. Int J Sports Med 30: 293-301, 2009.
365. Valamatos MJ, Tavares F, M SR, Veloso AP, and Mil-Homens P. Influence of full
range of motion vs. equalized partial range of motion training on muscle architecture
and mechanical properties. Eur J Appl Physiol 118: 1969-1983, 2018.
366. Valera-Garrido F, Jiménez-Rubio S, Minaya-Muñoz F, Estévez-Rodríguez JL, and
Navandar A. Ultrasound-guided percutaneous needle electrolysis and rehab and
reconditioning program for rectus femoris muscle injuries: A cohort study with
professional soccer players and a 20-week follow-up. Applied Sciences 10: 7912, 2020.
367. van Beijsterveldt AMC, van de Port IGL, Vereijken AJ, and Backx FJG. Risk factors
for hamstring injuries in male soccer players: A systematic review of prospective
studies. Scand J Med Sci Sports 23: 253-262, 2013.
368. van der Zwaard S, Weide G, Levels K, Eikelboom MRI, Noordhof DA, Hofmijster MJ,
van der Laarse WJ, de Koning JJ, de Ruiter CJ, and Jaspers RT. Muscle morphology of
the vastus lateralis is strongly related to ergometer performance, sprint capacity and
endurance capacity in Olympic rowers. Journal of Sports Sciences 36: 2111-2120,
2018.

References
221
369. Van Gheluwe B, Huybrechts P, and Deporte E. Electromyographic evaluation of arm
and torso muscles for different postures in windsurfing. Int J Sport Biomech 4: 156-
165, 1988.
370. Van Hooren B and Bosch F. Is there really an eccentric action of the hamstrings during
the swing phase of high-speed running? Part 1: A critical review of the literature.
Journal of Sports Sciences 35: 2313-2321, 2017.
371. Van Hooren B and Bosch F. Is there really an eccentric action of the hamstrings during
the swing phase of high-speed running? part I: A critical review of the literature. J
Sports Sci 35: 2313-2321, 2017.
372. Van Hooren B and Bosch F. Is there really an eccentric action of the hamstrings during
the swing phase of high-speed running? part II: Implications for exercise. J Sports Sci
35: 2322-2333, 2017.
373. van Schie HT, de Vos RJ, de Jonge S, Bakker EM, Heijboer MP, Verhaar JA, Tol JL,
and Weinans H. Ultrasonographic tissue characterisation of human Achilles tendons:
quantification of tendon structure through a novel non-invasive approach. Br J Sports
Med 44: 1153-1159, 2010.
374. Varanoske AN, Coker NA, Johnson BDI, Belity T, Mangine GT, Stout JR, Fukuda DH,
and Wells AJ. Effects of rest position on morphology of the vastus lateralis and its
relationship with lower-body strength and power. Functional Morphology and
Kinesiology 4: 64, 2019.
375. Varanoske AN, Fukuda DH, Boone CH, Beyer KS, Stout JR, and Hoffman JR.
Homogeneity of echo intensity values in transverse ultrasound images. Muscle Nerve
56: 93-98, 2017.
376. Varanoske AN, Fukuda DH, Boone CH, Beyer KS, Stout JR, and Hoffman JR.
Scanning plane comparison of ultrasound-derived morphological characteristics of the
vastus lateralis. Clin Anat 30: 533-542, 2017.
377. Verkhoshansky V and Tetyna V. Speed-strength preparation of future champions.
Legkaya Athletika 2: 12-13, 1973.
378. Verkhoshansky Y and Siff MC. Supertraining. Rome, Italy: Ultimate Athlete Concepts,
2009.
379. Wakahara T, Kanehisa H, Kawakami Y, Fukunaga T, and Yanai T. Relationship
between muscle architecture and joint performance during concentric contractions in
humans. J Appl Biomech 29: 405-412, 2013.

References
222
380. Watanabe K, Kouzaki M, and Moritani T. Non-uniform surface electromyographic
responses to change in joint angle within rectus femoris muscle. Muscle Nerve 50: 794-
802, 2014.
381. Watanabe Y, Madarame H, Ogasawara R, Nakazato K, and Ishii N. Effect of very low-
intensity resistance training with slow movement on muscle size and strength in healthy
older adults. Clin Physiol Funct Imaging 34: 463-470, 2014.
382. Watanabe Y, Tanimoto M, Oba N, Kiyoshi S, Muyachi M, and Ishii N. Effect of
resistance training using bodyweight in the elderly: Comparison of resistance exercise
movement between slow and normal speed movement. Geriatr Gerontol Int 15: 1270-
1277, 2015.
383. Watanabe Y, Tanimoto M, Ohgane A, Sanada K, Miyachi M, and Ishii N. Increased
muscle size and strength from slow-movement, low-intensity resistance exercise and
tonic force generation. J Aging Phys Act 21: 71-84, 2013.
384. Watanabe Y, Yamada Y, Fukumoto Y, Ishihara T, Yokoyama K, Yoshida T, Miyake
M, Yamagata E, and Kimura M. Echo intensity obtained from ultrasonography images
reflecting muscle strength in elderly men. Clinical Interventions in Aging 8: 993-998,
2013.
385. Waugh CM, Alktebi T, De Sa A, and Scott A. Impact of rest duration on Achilles tendon
structure and function following isometric training. Scand J Med Sci Sports 28: 436-
445, 2018.
386. Weir JP. Quantifying test-retest reliability using the intraclass correlation coefficient
and the SEM. J Strength Cond Res 19: 231-240, 2005.
387. Weissgarber TL, Milic NM, Winham SJ, and Garovic VD. Beyond bar and line graphs:
Time for a new data presentation paradigm. PLoS Biol 13: e1002128, 2015.
388. West DJ, Owen NJ, Jones MR, Bracken RM, Cook CJ, Cunningham DJ, Shearer DA,
Finn CV, Newton RU, Crewther BT, and Kilduff LP. Relationships between force-time
characteristics of the isometric midthigh pull and dynamic performance in professional
rugby leage players. J Strength Cond Res 25: 3070-3075, 2011.
389. Williams DM. The study of voluntary activation and force production relationships and
responses to varied isometric strength training parameters during fatiguing and non-
fatiguing test protocols. University of Iowa, 2011, pp 181 p-181.
390. Wilson GJ and Murphy AJ. The use of isometric tests of muscular function in athletic
assessment. Sports Med 22: 19-37, 1996.

References
223
391. Winchester JB, McBride JM, Maher MA, Mikat RP, Allen BK, Kline DE, and
McGuigan MR. Eight weeks of ballistic exercise improves power independently of
changes in strength and muscle fiber type expression. J Strength Cond Res 22: 1728-
1734, 2008.
392. Yamauchi J and Koyama K. Relation between the ankle joint angle and the maximum
isometric force of the toe flexor muscles. J Biomech 85: 1-5, 2019.
393. Yeung SS and Yeung EW. Shift of peak torque angle after eccentric exercise. Int J
Sports Med 29: 251-256, 2008.
394. Yoo W-G. Effects of the slow speed-targeting squat exercise on the vastus medialis
oblique/vastus lateralis muscle ratio. J Phys Ther Sci 27: 2861-2862, 2015.
395. Young HJ, Jenkins NT, Zhao Q, and Mccully KK. Measurement of intramuscular fat
by muscle echo intensity. Muscle Nerve 52: 963-971, 2015.
396. Young K, McDonagh MJN, and Davies CTM. The effects of two forms of isometric
training on the mechanical properties of the triceps surae in man. Pflügers Archiv 405:
384-388, 1985.
397. Zabaleta-Korta A, Fernández-Peña E, and Santos-Concejero J. Regional hypertrophy,
the inhomogeneous muscle growth: A systematic review. Strength and Conditioning
Journal 42: 94-101, 2020.
398. Zbidi S, Zinoubi B, Hammouda O, Vandewalle H, Serrau V, and Driss T. Co-
contraction training, muscle explosive force and associated electromyography activity.
J Sports Med Phys Fitness 57: 725-733, 2017.
399. Zhang BT, Yeung SS, Allen DG, Qin L, and Yeung EW. Role of the calcium-calpain
pathway in cytoskeletal damage after eccentric contractions. J Appl Physiol 105: 352-
357, 2008.
400. Zimmerman SD, McCormick RJ, Vadlamudi RK, and Thomas DP. Age and training
alter collagen characteristics in fast- and slow-twitch rat limb muscle. J Appl Physiol
75: 1670-1674, 1993.

Appendices
224
Appendices
Appendix 1. Study quality scoring system
No. Item Score
1 Inclusion criteria stated 0-2
2 Random allocation of subjects to groups 0-2
3 Independent and dependent variables were clearly stated 0-2
4 Groups were tested for similarity at baseline 0-2
5 A control group was utilized 0-2
6 Interventions were volume equated 0-2
7 Assessments were practically useful 0-2
8 Intervention duration was practically useful 0-2
9 Statistical analysis was appropriate 0-2
10 Evaluation methods are valid and reliable 0-2
Adapted from Brughelli et al. (56)

Appendices
225
Appendix 2. Study quality ratings
Author N Mean age Training status Volume equated Non-exercise control QS
Alegre et al. (9) 29 19.3 Untrained Yes Yes 18/20
Bandy & Hanten (35) 107 23.9 Untrained Yes Yes 18/20
Massey et al. (225) 42 25 Untrained No Yes 18/20
Maffiuleti & Martin (216) 21 Unknown Untrained No Yes 17/20
Noorkoiv et al. (250) 16 23.7 ± 4 Untrained Yes No 17/20
Noorkoiv et al. (251) 16 23.7 ± 4 Untrained Yes No 17/20
Sterling (335)* 120 Unknown Active Yes Yes 17/20
Balshaw et al. (32) 48 Unknown Untrained No Yes 16/20
Kanesha et al. (164) 12 27.5 Untrained Yes No 16/20
Ullrich et al. (362) 10 24.4 ± 3.2 Active Yes No 16/20
Williams (389)* 23 22.8 Active No Yes 16/20
Bogdanis et al. (49) 15 21.5 ± 2.1 Active Yes No 15/20
Arampatzis et al. (21) 21 28 Untrained Yes No 14/20
Arampatzis et al. (19) 11 23.9 Untrained Yes Yes 14/20
Kubo et al. (185) 8 22.6 Untrained Yes No 14/20
Waugh et al. (385) 14 30 Active Yes No 14/20
Lindh (205) 10 26.5 Active Yes No 13/20
Meyers (231) 29 Unknown Untrained No Yes 13/20
Rasch & Pierson (289) 29 Unknown Untrained Yes No 13/20
Tillin & Folland (354) 19 20.5 Active No No 12/20
Young et al. (396) 4 20.5 Active Yes No 12/20
Khouw & Herbert (169) 51 Unknown Untrained No No 11/20
Kubo et al. (188) 9 24 ± 1 Active Yes No 11/20
Szeto et al. (344) 18 Unknown Active No No 11/20
Thepaut-Mathieu et al. (353) 24 31.8 Untrained Yes Yes 11/20
Schott et al. (314) 7 22.7 Untrained No No 10/20
QS = quality score. *Unpublished doctoral dissertation.
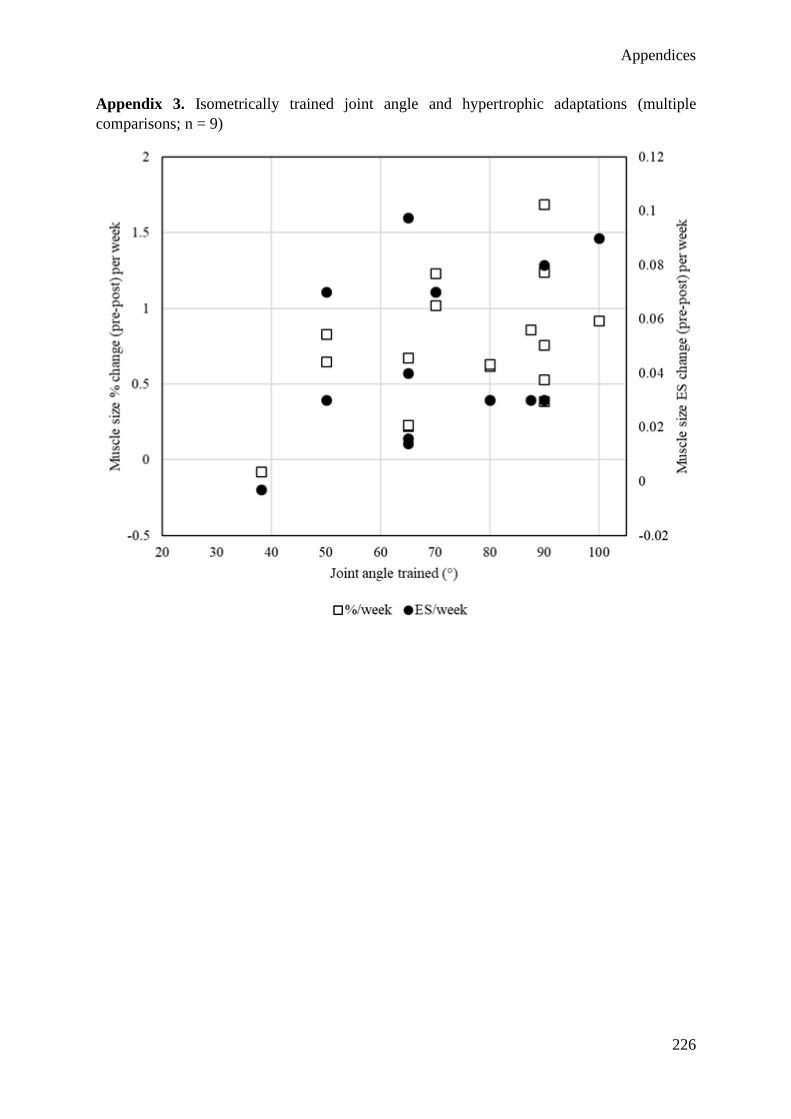
Appendices
226
Appendix 3. Isometrically trained joint angle and hypertrophic adaptations (multiple
comparisons; n = 9)

Appendices
227
Appendix 4. Isometrically trained joint angle and strength adaptations (multiple comparison.
n = 7)

Appendices
228
Appendix 5. Regional quadriceps architecture averaged over three sessions
Muscle Measurement Limb Proximal Middle Distal
Vastus lateralis MT (cm) Dominant 2.54 ± 0.36 2.81 ± 0.43 2.21 ± 0.34
Non-dominant 2.44 ± 0.33 2.74 ± 0.41 2.20 ± 0.37
PA (°) Dominant 17.1 ± 3.2 20.6 ± 2.6 22.7 ± 2.7
Non-dominant 16.3 ± 2.7 20.2 ± 2.1 22.5 ± 2.8
FL (cm) Dominant 7.73 ± 0.68 8.18 ± 0.83 7.16 ± 0.83
Non-dominant 7.70 ± 0.73 8.16 ± 0.72 7.12 ± 0.90
Rectus femoris MT (cm) Dominant 2.80 ± 0.26 2.69 ± 0.33 1.96 ± 0.30
Non-dominant 2.76 ± 0.33 2.69 ± 0.31 1.99 ± 0.31
Lateral
vastus intermedius
MT (cm) Dominant 2.02 ± 0.44 2.04 ± 0.54 1.93 ± 0.44
Non-dominant 2.01 ± 0.51 2.03 ± 0.53 1.84 ± 0.42
Anterior
vastus intermedius
MT (cm) Dominant 2.94 ± 0.46 2.24 ± 0.47 1.88 ± 0.42
Non-dominant 2.96 ± 0.47 2.36 ± 0.49 1.78 ± 0.37
MT = muscle thickness. PA = pennation angle. FL = fascicle length. Data are mean ± SD.

Appendices
229
Appendix 6. Differences in adjusted simple correlations (adjR2), with compatibility
limits and magnitude-based decisions, between normalized maximal voluntary
isometric torque and regional quadriceps measures
Joint angle Region comparison Δ adjR2 (90%CL) Decision
Vastus lateralis muscle thickness
40º Distal-Proximal 0.43 (0.06, 0.65) Moderate**
Distal-Middle 0.09 (-0.12, 0.31) Trivial
Middle-Proximal 0.35 (0.03, 0.54) Moderate**
70º Distal-Proximal 0.35 (0.04, 0.80) Moderate**
Distal-Middle 0.02 (-0.17, 0.21) Trivial
Middle-Proximal 0.32 (0.09, 0.70) Moderate**
100º Distal-Proximal 0.29 (0.00, 0.78) Small**
Distal-Middle -0.03 (-0.22, 0.17) Trivial
Middle-Proximal 0.32 (0.13, 0.68) Moderate***
Vastus lateralis pennation angle
40º Distal-Proximal 0.25 (-0.10, 0.63) Small
Distal-Middle 0.23 (-0.17, 0.60) Small
Middle-Proximal 0.02 (-0.27, 0.38) Trivial
70º Distal-Proximal 0.20 (-0.23, 0.60) Small
Distal-Middle 0.03 (-0.52, 0.50) Trivial
Middle-Proximal 0.17 (-0.18, 0.59) Small
100º Distal-Proximal 0.37 (-0.06, 0.69) Moderate**
Distal-Middle 0.22 (-0.20, 0.60) Small
Middle-Proximal 0.15 (-0.24, 0.54) Small
Vastus lateralis fascicle length
40º Distal-Proximal -0.11 (-0.56, 0.28) Small
Distal-Middle -0.13 (-0.52, 0.22) Small

Appendices
230
Middle-Proximal 0.03 (-0.28, 0.32) Trivial
70º Distal-Proximal -0.22 (-0.67, 0.10) Small
Distal-Middle -0.13 (-0.50, 0.23) Small
Middle-Proximal -0.09 (-0.45, 0.18) Trivial
100º Distal-Proximal -0.31 (-0.72, 0.01) Small**
Distal-Middle -0.09 (-0.45, 0.26) Trivial
Middle-Proximal -0.21 (-0.59, 0.08) Small*
Rectus femoris muscle thickness
40º Distal-Proximal 0.28 (-0.32, 0.67) Small
Distal-Middle -0.13 (-0.51, 0.22) Small
Middle-Proximal 0.41 (0.00, 0.62) Moderate**
70º Distal-Proximal 0.31 (-0.31, 0.65) Moderate
Distal-Middle -0.11 (-0.49, 0.23) Small
Middle-Proximal 0.41 (0.01, 0.59) Moderate**
100º Distal-Proximal 0.23 (-0.35, 0.64) Small
Distal-Middle -0.20 (-0.59, 0.15) Small
Middle-Proximal 0.43 (0.08, 0.64) Moderate**
Lateral vastus intermedius muscle thickness
40º Distal-Proximal -0.02 (-0.31, 0.21) Trivial
Distal-Middle 0.11 (-0.08, 0.32) Small*
Middle-Proximal -0.13 (-0.42, 0.10) Small*
70º Distal-Proximal 0.01 (-0.22, 0.23) Trivial
Distal-Middle 0.13 (-0.01, 0.32) Small*
Middle-Proximal -0.11 (-0.40, 0.09) Small*
100º Distal-Proximal 0.12 (-0.10, 0.40) Small*
Distal-Middle 0.15 (0.05, 0.32) Small**

Appendices
231
Middle-Proximal -0.04 (-0.26, 0.19) Trivial
Anterior vastus intermedius muscle thickness
40º Distal-Proximal 0.09 (-0.20, 0.49) Trivial
Distal-Middle 0.06 (-0.19, 0.36) Trivial
Middle-Proximal 0.03 (-0.19, 0.34) Trivial
70º Distal-Proximal 0.08 (-0.24, 0.55) Trivial
Distal-Middle 0.02 (-0.01, 0.26) Trivial
Middle-Proximal 0.06 (-0.22, 0.35) Trivial
100º Distal-Proximal 0.16 (-0.18, 0.56) Small
Distal-Middle 0.08 (-0.05, 0.36) Trivial
Middle-Proximal 0.03 (-0.22, 0.37) Trivial
CL=compatibility limits. *=possibly. **=likely. ***=very likely substantial. Decisions
in bold have acceptable precision with 99% CLs. Italicized decisions are unclear.

Appendices
232
Appendix 7. Differences in adjusted multiple correlations (adjR2), with compatibility
limits and magnitude-based decisions, between normalized maximal voluntary isometric
torque and regional quadriceps measures
Joint angle Region comparison Δ adjR2 (90%CL) Decision
VL MT + VL PA + VL FL
40º Distal-Proximal 0.25 (0.00, 0.69) Small**
Distal-Middle 0.06 (-0.17, 0.42) Trivial
Middle-Proximal 0.19 (-0.06, 0.56) Small*
70º Distal-Proximal 0.18 (-0.07, 0.57) Small*
Distal-Middle 0.07 (-0.16, 0.40) Trivial
Middle-Proximal 0.11 (-0.10, 0.38) Small
100º Distal-Proximal 0.08 (-0.11, 0.43) Trivial
Distal-Middle 0.03 (-0.11, 0.23) Trivial
Middle-Proximal 0.05 (0.16, 0.35) Trivial
VL MT + VL PA + VL FL + LVI MT
40º Distal-Proximal 0.25 (0.02, 0.73) Small**
Distal-Middle 0.07 (-0.16, 0.47) Trivial
Middle-Proximal 0.18 (-0.09, 0.62) Small*
70º Distal-Proximal 0.20 (0.00, 0.60) Small**
Distal-Middle 0.10 (-0.10, 0.48) Small
Middle-Proximal 0.10 (-0.15, 0.44) Small
100º Distal-Proximal 0.10 (-0.04, 0.37) Small*
Distal-Middle 0.05 (-0.07, 0.25) Trivial
Middle-Proximal 0.05 (-0.16, 0.31) Trivial
VL MT + LVI MT
40º Distal-Proximal 0.23 (0.04, 0.53) Small**
Distal-Middle 0.10 (-0.11, 0.38) Small

Appendices
233
Middle-Proximal 0.13 (-0.09, 0.42) Small*
70º Distal-Proximal 0.20 (0.04, 0.49) Small**
Distal-Middle 0.04 (-0.13, 0.22) Trivial
Middle-Proximal 0.16 (-0.02, 0.48) Small*
100º Distal-Proximal 0.20 (0.00, 0.54) Small**
Distal-Middle 0.03 (-0.13, 0.19) Trivial
Middle-Proximal 0.17 (0.00, 0.47) Small*
RF MT + AVI MT
40º Distal-Proximal 0.38 (-0.34, 0.74) Moderate
Distal-Middle -0.18 (-0.61, 0.26) Small
Middle-Proximal 0.56 (-0.01, 0.69) Large**
70º Distal-Proximal 0.34 (-0.34, 0.72) Moderate
Distal-Middle -0.12 (-0.60, 0.28) Small
Middle-Proximal 0.46 (0.02, 0.67) Moderate**
100º Distal-Proximal 0.18 (-0.32, 0.65) Small
Distal-Middle -0.17 (-0.61, 0.14) Small
Middle-Proximal 0.35 (0.04, 0.71) Moderate**
VL MT + VL PA + VL FL + RF MT + LVI MT + AVI MT
40º Distal-Proximal 0.37 (0.02, 0.94) Moderate**
Distal-Middle 0.11 (-0.15, 0.69) Small
Middle-Proximal 0.25 (-0.18, 0.77) Small
70º Distal-Proximal 0.25 (0.01, 0.70) Small**
Distal-Middle 0.13 (-0.09, 0.61) Small*
Middle-Proximal 0.11 (-0.31, 0.53) Small
100º Distal-Proximal 0.12 (-0.07, 0.53) Small*
Distal-Middle 0.05 (-0.08, 0.33) Trivial*

Appendices
234
Middle-Proximal 0.07 (-0.22, 0.48) Trivial
CL=compatibility limits. VL=vastus lateralis. LVI=lateral vastus intermedius. RF=rectus
femoris. AVI=anterior vastus intermedius. MT=muscle thickness. PA=pennation angle.
FL=fascicle length. *=possibly. **=likely substantial. Decisions in bold have acceptable
precision with 99% CLs. Italicized decisions are unclear.

Appendices
235
Appendix 8. Differences in adjusted multiple correlations (adjR2), with compatibility
limits and magnitude-based decisions, between lateral (vastus lateralis + lateral vastus
intermedius) and anterior (rectus femoris + anterior vastus intermedius) quadriceps
muscle thickness
Joint angle Region Δ adjR2 (90%CL) Decision
40º Proximal 0.57 (-0.09, 0.79) Large**
Middle 0.14 (-0.15, 0.64) Small
Distal 0.42 (-0.01, 0.88) Moderate**
70º Proximal 0.47 (-0.10, 0.70) Moderate**
Middle 0.17 (-0.05, 0.56) Trivial*
Distal 0.33 (-0.02, 0.88) Moderate**
100º Proximal 0.33 (-0.13, 0.72) Moderate
Middle 0.15 (-0.08, 0.48) Small*
Distal 0.35 (0.00, 0.87) Moderate**
CL=compatibility limits. *=possibly. **=likely substantial. Italicized decisions are
unclear.

Appendices
236
Appendix 9. Raw pressure-pain threshold values at each time-point with custom effect of between-condition deltas
Condition PRE 24 hours 48 hours 72 hours 7 days
Vastus lateralis
Proximal ECC 3.4 ± 1.5 2.6 ± 1.4 2.7 ± 1.3 3.0 ± 1.4 3.4 ± 1.3
EQI 3.2 ± 1.4 2.8 ± 1.5 3.0 ± 1.5 3.4 ± 1.6 3.4 ± 1.3
Custom effect (%) 12.9% (-6.7, 36.3) 14.9% (-6.9, 41.8) 14% (-1.3, 31.8) 3.8% (-11.6, 21.8) Custom effect (ES) *↑ 0.25 (-0.15, 0.66) *↑ 0.29 (-0.15, 0.73) *↑ 0.28 (-0.03, 0.58) 0.08 (-0.26, 0.41)
Middle
ECC 2.9 ± 1.3 2.3 ± 1.3 2.4 ± 1.3 2.9 ± 1.3 3.0 ± 1.3
EQI 3.0 ± 1.3 2.9 ± 1.6 3.0 ± 1.5 3.3 ± 1.4 3.1 ± 1.3
Custom effect (%) 16.5% (3.7, 31.2) 17.7% (10.3, 25.5) 8.1% (-1.2, 18.3) 1.9% (-12.1, 18.1) Custom effect (ES) *↑ 0.32 (0.07, 0.56) **↑ 0.33 (0.2, 0.47) 0.16 (-0.02, 0.34) 0.04 (-0.26, 0.34)
Distal
ECC 2.9 ± 1.6 2.3 ± 1.6 2.4 ± 1.3 2.6 ± 1.4 3.0 ± 1.6 EQI 2.9 ± 1.5 2.7 ± 1.5 2.7 ± 1.6 3.0 ± 1.6 3.0 ± 1.4
Custom effect (%) 25.9% (8.6, 46) 10% (-2.1, 23.6) 15.8% (9.2, 22.7) 7% (-15.5, 32.9)
Custom effect (ES) **↑ 0.40 (0.14, 0.66) *↑0.17 (-0.04, 0.37) **↑ 0.26 (0.15, 0.36) 0.12 (-0.39, 0.44) Rectus femoris
Proximal
ECC 3.0 ± 1.3 2.2 ± 1.3 2.5 ± 1.5 2.8 ± 1.5 3.2 ± 1.3 EQI 3.2 ± 1.4 2.6 ± 1.4 2.9 ± 1.6 3.2 ± 1.6 3.4 ± 1.4
Custom effect (%) 13.8% (-4.8, 36) 9.9% (-1.6, 22.9) 11.4% (-3.9, 29.2) -1.2% (-14.5, 14.2)
Custom effect (ES) *↑ 0.27 (-0.1, 0.65) *↑ 0.2 (-0.03, 0.44) *↑ 0.23 (-0.08, 0.54) -0.03 (-0.33, 0.28)
Middle
ECC 2.8 ± 1.5 2.4 ± 1.3 2.4 ± 1.4 2.7 ± 1.5 2.9 ± 1.1 EQI 3.3 ± 1.6 2.9 ± 1.5 2.9 ± 1.8 3.4 ± 1.4 3.4 ± 1.6
Custom effect (%) 4.9% (-6.4, 17.6) -3.9% (-26.5, 25.7) 14.8%, (-4.4, 37.9) 0.05% (-16.6, 21)
Custom effect (ES) 0.08 (-0.12, 0.29) -0.07 (-0.54, 0.4) 0.24 (-0.08, 0.57) 0.01 (-0.32, 0.34)
Distal
ECC 3.1 ± 1.5 2.3 ± 1.5 2.2 ± 1.2 2.7 ± 1.2 3.1 ± 1.4
EQI 3.3 ± 1.4 3.2 ± 1.6 3.0 ± 1.9 3.4 ± 1.6 3.4 ± 1.5 Custom effect (%) 30.4% (6.8, 59.2) 12.3% (-18.5, 54.6) 16.9% (-11.4, 54.2) 1.6% (-14.5, 20.7)
Custom effect (ES) ***↑ 0.54 (0.13, 0.94) 0.24 (-0.41, 0.88) 0.32 (-0.25, 0.88) 0.03 (-0.32, 0.38)
ECC = Eccentric. EQI = Eccentric quasi-isometric. Custom effect = difference (%) and Cohen’s d (ES) adjusted for individual total impulse and PRE value of the dependent variable. Data are mean ± standard deviation or the effect
with (95% Compatibility intervals). Asterisks indicate substantial effects with adequate precision as follows: *possibly, **likely, ***very likely, ****most likely. ↑ = larger effect in ECC. ↓ = larger effect in EQI. Smallest important
difference for proximal/middle/distal regions were: vastus lateralis = 5%/9.7%/11%; rectus femoris = 9.4%/11.1%/9.1%.
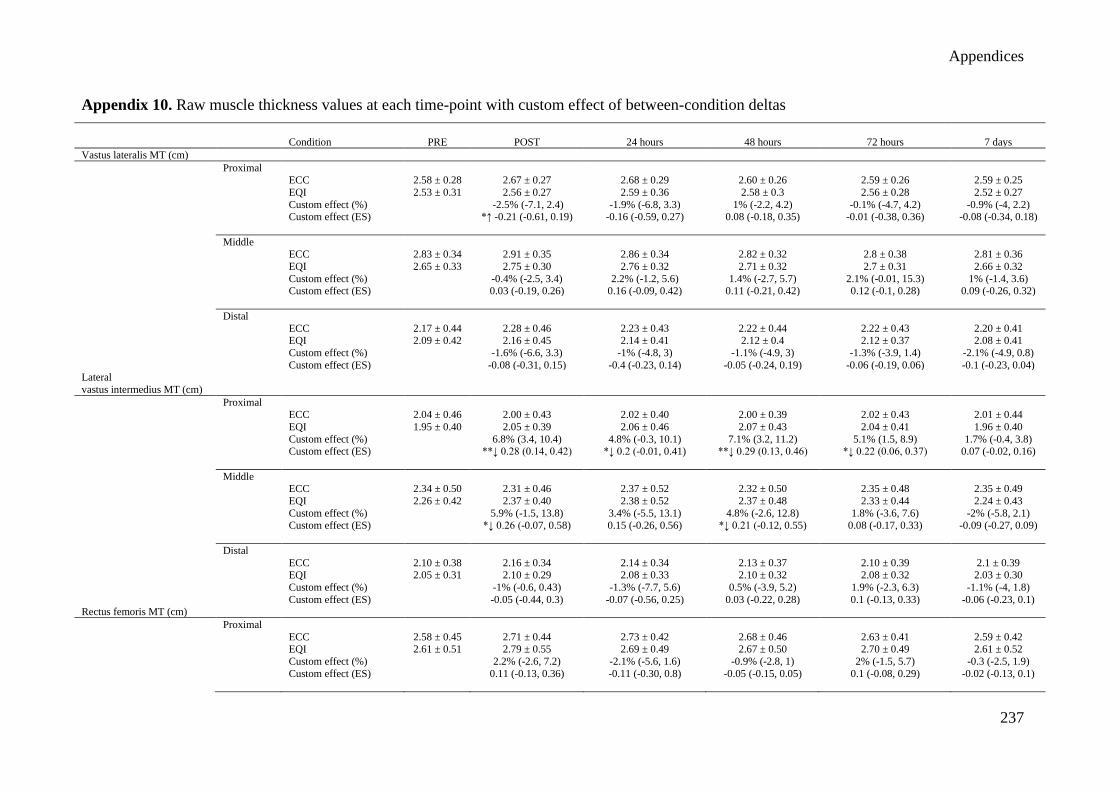
Appendices
237
Appendix 10. Raw muscle thickness values at each time-point with custom effect of between-condition deltas
Condition PRE POST 24 hours 48 hours 72 hours 7 days
Vastus lateralis MT (cm)
Proximal ECC 2.58 ± 0.28 2.67 ± 0.27 2.68 ± 0.29 2.60 ± 0.26 2.59 ± 0.26 2.59 ± 0.25
EQI 2.53 ± 0.31 2.56 ± 0.27 2.59 ± 0.36 2.58 ± 0.3 2.56 ± 0.28 2.52 ± 0.27
Custom effect (%) -2.5% (-7.1, 2.4) -1.9% (-6.8, 3.3) 1% (-2.2, 4.2) -0.1% (-4.7, 4.2) -0.9% (-4, 2.2) Custom effect (ES) *↑ -0.21 (-0.61, 0.19) -0.16 (-0.59, 0.27) 0.08 (-0.18, 0.35) -0.01 (-0.38, 0.36) -0.08 (-0.34, 0.18)
Middle
ECC 2.83 ± 0.34 2.91 ± 0.35 2.86 ± 0.34 2.82 ± 0.32 2.8 ± 0.38 2.81 ± 0.36
EQI 2.65 ± 0.33 2.75 ± 0.30 2.76 ± 0.32 2.71 ± 0.32 2.7 ± 0.31 2.66 ± 0.32
Custom effect (%) -0.4% (-2.5, 3.4) 2.2% (-1.2, 5.6) 1.4% (-2.7, 5.7) 2.1% (-0.01, 15.3) 1% (-1.4, 3.6) Custom effect (ES) 0.03 (-0.19, 0.26) 0.16 (-0.09, 0.42) 0.11 (-0.21, 0.42) 0.12 (-0.1, 0.28) 0.09 (-0.26, 0.32)
Distal
ECC 2.17 ± 0.44 2.28 ± 0.46 2.23 ± 0.43 2.22 ± 0.44 2.22 ± 0.43 2.20 ± 0.41 EQI 2.09 ± 0.42 2.16 ± 0.45 2.14 ± 0.41 2.12 ± 0.4 2.12 ± 0.37 2.08 ± 0.41
Custom effect (%) -1.6% (-6.6, 3.3) -1% (-4.8, 3) -1.1% (-4.9, 3) -1.3% (-3.9, 1.4) -2.1% (-4.9, 0.8)
Custom effect (ES) -0.08 (-0.31, 0.15) -0.4 (-0.23, 0.14) -0.05 (-0.24, 0.19) -0.06 (-0.19, 0.06) -0.1 (-0.23, 0.04) Lateral
vastus intermedius MT (cm)
Proximal ECC 2.04 ± 0.46 2.00 ± 0.43 2.02 ± 0.40 2.00 ± 0.39 2.02 ± 0.43 2.01 ± 0.44
EQI 1.95 ± 0.40 2.05 ± 0.39 2.06 ± 0.46 2.07 ± 0.43 2.04 ± 0.41 1.96 ± 0.40
Custom effect (%) 6.8% (3.4, 10.4) 4.8% (-0.3, 10.1) 7.1% (3.2, 11.2) 5.1% (1.5, 8.9) 1.7% (-0.4, 3.8) Custom effect (ES) **↓ 0.28 (0.14, 0.42) *↓ 0.2 (-0.01, 0.41) **↓ 0.29 (0.13, 0.46) *↓ 0.22 (0.06, 0.37) 0.07 (-0.02, 0.16)
Middle ECC 2.34 ± 0.50 2.31 ± 0.46 2.37 ± 0.52 2.32 ± 0.50 2.35 ± 0.48 2.35 ± 0.49
EQI 2.26 ± 0.42 2.37 ± 0.40 2.38 ± 0.52 2.37 ± 0.48 2.33 ± 0.44 2.24 ± 0.43
Custom effect (%) 5.9% (-1.5, 13.8) 3.4% (-5.5, 13.1) 4.8% (-2.6, 12.8) 1.8% (-3.6, 7.6) -2% (-5.8, 2.1) Custom effect (ES) *↓ 0.26 (-0.07, 0.58) 0.15 (-0.26, 0.56) *↓ 0.21 (-0.12, 0.55) 0.08 (-0.17, 0.33) -0.09 (-0.27, 0.09)
Distal
ECC 2.10 ± 0.38 2.16 ± 0.34 2.14 ± 0.34 2.13 ± 0.37 2.10 ± 0.39 2.1 ± 0.39 EQI 2.05 ± 0.31 2.10 ± 0.29 2.08 ± 0.33 2.10 ± 0.32 2.08 ± 0.32 2.03 ± 0.30
Custom effect (%) -1% (-0.6, 0.43) -1.3% (-7.7, 5.6) 0.5% (-3.9, 5.2) 1.9% (-2.3, 6.3) -1.1% (-4, 1.8)
Custom effect (ES) -0.05 (-0.44, 0.3) -0.07 (-0.56, 0.25) 0.03 (-0.22, 0.28) 0.1 (-0.13, 0.33) -0.06 (-0.23, 0.1) Rectus femoris MT (cm)
Proximal
ECC 2.58 ± 0.45 2.71 ± 0.44 2.73 ± 0.42 2.68 ± 0.46 2.63 ± 0.41 2.59 ± 0.42 EQI 2.61 ± 0.51 2.79 ± 0.55 2.69 ± 0.49 2.67 ± 0.50 2.70 ± 0.49 2.61 ± 0.52
Custom effect (%) 2.2% (-2.6, 7.2) -2.1% (-5.6, 1.6) -0.9% (-2.8, 1) 2% (-1.5, 5.7) -0.3 (-2.5, 1.9)
Custom effect (ES) 0.11 (-0.13, 0.36) -0.11 (-0.30, 0.8) -0.05 (-0.15, 0.05) 0.1 (-0.08, 0.29) -0.02 (-0.13, 0.1)
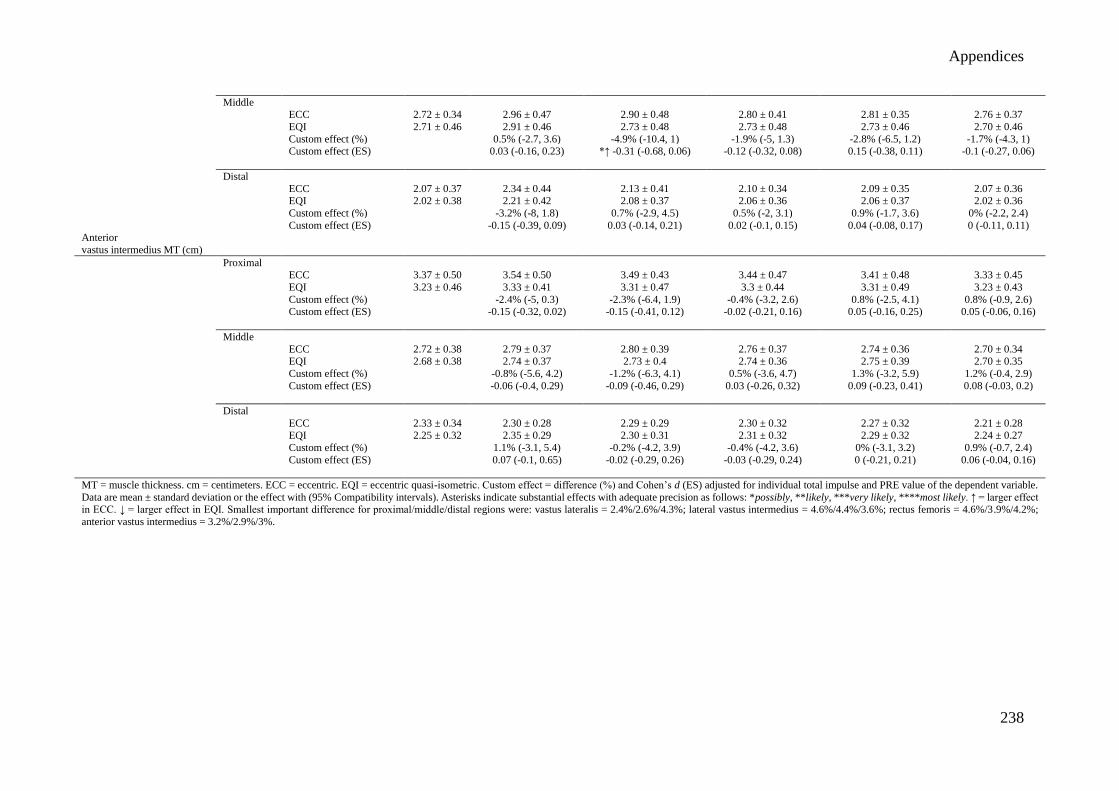
Appendices
238
Middle ECC 2.72 ± 0.34 2.96 ± 0.47 2.90 ± 0.48 2.80 ± 0.41 2.81 ± 0.35 2.76 ± 0.37
EQI 2.71 ± 0.46 2.91 ± 0.46 2.73 ± 0.48 2.73 ± 0.48 2.73 ± 0.46 2.70 ± 0.46
Custom effect (%) 0.5% (-2.7, 3.6) -4.9% (-10.4, 1) -1.9% (-5, 1.3) -2.8% (-6.5, 1.2) -1.7% (-4.3, 1) Custom effect (ES) 0.03 (-0.16, 0.23) *↑ -0.31 (-0.68, 0.06) -0.12 (-0.32, 0.08) 0.15 (-0.38, 0.11) -0.1 (-0.27, 0.06)
Distal
ECC 2.07 ± 0.37 2.34 ± 0.44 2.13 ± 0.41 2.10 ± 0.34 2.09 ± 0.35 2.07 ± 0.36 EQI 2.02 ± 0.38 2.21 ± 0.42 2.08 ± 0.37 2.06 ± 0.36 2.06 ± 0.37 2.02 ± 0.36
Custom effect (%) -3.2% (-8, 1.8) 0.7% (-2.9, 4.5) 0.5% (-2, 3.1) 0.9% (-1.7, 3.6) 0% (-2.2, 2.4)
Custom effect (ES) -0.15 (-0.39, 0.09) 0.03 (-0.14, 0.21) 0.02 (-0.1, 0.15) 0.04 (-0.08, 0.17) 0 (-0.11, 0.11) Anterior
vastus intermedius MT (cm)
Proximal ECC 3.37 ± 0.50 3.54 ± 0.50 3.49 ± 0.43 3.44 ± 0.47 3.41 ± 0.48 3.33 ± 0.45
EQI 3.23 ± 0.46 3.33 ± 0.41 3.31 ± 0.47 3.3 ± 0.44 3.31 ± 0.49 3.23 ± 0.43
Custom effect (%) -2.4% (-5, 0.3) -2.3% (-6.4, 1.9) -0.4% (-3.2, 2.6) 0.8% (-2.5, 4.1) 0.8% (-0.9, 2.6) Custom effect (ES) -0.15 (-0.32, 0.02) -0.15 (-0.41, 0.12) -0.02 (-0.21, 0.16) 0.05 (-0.16, 0.25) 0.05 (-0.06, 0.16)
Middle
ECC 2.72 ± 0.38 2.79 ± 0.37 2.80 ± 0.39 2.76 ± 0.37 2.74 ± 0.36 2.70 ± 0.34 EQI 2.68 ± 0.38 2.74 ± 0.37 2.73 ± 0.4 2.74 ± 0.36 2.75 ± 0.39 2.70 ± 0.35
Custom effect (%) -0.8% (-5.6, 4.2) -1.2% (-6.3, 4.1) 0.5% (-3.6, 4.7) 1.3% (-3.2, 5.9) 1.2% (-0.4, 2.9)
Custom effect (ES) -0.06 (-0.4, 0.29) -0.09 (-0.46, 0.29) 0.03 (-0.26, 0.32) 0.09 (-0.23, 0.41) 0.08 (-0.03, 0.2)
Distal
ECC 2.33 ± 0.34 2.30 ± 0.28 2.29 ± 0.29 2.30 ± 0.32 2.27 ± 0.32 2.21 ± 0.28 EQI 2.25 ± 0.32 2.35 ± 0.29 2.30 ± 0.31 2.31 ± 0.32 2.29 ± 0.32 2.24 ± 0.27
Custom effect (%) 1.1% (-3.1, 5.4) -0.2% (-4.2, 3.9) -0.4% (-4.2, 3.6) 0% (-3.1, 3.2) 0.9% (-0.7, 2.4)
Custom effect (ES) 0.07 (-0.1, 0.65) -0.02 (-0.29, 0.26) -0.03 (-0.29, 0.24) 0 (-0.21, 0.21) 0.06 (-0.04, 0.16)
MT = muscle thickness. cm = centimeters. ECC = eccentric. EQI = eccentric quasi-isometric. Custom effect = difference (%) and Cohen’s d (ES) adjusted for individual total impulse and PRE value of the dependent variable.
Data are mean ± standard deviation or the effect with (95% Compatibility intervals). Asterisks indicate substantial effects with adequate precision as follows: *possibly, **likely, ***very likely, ****most likely. ↑ = larger effect in ECC. ↓ = larger effect in EQI. Smallest important difference for proximal/middle/distal regions were: vastus lateralis = 2.4%/2.6%/4.3%; lateral vastus intermedius = 4.6%/4.4%/3.6%; rectus femoris = 4.6%/3.9%/4.2%;
anterior vastus intermedius = 3.2%/2.9%/3%.

Appendices
239
Appendix 11. Raw vastus lateralis pennation angle and fascicle length values at each time-point with custom effect of between-condition
deltas
Condition PRE POST 24 hours 48 hours 72 hours 7 days
Vastus lateralis
pennation angle (º)
Proximal ECC 17.9 ± 3.43 17.8 ± 4.7 18.5 ± 4.3 17.9 ± 4.3 17.9 ± 4.1 17.8 ± 4.3
EQI 18.9 ± 5.73 18.6 ± 5.0 18.8 ± 5.2 18.0 ± 4.6 17.9 ± 4.6 17.2 ± 4.2
Custom effect (%) 2.1% (-12.5, 19.1) -2% (-15.2, 13.2) -2.7 (-0.14.1, 10.1) -2.8% (-14.8, 10.8) -3% (-12.5, 7.4) Custom effect (ES) 0.07 (-0.47, 0.61) -0.07 (-0.58, 0.44) -0.1 (-0.53, 0.34) -0.1 (-0.56, 0.36) -0.12 (-0.49, 0.25)
Middle
ECC 23.2 ± 4.5 22.1 ± 5.1 22.0 ± 4.4 21.9 ± 3.8 22.4 ± 4.6 23.0 ± 5.1 EQI 21 ± 3.7 21.6 ± 3.6 21.9 ± 3.2 21.2 ± 4.5 21.3 ± 5.2 21.4 ± 4.5
Custom effect (%) 7.3% (-1, 16.2) 7.3% (-4.5, 20.5) 2.9% (-10.3, 18.1) 2.6% (-11.6, 19.1) 2.7% (-7.8, 14.4)
Custom effect (ES) **↓ 0.34 (-0.05, 0.72) 0.34 (-0.22, 0.89) 0.14 (-0.52, 0.8) 0.12 (-0.59, 0.84) 0.13 (-0.39, 0.65)
Distal
ECC 26.5 ± 4.6 27.0 ± 4.1 25.3 ± 4.1 27.1 ± 6.0 26.7 ± 5.2 26.2 ± 5.2 EQI 25.7 ± 4.8 24.0 ± 3.8 24.5 ± 3.5 25.2 ± 4.5 24.7 ± 4.8 25.7 ± 5.1
Custom effect (%) -8.7% (-15.6, -1.4) -0.4% (-7.4, 7.1) -4.5% (-15.7, 8.2) -4.5% (-11.1, 2.5) 1.1% (-8, 11.1)
Custom effect (ES) **↑ -0.49 (-0.9, -0.07) -0.02 (-0.41, 0.37) -0.24 (-0.91, 0.42) *↑ -0.25 (-0.63, 0.13) 0.06 (-0.45, 0.56) Vastus lateralis
fascicle length (cm)
Proximal ECC 7.22 ± 1.04 7.35 ± 0.81 7.57 ± 0.83 7.26 ± 0.59 7.25 ± 0.65 7.30 ± 0.93
EQI 7.43 ± 0.85 7.03 ± 0.73 7.13 ± 0.90 7.38 ± 0.71 7.22 ± 0.67 7.36 ± 0.93
Custom effect (%) -6.2% (-11, -1.2) -8.3% (-12.6, -3.7) -0.3% (-4.1, 3.6) -2.4% (-4.8, 0.1) -2.1% (-5.7, 1.6) Custom effect (ES) **↓ -0.49 (-0.89, -0.09) ***↓ -0.66 (-1.04, -0.29) -0.17 (-0.36, 0.04) -0.16 (-0.33, 0.05) -0.16 (-0.45, 0.12)
Middle
ECC 7.42 ± 0.62 7.33 ± 0.75 7.32 ± 0.74 7.33 ± 0.70 7.43 ± 0.65 7.41 ± 0.71 EQI 7.39 ± 1.15 7.29 ± 1.08 7.51 ± 1.02 7.65 ± 0.95 7.73 ± 0.95 7.54 ± 1.17
Custom effect (%) 0.1% (-5, 5.4) 3.6% (-1.9, 9.3) 4.8% (-0.83, 11.1) 4.5% (0.08, 9.4) 2.2% (-3.4, 8.1)
Custom effect (ES) 0 (-0.4, 0.41) *↑ 0.27 (-0.15, 0.69) **↑ 0.37 (-0.08, 0.82) **↑ 0.34 (-0.01, 0.69) 0.17 (-0.27, 0.6)
Distal
ECC 6.95 ± 0.74 6.89 ± 0.61 6.90 ± 0.58 6.77 ± 0.61 6.89 ± 0.71 6.99 ± 0.83 EQI 6.73 ± 0.82 6.68 ± 0.65 6.79 ± 0.79 6.74 ± 0.88 6.77 ± 0.61 6.80 ± 0.67
Custom effect (%) -0.8% (-5.6, 4.2) 0.7% (-5.7, 7.6) 1.7% (-4.5, 8.6) 0.9% (-3.6, 5.8) 0.8% (-2.8, 4.5)
Custom effect (ES) -0.07 (-0.5, 0.36) 0.06 (-0.51, 0.63) 0.14 (-0.4, 0.69) 0.08 (-0.32, 0.48) 0.07 (-0.24, 0.38)
º = degrees. cm = centimeters. ECC = eccentric. EQI = eccentric quasi-isometric. Custom effect = difference (%) and Cohen’s d (ES) adjusted for individual total impulse and PRE value of the dependent variable. Data are mean ±
standard deviation or the effect with (95% Compatibility intervals). Asterisks indicate substantial effects with adequate precision as follows: *possibly, **likely, ***very likely, ****most likely. ↑ = larger effect in ECC. ↓ = larger
effect in EQI. Smallest important difference for proximal/middle/distal pennation angle were: 5.7%/4.2%/3.8%; fascicle length: 2.6%/2.6%/2.3%.

Appendices
240
Appendix 12. Raw echo intensity values at each time-point with custom effect of between-condition deltas
Condition PRE POST 24 hours 48 hours 72 hours 7 days
Vastus lateralis EI (a.u)
Proximal
ECC 70.6 ± 10.0 77.6 ± 12.1 73.2 ± 15.5 73.2 ± 12.4 68.7 ± 10.0 71.5 ± 11.9 EQI 70.5 ± 14.2 73.7 ± 14.8 71.2 ± 12.0 71.6 ± 10.3 69.2 ± 10.8 68.5 ± 14.0
Custom effect (%) -4.7% (-11, 2.1) -1.6% (-9.3, 6.8) -1% (-5.9, 4.2) 1.1% (-3.9, 6.3) 1.1% (-5.6, 8.2)
Custom effect (ES) -0.2 (-0.62, 0.18) -0.08 (-0.52, 0.35) -0.05 (-0.32, 0.22) 0.06 (-0.21, 0.32) 0.06 (-0.3, 0.42)
Middle
ECC 59.5 ± 7.9 65.9 ± 11.6 64.6 ± 12.4 62.9 ± 8.5 60.8 ± 7.9 61.2 ± 7.4
EQI 61.4 ± 9.1 66.4 ± 9.1 63.2 ± 8.4 62.6 ± 7.4 59.8 ± 9.8 59.9 ± 8.7 Custom effect (%) -1.4% (-9.3, 7.2) -4.4% (-10.9, 2.7) -2.4% (-7.2, 2.7) -4.4% (-12.4, 4.3) 3% (-10.1, 4.7)
Custom effect (ES) -0.1 (-0.67, 0.48) -0.11 (-0.59, 0.18) -0.14 (-0.51, 0.18) -0.21 (-0.71, 0.29) 0.21 (-0.73, 0.32)
Distal
ECC 69.1 ± 6.6 82.4 ± 9.3 70.5 ± 8.0 71.3 ± 8.0 70.3 ± 8.4 69.9 ± 9.3
EQI 68.6 ± 8.0 79.8 ± 8.2 71.9 ± 9.5 71.9 ± 10.3 68.9 ± 6.4 67.7 ± 7.3 Custom effect (%) -2.5% (-7.8, 3.1) 2.5% (-2.8, 8.3) -0.2% (-5.9, 5.8) -1.2% (-6.3, 4.3) 0.9% (-5.3, 7.4)
Custom effect (ES) -0.22 (-0.72, 0.28) 0.23 (-0.26, 0.71) -0.02 (-0.54, 0.5) -0.1 (-0.58, 0.37) 0.08 (-0.49, 0.64)
Lateral
vastus intermedius EI (a.u)
Proximal
ECC 43.3 ± 10.3 47.3 ± 10.2 44.3 ± 10.2 43.1 ± 9.2 43.4 ± 10.2 42.6 ± 9.7 EQI 41.9 ± 11.6 44.9 ± 11.2 41.9 ± 10.1 42.6 ± 9.4 40.5 ± 9.9 41.3 ± 10.9
Custom effect (%) -0.5% (-6.3, 5.8) -0.4% (-0.9, 8.9) 3.7% (-1.7, 9.5) -1.1% (-8.1, 6.4) 4.2% (-4, 13.1)
Custom effect (ES) -0.02 (-0.23, 0.20) -0.02 (-0.34, 0.31) 0.13 (-0.06, 0.32) -0.04 (0.3, 0.22) 0.17 (-1.2, 0.56)
Middle
ECC 28.6 ± 10.1 32.9 ± 13.0 30.2 ± 9.8 29.5 ± 10.0 28.1 ± 8.7 22.2 ± 12.1
EQI 29.2 ± 8.8 32.6 ± 9.5 30.3 ± 7.9 30.9 ± 8.2 27.0 ± 5.3 28.5 ± 6.7 Custom effect (%) -2.1% (-12.8, 10) -1.4% (-12.4, 11) 3.7% (-8.9, 17.9) -4% (-9.3, 1.6) -3.5% (-11.3, 5.1)
Custom effect (ES) -0.07 (-0.46, 0.32) -0.05 (-0.44, 0.35) 0.12 (-0.31, 0.55) -0.14 (-0.33, 0.05) -0.12 (-0.4, 0.17)
Distal
ECC 31.2 ± 11.6 36.5 ± 8.6 32.2 ± 7.4 30.6 ± 8.0 30.6 ± 8.5 30.9 ± 7.4
EQI 31.0 ± 11.6 34.2 ± 12.0 34.3 ± 14.1 33.7 ± 13.4 31.4 ± 10.0 31.5 ± 10.7 Custom effect (%) -7.9% (-19.2, 5.1) 2.5% (-8.7, 15.1) 3.4% (-12.7, 19.8) 3.3% (-6.2, 13.8) 1.6% (-6, 9.8)
Custom effect (ES) *↑ -0.25 (-0.65, 0.15) 0.07 (-0.28, 0.43) 0.09 (-0.22, 0.28) 0.1 (-0.2, 0.39) 0.05 (-0.19, 0.28)
Rectus femoris EI (a.u)
Proximal
ECC 74.1 ± 20.6 78.2 ± 17.8 74.3 ± 18.5 75.6 ± 16.3 74.6 ± 16.2 72.3 ± 18.4
EQI 74.7 ± 19.1 78.9 ± 16.3 77.1 ± 18.6 78.7 ± 15.2 73.9 ± 15.5 74.9 ± 19.5
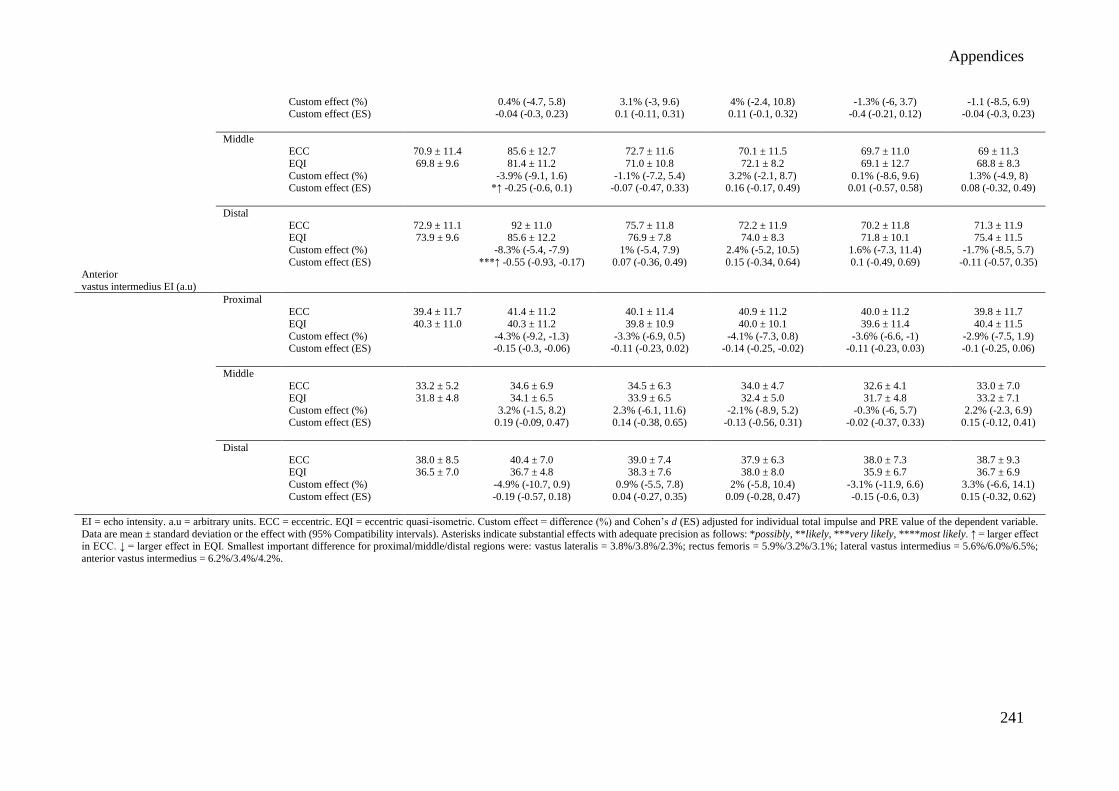
Appendices
241
Custom effect (%) 0.4% (-4.7, 5.8) 3.1% (-3, 9.6) 4% (-2.4, 10.8) -1.3% (-6, 3.7) -1.1 (-8.5, 6.9) Custom effect (ES) -0.04 (-0.3, 0.23) 0.1 (-0.11, 0.31) 0.11 (-0.1, 0.32) -0.4 (-0.21, 0.12) -0.04 (-0.3, 0.23)
Middle ECC 70.9 ± 11.4 85.6 ± 12.7 72.7 ± 11.6 70.1 ± 11.5 69.7 ± 11.0 69 ± 11.3
EQI 69.8 ± 9.6 81.4 ± 11.2 71.0 ± 10.8 72.1 ± 8.2 69.1 ± 12.7 68.8 ± 8.3
Custom effect (%) -3.9% (-9.1, 1.6) -1.1% (-7.2, 5.4) 3.2% (-2.1, 8.7) 0.1% (-8.6, 9.6) 1.3% (-4.9, 8) Custom effect (ES) *↑ -0.25 (-0.6, 0.1) -0.07 (-0.47, 0.33) 0.16 (-0.17, 0.49) 0.01 (-0.57, 0.58) 0.08 (-0.32, 0.49)
Distal
ECC 72.9 ± 11.1 92 ± 11.0 75.7 ± 11.8 72.2 ± 11.9 70.2 ± 11.8 71.3 ± 11.9 EQI 73.9 ± 9.6 85.6 ± 12.2 76.9 ± 7.8 74.0 ± 8.3 71.8 ± 10.1 75.4 ± 11.5
Custom effect (%) -8.3% (-5.4, -7.9) 1% (-5.4, 7.9) 2.4% (-5.2, 10.5) 1.6% (-7.3, 11.4) -1.7% (-8.5, 5.7)
Custom effect (ES) ***↑ -0.55 (-0.93, -0.17) 0.07 (-0.36, 0.49) 0.15 (-0.34, 0.64) 0.1 (-0.49, 0.69) -0.11 (-0.57, 0.35) Anterior
vastus intermedius EI (a.u)
Proximal ECC 39.4 ± 11.7 41.4 ± 11.2 40.1 ± 11.4 40.9 ± 11.2 40.0 ± 11.2 39.8 ± 11.7
EQI 40.3 ± 11.0 40.3 ± 11.2 39.8 ± 10.9 40.0 ± 10.1 39.6 ± 11.4 40.4 ± 11.5
Custom effect (%) -4.3% (-9.2, -1.3) -3.3% (-6.9, 0.5) -4.1% (-7.3, 0.8) -3.6% (-6.6, -1) -2.9% (-7.5, 1.9) Custom effect (ES) -0.15 (-0.3, -0.06) -0.11 (-0.23, 0.02) -0.14 (-0.25, -0.02) -0.11 (-0.23, 0.03) -0.1 (-0.25, 0.06)
Middle
ECC 33.2 ± 5.2 34.6 ± 6.9 34.5 ± 6.3 34.0 ± 4.7 32.6 ± 4.1 33.0 ± 7.0 EQI 31.8 ± 4.8 34.1 ± 6.5 33.9 ± 6.5 32.4 ± 5.0 31.7 ± 4.8 33.2 ± 7.1
Custom effect (%) 3.2% (-1.5, 8.2) 2.3% (-6.1, 11.6) -2.1% (-8.9, 5.2) -0.3% (-6, 5.7) 2.2% (-2.3, 6.9)
Custom effect (ES) 0.19 (-0.09, 0.47) 0.14 (-0.38, 0.65) -0.13 (-0.56, 0.31) -0.02 (-0.37, 0.33) 0.15 (-0.12, 0.41)
Distal
ECC 38.0 ± 8.5 40.4 ± 7.0 39.0 ± 7.4 37.9 ± 6.3 38.0 ± 7.3 38.7 ± 9.3 EQI 36.5 ± 7.0 36.7 ± 4.8 38.3 ± 7.6 38.0 ± 8.0 35.9 ± 6.7 36.7 ± 6.9
Custom effect (%) -4.9% (-10.7, 0.9) 0.9% (-5.5, 7.8) 2% (-5.8, 10.4) -3.1% (-11.9, 6.6) 3.3% (-6.6, 14.1)
Custom effect (ES) -0.19 (-0.57, 0.18) 0.04 (-0.27, 0.35) 0.09 (-0.28, 0.47) -0.15 (-0.6, 0.3) 0.15 (-0.32, 0.62)
EI = echo intensity. a.u = arbitrary units. ECC = eccentric. EQI = eccentric quasi-isometric. Custom effect = difference (%) and Cohen’s d (ES) adjusted for individual total impulse and PRE value of the dependent variable.
Data are mean ± standard deviation or the effect with (95% Compatibility intervals). Asterisks indicate substantial effects with adequate precision as follows: *possibly, **likely, ***very likely, ****most likely. ↑ = larger effect in ECC. ↓ = larger effect in EQI. Smallest important difference for proximal/middle/distal regions were: vastus lateralis = 3.8%/3.8%/2.3%; rectus femoris = 5.9%/3.2%/3.1%; lateral vastus intermedius = 5.6%/6.0%/6.5%;
anterior vastus intermedius = 6.2%/3.4%/4.2%.

Appendices
242
Appendix 13. Raw angle specific concentric peak torque, total impulse, and angle specific impulse values at each time-point with custom effect of between-condition deltas
Condition PRE POST 24 hours 48 hours 72 hours 7 days
Peak concentric torque (Nm)
ECC 214.2 ± 32.2 189.7 ± 41.7 181.5± 34.6 184.2 ± 35.8 196.4 ± 32.4 214.4 ± 37.0
EQI 208.9 ± 31.9 200.7 ± 179.2 179.2 ± 27.3 186.8 ± 33.3 191.0 ± 28.9 205.9 ± 31.0 Custom effect (%) 8.7% (0.4, 17.7) 1.5% (-4.8, 8.2) 3.5% (-8.7, 17.3) -0.7% (-8.8, 8) -1.9% (-9.6, 6.4)
Custom effect (ES) **↑ 0.5 (0.02, 0.98) 0.09 (-0.30, 0.47) 0.2 (-0.55, 0.96) -0.04 (-0.55, 0.46) -0.12 (-0.6, 0.37)
Total concentric
impulse (Nm.s)
ECC 245.4 ± 39.2 216.9 ± 47.2 214.7 ± 41.3 217.7 ± 39.0 226.8 ± 49.1 249.1 ± 41.2 EQI 239.5 ± 37.3 229.6 ± 51 210.1 ± 33.4 220.0 ± 39.3 222.5 ± 38.3 239.7 ± 36.8
Custom effect (%) 8.3% (0.4, 0.16.9) 0.4% (-5.7, 4) 2.8% (-8.3, 15.2) -0.2% (-8.4, 8.8) -1.9% (-8.9, 5.7)
Custom effect (ES) **↑ 0.45 (0.02, 0.88) 0.02 (-0.33, 0.38) 0.15 (-0.49, 0.8) -0.01 (-0.49, 0.47) -0.11 (-0.52, 0.31) Angle-specific
impulse (Nm.s)
100-90º
ECC 26.7 ± 8.3 20.8 ± 6.5 22.1 ± 5.3 23.4 ± 5.5 23.0 ± 5.7 25.2 ± 5.9 EQI 26.1 ± 5.6 24.7 ± 6.6 23.3 ± 5.4 23.2 ± 4.7 23.9 ± 5.1 26.0 ± 5.3
Custom effect (%) 19.7% (6.2, 34.8) 5.1% (-3, 13.9) -1% (-12, 11.5) 4.5% (-5.6, 15.8) 3.8% (-2.3, 10.4)
Custom effect (ES) ***↑ 0.57 (0.19, 0.94) *↑ 0.16 (-0.1, 0.41) -0.03 (-0.41, 0.34) 0.14 (-0.18, 0.46) 0.12 (-0.07, 0.31)
90-80º
ECC 31.3 ± 7.1 25.8 ± 6.2 26.9 ± 6.3 27.4 ± 6.1 28.5 ± 5.9 30.7 ± 6.1 EQI 31.6 ± 6.0 30.2 ± 7.2 27.4 ± 5.3 27.5 ± 5.2 28.5 ± 4.7 31.2 ± 5.6
Custom effect (%) 15.6% (-5.2, 26.9) 1.1% (-4.6, 7) -0.4% (-11, 11.5) -0.7% (-8, 7.3) 0.6% (-7.3, 9.2)
Custom effect (ES) ***↑ 0.6 (0.21, 0.99) 0.04 (-0.19, 0.28) -0.02 (-0.48, 0.45) -0.3 (-0.35, 0.29) 0.02 (-0.32, 0.36)
80-70º
ECC 33.0 ± 5.9 28.5 ± 6.7 28.7 ± 6.4 29.1 ± 6.3 30.7 ± 6.1 33.5 ± 6.6 EQI 32.6 ± 5.6 31.6 ± 7.1 27.6 ± 4.6 28.8 ± 5.4 29.6 ± 4.4 32.4 ± 5.4
Custom effect (%) 11.7% (1.2, 23.2) -2.3% (-9.2, 5.1) 0.4% (-12.1, 14.6) -2.2% (-10.5, 6.8) -1.9% (-8.9, 5.7)
Custom effect (ES) **↑ 0.56 (0.06, 1.06) -0.12 (-0.49, 0.25) 0.02 (-0.66, 0.69) -0.11 (-0.56, 0.33) -0.1 (-0.48, 0.28)
70-60º
ECC 30.8 ± 5.6 29.8 ± 7.2 29.0 ± 5.8 29.4 ± 5.9 30.9 ± 5.7 34.4 ± 6.5
EQI 32.2 ± 5.1 31.5 ± 7.1 27.5 ± 4.2 29.1 ± 5.3 29.6 ± 4.3 32.6 ± 5.2 Custom effect (%) 10.7% (0.5, 0.22) -0.07% (-8, 7.2) 2.4% (-12.1, 19.4) -0.7% (-11.2, 11.1) -1.4% (-11.5, 9.8)
Custom effect (ES) **↑ 0.58 (0.03, 1.14) -0.04 (-0.48, 0.4) 0.14 (-0.74, 1.01) -0.04 (-0.68, 0.6) -0.08 (-0.7, 0.53)
60-50º
ECC 32 ± 4.6 28.4 ± 6.3 27.8 ± 5.3 28.4 ± 5.6 29.9 ± 5.7 33.5 ± 6.2
EQI 30.4 ± 4.8 29.7 ± 6.6 26.4 ± 3.9 28.5 ± 5.5 26.6 ± 5.1 30.8 ± 4.9 Custom effect (%) 10.5% (0.5, 21.6) -0.2% (-8, 8.4) 3.8% (-11.8, 22.1) -0.4% (-12.5, 13.3) -0.4% (-12.5, 13.3)

Appendices
243
Custom effect (ES) **↑ 0.62 (0.03, 1.2) -0.01 (-0.52, 0.5) 0.23 (-0.78, 1.23) -0.03 (-0.82, 0.77) -0.03 (-0.82, 0.77)
50-40º
ECC 28.7 ± 4.0 25.8 ± 5.8 25.7 ± 5.2 25.9 ± 4.8 27.1 ± 5.1 30.5 ± 5.7 EQI 27.8 ± 4.9 26.7 ± 6.6 24.1 ± 4.0 26.4 ± 5.8 26.5 ± 6.1 28.0 ± 5.2
Custom effect (%) 8% (-2.2, 19.3) -2.3% (-10.5, 6.7) 4.5% (-9.9, 21.4) 0.1% (-11.2, 12.9) -5.3% (-13.8, 4.1)
Custom effect (ES) **↑ 0.45 (-0.13, 1.03) -0.13 (-0.65, 0.38) 0.26 (-0.61, 1.13) 0.01 (-0.69, 0.71) -0.32 (-0.87, 0.23)
40-30º
ECC 24.3 ± 3.6 22.4 ± 5.3 22.3 ± 4.2 22.2 ± 4.0 23.4 ± 4.4 25.9 ± 4.8
EQI 23.8 ± 4.5 22.7 ± 6.4 21.1 ± 4.3 23.0 ± 5.2 22.6 ± 5.5 23.9 ± 4.8 Custom effect (%) 4.3% (-5.3, 14.7) -3.4% (-11.2, 5) 4.7% (-8.4, 19.7) -2.3% (-11.8, 8.2) -6% (-14, 2.6)
Custom effect (ES) 0.22 (-0.29, 0.73) -0.19 (-0.63, 0.26) 0.25 (-0.46, 0.95) -0.12 (-0.66, 0.42) *↓ -0.33 (-0.8, 0.14)
30-20º
ECC 20.2 ± 3.6 18.5 ± 4.8 18.2 ± 3.6 17.9 ± 3.0 19 ± 3.4 21 ± 3.8
EQI 19.5 ± 4.1 18.4 ± 5.1 17.7 ± 4.5 18.9 ± 4.5 18.3 ± 4.6 19.5 ± 4.2 Custom effect (%) 4.2% (-5.2, 14.5) -0.9% (-9, 8) 7.3% (-8.3, 19.6) -2% (-10.3, 7.1) -4.4% (-11.9, 3.6)
Custom effect (ES) 0.19 (-0.25, 0.65) -0.4 (-0.43, 0.35) *↑ 0.32 (-0.18, 0.82) -0.09 (-0.5, 0.31) *↓ 0.21 (-0.58, 0.16)
20-10º ECC 15.5 ± 3.3 14.1 ± 4.3 14.6 ± 3.2 13.8 ± 2.5 14.6 ± 2.7 15.8 ± 2.9
EQI 15.2 ± 3.4 14.0 ± 4.0 13.8 ± 3.7 14.7 ± 3.7 14.0 ± 3.7 14.9 ± 3.6
Custom effect (%) 3% (-5.3, 12.1) -3.8% (-11, 4.1) 7.5% (-3.4, 19.6) -3.9% (-11.5, 4.4) -4.9% (-13.1, 4) Custom effect (ES) 0.12 (-0.21, 0.45) -0.14 (-0.44, 0.17) *↑ 0.28 (-0.13, 0.7) -0.15 (-0.48, 0.17) *↓ -0.2 (-0.55, 0.15)
Nm = newton-meters. Nm.s = newton-meter seconds. ECC = Eccentric. EQI = Eccentric quasi-isometric. Custom effect = difference (%) and Cohen’s d (ES) adjusted for individual total impulse and PRE value of the dependent variable. Data are mean ± standard deviation or the effect with (95% Compatibility intervals). Asterisks indicate substantial effects with adequate precision as follows: *possibly, **likely, ***very likely, ****most likely. ↑ = larger effect in ECC. ↓ = larger effect in EQI. Smallest
important difference were: peak torque = 3.4%; total impulse = 3.7%; impulse from 100-90º = 6.3%; 90-80º = 4.8%; 80-70º = 4.0%; 70-60º = 3.5%; 60-50º = 3.3%; 50-40º = 3.5%; 40-30º = 3.5%; 30-20º = 4.4%; 20-10º = 5.2%.

Appendices
244
Appendix 14. Raw angle specific maximal voluntary isometric torque and rate of torque development values at each time-point with custom effect of between-condition
deltas
Condition PRE POST 24 hours 48 hours 72 hours 7 days
MVIT (Nm)
40º
ECC 198.6 ± 44.3 182.7 ± 50.1 177.0 ± 42.6 180.2 ± 44.5 189.9 ± 44.9 200.2 ± 37.6 EQI 196.8 ± 46.2 188.7 ± 54.2 173.1 ± 38.6 184.8 ± 55.3 186.3 ± 55.8 194.1 ± 42.1
Custom effect (%) 2.5% (-6.3, 12.2) -0.9% (-8.8, 7.7) 2.6% (-6.9, 13.1) -2.2% (-10.1, 6.4) -2.7% (-9.2, 4.2)
Custom effect (ES) 0.08 (-0.28, 0.43) -0.03 (-0.37, 0.3) 0.1 (-0.29, 0.5) -0.09 (-0.43, 0.25) -0.11 (-0.39, 0.16)
70º
ECC 256.3 ± 68.2 209.9 ± 54.5 210.7 ± 68.4 219.4 ± 64.7 229.0 ± 63.8 244.3 ± 46.6
EQI 245.4 ± 59.3 226.7 ± 66.3 214.1 ± 63.7 228.2 ± 67.8 226.9 ± 61.1 244.6 ± 47.7 Custom effect (%) 10.4% (0, 21.9) 5.8% (-6.8, 20.2) 7.9% (-1.9, 18.7) 2.5% (-5.3, 10.9) 2.4% (-1.9, 6.9)
Custom effect (ES) **↑ 0.35 (0, 0.7) 0.2 (-0.25, 0.65) *↑ 0.27 (-0.07, 0.61) 0.09 (-0.19, 0.37) 0.09 (-0.07, 0.24)
100º
ECC 208.1 ± 44.4 175.1 ± 35.5 178.7 ± 45.3 184.1 ± 47.8 190.4 ± 43.7 203.6 ± 38.2
EQI 211.9 ± 40.4 197.1 ± 41.8 186.9 ± 39.1 193.0 ± 44.2 196.8 ± 34 207.8 ± 30.3 Custom effect (%) 9.8% (0.4, 20.1) 3.5% (-5.1, 12.8) 3.7% (-2.6, 10.5) 2.3% (-4.3, 9.4) 1.3% (-1.7, 4.4)
Custom effect (ES) **↑ 0.39 (0.01, 0.76) 0.14 (-0.22, 0.5) 0.15 (-0.11, 0.42) 0.1 (-0.18, 0.38) 0.05 (-0.07, 0.18)
RTD 0-200 ms (Nm·s-1)
40º ECC 679.8 ± 191 582.8 ± 224 543.2 ± 150 542.5 ± 140 552.8 ± 177 626.4 ± 147
EQI 681.9 ± 164 614.1 ± 222 511.0 ± 131 547.3 ± 112 570.3 ± 144 600.7 ± 137 Custom effect (%) 5.4% (-4.8, 16.7) -6.1% (-18.7, 8.5) 1.8% (-11.2, 16.8) 3.8% (-3.1, 11.3) -1.1% (-10.4, 9.2)
Custom effect (ES) *↑ 0.18 (-0.17, 0.52) -0.21 (-0.70, 0.27) 0.06 (-0.40, 0.52) 0.13 (-0.11, 0.36) -0.04 (-0.37, 0.29)
70º ECC 728.0 ± 254 561.3 ± 240 548.3 ± 167 568.5 ± 180 588 ± 211 687.6 ± 212
EQI 675.2 ± 211 632.3 ± 224 480.4 ± 180 554.8 ± 167 557.4 ± 157 584.0 ± 172
Custom effect (%) 32.3% (15.3, 51.8) -4.8% (-17.6, 10) 9.1% (-2.5, 22) 7.2% (-4.5, 20.2) 3.2% (-9.5, 13.6) Custom effect (ES) ****↑ 0.70 (0.36, 1.05) -0.12 (-0.49, 0.24) *↑ 0.22 (-0.06, 0.50) *↑ 0.17 (-0.11, 0.46) 0.08 (-0.20, 0.35)
100º ECC 608.5 ± 182 461.7 ± 140 498.2 ± 140 480.2 ± 146 572.0 ± 176 606.7 ± 180
EQI 624.3 ± 180 561.4 ± 209 518.4 ± 157 512.5 ± 148 543.1 ± 170 569.8 ± 138
Custom effect (%) 15.3 % (0.9, 31.7) 1.4% (-9.8, 14.1) 6.3% (-4.8, 18.7) -7.4% (-19.2, 6.1) -2.6% (-14.2, 10.5) Custom effect (ES) **↑ 0.42 (0.03, 0.82) 0.04 (-0.31, 0.39) *0.18↑ (-0.15, 0.51) *↓ -0.23 (-0.63, 0.18) -0.08 (-0.46, 0.30)
Nm = newton-meters. Nm·s-1 = newton-meters per second. MVIT = maximal voluntary isometric torque. RTD = rate of torque development. ECC = Eccentric. EQI = Eccentric quasi-isometric. Custom effect = difference (%) and Cohen’s d (ES) adjusted
for individual total impulse and PRE value of the dependent variable. Data are mean ± standard deviation or the effect with (95% Compatibility intervals). Asterisks indicate substantial effects with adequate precision as follows: *possibly, **likely, ***very likely, ****most likely. ↑ = larger effect in ECC. ↓ = larger effect in EQI. Smallest important difference at 40º/70º/100º were: MVIT = 5.0%/5.7%/4.8%; RTD 0-200 = 6.1%/8.0%/6.8%.

Appendices
245
Appendix 15. Comparison of angular impulse (Nm.s-1) between contractions
Comparison
Total impulse 30-40º 40-50º 50-60º 60-70º 70-80º 80-90º 90-100º
Mean
± SD Δ
Mean
± SD Δ
Mean
± SD Δ
Mean
± SD Δ
Mean
± SD Δ
Mean
± SD Δ
Mean
± SD Δ
Mean
± SD Δ
C1 12267
± 5233 ES = 0.30
(-0.02, 0.50)
13.4%
443
± 480 ES = -0.09
(-0.56, 0.39)
-9.5%
2925
± 2615 ES = 0.33
(-0.06, 0.72)
29.6%
3073
± 2042 ES = 0.20
(-0.13, 0.53)
13.5%
2305
± 1810 ES = 0.03
(-0.67, 0.86)
2.5%
1557
± 1166 ES = 0.16
(-0.38, 0.70)
12.2%
1076
± 1634 ES = 0.09
(-0.79, 0.96)
10.9%
356
± 384 ES = -0.18
(-0.80, 0.44)
-21.3% C2 10623 ± 4238
485
± 459
2059 ± 1903
2658 ± 1739
2248 ± 1208
1367 ± 1096
959 ± 779
432
± 398
C1 12267 ± 5233
ES = 0.51* (0.15, 0.85)
22.4%
443 ± 480
ES = 0.17 (-0.22, 0.57)
18.7%
2925 ± 2615
ES = 0.82* (0.11, 1.53)
64.3%
3073 ± 2042
ES = 0.33 (-0.29, 0.95)
21.8%
2305 ± 1810
ES = 0.09 (-0.67, 0.86)
6.6%
1557
± 1166 ES = -0.26
(-0.85, 0.35)
-24.3%
1076 ± 1634
ES = 0.17 (-0.65, 0.99)
20.4%
356 ± 384
ES = 0.15 (-0.23, 0.52)
16.0% C3 9517
± 3592
360
± 303
1043
± 1113
2403
± 1716
2154
± 1117
1935
± 1555
857
± 621
299
± 274
C1 12267
± 5233 ES = 0.72***
(0.40, 1.04)
33.8%
443
± 480 ES = 0.30
(-0.01, 0.60)
50.1%
2925
± 2615 ES = 0.90**
(0.23, 1.57)
74.1%
3073
± 2042 ES = 0.60
(-0.02, 1.21)
38.2%
2305
± 1810 ES = 0.16
(-0.63, 0.94)
11.5%
1557
± 1166 ES = 0.41
(-0.08, 0.74)
33.8%
1076
± 1634 ES = -0.09
(-0.94, 0.76)
-13.4%
356
± 384 ES = -0.19
(-0.68, 0.31)
-22.8% C4
8119
± 3415
221
± 145
757
± 774
1900
± 1550
2041
± 1330
1030
± 674
1220
± 1336
437
± 434
C2 10623
± 4237 ES = 0.25
(-0.02, 0.47)
11.6%
485
± 459 ES = 0.25
(-0.04, 0.53)
34.7%
2059
± 1903 ES = 0.53*
(0.10, 0.96)
49.3%
2658
± 1739 ES = 0.13
(-0.37, 0.64)
9.6%
2248
± 1208 ES = 0.08
(-0.24, 0.39)
4.2%
1367
± 1096 ES = -0.37
(-0.81, 0.07)
-41.6%
959
± 779 ES = 0.12
(-0.14, 0.39)
10.6%
432
± 398 ES = 0.35
(-0.21, 0.92)
30.8% C3 9517
± 3592
360
± 303
1043
± 1113
2403
± 1716
2154
± 1117
1935
± 1555
857
± 621
299
± 274
C2 10623
± 4237 ES = 0.53** (0.32, 0.74)
23.6%
485
± 459 ES = 0.52
(-0.07, 0.97)
54.4%
2059
± 1903 ES = 0.69* (0.16, 1.22)
63.2%
2658
± 1739 ES = 0.43
(-0.04, 0.90)
28.5%
2248
± 1208 ES = 0.15
(-0.46, 0.76)
9.2%
1367
± 1096 ES = 0.34
(-0.28, 0.95)
24.7%
959
± 779 ES = -0.16
(-0.43, 0.11)
-27.2%
432
± 398 ES = -0.01
(-0.61, 0.59)
-1.2% C4 8119
± 3415
221
± 145
757
± 774
1900
± 1550
2041
± 1330
1030
± 674
1220
± 1336
437
± 434
C3 9517
± 3592 ES = 0.37*
(0.19, 0.55)
14.7%
360
± 303 ES = 0.43
(-0.02, 0.85)
38.6%
1043
± 1113 ES = 0.24
(-0.06, 0.54)
27.4%
2403
± 1716 ES = 0.28
(-0.01, 0.54)
20.9%
2154
± 1117 ES = 0.08
(-0.25, 0.42)
5.5%
1935
± 1555 ES = 0.67
(-0.05, 1.40)
87.9%
857
± 621 ES = -0.18
(-0.42, 0.05)
-42.4%
299
± 274 ES = -0.32
(-0.75, 0.11)
-46.2% C4
8119 ± 3415
221 ± 145
757 ± 774
1900 ± 1550
2041 ± 1330
1030 ± 674
1220
± 1336
437
± 434
Δ = decrease. C1 = contraction 1. C2 = contraction 2. C3 = contraction 3. C4 = contraction 4. SD = standard deviation. ES = paired Hedges’ g effect size. Brackets show 95% compatibility limits of the ES. Bold = increase between sets. *p < 0.05.
**p < 0.01. ***p < 0.001. (p-values are Bonferroni corrected).

Appendices
246
Appendix 16. Comparison of time-under-tension (seconds) between contractions
Comparison
Total duration 30-40º 40-50º 50-60º 60-70º 70-80º 80-90º 90-100º
Mean
± SD Δ
Mean
± SD Δ
Mean
± SD Δ
Mean
± SD Δ
Mean
± SD Δ
Mean
± SD Δ
Mean
± SD Δ
Mean
± SD Δ
C1 64.7
± 32.5 ES = 0.22
(-0.01, 0.45)
11.8%
2.83
± 3.25 ES = -0.07
(-0.61, 0.47)
-8.8%
16.1 ± 13.8
ES = 0.33
(-0.09, 0.74)
8.0%
17.5 ± 12.5
ES = 0.18
(-0.17, 0.52)
12.6%
13.6 ± 10.8
ES = 0.05
(-0.61, 0.70)
2.9%
10.8 ± 8.78
ES = 0.29
(-0.25, 0.83)
23.0%
6.42 ± 8.55
ES = 0.07
(-0.77, 0.91)
7.8%
2.56
± 2.99 ES = -0.04
(-0.56, 0.48)
-4.3% C2
57.1 ± 27.8
3.08
± 3.48
11.6 ± 10.6
15.3 ± 9.90
13.2 ± 8.10
8.32 ± 7.44
5.92 ± 4.55
2.67
± 2.39
C1 64.7
± 32.5 ES = 0.42
(-0.10, 0.75)
22.3%
2.83 ± 3.25
ES = 0.24
(-0.21, 0.68)
26.9%
16.1 ± 13.8
ES = 0.78*
(0.13, 1.42)
60.3%
17.5 ± 12.5
ES = 0.36
(-0.20, 0.91)
24.0%
13.6 ± 10.8
ES = 0.06
(-0.70, 0.83)
3.7%
10.8
± 8.78 ES = -0.08
(-0.38, 0.24)
-7.41%
6.42 ± 8.55
ES = 0.14
(-0.64, 0.94)
16.5%
2.56 ± 2.99
ES = 0.16
(-0.15, 0.46)
19.5% C3
50.3 ± 22.6
2.07 ± 1.98
6.40 ± 7.15
13.3 ± 9.11
13.1 ± 6.60
11.6
± 10.2
5.36 ± 4.15
2.06 ± 2.00
C1 64.7
± 32.5 ES = 0.61** (0.31, 0.92)
34.2%
2.83 ± 3.25
ES = 0.39* (0.02, 0.77)
56.9%
16.1 ± 13.8
ES = 0.88** (0.26, 1.49)
71.6%
17.5 ± 12.5
ES = 0.52 (-0.02, 1.02)
36.0%
13.6 ± 10.8
ES = 0.24 (-0.54, 1.01)
16.2%
10.8 ± 8.78
ES = 0.58 (-0.05, 1.11)
45.4%
6.42
± 8.55 ES = -0.14
(-0.96, 0.69)
-19.3%
2.56
± 2.99 ES = -0.12
(-0.53, 0.29)
-15.6% C4 42.6
± 21.4 1.22
± 0.98 4.57
± 4.98 11.2
± 9.24 11.4
± 6.86 5.90
± 3.83 7.66
± 8.37
2.96
± 3.15
C2 57.1
± 27.8 ES = 0.20
(-0.05, 0.35)
11.9%
3.08
± 3.48 ES = 0.28
(-0.10, 0.65)
32.8%
11.6
± 10.6 ES = 0.49*
(0.09, 0.89)
44.8%
15.3
± 9.9 ES = 0.20
(-0.22, 0.62)
13.1%
13.2
± 8.10 ES = 0.01
(-0.46, 0.48)
0.76%
8.32
± 7.44 ES = -0.33
(-0.77, 0.12)
39.4%
5.92
± 4.55 ES = 0.12
(-0.16, 0.40)
9.5%
2.67
± 2.39 ES = 0.26
(-0.25, 0.76)
22.9% C3
50.3
± 22.6
2.07
± 1.98
6.40
± 7.15
13.3
± 9.11
13.1
± 6.6
11.6
± 10.2
5.36
± 4.15
2.06
± 2.00
C2 57.1
± 27.8 ES = 0.44**
(0.25, 0.64)
25.4%
3.08 ± 3.48
ES = 0.49*
(0.02, 0.96)
60.4%
11.6 ± 10.6
ES = 0.69*
(0.16, 1.21)
60.6%
15.3 ± 9.9
ES = 0.39
(-0.04, 0.74)
26.8%
13.2 ± 8.10
ES = 0.23
(-0.35, 0.80)
13.6%
8.32 ± 7.44
ES = 0.36
(-0.24, 0.96)
29.1%
5.92
± 4.55 ES = -0.18
(-0.47, 0.12)
-29.4%
2.67
± 2.39 ES = -0.10
(-0.69, 0.50)
-10.9% C4 42.6
± 21.4
1.22
± 0.98
4.57
± 4.98
11.2
± 9.24
11.4
± 6.86
5.90
± 3.83
7.66
± 8.37
2.96
± 3.15
C3 50.3
± 22.6 ES = 0.32** (0.15, 0.49)
15.3%
2.07
± 1.98 ES = 0.38* (0.03, 0.73)
41.1%
6.40
± 7.15 ES = 0.23
(-0.03, 0.49)
28.6%
13.3
± 9.11 ES = 0.21
(-0.07, 0.50)
15.8%
13.1
± 6.60 ES = 0.24
(-0.01, 0.47)
13.0%
11.6
± 10.2 ES = 0.66
(-0.07, 1.39)
49.1%
5.36
± 4.15 ES = -0.21
(-0.47, 0.06)
-42.9%
2.06
± 2.00 ES = -0.29
(-0.73, 0.15)
-43.7% C4 42.6
± 21.4 1.22 ± 0.98
4.57 ± 4.98
11.2 ± 9.24
11.4 ± 6.86
5.90 ± 3.83
7.66
± 8.37
2.96
± 3.15
Δ = decrease. C1 = contraction 1. C2 = contraction 2. C3 = contraction 3. C4 = contraction 4. SD = standard deviation. ES = paired Hedges’ g effect size. Brackets show 95% compatibility limits of the ES. Bold = increase between sets. *p <
0.05. **p < 0.01. (p-values are Bonferroni corrected).

Appendices
247
Appendix 17. Comparison of velocity (degrees per second) between contractions
Comparison
Mean velocity 30-40º 40-50º 50-60º 60-70º 70-80º 80-90º 90-100º
Mean
± SD Δ
Mean
± SD Δ
Mean
± SD Δ
Mean
± SD Δ
Mean
± SD Δ
Mean
± SD Δ
Mean
± SD Δ
Mean
± SD Δ
C1 1.08
± 2.2 ES = 0.16
(-0.08, 0.40)
13.9%
3.53
± 3.1 ES = -0.09
(-0.63, 0.45)
-7.9%
0.62
± 0.73 ES = 0.29
(-0.07, 0.72)
38.7%
0.57
± 0.80 ES = 0.12
(-0.31, 0.55)
14.0%
0.74
± 0.93 ES = 0.04
(-0.72, 0.77)
2.7%
0.93
± 1.1 ES = 0.24
(-0.33, 0.81)
29.0%
1.56
± 1.2 ES = 0.08
(-0.72, 0.88)
8.3%
3.91
± 3.4 ES = -0.04
(-0.58, 0.50)
-3.8% C2
1.23 ± 2.5
3.25
± 2.9
0.86 ± 0.94
0.65 ± 1.0
0.76 ± 1.2
1.20 ± 1.3
1.69 ± 2.2
3.75
± 4.2
C1 1.08 ± 2.2
ES = 0.29
(-0.24, 0.68)
28.7%
3.53 ± 3.1
ES = 0.29
(-0.27, 0.73)
36.8%
0.62 ± 0.73
ES = 0.80*
(0.10, 1.50)
152%
0.57 ± 0.80
ES = 0.22
(-0.38, 0.82)
31.6%
0.74 ± 0.93
ES = 0.04
(-0.72, 0.80)
2.7%
0.93
± 1.1 ES = -0.06
(-0.34, 0.22)
-7.53%
1.56 ± 1.2
ES = 0.17
(-0.61, 0.95)
19.9%
3.91 ± 3.4
ES = 0.19
(-0.11, 0.49)
24.0% C3 1.39
± 3.1
4.83
± 5.1
1.56
± 1.4
0.75
± 1.1
0.76
± 1.5
0.86
± 0.98
1.87
± 2.4
4.85
± 5.0
C1 1.08 ± 2.2
ES = 0.48** (0.18, 0.78)
51.9%
3.53 ± 3.1
ES = 0.41* (0.04, 0.79)
132%
0.62 ± 0.73
ES = 0.98*** (-0.48, 1.48)
253%
0.57 ± 0.80
ES = 0.41 (-0.05, 0.87)
56.1%
0.74 ± 0.93
ES = 0.19 (-0.57, 0.95)
18.9%
0.93 ± 1.1
ES = 0.42 (-0.15, 0.99)
82.8%
1.56
± 1.2 ES = -0.18
(-0.97, 0.61)
-16.0%
3.91
± 3.4 ES = -0.14
(-0.53, 0.25)
-13.6% C4 1.64 ± 3.3
8.20 ± 10.0
2.19 ± 2.0
0.89 ± 1.1
0.88 ± 1.5
1.70 ± 2.6
1.31
± 1.2
3.38
± 3.2
C2 1.23 ± 2.5
ES = 0.16 (-0.07, 0.39)
13.0%
3.25 ± 2.9
ES = 0.32 (-0.06 0.70)
48.6%
0.86 ± 0.94
ES = 0.54* (0.12, 0.96)
81.4%
0.65 ± 1.0
ES = 0.11 (-0.34, 0.56)
15.4%
0.76 ± 1.2
ES = 0.00 (-0.52, 0.52)
0.00%
1.20
± 1.3 ES = -0.30
(-0.80, 0.20)
-28.3%
1.69 ± 2.2
ES = 0.09 (-0.32, 0.50)
10.7%
3.75 ± 4.2
ES = 0.24 (-0.29, 0.77)
29.3% C3 1.39 ± 3.1
4.83 ± 5.1
1.56 ± 1.4
0.75 ± 1.1
0.76 ± 1.5
0.86
± 0.98
1.87 ± 2.4
4.85 ± 5.0
C2 1.23 ± 2.5
ES = 0.30*
(0.02, 0.58)
33.3%
3.25 ± 2.9
ES = 0.55*
(0.07, 1.04)
152%
0.86 ± 0.94
ES = 0.76*
(0.04, 1.48)
155%
0.65 ± 1.0
ES = 0.28
(-0.24, 0.80)
36.9%
0.76 ± 1.2
ES = 0.15
(-0.48, 0.78)
15.8%
1.20 ± 1.3
ES = 0.29
(-0.23, 0.81)
41.7%
1.69
± 2.2 ES = -0.20
(-0.50, 0.10)
-22.5%
3.75
± 4.2 ES = -0.11
(-0.71, 0.49)
-9.9% C4 1.64
± 3.3
8.20
± 10.0
2.19
± 2.0
0.89
± 1.1
0.88
± 1.5
1.70
± 2.6
1.31
± 1.2
3.38
± 3.2
C3 1.39 ± 3.1
ES = 0.25*
(0.02, 0.48)
18.0%
4.83 ± 5.1
ES = 0.41
(-0.01, 0.74)
69.8%
1.56 ± 1.4
ES = 0.30
(-0.02, 0.62)
40.4%
0.75 ± 1.1
ES = 0.15
(-0.17, 0.47)
18.7%
0.76 ± 1.5
ES = 0.14
(-0.17, 0.45)
15.8%
0.86 ± 0.98
ES = 0.55
(-0.18, 1.28)
97.7%
1.87
± 2.4 ES = -0.25
(-0.48, 0.02)
-30.0%
4.85
± 5.0 ES = -0.31
(-0.78, 0.16)
-30.3% C4 1.64
± 3.3
8.20
± 10.0
2.19
± 2.0
0.89
± 1.1
0.88
± 1.5
1.70
± 2.6
1.31
± 1.2
3.38
± 3.2
Δ = increase. C1 = contraction 1. C2 = contraction 2. C3 = contraction 3. C4 = contraction 4. SD = standard deviation. ES = paired Hedges’ g effect size. Brackets show 95% compatibility limits of the ES. Bold = decrease between sets. *p <
0.05. **p < 0.01. (p-values are Bonferroni corrected).

Appendices
248
Appendix 18. Ethical approval for Chapters 4-10

Appendices
249
Appendix 19. Participant information sheet for Chapters 4-10

Appendices
250

Appendices
251

Appendices
252
Appendix 20. Consent form for Chapters 4-10

Appendices
253
Appendix 21. Advertisement for Chapters 4-10

Appendices
254
Appendix 28. Additional peer-reviewed journal outputs since starting the PhD
Watkins CM, Maunder E, van den Tillaar R, and Oranchuk DJ. Concurrent validity and
reliability of three ultra-portable vertical jump assessment technologies. Sensors 20: 7240,
2020.
Mira J, Floreani M, Savoldelli A, Amery K, Koral J, Oranchuk DJ, Messonnier L, Rupp T,
and Millet GY. Neuromuscular fatigue of cycling exercise in hypoxia. Med Sci Sports Exerc
52: 1888-1889, 2020.
Oranchuk DJ, Mannerberg JM, Robinson TL, and Nelson MC. Eight weeks of strength and
power training improves club head speed in collegiate golfers. J Strength Cond Res 34: 2205-
2213, 2020.
Oranchuk DJ, Koral J, da Mota GR, Wrightson J, Soares R, Twomey R, and Millet GY. Effect
of blood flow occlusion on neuromuscular fatigue following sustained maximal isometric
contraction. Appl Physiol Nutr Metab 45: 698-706, 2020.
van den Tillaar R, Roaas T, and Oranchuk DJ. Comparison of effect of training order of
explosive strength and plyometrics training upon different physical abilities in adolescent
handball players. Biol Sport 3: 239-246, 2020.
Koral J, Oranchuk DJ, Wrightson JG, Twomey R, and Millet GY. Mechanisms of
neuromuscular fatigue and recovery in unilateral versus bilateral maximal voluntary
contractions. J Appl Physiol 128: 785-794, 2020.
Stock MS, Oranchuk DJ, Burton AM, and Phan DC. Age-, sex-, and region-specific
differences in skeletal muscle size and quality. Appl Physiol Nutr Metab 45: 1253-1260, 2020.
Oranchuk DJ, Ecsedy EN, and Robinson TL. Effects of a sport-specific upper-body
resistance-band training program on overhead throwing velocity and glenohumeral joint range
of motion. J Strength Cond Res Ahead of print, 2020.
da Silva BVC, Bertucci D, Branco T, Ide BN, Marocolo M, de Souza HLR, de Oliveira RAA,
Oranchuk DJ, and da Mota GR. Comparison of high-volume and high-intensity upper body
resistance exercise on acute neuromuscular outputs and perceived exertion Int J Exerc Sci 13:
723-733, 2020.
Oranchuk DJ, Flattery MR, and Robinson TL. Superficial heat administration and foam
rolling increase hamstring flexibility acutely; with amplifying effects. Phys Ther Sport 40: 213-
217, 2019.
Oranchuk DJ, Drinkwater EJ, Lindsay RS, Helms ER, Harbour ET, and Storey AG.
Improvement of kinetic, kinematic, and qualitative performance variables of the power clean
with the hook grip. Int J Sports Physiol Perform 14: 378-384, 2019.
Oranchuk DJ, Robinson TL, Switaj ZJ, and Drinkwater EJ. Comparison of the hang high-pull
and loaded jump squat for the development of vertical jump and isometric force-time
characteristics. J Strength Cond Res 33: 17-24, 2019.

Appendices
255
Nichols DT, Robinson TL, and Oranchuk DJ. Kinesiology taping of the ankle does not
improve dynamic balance in NCAA athletes. Athl Train Sports Health Care 11: 10-18, 2018.
da Silva BVC, Simim MAM, Reis Viegas LC, Brigido TS, Oranchuk DJ, and da Mota GR.
The acute hypotensive effect of resistance training performed with machines vs free weights in
normotensive men. Motriz 24: e1018173, 2018.
Koral J, Oranchuk DJ, Herrera R, and Millet GY. Six sessions of sprint interval training
improves running performance in trained athletes. J Strength Cond Res 32: 617-623, 2018.

Appendices
256
Appendix 29. Peer-reviewed conference proceedings since starting the PhD
Oranchuk DJ, Hopkins WG, Storey AG, Cronin JB and Nelson AR. The isometric length-
tension relationship is not differentially affected by regional quadriceps muscle architecture.
European College of Sport Science, Saville, Spain. (International conference, poster
presentation)
Adkins SJ, Robinson TL, Martinez MM, and Oranchuk DJ. Effects of electrical stimulation
versus exercise on abdominal muscle activity, strength, endurance, fat and muscle thicknesses. American Council of Sports Medicine: Rocky Mountain Region, Estes Park,
Colorado. (Regional conference, poster presentation) (Cancelled due to Covid-19), 2020.
Oranchuk DJ, Storey AG, Nelson AR, Cronin JB, and Franchi MV. Accuracy and reliability
of extended-field-of-view ultrasonography in the assessment of vastus lateralis pennation angle
and muscle thickness: A preliminary report. Sport Performance Research Institute New
Zealand annual conference, Denver, Colorado. (Local conference, poster presentation), 2019.
Sheppard D, Oranchuk DJ, Klawitter LA, and Robinson TL. Variations in Wingate load to
optimize peak power output in NCAA DII collegiate athletes. American Council of Sports
Medicine: Rocky Mountain Region, Denver, Colorado. (Regional conference, poster
presentation), 2019.
Oranchuk DJ, Lindsay RS, Helms ER, Harbour ET, Storey AG, and Drinkwater EJ. Hook-
grip improves power clean kinetics and kinematics. 36th International Conference on
Biomechanics in Sports, Auckland, New Zealand. (International conference, oral podium
presentation), 2018.
Rupp T, Mira J, Floreani M, Savoldelli A, Amery K, Koral J, Oranchuk DJ, and Millet GY.
Neuromuscular fatigue in hypoxia revisited. European College of Sport Science, Dublin,
Ireland, (International conference, Oral podium presentation), 2018.
Greenfield M, Robinson TL, Klawitter LA, and Oranchuk DJ. Performance differences with
stance variance in weightlifting. American Council of Sports Medicine: Rocky Mountain
Region, Denver, Colorado. (Regional conference, poster presentation), 2018.

Appendices
257
Appendix 30. Chapter 2 abstract
Isometric training is used in the rehabilitation and physical preparation of athletes, special
populations, and the general public. However, little consensus exists regarding training
guidelines for a variety of desired outcomes. Understanding the adaptive response to specific
loading parameters would be of benefit to practitioners. The objective of this systematic review,
therefore, was to detail the medium to long-term adaptations of different types of isometric
training on morphological, neurological and performance variables. Exploration of the relevant
subject matter was performed through MEDLINE, PubMed, SPORTDiscus and CINAHL
databases. English, full-text, peer-reviewed journal articles and unpublished doctoral
dissertations investigating medium to long-term (≥ 3 weeks) adaptations to isometric training
in humans were identified. These studies were evaluated further for methodological quality.
Twenty-six research outputs were reviewed. Isometric training at longer muscle lengths (0.86-
1.69%·week-1, ES = 0.03-0.09·week-1) produced greater muscular hypertrophy when compared
to equal volumes of shorter muscle length training (0.08-0.83%·week-1, ES = -0.003-
0.07·week-1). Ballistic intent resulted in greater neuromuscular activation (1.04-10.5%·week-1,
ES = 0.02-0.31·week-1 vs 1.64-5.53%·week-1, ES = 0.03-0.20·week-1) and rapid force
production (1.2-13.4%·week-1, ES = 0.05-0.61·week-1 vs 1.01-8.13%·week-1, ES = 0.06-
0.22·week-1). Substantial improvements in muscular hypertrophy and maximal force
production were reported regardless of training intensity. High-intensity (≥ 70%) contractions
are required for improving tendon structure and function. Additionally, long muscle length
training results in greater transference to dynamic performance. Despite relatively few studies
meeting the inclusion criteria, this review provides practitioners with insight into which
isometric training variables (e.g., joint angle, intensity, intent) to manipulate to achieve desired
morphological and neuromuscular adaptations.

Appendices
258
Appendix 31. Chapter 3 abstract
Eccentric quasi-isometric (EQI) resistance training involves holding a submaximal, yielding
isometric contraction until fatigue causes muscle lengthening, then maximally resisting
through a range of motion. Practitioners contend that EQI contractions are a powerful tool for
the development of several physical qualities important to health and sports performance.
Additionally, several sports involve regular quasi-isometric contractions for optimal
performance. Therefore, the primary objective of this review was to synthesize and critically
analyze relevant biological, physiological, and biomechanical research and develop a rationale
for the value of EQI training. Additionally, this review offers potential practical applications
and highlights future areas of research. While there is a paucity of research investigating EQIs,
the literature on responses to traditional contraction types is vast. Based on relevant literature,
EQIs may provide a practical means of increasing total volume, metabolite build-up and
hormonal signalling factors while safely enduring large quantities of mechanical tension with
low levels of peak torque. Conversely, EQI contractions likely hold little neuromuscular
specificity to high velocity or power movements. Therefore, EQI training appears to be
effective for improving musculotendonous morphological and performance variables with low
injury risk. Although speculative due to the limited specific literature, available evidence
suggests a case for future experimentation.
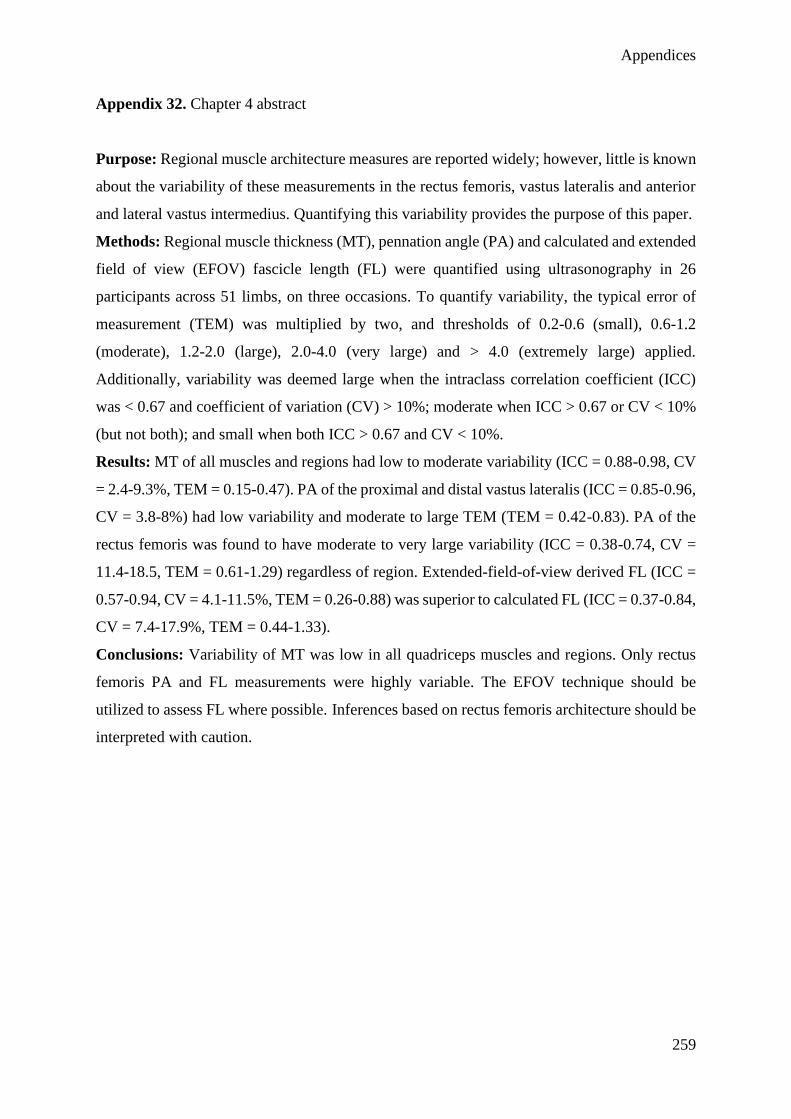
Appendices
259
Appendix 32. Chapter 4 abstract
Purpose: Regional muscle architecture measures are reported widely; however, little is known
about the variability of these measurements in the rectus femoris, vastus lateralis and anterior
and lateral vastus intermedius. Quantifying this variability provides the purpose of this paper.
Methods: Regional muscle thickness (MT), pennation angle (PA) and calculated and extended
field of view (EFOV) fascicle length (FL) were quantified using ultrasonography in 26
participants across 51 limbs, on three occasions. To quantify variability, the typical error of
measurement (TEM) was multiplied by two, and thresholds of 0.2-0.6 (small), 0.6-1.2
(moderate), 1.2-2.0 (large), 2.0-4.0 (very large) and > 4.0 (extremely large) applied.
Additionally, variability was deemed large when the intraclass correlation coefficient (ICC)
was < 0.67 and coefficient of variation (CV) > 10%; moderate when ICC > 0.67 or CV < 10%
(but not both); and small when both ICC > 0.67 and CV < 10%.
Results: MT of all muscles and regions had low to moderate variability (ICC = 0.88-0.98, CV
= 2.4-9.3%, TEM = 0.15-0.47). PA of the proximal and distal vastus lateralis (ICC = 0.85-0.96,
CV = 3.8-8%) had low variability and moderate to large TEM (TEM = 0.42-0.83). PA of the
rectus femoris was found to have moderate to very large variability (ICC = 0.38-0.74, CV =
11.4-18.5, TEM = 0.61-1.29) regardless of region. Extended-field-of-view derived FL (ICC =
0.57-0.94, CV = 4.1-11.5%, TEM = 0.26-0.88) was superior to calculated FL (ICC = 0.37-0.84,
CV = 7.4-17.9%, TEM = 0.44-1.33).
Conclusions: Variability of MT was low in all quadriceps muscles and regions. Only rectus
femoris PA and FL measurements were highly variable. The EFOV technique should be
utilized to assess FL where possible. Inferences based on rectus femoris architecture should be
interpreted with caution.

Appendices
260
Appendix 33. Chapter 5 abstract
Quantifying echo intensity (EI), a proposed measure of muscle quality, is becoming
increasingly popular. Additionally, much attention has been paid to regional differences in
other ultrasonically evaluated measures of muscle morphology and architecture. However, the
variability of regional (proximal, middle, distal) EI of the vastus lateralis, rectus femoris, and
lateral and anterior vastus intermedius has yet to be determined. Twenty participants (40 limbs),
were evaluated on three occasions, separated by seven days. Intersession variability of EI with
and without subcutaneous fat correction was quantified. Furthermore, the interchangeability of
corrected EI across regions was evaluated. Variability of regional quadriceps EI was
substantially lower with subcutaneous fat correction (ICC = 0.81-0.98, CV = 4.5-16.8%, TEM
= 0.13-0.49) versus raw values (ICC = 0.69-0.98, CV = 7.7-42.7%, TEM = 0.14-0.68),
especially when examining the vastus intermedius (ICC = 0.81-0.95, CV = 7.1-16.8%, TEM =
0.23-0.49 vs ICC = 0.69-0.92, CV = 22.9-42.7%, TEM = 0.31-0.68). With the exception of the
rectus femoris and vastus intermedius (p ≥ 0.143, ES ≤ 0.18), corrected EI was greater for
proximal and distal regions when compared to the mid-point (p ≤ 0.038, ES = 0.38-0.82).
Researchers and practitioners should utilize subcutaneous fat thickness correction to
confidently evaluate EI at all regions of the quadriceps. Regional EI cannot be used
interchangeably for the vastus muscles, likely due to an increase in fibrous content towards the
myotendinous junctions.
Novelty bullets:
• Regional quadriceps echo intensity was reliable with and without correction for
subcutaneous fat thickness.
• Intersession variability of regional quadriceps echo intensity was substantially
improved following subcutaneous fat correction.
• Quadriceps echo intensity increased towards myotendinous junctions in the vastus
muscles.

Appendices
261
Appendix 34. Chapter 6 abstract
Objective: Length-tension relationships are widely reported in research, rehabilitation and
performance settings; however, several isometric contractions at numerous angles are needed
to understand these muscular outputs. Perhaps a more efficient way to determine torque-angle
characteristics is via isokinetic dynamometry; however, little is known about the variability of
isokinetic measurements besides peak torque and optimal-angle. This paper examines the
variability of angle-specific isokinetic torque and impulse measures.
Approach: Three sessions of concentric (60º·s-1) knee extensions were performed by both
limbs of 32 participants. Assessments were repeated on three occasions, separated by 5-8 days.
To quantify variability, the standardized typical error of measurement (TEM) was doubled and
thresholds of 0.2-0.6 (small), 0.6-1.2 (moderate), 1.2-2.0 (large), 2.0-4.0 (very large) and > 4.0
(extremely large) were applied. Additionally, variability was deemed large when the intraclass
correlation coefficient (ICC) was < 0.67 and coefficient of variation (CV) > 10%; moderate
when ICC > 0.67 or CV < 10% (but not both); and small when both ICC > 0.67 and CV < 10%.
Main Results: Isokinetic torque and angular impulse show small to medium variability (ICC
= 0.75-0.96, CV = 6.4-15.3%, TEM = 0.25-0.53) across all but the longest (100°) and shortest
(10°) muscle lengths evaluated. However, moderate to large variability was found for the
optimal-angle (ICC = 0.58-0.64, CV = 7.3-8%, TEM = 0.76-0.86), and torque and impulse at
the beginning and end of the range of motion (ICC = 0.57-0.85, CV = 11-42.9%, TEM = 0.40-
0.89). Intersession variability of isokinetic torque and impulse were small to moderate at
medium (90-20°) joint angles.
Significance: Researchers and practitioners can examine the muscle torque-angle relationship
and activity-specific torque outputs within these ranges, without resorting to more strenuous
and time-consuming isometric evaluations.

Appendices
262
Appendix 35. Chapter 7 abstract
Measurements of isometric force, rate of force development (RFD) and impulse are widely
reported. However, little is known about the variability and reliability of these measurements
at multiple angles, over repeated testing occasions in a homogenous, resistance-trained
population. Thus, understanding the intersession variability of multi-angle isometric force-time
characteristics provides the purpose of this paper. Three sessions of isometric knee extensions
at 40º, 70º and 100º of flexion were performed by 26 subjects across 51 limbs. All assessments
were repeated on three occasions separated by 5-8 days. Variability was qualified by doubling
the typical error of measurement (TEM), with thresholds of 0.2-0.6 (small), 0.6-1.2 (moderate),
1.2-2.0 (large), 2.0-4.0 (very large) and > 4.0 (extremely large). Additionally, variability was
deemed large when the intraclass correlation coefficient (ICC) was < 0.67 and coefficient of
variation (CV) > 10%; moderate when ICC > 0.67 or CV < 10% (but not both); and small when
both ICC > 0.67 and CV < 10%. Small to moderate between-session variability (ICC = 0.68-
0.95, CV = 5.2-18.7%, TEM = 0.24-0.49) was associated with isometric peak force, regardless
of angle. Moderate to large variability was seen in early-stage (0-50 ms) RFD and impulse
(ICC = 0.60-0.80, CV = 22.4-63.1%, TEM = 0.62-0.74). Impulse and RFD at 0-100 ms, 0-200
ms and 100-200 ms were moderately variable (ICC = 0.71-0.89, CV = 11.8-42.1%, TEM =
0.38-0.60) at all joint angles. Isometric peak force and late-stage isometric RFD and impulse
measurements were found to have low intersession variability regardless of joint angle.
However, practitioners need to exercise caution when making inferences about early-stage
RFD and impulse measures due to moderate-large variability.

Appendices
263
Appendix 36. Chapter 8 abstract
The length-tension relationship affects knee extension performance; however, whether
anatomical variations in different quadriceps regions affect this relationship is unknown.
Regional (proximal, middle, distal) quadriceps thickness (MT), pennation angle (PA), and
fascicle length (FL) of 24 males (48 limbs) were assessed via ultrasonography. Participants
also performed maximal voluntary isometric torque (MVIT) assessments at 40º, 70º, and 100º
of knee flexion. Measures were recorded on three separate occasions. Linear regression models
predicting angle-specific torque from regional anatomy provided adjusted simple and multiple
correlations (adjR2) with bootstrapped compatibility limits to assess magnitude. Middle
vastus lateralis MT and MVIT at 100° (adjR2 = 0.64) was the largest single correlation, with
distal vastus lateralis MT having the greatest mean correlations regardless of angle (adjR2 =
0.61 ± 0.05, mean ± SD). Lateral distal MT and architecture had larger (ΔadjR2 = 0.01-0.43)
single and multiple correlations with MVIT than the lateral proximal (adjR2 = 0.15-0.69 vs -
0.08-0.65). Conversely, middle anterior MT had greater (ΔadjR2 = 0.08-0.38) single and
multiple correlations than proximal MT (adjR2 = 0.09-0.49 vs -0.21-0.14). The length-tension
relationship was trivially affected by regional quadriceps architecture. The middle and distal
quadriceps were the strongest predictors of MVIT at all joint angles. Therefore, researchers
may wish to focus on middle and distal lateral quadriceps anatomy when performing
ultrasonographic evaluations.
Novelty bullets:
• The length-tension relationship is minimally affected by regional quadriceps
anatomical parameters.
• Middle and distal vastus lateralis and lateral vastus intermedius anatomy were
consistently the best predictors of torque.
• Practitioners may focus their assessments on the middle and distal regions of the lateral
quadriceps’ musculature.

Appendices
264
Appendix 37. Chapter 9 abstract
Purpose: Eccentric quasi-isometric (EQI) contractions have been proposed as a novel training
method for safely exposing the musculotendinous system to a large mechanical load/impulse,
with few repetitions. However, understanding of this contraction type is rudimentary. We
aimed to compare the acute effects of a single session of isotonic EQIs with isokinetic eccentric
(ECC) contractions.
Methods: Fifteen well-trained men performed a session of impulse-equated EQI and ECC knee
extensions, with each limb randomly allocated to one contraction type. Immediately PRE,
POST, 24/48/72 h, and 7 days post-exercise, regional quadriceps soreness, swelling,
architecture, and echo intensity were evaluated. Peak concentric and isometric torque, rate of
torque development (RTD), and angle-specific impulse were evaluated at each time point.
Results: There were substantial differences in number of contractions (ECC: 100.8 ± 54; EQI:
3.85 ± 1.1) and peak torque (mean: ECC: 215 ± 54 Nm; EQI: 179 ± 28.5 Nm). Both conditions
elicited similar responses in 21/53 evaluated variables. EQIs resulted in greater vastus
intermedius swelling (7.1-8.8%, ES = 0.20-0.29), whereas ECC resulted in greater soreness at
the distal and middle vastus lateralis and distal rectus femoris (16.5-30.4%, ES = 0.32-0.54)
and larger echogenicity increases at the distal rectus femoris and lateral vastus intermedius
(11.9-15.1%, ES = 0.26-0.54). Furthermore, ECC led to larger reductions in concentric (8.3-
19.7%, ES = 0.45-0.62) and isometric (6.3-32.3%, ES = 0.18-0.70) torque and RTD at medium-
long muscle lengths.
Conclusion: A single session of EQIs resulted in less soreness and smaller reductions in peak
torque and RTD versus impulse-equated ECC contractions, yet morphological shifts were
largely similar. Long-term morphological, architectural, and neuromuscular adaptations to EQI
training requires investigation.

Appendices
265
Appendix 38. Chapter 10 abstract
Eccentric quasi-isometric (EQI) contractions (maintaining a yielding contraction for as long as
possible, beyond task failure) have gained interest in research and applied settings. However,
little is known regarding the biomechanical profile of EQIs. Fourteen well-trained males
performed four maximal effort knee-extensor EQIs, separated by 180 seconds. Angular
impulse, velocity, and time-under-tension through the 30-100º range of motion (ROM), and in
eight ROM brackets were quantified. Statistical parametric mapping, analyses of variance, and
standardized effects (Hedges’ g (ES), %Δ) detected between-contraction joint-angle-specific
differences in time-normalized and absolute variables. Mean velocity was 1.34º·s−1 with most
(62.5 ± 4.9%) of the angular impulse imparted between 40–70º. Most between-contraction
changes occurred between 30-50º (p ≤ 0.067, ES = 0.53 ± 0.31, 60 ± 52%), while measures
remained constant between 50-100º (p = 0.069-0.83, ES = 0.10 ± 0.26, 14.3 ± 24.6%). EQIs
are a time-efficient means to impart high cumulative mechanical tension, especially at short to
medium muscle lengths. However, angular impulse distribution shifts towards medium to long
muscle lengths with repeat contractions. Practitioners may utilize EQIs to emphasize the initial
portion of the ROM, and limit ROM, or apply EQIs in a fatigued state to emphasis longer
muscle lengths.

The end