Biomechanical Computed Tomography analysis (BCT) for ...
24
REVIEW Biomechanical Computed Tomography analysis (BCT) for clinical assessment of osteoporosis T.M. Keaveny 1 & B.L. Clarke 2 & F. Cosman 3 & E.S. Orwoll 4 & E.S. Siris 5 & S. Khosla 2 & M.L. Bouxsein 6 Received: 27 November 2019 /Accepted: 9 March 2020 # The Author(s) 2020 Abstract The surgeon general of the USA defines osteoporosis as “a skeletal disorder characterized by compromised bone strength, predisposing to an increased risk of fracture. ” Measuring bone strength, Biomechanical Computed Tomography analysis (BCT), namely, finite element analysis of a patient’ s clinical-resolution computed tomography (CT) scan, is now available in the USA as a Medicare screening benefit for osteoporosis diagnostic testing. Helping to address under-diagnosis of osteoporosis, BCT can be applied “opportunistically” to most existing CT scans that include the spine or hip regions and were previously obtained for an unrelated medical indication. For the BCT test, no modifications are required to standard clinical CT imaging protocols. The analysis provides measurements of bone strength as well as a dual-energy X-ray absorptiometry (DXA)– equivalent bone mineral density (BMD) T-score at the hip and a volumetric BMD of trabecular bone at the spine. Based on both the bone strength and BMD measurements, a physician can identify osteoporosis and assess fracture risk (high, increased, not increased), without needing confirmation by DXA. To help introduce BCT to clinicians and health care professionals, we describe in this review the currently available clinical implementation of the test (VirtuOst), its application for managing patients, and the underlying supporting evidence; we also discuss its main limitations and how its results can be interpreted clinically. Together, this body of evidence supports BCT as an accurate and convenient diagnostic test for osteoporosis in both sexes, particularly when used opportunistically for patients already with CT. Mini Abstract Biomechanical Computed Tomography analysis (BCT) uses a patient’ s CT scan to measure both bone strength and bone mineral density at the hip or spine. Performing at least as well as DXA for both diagnosing osteoporosis and assessing fracture risk, BCT is particularly well-suited to “opportunistic” use for the patient without a recent DXA who is undergoing or has previously undergone CT testing (including hip or spine regions) for an unrelated medical condition. Keywords Biomechanical computed tomography . Bone mineral density . Bone strength . Finite element analysis . Fracture risk . Osteoporosis Electronic supplementary material The online version of this article (https://doi.org/10.1007/s00198-020-05384-2) contains supplementary material, which is available to authorized users. * T.M. Keaveny [email protected] 1 Departments of Mechanical Engineering and Bioengineering, University of California, Berkeley, CA, USA 2 Division of Endocrinology, Diabetes, Metabolism, and Nutrition, Mayo Clinic, Rochester, MN, USA 3 Department of Medicine, Columbia University College of Physicians and Surgeons, New York, NY, USA 4 Bone and Mineral Unit, Oregon Health and Science University, Portland, OR, USA 5 Toni Stabile Osteoporosis Center, Department of Medicine, Columbia University Medical Center, New York, NY, USA 6 Orthopedic Biomechanics Laboratory, Beth Israel Deaconess Medical Center and Harvard Medical School, Boston, MA, USA https://doi.org/10.1007/s00198-020-05384-2 /Published online: 26 April 2020 Osteoporosis International (2020) 31:1025–1048
-
Upload
khangminh22 -
Category
Documents
-
view
0 -
download
0
Transcript of Biomechanical Computed Tomography analysis (BCT) for ...
REVIEW
Biomechanical Computed Tomography analysis (BCT) for clinicalassessment of osteoporosis
T.M. Keaveny1 & B.L. Clarke2 & F. Cosman3& E.S. Orwoll4 & E.S. Siris5 & S. Khosla2 & M.L. Bouxsein6
Received: 27 November 2019 /Accepted: 9 March 2020# The Author(s) 2020
AbstractThe surgeon general of the USA defines osteoporosis as “a skeletal disorder characterized by compromised bone strength,predisposing to an increased risk of fracture.” Measuring bone strength, Biomechanical Computed Tomographyanalysis (BCT), namely, finite element analysis of a patient’s clinical-resolution computed tomography (CT) scan, is nowavailable in the USA as a Medicare screening benefit for osteoporosis diagnostic testing. Helping to address under-diagnosisof osteoporosis, BCT can be applied “opportunistically” to most existing CT scans that include the spine or hip regions and werepreviously obtained for an unrelated medical indication. For the BCT test, no modifications are required to standard clinical CTimaging protocols. The analysis provides measurements of bone strength as well as a dual-energy X-ray absorptiometry (DXA)–equivalent bone mineral density (BMD) T-score at the hip and a volumetric BMD of trabecular bone at the spine. Based on boththe bone strength and BMD measurements, a physician can identify osteoporosis and assess fracture risk (high, increased, notincreased), without needing confirmation by DXA. To help introduce BCT to clinicians and health care professionals, wedescribe in this review the currently available clinical implementation of the test (VirtuOst), its application for managing patients,and the underlying supporting evidence; we also discuss its main limitations and how its results can be interpreted clinically.Together, this body of evidence supports BCT as an accurate and convenient diagnostic test for osteoporosis in both sexes,particularly when used opportunistically for patients already with CT.
Mini AbstractBiomechanical Computed Tomography analysis (BCT) uses a patient’s CTscan to measure both bone strength and bone mineraldensity at the hip or spine. Performing at least as well as DXA for both diagnosing osteoporosis and assessing fracture risk, BCTis particularly well-suited to “opportunistic” use for the patient without a recent DXA who is undergoing or has previouslyundergone CT testing (including hip or spine regions) for an unrelated medical condition.
Keywords Biomechanical computed tomography .Bonemineral density . Bone strength . Finite element analysis . Fracture risk .
Osteoporosis
Electronic supplementary material The online version of this article(https://doi.org/10.1007/s00198-020-05384-2) contains supplementarymaterial, which is available to authorized users.
* T.M. [email protected]
1 Departments of Mechanical Engineering and Bioengineering,University of California, Berkeley, CA, USA
2 Division of Endocrinology, Diabetes, Metabolism, and Nutrition,Mayo Clinic, Rochester, MN, USA
3 Department of Medicine, Columbia University College of Physiciansand Surgeons, New York, NY, USA
4 Bone and Mineral Unit, Oregon Health and Science University,Portland, OR, USA
5 Toni Stabile Osteoporosis Center, Department of Medicine,Columbia University Medical Center, New York, NY, USA
6 Orthopedic Biomechanics Laboratory, Beth Israel DeaconessMedical Center and Harvard Medical School, Boston, MA, USA
https://doi.org/10.1007/s00198-020-05384-2
/Published online: 26 April 2020
Osteoporosis International (2020) 31:1025–1048
Introduction
The surgeon general of the USA defines osteoporosis as “askeletal disorder characterized by compromised bonestrength, predisposing to an increased risk of fracture” [1, 2]and the International Osteoporosis Foundation defines oste-oporosis as “a condition where bones become thin and losetheir strength” [3]. Since it has not yet been possible clinicallyto measure a patient’s bone strength non-invasively, osteopo-rosis is usually diagnosed by measuring bone mineral density(BMD) using dual-energy X-ray absorptiometry (DXA). Thisapproach is limited in two ways. First, rates of diagnostictesting by DXA are low. In particular, each year, only 9.5%of eligible Medicare women and 1.7% of men in the USA getdiagnostically screened for osteoporosis by DXA [4]. Thatlow screening rate is of concern because it hinders osteoporo-sis care [5–8] and is thought to contribute to the now risingincidence rate of hip fracture in the USA [9]. This under-diagnosis problem is widely recognized [4–8, 10–12] and isurgent because the size of the elderly population is continuingto increase [13].
A second limitation with current osteoporosis assessment isthat the BMDmeasurement from DXA does not directly mea-sure bone strength, the subject of osteoporosis. While bonestrength does indeed correlate with BMD [14], a DXA-derived BMD measurement does not mechanistically capturepotentially important elements of bone strength such as thebone’s overall shape and three-dimensional geometry, the rel-ative amount of cortical and trabecular bone, local variationsin cortical thickness, and the internal spatial distribution ofbone density. This limitation partly explains why DXA haslimited sensitivity [15–20] for correctly predicting who willfracture.
Given these limitations, it is significant that a well-validat-ed, convenient diagnostic test for osteoporosis that non-invasively assesses bone strength is now available clinicallyin the USA as a reimbursed Medicare screening benefit forosteoporosis. Formally referred to by the American MedicalAssociation as “Biomechanical Computed Tomography”analysis (BCT), the test comprises a finite element analysisof bone strength using as input a clinical resolution CT scan[21]; it also includes CT-based measurements of BMD andDXA-equivalent hip BMD T-scores. First reported in 1991[22] and used since by multiple groups in researchsettings—extensive reviews are provided elsewhere[23–26]—the finite element analysis component of BCT rep-resents a “virtual stress test” that provides a functional non-invasive assessment of the breaking strength of the patient’ship (proximal femur) or spine (vertebral body). Currently, theonly clinically available, FDA-cleared implementation ofBCT in the USA is by the VirtuOst® software (O.N.Diagnostics, Berkeley, CA), a regulated class-II medical de-vice that is the focus of this report.
Importantly for patient convenience, the VirtuOst imple-mentation of BCT can utilize most hip- or spine-containingCTscans taken previously for any medical indication, withoutrequiring any change to how those CT scans are originallyacquired. Used in this way—so-called opportunistic use—the patient does not need to undergo any extra imaging forthe BCT test and there is zero radiation exposure associatedwith the BCT test per se. Millions of patients in the osteopo-rosis demographic are scanned with CT covering the hip orspine each year. For example, in the US Medicare populationin 2018, 6.8 million reimbursed CT exams of the abdomen orpelvis were performed and 2.6 million DXA exams [27].Assuming that 40% of those DXA exams were taken for di-agnostic screening purposes [4], these data imply that oversixfold more hip-containing CT exams were performed in2018 than diagnostic DXA exams. Thus, opportunistic BCTcould have appreciable clinical impact if widely used for di-agnostic screening purposes in the older CT patient popula-tion. This review focuses primarily on this opportunistic use ofBCT.
To help introduce the BCT test to clinicians and health careprofessionals, we review here the VirtuOst BCT test, describehow it can be used to manage patients, and suggest how itsresults are best interpreted in a clinical setting. We also reviewthe available supporting evidence, with additional detail pro-vided in a series of appendices (see SupplementaryMaterials).Lastly, we also discuss some key clinical issues that arisewhen using BCT to manage patients for osteoporosis, includ-ing the test’s main limitations. Unlike other technical reviewsof the finite element analysis component of BCT [23–26],unless noted otherwise, all data reviewed here relate to theVirtuOst implementation of BCT or its earlier versions, witha focus on its use in a clinical setting.
BCT as a clinical test
What is the BCT test?
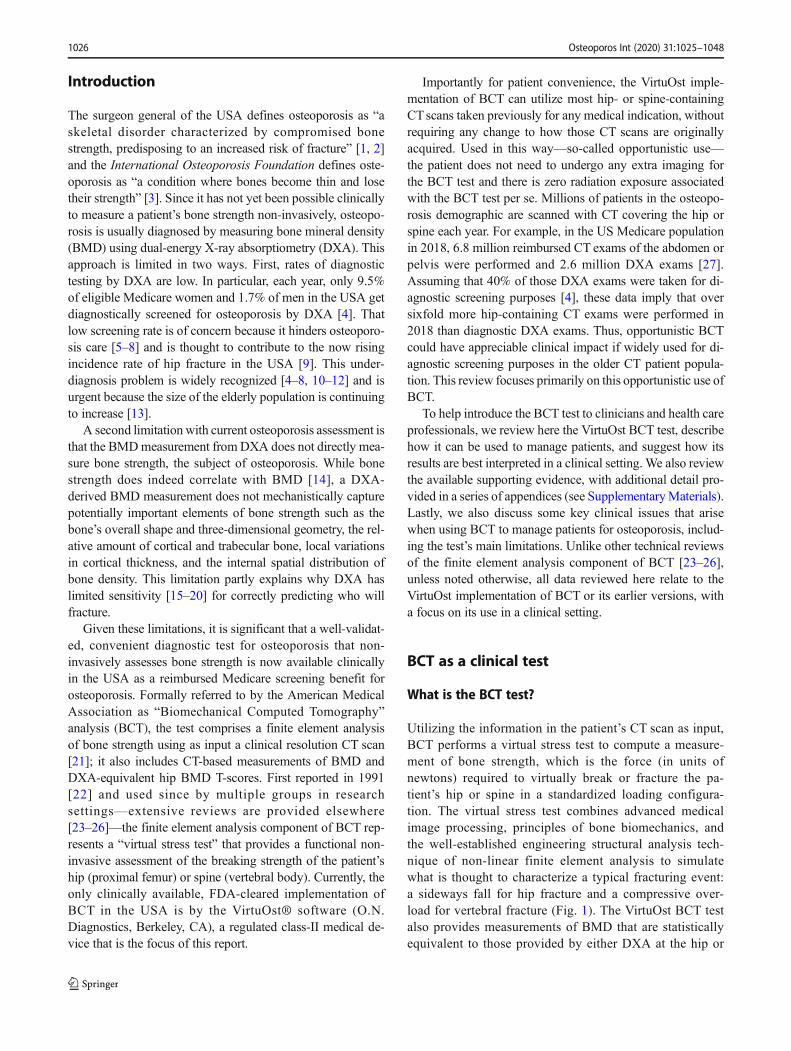
Utilizing the information in the patient’s CT scan as input,BCT performs a virtual stress test to compute a measure-ment of bone strength, which is the force (in units ofnewtons) required to virtually break or fracture the pa-tient’s hip or spine in a standardized loading configura-tion. The virtual stress test combines advanced medicalimage processing, principles of bone biomechanics, andthe well-established engineering structural analysis tech-nique of non-linear finite element analysis to simulatewhat is thought to characterize a typical fracturing event:a sideways fall for hip fracture and a compressive over-load for vertebral fracture (Fig. 1). The VirtuOst BCT testalso provides measurements of BMD that are statisticallyequivalent to those provided by either DXA at the hip or
Osteoporos Int (2020) 31:1025–10481026
quantitative CT at the spine (Fig. 1). Overall, the follow-ing measurements are provided at the hip or spine or both,depending on the type of CT scan used as input:
& Hip measurements: proximal femoral strength for a stan-dardized sideways fall; DXA-equivalent BMD T- and Z-scores for the femoral neck and total hip regions (can usethe NHANES or other reference populations); plots ofproximal femoral strength and femoral neck BMD T-score versus age with reference population means andstandard deviations. Since the BMD T-score from BCTis statistically equivalent to that from DXA, it can be usedwith FRAX® [28] or other risk calculators.
& Spine measurements: vertebral strength for a compressiveoverload; vertebral trabecular volumetric BMD, with Z-scores; plots of vertebral strength and BMD versus agewith reference population means and standard deviations.Note, as per clinical guidelines, T-scores are not used withvertebral trabecular BMD [29, 30]. As discussed below,
the BCT volumetric BMD spinal measurement may havesome advantages over a DXA spine BMD measurementbecause the volumetric measurement is minimally influ-enced by typical degenerative changes in the posteriorelements, on the vertebral surfaces, or in the adjacent vas-culature, any of which can compromise the accuracy ofthe DXA measurement.
& Classification of fracture risk: based on these hip and spinemeasurements and using clinically validated cut-points,various classifications are provided to arrive at an overallfracture risk classification for the patient (high, increased,or not increased).
Details of the (VirtuOst) BCT test
Described in detail elsewhere [31, 32], starting with a hip- orspine-containing routine clinical CT scan, the target bone in
Fig. 1 The BCT measurements for the hip (top) and spine (bottom). Thefinite element models (sectioned to show internal detail) depicting: (left)the spatial distribution of BMD (in grayscale) before virtual loading, and
(center) the deformed shape and failed tissue (in colors) after virtualloading; deformed shape is amplified for clarity. Right: the regions ofinterest (in yellow) for the BMD measurements
Osteoporos Int (2020) 31:1025–1048 1027
the patient’s CT scan is first identified—a proximal femur(nominally the left femur) or a single vertebral body (prefera-bly L1, or any one level within T12 to L3). The bone is thenisolated from the surrounding tissues and organs (posteriorelements are virtually removed for the spine) using advancedimage processing. Unlike with spinal DXA for which fourvertebral levels are typically assessed, analysis of just one[33, 34] or two [35] vertebral levels (between T12 and L3)by BCT has been shown to be effective for spinal fractureprediction; similarly, analysis of just one femur is adequatefor hip fracture prediction [16, 20, 35]. To provide a patient-specific calibration and therefore enable a diagnostic-qualitymeasurement of BMD, the CT scan is calibrated using eitheran external calibration phantom (typical in research studies) ora phantomless approach (typical in clinical practice) usinginternal tissues as references (details below). Next, the isolatedbone is registered into a standardized coordinate system eitherby mapping the patient’s proximal femur onto a referencefemur that is already in a standardized orientation for virtualloading or by ensuring the vertebral endplates are horizontallyoriented. For monitoring changes over time, at each timepoint, the isolated bones can be virtually registered to eachother to optimize precision for measuring temporal changes.The isolated, calibrated, and registered bone is then convertedinto a finite element model comprised of 1.0-mm-sized cube-shaped, eight-node brick elements. Models for the proximalfemur, for example, typically have 100,000–200,000 finiteelements.
For each finite element in the model, element-specific bio-mechanical elastic and strength material properties are gener-ated directly from the calibrated CT scan data, based on em-pirical relations obtained from biomechanical testing of hu-man cadaveric bone specimens [36–39]. When interpretingresults from a BCT test, it is noteworthy that those relationsreflect the biomechanical behavior of typical human bone.These relations therefore do not capture any molecular leveldefects that might occur in some individuals, for example,patients with collagen or mineral deficiencies that can appre-ciably alter the mechanical properties independent of theBMD. As a result, for these patients, the assumed relation inthe BCT model between mechanical properties and BMD atthe tissue level could differ from the true relation, which couldintroduce an error in their BCT strength measurement.
After constructing the finite element model, loading condi-tions are applied. The VirtuOst implementation of BCT simu-lates a uniform compressive over-loading of the spine or asideways fall of the hip, both applied via a thin layer of plasticover the bone surface to mimic laboratory biomechanical test-ing conditions (Fig. 1). Finally, a computationally non-linearfinite element analysis is performed, solving hundreds ofthousands of simultaneous equations multiple times per sim-ulation, and the resulting non-linear force-deformation curveis processed to provide the output measurement of the whole-
bone breaking strength. Ongoing research is addressing thepotential clinical utility of accounting for different types ofloading configurations in this process, including applyingmultiple different forces and simulating dynamic impact[40–42]. Thus, as the BCT technology continues to evolve,if proven beneficial, some aspects of the virtual stress testingmay change.
When BCT is used opportunistically (e.g., using CT scansnot acquired specifically for bone assessment), unique techni-cal challenges arise related to ensuring the following: (1) ad-equate quality of the image and proper quantitative calibrationof the scan and (2) consistency of BCT results across patients,especially when different CT scanners and acquisition settingsare used, as is typical for opportunistic use. For example, toomuch image noise, including metal artifacts, can compromisethe calibration and overall analysis; sharp kernels (e.g., the“bone” kernel) or unusual reconstruction filters can distortthe underlying grayscale data [43]; and low voltage settings(≤ 80 kVp) can lead to excessive noise. All these factorswould disqualify an analysis if the artifacts are manifested inthe calibration reference tissues or the bone of interest; typi-cally, for example, scans are not analyzed if there is any metalin the transverse plane of the bone of interest, e.g., a hip pros-thesis in either proximal femur or a posterior fixation rod thatspans T12 to L3. That said, most current clinical CT scans donot exhibit these characteristics and therefore 85–95% ofscans can be processed. Intravenous contrast is not a problemfor BCT at the hip but can compromise a spine analysis [44],and therefore, BCT is not typically recommended for a spinalscan acquired with intravenous contrast [45]. Excessive de-generative changes do not invalidate an analysis but can re-quire additional image processing and more nuanced clinicalinterpretation. Hip scans that do not extend sufficiently towardthe lesser trochanter cannot be used for a bone strength anal-ysis, although the femoral neck BMD can be measured fromslightly shorter scans.
Since BCT as a clinical test is new, widespread standardsand practice guidelines do not yet exist. One immediate chal-lenge is to ensure that the highly technical BCT analysis isproperly executed and that results remain consistent acrosssoftware updates, over time, and when obtained by differenttechnicians and on different CT scanners. The FDA-regulatednature of the VirtuOst software and the associated softwareengineering controls ensure that results remain consistentacross software updates and over time; the software algo-rithms also account for different CT scanner characteristicsvia manufacturer- and acquisition-specific adjustments in thecalibration process. In addition, the VirtuOst test is currentlyonly available via a centralized laboratory service (O.N.Diagnostics, Berkeley, CA). For that service, scans are sentto the laboratory for BCT analysis, where uniquely trainedtechnicians perform the analysis under strict controls. Thisoverall approach helps ensure that all VirtuOst-based BCT
Osteoporos Int (2020) 31:1025–10481028
analyses are performed in an expert and consistent manneracross different technicians, CT scanners, acquisition settings,patients, and over time.
Clinical interpretation of BCT results
By comparing a patient’s measurements of bone strength andBMD to respective interventional thresholds (see below),BCT provides classifications for fragile bone strength, lowbone strength, and normal bone strength and for (BMD-defined) osteoporosis, low bone mass (aka, osteopenia), andnormal bone mass (Table 1). Based on those classifications,an overall fracture risk classification is assigned followingtraditional DXA criteria [46], expanded to consider also thebone strength measurements:
& High risk, if the patient tests positive either for fragilebone strength or (BMD-defined) osteoporosis, or both,at either the hip or spine
& Increased risk, if the patient is not at high risk and insteadtests positive for either low bone strength or low bonemass, or both, at either the hip or spine
& Not increased risk, if both bone strength and BMD are inthe normal range at all measured sites
As cleared by the FDA, these classifications can be used bya physician to diagnose osteoporosis and assess fracture risk.For example, the International Society for ClinicalDensitometry’s practice guidelines for initiating therapeutictreatment [23] recommend that patients be considered for ther-apeutic treatment if classified as having fragile bone strength.As discussed in more detail below, results from BCT do notneed to be confirmed by DXA, although some physicians may
decide to subsequently order a baseline DXA for use in mon-itoring a treatment response.
Using these criteria, a slightly greater number of patientswill test positive, and presumably more will be treated, than ifone were to define high-risk patients on the basis of fragilebone strength alone or BMD alone.When using only hip BCT,the prevalence of high-risk patients by BCT appears to besimilar to the prevalence of BMD-defined osteoporosis basedon traditional DXA criteria (BMDT-score ≤ − 2.5 at the hip orspine). For example, in the large real-world FOCUS study ofhip fractures [20] (the “Fracture, Osteoporosis, and CTUtilization Study”, see below for details), prevalence ofhigh-risk women by hip BCT using the above criteria was30%, which was similar to the prevalence of 28% by tradi-tional (hip/spine) DXA criteria (for patients not treated previ-ously with osteoporosis medications). Based on these data, thenumber of positive testing patients should be similar if hipBCT is used instead of traditional DXA. As discussed belowin more detail, the FOCUS study also demonstrated that thesehigh-risk women (by hip BCT) were at significantly higherrisk of hip fracture than those identified by traditional (hip/spine) DXA.
If BCT is performed at both the hip and spine, more high-risk patients by the above criteria will be expected than ifusing only hip BCT. One small study on CT colonographypatients (age 43–92 years) reported the prevalence of high-risk patients when using both hip and spine BCTas comparedto prevalence of BMD-defined osteoporosis by traditionalDXA (hip/spine) [47]. That study reported prevalence of33% by hip/spine BCT versus 27% for hip/spine DXA for106 women, suggesting that use of hip/spine BCT will in-crease the number of positive-testing patients versus tradition-al (hip/spine) DXA. Additional and larger studies are requiredto characterize the risk profile of those patients. However,
Table 1 Interventional thresholds for bone strength [35] (in newtons,N) and BMD (in dimensionless DXA-equivalent T-score units for the hipor mg/cm3 for the spine). A patient is considered at high risk of fracture ifany measurement falls within the italicized entries. The bone strengththresholds were developed based on a statistical correspondence between
BMD and bone strength, measured in hundreds of patients in cohortsindependent of those used for their prospective validation. The BMDthresholds are based on established guidelines. See Appendix C for fur-ther details and the related validation studies
Classification Women Men
Hip Spine Hip Spine
Fragile bone strength ≤ 3000 N ≤ 4500 N ≤ 3500 N ≤ 6500 N
Low bone strength > 3000 to < 4000 > 4500 to < 6000 > 3500 to < 5000 > 6500 to < 8500
Normal bone strength ≥ 4000 ≥ 6000 ≥ 5000 ≥ 8500Osteoporosis ≤ − 2.5 ≤ 80 mg/cm3 ≤ − 2.5 ≤ 80 mg/cm3
Low bone mass (osteopenia) > − 2.5 to < − 1.0 > 80 to < 120 > − 2.5 to < − 1.0 > 80 to < 120
Normal bone mass ≥ − 1.0 ≥ 120 ≥ − 1.0 ≥ 120
The strength thresholds were developed and validated for measurement by VirtuOst. Strength is reported to ± 10 N, BMD T-score to ± 0.1 unit, andvolumetric BMD to ± 1 mg/cm3 . For the overall fracture risk classification (see text), a patient is classified as being at: high risk if testing test positive forfragile bone strength or (BMD-defined) osteoporosis or both, at either the hip or spine; not increased risk if both bone strength and BMD are in thenormal range at all measured sites; or increased risk otherwise
Osteoporos Int (2020) 31:1025–1048 1029
since about 60–70% of abdominal scans (at least in the USA)are performed with intravenous contrast, which precludes ac-curate analysis of the spine [44], the issue of performing bothhip and spine BCT will not arise for most patients in typicalclinical practice. That said, sagittal reconstructions from ab-dominal scans with intravenous contrast can be used to iden-tify prevalent vertebral fractures in the lumbar region [48, 49].The clinical utility of combining such measurements with hipor spine BCT or both remains to be investigated.
Occasionally, some patients classified by BCT as high riskwill have fragile bone strength without having BMD-definedosteoporosis. Mechanistically, such patients might have smallbones, a relatively porous trabecular but normal cortical com-partment [50], unusual 3D geometry, unusual spatial distribu-tion of bone density, focally thin cortices [51], or weak subre-gions. These features are typically not reflected by the DXABMD T-score but can be captured in the less averaged andmore mechanistic finite element analysis, explaining whyBCT-based bone strength has been found to predict incidentfractures independently of BMD at both the spine [33, 35] andhip [20, 35]. Supported by the clinical evidence discussedbelow, these patients with fragile bone strength are classifiedas being at high risk of fracture regardless of the BMD mea-surement. Less commonly, some patients may be classified tohave BMD-defined osteoporosis without fragile bonestrength. As per traditional but well-established clinical guide-lines, because these patients have BMD-defined osteoporosis,they are also classified as being at high risk of fracture regard-less of the bone strength measurement. Patients testing posi-tive for both fragile bone strength and BMD-defined osteopo-rosis are at additionally increased risk [20].
Typical uses of BCT
To date, measurement of BMD byDXA has been the standardof care for osteoporosis testing for all patients. Going forward,based on the evidence reviewed below, BCT could now beconsidered as an accurate alternative to DXA for the followingtwo situations:
For opportunistic use
BCTwould be appropriate for a patient who has had a recentCTor is about to undergo a CT for any medical indication andwho satisfies both of the following criteria:
& would benefit medically from an accurate osteoporosistest and who meets clinical guidelines for osteoporosistesting
& has had a hip- or spine-containing CT scan for any indi-cation (for hip: any abdominal or pelvic CT, includingwhole-body CT; for spine: any CT without intra-venous
contrast containing one or more lumbar or lower thoracicvertebrae)
For this situation, the patient does not need to undergo anyextra imaging procedure for diagnostic purposes and there isno extra radiation exposure because the patient’s CT scan hasalready been acquired or ordered for other reasons. TheFOCUS study [20] from Kaiser Permanente SouthernCalifornia established the robustness of this opportunistic ap-proach for BCT, sampling all available hip-containing CTscans from a cohort of 111,694 patients, acquired on 80 dif-ferent CT scanners, across 14 hospitals, over a 9-year timeframe. Approximately two-thirds of the CT scans were ac-quired using intravenous contrast, and more than one-thirdof CT scans had a slice thickness between 3 and 5 mm. Intotal, 86% of all available hip-containing CT scans were ana-lyzable by BCT, the most common reason for rejection beinginsufficient distal bone coverage by the scan (more commonin abdominal than in pelvic or pelvic-abdominal scans).
For non-opportunistic use
BCT with a dedicated CT scan would be appropriate for pa-tients for whom a DXA test is either not easily available,inadequate, or inconclusive. Examples include institutions orregions with CT but without DXA facilities; if appreciablebone deformities or degenerative changes exist that wouldcompromise the accuracy of a DXA measurement; if the pa-tient is highly obese, which can be particularly problematic forDXA [52, 53]; or if more detail is required for assessmentpurposes than is provided by DXA. An example of the latterwould be a patient presenting with a wrist fracture who haslow bone mass by DXA and for whom additional informationon the hip or spine is required to make a diagnosis.
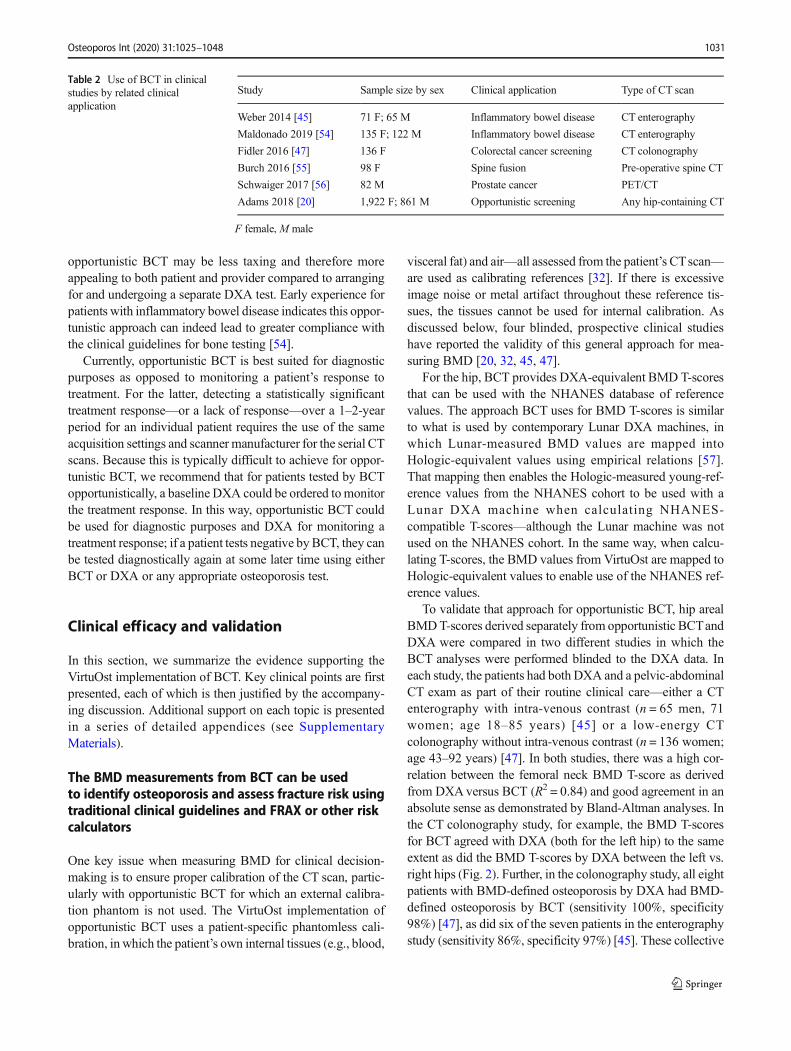
For opportunistic BCT, the patients’ primary care physicianor health care provider would typically order the BCT test atsome time after the original CTwas taken; the physician whoordered the original CT would typically not be involved. Inaddition, depending on the particular hospital system and re-gional practice guidelines, there are applications for which thesame physician who orders the original CT scan may simulta-neously order BCT. Examples include (Table 2) patients un-dergoing the following: CT enterography for assessment ofinflammatory bowel disease (IBD) [45], CT colonographyfor colorectal cancer screening [47], spine CT before spinalfusion surgery [55], or PET/CT for staging prostate cancer[56]. In these cases, the CT is typically ordered to help managethe underlying medical condition and the guidelines for man-aging that condition also suggest bone density testing due tothe medical condition itself or associated medications, eitherof which is associated with deteriorated bone strength. For thebusy specialist physician and imaging-burdened patient typi-cal of these medical conditions, ordering and undergoing
Osteoporos Int (2020) 31:1025–10481030
opportunistic BCT may be less taxing and therefore moreappealing to both patient and provider compared to arrangingfor and undergoing a separate DXA test. Early experience forpatients with inflammatory bowel disease indicates this oppor-tunistic approach can indeed lead to greater compliance withthe clinical guidelines for bone testing [54].
Currently, opportunistic BCT is best suited for diagnosticpurposes as opposed to monitoring a patient’s response totreatment. For the latter, detecting a statistically significanttreatment response—or a lack of response—over a 1–2-yearperiod for an individual patient requires the use of the sameacquisition settings and scanner manufacturer for the serial CTscans. Because this is typically difficult to achieve for oppor-tunistic BCT, we recommend that for patients tested by BCTopportunistically, a baseline DXA could be ordered tomonitorthe treatment response. In this way, opportunistic BCT couldbe used for diagnostic purposes and DXA for monitoring atreatment response; if a patient tests negative by BCT, they canbe tested diagnostically again at some later time using eitherBCT or DXA or any appropriate osteoporosis test.
Clinical efficacy and validation
In this section, we summarize the evidence supporting theVirtuOst implementation of BCT. Key clinical points are firstpresented, each of which is then justified by the accompany-ing discussion. Additional support on each topic is presentedin a series of detailed appendices (see SupplementaryMaterials).
The BMD measurements from BCT can be usedto identify osteoporosis and assess fracture risk usingtraditional clinical guidelines and FRAX or other riskcalculators
One key issue when measuring BMD for clinical decision-making is to ensure proper calibration of the CT scan, partic-ularly with opportunistic BCT for which an external calibra-tion phantom is not used. The VirtuOst implementation ofopportunistic BCT uses a patient-specific phantomless cali-bration, in which the patient’s own internal tissues (e.g., blood,
visceral fat) and air—all assessed from the patient’s CTscan—are used as calibrating references [32]. If there is excessiveimage noise or metal artifact throughout these reference tis-sues, the tissues cannot be used for internal calibration. Asdiscussed below, four blinded, prospective clinical studieshave reported the validity of this general approach for mea-suring BMD [20, 32, 45, 47].
For the hip, BCT provides DXA-equivalent BMD T-scoresthat can be used with the NHANES database of referencevalues. The approach BCT uses for BMD T-scores is similarto what is used by contemporary Lunar DXA machines, inwhich Lunar-measured BMD values are mapped intoHologic-equivalent values using empirical relations [57].That mapping then enables the Hologic-measured young-ref-erence values from the NHANES cohort to be used with aLunar DXA machine when calculating NHANES-compatible T-scores—although the Lunar machine was notused on the NHANES cohort. In the same way, when calcu-lating T-scores, the BMD values from VirtuOst are mapped toHologic-equivalent values to enable use of the NHANES ref-erence values.
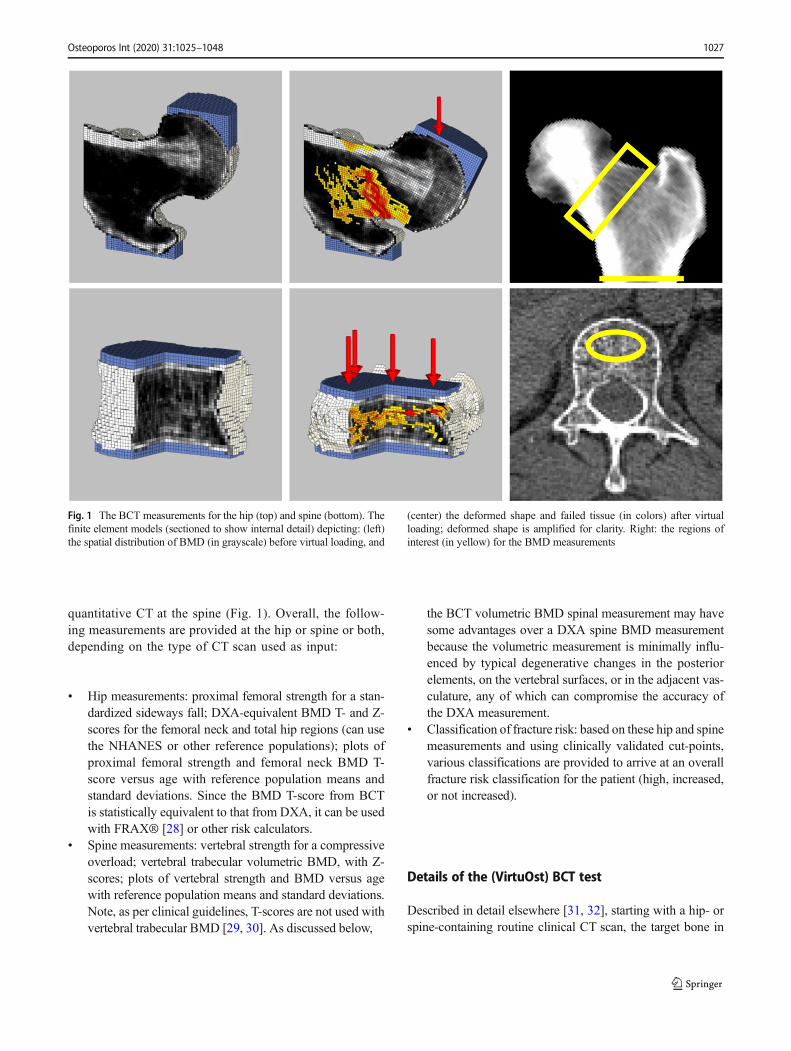
To validate that approach for opportunistic BCT, hip arealBMDT-scores derived separately from opportunistic BCTandDXA were compared in two different studies in which theBCT analyses were performed blinded to the DXA data. Ineach study, the patients had both DXA and a pelvic-abdominalCT exam as part of their routine clinical care—either a CTenterography with intra-venous contrast (n = 65 men, 71women; age 18–85 years) [45] or a low-energy CTcolonography without intra-venous contrast (n = 136 women;age 43–92 years) [47]. In both studies, there was a high cor-relation between the femoral neck BMD T-score as derivedfrom DXAversus BCT (R2 = 0.84) and good agreement in anabsolute sense as demonstrated by Bland-Altman analyses. Inthe CT colonography study, for example, the BMD T-scoresfor BCT agreed with DXA (both for the left hip) to the sameextent as did the BMD T-scores by DXA between the left vs.right hips (Fig. 2). Further, in the colonography study, all eightpatients with BMD-defined osteoporosis by DXA had BMD-defined osteoporosis by BCT (sensitivity 100%, specificity98%) [47], as did six of the seven patients in the enterographystudy (sensitivity 86%, specificity 97%) [45]. These collective
Table 2 Use of BCT in clinicalstudies by related clinicalapplication
Study Sample size by sex Clinical application Type of CT scan
Weber 2014 [45] 71 F; 65 M Inflammatory bowel disease CT enterography
Maldonado 2019 [54] 135 F; 122 M Inflammatory bowel disease CT enterography
Fidler 2016 [47] 136 F Colorectal cancer screening CT colonography
Burch 2016 [55] 98 F Spine fusion Pre-operative spine CT
Schwaiger 2017 [56] 82 M Prostate cancer PET/CT
Adams 2018 [20] 1,922 F; 861 M Opportunistic screening Any hip-containing CT
F female, M male
Osteoporos Int (2020) 31:1025–1048 1031

findings demonstrate that the femoral neck BMD T-scores forBCT and DXA in real-world practice are statistically equiva-lent. Other groups have also validated DXA-like hip arealBMD measurements obtained from calibrated CT scans[58–60]. At present, BCT only assesses one hip; it remainsto be seen if there is any clinical utility in assessing both hips.
As would be expected from this statistical equivalence, thehip BMD T-scores from BCTand DXA have also been shownto be equally effective for assessing fracture risk andpredicting hip fracture. Sampling from over 110,000 patientswho had both DXA and abdominal CTas part of their medicalcare, the FOCUS study [20] determined the association be-tween the hip BMD T-score (lower value from the femoralneck and total hip regions), obtained from both BCT andDXA, against the occurrence of new hip fractures subsequentto the CTandDXA scans. The BCTmeasurements weremadeblinded to the DXA and fracture-outcome data. Results indi-cated that for all the women tested with BCT in that study—1019 with hip fracture and 903 without—the mean values ofthe hip T-score from BCTand DXA differed by at most 0.1 T-score unit. Further, the age-adjusted hazards ratio per standarddeviation deficit for hip fracture was the same for both modal-ities (HR/SD = 2.1), as was the AUC (0.72). Consistent withthose metrics, at the traditional BMD T-score interventionalthreshold of − 2.5, specificity for predicting new hip fractureby the hip BMD T-score was the same for BCT and DXA(0.77), and sensitivity was similar (0.56 BCT, 95% CI 0.51–0.60; 0.52DXA, 0.47–0.56). For the men, the sensitivity (0.45BCT vs. 0.43 DXA) and specificity (0.82 BCT vs. 0.83 DXA)were similar between BCTand DXA, as was AUC (0.71 BCTvs. 0.73 DXA). Finally, hazard ratio for hip fracture for thosetesting positive by the BMD T-score criterion was statisticallysimilar for BCT and DXA, both for women (3.7 BCT vs. 2.9DXA) and men (4.0 BCT vs. 3.3 DXA).
Because both DXA and BCT use the NHANES III refer-ence populations for calculating the hip BMD T-scores, one
implication of these collective findings is that the clinicalguidelines for interpreting hip T-scores by DXA can also beused for BCT; in addition, the BCT-derived femoral neckBMD T-score can be used in lieu of the DXA BMD T-scorein FRAX [28] or other risk calculators.
As noted earlier, the spine BMD measurement for BCT isnot DXA-equivalent but instead is a volumetric BMD mea-surement for the trabecular bone within one vertebral body,thus avoiding many of the degenerative changes in the spinethat can confound a DXA-type BMD measurement. Obtainedfor opportunistic BCT without an external calibration phan-tom, these BMDmeasurements have been validated in a studythat directly compared them against paired measurements ob-tained by traditional quantitative CT [32]. That study utilizedmeasurements derived from multiple clinical research studiesthat used traditional quantitative CT (and an external calibra-tion phantom). A paired comparison was made of data fromopportunistic BCT versus quantitative CT for 25 women and15 men (age 41–86 years) scanned using 24 different CTscanners (from four different CT manufacturers). Results in-dicated a negligible difference (1 mg/cm3, not statistically sig-nificant) between the two paired measurements and a highcorrelation (R2 = 0.98, slope not different than unity); Bland-Altman analysis also revealed no bias. These results establishthat the spinal volumetric trabecular BMDmeasurement fromopportunistic BCTwith internal tissue-based phantomless cal-ibration is equivalent to that from traditional quantitative CTwith an external calibration phantom; a similar level of agree-ment between the phantom and phantomless measurementswas found for all the BCT measurements [32].
The clinical use of vertebral trabecular BMD for osteopo-rosis and vertebral fracture risk assessment, reported first inthe 1980s [61], is supported with BCT by its consistently highassociation with vertebral fracture, using DXA as a reference.For example, in all five of the vertebral fracture-outcome stud-ies discussed below for BCT, age-adjusted odds ratios per
DXA: Hip vs. Spine HIP: DXA vs BCT Hip DXA: Left vs. Right
Fig. 2 Comparison of BCT vs. DXA for measuring the femoral neckBMD T-score, with various DXA comparisons for reference. Thecorrelation between BCT and DXA (center) was similar to that between
left and right hip for DXA (right) and over twofold higher than betweenhip and spine for DXA (left). From Fidler [47]
Osteoporos Int (2020) 31:1025–10481032
standard deviation for vertebral fracture were consistentlyhigher for vertebral trabecular BMD than for spinal DXABMD, both for prevalent fracture—1.9 vs. 0.7 [62]; 1.9 vs.1.3 [63]; 3.4 vs. 1.9 [64]—and for incident fracture—5.7 vs.3.2 [33]; 2.4 vs. 1.8 [34]. Limited comparative data exist onsensitivity and specificity for predicting new vertebral frac-tures by vertebral trabecular BMD versus spinal DXABMD. As discussed below, the available comparative data[33–35] suggest that the sensitivity for vertebral trabecularBMD at the ACR-recommended (American College ofRadiology) cut-point of 80 mg/cm3 is higher than for spinalDXA BMD T-score at the traditional T ≤ − 2.5 cut-point, al-though specificity can be lower for BCT. Other groups previ-ously validated vertebral trabecular BMD from quantitativeCT for vertebral fracture risk assessment [61]. Taken together,these studies demonstrate that the vertebral trabecular BMDmeasurement from opportunistic BCT is equivalent to thatfrom traditional quantitative CT, which in turn is at least asgood as spinal DXA-BMD for assessing vertebral fracturerisk.
BCT does not currently use any volumetric measurementof BMD at the hip, in part because some fracture-outcomestudies have shown no advantage of doing so over traditionalhip BMD by DXA [65] and in part because interventionalthresholds for volumetric measurements of BMD at the hiphave not been established or validated.
Bone strength by BCT accurately measures bonestrength in human cadavers and has accuratelyquantified treatment effects on bone strengthin monkeys
BCT is the only clinical test that non-invasively measuresbone strength—in units of force—for fracture risk assessment.The bone strength measurement in BCTsimulates cadaver-labtesting conditions, in which an excised bone is loaded to fail-ure in a controlled orientation and configuration in order tomeasure the breaking force (strength) of the bone. Extensiveliterature reviews of BCT in general for bone strength assess-ment are available elsewhere [24, 26]. For the VirtuOst imple-mentation of BCT or its earlier versions, four studies havereported on the accuracy of BCT-derived measurements ofbone strength, three studies addressing vertebral strength (fora compressive overload) [33, 66, 67], and one addressingfemoral strength (for a sideways fall) [14]. All four studiesused laboratory-based biomechanical testing as the gold stan-dard. As reviewed in detail in Appendix A, these human ca-daver studies consistently demonstrated that BCT accuratelymeasured bone strength at the hip (sideways fall) and spine(compressive overload) and that the directly measuredstrength from biomechanical testing was more highly corre-lated with BCT-measured bone strength than BMD (either byDXA or quantitative CT) [14, 33, 66]. Consistent with these
results for VirtuOst, other groups using differentimplementations of BCT have also reported correlations withdirectly measured cadaver bone strength that were higher forBCT-measured bone strength than BMD, both for the spine[68–70] and hip [70–74].
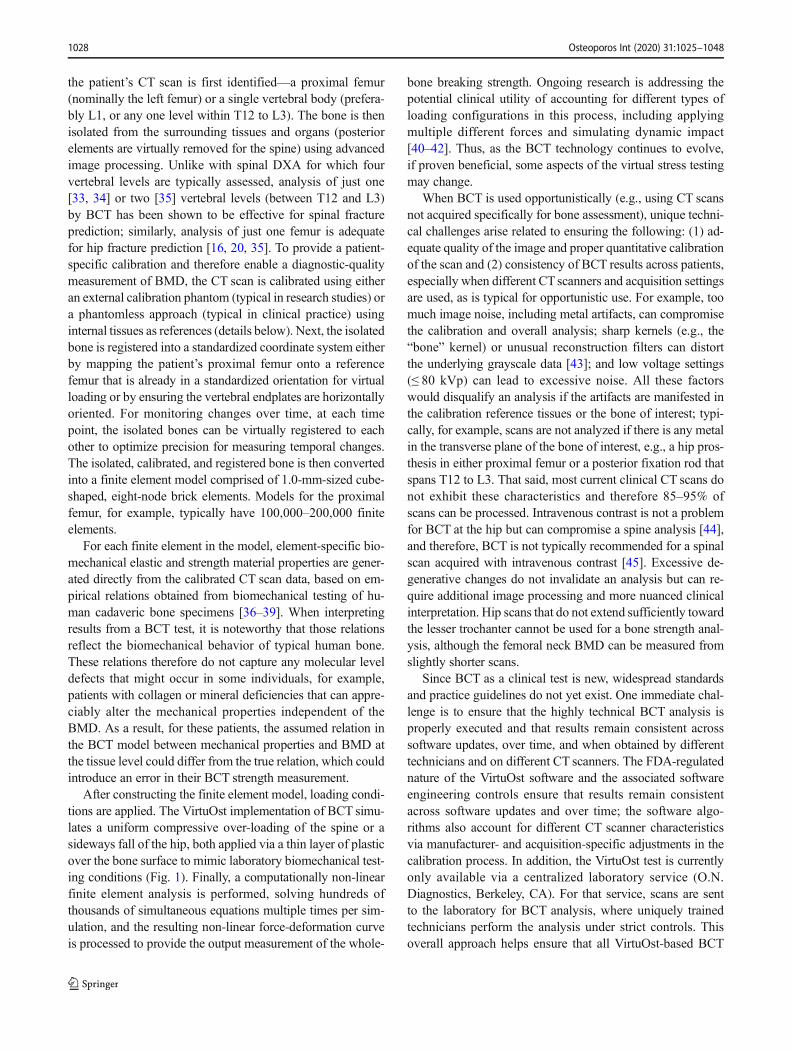
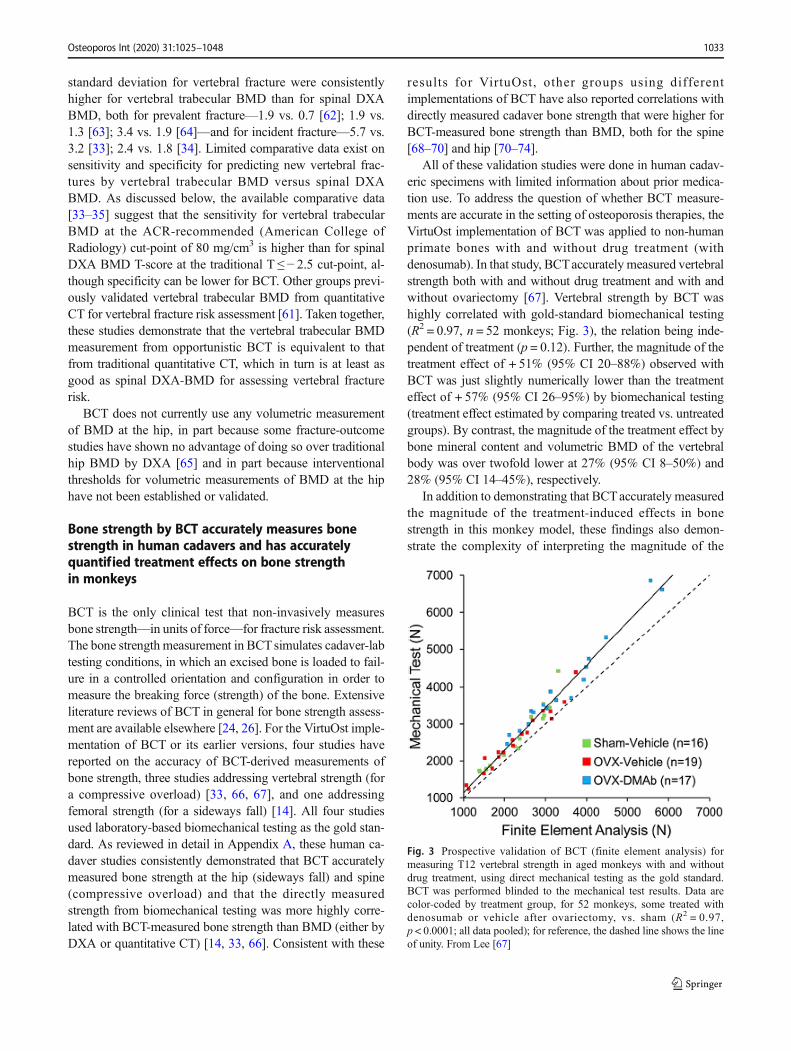
All of these validation studies were done in human cadav-eric specimens with limited information about prior medica-tion use. To address the question of whether BCT measure-ments are accurate in the setting of osteoporosis therapies, theVirtuOst implementation of BCT was applied to non-humanprimate bones with and without drug treatment (withdenosumab). In that study, BCTaccurately measured vertebralstrength both with and without drug treatment and with andwithout ovariectomy [67]. Vertebral strength by BCT washighly correlated with gold-standard biomechanical testing(R2 = 0.97, n = 52 monkeys; Fig. 3), the relation being inde-pendent of treatment (p = 0.12). Further, the magnitude of thetreatment effect of + 51% (95% CI 20–88%) observed withBCT was just slightly numerically lower than the treatmenteffect of + 57% (95% CI 26–95%) by biomechanical testing(treatment effect estimated by comparing treated vs. untreatedgroups). By contrast, the magnitude of the treatment effect bybone mineral content and volumetric BMD of the vertebralbody was over twofold lower at 27% (95% CI 8–50%) and28% (95% CI 14–45%), respectively.
In addition to demonstrating that BCTaccurately measuredthe magnitude of the treatment-induced effects in bonestrength in this monkey model, these findings also demon-strate the complexity of interpreting the magnitude of the
Fig. 3 Prospective validation of BCT (finite element analysis) formeasuring T12 vertebral strength in aged monkeys with and withoutdrug treatment, using direct mechanical testing as the gold standard.BCT was performed blinded to the mechanical test results. Data arecolor-coded by treatment group, for 52 monkeys, some treated withdenosumab or vehicle after ovariectomy, vs. sham (R2 = 0.97,p < 0.0001; all data pooled); for reference, the dashed line shows the lineof unity. From Lee [67]
Osteoporos Int (2020) 31:1025–1048 1033
treatment-induced changes in BMD or bonemass with respectto actual changes in bone strength. For the monkey study, thedensity/mass parameter that had a magnitude of effect mostsimilar to the observed change in bone strength was the(volumetric) bone mineral content of the cortical shell andits thickness, as measured by micro-CT analysis [67].However, biomechanically, BCTalso showed that the strengthassociated with the cortical and trabecular compartmentschanged approximately equally [67]. It is not possible to di-rectly validate these findings in humans. Short of that directvalidation, the data so far suggest that the main determinantsof treatment effects on strength—at least in the monkey modeland for treatment with denosumab—are those that were ade-quately captured by BCT, namely, the bone geometry andmass and the spatial distribution of bone mass. Those findingsin turn imply that any potential molecular or other lower-scaleeffects of the treatment in that monkey study did not play anyappreciative role in the strength response. A similar trend wasobserved in a finite element analysis study of the distal radiusin monkeys treated with odanacatib [75]. If molecular orsmall-scale treatment effects are also unimportant after treat-ment with contemporary osteoporosis agents in older humans,these collective human cadaver and monkey validation studiessuggest that BCT may capture the correct magnitude of treat-ment effects on bone strength in humans.
Bone strength by BCT is associated with risk of hip,spine, and major osteoporotic fractures at leastas strongly as is BMD by either DXA or quantitativeCT, for both sexes
Nine clinical fracture-outcome studies have been performed todate for BCT using VirtuOst. Involving both women and men,three studies addressed prevalent spine fracture, two ad-dressed incident spine fracture, two addressed incident hipfracture, one addressed both incident spine and hip fractures,and one addressed any prevalent major osteoporotic fracture(clinical spine, hip, proximal humerus, or wrist). Together,these studies involved BCT measurements taken in over5500 subjects, sampled using case-control or case-cohort de-signs from much larger study populations. In all instances, theBCT analyses were performed blinded to the fracture out-comes. Details of the studies and cohorts are provided inAppendix B. Overall, the combined cohorts represented bothsexes, populations in both the USA and Europe, with onelarge US cohort [20] including both sexes and being raciallydiverse.
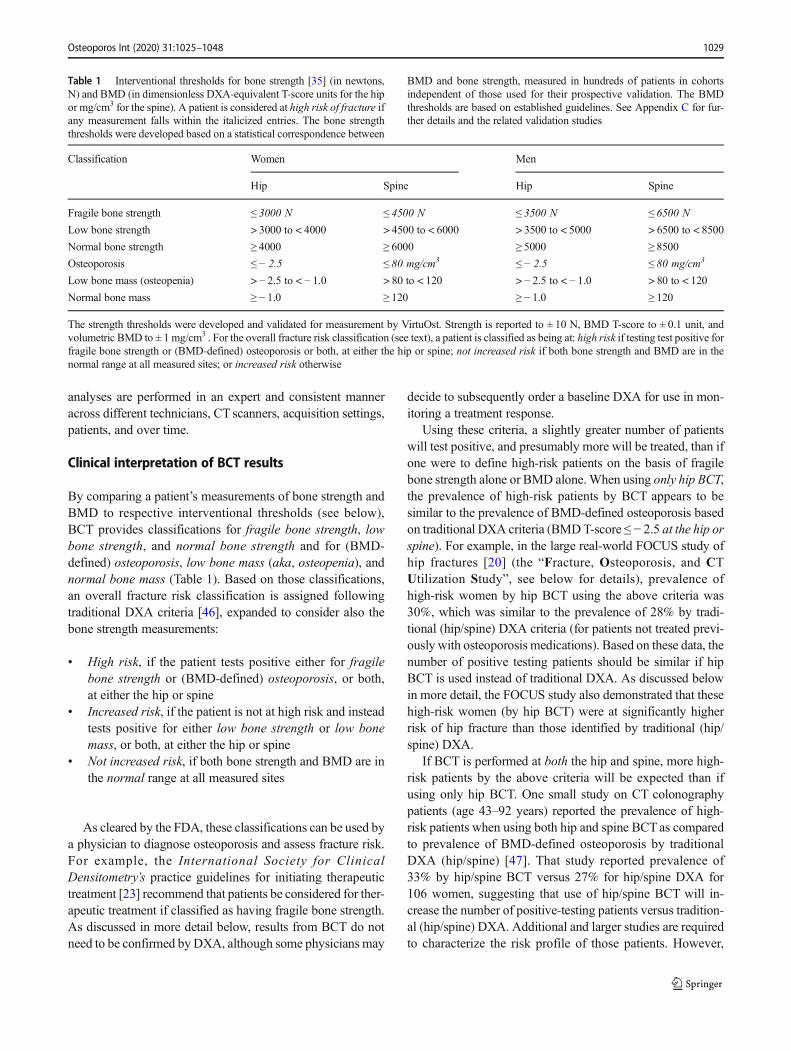
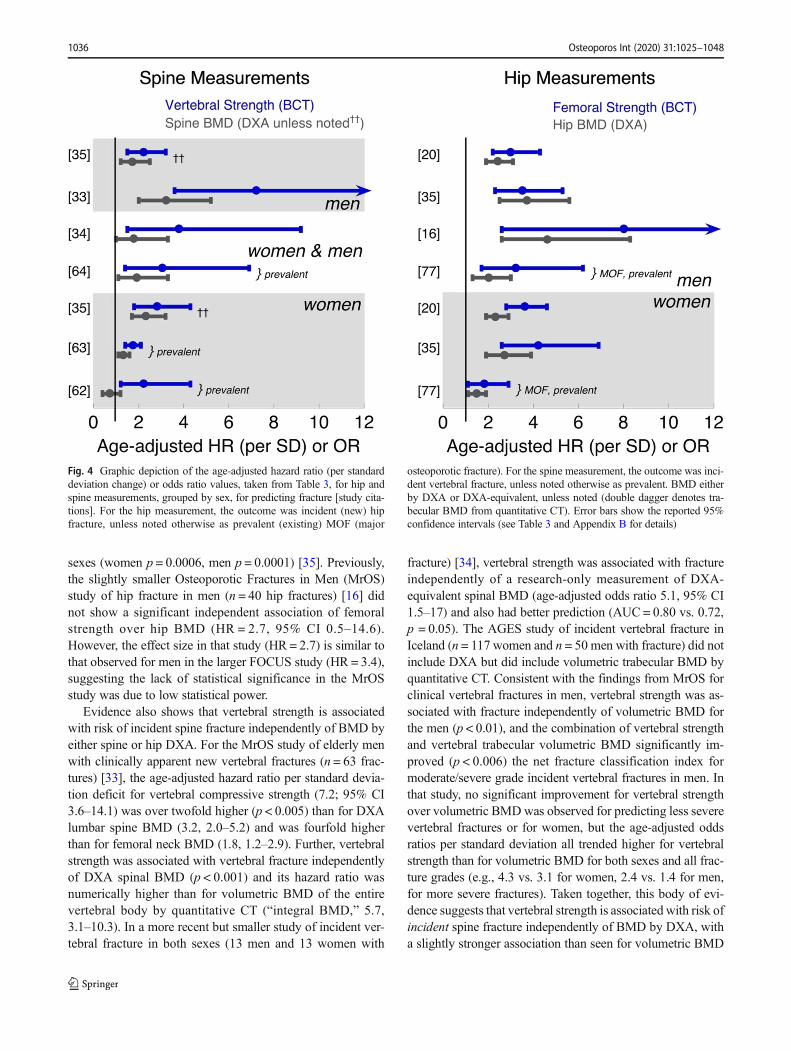
Across all nine studies, low values of bone strength wereconsistently associated with an increased risk of fracture, in-cluding hip, spine, or any osteoporotic fracture, for both sexes(Table 3; Fig. 4). As a reference for interpretation, results forbone strength by BCT in these studies can be compared withthose for BMD, usually by DXA (or CT-based DXA-
equivalent measurements). As noted elsewhere [77], an in-crease in the hazards or odds ratio (divided by the populationstandard deviation of the measurement) typically improvessensitivity for fracture prediction without markedly affectingspecificity, although, as noted below, sensitivity and specific-ity data comparing both BCTand BMD are sparse. We did notperform a statistical meta-analysis of these data, which wasbeyond the scope of this review. However, collectively in 13of the 14 comparisons of fracture outcomes made in these ninestudies, the published data for each individual study indicatethat bone strength had either a statistically stronger or numer-ically higher association with fracture than did BMD, as quan-tified by the age-adjusted hazard or odds ratio (divided by thestandard deviation); the other single comparison showed analmost identical association. For example, across studies, thehazard or odds ratio per SD for spine fracture ranged from 1.7to 7.2 for vertebral strength and from 0.7 to 3.2 for BMD andfor hip fracture ranged from 3.0 to 8.0 for femoral strength andfrom 2.3 to 4.6 for BMD (Table 3; Fig. 4). Taken together,these data indicate that the association of bone strength withrisk of hip or spine fractures equals or exceeds that of BMD byeither DXA or quantitative CT.
In eight of these nine studies, BCT was performed at thesame general anatomic site (hip or spine) as the site of theoutcome fracture (hip or spine fracture, respectively). In theother study, hip BCT was used to assess risk of any majorosteoporotic fracture [76]. That study demonstrated that fem-oral strength by hip BCTwas associated with any (prevalent)major osteoporotic fracture, performing as well as DXA-equivalent hip BMD (by BCT). In particular, the age-adjusted odds ratio of a major osteoporotic fracture was atleast as high for femoral strength as for the hip BMD (byBCT), both for both women [odds ratio (95% CI)—bonestrength 1.8 (1.1–2.9) vs. hip BMD 1.5 (1.1–1.9)] and men[bone strength 3.2 (1.7–6.2) vs. hip BMD 2.0 (1.3–3.0)].
These collective data indicate that the odds or hazard ratio(per standard deviation) trended consistently higher for bonestrength than BMD. Presumably, this trend reflects that agreater portion of the variation across the population in truebone strength—which directly influences fracture risk—iscaptured by the BCT measurement of bone strength than byBMD. Across large groups of individuals, the relative varia-tion (ratio of standard deviation to mean value) for both fem-oral [20] and vertebral [63] strength by BCT is up to twofoldgreater than the relative variation for BMD, particularly forareal BMD. This greater relative variation for strength partlyreflects the non-linear relation between bone strength andBMD at the tissue level; it also partly reflects other factorsthat affect whole-bone strength independently of BMD andthat also vary across the population, for example, corticalthickness, overall bone shape and geometry, and spatial distri-bution of BMD within the bone including the relative amountof cortical and trabecular bone—all of which are captured to
Osteoporos Int (2020) 31:1025–10481034

some degree and mechanistically within the BCT model butare missed by the DXA BMD measurement. For the samereasons, a simultaneous variation of these other factors overtime also explains why typical age-related declines arethought to be greater (percent-wise) at the whole-bone levelfor bone strength than for BMD [78]. As discussed next, in-tegration of these same factors in the BCT model likely ex-plains why bone strength by BCT has been shown to predictfracture independently of BMD.
Bone strength by BCT is associated with fracture riskindependently of BMD by DXA
The large FOCUS study provided definitive evidence on thisissue regarding hip fractures, for both sexes. That study drewfrom an underlying population of 111,694 patients age 65 orolder with an abdominal or pelvic CTand a DXA examwithin3 years of the CTand no prior hip fracture. Cases were definedas those who subsequently suffered a hip fracture (1340 wom-en, 619 men) and controls (no fracture) were randomly select-ed subgroup from the overall cohort (1350 women, 629 men),after removing any participants with hip fracture. As noted
above, this study confirmed the equivalence of the hip T-score (using the lower T-score from the femoral neck and totalhip regions) as measured by BCT versus DXA. This equiva-lence justified using logistic regression to directly comparepaired measurements of the hip BMD T-score (from BCT)and bone strength, both measurements taken from the verysame CT scan and thus minimizing any random errors associ-ated with variations in imaging parameters or any time differ-ence between the CT and DXA scans.
FOCUS established that incident hip fracture was associat-ed with femoral strength independently of hip BMD. In par-ticular, after adjusting for age, BMI, race/ethnicity, and the hipBMD T-score (lower T-score from femoral neck or total hipregions, fromBCT), the age-adjusted hazard ratio per standarddeviation for femoral strength was statistically significant forboth women (HR = 1.9, 95% CI 1.2–3.1) and men (HR = 3.4,95% CI 1.6–7.2). Consistent with these findings, the earlierbut smaller Age, Gene/Environment Susceptibility (AGES)study of hip fracture (108 fracture cases for women, 63 formen) also used logistic regression to show that femoralstrength was associated with incident hip fracture indepen-dently of femoral neck areal BMD (by BCT) for women(p = 0.01) and independently of total hip areal BMD for both
Table 3 Summary of studies comparing fracture risk assessment between BMD and bone strength
Study by fracture site Demographic N fracture/no-fracture, sex (N = 5514 total) Age-adjusted HR (per SD) or OR (95% CI)
BMD Bone strength
Vertebral fracture (BCT/DXA measurements made at the spine):
Melton 2007 [62]† 40/40 F 0.7 (0.4–1.2) 2.2 (1.2–4.3)
Melton 2010 [63]† 193/90 F 1.3 (1.1–1.6) 1.7 (1.4–2.1)
Wang 2012 [33] 63/243 M 3.2 (2.0–5.2) 7.2 (3.6–14.1)
Anderson 2014 [64]† 40/80 F/M 1.9 (1.1–3.3) 3.0 (1.4–6.9)
Kopperdahl 2014 [35] 117/380 F 2.3 (1.7–3.2)†† 2.8 (1.8–4.3)
50/296 M 1.7 (1.2–2.5)†† 2.2 (1.5–3.2)
Allaire 2018 [34] 26/62 F/M 1.8 (1.0–3.3) 3.8 (1.5–9.2)
Hip fracture (BCT/DXA measurements made at the hip):
Orwoll 2009 [16] 40/210 M 4.6 (2.6–8.3) 8.0 (2.6–24.3)
Kopperdahl 2014 [35] 108/500 F 2.7 (1.9–3.9) 4.2 (2.6–6.9)
63/377 M 3.7 (2.5–5.6) 3.5 (2.3–5.3)
Adams 2018 [20]§ 595/769 F 2.3 (1.9–2.9) 3.6 (2.8–4.6)
308/404 M 2.4 (1.9–3.1) 3.0 (2.2–4.3)
Any major osteoporotic fracture (BCT/DXA measurements made at the hip):
Amin 2011 [76]† 55/175 F 1.5 (1.1–1.9) 1.8 (1.1–2.9)
28/162 M 2.0 (1.3–3.0) 3.2 (1.7–6.2)
Incident (new) fractures unless noted otherwise; BMD is measured by DXA (or is DXA-equivalent) unless noted otherwise; bone strength is measuredby VirtuOst or earlier implementations
F female, M male† Prevalent (existing) fracture (occurred before the imaging)††Vertebral trabecular volumetric BMD by quantitative CT (spine BMD by DXA not measured in those studies)§ Results are reported here for patients not recently treated with any osteoporosis medication
Osteoporos Int (2020) 31:1025–1048 1035
sexes (women p = 0.0006, men p = 0.0001) [35]. Previously,the slightly smaller Osteoporotic Fractures in Men (MrOS)study of hip fracture in men (n = 40 hip fractures) [16] didnot show a significant independent association of femoralstrength over hip BMD (HR = 2.7, 95% CI 0.5–14.6).However, the effect size in that study (HR = 2.7) is similar tothat observed for men in the larger FOCUS study (HR = 3.4),suggesting the lack of statistical significance in the MrOSstudy was due to low statistical power.
Evidence also shows that vertebral strength is associatedwith risk of incident spine fracture independently of BMD byeither spine or hip DXA. For the MrOS study of elderly menwith clinically apparent new vertebral fractures (n = 63 frac-tures) [33], the age-adjusted hazard ratio per standard devia-tion deficit for vertebral compressive strength (7.2; 95% CI3.6–14.1) was over twofold higher (p < 0.005) than for DXAlumbar spine BMD (3.2, 2.0–5.2) and was fourfold higherthan for femoral neck BMD (1.8, 1.2–2.9). Further, vertebralstrength was associated with vertebral fracture independentlyof DXA spinal BMD (p < 0.001) and its hazard ratio wasnumerically higher than for volumetric BMD of the entirevertebral body by quantitative CT (“integral BMD,” 5.7,3.1–10.3). In a more recent but smaller study of incident ver-tebral fracture in both sexes (13 men and 13 women with
fracture) [34], vertebral strength was associated with fractureindependently of a research-only measurement of DXA-equivalent spinal BMD (age-adjusted odds ratio 5.1, 95% CI1.5–17) and also had better prediction (AUC = 0.80 vs. 0.72,p = 0.05). The AGES study of incident vertebral fracture inIceland (n = 117 women and n = 50 men with fracture) did notinclude DXA but did include volumetric trabecular BMD byquantitative CT. Consistent with the findings from MrOS forclinical vertebral fractures in men, vertebral strength was as-sociated with fracture independently of volumetric BMD forthe men (p < 0.01), and the combination of vertebral strengthand vertebral trabecular volumetric BMD significantly im-proved (p < 0.006) the net fracture classification index formoderate/severe grade incident vertebral fractures in men. Inthat study, no significant improvement for vertebral strengthover volumetric BMDwas observed for predicting less severevertebral fractures or for women, but the age-adjusted oddsratios per standard deviation all trended higher for vertebralstrength than for volumetric BMD for both sexes and all frac-ture grades (e.g., 4.3 vs. 3.1 for women, 2.4 vs. 1.4 for men,for more severe fractures). Taken together, this body of evi-dence suggests that vertebral strength is associated with risk ofincident spine fracture independently of BMD by DXA, witha slightly stronger association than seen for volumetric BMD
Fig. 4 Graphic depiction of the age-adjusted hazard ratio (per standarddeviation change) or odds ratio values, taken from Table 3, for hip andspine measurements, grouped by sex, for predicting fracture [study cita-tions]. For the hip measurement, the outcome was incident (new) hipfracture, unless noted otherwise as prevalent (existing) MOF (major
osteoporotic fracture). For the spine measurement, the outcome was inci-dent vertebral fracture, unless noted otherwise as prevalent. BMD eitherby DXA or DXA-equivalent, unless noted (double dagger denotes tra-becular BMD from quantitative CT). Error bars show the reported 95%confidence intervals (see Table 3 and Appendix B for details)
Osteoporos Int (2020) 31:1025–10481036
by quantitative CT. For prevalent fracture, the association withfracture is similar between vertebral strength and volumetricBMD, both of which consistently have stronger associationsthan DXA BMD [62–64].
Older patients classified by BCT as having eitherBMD-defined osteoporosis or fragile bone strengthare at high risk of fracture
Although fracture risk in older individuals depends on manyfactors, almost all clinical decision-making for consideringtherapeutic treatment ultimately classifies the individual pa-tient into a “high-risk” category using some type of interven-tional threshold. For example, the DXA BMD T-score thresh-old of − 2.5 at the hip or spine is widely used to identifycandidates for treatment. Likewise, in the USA, the 3% thresh-old for 10-year absolute risk of hip fracture from the FRAXcalculator is also used to identify high-risk patients suitable fortreatment [46, 79]. Research on optimal ways to identify high-risk patients using some type of threshold or risk-based ap-proach, and how to best incorporate strength measurements, isongoing in the field.
For BCT, the FDA-approved interventional thresholds forfragile bone strength using VirtuOst, first reported in 2014[35], were developed with clinical decision-making in mindand have been validated in a number of studies (for details onthe development, see Appendix C). To validate that patientsclassified by BCTas having fragile bone strength are indeed atclinically significant high risk of fracture—and therefore can-didates for treatment—comparisons of sensitivity (and speci-ficity) for predicting new fractures via fragile bone strength byBCT can be compared with sensitivity (and specificity) viaBMD-defined osteoporosis by DXA, the clinical standard ofcare (or DXA-equivalent hip BMD from BCT); alternatively,the observed probability of fracture in these studies can also becompared at the interventional thresholds for fragile bonestrength versus BMD-defined osteoporosis, again interpretingthe latter as a reference standard. Two such studies addressednew hip fractures [20, 35], two addressed new spine fractures[34, 35], and two earlier studies also provide support whenconsidered in retrospect [16, 33]; details of all studies areprovided in Appendix C. Collectively, the available data dem-onstrate that older patients classified by BCTas having fragilebone strength, at the hip or spine, are at clinically significanthigh risk of fracture.
As regards to identifying patients at high risk of hip fracture,the FOCUS study assessed both risk of fracture at the interven-tional thresholds and sensitivity (and specificity) [20]. Risk of hipfracture was numerically higher for the women and men whotested positive with fragile bone strength by BCT than for thosetesting positive with BMD-defined osteoporosis either by hipDXA or by traditional DXA (hip/spine), the difference againsttraditional DXA reaching statistical significance for the women,
and AUC values for femoral strength were similar to those fromthe DXA BMD T-score (within 0.10 points). Considering sensi-tivity and specificity, for the women in the FOCUS study, sensi-tivity for predicting incident hip fracture at 5 years was signifi-cantly higher for fragile bone strength at the hip by BCT (0.63,0.59–0.68) than for BMD-defined osteoporosis at the hip byDXA (0.52, 0.47–0.56), although specificity was significantlylower for fragile bone strength (0.69, 0.64–0.74) than forBMD-defined osteoporosis (0.77, 0.73–0.81). For men, sensitiv-ity trended numerically higher for fragile bone strength at the hip(0.48, 0.42–0.55) than for BMD-defined osteoporosis at the hipby DXA (0.43, 0.37–0.50), with similar specificities (0.82 vs.0.83, respectively). In typical clinical practice, one would usethe lower BMD T-score from the hip or spine when usingDXA to identify patients with BMD-defined osteoporosis [46].Doing so in FOCUS yielded a sensitivity for BMD-defined os-teoporosis for women that increased from 0.52 to 0.59—numer-ically lower than 0.63 for fragile bone strength—while specificitydecreased from 0.77 to 0.67—also numerically lower than 0.69for fragile bone strength. As described in more detail inAppendix C, in the AGES study of incident hip fractures inwomen and men in Iceland [35], the elevated probability offracture at the interventional thresholds was statistically similarfor fragile bone strength versus BMD-defined osteoporosis at thehip, and retrospective evidence of higher sensitivity at equivalentspecificity for fragile bone strength at the hip over BMD-definedosteoporosis at the hip was reported in the MrOS study of hipfractures in elderly men [16].
The FOCUS study extended these results by showing thatwhen both femoral strength and hip BMD from BCTare usedto identify high-risk patients—as opposed to using just femo-ral strength or just BMD—BCT at the hip correctly identifiedmore patients at high risk of hip fracture than did traditional(hip/spine) DXA, and those patients testing positive with hipBCT were at higher risk of hip fracture than those testingpositive by traditional DXA [20]. Consistent with that finding,in the earlier AGES study, reclassification analysis indicatedthat prediction of hip fracture for women was improved byconsidering both femoral strength and hip BMD (p = 0.002)[35].
Considering measurements of both femoral strength andhip BMD can facilitate clinical interpretation since it enablesphysicians to easily identify patients with clinically significantlow levels of bone strength in the absence of BMD-definedosteoporosis. In doing so, one approach is to identify high-riskpatients as those who test positive by BCT for either fragilebone strength or BMD-defined osteoporosis. Using thiseither/or approach in the FOCUS study, sensitivity forpredicting 5-year hip fracture increased (0.63 to 0.66 for wom-en; 0.48 to 0.56 for men) and specificity decreased (0.69 to0.66 for women; 0.82 to 0.76 for men) compared to using onlybone strength, and AUC values did not change. For clinicalreference purposes, when comparing this approach for hip
Osteoporos Int (2020) 31:1025–1048 1037
BCT against traditional DXA (lowest T-score at the hip orspine), sensitivity for BCT was 12% higher for women (0.66vs. 0.59) and 17% higher for men (0.56 vs. 0.48) than fortraditional DXA, with similar values of specificity betweenhip BCT used in this way and tradit ional DXA.Furthermore, the women who tested positive by BCT in thisway were at over 50% higher elevated risk of hip fracture thanwere those women testing positive by traditional DXA (haz-ard ratio 3.4 vs. 2.2, p < 0.05); there was no significant effectfor men (hazard ratio 4.0 BCT vs. 3.3 DXA). Studies have notyet been performed to assess whether hip fracture prediction isimproved for BCT by combining BCT measurements at thespine and hip. Nevertheless, these findings demonstrate thatolder patients classified by hip BCT as having either fragilebone strength or BMD-defined osteoporosis (by BCT) are atclinically significant high risk of hip fracture.
As regards to identifying patients at high risk of spine frac-ture, fewer data exist. As described inmore detail in AppendixC, in the AGES study of incident vertebral fractures in womenand men in Iceland [35], the elevated probability of fracture atthe interventional thresholds was statistically similar for frag-ile bone strength versus BMD-defined osteoporosis at thespine; sensitivity and specificity were not reported. In thesmall Framingham study of women and men (26 incidentfracture cases) [34], fragile bone strength at the spine trendedtoward twofold higher sensitivity than a validated DXA-equivalent spine T-score (from quantitative CT) for identify-ing new vertebral fracture (0.46 vs. 0.23, p = 0.09), at similarvalues of specificity. Consistent with these findings, in theearlier and larger (n = 63 incident fracture cases) MrOS studyof clinical spine fractures in elderly men [33], low values ofvertebral strength produced higher sensitivity than did theestablished spinal DXAT-score thresholds, at the same spec-ificity. The interventional thresholds for fragile bone strengthhad not been established at the time of that study. Even so,sensitivity trended higher for strength both at 95% specificity(37% BCT vs. 30% DXA) and at 90% specificity (52% BCTvs. 43% DXA), and AUC was higher (0.83 BCT vs. 0.76DXA, p < 0.02).
BCT measurements are precise and clinicallyreproducible
Opportunistic BCT uses the patient’s internal tissues as“phantomless” calibrating references; it also utilizes CT scansfrom a variety of different CT scanners and acquisition set-tings. One potential concern with opportunistic BCT is themeasurement error associated with the use of different CTscanners or scan acquisitions—how robust are one-time mea-surements used for diagnostic purposes? To date, two studieshave been reported that are relevant to measurement precision
and clinical reproducibility for opportunistic BCT (performedat the O.N. Diagnostics centralized BCT facility).
For inter-operator precision, one study was performed on25 women and 15 men (age range, 41–86 years) whounderwent CT scanning on 24 different CT scanners (fourdifferent CT manufacturers) as part of different clinical drugtrials (baseline scans only, no drug treatment); scans were re-analyzed by two different BCT technicians who were blindedto each other [32]. Results indicated that the reanalysis preci-sion errors (CV%) for all measurements of bone strength andBMD by opportunistic BCT (i.e., using phantomless calibra-tion), at the hip and spine, were 0.5% or less. Thus, for thesame scan analyzed by different BCT technicians, inter-operator discordance was negligible.
To assess clinical reproducibility, one must account for thetypical uncertainty associated with the variability of the sourcescan, both in CT scanner and the acquisition settings, andpatient repositioning. Data from one study can be used toaddress this issue [56]. That study reported on men with pros-tate cancer (n = 82, 71.6 ± 8.3 years) who underwent bothPET/CT and multi-detector CT at different time points as partof their medical care—two very different types of CT scan.Both the BMD and bone strength measurements at the hip andspine were directly compared between the paired PET/CT(one scanner) and multi-detector CT (12 different scanners)scans, taken in a clinical setting within 3 months of each other(full paired data were available for n = 63 patients). Resultsindicated that the mean paired differences (p > 0.05 unlessnoted) between the various BCT measurements for the twotypes of scan were all small: 1.1% for total hip areal BMD,1.3% femoral strength, 2.6% for vertebral trabecularBMD,1.7% for vertebral strength, and 2.5% (p = 0.007) forfemoral neck areal BMD. Consistent with these small differ-ences, between-scan agreement for fracture-risk classificationwas 97% (0.89 kappa for repeatability). Comparable differ-ences have been noted between different types of DXA scan-ners for the BMD T-score [80]. For example, for the femoralneck BMD T-score, which can be directly compared betweenBCT and DXA, the correlation between measurements withineach modality was at least as high for BCT (R2 = 0.94; PET/CT vs. multi-detector CT) as for DXA (R2 = 0.87; HologicDXAvs. Lunar DXA). These findings suggest that the clinicalreproducibility for one-time measurements for opportunisticBCTwhen used on different scanners/settings should be com-parable to reproducibility for DXA when used on differentscanners.
Non-opportunistic BCT can be used to monitorfor a treatment response
“Monitoring” in osteoporosis care typically refers to measur-ing or confirming a treatment-induced response over time,
Osteoporos Int (2020) 31:1025–10481038
which can be challenging clinically. One challenge is thatannual percent changes in bone strength (and BMD) for theindividual patient are often comparable to measurement pre-cision errors [81], and changes may be even smaller if thepatient is on an antiresorptive treatment. Another challengeis that, for maximum measurement precision, the imagingequipment and protocol should remain unchanged across allserial measurements. Since those latter conditions are difficultto achieve for opportunistic BCT, and since opportunisticBCT has not yet been characterized for monitoring treatmentresponses in individual patients, monitoring of a treatmentresponse for an individual patient is not currently recommend-ed with opportunistic BCT. However, as discussed next, theevidence so far suggests that when BCT is used non-opportunistically, that is, with a dedicated CT scan and a tra-ditional calibration phantom, and when the imaging
equipment and protocol remains unchanged across all serialmeasurements, then BCT is an excellent modality for moni-toring treatment responses in individual patients and may de-tect changes missed by DXA.
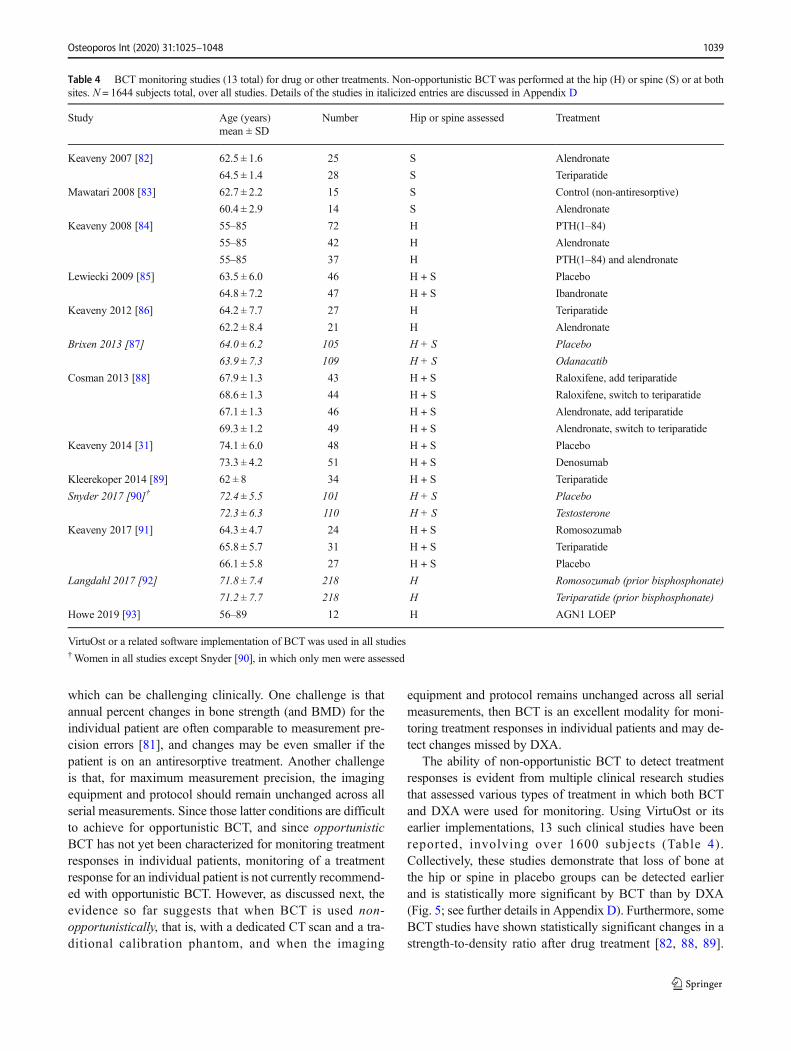
The ability of non-opportunistic BCT to detect treatmentresponses is evident from multiple clinical research studiesthat assessed various types of treatment in which both BCTand DXA were used for monitoring. Using VirtuOst or itsearlier implementations, 13 such clinical studies have beenreported, involving over 1600 subjects (Table 4).Collectively, these studies demonstrate that loss of bone atthe hip or spine in placebo groups can be detected earlierand is statistically more significant by BCT than by DXA(Fig. 5; see further details in Appendix D). Furthermore, someBCT studies have shown statistically significant changes in astrength-to-density ratio after drug treatment [82, 88, 89].
Table 4 BCT monitoring studies (13 total) for drug or other treatments. Non-opportunistic BCTwas performed at the hip (H) or spine (S) or at bothsites. N = 1644 subjects total, over all studies. Details of the studies in italicized entries are discussed in Appendix D
Study Age (years)mean ± SD
Number Hip or spine assessed Treatment
Keaveny 2007 [82] 62.5 ± 1.6 25 S Alendronate
64.5 ± 1.4 28 S Teriparatide
Mawatari 2008 [83] 62.7 ± 2.2 15 S Control (non-antiresorptive)
60.4 ± 2.9 14 S Alendronate
Keaveny 2008 [84] 55–85 72 H PTH(1–84)
55–85 42 H Alendronate
55–85 37 H PTH(1–84) and alendronate
Lewiecki 2009 [85] 63.5 ± 6.0 46 H + S Placebo
64.8 ± 7.2 47 H + S Ibandronate
Keaveny 2012 [86] 64.2 ± 7.7 27 H Teriparatide
62.2 ± 8.4 21 H Alendronate
Brixen 2013 [87] 64.0 ± 6.2 105 H + S Placebo
63.9 ± 7.3 109 H + S Odanacatib
Cosman 2013 [88] 67.9 ± 1.3 43 H + S Raloxifene, add teriparatide
68.6 ± 1.3 44 H + S Raloxifene, switch to teriparatide
67.1 ± 1.3 46 H + S Alendronate, add teriparatide
69.3 ± 1.2 49 H + S Alendronate, switch to teriparatide
Keaveny 2014 [31] 74.1 ± 6.0 48 H + S Placebo
73.3 ± 4.2 51 H + S Denosumab
Kleerekoper 2014 [89] 62 ± 8 34 H + S Teriparatide
Snyder 2017 [90]† 72.4 ± 5.5 101 H + S Placebo
72.3 ± 6.3 110 H + S Testosterone
Keaveny 2017 [91] 64.3 ± 4.7 24 H + S Romosozumab
65.8 ± 5.7 31 H + S Teriparatide
66.1 ± 5.8 27 H + S Placebo
Langdahl 2017 [92] 71.8 ± 7.4 218 H Romosozumab (prior bisphosphonate)
71.2 ± 7.7 218 H Teriparatide (prior bisphosphonate)
Howe 2019 [93] 56–89 12 H AGN1 LOEP
VirtuOst or a related software implementation of BCT was used in all studies†Women in all studies except Snyder [90], in which only men were assessed
Osteoporos Int (2020) 31:1025–1048 1039
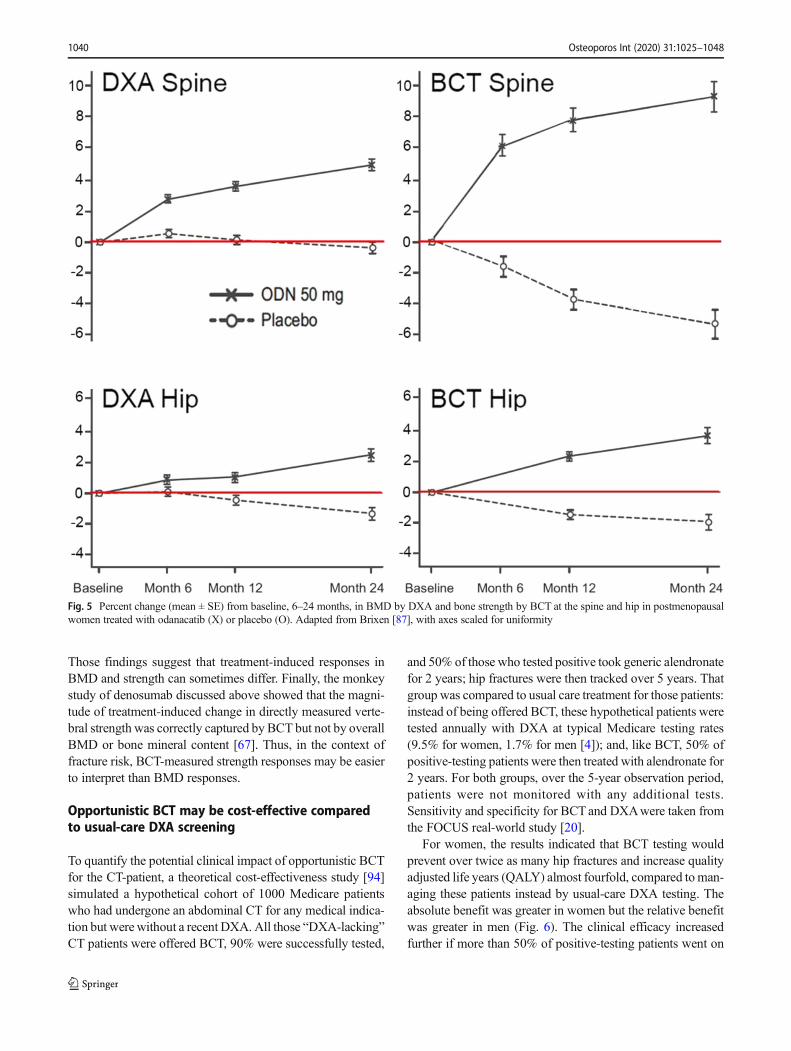
Those findings suggest that treatment-induced responses inBMD and strength can sometimes differ. Finally, the monkeystudy of denosumab discussed above showed that the magni-tude of treatment-induced change in directly measured verte-bral strength was correctly captured by BCT but not by overallBMD or bone mineral content [67]. Thus, in the context offracture risk, BCT-measured strength responses may be easierto interpret than BMD responses.
Opportunistic BCT may be cost-effective comparedto usual-care DXA screening
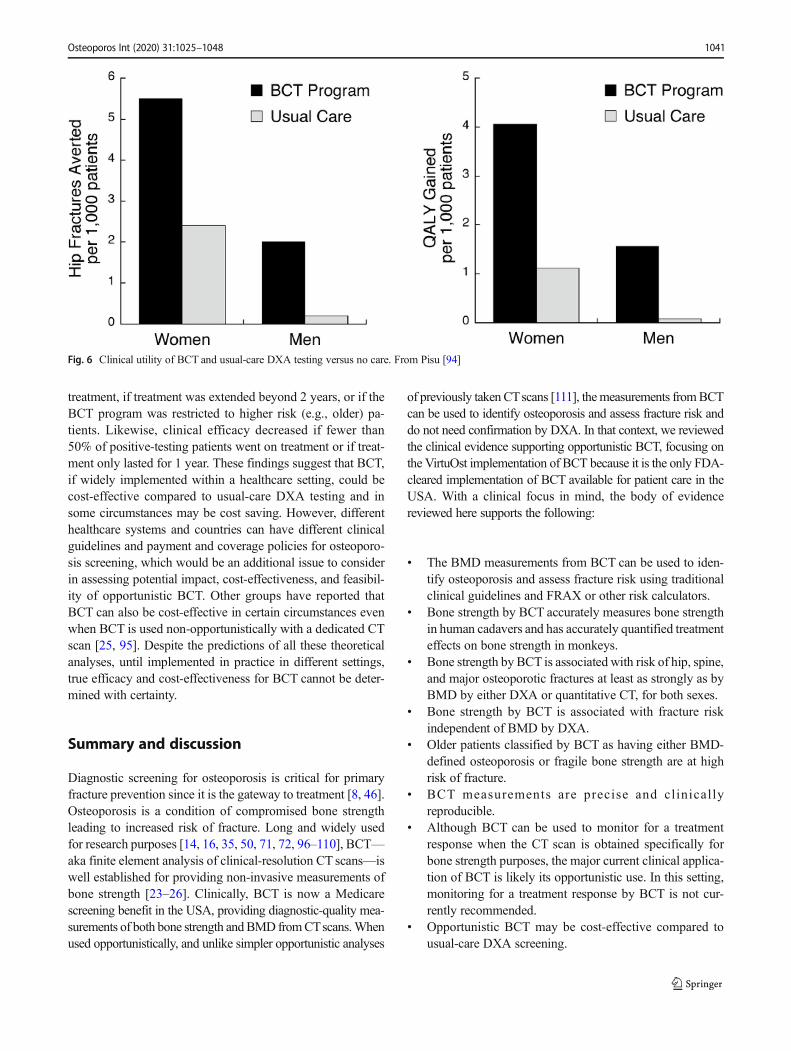
To quantify the potential clinical impact of opportunistic BCTfor the CT-patient, a theoretical cost-effectiveness study [94]simulated a hypothetical cohort of 1000 Medicare patientswho had undergone an abdominal CT for any medical indica-tion but were without a recent DXA. All those “DXA-lacking”CT patients were offered BCT, 90% were successfully tested,
and 50% of those who tested positive took generic alendronatefor 2 years; hip fractures were then tracked over 5 years. Thatgroup was compared to usual care treatment for those patients:instead of being offered BCT, these hypothetical patients weretested annually with DXA at typical Medicare testing rates(9.5% for women, 1.7% for men [4]); and, like BCT, 50% ofpositive-testing patients were then treated with alendronate for2 years. For both groups, over the 5-year observation period,patients were not monitored with any additional tests.Sensitivity and specificity for BCTand DXAwere taken fromthe FOCUS real-world study [20].
For women, the results indicated that BCT testing wouldprevent over twice as many hip fractures and increase qualityadjusted life years (QALY) almost fourfold, compared toman-aging these patients instead by usual-care DXA testing. Theabsolute benefit was greater in women but the relative benefitwas greater in men (Fig. 6). The clinical efficacy increasedfurther if more than 50% of positive-testing patients went on
Fig. 5 Percent change (mean ± SE) from baseline, 6–24 months, in BMD by DXA and bone strength by BCT at the spine and hip in postmenopausalwomen treated with odanacatib (X) or placebo (O). Adapted from Brixen [87], with axes scaled for uniformity
Osteoporos Int (2020) 31:1025–10481040
treatment, if treatment was extended beyond 2 years, or if theBCT program was restricted to higher risk (e.g., older) pa-tients. Likewise, clinical efficacy decreased if fewer than50% of positive-testing patients went on treatment or if treat-ment only lasted for 1 year. These findings suggest that BCT,if widely implemented within a healthcare setting, could becost-effective compared to usual-care DXA testing and insome circumstances may be cost saving. However, differenthealthcare systems and countries can have different clinicalguidelines and payment and coverage policies for osteoporo-sis screening, which would be an additional issue to considerin assessing potential impact, cost-effectiveness, and feasibil-ity of opportunistic BCT. Other groups have reported thatBCT can also be cost-effective in certain circumstances evenwhen BCT is used non-opportunistically with a dedicated CTscan [25, 95]. Despite the predictions of all these theoreticalanalyses, until implemented in practice in different settings,true efficacy and cost-effectiveness for BCT cannot be deter-mined with certainty.
Summary and discussion
Diagnostic screening for osteoporosis is critical for primaryfracture prevention since it is the gateway to treatment [8, 46].Osteoporosis is a condition of compromised bone strengthleading to increased risk of fracture. Long and widely usedfor research purposes [14, 16, 35, 50, 71, 72, 96–110], BCT—aka finite element analysis of clinical-resolution CT scans—iswell established for providing non-invasive measurements ofbone strength [23–26]. Clinically, BCT is now a Medicarescreening benefit in the USA, providing diagnostic-quality mea-surements of both bone strength andBMD fromCTscans.Whenused opportunistically, and unlike simpler opportunistic analyses
of previously taken CTscans [111], themeasurements fromBCTcan be used to identify osteoporosis and assess fracture risk anddo not need confirmation by DXA. In that context, we reviewedthe clinical evidence supporting opportunistic BCT, focusing onthe VirtuOst implementation of BCT because it is the only FDA-cleared implementation of BCT available for patient care in theUSA. With a clinical focus in mind, the body of evidencereviewed here supports the following:
& The BMD measurements from BCT can be used to iden-tify osteoporosis and assess fracture risk using traditionalclinical guidelines and FRAX or other risk calculators.
& Bone strength by BCT accurately measures bone strengthin human cadavers and has accurately quantified treatmenteffects on bone strength in monkeys.
& Bone strength by BCT is associated with risk of hip, spine,and major osteoporotic fractures at least as strongly as byBMD by either DXA or quantitative CT, for both sexes.
& Bone strength by BCT is associated with fracture riskindependent of BMD by DXA.
& Older patients classified by BCT as having either BMD-defined osteoporosis or fragile bone strength are at highrisk of fracture.
& BCT measurements are precise and clinical lyreproducible.
& Although BCT can be used to monitor for a treatmentresponse when the CT scan is obtained specifically forbone strength purposes, the major current clinical applica-tion of BCT is likely its opportunistic use. In this setting,monitoring for a treatment response by BCT is not cur-rently recommended.
& Opportunistic BCT may be cost-effective compared tousual-care DXA screening.
Fig. 6 Clinical utility of BCT and usual-care DXA testing versus no care. From Pisu [94]
Osteoporos Int (2020) 31:1025–1048 1041
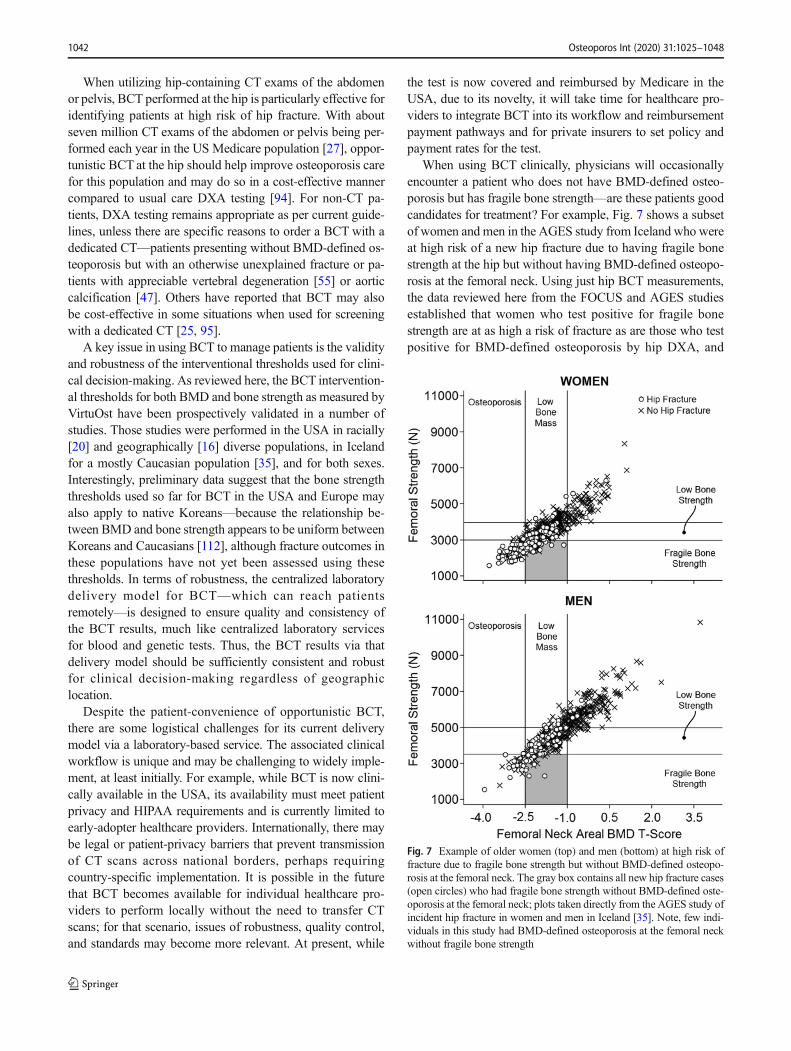
When utilizing hip-containing CT exams of the abdomenor pelvis, BCT performed at the hip is particularly effective foridentifying patients at high risk of hip fracture. With aboutseven million CT exams of the abdomen or pelvis being per-formed each year in the US Medicare population [27], oppor-tunistic BCT at the hip should help improve osteoporosis carefor this population and may do so in a cost-effective mannercompared to usual care DXA testing [94]. For non-CT pa-tients, DXA testing remains appropriate as per current guide-lines, unless there are specific reasons to order a BCT with adedicated CT—patients presenting without BMD-defined os-teoporosis but with an otherwise unexplained fracture or pa-tients with appreciable vertebral degeneration [55] or aorticcalcification [47]. Others have reported that BCT may alsobe cost-effective in some situations when used for screeningwith a dedicated CT [25, 95].
A key issue in using BCT to manage patients is the validityand robustness of the interventional thresholds used for clini-cal decision-making. As reviewed here, the BCT intervention-al thresholds for both BMD and bone strength as measured byVirtuOst have been prospectively validated in a number ofstudies. Those studies were performed in the USA in racially[20] and geographically [16] diverse populations, in Icelandfor a mostly Caucasian population [35], and for both sexes.Interestingly, preliminary data suggest that the bone strengththresholds used so far for BCT in the USA and Europe mayalso apply to native Koreans—because the relationship be-tween BMD and bone strength appears to be uniform betweenKoreans and Caucasians [112], although fracture outcomes inthese populations have not yet been assessed using thesethresholds. In terms of robustness, the centralized laboratorydelivery model for BCT—which can reach patientsremotely—is designed to ensure quality and consistency ofthe BCT results, much like centralized laboratory servicesfor blood and genetic tests. Thus, the BCT results via thatdelivery model should be sufficiently consistent and robustfor clinical decision-making regardless of geographiclocation.
Despite the patient-convenience of opportunistic BCT,there are some logistical challenges for its current deliverymodel via a laboratory-based service. The associated clinicalworkflow is unique and may be challenging to widely imple-ment, at least initially. For example, while BCT is now clini-cally available in the USA, its availability must meet patientprivacy and HIPAA requirements and is currently limited toearly-adopter healthcare providers. Internationally, there maybe legal or patient-privacy barriers that prevent transmissionof CT scans across national borders, perhaps requiringcountry-specific implementation. It is possible in the futurethat BCT becomes available for individual healthcare pro-viders to perform locally without the need to transfer CTscans; for that scenario, issues of robustness, quality control,and standards may become more relevant. At present, while
the test is now covered and reimbursed by Medicare in theUSA, due to its novelty, it will take time for healthcare pro-viders to integrate BCT into its workflow and reimbursementpayment pathways and for private insurers to set policy andpayment rates for the test.
When using BCT clinically, physicians will occasionallyencounter a patient who does not have BMD-defined osteo-porosis but has fragile bone strength—are these patients goodcandidates for treatment? For example, Fig. 7 shows a subsetof women and men in the AGES study from Iceland who wereat high risk of a new hip fracture due to having fragile bonestrength at the hip but without having BMD-defined osteopo-rosis at the femoral neck. Using just hip BCT measurements,the data reviewed here from the FOCUS and AGES studiesestablished that women who test positive for fragile bonestrength are at as high a risk of fracture as are those who testpositive for BMD-defined osteoporosis by hip DXA, and
Fig. 7 Example of older women (top) and men (bottom) at high risk offracture due to fragile bone strength but without BMD-defined osteopo-rosis at the femoral neck. The gray box contains all new hip fracture cases(open circles) who had fragile bone strength without BMD-defined oste-oporosis at the femoral neck; plots taken directly from the AGES study ofincident hip fracture in women and men in Iceland [35]. Note, few indi-viduals in this study had BMD-defined osteoporosis at the femoral neckwithout fragile bone strength
Osteoporos Int (2020) 31:1025–10481042
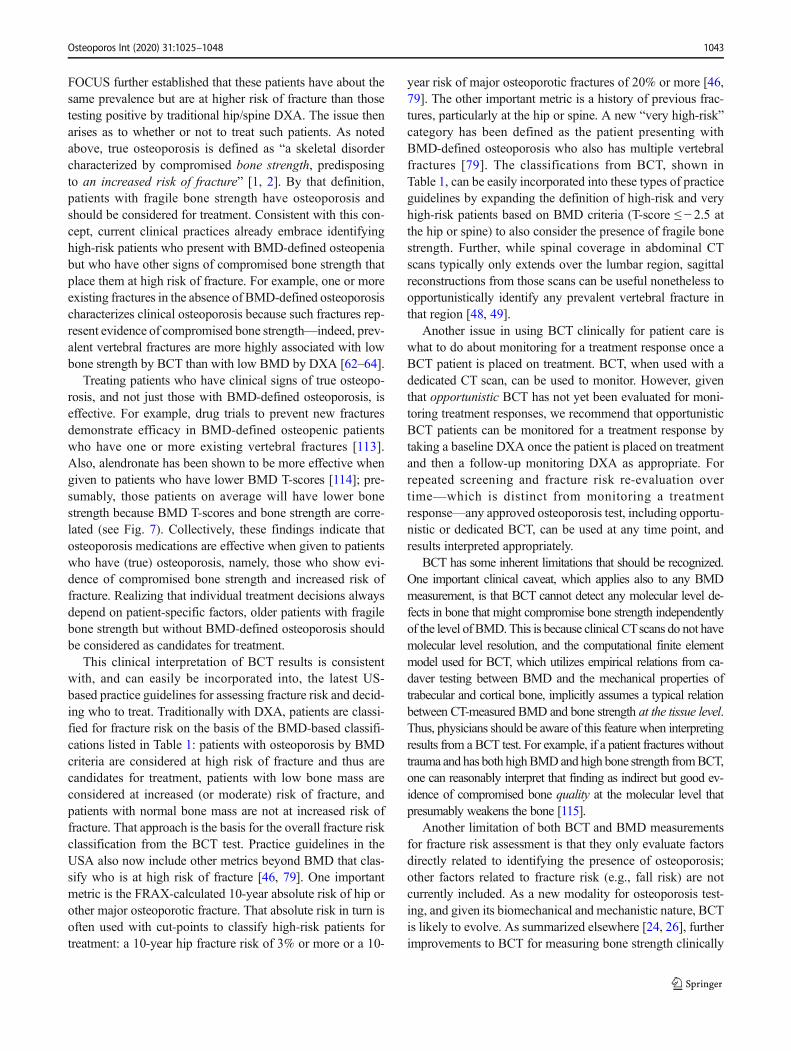
FOCUS further established that these patients have about thesame prevalence but are at higher risk of fracture than thosetesting positive by traditional hip/spine DXA. The issue thenarises as to whether or not to treat such patients. As notedabove, true osteoporosis is defined as “a skeletal disordercharacterized by compromised bone strength, predisposingto an increased risk of fracture” [1, 2]. By that definition,patients with fragile bone strength have osteoporosis andshould be considered for treatment. Consistent with this con-cept, current clinical practices already embrace identifyinghigh-risk patients who present with BMD-defined osteopeniabut who have other signs of compromised bone strength thatplace them at high risk of fracture. For example, one or moreexisting fractures in the absence of BMD-defined osteoporosischaracterizes clinical osteoporosis because such fractures rep-resent evidence of compromised bone strength—indeed, prev-alent vertebral fractures are more highly associated with lowbone strength by BCT than with low BMD by DXA [62–64].
Treating patients who have clinical signs of true osteopo-rosis, and not just those with BMD-defined osteoporosis, iseffective. For example, drug trials to prevent new fracturesdemonstrate efficacy in BMD-defined osteopenic patientswho have one or more existing vertebral fractures [113].Also, alendronate has been shown to be more effective whengiven to patients who have lower BMD T-scores [114]; pre-sumably, those patients on average will have lower bonestrength because BMD T-scores and bone strength are corre-lated (see Fig. 7). Collectively, these findings indicate thatosteoporosis medications are effective when given to patientswho have (true) osteoporosis, namely, those who show evi-dence of compromised bone strength and increased risk offracture. Realizing that individual treatment decisions alwaysdepend on patient-specific factors, older patients with fragilebone strength but without BMD-defined osteoporosis shouldbe considered as candidates for treatment.
This clinical interpretation of BCT results is consistentwith, and can easily be incorporated into, the latest US-based practice guidelines for assessing fracture risk and decid-ing who to treat. Traditionally with DXA, patients are classi-fied for fracture risk on the basis of the BMD-based classifi-cations listed in Table 1: patients with osteoporosis by BMDcriteria are considered at high risk of fracture and thus arecandidates for treatment, patients with low bone mass areconsidered at increased (or moderate) risk of fracture, andpatients with normal bone mass are not at increased risk offracture. That approach is the basis for the overall fracture riskclassification from the BCT test. Practice guidelines in theUSA also now include other metrics beyond BMD that clas-sify who is at high risk of fracture [46, 79]. One importantmetric is the FRAX-calculated 10-year absolute risk of hip orother major osteoporotic fracture. That absolute risk in turn isoften used with cut-points to classify high-risk patients fortreatment: a 10-year hip fracture risk of 3% or more or a 10-
year risk of major osteoporotic fractures of 20% or more [46,79]. The other important metric is a history of previous frac-tures, particularly at the hip or spine. A new “very high-risk”category has been defined as the patient presenting withBMD-defined osteoporosis who also has multiple vertebralfractures [79]. The classifications from BCT, shown inTable 1, can be easily incorporated into these types of practiceguidelines by expanding the definition of high-risk and veryhigh-risk patients based on BMD criteria (T-score ≤ − 2.5 atthe hip or spine) to also consider the presence of fragile bonestrength. Further, while spinal coverage in abdominal CTscans typically only extends over the lumbar region, sagittalreconstructions from those scans can be useful nonetheless toopportunistically identify any prevalent vertebral fracture inthat region [48, 49].
Another issue in using BCT clinically for patient care iswhat to do about monitoring for a treatment response once aBCT patient is placed on treatment. BCT, when used with adedicated CT scan, can be used to monitor. However, giventhat opportunistic BCT has not yet been evaluated for moni-toring treatment responses, we recommend that opportunisticBCT patients can be monitored for a treatment response bytaking a baseline DXA once the patient is placed on treatmentand then a follow-up monitoring DXA as appropriate. Forrepeated screening and fracture risk re-evaluation overtime—which is distinct from monitoring a treatmentresponse—any approved osteoporosis test, including opportu-nistic or dedicated BCT, can be used at any time point, andresults interpreted appropriately.
BCT has some inherent limitations that should be recognized.One important clinical caveat, which applies also to any BMDmeasurement, is that BCT cannot detect any molecular level de-fects in bone that might compromise bone strength independentlyof the level of BMD. This is because clinical CTscans do not havemolecular level resolution, and the computational finite elementmodel used for BCT, which utilizes empirical relations from ca-daver testing between BMD and the mechanical properties oftrabecular and cortical bone, implicitly assumes a typical relationbetween CT-measured BMD and bone strength at the tissue level.Thus, physicians should be aware of this feature when interpretingresults from a BCT test. For example, if a patient fractures withouttrauma and has both highBMDand high bone strength fromBCT,one can reasonably interpret that finding as indirect but good ev-idence of compromised bone quality at the molecular level thatpresumably weakens the bone [115].
Another limitation of both BCT and BMD measurementsfor fracture risk assessment is that they only evaluate factorsdirectly related to identifying the presence of osteoporosis;other factors related to fracture risk (e.g., fall risk) are notcurrently included. As a new modality for osteoporosis test-ing, and given its biomechanical and mechanistic nature, BCTis likely to evolve. As summarized elsewhere [24, 26], furtherimprovements to BCT for measuring bone strength clinically
Osteoporos Int (2020) 31:1025–1048 1043
might result from incorporating such characteristics as trabec-ular orientation, enhanced cortical modeling, effects of agingon bone tissue ductility, and multiple sideway fall loadingconditions—all topics of ongoing research [42, 97, 99, 100,116]. In addition, beyond bone strength, other biomechanicalfactors are also important in fracture etiology: for example,fall risk, fall biomechanics, probabilistic loading, musclestrength, overall skeletal geometry, and soft tissue-related en-ergy absorption and force attenuation [41]. These and otherfactors may eventually be integrated into BCT to morecompletely and mechanistically assess overall fracture risk.
Finally, it is noteworthy also that the BCT results presentedhere are limited to the specific implementation of BCT reviewedhere (VirtuOst). Due to BCT’s use to date primarily in researchsettings, different implementations of BCT by different researchgroups can provide different values of bone strength dependingon a number of technical factors. Such factors include specificsof the image processing and calibration, the finite elementmodel-ing choices (e.g., type of finite element, material property map-ping), and perhaps most importantly, how the virtual stress test-ing itself is configured, e.g., the bone orientation during the side-ways fall or even the use of stance-like loading [26, 117]. Thus,all BCT is not the same and different implementations of BCTbydifferent groups may produce different values of strength, requir-ing, for example, different classification cut-points. That said,one study reported different absolute measurements from twodifferent implementations of BCT but similar measurements oftreatment-induced percent changes [118], suggesting that BCT ismore robust across different implementations for assessing tem-poral changes than absolute values. Related, the clinical term“BCT” is intended only to apply to finite element analysis ofclinical-resolution CTscans and does not apply to finite elementanalysis of other types of medical images. For example, finiteelement analysis can be used with DXA [119, 120] and high-resolution peripheral quantitative CT [121, 122] scans, but boththese applications are used primarily in research settings and arenot available for clinical diagnostic purposes.
In summary, long used as a research tool, at this juncture,BCT is well established in terms of clinical efficacy and is nowavailable clinically as aMedicare-reimbursed osteoporosis test inthe USA. While it can be used with a dedicated CT, BCT isparticularly well suited for opportunistic use in the patient whois already undergoing a hip- or spine-containing CT for otherpurposes. The data presented here indicate that BCT used in thisway should provide a convenient, safe, and effective alternativeto DXA for those patients not already undergoingDXA andwhowould benefit from a comprehensive osteoporosis assessment.
Compliance with ethical standards
Conflicts of interest Keaveny: Founder and consulting Chief ScientificOfficer, O.N. Diagnostics; consulting for Amgen, Agnovos Healthcare,Bone Health Technologies; equity in O.N. Diagnostics.
Clarke: Advisory board and grant support from Shire/Takeda, Inc.;Data Monitoring Board for Bristol-Myers-Squibb.
Cosman: Consulting, advisory board, speaking fees, and/or grant sup-port from Amgen, Eli Lilly, Radius, Merck, and RPharm US.
Orwoll: Consulting for Bayer and Amgen. Research support fromMereo BioPharma.
Siris: none.Khosla: none.Bouxsein: Grant support from Radius and Amgen; consulting fees
from Agnovos Healthcare
Open Access This article is licensed under a Creative CommonsAttribution-NonCommercial 4.0 International License, which permitsany non-commercial use, sharing, adaptation, distribution andreproduction in any medium or format, as long as you give appropriatecredit to the original author(s) and the source, provide a link to theCreative Commons licence, and indicate if changes were made. Theimages or other third party material in this article are included in thearticle's Creative Commons licence, unless indicated otherwise in acredit line to the material. If material is not included in the article'sCreative Commons licence and your intended use is not permitted bystatutory regulation or exceeds the permitted use, you will need toobtain permission directly from the copyright holder. To view a copy ofthis licence, visit http://creativecommons.org/licenses/by-nc/4.0/.
References
1. U.S. Department of Health and Human Services (2004) Bonehealth and osteoporosis: a report of the surgeon general. U.S.Department of Health and Human Services, Office of theSurgeon General, Rockville
2. NIH Consensus Development Panel (2001) Osteoporosis preven-tion, diagnosis, and therapy. JAMA 285:785–795
3. International Osteoporosis Foundation (2020) Osteoporosis.http://wwwiofbonehealthorg/osteoporosis Accessed Feb 20 2020
4. Zhang J, Delzell E, Zhao H, Laster AJ, Saag KG, Kilgore ML,Morrisey MA,Wright NC, Yun H, Curtis JR (2012) Central DXAutilization shifts from office-based to hospital-based settingsamong Medicare beneficiaries in the wake of reimbursementchanges. J Bone Miner Res 27:858–864
5. Lewiecki EM, Adler RA, Curtis JR (2016) Hip fractures and de-clining DXA testing: at a breaking point? J Bone Miner Res 31:S26
6. King AB, Fiorentino DM (2011) Medicare payment cuts for oste-oporosis testing reduced use despite tests' benefit in reducing frac-tures. Health Aff (Millwood) 30:2362–2370
7. Lim SY, Lim JH, Nguyen D, Okamura R, Amiri HM, Calmes M,Nugent K (2013) Screening for osteoporosis in men aged 70 yearsand older in a primary care setting in the United States. Am JMensHealth 7:350–354
8. Siris ES, Modi A, Tang J, Gandhi S, Sen S (2014) Substantialunder-treatment among women diagnosed with osteoporosis in aUS managed-care population: a retrospective analysis. Curr MedRes Opin 30:123–130
9. Lewiecki E, Wright NC, Curtis JR, Siris E, Gagel RF, Saag KG,Singer AJ, Steven PM, Adler RA (2018) Hip fracture trends in theUnited States, 2002 to 2015. Osteoporos Int 29:717–722
10. Schousboe JT, Taylor BC, Fink HA, Kane RL, Cummings SR,Orwoll ES, Melton LJ 3rd, Bauer DC, Ensrud KE (2007) Cost-effectiveness of bone densitometry followed by treatment of oste-oporosis in older men. JAMA 298:629–637
11. Nayak S, Greenspan SL (2016) Cost-effectiveness of osteoporosisscreening strategies for men. J Bone Miner Res 31:1189–1199
Osteoporos Int (2020) 31:1025–10481044

12. Nayak S, Greenspan SL (2018) How canwe improve osteoporosiscare? A systematic review and meta-analysis of the efficacy ofquality improvement strategies for osteoporosis. J Bone MinerRes 33:1585–1594
13. Wright NC, Looker AC, Saag KG, Curtis JR, Delzell ES, RandallS, Dawson-Hughes B (2014) The recent prevalence of osteoporo-sis and low bone mass in the United States based on bone mineraldensity at the femoral neck or lumbar spine. J BoneMiner Res 29:2520–2526
14. Johannesdottir F, Thrall E, Muller J, Keaveny TM, KopperdahlDL, Bouxsein ML (2017) Comparison of non-invasive assess-ments of strength of the proximal femur. Bone 105:93–102
15. Schuit SC, van der Klift M, Weel AE, de Laet CE, Burger H,Seeman E, Hofman A, Uitterlinden AG, van Leeuwen JP, PolsHA (2004) Fracture incidence and association with bone mineraldensity in elderly men and women: the Rotterdam study. Bone 34:195–202
16. Orwoll ES,Marshall LM, Nielson CM, Cummings SR, Lapidus J,Cauley JA, Ensrud K, Lane N, Hoffmann PR, Kopperdahl DL,Keaveny TM (2009) Finite element analysis of the proximal femurand hip fracture risk in older men. J Bone Miner Res 24:475–483
17. Wainwright SA,Marshall LM, EnsrudKE, Cauley JA, Black DM,Hillier TA, Hochberg MC, Vogt MT, Orwoll ES (2005) Hip frac-ture in women without osteoporosis. J Clin Endocrinol Metab 90:2787–2793
18. Oden A, McCloskey EV, Johansson H, Kanis JA (2013)Assessing the impact of osteoporosis on the burden of hip frac-tures. Calcif Tissue Int 92:42–49
19. Jiang X, Gruner M, Tremollieres F, PluskiewiczW, Sornay-RenduE, Adamczyk P, Schnatz PF (2017) Diagnostic accuracy of FRAXin predicting the 10-year risk of osteoporotic fractures using theUSA treatment thresholds: a systematic review and meta-analysis.Bone 99:20–25
20. Adams AL, Fischer H, Kopperdahl DL, Lee DC, Black DM,Bouxsein ML, Fatemi S, Khosla S, Orwoll ES, Siris ES,Keaveny TM (2018) Osteoporosis and hip fracture risk from rou-tine computed tomography scans: the Fracture, Osteoporosis, andCT Utilization Study (FOCUS). J Bone Miner Res 33:1291–1301
21. Keaveny TM (2010) Biomechanical computed tomography-noninvasive bone strength analysis using clinical computed to-mography scans. Ann N YAcad Sci 1192:57–65
22. Faulkner KG, Cann CE, Hasegawa BH (1991) Effect of bonedistribution on vertebral strength: assessment with patient-specific nonlinear finite element analysis. Radiology 179:669–674
23. Zysset P, Qin L, Lang T, Khosla S, Leslie WD, Shepherd JA,Schousboe JT, Engelke K (2015) Clinical use of quantitative com-puted tomography-based finite element analysis of the hip andspine in the management of osteoporosis in adults: the 2015ISCD official positions-part II. J Clin Densitom 18:359–392
24. Johannesdottir F, Allaire B, Bouxsein ML (2018) Fracture predic-tion by computed tomography and finite element analysis: currentand future perspectives. Curr Osteoporos Rep 16:411–422
25. VicecontiM, QasimM,Bhattacharya P, Li X (2018) Are CT-basedfinite element model predictions of femoral bone strengtheningclinically useful? Curr Osteoporos Rep 16:216–223
26. Bouxsein ML, Zysset P, Gluer CC, McClung M, Biver E, PierrozDD, Ferrari SL (2020) Perspectives on the non-invasive evalua-tion of femoral strength in the assessment of hip fracture risk.Osteoporos Int
27. The Centers for Medicare & Medicaid Services (2018) Part Bnational summary data file, Code Range: 03) Radiology (70000- 79999) http://wwwcmsgov/Research-Statistics-Data-and-Systems/Downloadable-Public-Use-Files/Part-B-National-Summary-Data-File/Overviewhtml Accessed Feb 20 2020
28. FRAX (2019) Fracture risk assessment tool. http://wwwshefacuk/FRAX Accessed Feb 20 2020
29. American College of Radiology (2013) ACR practice guidelinefor the performance of quantitative computed tomography (QCT)bone densitometry (resolution 32). American College ofRadiology, Reston
30. Engelke K, Adams JE, Armbrecht G, Augat P, Bogado CE,Bouxsein ML, Felsenberg D, Ito M, Prevrhal S, Hans DB,Lewiecki EM (2008) Clinical use of quantitative computed to-mography and peripheral quantitative computed tomography inthe management of osteoporosis in adults: the 2007 ISCD officialpositions. J Clin Densitom 11:123–162
31. Keaveny TM, McClung MR, Genant HK, Zanchetta JR, KendlerD, Brown JP, Goemaere S, Recknor C, Brandi ML, Eastell R,Kopperdahl DL, Engelke K, Fuerst T, Radcliffe HS, Libanati C(2014) Femoral and vertebral strength improvements in postmen-opausal womenwith osteoporosis treated with denosumab. J BoneMiner Res 29:158–165
32. Lee DC, Hoffmann PF, Kopperdahl DL, Keaveny TM (2017)Phantomless calibration of CT scans for measurement of BMDand bone strength — inter-operator reanalysis precision. Bone103:325–333
33. Wang X, Sanyal A, Cawthon PM, Palermo L, Jekir M,Christensen J, Ensrud KE, Cummings SR, Orwoll E, BlackDM, Keaveny TM (2012) Prediction of new clinical vertebralfractures in elderly men using finite element analysis of CTscans.J Bone Miner Res 27:808–816
34. Allaire BT, Lu D, Johannesdottir F, Kopperdahl D, Keaveny TM,Jarraya M, Guermazi A, Bredella MA, Samelson EJ, Kiel DP,Anderson DE, Demissie S, Bouxsein ML (2019) Prediction ofincident vertebral fracture using CT-based finite element analysis.Osteoporos Int 30:323–331
35. Kopperdahl DL, Aspelund T, Hoffmann PF, Sigurdsson S,Siggeirsdottir K, Harris TB, Gudnason V, Keaveny TM (2014)Assessment of incident spine and hip fractures in women andmenusing finite element analysis of CT scans. J Bone Miner Res 29:570–580
36. Kopperdahl DL, Morgan EF, Keaveny TM (2002) Quantitativecomputed tomography estimates of the mechanical properties ofhuman vertebral trabecular bone. J Orthop Res 20:801–805
37. Morgan EF, Keaveny TM (2001) Dependence of yield strain ofhuman trabecular bone on anatomic site. J Biomech 34:569–577
38. Morgan EF, Bayraktar HH, Keaveny TM (2003) Trabecular bonemodulus-density relationships depend on anatomic site. JBiomech 36:897–904
39. Bayraktar HH, Morgan EF, Niebur GL, Morris GE, Wong EK,Keaveny TM (2004) Comparison of the elastic and yield proper-ties of human femoral trabecular and cortical bone tissue. JBiomech 37:27–35
40. Altai Z, Qasim M, Li X, Viceconti M (2019) The effect of bound-ary and loading conditions on patient classification using finiteelement predicted risk of fracture. Clin Biomech (Bristol, Avon)68:137–143
41. Bhattacharya P, Altai Z, Qasim M, Viceconti M (2019) Amultiscale model to predict current absolute risk of femoral frac-ture in a postmenopausal population. Biomech ModelMechanobiol 18:301–318
42. Nishiyama KK, Ito M, Harada A, Boyd SK (2014) Classificationof women with and without hip fracture based on quantitativecomputed tomography and finite element analysis. OsteoporosInt 25:619–626
43. Michalski AS, Edwards WB, Boyd SK (2019) The influence ofreconstruction kernel on bone mineral and strength estimatesusing quantitative computed tomography and finite element anal-ysis. J Clin Densitom 22:219–228
44. Bauer JS, Henning TD, Mueller D, Lu Y, Majumdar S, Link TM(2007) Volumetric quantitative CT of the spine and hip derived
Osteoporos Int (2020) 31:1025–1048 1045
from contrast-enhanced MDCT: conversion factors. Am JRoentgenol 188:1294–1301
45. Weber NK, Fidler JL, Keaveny TM, Clarke BL, Khosla S,Fletcher JG, Lee DC, Pardi DS, Loftus EV Jr, Kane SV, BarlowJM, Murthy NS, Becker BD, Bruining DH (2014) Validation of aCT-derived method for osteoporosis screening in IBD patientsundergoing contrast-enhanced CT enterography. Am JGastroenterol 109:401–408
46. Cosman F, de Beur SJ, LeBoff MS, Lewiecki EM, Tanner B,Randall S, Lindsay R (2014) Clinician's guide to prevention andtreatment of osteoporosis. Osteoporos Int 25:2359–2381
47. Fidler JL, Murthy NS, Khosla S, Clarke BL, Bruining DH,Kopperdahl DL, Lee DC, Keaveny TM (2016) Comprehensiveassessment of osteoporosis and bone fragility with CTcolonography. Radiology 278:172–180
48. Bauer JS, Muller D, Ambekar A, Dobritz M, Matsuura M,Eckstein F, Rummeny EJ, Link TM (2006) Detection of osteopo-rotic vertebral fractures using multidetector CT. Osteoporos Int17:608–615
49. Lee SJ, Binkley N, Lubner MG, Bruce RJ, Ziemlewicz TJ,Pickhardt PJ (2016) Opportunistic screening for osteoporosisusing the sagittal reconstruction from routine abdominal CT forcombined assessment of vertebral fractures and density.Osteoporos Int 27:1131–1136
50. Nawathe S, Akhlaghpour H, Bouxsein ML, Keaveny TM (2014)Microstructural failure mechanisms in the human proximal femurfor sideways fall loading. J Bone Miner Res 29:507–515
51. Poole KE, Skingle L, Gee AH, Turmezei TD, Johannesdottir F,Blesic K, Rose C, VindlacheruvuM, Donell S, Vaculik J, Dungl P,Horak M, Stepan JJ, Reeve J, Treece GM (2017) Focal osteopo-rosis defects play a key role in hip fracture. Bone 94:124–134
52. Bolotin HH (2007) DXA in vivo BMD methodology: an errone-ous and misleading research and clinical gauge of bone mineralstatus, bone fragility, and bone remodelling. Bone 41:138–154
53. Yu EW, Thomas BJ, Brown JK, Finkelstein JS (2012) Simulatedincreases in body fat and errors in bone mineral density measure-ments by DXA and QCT. J Bone Miner Res 27:119–124
54. Maldonado FJ, Al BawardyBF, Nehra AK, LeeYS, BruiningDH,Adkins MC, Keaveny TM, Johnson MP, Fidler JL, McColloughCH, Fletcher JG (2019) Findings of CT-derived bone strengthassessment in inflammatory bowel disease patients undergoingCT enterography in clinical practice. Inflamm Bowel Dis 25:1072–1079
55. Burch S, Feldstein M, Hoffmann PF, Keaveny TM (2016)Prevalence of poor bone quality in women undergoing spinalfusion using biomechanical-CT analysis. Spine (Phila Pa 1976)41:246–252
56. Schwaiger BJ, Kopperdahl DL, Nardo L, Facchetti L, Gersing AS,Neumann J, Lee KJ, Keaveny TM, Link TM (2017) Vertebral andfemoral bone mineral density and bone strength in prostate cancerpatients assessed in phantomless PET/CT examinations. Bone101:62–69
57. Binkley N, Kiebzak GM, Lewiecki EM, Krueger D, Gangnon RE,Miller PD, Shepherd JA, Drezner MK (2005) Recalculation of theNHANES database SD improves T-score agreement and reducesosteoporosis prevalence. J Bone Miner Res 20:195–201
58. Khoo BC, Brown K, Cann C, Zhu K, Henzell S, Low V,Gustafsson S, Price RI, Prince RL (2009) Comparison of QCT-derived and DXA-derived areal bone mineral density and Tscores. Osteoporos Int 20:1539–1545
59. Ziemlewicz TJ, Maciejewski A, Binkley N, Brett AD, Brown JK,Pickhardt PJ (2016) Opportunistic quantitative CT bone mineraldensity measurement at the proximal femur using routine contrast-enhanced scans: direct comparison with DXA in 355 adults. JBone Miner Res 31:1835–1840
60. Lee SJ, Anderson PA, Pickhardt PJ (2017) Predicting future hipfractures on routine abdominal CT using opportunistic osteoporo-sis screening measures: a matched case-control study. Am JRoentgenol 209:395–402
61. Cann CE, Genant HK, Kolb FO, Ettinger B (1985) Quantitativecomputed tomography for prediction of vertebral fracture risk.Bone 6:1–7
62. Melton LJ, Riggs BL, Keaveny TM,Achenbach SJ, Hoffmann PF,Camp JJ, Rouleau PA, Bouxsein ML, Amin S, Atkinson EJ, RobbRA, Khosla S (2007) Structural determinants of vertebral fracturerisk. J Bone Miner Res 22:1885–1892
63. Melton LJ 3rd, Riggs BL, Keaveny TM, Achenbach SJ,Kopperdahl D, Camp JJ, Rouleau PA, Amin S, Atkinson EJ,Robb RA, Therneau TM, Khosla S (2010) Relation of vertebraldeformities to bone density, structure, and strength. J Bone MinerRes 25:1922–1930
64. Anderson DE, Demissie S, Allaire BT, Bruno AG, KopperdahlDL, Keaveny TM, Kiel DP, BouxseinML (2014) The associationsbetween QCT-based vertebral bone measurements and prevalentvertebral fractures depend on the spinal locations of both bonemeasurement and fracture. Osteoporos Int 25:559–566
65. Black DM, BouxseinML,Marshall LM, Cummings SR, Lang TF,Cauley JA, Ensrud KE, Nielson CM, Orwoll ES (2008) Proximalfemoral structure and the prediction of hip fracture in men: a largeprospective study using QCT. J Bone Miner Res 23:1326–1333
66. Crawford RP, Cann CE, Keaveny TM (2003) Finite elementmodels predict in vitro vertebral body compressive strength betterthan quantitative computed tomography. Bone 33:744–750
67. Lee DC, Varela A, Kostenuik PJ, Ominsky MS, Keaveny TM(2016) Finite element analysis of denosumab treatment effectson vertebral strength in ovariectomized cynomolgus monkeys. JBone Miner Res 31:1586–1595
68. Buckley JM, Loo K, Motherway J (2007) Comparison of quanti-tative computed tomography-based measures in predicting verte-bral compressive strength. Bone 40:767–774
69. Dall'Ara E, Schmidt R, Pahr D, Varga P, Chevalier Y, Patsch J,Kainberger F, Zysset P (2010) A nonlinear finite element modelvalidation study based on a novel experimental technique for in-ducing anterior wedge-shape fractures in human vertebral bodiesin vitro. J Biomech 43:2374–2380
70. Zysset PK, Dall'ara E, Varga P, Pahr DH (2013) Finite elementanalysis for prediction of bone strength. Bonekey Rep 2:386
71. Keyak JH, Rossi SA, Jones KA, Skinner HB (1998) Prediction offemoral fracture load using automated finite element modeling. JBiomech 31:125–133
72. Cody DD, Gross GJ, Hou FJ, Spencer HJ, Goldstein SA, FyhrieDP (1999) Femoral strength is better predicted by finite elementmodels than QCT and DXA. J Biomech 32:1013–1020
73. Dragomir-Daescu D, Op Den Buijs J, McEligot S, Dai Y,Entwistle RC, Salas C, Melton LJ 3rd, Bennet KE, Khosla S,Amin S (2011) Robust QCT/FEAmodels of proximal femur stiff-ness and fracture load during a sideways fall on the hip. AnnBiomed Eng 39:742–755
74. Dall'Ara E, Luisier B, Schmidt R, Kainberger F, Zysset P, Pahr D(2013) A nonlinear QCT-based finite element model validationstudy for the human femur tested in two configurations in vitro.Bone 52:27–38
75. Jayakar RY, Cabal A, Szumiloski J, Sardesai S, Phillips EA, LaibA, Scott BB, Pickarski M, Duong LT, Winkelmann CT,McCracken PJ, Hargreaves R, Hangartner TN, Williams DS(2012) Evaluation of high-resolution peripheral quantitative com-puted tomography, finite element analysis and biomechanical test-ing in a pre-clinical model of osteoporosis: a study with odanacatibtreatment in the ovariectomized adult rhesus monkey. Bone 50:1379–1388
Osteoporos Int (2020) 31:1025–10481046
76. Amin S, Kopperdahl DL,Melton LJ 3rd, Achenbach SJ, TherneauTM, Riggs BL, Keaveny TM, Khosla S (2011) Association of hipstrength estimates by finite-element analysis with fractures inwomen and men. J Bone Miner Res 26:1593–1600
77. Kanis JA, Oden A, Johnell O, Johansson H, De Laet C, Brown J,Burckhardt P, Cooper C, Christiansen C, Cummings S, EismanJA, Fujiwara S, Gluer C, Goltzman D, Hans D, Krieg MA, LaCroix A, McCloskey E, Mellstrom D, Melton LJ 3rd, Pols H,Reeve J, Sanders K, Schott AM, Silman A, Torgerson D, vanStaa T, Watts NB, Yoshimura N (2007) The use of clinical riskfactors enhances the performance of BMD in the prediction of hipand osteoporotic fractures in men and women. Osteoporos Int 18:1033–1046
78. Keaveny TM, Kopperdahl DL, Melton LJ 3rd, Hoffmann PF,Amin S, Riggs BL, Khosla S (2010) Age-dependence of femoralstrength in white women and men. J Bone Miner Res 25:994–1001
79. Eastell R, Rosen CJ, Black DM, Cheung AM, Murad MH,Shoback D (2019) Pharmacological management of osteoporosisin postmenopausal women: an endocrine society clinical practiceguideline. J Clin Endocrinol Metab 104:1595–1622
80. Fan B, Lu Y, Genant H, Fuerst T, Shepherd J (2010) Does stan-dardized BMD still remove differences between Hologic and GE-lunar state-of-the-art DXA systems? Osteoporos Int 21:1227–1236
81. Cummings SR, Palermo L, Browner W, Marcus R, Wallace R,Pearson J, Blackwell T, Eckert S, Black D (2000) Monitoringosteoporosis therapy with bone densitometry: misleading changesand regression to the mean. JAMA 283:1318–1321
82. Keaveny TM, Donley DW, Hoffmann PF, Mitlak BH, Glass EV,San Martin JA (2007) Effects of teriparatide and alendronate onvertebral strength as assessed by finite element modeling of QCTscans in women with osteoporosis. J Bone Miner Res 22:149–157
83. Mawatari T, Miura H, Hamai S, Shuto T, Nakashima Y, OkazakiK, Kinukawa N, Sakai S, Hoffmann PF, Iwamoto Y, Keaveny TM(2008) Vertebral strength changes in rheumatoid arthritis patientstreated with alendronate, as assessed by finite element analysis ofclinical computed tomography scans: a prospective randomizedclinical trial. Arthritis Rheum 58:3340–3349
84. Keaveny TM, Hoffmann PF, Singh M, Palermo L, Bilezikian JP,Greenspan SL, Black DM (2008) Femoral bone strength and itsrelation to cortical and trabecular changes after treatment withPTH, alendronate, and their combination as assessed by finiteelement analysis of quantitative CT scans. J Bone Miner Res 23:1974–1982
85. Lewiecki EM, Keaveny TM, Kopperdahl DL, Genant HK,Engelke K, Fuerst T, Kivitz A, Davies RY, Fitzpatrick LA(2009) Once-monthly oral Ibandronate improves biomechanicaldeterminants of bone strength in women with postmenopausalosteoporosis. J Clin Endocrinol Metab 94:171–180
86. Keaveny TM,McClungMR,WanX, Kopperdahl DL,Mitlak BH,Krohn K (2012) Femoral strength in osteoporotic women treatedwith teriparatide or alendronate. Bone 50:165–170
87. Brixen K, Chapurlat R, Cheung AM, Keaveny TM, Fuerst T,Engelke K, Recker R, Dardzinski B, Verbruggen N, Ather S,Rosenberg E, de Papp AE (2013) Bone density, turnover, andestimated strength in postmenopausal women treated withodanacatib: a randomized trial. J Clin Endocrinol Metab 98:571–580
88. Cosman F, Keaveny TM, Kopperdahl D, Wermers RA, Wan X,Krohn KD, Krege JH (2013) Hip and spine strength effects ofadding versus switching to teriparatide in postmenopausal womenwith osteoporosis treated with prior alendronate or raloxifene. JBone Miner Res 28:1328–1336
89. Kleerekoper M, Greenspan SL, Lewiecki EM, Miller PD, KendlerDL, Maricic M, Keaveny TM, Kopperdahl DL, Ruff VA, Wan X,
Janos B, Krohn K (2014) Assessing the effects of teriparatidetreatment on bone mineral density, bone microarchitecture, andbone strength. J Bone Joint Surg Am 96:e90
90. Snyder PJ, Kopperdahl DL, Stephens-Shields AJ, Ellenberg SS,Cauley JA, Ensrud KE, Lewis CE, Barrett-Connor E, SchwartzAV, Lee DC, Bhasin S, Cunningham GR, Gill TM, MatsumotoAM, Swerdloff RS, Basaria S, Diem SJ, Wang C, Hou X, CifelliD, Dougar D, Zeldow B, Bauer DC, Keaveny TM (2017) Effect oftestosterone treatment on volumetric bone density and strength inolder men with low testosterone: a controlled clinical trial. JAMAIntern Med 177:471–479
91. Keaveny TM, Crittenden DB, Bolognese MA, Genant HK,Engelke K, Oliveri B, Brown JP, Langdahl BL, Yan C, GrauerA, Libanati C (2017) Greater gains in spine and hip strength forromosozumab compared to teriparatide in postmenopausal wom-en with low bone mass. J Bone Miner Res 32:1956–1962
92. Langdahl BL, Libanati C, Crittenden DB, Bolognese MA, BrownJP, Daizadeh NS, Dokoupilova E, Engelke K, Finkelstein JS,Genant HK, Goemaere S, Hyldstrup L, Jodar-Gimeno E,Keaveny TM, Kendler D, Lakatos P, Maddox J, Malouf J,Massari FE, Molina JF, Ulla MR, Grauer A (2017)Romosozumab (sclerostin monoclonal antibody) versusteriparatide in postmenopausal women with osteoporosistransitioning from oral bisphosphonate therapy: a randomised,open-label, phase 3 trial. Lancet 390:1585–1594
93. Howe JG, Hill RS, Stroncek JD, Shaul JL, Favell D, Cheng RR,Engelke K, Genant HK, Lee DC, Keaveny TM, Bouxsein ML,Huber B (2019) Treatment of bone loss in proximal femurs ofpostmenopausal osteoporotic women with AGN1 local osteo-enhancement procedure (LOEP) increases hip bone mineral den-sity and hip strength: a long-term prospective cohort study.Osteoporos Int
94. Pisu M, Kopperdahl DL, Lewis CE, Saag KG, Keaveny TM(2019) Cost-effectiveness of osteoporosis screening using biome-chanical computed tomography for patients with a previous ab-dominal CT. J Bone Miner Res 34:1229–1239
95. Agten CA, Ramme AJ, Kang S, Honig S, Chang G (2017) Cost-effectiveness of virtual bone strength testing in osteoporosisscreening programs for postmenopausal women in the UnitedStates. Radiology 285:506–517
96. Falcinelli C, Schileo E, Balistreri L, Baruffaldi F, Bordini B,Viceconti M, Albisinni U, Ceccarelli F, Milandri L, Toni A,Taddei F (2014) Multiple loading conditions analysis can improvethe association between finite element bone strength estimates andproximal femur fractures: a preliminary study in elderly women.Bone 67:71–80
97. Schileo E, Dall'ara E, Taddei F, Malandrino A, Schotkamp T,Baleani M, Viceconti M (2008) An accurate estimation of bonedensity improves the accuracy of subject-specific finite elementmodels. J Biomech 41:2483–2491
98. Grassi L, Schileo E, Taddei F, Zani L, Juszczyk M, Cristofolini L,Viceconti M (2012) Accuracy of finite element predictions insideways load configurations for the proximal human femur. JBiomech 45:394–399
99. Enns-Bray WS, Bahaloo H, Fleps I, Ariza O, Gilchrist S, WidmerR, Guy P, Palsson H, Ferguson SJ, Cripton PA, Helgason B (2018)Material mapping strategy to improve the predicted response ofthe proximal femur to a sideways fall impact. J Mech BehavBiomed Mater 78:196–205
100. Bahaloo H, Enns-Bray WS, Fleps I, Ariza O, Gilchrist S, SoykaRW, Guy P, Palsson H, Ferguson SJ, Cripton PA, Helgason B(2018) On the failure initiation in the proximal human femur undersimulated sideways fall. Ann Biomed Eng 46:270–283
101. Ariza O, Gilchrist S,Widmer RP, Guy P, Ferguson SJ, Cripton PA,Helgason B (2015) Comparison of explicit finite element and
Osteoporos Int (2020) 31:1025–1048 1047
mechanical simulation of the proximal femur during dynamicdrop-tower testing. J Biomech 48:224–232
102. Bessho M, Ohnishi I, Matsumoto T, Ohashi S, Matsuyama J,Tobita K, Kaneko M, Nakamura K (2009) Prediction of proximalfemur strength using a CT-based nonlinear finite element method:differences in predicted fracture load and site with changing loadand boundary conditions. Bone 45:226–231
103. Haider IT, Speirs AD, Frei H (2013) Effect of boundary condi-tions, impact loading and hydraulic stiffening on femoral fracturestrength. J Biomech 46:2115–2121
104. Keyak JH, Sigurdsson S, Karlsdottir GS, Oskarsdottir D,Sigmarsdottir A, Kornak J, Harris TB, Sigurdsson G, JonssonBY, Siggeirsdottir K, Eiriksdottir G, Gudnason V, Lang TF(2013) Effect of finite element model loading condition on frac-ture risk assessment in men and women: the AGES-Reykjavikstudy. Bone 57:18–29
105. Kheirollahi H, Luo Y (2015) Identification of high stress andstrain regions in proximal femur during single-leg stance and side-ways fall using QCT-based finite element model. Int J Med HealthBiomed Bioeng Pharm Eng 9:633–640
106. Lang TF, Sigurdsson S, Karlsdottir G, Oskarsdottir D,Sigmarsdottir A, Chengshi J, Kornak J, Harris TB, SigurdssonG, Jonsson BY, Siggeirsdottir K, Eiriksdottir G, Gudnason V,Keyak JH (2012) Age-related loss of proximal femoral strengthin elderly men and women: The Age Gene/EnvironmentSusceptibility Study–Reykjavik. Bone 50:743–748
107. Lotz JC, Cheal EJ, Hayes WC (1995) Stress distributions withinthe proximal femur during gait and falls: implications for osteopo-rotic fracture. Osteoporos Int 5:252–261
108. Schileo E, Balistreri L, Grassi L, Cristofolini L, Taddei F (2014)To what extent can linear finite element models of human femorapredict failure under stance and fall loading configurations? JBiomech 47:3531–3538
109. Schileo E, Taddei F, Cristofolini L, Viceconti M (2008) Subject-specific finite element models implementing a maximum principalstrain criterion are able to estimate failure risk and fracture locationon human femurs tested in vitro. J Biomech 41:356–367
110. Varga P, Schwiedrzik J, Zysset PK, Fliri-Hofmann L, Widmer D,Gueorguiev B, Blauth M, Windolf M (2016) Nonlinear quasi-static finite element simulations predict in vitro strength of humanproximal femora assessed in a dynamic sideways fall setup. JMech Behav Biomed Mater 57:116–127
111. Dagan N, Elnekave E, Barda N, Bregman-Amitai O, Bar A,Orlovsky M, Bachmat E, Balicer RD (2020) Automated opportu-nistic osteoporotic fracture risk assessment using computed to-mography scans to aid in FRAX underutilization. Nat Med 26:77–82
112. Lee DC, Hong N, Khosla S, Rhee Y, Keaveny TM (2019)Prevalence of spinal osteoporosis in women and men consideringboth bone strength and volumetric BMD — a comparison ofCaucasians (in the United States) and Koreans (in Korea). JBone Miner Res 34:100
113. Bone HG, Dempster DW, Eisman JA, Greenspan SL, McClungMR, Nakamura T, Papapoulos S, Shih WJ, Rybak-Feiglin A,
Santora AC, Verbruggen N, Leung AT, Lombardi A (2015)Odanacatib for the treatment of postmenopausal osteoporosis: de-velopment history and design and participant characteristics ofLOFT, the Long-Term Odanacatib Fracture Trial. Osteoporos Int26:699–712
114. Cummings SR, Black DM, Thompson DE, Applegate WB,Barrett-Connor E, Musliner TA, Palermo L, Prineas R, RubinSM, Scott JC, Vogt T, Wallace R, Yates AJ, LaCroix AZ (1998)Effect of alendronate on risk of fracture in women with low bonedensity but without vertebral fractures: results from the FractureIntervention Trial. JAMA 280:2077–2082
115. Tucci JR, Whitford GM, McAlister WH, Novack DV, Mumm S,Keaveny TM, Whyte MP (2017) Skeletal fluorosis due to inhala-tion abuse of a difluoroethane-containing computer cleaner. JBone Miner Res 32:188–195
116. Enns-Bray WS, Bahaloo H, Fleps I, Pauchard Y, Taghizadeh E,Sigurdsson S, Aspelund T, Buchler P, Harris T, Gudnason V,Ferguson SJ, Palsson H, Helgason B (2019) Biofidelic finite ele-ment models for accurately classifying hip fracture in a retrospec-tive clinical study of elderly women from the AGES Reykjavikcohort. Bone 120:25–37
117. Michalski AS, Amin S, Cheung AM, Cody DD, Keyak JH, LangTF, Nicolella DP, Orwoll ES, Boyd SK, Sibonga JD (2019) Hipload capacity cut-points for astronaut skeletal health NASA finiteelement strength task group recommendations. NPJ Microgravity5:6
118. Zysset P, Pahr D, Engelke K, Genant HK, McClung MR, KendlerDL, Recknor C, Kinzl M, Schwiedrzik J, Museyko O, Wang A,Libanati C (2015) Comparison of proximal femur and vertebralbody strength improvements in the FREEDOM trial using an al-ternative finite element methodology. Bone 81:122–130
119. Terzini M, Aldieri A, Rinaudo L, Osella G, Audenino AL,Bignardi C (2019) Improving the hip fracture risk predictionthrough 2D finite element models from DXA images: validationagainst 3D models. Front Bioeng Biotechnol 7:220
120. Yang S, Leslie WD, Luo Y, Goertzen AL, Ahmed S, Ward LM,Delubac I, Lix LM (2018) Automated DXA-based finite elementanalysis for hip fracture risk stratification: a cross-sectional study.Osteoporos Int 29:191–200
121. Westbury LD, Shere C, Edwards MH, Cooper C, Dennison EM,Ward KA (2019) Cluster analysis of finite element analysis andbone microarchitectural parameters identifies phenotypes withhigh fracture risk. Calcif Tissue Int 105:252–262
122. Stein EM, Liu XS, Nickolas TL, Cohen A, Thomas V, McMahonDJ, Zhang C, Yin PT, Cosman F, Nieves J, Guo XE, Shane E(2010) Abnormal microarchitecture and reduced stiffness at theradius and tibia in postmenopausal women with fractures. JBone Miner Res 25:2572–2581
Publisher’s note Springer Nature remains neutral with regard to jurisdic-tional claims in published maps and institutional affiliations.
Osteoporos Int (2020) 31:1025–10481048