Biomechanical Analysis of the Sit-to-Stand Transition 2015
104
Biomechanical Analysis of the Sit-to-Stand Transition A Thesis submitted to The University of Manchester for the degree of Master of Philosophy in the Faculty of Engineering and Physical Sciences 2015 Ivette Yadira Campos Padilla SCHOOL OF MECHANICAL, AEROSPACE AND CIVIL ENGINEERING
-
Upload
khangminh22 -
Category
Documents
-
view
2 -
download
0
Transcript of Biomechanical Analysis of the Sit-to-Stand Transition 2015

Biomechanical Analysis of the Sit-to-Stand
Transition
A Thesis submitted to The University of Manchester for the
degree of Master of Philosophy in the Faculty of Engineering and
Physical Sciences
2015
Ivette Yadira Campos Padilla
SCHOOL OF MECHANICAL, AEROSPACE AND CIVIL ENGINEERING

Biomechanical Analysis of Sit to Stand Transition
2
Table of Contents TABLE OF CONTENTS............................................................................................................. 2LIST OF FIGURES ..................................................................................................................... 5
LIST OF TABLES ....................................................................................................................... 8LIST OF ABBREVIATIONS ..................................................................................................... 9
NOMENCLATURE................................................................................................................... 11
ABSTRACT................................................................................................................................ 12DECLARATION........................................................................................................................ 13
COPYRIGHT............................................................................................................................. 13ACKNOWLEDGMENTS ......................................................................................................... 15
CHAPTER 1. INTRODUCTION ....................................................................................... 16
1.1. General Objective .....................................................................................................18
1.2. Specific Objectives ...................................................................................................18
1.3. Thesis Overview .......................................................................................................19
CHAPTER 2. LITERATURE REVIEW........................................................................... 21
2.1. Biomechanics of Human Movement ........................................................................21
2.1.1.Background of the Study of Human Movement ....................................................22
2.2. Activities of Daily Living .........................................................................................24
2.2.1.Phases of the Sit to Stand Transition......................................................................25
2.3. Sit-to-Stand Transition Test ......................................................................................26
2.3.1.Technology to Analyse the Sit-to-Stand Transition ...............................................28
2.3.2.Sit-to-Stand Transition in Physical Therapy ..........................................................30
2.4. Effects of Pathological Conditions on the Human Motion .......................................33
2.4.1.Effects of Ageing on the Human Motion. ..............................................................34
2.4.2.Younger vs Older Performance ..............................................................................35
2.5. Summary ...................................................................................................................37
CHAPTER 3. METHODOLOGY...................................................................................... 39
3.1. Experimental Set-Up.................................................................................................39
3.2. Data Acquisition .......................................................................................................42
3.3. Data Processing.........................................................................................................45
3.3.1.Biomechanical Model Creation and Kinematics Data Analysis ............................45
3.3.2.Analysis of Kinematic Data, Principal Component Analysis and Kinetic
analysis 47

Biomechanical Analysis of Sit to Stand Transition
3
3.3.3.Time and Magnitude Normalization ......................................................................48
3.3.4.Principal Component Analysis ...............................................................................49
3.3.5.Kinetics...................................................................................................................49
3.4. Summary ...................................................................................................................51
CHAPTER 4. BIOMECHANICAL ANALYSIS COMPARISON OF SIT-TO-
STAND TRANSITION PERFORMANCE BETWEEN YOUNGER AND OLDER PARTICIPANTS................................................................................................ 53
4.1. Introduction...............................................................................................................53
4.2. Whole-Body Centre of Mass Kinematics .................................................................54
4.2.1.Kinematic Analysis Comparison of the Whole-Body Centre of Mass for self-
selected Slow, Normal and Fast Speeds ...........................................................................56
4.2.2.Kinematic Analysis Comparison of the Centre of Mass’ Segments for self-
selected at Slow, Normal and Fast Speeds. ......................................................................57
4.2.3.Kinetic Analysis Comparison between the Joint’s Centres of Younger and
Older Participants .............................................................................................................59
4.2.4.Comparison of the Principal Component Analysis applied to Momenta
Variables of the WB CoM for self-selected Slow, Normal and Fast................................67
4.2.5.Comparison of the Principal Component Analysis applied to Momenta
Variables of the Centre of Mass Segments for self-selected Slow, Normal and Fast
Speeds 69
4.2.6.Summary ................................................................................................................73
CHAPTER 5. CONCLUSIONS AND DISCUSSION....................................................... 74
5.1. Younger Participants Performance of the Sit-to-Stand Transition ...........................74
5.2. Older Participants’ Performance of the Sit-to-Stand Transition...............................75
5.3. Conclusions of the Sit-to-Stand Transition Comparison Performance between
Younger and Older Participants...........................................................................................76
5.3.1.Principal Component Analysis of the Whole-Body Centre of Mass......................76
5.3.2.Principal Component Analysis applied to Momenta Variables of the
Segments Centre of Mass .................................................................................................77
5.3.3.Kinetic Analysis of the Joints.................................................................................78
REFERENCES........................................................................................................................... 80APPENDIX 1 .............................................................................................................................. 88
Ethical Document ................................................................................................................88
APPENDIX 2 .............................................................................................................................. 90Arrangement of the Anatomical Landmarks .......................................................................90
APPENDIX 3 .............................................................................................................................. 92

Biomechanical Analysis of Sit to Stand Transition
4
Data Process using Vicon Nexus Software..........................................................................92
APPENDIX 4 .............................................................................................................................. 94Data Motion Analysis ..........................................................................................................94
APPENDIX 5 .............................................................................................................................. 96Normalization Processing ....................................................................................................96
APPENDIX 6 .............................................................................................................................. 98Statistics ...............................................................................................................................98
Principal Component Analysis of the Whole-Body .........................................................98
Principal Component Analysis of the body segments ......................................................99
APPENDIX 7 ............................................................................................................................ 101
Kinetic Analysis...................................................................................................................101

Biomechanical Analysis of Sit to Stand Transition
5
List of figures
Figure 1. Sit to stand cycle normalized at 100%. Showing: at 0% sitting position; at
10% beginning of upper body movement (trunk, arms and pelvis); at 27% start to
rise; at 27% starting the HAT swinging movement; at 35% body leaves the chair;
maximum velocity is reached at 45% then at 73% body begins to stabilize the
standing position. (modif.) [6, 47]. .................................................................................25
Figure 2. Support base. a) Chair base support (when the person is sitting its CoM is
placed over the area of the five branches of the chair) and b) Feet base support
(when the person is standing its CoM is placed over the area of the feet)......................27
Figure 3. Three different sitting positions of a person. ...................................................28
Figure 4. Force-plate operation. a) Force-plate with a coordinate systems that helps
to measure the GRF and the CoP. b) Forces applied to the plate when a foot is on it.
c) Four sensors measure the position and the magnitude of the force. d) Resultant
force from the foot forces, which is the GRF applied (modif.)[161]..............................29
Figure 5. Different kinds of protocols used in the STS transition analysis. a) STS
transition analysis for younger males participants using a chair without armrest and
backrest [90], b) STS transition analysis for older females participants using a chair
with backrest, and c) STS analysis for older female rheumatoid arthritis patients
using an ejector chair [91]...............................................................................................31
Figure 6. Characterization of Pathologic Sit-to-Stand. (modif.) [11]. ............................34
Figure 7. Marker distribution over the body. a) Markers position on the landmarks
(modif.)[122]. b) Photograph of reflective markers placed and a participant for the
STS transition..................................................................................................................41
Figure 8. Motion capture system from VICON Company. a) Gait-Lab of The
University of Manchester, b) Infrared cameras from VICON system used in the
Gait–Lab..........................................................................................................................42
Figure 9. Illustration of the two static positions of the STS transition. a) In-vivo
capturing of the human body. b) Link-segment model from SMAS. .............................44
Figure 10. Data pre-processing. a) Virtual reconstruction on VICON Nexus System.
b) Markers identified and labelled according their anatomical position.........................45

Biomechanical Analysis of Sit to Stand Transition
6
Figure 11. Illustration of static sitting position of the eight link-segment model. ..........47
Figure 12. Flow Chart showing the Methodology used to estimate the STS
transition motion. ............................................................................................................52
Figure 13. Translational motion of the whole-body centre of mass along sit-to-stand
transition. a) Three dimensional plot of the whole-body centre of mass position in a
sagittal plane during the STS transition. b) Representative STS transition cycle
defining relevant time points...........................................................................................54
Figure 14. Average velocities of the whole-body centre of mass from whole
participants. .....................................................................................................................55
Figure 15. Comparison of trajectories of the whole-body centre of mass of younger
and older healthy participants at three different speeds. a) WB CoM position, b)
WB CoM linear momentum, c) WB CoM angular momentum......................................57
Figure 16. Comparison of the HAT centre of mass angular momentum at fast speed
of younger and older healthy participants.......................................................................58
Figure 17. Comparison of the angular momentum of the thigh and shank segments
of younger and older healthy participants at three different speeds. a) Thigh
segments analysis, b) Shank segment analysis. ..............................................................59
Figure 18. Comparison of the kinetic analysis result of the waist joint centre of
younger and older healthy participants at three different speeds. a) Waist joint
centre torque, b) Waist joint centre power. .....................................................................60
Figure 19. Comparison of the kinetic analysis result of the hip joints centre of
younger and older healthy participants at three different speeds. a) Hip joints centre
torque, b) Hip joints centre power, c) Hip joints centre work done................................62
Figure 20. Comparison of the kinetic analysis result of the knee joints centre of
younger and older healthy participants at three different speeds. a) Knee joints
centre torque, b) Knee joints centre power, c) Knee joints centre work done. ...............64
Figure 21. Comparison of the kinetic analysis result of the ankle joints centre of
younger and older healthy participants at three different speeds. a) Ankle joints
centre torque, b) Ankle joints centre power, c) Ankle joints centre work done. ............66
Figure 22. Comparison of the principal component analysis of the whole-body
centre of mass of younger and older healthy participants at three different speeds. a)
First principal component (PC1) and Z-scores momentum analysis, b) Second

Biomechanical Analysis of Sit to Stand Transition
7
principal component (PC2) and Z-scores momentum analysis, c) Third principal
component (PC3) and Z-score momentum analysis. ......................................................68
Figure 23. Comparison of the first principal component (PC1) and Z-score
momentum of the HAT segment momentum variables of younger and older healthy
participants at three different speeds...............................................................................69
Figure 24. Comparison of the first principal component (PC1) and Z-score
momentum analysis of the pelvis segment momentum variables of younger and
older healthy participants at three different speeds.........................................................70
Figure 25. Comparison of the first principal component (PC1) and Z-score
momentum analysis of the thighs segment momentum variables of younger and
older healthy participants at three different speeds.........................................................71
Figure 26. Comparison of the first principal component (PC1) and Z-score
momentum analysis of the shanks segment momentum variables of younger and
older healthy participants at three different speeds.........................................................72
Figure 27. Comparison of the first principal component (PC1) and Z-score
momentum analysis of the feet segment momentum variables of younger and older
healthy participants at three different speeds. .................................................................73
Figure 36. Labelling windows from VICON Nexus software to label the human
motion captured...............................................................................................................92
Figure 37. Before and After of Labelling Markers in Vicon Software...........................93
Figure 38. Model of the human body during STS transition. .........................................95
Figure 39. Vector velocity from the trial one of participant number one, showing
the parameters needed to normalize the trials. ................................................................97
Figure 40. Markers, joint, and CoP position on sagittal and frontal view at 35% of
the STS transition cycle. ...............................................................................................102
Figure 41. Flow diagram used to obtain the ankle force...............................................103
Figure 42. Flow diagram to obtain the ankle torque. ....................................................104

Biomechanical Analysis of Sit to Stand Transition
8
List of Tables
Table 1. Anthropometric individual data from all participants involved in this study. ..40
Table 2. Technical Markers ............................................................................................90
Table 3. Anatomical Markers..........................................................................................91

Biomechanical Analysis of Sit to Stand Transition
9
List of Abbreviations
ADL Activities of Daily Living
STS Sit-to-stand
MoCap motion capture
WB whole-body
CoM centre of mass
HAT head, arms, trunk
PCA Principal Component Analysis
AP Anteroposterior axis
ML Medio lateral axis
RoM Range of Motion
DOF Degree of Freedom
P Position point
r Vector of P
O Origin of Coordinates
X Anteroposterior axis
Y Vertical axis
Z Medio lateral axis
SI International System of Units
W Weight
F Force
GRF Ground Reaction Force
CoP Centre of Pressure
GPE Gravitational Potential Energy
h Height
2D Two Dimensions
3D Three Dimensions
EMG Electromyography
VICON Vicon Analysis System

Biomechanical Analysis of Sit to Stand Transition
10
ABC Activities-Specific Balance Confidence
FES Falls Efficacy Scale
SD Standard Deviation

Biomechanical Analysis of Sit to Stand Transition
11
Nomenclature
N Newton
m Metre
cm Centimetre
mm Millimetre
g Gram
kg Kilogram
kg m/s Linear Momentum
Kg m2/s Angular Momentum
J Joule

Biomechanical Analysis of Sit to Stand Transition
12
Abstract The Sit-to-Stand (STS) transition is a voluntary daily activity that consists of rising from a sitting position to a standing position, an activity that is typically performed by a person several times a day. To undertake the activity successfully requires the coordination of the body limbs in order to transfer the body weight between the sitting and standing positions, maintaining the balance, in order to avoid a fall. A biomechanical analysis of the STS transition provides useful information about the motor ability and control strategy of a person and as such, it is commonly employed to assess functional performance, and as an indicator of lower limb strength in the elderly and in people with disabling diseases. The aim of the work described in this thesis was to investigate and analyse the STS transition in two groups of healthy subjects, a cohort (n=10) of younger adult participants (age range 28±2 years) and a cohort (n=10) of older adult participants (age range 56±8 years), in order to identify the differences in the performances within and between the two groups when the STS transition was undertaken at different speeds. The two groups of participants performed STS transition trials at three, different, self-selected speeds (normal, slow and fast) during which data was recorded from a caption systems, consisting of a set of six infrared-cameras and two force plates. The in-vivo data obtained was applied to a link segment biomechanical model enabling the kinematic contribution of the major body segments to the STS activity to be determined for each participant. A principal component analysis (PCA) was undertaken to identify any aggregate and segmental differences in the STS transition performance between speeds. In addition, a kinetic analysis was performed to determine the torque and power contributions of the lower limb joints during the STS transition. The results from the analysis showed that younger and older participants performed the STS transition with a similar pattern, but they used different strategies to ascend according to the speed at which the activity was being performed. The younger participants used the same strategy at slow speed than the older participants used at slow and normal speeds. Likewise, the younger participants used the same strategy at normal and fast speeds as the older participants used at fast speed. From the segmental analysis it was found that the upper-body and pelvis segments presented the larger variability than the other segments. From the joint analysis, the knee and hip joints were identified as the joints that provide the greatest contribution to the STS transition as they generated most of the power and torque required for the activity. The results obtained and the methodology developed could help clinicians with the diagnosis, planning and selection of treatment for patients with a lack of mobility. This type of analysis may also find application in fields such as robotics, ergonomics and sports training.

Biomechanical Analysis of Sit to Stand Transition
13
Declaration
Any portion of the work referred to in the thesis has been submitted in support of an
application for another degree or qualification of this or any other university or
other institute of learning.
Copyright
i. The author of this thesis (including any appendices and/or schedules to this
thesis) owns certain copyright or related rights in it (the “Copyright”) and she
has given The University of Manchester certain rights to use such Copyright,
including for administrative purposes.
ii. Copies of this thesis, either in full or in extracts and whether in hard or
electronic copy, may be made only in accordance with the Copyright, Designs
and Patents Act 1988 (as amended) and regulations issued under it or, where
appropriate, in accordance with licensing agreements which the University
has from time to time. This page must form part of any such copies made.
iii. The ownership of certain Copyright, patents, designs, trademarks and other
intellectual property (the “I Intellectual Property Rights”) and any
reproductions of copyright works in the thesis, for example graphs and tables
(“Reproductions”), which may be described in this thesis, may not be owned
by the author and may be owned by third parties. Such Intellectual Property
and Reproductions cannot and must not be made available for use without the
prior written permission of the owner(s) of the relevant Intellectual Property
and/or Reproductions.

Biomechanical Analysis of Sit to Stand Transition
14
iv. Further information on the conditions under which disclosure, publication and
commercialisation of this thesis, the Copyright and any Intellectually
Property Rights and/or Reproductions described in it may take place is
available in the University IP Policy (see
http:/documents.manchester.ac.uk/DocuInfo.aspx?DocID=487), in any
relevant Thesis restriction declarations deposited in the University Library,
The University Library’s regulations (see
http://manchester.ac.uk/library/aboutus/regulations) and in The University’s
policy on Presentation of Theses.

Biomechanical Analysis of Sit to Stand Transition
15
Acknowledgments
I would like to express my gratitude to everyone who supported me through the
course of this research. I am thankful for their help, support and friendly advice
during the research.
My sincere thanks to Prof Teresa Alonso-Rasgado, Dr Alan Walmsley and to the
Bioengineering Research Group for their guidance to improve this work.
I would like thanking to my family for their support along this investigation. To my
friends for their friendship, help and support during the development of this
research.
I wish to gratefully acknowledge the PhD scholarship financial support provided by
the National Council on Science and Technology of Mexico (CONACYT).

Biomechanical Analysis of Sit to Stand Transition
16
Chapter 1. Introduction
People perform many activities during their life such as walking, running, jumping,
climbing stairs, and sit-to-stand (STS). The correct performance of these tasks
requires a sufficient level of mobility and thus allows a person to move
independently.
The STS transition is one of the most complicated and frequent activities executed
by a person during an ordinary day. The ability to move the body from a sitting
position to standing position is a task that demands coordination and balance of the
whole body [1-3]
The STS task requires coordination, adequate mobility and balance, and sufficient
strength in the lower limbs to reach the standing position, and is essential for
functional mobility [4, 5]. STS tests are commonly used to estimate function in a
person, and can be used as an indicator of lower extremity strength. STS tests can
be important indicators of mobility limitations that are typically present as early
indications of a degenerative process [6, 7]. Hence, the importance of human
motion studies that allows a segmental analysis of the movement in the STS
transition. The main aim in evaluating an individual’s performance during activities
such as the STS transition is to identify potential opportunities to improve the
ability to move in order to regain or maintain physical independence [8-10].
STS transition has been used as a motion test where the person’s ability to perform
the STS activity without losing balance is analysed and evaluated, thus providing
the functional level of mobility [11, 12]. Clinical balance tests have revealed that
the STS transition is one of the most common activities related to the risk of falling
[12-15], because of the complexity involved in performing it.
Healthy younger people easily perform the STS transition. However, for people
with medical conditions such as Parkinson’s disease, the after effects of a stroke, or

Biomechanical Analysis of Sit to Stand Transition
17
motor impairment as a result of ageing, the ability to move is diminished. In such
cases, the WB CoM trajectory presents smalls displacements, which can be affected
body control which may be reflected in the loss of balance, increasing the risk of
falls [3]. The frequently undertaken STS activity can therefore be a challenge to
complete it for people in these circumstances [16].
In undertaking research into the STS transition, several physiologists have found it
beneficial for analysis purposes. The majority of the research into STS to-date has
been carried out to examine the performance of older people [17-19], obese
participants, women during pregnancy [20] and children with disabilities [21].
These studies say that STS transition in those people present abnormalities during
the performance, presented an analysis in just two dimensions and using only three
segments. For that reason, this research focuses on developing a methodology
which will allows an analysis of the performance of the human body throughout the
STS transition. This thesis describes an investigation into the STS transition in two
groups of healthy subjects, a group of younger adults and a group of older adults,
when the STS activity is undertaken at different speeds, enabling a comparison of
performance to be made both within and between the groups.
The first study presented investigated the STS performance in younger, healthy
participants (n=10, mean age 28±2 years) when the activity was undertaken at three
self-selected speeds: slow, normal and fast. Kinematic and kinetic analysis [22, 23]
was applied to a 13 segment whole body biomechanical model constructed using
motion capture and force plate data obtained from participants trials in order to
elucidate the contribution of the major body segments to the kinematics of the STS
transition. Principal Component Analysis (PCA) was applied to the whole body and
segmental momentum components in order to identify the more significant
momentum variables and to determine any gross and segmental level differences in
these variables between the speeds.
Next, the STS transition performance of a group of more older, healthy participants
(n=10, mean age 56±8 years) was investigated. The older participants undertook the

Biomechanical Analysis of Sit to Stand Transition
18
same series of STS trials as the group of younger participants i.e. at slow, normal
and fast self-selected speeds while data was captured from the motion capture
system and force plates, enabling a link segment whole body biomechanical model
to be constructed for each participant and facilitating kinematic and kinetic
analyses. PCA was again applied to the momentum variables to analyse segment
performance and examine any differences in performance between the three speeds.
Finally, the performance of the younger and older groups of participants when
undertaking the STS transition at the three speeds selected were compared and
analysed enabling the similarities and differences in the strategies employed by the
two groups to be identified.
1.1. General Objective
The aim of the work described in this thesis was to investigate how the transition
from a sitting to a standing position (STS transition) is accomplished in healthy
younger and older adults, thus enabling the movement to be identified in both
groups of participants.
This analysis of the STS transition enables the mobility pattern to be determined
and explains the contribution of the body’s segments and joints during the motion.
Furthermore, it aids in identifying any performance differences related with the
speed at which the activity is performed and the age of the person undertaking the
task.
1.2. Specific Objectives
To determine the kinematics and kinetics of the whole-body (WB), body segments
and body joints in two groups of healthy participants (younger adults, mean age
28±2 years and older adults, mean age 56±8 years) when undertaking the STS

Biomechanical Analysis of Sit to Stand Transition
19
transition at slow, normal and fast self-selected speeds. PCA was used to clarify the
performance of each segment in the execution of the STS transition.
To identify the similarities and differences existing between the performances of
the participant groups at the three different STS transition speeds considered.
To develop a methodology to quantify the momentum variables during the STS
transition based on human motion analysis involving anthropometric measurements
obtained from in-vivo motion capture of the participant/patient using computational
estimation. To indicate how the results could be useful as an intervention in
therapy/treatment and/or design of new assistive devices to help restoration of
normal functions.
1.3. Thesis Overview
This thesis is focused on the analysis of the STS transition. In addition to this
introductory Chapter, the thesis consists of five further chapters that have been
organized as follows:
The second Chapter describes early studies of human motion and the chronology
through to the present day. Also, this chapter gives a brief introduction to the
biomechanics related to human motion. Also explains the characterization of the
STS transition and provides a literature review of relevant analyses undertaken in
previous research. It defines the methods, equipment and tools used to analyse the
transition. Problems and disorders that can affect mobility are also described in this
Chapter
The third Chapter explains the methodology used to perform the STS trials detailed
in this thesis. A brief introduction to the equipment is provided and preparation of
the participant, video recording and data processing are described.

Biomechanical Analysis of Sit to Stand Transition
20
The fourth Chapter shows the comparison results of the STS transition analysis
between the performances of the two groups of participants, younger and older
adults, for the STS transition trials undertaken at slow, normal and fast self-selected
speeds.
Finally, the fifth Chapter presents the discussions and conclusions drawn from the
research described in this thesis.

Biomechanical Analysis of Sit to Stand Transition
21
Chapter 2. Literature Review
This chapter explains human motion studies and the factors that affect movement.
As well as reviews of the STS transition studies and its use in clinical applications
to evaluate mobility in people with disabling diseases and ageing. STS transition is
a complex activity that involves much effort from the neuro-muscular and skeletal
systems. It consists of a number of consecutive motion phases that allow the subject
to move from the sitting position to the standing position. In order to successfully
complete the STS transition, the human body requires a very high degree of
flexibility with sufficient stability to maintain the equilibrium of the whole
movement and to undertake the coordinated movement patterns [1, 2]. An
important use for STS studies is for estimating the variations in the performance of
different subjects or groups of subjects.
2.1. Biomechanics of Human Movement
The scientific study of the human motion is called kinesiology. It describes,
analyses, and evaluates the biomechanical systems. This science is developed with
interaction from others fields of knowledge such as physiology, psychology,
neuroscience, anatomy and biomechanics [24, 25]. Biomechanics describes the
interaction of the human body with the external environment, obtaining truthful
approximations of its performance by mechanics engineering theories [26-31].
Biomechanics relates the application of engineering principles to biological
systems, so that, engineering analysis may be used to understand the function of the
biological systems. Different techniques and methods are used such as experimental
measurements, modelling, and computer simulation. However, the complexity of
biological systems means that these methods are still being refined in order to
obtain more accurate results [32].

Biomechanical Analysis of Sit to Stand Transition
22
Biomechanics in human movement can be defined as the muscular, joints and
skeletal actions of the body when performing a task. The precise understanding of
human movement has a great impact on the improvement of the physical
capabilities, rehabilitation and injury prevention [24, 30, 33-35].
To perform locomotion it is necessary that all the components of the living being
are controlled and coordinated [36]. The study of human motion has been useful to
understand how the body moves. The human body produces internal forces to
produce limb movements. Biomechanics examine the effects of these forces and the
external reaction forces that acting on the motion body. The study of biomechanics
is divided into two areas kinematics and kinetics. Kinematics describes the motion
of bodies without considering the causes of movement (displacement, velocity,
acceleration, time, etc.) and kinetics studies the forces that produce the motion
(force, torque, power, etc.) [26, 33, 37-39].
2.1.1. Background of the Study of Human Movement
The early methods used to analyse human motion in living beings were based on
drawings or photographs. Then, with the invention of cinematography, motion
analysis improved, enabling more accurate measurements to be obtained. Early
studies revealed that animal movements were more complex than was originally
thought, and that successful movement performance required control and
coordination of all the components of the body system [40, 41].
The study of human motion became more important during the World wars, as a
result of the wounds inflicted that caused disability in both civilians and soldiers.
Therefore, the demand for orthotics and prostheses was substantial, which led an
increased interest in the clinical analysis of human motion performance.
In the 1970’s the main clinical analysis undertaken was the gait test. This test
involved the walking activity, which was considered to be a dynamic mobility
measure [29, 33, 34, 36]. Subsequently during the 1980’s, researchers noticed that

Biomechanical Analysis of Sit to Stand Transition
23
the STS was also an important activity that required co-ordination, control and
strength, mainly in the lower limbs. This activity leads to a basic clinical test being
established to measure the level of mobility of people.
Nowadays, the demands of daily life, the interaction with the environment, the
increase in life expectancy of human beings, and an understanding of how the body
can produce motion, are the main factors which are fuelling the interest and
motivation of researchers to observe and interpret human motion.
Through time, a many research studies have developed devices and technologies
focused on the study of human motion. These studies begin with the parameterization
of different tasks in order to obtain a classification of the movements and the phases
that involves their performance.
Subsequently the studies of forces exerted by the body on the Earth were correlated
to the motion performance [29, 33, 38]. The need to study the human body’s
behaviour, actions and reactions, as well as to improve any abnormal condition, are
the most important reasons for the study of human locomotion research studies,
which has allowed clinicians and researchers apply this knowledge to the
development of devices and novel techniques that improve human health [29, 33,
34].
Some scientists frequently use motion tracking systems, motion capture,
electrophysiology (of muscle and brain activity), and ultrasonography in order to
analyses of human locomotion. These techniques and associated equipment are
helpful in creating models in order to simulate the human body system and hence
for exploring and estimating body performance using analytical methods [24, 29,
30, 42]. Currently, it is able to rehabilitate the human body and improve or recover
the locomotion, understand the differences existing between a normal and
pathological function and prevent and treat injuries. Some direct applications are in
orthopaedics, ergonomics, rehabilitation, and sports [30].

Biomechanical Analysis of Sit to Stand Transition
24
2.2. Activities of Daily Living
People perform many different activities during an ordinary day. In the field of
healthcare they are called the activities of daily living (ADL). The ADL are
fundamental tasks that, almost all of the time, the person performs automatically
(unconsciously) but at the same time with the intention to move. The motor system
is the ability to perform these intentional movements. When the motor system is in
good condition it is not a problem to perform the ADL successfully, but if the
motor system is impaired it will be more difficult to perform them [43, 44]. The
human body shows a very high degree of flexibility with sufficient stability. To
maintain the equilibrium all the movements must be coordinated in to patterns to
allow the motion [45].
The variety of ADL depends on the person’s profile, but some ADL are more
functionally demanding such as walking, running, jumping, climbing stairs and sit
to stand. Biomechanics has been focused on these tasks because their analysis
helped medical researchers to measure the ability of each patient in order to predict
disabilities.
It has been found that many of the functionally demanding tasks start whit the
person sitting and needing to stand up in order to begin another locomotion task;
this is the sit-to-stand transition and this is one of the most frequent activities during
the day [46].
In order to successfully perform the STS transition, the individual requires adequate
strength and coordination of whole body systems. If any of the systems are altered
or damaged the level of mobility decreases affecting the normal body motion.
People with pathologies often present with difficulties balancing the body and
therefore is more challenging to perform the STS transition successfully.

Biomechanical Analysis of Sit to Stand Transition
25
2.2.1. Phases of the Sit to Stand Transition
The STS movement has four principal phases: sitting, initiation, ascending, and
standing. Each phase is composed of events, which change the orientation and
position (pose) of the body components (segments and joints). The STS transition
begins when the person is sitting on a firm surface such as a chair or the edge of a
bed, it’s called first base of support.
Then movement begins when the upper-body moves forwards, following this an
impulse to initiate the ascension is required in order to leave the chair by the
extension of the lower limbs, until all the body mass is placed over the feet (second
base of support). It continues with the extension of the whole body, to finally
standing straight over the feet [1, 2, 4, 6, 11, 18, 47-50]. These are called the phases
of the STS transition. Figure 1 shows these phases as a percentage of the movement
time [6, 48, 49, 51].
Figure 1. Sit to stand cycle normalized at 100%. Showing: at 0% sitting position; at 10%
beginning of upper body movement (trunk, arms and pelvis); at 27% start to rise; at 27% starting the HAT swinging movement; at 35% body leaves the chair; maximum velocity is reached at 45% then at 73% body begins to stabilize the standing position. (modif.) [6, 47].
In the beginning it is necessary to have an impulse, of sufficient magnitude to
transfer the upper-body forward and upright, in order get-up and leave the chair. At

Biomechanical Analysis of Sit to Stand Transition
26
braking impulse is required to stop the movement and to obtain the balance to
complete the transition, thus completing the transfer, and finishing the movement
standing on the feet [11].
The STS transition is a complex motion performed several times through the day,
so its analysis has been of interest for different specialist such as researchers,
clinicians, therapists and coaches. Each specialist follows different procedures
according to the purpose of their analysis, so the STS transition has been used as a
human motion test.
2.3. Sit-to-Stand Transition Test
The evaluation of the sit-to-stand test is applied to find the functional level of
mobility performed by individuals and so estimate the ability of each person to rise
from the sitting position until they reach the standing position without any injury or
fall. It is also used to analyse injuries and musculoskeletal disease. This kind of
motion test helps to improve the human motion, and even helps the clinicians to
choose a better therapy for the individual.
During the STS transition, there are four factors, which helps to determine the
levels of stability and mobility: size of the support base, location of the CoM
projection within the support base and the participants body mass or body weight
[52].
The STS transition represents a challenge for the human body’s balance, due to the
transition requires the change between two bases of support. The base of support is
the area where the CoM of the WB is supported, in general are the different points
of contact that exist between the human body with the ground, the first is created by
the chair and the second created by the area around the feet [53]. The STS activity
requires the quick transference of the WB CoM from the chair’s support base to the
feet’s support base as is showed in the Figure 2.

Biomechanical Analysis of Sit to Stand Transition
27
a) b)
Figure 2. Support base. a) Chair base support (when the person is sitting its CoM is
placed over the area of the five branches of the chair) and b) Feet base support (when the person is standing its CoM is placed over the area of the feet).
The support base function is to help to balance and stabilize the body throughout
the STS transition. The most challenging moment of the whole transition is when
the body leaves the chair, because that is when the body changes its support base:
from the chair to the feet. This transition produces an abrupt movement mainly
caused by the forces and torques produced by segments and joints of the body in
order to ascend and stand [54].
The significance, of the base of support, is due to this determine the stability and
mobility of the human body. The stability depends of the support base size, as the
support base area is wider the stability increase, but as the base area is narrow the
stability decrease. Because is easily to maintain the balance of the CoM of the WB
within the expanded base of support.
The location of the CoM reflects the projection within the support base. This factor
involves the amount of effort that the subject will perform to get up of the chair. It
depends on different environment characteristics such as the height of the chair sit
and the sitting position of the subject [55]. Figure 3 shows there different locations
of the CoM over the area of the initial support base (chair).
The body mass or body weight also gives an idea of the performance of the subject.
Due to a bigger mass the muscles needs more momenta and therefore more power
to get up of the chair.

Biomechanical Analysis of Sit to Stand Transition
28
Figure 3. Three different sitting positions of a person.
The relevance of these factors is that every time that STS transition is performed
the coordination of the subject body is assessed [8, 10, 56-65]. Hence the objective
of the STS transition test motion, that is to quantify the functional mobility of the
human body without losing the balance or becoming unsteady. Regardless of the
methodology used, STS test is a reliable and trustworthy method to determine the
loss of balance [66-69].
Clinicians and by researchers has been interested in the analysis of the STS in order
to described the assessment of the stability, coordination, posture correction,
strength and motor control of the body during their performance [70].
2.3.1. Technology to Analyse the Sit-to-Stand Transition
The importance of the STS transition analysis underlies the identification of the
human posture during the motion, improving the performance, avoiding injuries
and suggesting a better treatment to recover the mobility.

Biomechanical Analysis of Sit to Stand Transition
29
Test motion analysis has always been conducted with the technology available at
the time of study; starting with the use of simple drawings, followed by photo an
video tracking systems, and lately by computers software and electronic systems
[39, 156].
The motion analysis is frequently completed by the use of Biomechanics platform,
better known as force-plates. The force-plates define the force applied by the
participant on the plate, called ground-reaction-force (GRF), and its point of
application or centre of pressure (CoP). During the data acquisition from the motion
Caption system (MoCap). The force-plates sensors capture the force that the body
exerts over them [5, 159, 160]. Then the device uses 4 force sensors fixed in the
plate corners in order to capture and measure the GRF and CoP of the foot, in the
Figure 4 presents how the force-plate operates.
Figure 4. Force-plate operation. a) Force-plate with a coordinate systems that helps to
measure the GRF and the CoP. b) Forces applied to the plate when a foot is on it. c) Four sensors measure the position and the magnitude of the force. d) Resultant force from the
foot forces, which is the GRF applied (modif.)[161].
When a foot touches a force-plate, it causes various reactions on the contact zone
(Figure 4.b). Those reactions are captured by the four sensors in the plate and are
then characterized by four ground reaction forces (R1, R2, R3, R4) (Figure 4.c).
The sum of these four reactions is the magnitude of the GRF (Figure 4.d). The GRF

Biomechanical Analysis of Sit to Stand Transition
30
is represented in the three components (X, Y, Z), given the magnitude and direction
of the vector force.
2.3.2. Sit-to-Stand Transition in Physical Therapy
The original purpose of the first STS test applications was to measure the functional
strength of the muscles in the lower limbs [58, 66, 71]. However has been also
applied the STS transition test to predict disabilities, incidence of care nursing and,
surprisingly, the death related to the loss of balance [68, 72, 73]. The STS test is
considered to be a helpful tool in the comparison of the people’s performance with
different demographic information such as age, gender, and pathologies [18, 20, 74-
78].
The clinical analysis depends of the clinician expertise and of his skills to evaluate
and report a good diagnosis of the person performance [79]. Each clinician has the
own method to determine how well people can rise from a chair. And although the
clinician is helped by an controlled questionnaire based on the activities-specific
balance confidence scale (ABC) and falls efficacy scale (FES), that provide a
measure of confidence in perform the transition [80, 81], this gives a vast
inaccuracy on the mobility description due to there are not a protocol established.
One of the most important findings of the clinical test suggests that STS transition
is an activity that is difficult to perform when the human body is not working
perfectly [69].
The biomechanical analysis, provide a complete study with better accuracy on the
mobility description. Although use the basis of the clinical analysis, it use auxiliary
biomechanics methods and better technology to analyse, process and describe the
mobility of a person (already described above). The biomechanics methods are
based on the dynamic measurements of the persons, and mathematical estimations
of the person transition.

Biomechanical Analysis of Sit to Stand Transition
31
The STS analysis is used to compare the performance between normal patterns and
pathologic patterns of the transition in patients with disabilities, diseases, or
different capabilities [11, 17, 20, 48, 66, 70, 79, 82, 83]. Furthermore, more recent
STS analyses were initiated to include the study of the forces exerted by the body to
the ground in order to estimate the joints’ behaviour [29, 33, 38, 40, 71, 84].
Subsequently, the study of the STS transition has driven the focus of clinicians and
researchers to apply this knowledge, to the development of devices and novel
techniques, that aim to benefit and improvement the human body health [29, 33, 34,
79, 85, 86]. Each human being is different in both, their anatomy and characteristics
and in their performance of the ADL. Those particular characteristics provide a
unique strategy, style and distinctive movement for their motion. Each individual
will never repeat exactly the same movement.
However, if the performances of the STS transition trials are regulated, by the
control of certain variables as shown in Figure 5, similar patterns along the trials
can been obtained. Similar movement patterns allow the comparison between
individuals, as long as the protocol of the STS test remains the same, between
participants and the trials recorder [49, 87-89].
a) b) c)
Figure 5. Different kinds of protocols used in the STS transition analysis. a) STS transition analysis for younger males participants using a chair without armrest and backrest
[90], b) STS transition analysis for older females participants using a chair with backrest, and c) STS analysis for older female rheumatoid arthritis patients using an ejector chair
[91].

Biomechanical Analysis of Sit to Stand Transition
32
Among the variables that had been controlled over different research groups the
following ones can be mentioned as shown in Figure 5 [7, 11, 17, 92-100]:
• Chair type such as high, with or without armrest, with or without backrest,
with or without caster.
• Preparation of the participant such as arms crossed, arms in front, arms on
the waist, arms helping the seat unload, arms at sides, the position of the
feet.
• Anthropometry of the participant such as gender, age, height, lifestyle,
health status.
• Activity performance speed.
There are different types of techniques to achieve the ascension, hence the wide
range of studies such as sit-to-stand, sit-to-stand-to-sit, five times sit-to-stand,
stand-to-sit-to-stand, sit-to-stand-up-and-go, and complete squat.
The sit-to-stand performance begins from a static sitting position to a standing static
position [6, 7]. The sit-to-stand-to-sit begins with the sitting static position,
ascending to standing, and finally to standing [95, 101]. The five time sit-to-stand
test repeats the similar movements that the sit-to-stand test but in this one the
participants must to perform the motion five consecutive times [67, 68, 102].
The stand-to-sit-to-stand begins with the static standing position, moving to sitting,
and finally to standing position again [103]. The sit-to-stand-up-and-go begins with
the static position sitting, ascending to standing, followed walking or running [10,
104]. Finally, the complete squat does not need a chair and begins with the standing
static position to moving downwards as much as possible to then returning to
standing position [105-107].
The STS test has been focused on selected aspects such as the body CoM
adjustment to maintain the balance, the body segments contribution during the
movement performance, the importance of the base support during the test, the
weight transference performed by the body, the GRF and the CoP trajectory, the
amount of power and energy required to rise, and the body elements behaviour at

Biomechanical Analysis of Sit to Stand Transition
33
different speeds in order to understand the performance [1, 6, 17, 22, 72, 92, 108-
110].
The biomechanical analysis has established that the people use a different technique
to stand up form sitting, but in somehow the healthy people has a similar pattern to
perform this activity. The sequence to active the muscles and create joint rotations
seems to be the same strategy used by healthy subjects. However as it gets older the
strategy used by people presents a change in their performance.
2.4. Effects of Pathological Conditions on the Human Motion
There is a wide range of pathologies that affect the systems of the body, and so
directly affect the mobility of the patients, some of which lead to difficulty in
performing an STS transition.
Patients with conditions such as strokes, Parkinson’s disease, and multiple sclerosis
show problems in the strength, flexibility, and control of their movements [51].
Older people also present problems of mobility due to the muscle weakness of their
body [46]. Furthermore pain in the joints and limbs, such as for patients with
rheumatoid arthritis and osteoarthritis, reduces the range of motion, which limits
their ability to carry out the STS activity [70, 111]. Other limitations are presented
in people with temporary conditions, such as pregnancy, recovering from injury, or
having strain and cramp, which restrict the limbs’ motions. These conditions
represent a considerable risk to the person, which can result in falls, which cause
injuries, bone fractures, and sometimes death [14, 15, 20, 112-114].
The pathological effects may produce a change in the control of movement, thus
modifying the movement variables such as the segment position, velocity, and
momentum. For example during the STS transition, when a person produces non-
controller movements it is harder for the body to balance itself during the activity,
thus losing the base of support during the ascending phase and hence when the fall

Biomechanical Analysis of Sit to Stand Transition
34
is initiated. Figure 6 shows the characterization of a pathologic STS transition [11,
80].
Figure 6. Characterization of Pathologic Sit-to-Stand. (modif.) [11].
Another complication developed is bad posture on the activities of the ADL, such
as standing, sitting and walking. Bad posture during any activity can cause an
imbalance on the musculoskeletal system, which produces an increase of stress on
the human body causing fatigue and pain. The big problem when bad posture is
presented is that, when the body tries to restore the balance on the systems,
deformities can be caused and body energy wasted which is the origin of
disabilities [115].
2.4.1. Effects of Ageing on the Human Motion.
Ageing is the biological process to which everybody is subject to through life.
Ageing is associated with a change in the characteristics of the human body over a
period of time. The characteristics change according to the physical activity and the
daily diet that each person has in their lifestyle.
Some of the changes could be induced by physical strength, ability to respond,
agility and elasticity of the tissues and wear of the components of the body. The

Biomechanical Analysis of Sit to Stand Transition
35
wear of the components makes them more fragile, particularly the skin, muscles
and bones. This decreases the flexibility, reaction time and the range of motion, as
well as making the joints feeling stiff, in many cases with pain, when performing
the ADL.
Ineffective movement at the joints affects the ADL, such as walking, running,
jumping and STS transition, which could lead to loss of balance therefore
increasing the risk of falls. The consequences of falls are sometimes terrible,
causing breakdowns, wounds, psychological problems and, at times, death. Because
the healing process is slow in older adults, and the immune system does not react
with the desired effectiveness, infections and more complications may result.
Loss of balance is also affected by impairment of senses such as hearing and vision.
The hearing sense is related to the vestibular system, which is one of the important
systems that help to maintain the balance. Inadequately function of the vestibular
system may cause problems of imbalance such as disorientation, dizziness and
vertigo.
The older population are sometimes reluctant to undertake physical activity,
because a few falling motion problems sometimes cause depression because the
older abandon their favourite activities, which produce in them a sense of loss.
Hence, the importance of analysing and studying human motion in older individuals
as it will identify the motion failure. If the patient is not treated, bodily functions
continue to deteriorate until the patient needs assistance, from either another person
or special devices (orthotic), to help them to stand-up and to prevent falls [51].
2.4.2. Younger vs Older Performance
Usually, the STS transition is easily performed by younger people but older people
find it a big challenge to complete it. This is due to ageing impairing the body’s
functions, therefore altering the potential and/or ability of the person to move

Biomechanical Analysis of Sit to Stand Transition
36
independently, which often affects the body’s control and may be reflected in the
loss of balance and may cause the person fall.
The inability to rise from a chair is presented mainly by chronic patients and older
subjects. For that reason the STS transition is a crucial component in the assessment
of older people’s mobility. Several studies have been focused on this subject with
the intention of minimising the overwhelming hazard of falling when older people
are performing their ADL. Both, clinician and researchers have hypothesised that
fatigue can affect the body functions therefore altering the potential and ability of
the person to move independently [3]. This potentially, could make them stay
prisoners in their chairs [116].
Studies have demonstrated that the performance of the STS transition between
younger and older subjects is similar in their kinematics, kinetics (such as
velocities, maximal joint and segmental angles and torques), effort required to
ascend, and also in the timing and duration of each phase [26, 69, 74]. However,
changes have been found in the momentum of the CoM during the ascending of the
STS transition across different speeds, with older subjects using a big angular
momentums in order to help them to stand up with less effort [93, 117]. One
assumption found and identified, that an exaggerated trunk flexion and linear
momentum on the vertical axis strategy was used by aging people to stand up from
a sitting position [100, 118]. Another assumption found that the older people placed
their feet further back which showed that was more difficult for the older than for
the younger when rising from a chair [41]. Likewise, other study found that the
significant differences in the performance of the older people may be due to the
WB CoM acceleration description [119].
Although many studies have been interested in the different strategies performed by
the older population and some differences have been described there are no studies
that declare where those differences come from or which strategies were used. Or
any studies that could explain which is the most important contribution of each
lower limb component at the time of performing the transition. Hence the

Biomechanical Analysis of Sit to Stand Transition
37
importance of this research is to use a different methodology with the intention of
filling the gap on the STS transition analysis.
The physical performance measures may offer advantages over self-reporting
measures in terms of validity, reproducibility, sensitivity to change, applicability to
cross-national and cross cultural studies and the ability to characterize high levels
of function.
The immediate application of STS transition analysis lies in understanding the
differences that exist between a normal and pathological performance. Depending
on the STS transition analysis and the interpretation of the results, the data can be
used in several applications such as to improve physical performance, to
recommend orthopaedic treatment, to assist in sports medicine, to allow the
development of care therapy, to reduce the possibility of injury or to recover from
an injury and to solve different balance disorders [120]. The outcome can also be
oriented to areas such as ergonomics and assistive technology which allows the
development of devices to be used to improve peoples’ health [30].
2.5. Summary
In order to understand the human motion and its abnormal conditions, it is most
important to study the behaviour of the human body (actions and reactions).
Biomechanics provides the knowledge and tools to analyse the human body
locomotion. Biomechanics studies have direct application in orthopaedics,
ergonomics, rehabilitation, and sports [30]. It is also very useful to understand
abnormalities and pathologies and to reduce the possibility of injury.
Biomechanics studies have demonstrated that humans perform their ADL using
different strategies according with their age groups. Older people present a big
challenge to complete their activities in comparison with younger people. The aging
impairments alter the body’s functions and control, reducing the potential for a
person to move independently. STS is one of the most complete ADL. It is

Biomechanical Analysis of Sit to Stand Transition
38
important to understand its biomechanics as it provides the level of mobility of a
subject.
The applications for human caption system are very wide. It is used in different
fields of the industry such as in animation (video games, virtual reality, web,
filmmaking movies, television shows) by using the equipment in subjects (such as
actors, performers and athletes) to obtain the motion from them and so the
computer generated imagery can simulates the movements with more accuracy. In
engineering (ergonomics, robotics) by using the equipment in related subjects in
order to obtain the motion information and so devices and new equipment can be
designed.
In scientific research (biomechanical analysis, sports) by using the equipment in
required subjects (participants, patients) to obtain the motion information with the
intention to study and analyse the causes and effects of the motion (patterns,
strategies). With the obtained data from the MoCap a biomechanical model is
constructed in order to simulate the human body’s performance as well as to
minimize the effort of the analysis.
Although, there have been several of studies focused on the STS transition
performance, there is not yet a complete study that can provide information about
the importance of the contribution of each lower limb. Hence the reasons that
makes relevant this study, because it is possible to find and understand differences,
between two different groups of participants, when the motion is performed at three
different self-selecting speeds.
This research used a descriptive model to develop a general analysis of the lower
limbs’, which allows the development of a novel methodology to study the STS
transition performance of the participants. This method is a useful tool to estimate
the weight transfer and the estimation of the segments and joint variables. With this
method were able to identify the normal pattern of movement that the different
groups perform during STS transition to determine their functional efficiency and
quantifying the differences in biomechanical parameters of body motion.

Biomechanical Analysis of Sit to Stand Transition
39
Chapter 3. Methodology
This chapter explains the methods, equipment and tools used to analyse the STS
transition are discussed. Human motion data is obtained directly from each
participant, using Video Motion Capture (MoCap) method. MoCap tries to follow
and track body movements, detecting reflective markers, placed on specific
landmarks over the participant body. A data sheet is obtained with the position and
direction of these markers over time. Whereas, the ground reaction force (GRF) and
the centre of pressure (CoP) are obtained. STS transition motion was performed ten
times at same conditions, in order to produce an accurate database from test
performance.
3.1. Experimental Set-Up
Twenty healthy volunteers, ten younger and ten older were required to participate
in this study. The recruitment method was set mainly by placed advertisement
around of the Manchester Universtiy’s Campus, and also asking to friends and
colleagues to participate. The criteria to select the participants were healthy
volunteers with no previous history of neuromuscular or musculoskeletal
impairment; the participants were required in two groups younger (n=10, average
age 28+/-2 years old) and older (n=10, average age 56+/-8 years old).
The individually participant data is showed in the Table 1 [18, 70, 76, 93, 100,
121]. The protocol was approved by the Ethics committee of The University of
Manchester (approval No 11443 shown in Appendix 1) and written informed
consent was obtained from all the participants prior to the study starting.

Biomechanical Analysis of Sit to Stand Transition
40
Table 1. Demographic individual data from all participants involved in this study.
# Participant Age Gender Height Mass # Participant Age Gender Height Mass
Younger (years) (m) (kg) Older (years) (m) (kg)
1 26 M 1.64 62 11 50 M 1.81 75
2 29 M 1.8 96 12 59 F 1.5 64
3 38 M 1.81 90 13 60 M 1.66 79
4 32 F 1.64 65 14 56 F 1.53 68
5 29 M 1.74 65 15 78 M 1.63 76
6 26 F 1.54 53 16 53 M 1.88 101
7 29 M 1.79 79 17 54 F 1.56 65
8 32 F 1.52 61 18 53 M 1.59 68
9 28 F 1.6 72 19 50 F 1.56 68
10 28 M 1.8 97 20 55 F 1.56 62
The MoCap system used reflective spherical markers in order to obtain the position,
orientation, and direct movement of each participant. A total of 76 reflective
spherical markers were placed on each subject; 32 markers were placed over
standardized anatomical landmarks and 11 technical markers (each one consisting
of a set of 4 reflective markers on a rigid base) were positioned on different body
segments. In addition 11 virtual markers were defined. In the next page, Figure 7
shows the position of the markers. In the Apendix 2 is showed the complete list of
the markers.
The placement of the markers was repeated, assessment and tested several times
before to place them on the volunteers. I was the only person in charge to place
these markers in order to increased accuracy in the data obtained. The anatomical
and virtual marker positions were used to estimate participant anthropometric data.
The technical markers were used to track the movement of the body segments
during the STS transition trials.

Biomechanical Analysis of Sit to Stand Transition
41
Anatomical Markers
1,2, Xiphoid Process and Jugular Notch 3,4 Spinous Process C7 and T8 5,6 Right Humeral Condyles 7,8 Right Styloid Process
9,10 Left Humeral Condyles 11,12 Left Styloid Process 13,14 Right Femoral Epicondyles 15,16 Right Fibula-head and Tibial-
tuberosity 17,18 Left Femoral Epicondyles 19,20 Left Fibula-head and Tibial-
tuberosity 21,22 Right Malleoli
23 Left Calcaneus 24,25 Left Malleoli
26 Right Calcaneus 27,28,29 Right Metatarsals 30,31,32 Left Metatarsals
Technical Markers 33 Head 34 Trunk 35 Back Pelvis
a)
36 Right Upper-Arm 37 Right Lower-Arm 38 Left Upper-Arm 39 Left Lower-Arm 40 Right Thigh 41 Right Shank 42 Left Thigh 43 Left Shank
Virtual Markers 44 Vertex 45 Right Temporomandibular Joint 46 Left Temporomandibular Joint 47 Right Glenohumeral Joint 48 Left Glenohumeral Joint 49 Right Elbow Joint 50 Left Elbow Joint 51 Right Superior Iliac Spine 52 Right Posterior Iliac Spine 53 Left Superior Iliac Spine 54 Left Posterior Iliac Spine 55 Right Hip Joint
b) 56 Left Hip Joint Figure 7. Marker distribution over the body. a) Markers position on the landmarks
(modif.)[122]. b) Photograph of reflective markers placed and a participant for the STS transition.
The virtual markers also gave the position and orientation of the difficult bony
landmarks. As these landmarks are challenging to locate with a simple marker for

Biomechanical Analysis of Sit to Stand Transition
42
that reason is used a wand with two markers on it at a known distance to obtain
more accurate measurements.
3.2. Data Acquisition
The participants undertook the trials in a gait analysis laboratory. A VICON Motion
Analysis System (VICON Motion Systems Ltd, Oxford, UK) consisting of 6 Model
MX-T Series Cameras running VICON Nexus 7 software was used to detect and
measure the three-dimensional location of the markers placed on the subjects
during the trials. The VICON Nexus T-wand calibration system was used to
calibrate the motion capture volume for data capture and post-processing. Data
were captured from the cameras at 200 frames per second (fps). Two AMTI
BP400600 force plates (Advanced Mechanical Technology, Inc., Watertown, MA,
USA) were used to measure the GRF under each foot and to determine the CoP
location synchronously with the kinematic data at a sampling rate of 1000Hz. The
kinematic data were stored and analysed off-line on a personal computer (DELL
Inc., Round Rock, TX, USA). Figure 8 shows the VICON Nexus system used.
a) b)
Figure 8. Motion capture system from VICON Company. a) Gait-Lab of The University of Manchester, b) Infrared cameras from VICON system used in the Gait–Lab.
Having positioned the reflective spherical markers on the bony landmarks of the
subject, a calibration procedure was followed in order to identify and locate
anatomical landmarks, and functional joint centres [122, 123].

Biomechanical Analysis of Sit to Stand Transition
43
In order to identify the anatomical landmarks, participants were asked to undertake
three static trials in pre-determined positions. Subjects were first required to stand
upright on a marker placed on the floor in the middle of the gait laboratory, looking
straight ahead with their arms abducted so that they were parallel to the ground.
Participants held this position while data from the cameras were captured for three
seconds. The participants then turned 90° about the vertical axis and assumed the
same position as previously: looking straight ahead with their arms abducted. This
position was held while data were again recorded from the cameras for three
seconds. The third static test was undertaken with the subject turning through a
further 90° before assuming the same position with the arms abducted after which
camera data were recorded.
The virtual landmarks were then identified using the VICON wand. Participants
were asked to stand upright in the fundamental position on the marker placed in the
middle of the gait laboratory floor looking straight ahead with arms straight down
by the side. Subjects were requested to hold this position and remain static while
the investigator touched each virtual landmark individually with the wand. The
wand was held against each virtual landmark in turn for three seconds while data
from the cameras were captured. To establish the virtual landmark, which is the
proximal point, was calculated from the stick wand. The virtual landmark was
subtracted from distal distance, of the two markers, of the wand stick in the 3D
anatomical reference frame on the global axes [124, 125].
In order to identify the four functional joint centre of each of the hip and shoulder
joints, subjects were required to again stand upright on the marker in the middle of
the gait laboratory and undertake a series of dynamic trials in which data were
recorded from the cameras. Taking each arm in turn, keeping the trunk steady and
without bending the arm at the elbow, subjects were asked to move their arm first
straight out in front, then straight back behind them, the to the side, and then in a
circular motion from front to back. Then, taking each leg in turn, keeping the trunk
steady and without bending the leg at the knee, they were then required to move

Biomechanical Analysis of Sit to Stand Transition
44
their leg straight out in front, then straight behind them, the to the side, and then in
a circular motion from front to back.
Having performed the calibration procedure, the STS trials were then undertaken.
Participants sat on a backless chair with one foot on each of the two force plates.
The height of the chair was adjusted so that the thighs of the participants were
parallel to the floor and perpendicular to the shanks, ensuring each subject started
the STS task from the same body position. Figure 9 shows the stating and final
position of the STS movement.
Keeping their hands on their waist, participants were then asked to perform the STS
task while data were recorded from the cameras and the force plates. Subjects
performed ten STS trials at a self-selected speed: this was the normal speed.
Subsequently, participants performed ten trials at a self-selected slow and fast
speed, with a two minute rest between conditions.
a) b)
Figure 9. Illustration of the two static positions of the STS transition. a) In-vivo capturing of the human body. b) Link-segment model from SMAS.
VICON Nexus software was used to reconstruct the three-dimensional (3D)
position of the markers, in order to identify and label each marker according to its
anatomical location (Figure 10a). During reconstruction gaps in individual marker
trajectories were detected and filled in order to obtain a smooth trajectory, which

Biomechanical Analysis of Sit to Stand Transition
45
was then exported to a text file (*.txt). Once reconstructed, all markers were
labelled to allow construction of the link-segment model (Figure 10b).
a) b)
Figure 10. Data pre-processing. a) Virtual reconstruction on VICON Nexus System. b) Markers identified and labelled according their anatomical position.
3.3. Data Processing
3.3.1. Biomechanical Model Creation and Kinematics Data Analysis
The first step involved utilising the Salford Motion Analysis System (SMAS) [125-
128] to create a 3D link-segment biomechanical model and obtain kinematic
information. SMAS is a MATLAB (MathWorks Inc., Cambridge, UK) based
software package for undertaking kinematic analysis of biomechanical multi-
segment systems using marker-based photogrammetric devices. It utilises a least
square method to estimate the position and orientation of the body segments based
on the technical marker data and the calibrated anatomical system technique
(CAST) protocol to enable mapping between technical and anatomical frames
[129].
Data from the static and dynamic calibration procedures and the STS trials for the
slow, normal and fast speed output from VICON Nexus software were input into

Biomechanical Analysis of Sit to Stand Transition
46
SMAS where marker coordinates were processed using a Butterworth 4th order zero
phase lag, low-pass filter with a cut-off frequency of 6Hz. In SMAS, the anatomical
and virtual landmark and functional joint centre identification data obtained from
the calibration procedure were used to create a 3D link-segment model for each
participant. This model consisted of thirteen segments: head, trunk, pelvis, right and
left upper-arms, lower-arms, thighs, shanks and feet as previously showed in Figure
9.
Using SMAS, the positions of the Centre of Mass (CoM) of each segment of the
model were calculated, using the Equation 1:
…….…………. Equation 1
Where: is the centre of mass position vector of the “ith” segment; is the
proximal point radius from the origin of the global coordinate system; mi is the
relative proportion of the “ith” segment mass with respect to the total body mass;
and is the distal point radius vector from the origin of the global coordinate
system.
The position vector for the WB CoM was calculated from the Equation 2:
…………………. Equation 2
Where: is the whole-body centre of mass position vector; is the
centre of mass position vector of the “ith” segment; mi s the relative proportion of
the “ith” segment mass with respect to the total body mass; and M is the total body
mass of the participant.
The technical marker data from the STS trials were then associated with the 3D
model enabling kinematic information to be calculated. Linear and angular velocity,
linear and angular acceleration and angular momentum were calculated for the
CoM of the WB and the CoM of each segment throughout each STS trial.

Biomechanical Analysis of Sit to Stand Transition
47
Functional joint centre locations during the STS trials were estimated using
standard kinematic expressions [24].
3.3.2. Analysis of Kinematic Data, Principal Component Analysis and
Kinetic analysis
Having obtained the kinematics a suite of in house MATLAB based routines was
used to perform time and magnitude normalization, descriptive statistical analysis
of the kinematic data, a PCA of the momentum variables [130-132], and a kinetic
analysis of the joint torque, power and work during the STS trials.
For the kinetic analysis, biomechanical model kinematic data obtained from the
SMAS software were input into the MatLab routines along with the data obtained
from the force plates during the STS transition trials, (the GRF and CoP location).
During the STS trials, the hands were placed on the waist in order to minimize the
effect of upper-limb segment movement during the STS transition. Since the lower
limbs are the main segments of the body that are active during this motion, the
head, arms and trunk were combined and considered as a single segment (HAT)
resulting in a 3D biomechanical model consisting of 8 segments as shown in Figure
11.
A) HAT segment B) waist joint C) pelvis segment D) hip joints E) thigh segments F) knee joints G) shank segments H) ankle joints I) feet segments
Figure 11. Illustration of static sitting position of the eight link-segment model.

Biomechanical Analysis of Sit to Stand Transition
48
Subsequently the linear momentum of the Whole Body CoM and each of the eight
body segments was calculated using Equation 3.
…………..…….……. Equation 3
Where: is the linear momentum vector of the “ith” segment, mi is the relative
proportion of the “ith” segment mass with respect to the total body mass, and is
the linear velocity vector of the “ith” segment CoM.
3.3.3. Time and Magnitude Normalization
In order to facilitate analysis of the variables and comparison between participants,
the kinematic data obtained from the STS trials were normalized with respect to
time. The time normalization procedure consisted of determining the point in the
STS transition corresponding to the beginning of movement, when the magnitude
of the resultant WB CoM velocity vector was still zero. This was taken as the
starting point in the STS transition (0% of the movement). The end of the STS
transition (100% of the movement) was taken to be the point where the magnitude
of the resultant WB CoM velocity vector was again zero, corresponding to the
participant being in the standing position.
In addition, magnitude normalization of the linear and angular momentum variables
was performed in order to obtain dimensionless momenta and allow comparison of
the data between participants. Linear momentum was normalized with respect to
the product of the body mass of the participant and the mean vertical velocity of the
WB CoM for each trial. Angular momentum was normalized with respect to the
product of the body mass of the participant, the mean vertical velocity of the WB
CoM and the final displacement vector of the WB CoM for each trial.
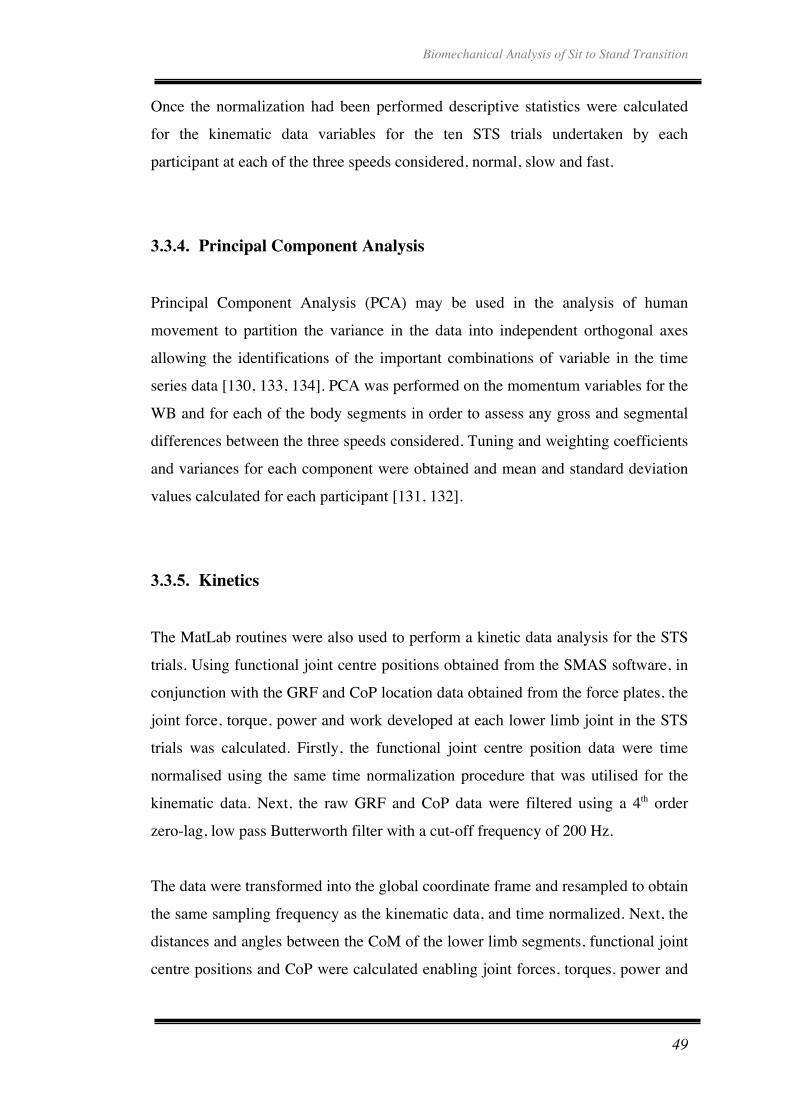
Biomechanical Analysis of Sit to Stand Transition
49
Once the normalization had been performed descriptive statistics were calculated
for the kinematic data variables for the ten STS trials undertaken by each
participant at each of the three speeds considered, normal, slow and fast.
3.3.4. Principal Component Analysis Principal Component Analysis (PCA) may be used in the analysis of human
movement to partition the variance in the data into independent orthogonal axes
allowing the identifications of the important combinations of variable in the time
series data [130, 133, 134]. PCA was performed on the momentum variables for the
WB and for each of the body segments in order to assess any gross and segmental
differences between the three speeds considered. Tuning and weighting coefficients
and variances for each component were obtained and mean and standard deviation
values calculated for each participant [131, 132].
3.3.5. Kinetics
The MatLab routines were also used to perform a kinetic data analysis for the STS
trials. Using functional joint centre positions obtained from the SMAS software, in
conjunction with the GRF and CoP location data obtained from the force plates, the
joint force, torque, power and work developed at each lower limb joint in the STS
trials was calculated. Firstly, the functional joint centre position data were time
normalised using the same time normalization procedure that was utilised for the
kinematic data. Next, the raw GRF and CoP data were filtered using a 4th order
zero-lag, low pass Butterworth filter with a cut-off frequency of 200 Hz.
The data were transformed into the global coordinate frame and resampled to obtain
the same sampling frequency as the kinematic data, and time normalized. Next, the
distances and angles between the CoM of the lower limb segments, functional joint
centre positions and CoP were calculated enabling joint forces, torques, power and

Biomechanical Analysis of Sit to Stand Transition
50
work to be estimated using the inverse dynamics method and using the body-free
diagram showed in the Figure 11 [24, 30, 135].
The torque, power and work data from the seat-unload point (35% of the STS
transition cycle) were calculated prior to normalization. Additionally that the data
was estimated from the seat-unload point due to the data obtained from the forces-
plates before this point is not real because the participant is sitting on the chair and
the force-plates were not able to measure that force.
The mathematical expressions to calculate kinetic variables force, torque, power
and work are as follows in the Equation 4, Equation 5, Equation 6, and Equation 7.
Force
………………………. Equation 4
Where: is the resultant force vector of the “jth” joint; mi is the relative proportion
of the “ith” segment mass; is the linear acceleration vector of the “ith” segment
CoM; n is the number of forces that are acting on the “ith” segment; Fn are the force
vectors acting on the “ith” segment.
Torque
……………. Equation 5
Where: τj is the resultant torque vector about the “jth” joint; Ii is the moment of
inertia of the “ith” segment; αi is the angular acceleration vector of the “ith”
segment; s is the number of torques acting on the “ith” segment; Ms are the torque
vectors acting on the “ith” segment; n is the number of force vectors that are acting
on the “ith” segment; Fn are the force vectors acting on the “ith” segment; dn is the
radial distance to the point where the force is applied.

Biomechanical Analysis of Sit to Stand Transition
51
Power
…..................... Equation 6
Where: Pj is the power of the “jth” joint; τj is the torque about the “jth” joint; ωd is
the angular velocity of the adjacent distal segment and ωp is the angular velocity of
the adjacent proximal segment.
Work
……………….….. Equation 7
Where: Wj is the work done for the “jth” joint; t2 is time point of the movement end;
t1 is time point of the movement start; Pj is the power at the “jth” joint and dt is the
derivate with respect to time.
3.4. Summary
This methodology has been helped to analyse the human motion in Manchester
University Gait-lab’s of the Pariser Building. Figure 12 shows the methodology
used to estimate and analyse the movement on both groups of participants.
This methodology was used to analyse the STS transition was by motion caption,
which was obtained directly from the participants. An individual open-chain model
is required in order to obtain the anthropometric data from each participant.
Kinematics analysis was estimated to WB and segments CoM, principal component
analysis was applied to the momenta variables.

Biomechanical Analysis of Sit to Stand Transition
52
Figure 12. Flow Chart showing the Methodology used to estimate the STS transition
motion.
Also a kinetics analysis was estimated for the body joints in order to compare firstly
between speeds for each group, and then between performances of the two groups.

Biomechanical Analysis of Sit to Stand Transition
53
Chapter 4. Biomechanical Analysis Comparison of Sit-to-Stand
Transition Performance between Younger and Older Participants
4.1. Introduction
In this chapter the biomechanical performance of the two groups of healthy,
younger and older participants (n=10, average age 28±2 and 56±8 years old,
respectively) is analysed during STS transition trials undertaken at three self-
selected speeds (slow, normal and fast). Then in-vivo data obtained from a motion
capture system and force plates during the trials is applied to a link segment
biomechanical model facilitating both a kinematic and kinetic analysis of the STS
activity enabling the contribution of the major body segments and joints to the STS
transition to be elucidated. In addition, PCA is applied to the whole body and
segmental momentum components in order to identify the more significant the
more significant momentum variables and to determine any gross and segmental
level differences in these variables between the speeds.
In particular the approach taken consisted of:
a. Estimating the momentum components of the CoM of the WB in order to
quantify the amount of movement in the human body.
b. Applying PCA to the normalized WB CoM momentum components in order
to determine the contribution of momentum variables that maximise the
variance explained in each condition.
c. Where PCA showed differences in the momentum components of the WB
CoM between the speeds PCA was applied at the segmental level to help
identify the segment(s) in which the difference originated.
Although the differences in the performance in the STS activity between younger
and older people have been extensively studied, concluding that younger people

Biomechanical Analysis of Sit to Stand Transition
54
perform STS easily with a minimum risk of losing balance and falling, whereas for
older people the risk of losing balance is a greater and consequently the risk of fall
during the STS transition is higher, a firm methodology has not been developed for
analysing, differentiating and identifying where the differences in the strategies
associated with age and speed originate. For that reason this research is focused in
identify and analyse the similarities and differences in the strategies employed by
the two groups of participants when undertaking the activity at different speeds.
4.2. Whole-Body Centre of Mass Kinematics
In this section linear and angular momentum results are reported for the WB CoM
since these variables explain the translational and rotational motion of the WB and
the segments during the STS transition. The linear and angular momentum data
combined with the calculation of the position of the centre of mass enabled the
phases of the STS transition to be determined. The phases: static sitting, initiation,
ascent, stabilization and static standing are shown in Figure 13 and are in agreement
with those in the literature [1, 84, 116, 136].
a) b)
Figure 13. Translational motion of the whole-body centre of mass along sit-to-stand transition. a) Three dimensional plot of the whole-body centre of mass position in a sagittal
plane during the STS transition. b) Representative STS transition cycle defining relevant time points.

Biomechanical Analysis of Sit to Stand Transition
55
In addition, highlighted in the plots presented in this section are the two important
points in the STS transition, namely:
1) Seat-unload, representing the point at which the initiation phase ends and
the ascending phase begins, which occurs approximately 35% of the way through
STS transition; and
2) Standing, representing the point at which the ascending phase finishes
and the stabilization phase begins, which occurs at approximately 60% of the way
through the STS transition.
Results are presented for the STS trials undertaken by the participants at slow,
normal and fast speeds. The velocity of the participants’ performance is showed in
the Figure 14. Which also shows the average for each velocity: 0.05 ±0.01 for the
slow speed, 0.08 ±0.01 for the normal speed, and 0.13 ±0.01 and 0.12±0.01, for
younger and older participants, respectively at fast speed.
Figure 14. Average velocities of the whole-body centre of mass from whole participants.

Biomechanical Analysis of Sit to Stand Transition
56
For each velocity, the mean and standard deviation (SD) for the variables of interest
were calculated first for each participant over ten trials and then the overall mean
and SD were calculated for all the participants. The results are presented for the AP
(global X), vertical (global Y) and ML (global Z) axes as shown in Figure 9.
The kinematics results seem to be similar performance, for both groups of
participants, in CoM of the both WB and segments. Following comparisons of the
results are based on the difference in the performance of the older participants with
respect to the younger participants.
4.2.1. Kinematic Analysis Comparison of the Whole-Body Centre of
Mass for self-selected Slow, Normal and Fast Speeds
The Figure 15a shows the slow position of the WB CoM, which presented
differences attributable the increase stature younger participants compared with the
older participants.
The WB CoM normalised linear momentum in older participants presented
insignificant differences on all the axes at three speeds in compassion with the
younger participants as shown in Figure 15b.
The WB CoM normalized angular momentum showed no variation about the AP
and vertical axes at the three speeds, the normalised angular momentum about the
ML axis showed a clear difference at fast speed. At fast speed, the older
participants showed the greater peak normalized angular momentum about the ML
axis before seat-unload and on the ascending phase (Figure 15c).

Biomechanical Analysis of Sit to Stand Transition
57
Figure 15. Comparison of trajectories of the whole-body centre of mass of younger and
older healthy participants at three different speeds. a) WB CoM position, b) WB CoM linear momentum, c) WB CoM angular momentum.
4.2.2. Kinematic Analysis Comparison of the Centre of Mass’ Segments
for self-selected at Slow, Normal and Fast Speeds.
The results from the kinematic analysis on the segments indicated that the
normalised linear momentum of the HAT, pelvis, thigh, shank and foot segments
were similar at three speeds for both younger and older participants. HAT exhibited
the dominant normalised linear and angular momentum.
The normalised angular momentum of the HAT segment at slow and fast speeds,
showed no difference between groups. However, at fast speed the older participants
exhibited greater normalised angular momentum than the younger participants
about the ML axis as shown in Figure 16.

Biomechanical Analysis of Sit to Stand Transition
58
Figure 16. Comparison of the HAT centre of mass angular momentum at fast speed of
younger and older healthy participants.
The segments that showed the most substantial normalised angular momentum
about the three axes were the thighs and shanks segments.
The older participants’ thigh and shank segments showed greater peak normalised
angular momentum about the three axes than the younger participants (at all the
speeds). The normalised angular momentum about the AP and vertical axes for
contralateral joint tended to cancel each other out. Figure 17 shows the normalised
angular momentum of the thigh and shank segments about the ML axis. The
increased normalised angular momentum illustrates that the older participants relied
more on segment rotation to accomplish the STS transition.

Biomechanical Analysis of Sit to Stand Transition
59
Figure 17. Comparison of the angular momentum of the thigh and shank segments of
younger and older healthy participants at three different speeds. a) Thigh segments analysis, b) Shank segment analysis.
4.2.3. Kinetic Analysis Comparison between the Joint’s Centres of
Younger and Older Participants
The kinetic analysis of the lower limbs showed that the torque, power and work at
the joints had a similar trend in both participants’ groups. However, despite the
general similarities, the kinetics analysis showed some differences in the magnitude
of the variables.

Biomechanical Analysis of Sit to Stand Transition
60
Waist Joint
The normalised torque at the waist was minimal in comparison with the other joints
but similar in both participant groups at the three speeds. Figure 18 shows the
comparison between younger and older participants kinetic analysis of the waist
joint. The waist torque about AP and vertical axes are insignificant in comparison
with the torque performed about ML axis at all the speeds. Even though its small
contribution, the older participants exhibited an increment in the torque about the
ML axis during the stabilization phase mainly at slow speed (Figure 18a).
The waist joint power presented a higher amount for the older participants mainly
in the ascending phase of the STS transition cycle (Figure 18b), which indicates
that older participants could rely more on the joint waist power in order to extend
the HAT (upper-body).
Figure 18. Comparison of the kinetic analysis result of the waist joint centre of younger
and older healthy participants at three different speeds. a) Waist joint centre torque, b) Waist joint centre power.

Biomechanical Analysis of Sit to Stand Transition
61
The result of the analysis of the work performed by the waist joint did not present
any change either in trend or amount at the three speeds in both participants’
groups, obtaining the minimum work done during the STS transition cycle in
comparison to the others lower limb joints.
Hip Joints
The normalised torques about the AP and vertical axes tended to cancel each other.
The normalised torque at the hip joints about the ML axis is the one that contributes
to the STS transition. This torque was similar at the beginning of the STS transition
in both participants’ groups at the three speeds. However, once the transition
reached the stabilization phase the older participants exhibited an increment in all
the cases as shown in Figure 19a.
The hip joints presented a decrement of power at slow and normal speeds in the
older participants. At fast speed presented a similar amount of peak power for the
younger and older participants. However, the power exhibited a decrement at 35%
of the transition cycle in the older participants at the three speeds (Figure 19b). In
general the muscles action between the younger and older participants was doing
similar things, functioning concentrically in order to extend the upper-body.
In regards to the hip joints work, the older participants presented a substantial
decrement on the amount at the three speeds, in comparison to the younger
participants as shown in Figure 19c.

Biomechanical Analysis of Sit to Stand Transition
62
Figure 19. Comparison of the kinetic analysis result of the hip joints centre of younger
and older healthy participants at three different speeds. a) Hip joints centre torque, b) Hip joints centre power, c) Hip joints centre work done.

Biomechanical Analysis of Sit to Stand Transition
63
Knee Joints
Same as the in the hip joints, the torques about AP and vertical axes are cancelled
each out with their counterpart. So that, the torque on the knee joints about the ML
axis, is the one that contributes to the STS transition. Torque on the knees about
ML axis was similar at the beginning of the STS transition cycle in both
participants’ groups but at the end of the stabilization phase it exhibited an
increment at all speeds as shown in Figure 20a. ???
The Figure 20b shows that the power produced by the knee joints presented a
similar trend in both participants’ groups at all speeds. The differences found were
that in the left joint at normal and fast speeds the older participants had a decrement
in the amount of power, whereas at slow speed presented the similar amount that
the younger participants. In the right joint at normal and fast speeds the power
remained similar for both groups and at slow speed presented an increment in the
amount of power. Same as in the hip joints, the muscles responsible of the knee
joints movement were doing similar things, functioning concentrically to extend the
pelvis and trunk with the purpose to start the ascending phase until reach the
standing position.
In regards to the knee joints work, the older participants in the left side presented a
substantial decrement on the amount of work at the three speeds, in comparison to
the younger participants. In the right side, for the older subjects the work done at
the knee joint remained similar that the work done by the younger participants in
normal and fast speeds and a little higher at sow speed as shown in the Figure 20c.
The variations between the left and the right sides for the work done and power
implies that the older participants had a tendency to lean more on the left side.

Biomechanical Analysis of Sit to Stand Transition
64
Figure 20. Comparison of the kinetic analysis result of the knee joints centre of younger
and older healthy participants at three different speeds. a) Knee joints centre torque, b) Knee joints centre power, c) Knee joints centre work done.

Biomechanical Analysis of Sit to Stand Transition
65
Ankle Joints
The torque in ankle joints, unlike in the other joints, was active at the end of the
STS transitions (Stabilization phase). Torque in ankle joints also have the same
behaviour than hip and knees of being cancelled about AP and vertical axes are
cancelled each out with their counterpart. So that, the torque on the ankle joints
about the ML axis, is the main contributor to the STS transition.
Figure 21a shows that the ankle joints torque about ML axis presented a similar
trend in both participants’ groups, however the older participants exhibited a
decrement in comparison with the younger group mainly during the ascension
phase at the three speeds.
The power in ankle joints got its peak point at the end of the ascending phase. It
was higher for the older participants at all speeds, being the highest variation at
normal speed as shown in Figure 21b.
Same as in the waist joint, the results of the kinetic analysis exhibited that the work
done by the ankle joints had not significant variations between both groups of
participants at any of the three speeds.

Biomechanical Analysis of Sit to Stand Transition
66
Figure 21. Comparison of the kinetic analysis result of the ankle joints centre of younger
and older healthy participants at three different speeds. a) Ankle joints centre torque, b) Ankle joints centre power, c) Ankle joints centre work done.

Biomechanical Analysis of Sit to Stand Transition
67
4.2.4. Comparison of the Principal Component Analysis applied to
Momenta Variables of the WB CoM for self-selected Slow, Normal and
Fast.
Based on the PCA results of the WB CoM, the strategies to perform the STS
transition were found different for both groups of age and also different at the three
speeds.
The execution of the STS transition of the older participants had similar strategy at
slow and normal speeds which was also similar to the strategy in younger
participants at slow speed, as is showing in the Figure 22a. This strategy presented
as significant variable the angular momentum (forward rotation). On the other
hand, the older participants, at fast speed, exhibited similar strategies to the younger
participants at both normal and fast speed. In this case the strategy relied on the
significance of the linear momentum (forward movement) to perform the STS
transition (Figure 22).

Biomechanical Analysis of Sit to Stand Transition
68
Figure 22. Comparison of the principal component analysis of the whole-body centre of
mass of younger and older healthy participants at three different speeds. a) First principal component (PC1) and Z-scores momentum analysis, b) Second principal component (PC2)
and Z-scores momentum analysis, c) Third principal component (PC3) and Z-score momentum analysis.
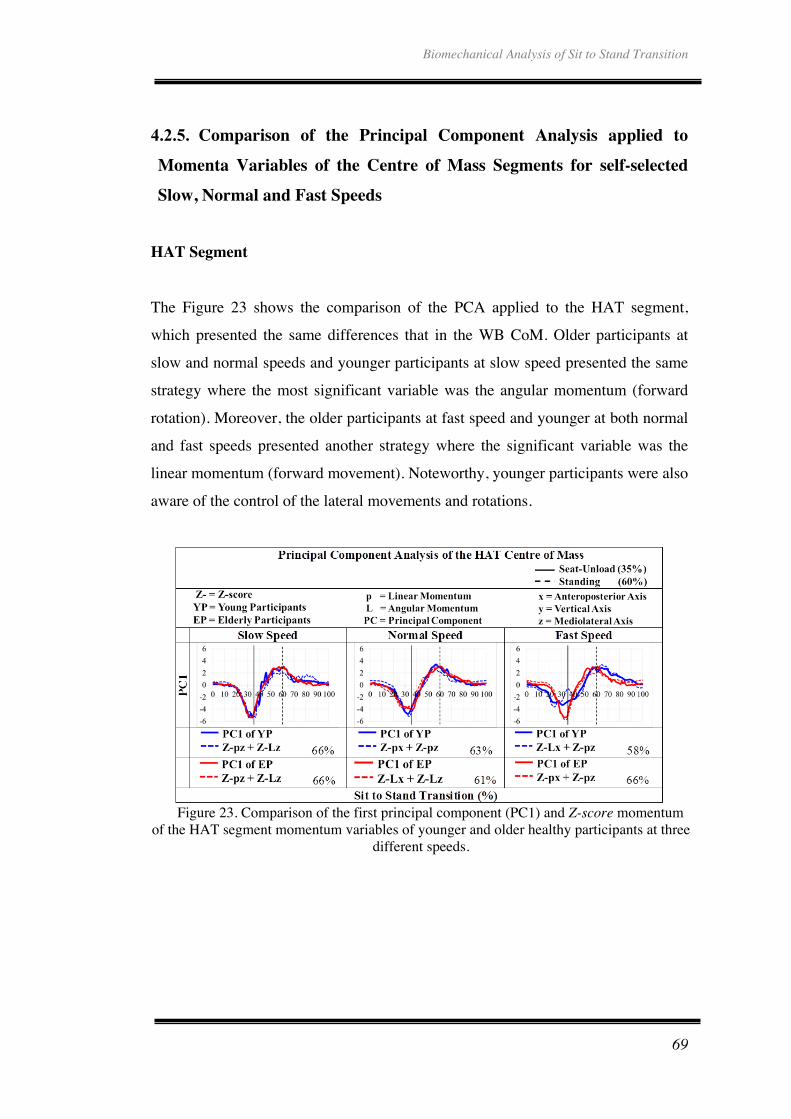
Biomechanical Analysis of Sit to Stand Transition
69
4.2.5. Comparison of the Principal Component Analysis applied to
Momenta Variables of the Centre of Mass Segments for self-selected
Slow, Normal and Fast Speeds
HAT Segment
The Figure 23 shows the comparison of the PCA applied to the HAT segment,
which presented the same differences that in the WB CoM. Older participants at
slow and normal speeds and younger participants at slow speed presented the same
strategy where the most significant variable was the angular momentum (forward
rotation). Moreover, the older participants at fast speed and younger at both normal
and fast speeds presented another strategy where the significant variable was the
linear momentum (forward movement). Noteworthy, younger participants were also
aware of the control of the lateral movements and rotations.
Figure 23. Comparison of the first principal component (PC1) and Z-score momentum
of the HAT segment momentum variables of younger and older healthy participants at three different speeds.
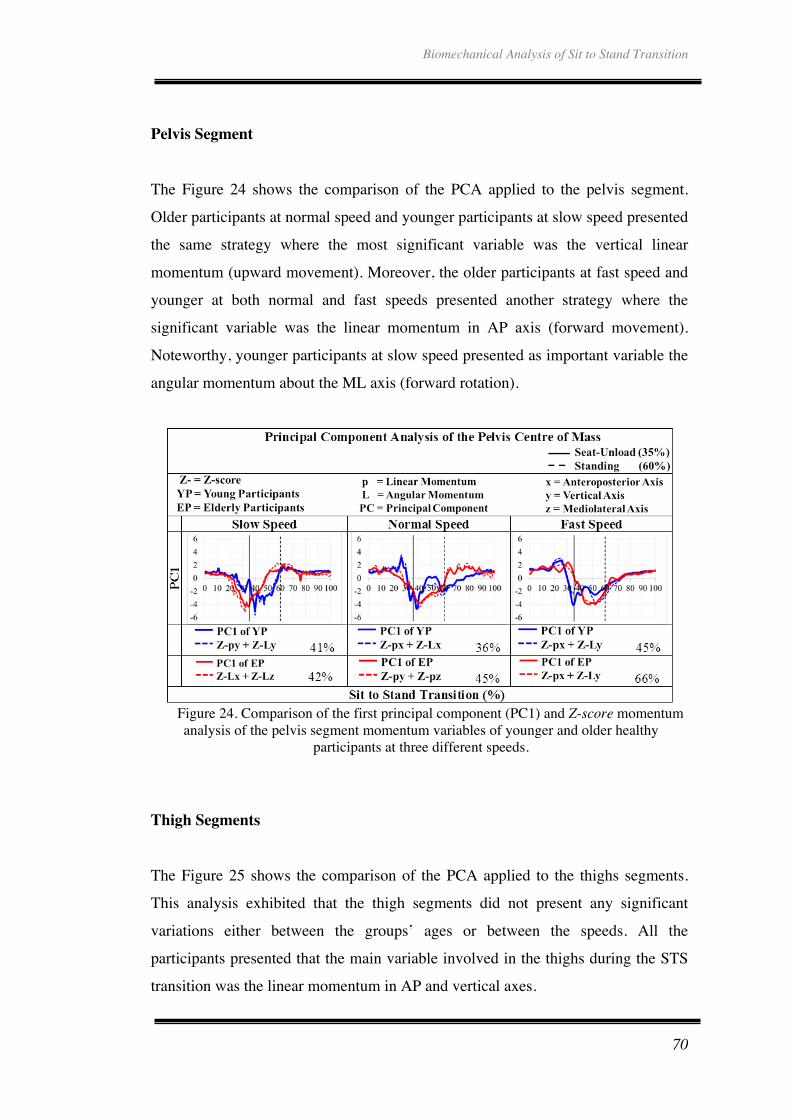
Biomechanical Analysis of Sit to Stand Transition
70
Pelvis Segment
The Figure 24 shows the comparison of the PCA applied to the pelvis segment.
Older participants at normal speed and younger participants at slow speed presented
the same strategy where the most significant variable was the vertical linear
momentum (upward movement). Moreover, the older participants at fast speed and
younger at both normal and fast speeds presented another strategy where the
significant variable was the linear momentum in AP axis (forward movement).
Noteworthy, younger participants at slow speed presented as important variable the
angular momentum about the ML axis (forward rotation).
Figure 24. Comparison of the first principal component (PC1) and Z-score momentum analysis of the pelvis segment momentum variables of younger and older healthy
participants at three different speeds.
Thigh Segments
The Figure 25 shows the comparison of the PCA applied to the thighs segments.
This analysis exhibited that the thigh segments did not present any significant
variations either between the groups’ ages or between the speeds. All the
participants presented that the main variable involved in the thighs during the STS
transition was the linear momentum in AP and vertical axes.

Biomechanical Analysis of Sit to Stand Transition
71
Figure 25. Comparison of the first principal component (PC1) and Z-score momentum analysis of the thighs segment momentum variables of younger and older healthy
participants at three different speeds.
Shank Segments
The Figure 26 shows the comparison of the PCA applied to the shanks segments.
This analysis exhibited that the shank segments presented variations between
strategies to perform the STS transition in both groups’ ages.
Older participants presented as main variable the angular momentum about the
vertical and ML axes at all speeds. While for the younger participants the main
variable was the angular momentum about the AP axis at all speeds.

Biomechanical Analysis of Sit to Stand Transition
72
Figure 26. Comparison of the first principal component (PC1) and Z-score momentum analysis of the shanks segment momentum variables of younger and older healthy
participants at three different speeds.
Feet Segments
The Figure 27 shows the comparison of the PCA applied to the feet segments. This
analysis exhibited that the feet segments did not present any significant variations
either between the groups ages and the speeds. All the participants presented that
the main variable involved in the thighs during the STS transition was the angular
momentum about vertical and ML axes.

Biomechanical Analysis of Sit to Stand Transition
73
Figure 27. Comparison of the first principal component (PC1) and Z-score momentum
analysis of the feet segment momentum variables of younger and older healthy participants at three different speeds.
4.2.6. Summary
Numerous studies have shown that STS transition has identified that the
performance is affected by pathological problems as well as by the ageing. It has
been noticed that the lifestyle and the daily diet that each person also can affect the
mobility.
In this study was found that there are no big differences between these two groups
of participants, it could be due to the both participants’ groups are healthy without
any musculoskeletal injury. The main pattern of the STS transition cycle looks very
similar in both groups, obtaining the same predominant variables on the kinematics
analysis as well as in their kinetics analysis. However there are slight changes on
their performance between the both groups and between the speeds. Also, it was
found by PCA that they use different type of strategy in order to rise, leave the
chair and stand without losing the balance.

Biomechanical Analysis of Sit to Stand Transition
74
Chapter 5. Conclusions and Discussion
This thesis has presented the analysis of the performance of the STS transition for
two different age groups: younger adults and older adults when the activity was
undertaken at three, self-selected speeds. The difference in performance at the three
speeds was assessed both within and between the two age groups considered. This
chapter presents the main conclusions from the analysis for each group as well as
for the comparative analysis, which compared the performance of one group to the
performance of the other.
5.1. Younger Participants Performance of the Sit-to-Stand Transition
The results from the kinetic analysis support the results of the PCA, which suggest
that a different strategy is utilised when performing the STS transition at slow
speed than at normal and fast speeds. Namely, at slow speed, the joint power
presents some disturbances in their pattern during the ascending phase, mainly in
the hip and knee joints. At slow speed the work done at the knee joints is less and
the standard deviation of the power at the hip and knee joints is higher. Indicating
that the hip joints’ increases the contribution at slow speed in order to help the knee
joints to perform the seat-unload and the ascending phase.
The most significant finding from the kinetic analysis is that the work at the hips
joints is greater at slow speed in comparison to the normal and fast speeds
indicating that the hip joints are responsible for rotating the trunk forward-
backward. This supports the findings of the PCA on the WB CoM, which indicates
that at slow speed the participants need more angular momentum about the ML axis
(Lz) to successfully perform the STS transition than at the normal and fast speeds.
In summary, this study has investigated the STS transition in order to determine if
there are any differences when the activity is undertaken at different speeds. In

Biomechanical Analysis of Sit to Stand Transition
75
addition, the investigation evaluated the segmental contributions to the STS
transition. The main finding of the investigation is that participants utilised a
different strategy for performing the STS transition at slow speed than at normal
and fast speeds, depending more on the generation of forward rotation than the
other speeds. It was found that the kinematics of the head, arms and trunk (HAT)
segment closely resembled that of the WB CoM, a finding that confirms that the
HAT is the dominant segment in determining the location and motion of the WB
CoM. In addition, it was determined that the ML angular momentum of the thigh
and shank segments is the major determinant of the motion of the HAT and WB
CoM. Furthermore, the knee and hip joints were found to generate the majority of
the power and torque required for the STS activity.
5.2. Older Participants’ Performance of the Sit-to-Stand Transition
Measurements of the ability in the older to move and balance the body are
correlated with the predictions to fall. Older people are subject to their physical
condition decreasing and this affect the mental confidence, which increases the risk
to fall. Knowing their mobility level helps to provide them with confidence in the
performance of the different activities not only in the STS transition.
This study has determined that the older subjects who participated in the study
utilised a different strategy when undertaking the STS transition at fast speed
compared at normal and slow speeds. When undertaken at normal and slow speeds
the STS transition depended more on the generation of forward rotation than at fast
speed. It was also found that the HAT segments made the greatest contribution to
the WB CoM movement during the STS activity.
The performance at normal speed seems to be more practiced by the older
participants than the others speeds, although it has been noticed by PCA that the
older participants use the same strategy at slow and normal speeds to stand-up.

Biomechanical Analysis of Sit to Stand Transition
76
5.3. Conclusions of the Sit-to-Stand Transition Comparison
Performance between Younger and Older Participants
Numerous studies have shown that STS transition has identified that the
performance is affected by pathological problems as well as by ageing. It has been
noticed that the lifestyle and the daily diet that each person has can also affect their
mobility.
However this study found that whilst there are no big differences between the two
groups of participants, it should be taken into account that both groups were healthy
and did not exhibit any musculoskeletal injuries. The performance trend of the STS
transition cycle looked very similar in both groups, obtaining the same predominant
variables on the kinematics analysis as well as in their kinetics analysis. However
slight changes were found in their performance in both groups at different speeds.
The PCA also found that both groups used different types of strategy in order to
rise, leave the chair and stand, without losing the balance.
5.3.1. Principal Component Analysis of the Whole-Body Centre of Mass
The PCA analysis found that the WB CoM performed a different strategy on
younger participants at slow speed in comparison with their performance at normal
and fast speeds. The PCA suggested that at slow speed younger participants bend
their CoM forward more than in the others speeds, which is confirmed by the
segmental and the kinetics analysis.
The PCA on older participants found that the WB CoM performed a different
strategy at fast speed in comparison with their performance at normal and slow
speeds. The PCA suggested that during the WB CoM transition at normal and slow

Biomechanical Analysis of Sit to Stand Transition
77
speeds older participants bend and transfer their CoM forward more than at fast
speed. This is confirmed by the segmental and kinetics analysis.
The comparative results were confirmed because the kinematic analysis on the
segments showed that the angular momentum of the older participants increased
with respect to the angular momentum of the younger participants.
5.3.2. Principal Component Analysis applied to Momenta Variables of
the Segments Centre of Mass
The PCA on the HAT segment was a significant outcome to find the strategy used
by the participants, due to the main differences identified in the analysis of both
groups of participants. Whereas the analysis of the remaining segments showed
similar results. So, it can be concluded that the HAT is the segment which the body
needs to deal with during the transition.
The PCA of the HAT confirmed that the strategies used for the WB CoM required
more angular momentum at slow speed for the younger participants, and at slow
and normal speeds for the older participants. It means that the trunk was more bent
forward at the mentioned speeds.
The PCA of the pelvis segment showed that there was no clear pattern between
their principal components which indicated that pelvis did not have an important
contribution for the STS transition. Concluding that pelvis only helped to transmit
and stabilize the movement from the lower limbs to the HAT segment.
The PCA of the thigh segments showed similar performance in both participants’
groups. The thigh segments had a similar strategy to move, they focused their
performance on the forward and upward movements.
The PCA on the shanks showed that they changed their strategy to move in both of
the participants’ groups. The younger participants’ group focussed on the internal-

Biomechanical Analysis of Sit to Stand Transition
78
external and forward rotations, whilst for the older the shanks were more focussed
on the lateral rotations.
According to the statements previously written, the thigh segments are responsible
for moving the trunk and pelvis forwards and upwards. While the shank segments
are responsible for helping the thigh segments to move and balance the upper-body.
The PCA on the feet showed that they were focussed on the internal-external
rotation in both groups of participants and at all speeds. Concluding, that the feet
are the responsible for stabilising the movement.
5.3.3. Kinetic Analysis of the Joints
With the kinetic analyses the results from the PCA were confirmed, as the results of
both of the participants’ groups were similar. From the waist kinetic analysis it was
found that the pelvis segment could be considered to be a connection that allows the
transfer of energy from the lower limbs to the upper-body.
The kinetic analysis showed that torques, power, and work from the knee and hip
joints were responsible for generating almost all the momentum and power
necessary for the seat-unload point. After the seat-unload the hip joints’ torques
rotated the HAT and pelvis forwards, while the knee joints’ torques contributed to
rotate the thigh backwards, and therefore the pelvis and HAT as well. Thus
generating the forward-backward angular momentum needed to push forward the
pelvis and HAT segments in order to leave the chair and therefore the upward linear
momentum.
The higher hip torque at the end of the cycle identified that the older participants
needed a bigger break torque in order to get the stabilization of the body.
The ankle joints’ torques, at the end of the STS transition, indicated that they are
responsible for dissipating the angular momentum generated by the hip and knees

Biomechanical Analysis of Sit to Stand Transition
79
earlier in the movement. Therefore the shank segments connect the thigh with the
feet segments in order to transfer the energy between them. Regarding the ankle
joints’ power, it is active all along the STS transition indicating that ankle joints
also help in stabilising the WB CoM including during the standing posture.
The feet are the base of support after participants leave the chair, hence that the
kinematic of the foot segments showed an insignificant activity.
This study helped to quantitatively and descriptively recognizes the broad range of
strategies that people use to perform the same task. The main application of
individual STS performance studies is to improve the ability to move in order to
obtain physical independence.
5.4. Future Work
In this work there are some scopes that can be added to improve the analysis of the
human movement. Due to kinetics and kinematics analysis only was done in this
study. From previous studies was expected to find a significant changes in the
comparison between the younger and older participants performance. Therefore the
slightly changes found, must to be clarified with the help of other technologies such
as electromyography and ultrasound.
Because the electromyography helps to measure the muscle response activity when
the muscle is active during the activity. And the ultrasound scan and produce
images of the musculoskeletal tissues. This can help to project muscle activation
during the activity, and so find abnormal muscular activation.

Biomechanical Analysis of Sit to Stand Transition
80
References
1. Nuzik, S., et al., Sit-to-stand movement pattern. A kinematic study. Physical Therapy, 1986. 66(11): p. 1708-1713.
2. Schenkman, M., et al., Whole-body movements during rising to standing from sitting. Physical Therapy, 1990. 70(10): p. 638-648.
3. Riley, P.O., D.E. Krebs, and R.A. Popat, Biomechanical analysis of failed sit-to-stand. IEEE Transactions on Rehabilitation Engineering, 1997. 5(4): p. 353-359.
4. Roberts, P.D. and G. McCollum, Dynamics of the sit-to-stand movement. Biological Cybernetics, 1996. 74(2): p. 147-157.
5. Papa, E. and A. Cappozzo, Sit-to-stand motor strategies investigated in able-bodied young and elderly subjects. Journal of Biomechanics, 2000. 33(9): p. 1113-1122.
6. Mazza, C., M. Zok, and U. Della Croce, Sequencing sit-to-stand and upright posture for mobility limitation assessment: determination of the timing of the task phases from force platform data. Gait and Posture, 2005. 21(4): p. 425-431.
7. Allin, S. and A. Mihailidis, Sit to stand detection and analysis, in AI in Eldercare: New Solutions to Old Problems: Papers from the AAAI Fall Symposium. 2008, Association for the Advancement of Artificial Intelligence: Toronto. p. 1-3.
8. Beninato, M., L.G. Portney, and P.E. Sullivan, Using the international classification of functioning, disability and health as a framework to examine the association between falls and clinical assessment tools in people with stroke. Physical Therapy, 2009. 89(8): p. 816-825.
9. Boulgarides, L.K., et al., Use of clinical and impairment-based tests to predict falls by community-dwelling older adults. Physical Therapy, 2003. 83(4): p. 328-339.
10. Hatch, J., K.M. Gill-Body, and L.G. Portney, Determinants of balance confidence in community-dwelling elderly people. Physical Therapy, 2003. 83(12): p. 1072-1079.
11. Pai, Y.C., et al., Control of body centre of mass momentum during sit-to-stand among young and elderly adults. Gait and Posture, 1994. 2(2): p. 109-116.
12. World Health Organization. Ageing and Life Course Unit., WHO global report on falls prevention in older age. 2008, Geneva, Switzerland: World Health Organization. iv, 47 p.
13. Blomqvist, S., et al., Test-retest reliability, smallest real difference and concurrent validity of six different balance tests on young people with mild to moderate intellectual disability. Physiotherapy, 2012. 98(4): p. 313-319.
14. Rubenstein, L.Z., Falls in older people: epidemiology, risk factors and strategies for prevention. Age and Ageing, 2006. 35(2): p. ii37-ii41.
15. Masud, T. and R.O. Morris, Epidemiology of falls. Age and Ageing, 2001. 30(4): p. 3-7.
Biomechanical Analysis of Sit to Stand Transition
81
16. Schwenk, M., et al., Test-retest reliability and minimal detectable change of repeated sit-to-stand analysis using one body fixed sensor in geriatric patients. Physiological Measurement, 2012. 33(11): p. 1931-1946.
17. Feland, J.B., R. Hager, and R.M. Merrill, Sit to stand transfer: performance in rising power, transfer time and sway by age and sex in senior athletes. British Journal of Sports Medicine, 2005. 39(11): p. 1-2.
18. Baer, G.D. and A.M. Ashburn, Trunk movements in older subjects during sit-to-stand. Archives of Physical Medicine and Rehabilitation, 1995. 76(9): p. 844-849.
19. Fotoohabadi, M.R., E.A. Tully, and M.P. Galea, Kinematics of rising from a chair: image-based analysis of the sagittal hip-spine movement pattern in elderly people who are healthy. Physical Therapy, 2010. 90(4): p. 561-571.
20. Gilleard, W., J. Crosbie, and R. Smith, A longitudinal study of the effect of pregnancy on rising to stand from a chair. Journal of Biomechanics, 2008. 41(4): p. 779-787.
21. Cignetti, F., et al., Updating process of internal models of action as assessed from motor and postural strategies in children. Neuroscience, 2013. 233: p. 127-138.
22. Pai, Y.C. and M.W. Rogers, Segmental contributions to total body momentum in sit-to-stand. Medicine and Science in Sports and Exercise, 1991. 23(2): p. 225-230.
23. Bieryla, K.A., D.E. Anderson, and M.L. Madigan, Estimations of relative effort during sit-to-stand increase when accounting for variations in maximum voluntary torque with joint angle and angular velocity. Journal of Electromyography and Kinesiology, 2009. 19(1): p. 139-144.
24. Winter, D.A., Biomechanics and motor control of human movement. 4 th ed. 1930, New Jersey: John Wiley & Sons Inc. 370.
25. Lee, S.H., Biomechanical modeling and control of the human body for computer animation, in Computer Science. 2008, University of California: Los Angeles, California. p. 143.
26. Freivalds, A., Biomechanics of the upper limbs. First ed. 2000, United States of America: CRC Press. 564.
27. Enderle, J.D. and J.D. Bronzino, Introduction to biomedical engineering. 3 rd ed. Biomedical Engineering, ed. Third. 2012, United Kingdom: Elsevier Inc. 1253.
28. Nordin, M. and V.H. Frankel, Basic biomechanics of the musculoskeletal system. 4 th ed. 2012, China: Wolters Kluwer. 454.
29. Andriacchi, T., P. and E.J. Alexander, Studies of human locomotion: past, presente and future. Journal of Biomechanics, 2000. 33: p. 1217-1224.
30. Robertson, D.G., et al., Research methods in biomechanics. 1 st ed. 2004, United States of America: Human Kinetics. 308.
31. Cael, C., Functional anatomy. 2010, Baltimore: Wolters Kluwer. 446. 32. Kaya, B.K., D.E. Krebs, and P.O. Riley, Dynamic stability in elders:
momentum control in locomotor ADL. The Journals of Gerontology. Series A, Biological Sciences and Medical Sciences, 1998. 53(2): p. 126-134.
33. Knudson, D., Fundamentals of biomechanics, ed. Second. 2007, California: Springer. 319.
34. Nordin, M. and V.H. Frankel, Biomecanica basica del sistema musculosqueletico, ed. Tercera. 2004, Madrid: Mc Graw Hill. 324.

Biomechanical Analysis of Sit to Stand Transition
82
35. Peterson, D.R. and J.D. Bronzino, Biomechanics principles and applications. 2008: CRC Press. 349.
36. Cappozzo, A., Gait analysis methodology. Human Movement Science, 1984. 3: p. 24-50.
37. Kerr, A., Introductory biomechanics. 2010, Glasgow: Elsevier. 150. 38. Mow, V.C. and R. Huiskes, Basic orthoapedic biomechanics and mechano-
biology. Third ed, ed. Third. 2005, Philadelphia: Lippincott Williams and Wilkins. 736.
39. Marieb, E.N. and K. Hoehn, Human anatomy and physiology, ed. Seventh. 2007: Pearson Education Inc. 1264.
40. Jones, F.P., et al., Quantitative analysis of abnormal movement: the sit-to-stand pattern. American Journal of Physical Medicine, 1963. 42: p. 208-218.
41. Wheeler, J., et al., Rising from a chair. Influence of age and chair design. Physical Therapy, 1985. 65(1): p. 22-26.
42. Aggarwal, J.K. and Q. Cai, Human motion analysis: a review. Computer Vision and Image Understanding, 1999. 73(3): p. 428-440.
43. Hikosaka, O. and M. Isoda, Brain mechanisms for switching from automatic to controlled eye movements. Progress in Brain Research, 2008. 171: p. 375-382.
44. Wiener, J.M., et al., Measuring the activities of daily living: comparisons across national surveys. Journal of Gerontology, 1990. 45(6): p. S229-S237.
45. Kerr, K.M., et al., Analysis of the sit-stand-sit movement cycle in normal subjects. Clinicla Biomechanics, 1997. 12(4): p. 236-245.
46. Van der Heijden, M.M., et al., Muscles limiting the sit-to-stand movement: an experimental simulation of muscle weakness. Gait and Posture, 2009. 30(1): p. 110-114.
47. Etnyre, B. and D.Q. Thomas, Event standardization of sit-to-stand movements. Physical Therapy, 2007. 87(12): p. 1651-1666.
48. Kerr, K.M., et al., Analysis of the sit-stand-sit movement cycle in normal subjects. Clinical Biomechanics, 1997. 12(4): p. 236-245.
49. Janssen, W.G., H.B. Bussmann, and H.J. Stam, Determinants of the sit-to-stand movement: a review. Physical Therapy, 2002. 82(9): p. 866-879.
50. Kerr, K.M., et al., Standardization and definitions of the sit-stand-sit movement cycle. Gait and Posture, 1994. 2(3): p. 182-190.
51. Saint-Bauzel, L., et al., Pathological sit-to-stand predictive models for control of a rehabilitation robotic device. IEEE International Symposium on Robot and Human Interactive Communication, 2007. 1-3(16th): p. 1166-1171.
52. Whiting, W.C. and S. Rugg, Dynatomy: dynamic human anatomy. 2006: William C. Whiting and Stuart Rugg. 246.
53. Gillette, J.C. and C.A. Stevermer, The effects of symmetric and asymmetric foot placements on sit-to-stand joint moments. Gait Posture, 2012. 35(1): p. 78-82.
54. Akram, S.B. and W.E. McIlroy, Challenging horizontal movement of the body during sit-to-stand: impact on stability in the young and elderly. Journal of Motor Behavior, 2011. 43(2): p. 147-153.
55. Mazza, C., et al., Association between subject functional status, seat height, and movement strategy in sit-to-stand performance. Journal of the American Geriatrics Society, 2004. 52(10): p. 1750-1754.

Biomechanical Analysis of Sit to Stand Transition
83
56. Ricard, P.E.H., J.C. Paz, and M.P. West, Chapter 23 - Functional Tests, in Acute care handbook for physical therapists. 2014, W.B. Saunders: St. Louis. p. 471-483.
57. Raad, J., et al., A brief review of the activities-specific balance confidence scale in older adults. Archives of Physycal Medicine and Rehabilitation, 2013. 94: p. 1426-1427.
58. Novy, D.M., M.J. Simmonds, and C.E. Lee, Physical performance tasks: what are the underlying constructs? Archives of Physical Medicine and Rehabilitation, 2002. 83(1): p. 44-47.
59. Tiedemann, A., et al., The comparative ability of eight functional mobility tests for predicting falls in community-dwelling older people. Age and Ageing, 2008. 37(4): p. 430-435.
60. Jones, S.E., et al., The five-repetition sit-to-stand test as a functional outcome measure in COPD. Thorax, 2013. 68(11): p. 1015-1020.
61. Christiansen, C.L. and J.E. Stevens-Lapsley, Weight-bearing asymmetry in relation to measures of impairment and functional mobility for people with knee osteoarthritis. Archives of Physical Medicine and Rehabilitation, 2010. 91(10): p. 1524-1528.
62. McMillan, A.G. and J.P. Scholz, Early development of coordination for the sit-to-stand task. Human Movement Science, 2000. 19(1): p. 21-57.
63. Tsutsumi, T., et al., Time course analysis of angular control of the body and head while rising from a chair. Acta Otolaryngologica, 2004. 124(7): p. 798-802.
64. Giansanti, D. and G. Maccioni, Physiological motion monitoring: a wearable device and adaptative algorithm for sit-to-stand timing detection. Physiological Measurement, 2006. 27(8): p. 713-723.
65. Seven, Y.B., N.E. Akalan, and C.A. Yucesoy, Effects of back loading on the biomechanics of sit-to-stand motion in healthy children. Human Movement Science, 2008. 27(1): p. 65-79.
66. Mong, Y., T.W. Teo, and S.S. Ng, 5-repetition sit-to-stand test in subjects with chronic stroke: reliability and validity. Archives of Physical Medicine Rehabilitation, 2010. 91(3): p. 407-413.
67. Buatois, S., et al., Five times sit to stand test is a predictor of recurrent falls in healthy community-living subjects aged 65 and older. Journal of the American Geriatrics Society, 2008. 56(8): p. 1575-1577.
68. Duncan, R.P., A.L. Leddy, and G.M. Earhart, Five times sit-to-stand test performance in Parkinson's disease. Archives of Physical Medicine and Rehabilitation, 2011. 92(9): p. 1431-1436.
69. Dubost, V., et al., Decreased trunk angular displacement during sitting down: An early feature of aging. Physical Therapy, 2005. 85: p. 404 - 412.
70. Galli, M., et al., Quantitative analysis of sit to stand movement: experimental set-up definition and application to healthy and hemiplegic adults. Gait and Posture, 2008. 28(1): p. 80-85.
71. Csuka, M. and D.J. McCarty, Simple method for measurement of lower extremity muscle strength. The American Journal of Medicine, 1985. 78(1): p. 77-81.
72. Guralnik, J.M., et al., A short physical performance battery assessing lower extremity function: association with self-reported disability and prediction of

Biomechanical Analysis of Sit to Stand Transition
84
mortality and nursing home admission. Journal of Gerontology, 1994. 49(2): p. M85-M94.
73. Shumway-Cook, A., S. Brauer, and M. Woollacott, Predicting the probability for falls in community-dwelling older adults using the Timed Up & Go Test. Physical Therapy, 2000. 80(9): p. 896-903.
74. Ikeda, E.R., et al., Influence of age on dynamics of rising from a chair. Physical Therapy, 1991. 71(6): p. 473-481.
75. Pai, Y.-C., et al., Control of body centre of mass momentum during sit-to-stand among young and elderly adults. Gait and Posture, 1994. 2(2): p. 109-116.
76. Mourey, F., et al., Standing up from a chair as a dynamic equilibrium task: a comparison between young and elderly subjects. The Journals of Gerontology. Series A, Biological Sciences and Medical Sciences, 2000. 55(9): p. B425-B431.
77. McGibbon, C.A., D.E. Krebs, and D.M. Scarborough, Vestibulopathy and age effects on head stability during chair rise. Acta Otolaryngologica, 2001. 121(1): p. 52-58.
78. Lindemann, U., et al., Coordination of strength exertion during the chair-rise movement in very old people. The Journals of Gerontology. Series A, Biological Sciences and Medical Sciences, 2007. 62(6): p. 636-640.
79. Whitney, S.L., et al., Clinical measurement of sit-to-stand performance in people with balance disorders: validity of data for the five-times-sit-to-stand test. Physical Therapy, 2005. 85(10): p. 1034-1045.
80. Powell, L.E. and A.M. Myers, The activities-specific balance confidence (ABC) scale. The Journal of Gerontology A Biological Sciences and Medicine Science, 1995. 50A(1): p. M28-M34.
81. Yardley, L., et al., Development and initial validation of the Falls Efficacy Scale-International (FES-I). Age Ageing, 2005. 34(6): p. 614-619.
82. Lomaglio, M.J. and J.J. Eng, Muscle strength and weight-bearing symmetry relate to sit-to-stand performance in individuals with stroke. Gait and Posture, 2005. 22(2): p. 126-131.
83. Epifanio, I., et al., Analysis of multiple waveforms by means of functional principal component analysis: normal versus pathological patterns in sit-to-stand movement. Medical and Biological Engineering Computing, 2008. 46(6): p. 551-561.
84. Kralj, A., R.J. Jaeger, and M. Munih, Analysis of standing up and sitting down in humans: definitions and normative data presentation. Journal of Biomechanics, 1990. 23(11): p. 1123-1138.
85. Jeng, S.F., et al., Reliability of a clinical kinematic assessment of the sit-to-stand movement. Physical Therapy, 1990. 70(8): p. 511-520.
86. Shum, G.L., J. Crosbie, and R.Y. Lee, Effect of low back pain on the kinematics and joint coordination of the lumbar spine and hip during sit-to-stand and stand-to-sit. Spine, 2005. 30(17): p. 1998-2004.
87. Shepherd, R.B. and A.M. Gentile, Sit-to-Stand - Functional-Relationship between Upper-Body and Lower-Limb Segments. Human Movement Science, 1994. 13(6): p. 817-840.
88. Khemlani, M.M., J.H. Carr, and W.J. Crosbie, Muscle synergies and joint linkages in sit-to-stand under two initial foot positions. Clinical Biomechanics, 1999. 14(4): p. 236-246.

Biomechanical Analysis of Sit to Stand Transition
85
89. Lord, S.R., et al., Sit-to-stand performance depends on sensation, speed, balance, and psychological status in addition to strength in older people. The Journals of Gerontology. Series A, Biological Sciences and Medical Sciences, 2002. 57(8): p. M539-M543.
90. Nairn, B.C., S.R. Chisholm, and J.D.M. Drake, What is slumped sitting? A kinematic and electromygraphical evaluation. Manual Therapy, 2013: p. 1-8.
91. Munro, B.J., et al., A kinematic and kinetic analysis of the sit-to-stand transfer using an ejector chair: implications for elderly rheumatoid arthritic patients. Journal of Biomechanics, 1998. 31(3): p. 263-271.
92. Riley, P.O., et al., Mechanics of a constrained chair-rise. Journal of Biomechanics, 1991. 24(1): p. 77-85.
93. Pai, Y.C. and M.W. Rogers, Control of body mass transfer as a function of speed of ascent in sit-to-stand. Medicine and Science in Sports and Exercise, 1990. 22(3): p. 378-384.
94. Mourey, F., et al., A kinematic comparison between elderly and young subjects standing up from and sitting down in a chair. Age and Ageing, 1998. 27(2): p. 137-146.
95. Anglin, C. and U.P. Wyss, Arm motion and load analysis of sit-to-stand, stand-to-sit, cane walking and lifting. Clinical Biomechanics, 2000. 15(6): p. 441-448.
96. Gaul-Aláčová, P., et al., Analysis of the sitting-to-standing movement in variously demanding postural situations. 2003: Czech Republic. p. 57-64.
97. Sibella, F., et al., Biomechanical analysis of sit-to-stand movement in normal and obese subjects. Clinical Biomechanics, 2003. 18(8): p. 745-750.
98. Bernardi, M., et al., Determinants of sit-to-stand capability in the motor impaired elderly. Journal of Electromyography and Kinesiology, 2004. 14(3): p. 401-410.
99. Mathiyakom, W., et al., Modifying center of mass trajectory during sit-to-stand tasks redistributes the mechanical demand across the lower extremity joints. Clinical Biomechanics, 2005. 20(1): p. 105-111.
100. Scarborough, D.M., C.A. McGibbon, and D.E. Krebs, Chair rise strategies in older adults with functional limitations. Journal of Rehabilitation Research and Development, 2007. 44(1): p. 33-42.
101. Claeys, K., et al., Altered preparatory pelvic control during the sit-to-stance-to-sit movement in people with non-specific low back pain. Journal of Electromyography and Kinesiology, 2012. 22(6): p. 821-828.
102. Bohannon, R.W., Test-retest reliability of the five-repetition sit-to-stand test: a systematic review of the literature involving adults. Journal of Strength and Conditioning Research, 2011. 25(11): p. 3205-3207.
103. Crosbie, J., et al., Do people with recurrent back pain constrain spinal motion during seated horizontal and downward reaching? Clinical Biomechanics, 2013. 28(8): p. 866-872.
104. Kerr, A., et al., Measuring movement fluency during the sit-to-walk task. Gait & Posture, 2013. 37(4): p. 598-602.
105. Miletello, W.M., J.R. Beam, and Z.C. Cooper, A biomechanical analysis of the squat between competitive collegiate, competitive high school, and novice powerlifters. Journal of Strength and Conditioning Research, 2009. 23(5): p. 1611-1617.

Biomechanical Analysis of Sit to Stand Transition
86
106. Escamilla, R.F., et al., A three-dimensional biomechanical analysis of the squat during varying stance widths. Medicine and Science in Sports and Exercise, 2001. 33(6): p. 984-998.
107. Isear, J.A., Jr., J.C. Erickson, and T.W. Worrell, EMG analysis of lower extremity muscle recruitment patterns during an unloaded squat. Medicine and Science in Sports and Exercise, 1997. 29(4): p. 532-539.
108. Eng, J.J. and D.A. Winter, Estimations of the horizontal displacement of the total body centre of mass: considerations during standing activities. Gait and Posture, 1993. 1(3): p. 141-144.
109. Schultz, A.B., N.B. Alexander, and J.A. Ashton-Miller, Biomechanical analyses of rising from a chair. Journal of Biomechanics, 1992. 25(12): p. 1383-1391.
110. Janssen, W.G., et al., Validity of accelerometry in assessing the duration of the sit-to-stand movement. Medical and Biological Engineering and Computing, 2008. 46(9): p. 879-887.
111. Segal, N.A., et al., Association Between Chair Stand Strategy and Mobility Limitations in Older Adults With Symptomatic Knee Osteoarthritis. Archives of Physical Medicine and Rehabilitation, 2013. 94(2): p. 375-383.
112. Galumbeck, M.H., et al., The sit and stand chair. A revolutionary advance in adaptive seating systems. Journal of Long-Term Effects of Medical Implants, 2004. 14(6): p. 535-543.
113. DeSure, A.R., et al., An exercise program to prevent falls in institutionalized elderly with cognitive deficits: a crossover pilot study. Hawaii Journal of Medicine and Public Health, 2013. 72(11): p. 391-395.
114. Cuddihy, P.E., et al., Radar walking speed measurements of seniors in their apartments: technology for fall prevention, in 34th Annual international Conference of the IEEE Engineering in Medicine and Biology Society. 2012: San Diego, California USA p. 260-263.
115. Goossens, R.H. and C.J. Snijders, Design criteria for the reduction of shear forces in beds and seats. Journal of Biomechanics, 1995. 28(2): p. 225-230.
116. Aissaoui, R. and J. Dansereau. Biomechanical analysis and modelling of sit to stand task: a literature review. in Proceedings of the IEEE International Conference on Systems, Man and Cybernetics. 1999. Tokyo, Jpn: IEEE.
117. Van Lummel, R.C., et al., Automated approach for quantifying the repeated sit-to-stand using one body fixed sensor in young and older adults. Gait and Posture, 2013. 38(1): p. 153-156.
118. Guzman, R.A., et al., Differences in momentum development when standing up from a chair between elderly with and without frequent falls history. Revista Española de Geriatria y Gerontologia, 2009. 44(4): p. 200-204.
119. Fujimoto, M. and L.S. Chou, Dynamic balance control during sit-to-stand movement: an examination with the center of mass acceleration. Journal of Biomechanics, 2012. 45(3): p. 543-548.
120. Harrison, D.D., et al., Sitting biomechanics part I: review of the literature. Journal of Manipulative and Physiological Therapeutics, 1999. 22(9): p. 594-609.
121. Yoshioka, S., et al., Computation of the kinematics and the minimum peak joint moments of sit-to-stand movements. Biomed Eng Online, 2007. 6: p. 26.
122. Gross, J.M., J. Fetto, and E. Rosen, Musculoskeletal Examination. 2009, Chichester, West Sussex: Wiley-Blackwell. 463.

Biomechanical Analysis of Sit to Stand Transition
87
123. Whittle, M.W., Gait Analysis an Introduction, ed. Fourth. 2007, China: Elsevier. 255.
124. Yoo, B., S. Kim, and A. Merryweather, A technique for dynamic marker identification to locate occluded anatomical landmarks, in Conference of The American Society of Biomechanics 2011, T.A.S.o. Biomechanics, Editor. 2011. p. 1-2.
125. Ren, L., R. Jones, and D. Howard, Generalized approach to three-dimensional marker-based motion analysis of biomechanical multi-segment system, in International Society of Biomechanics XXth Congress. 2005: Cleveland, OH, USA. p. 235.
126. Zhao, G.R., et al., A customized model for 3D human segmental kinematic coupling analysis by optoelectronic stereophotogrammetry. Science China Technological Sciences, 2010. 53: p. 2947-2953.
127. Ren, L., R.K. Jones, and D. Howard, Whole body inverse dynamics over a complete gait cycle based only on measured kinematics. Journal of Biomechanics, 2008. 41(12): p. 2750-2759.
128. Ren, L., D. Howard, and L. Kenney, Computational models synthesize human walking. Journal of Bionic Engineering, 2006. 3: p. 127-138.
129. Cappozzo, A., et al., Position and orientation in space of bones during movement: anatomical frame definition and determination. Clinical Biomechanics, 1995. 10(4): p. 171-178.
130. Bennett, B.C., et al., Angular momentum of walking at different speeds. Human Movement Science, 2009. 29(1): p. 114-24.
131. Daffertshofer, A., et al., PCA in studying coordination and variability: a tutorial. Clinical Biomechanics, 2004. 19(4): p. 415-428.
132. Herr, H. and M. Popovic, Angular momentum in human walking. The Journal of Experimental Biology, 2008. 211: p. 467-481.
133. Robert, T., et al., Angular momentum synergies during walking. Experimental Brain Research, 2009. 197(2): p. 185-197.
134. Bennett, B.C., T. Robert, and S.D. Rossell, Angular momentum: insights into walking and its control, in International Conference on Intelligent Robots and Systems. 2011, IEEE: San Francisco, CA, USA. p. 3969-3974.
135. Zatsiorsky, V.M., Kinetics of human motion. 2002: Human Kinetics. 653. 136. McGibbon, C.A., et al., Instant of chair-rise lift-off can be predicted by foot-
floor reaction forces. Human Movement Science, 2004. 23(2): p. 121-132. 137. Jo, Y.N., M.J. Kang, and H.H. Yoo, Estimation of muscle and joint forces in
the human lower extremity during rising motion from a seated position. Journal of Mechanical Science and Technology, 2013. 28(2): p. 467-472.
138. Kim, S.M., et al., Study of Knee and Hip Joints' Moment Estimation by Biomechanical Simulation During Various Motion Changes. World Congress on Engineering and Computer Science, 2009. I and II: p. 785-788.
139. Schofield, J.S., et al., Characterizing asymmetry across the whole sit to stand movement in healthy participants. Journal of Biomechanics, 2013. 46(15): p. 2730-2735.
140. Jenkyn, T.R. and A.C. Nicol, A multi-segment kinematic model of the foot with a novel definition of forefoot motion for use in clinical gait analysis during walking. Journal of Biomechanics, 2007. 40(14): p. 3271-3278.

Biomechanical Analysis of Sit to Stand Transition
88
Appendix 1
Ethical Document

Biomechanical Analysis of Sit to Stand Transition
89

Biomechanical Analysis of Sit to Stand Transition
90
Appendix 2
Arrangement of the Anatomical Landmarks
Markers were placed by double side adhesive tape on the principal distal limbs of
the body of the participant with the aim to identify the principal body landmarks
and segments involved in the motion. Markers positions were based on the
international society of biomechanics (ISB) recommendations and previously
published studies [140]. The Table 2 and Table 3 show the name and position of
both types of markers.
Table 2. Technical Markers
No Body Segment Technical Markers Name 1 Head head_ant, head_post, head_Rlat, headLlat 2 Trunk ster_1, ster_2, ster_3, ster_4 3 Pelvis pel_1sr, pel_2, pel_3, pel_4 4 Right Humerus Rhum_1, Rhum_2, Rhum_3, Rhum_4 5 Right Forearm Rfarm_1, Rfarm_2, Rfarm_3, Rfarm_4 6 Left Humerus Lhum_1, Lhum_2, Lhum_3, Lhum_4 7 Left Forearm Lfarm_1, Lfarm_2, Lfarm_3, Lfarm_4 8 Right Thigh Rthg_1, Rthg_2, Rthg_3, Rthg_4 9 Right Shank Rleg_1, Rleg_2, Rleg_3, Rleg_4
10 Left Thigh Lthg_1, Lthg_2, Lthg_3, Lthg_4 11 Left Shank Lleg_1, Lleg_2, Lleg_3, Lleg_4

Biomechanical Analysis of Sit to Stand Transition
91
Table 3. Anatomical Markers Anatomical Landmark Description Anatomical
Landmark Description Head Right Femur
VERT Vertex, head cranial point RLEP Right lateral epicondyle RGON Right temporomandibular joint RMEP Right medial epicondyle LGON Left temporomandibular joint HJCR Right hip joint centre
Torso Right Shank PXIP Xiphoid process RHFB Right apex of fibula head IJUG Jugular notch RTTB Right tibial tuberosity C7SP Spinous process C7 RMML Right medial malleolus T8SP Spinous process T8 RLML Right lateral malleolus
Pelvis Right Foot RASIS Right anterior superior iliac spine CAR Right upper ridge of the calcaneus LASIS Left anterior superior iliac spine FMR Right dorsal of first metatarsal head RPSIS Right posterior superior iliac spine SMR Right dorsal of second metatarsal head LPSIS Left posterior superior iliac spine VMR Right dorsal of fifth metatarsal head
Right Humerus Left Femur RMHU Right medial humeral epicondyle LLEP Left lateral epicondyle RLHU Right lateral humeral epicondyle LMEP Left medial epicondyle GJCR Right glen humeral joint centre HJCL Left hip joint centre
Right Forearm Left Shank RRSY Right radial styloid LHFB Left apex of fibula head RUSY Right ulnar styloid LTTB Left tibial tuberosity EJCR Right elbow joint centre LMML Left medial malleolus
LLML Left lateral malleolus Left Humerus Left Foot
LMHU Left medial humeral epicondyle CAL Left upper ridge of the calcaneus LLHU Left lateral humeral epicondyle FML Left dorsal of first metatarsal head GJCL Left glen humeral joint centre SML Left dorsal of second metatarsal head
VML Left dorsal of fifth metatarsal head Left Forearm
LRSY Left radial styloid LUSY Left ulnar styloid EJCL Left elbow joint centre

Biomechanical Analysis of Sit to Stand Transition
92
Appendix 3
Data Process using Vicon Nexus Software
Using Vicon Nexus Software, markers will be detected and engraved frame by
frame in a text data, the 3D tracking is used during the motion, this process create
3D points from 2D rays capture and then sorts the points into trajectories. This
means that at least two cameras must to able to capture each marker to obtain a
continuous trajectory. Then the markers must to be identified, to accomplish the
labelling of each trial captured there are three labelling windows in Vicon software:
manual labelling, gap filling and pattern fill, like is showed in the Figure 28.
Figure 28. Labelling windows from VICON Nexus software to label the human motion captured.
First each marker is labelled manually with the name from their anthropometric
position given above, but sometimes some of them are lost and this impede tracking
the trajectory, in this cases are useful the other two windows; gap filling helps to
found the gap or unlabeled marker into the recorded trial, and pattern fill helps to
visualize the trajectory, if the suggested trajectory is correct the gap can be filled.
The Figure 29 shows the participant model before and after of the marker labelling.

Biomechanical Analysis of Sit to Stand Transition
93
Figure 29. Before and After of Labelling Markers in Vicon Software.
When all of the markers are labelled in a correct way and all their trajectories are
correct, these are exported like a text file (txt), this data is filtered to obtain
position, angles, velocity, acceleration and distances.

Biomechanical Analysis of Sit to Stand Transition
94
Appendix 4
Data Motion Analysis
The data files are processed in the MatLab platform, where General Motion
Analysis System Software (GMAS) has its principal operation. Data files are
loaded into GMAS, where the data is processed to obtain a biomechanical model of
the human body. The principal process is listed below:
• Construction of a biomechanical rigid body model; a link-segment model to
represent the human body is created from anatomical landmarks positioned
in order to show the arrangement and distribution of the segments in a three-
dimensional coordinate system
• Acquisition and construction of joint centres
• Definition of local coordinates systems of each segment
• Analyse the biomechanical model data to obtain: orientation and position of
body segments.
The resultant model of the human body must to look like is showed in the Figure
30.

Biomechanical Analysis of Sit to Stand Transition
95
Figure 30. Model of the human body during STS transition.
Then the position of the centre of mass (CoM) of each segment is obtained,
followed with the calculation of linear and angular velocities and accelerations of
the CoM’s segments, joint rotations, linear and angular momentum of each segment
were calculated too.

Biomechanical Analysis of Sit to Stand Transition
96
Appendix 5
Normalization Processing
In order to perform a better comparison of the data, all trails were normalized. It
was defined as the time 0% (start of the movement) when the vector velocity of the
WB CoM corresponded to zero, which corresponded to the sitting phase, during the
STS cycle. Similarly, the time 100% (end of movement) was defined as the time
when the vector velocity of the WB CoM reduces until it reaches zero. This
position corresponds to the standing position of the STS transition cycle. The
calculation of the transition’s duration was performed employing the normalized
time data that allows the expression of the transition’s performance time as a
percentage of the total movement duration.
In order to perform data normalization, with respect to the time interval the absolute
vector velocity for each trial was calculated. The maximum pick value was
identified and divided by two in order to obtain the values corresponding to the first
and second half curve vector value (t1 and t2). The middle point of the curve (T
period) was calculated employing ¡Error!No se encuentra el origen de la referencia., which is described as follow:
T=t2−t1 2
……………………….. Equation 8
Where: T is the half time period of the curve vector velocity, t1 is the first point of
the half value of the curve vector velocity, t2 is the second point of the half value of
the curve vector velocity.
STS transition start time is obtained using Equation 9, subtracting t1 to the two
times T period. STS transition end time is obtained using Equation 10, adding t2 to
the three times T period.

Biomechanical Analysis of Sit to Stand Transition
97
Where: start is the 0% of
the STS transition cycle, end is the 100% of the STS transition cycle, T is the
period of the half value of the curve vector velocity, t1 is the first point of the half
value of the curve vector velocity, t2 is the second point of the half value of the
curve vector velocity.
Figure 31 corresponds to a representative image of the vector velocity obtained for
one of the trials following data normalization.
Figure 31. Vector velocity from the trial one of participant number one, showing the
parameters needed to normalize the trials.
start=t1−T∗2 …………………….… Equation 9
end=t2 +T∗3 ……………………….
Equation 10
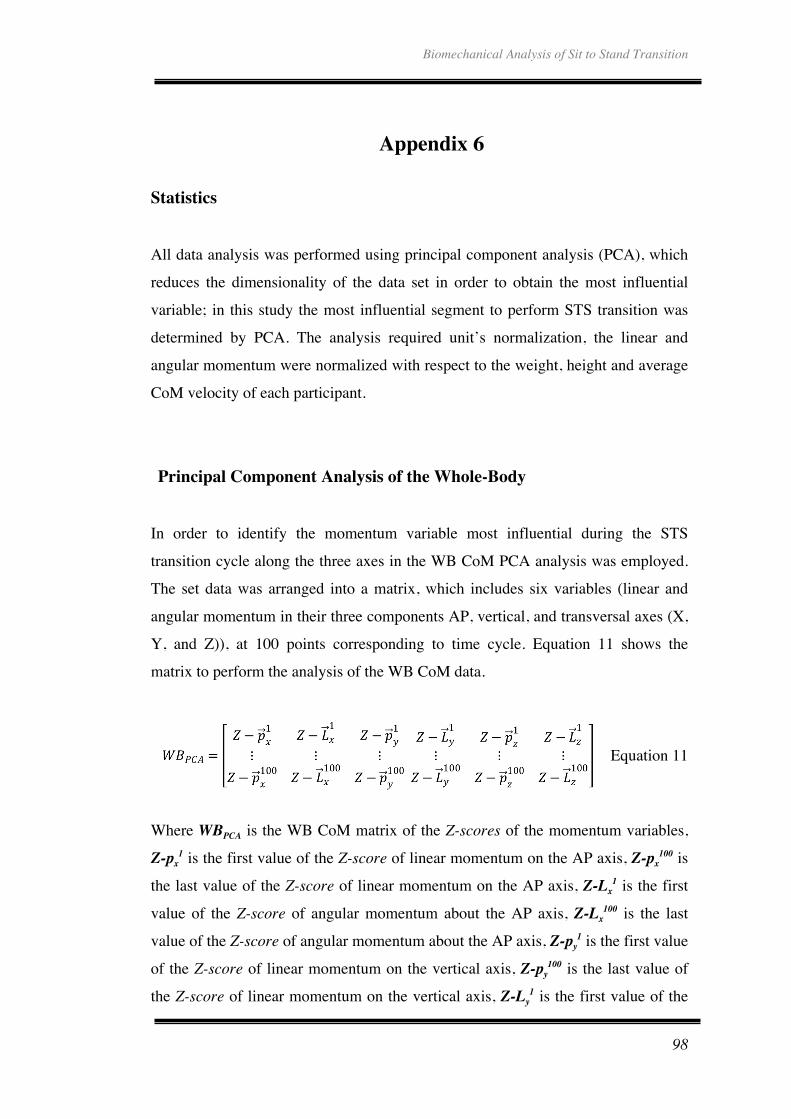
Biomechanical Analysis of Sit to Stand Transition
98
Appendix 6
Statistics
All data analysis was performed using principal component analysis (PCA), which
reduces the dimensionality of the data set in order to obtain the most influential
variable; in this study the most influential segment to perform STS transition was
determined by PCA. The analysis required unit’s normalization, the linear and
angular momentum were normalized with respect to the weight, height and average
CoM velocity of each participant.
Principal Component Analysis of the Whole-Body
In order to identify the momentum variable most influential during the STS
transition cycle along the three axes in the WB CoM PCA analysis was employed.
The set data was arranged into a matrix, which includes six variables (linear and
angular momentum in their three components AP, vertical, and transversal axes (X,
Y, and Z)), at 100 points corresponding to time cycle. Equation 11 shows the
matrix to perform the analysis of the WB CoM data.
Equation 11
Where WBPCA is the WB CoM matrix of the Z-scores of the momentum variables,
Z-px1 is the first value of the Z-score of linear momentum on the AP axis, Z-px
100 is
the last value of the Z-score of linear momentum on the AP axis, Z-Lx1 is the first
value of the Z-score of angular momentum about the AP axis, Z-Lx100 is the last
value of the Z-score of angular momentum about the AP axis, Z-py1 is the first value
of the Z-score of linear momentum on the vertical axis, Z-py100 is the last value of
the Z-score of linear momentum on the vertical axis, Z-Ly1 is the first value of the
Biomechanical Analysis of Sit to Stand Transition
99
Z-score of angular momentum about the vertical axis, Z-Ly100 is the last value of the
Z-score of angular momentum about the vertical axis, Z-pz1 is the first value of the
Z-score of linear momentum on the ML axis, Z-pz100 is the last value of the Z-score
of linear momentum on the ML axis, Z-Lz1 is the first value of the Z-score of
angular momentum about the ML axis, Z-Lz100 is the last value of the Z-score of
angular momentum about the ML axis.
The WBPCA matrix was analysed using MatLab routine princomp (principal
component) of the statics toolbox as is shown in Equation 12.
……. Equation 12
Where: coefs is the command to obtain the weighing coefficients, scores is the
command to obtain the tuning coefficients, variances is the command to obtain the
variance, princomp is the command to analyse in order to obtain the the principal
components, zscore is the command to obtain the Z-scores of the matrix, WBCoM is
the WB CoM matrix of the Z-scores of the momentum variables.
The analysis of the significant implication of each component (percent of variance)
was estimated using Equation 13 described as follows:
Percenti = variancesi *100 Σvariancesi
………. Equation 13
Where: Percenti is the variance percent of the “i” component, and variancesi is the
variance of “i” component.
Principal Component Analysis of the body segments
The body segment’s analysis was performed using PCA. The body segment’s
analysis aimed to provide further understanding of the individual performance
during the STS transition. The set of data of each segment was arranged into a
matrix. Equation Equation 14 shows the HAT matrix used during the analysis,

Biomechanical Analysis of Sit to Stand Transition
100
identical analysis matrices were used for the others segments. Every matrix
employs six variables (linear and angular momentum in their three components AP,
vertical, and transversal axes (X, Y, and Z)), at 100 points corresponding to time
cycle.
Segment no. 1 HAT
……….. Equation 14
Where: HAT PCA is the matrix of momentum variables of the HAT segment, 𝑝𝑥1
is the linear momentum on the AP axis, 𝑝𝑦1 is the linear momentum on the vertical
axis, 𝑝𝑧1 is the linear momentum on the ML axis, 𝐿𝑥1 is the angular momentum
about the AP axis, 𝐿𝑦1 is the angular momentum about the vertical axis, and 𝐿𝑧1 is
the angular momentum about the ML axis.
The result of the body segment’s analysis shows the dominant variable to each
segment, and how those components combine the momentum to produce the whole
body motion.

Biomechanical Analysis of Sit to Stand Transition
101
Appendix 7
Kinetic Analysis
The kinetic analysis corresponds to the study of the force exerted by the
participants to the ground (GRF) and the exerted point where the force is applied
over the device (CoP) obtained from the force-plates. This data is required to
estimate the causes of the movement [116]. The contribution that the left and right
sides of the body exerts during the STS transition is recorded by two force-plates.
The kinetic analysis was performed using MatLab software. GRF and CoP data
from the left and right side of the body were synchronized in order to obtain
normalising time and global coordinate system that corresponded to the data used
during the kinematic analysis. GRF and CoP data were filtered using a low pass
band Butterworth with a cut-off frequency of 200 hz, and a frequency of Nyquist of
500 hz. Figure 32 shows a representative image of the data synchronization to 35%
of the STS transition cycle using the same origin of the global coordinates system
where the joints, segments, and CoP positions can be appreciated.
The data analysis involved the calculation of the distances existing between the
segments CoM, joints centre, and CoP to estimate the length of radius arm where
the force is applied. The angles between segments were calculated by using the
Equation Equation 15 using the method ‘angle between two vectors’.
𝜃=cos−1𝐴𝐵1∙𝐴𝐵2||𝐴𝐵1||∙||𝐴𝐵2|| …………. Equation 15
Where 𝜃 is the angle between the two vectors, 𝐴 is the point of rotation centre (joint
centre) in three axes components (x, y, and z), 𝐵1 is the point of the result
magnitude of the first vector (segment “1” CoM), and 𝐵2 is the point of the result
magnitude of the second vector (segment “2” CoM),

Biomechanical Analysis of Sit to Stand Transition
102
Sagittal View Frontal View
a) b)
CoM Head Left Joint Shoulder Right CoM Feet
Joint Neck Left CoM Humerus Right CoP
CoM Trunk Left Joint Elbow Left Joint Hip
Joint Waist Left CoM Forearm Left CoM Thigh
CoM Pelvis Right Joint Hip Left Joint Knee
Right Joint Shoulder Right CoM Thigh Left CoM Shank
Right CoM Humerus Right Joint Knee Left Joint Ankle
Right Joint Elbow Right CoM Shank Left CoM Feet
Right CoM Forearm Right Joint Ankle Left CoP
Figure 32. Markers, joint, and CoP position on sagittal and frontal view at 35% of the STS transition cycle.
Then joint forces were calculated by the inverse dynamics method. The force
experienced at each joint segment was estimated individually following the free
body diagram as shown in Figure 33.

Biomechanical Analysis of Sit to Stand Transition
103
The forces and torque on the joints were calculated using the inverse rigid body
dynamics analysis, which employs the whole segments data and is based on the
second Newton’s Law. Figure 33 shows an example to estimate the forces of the
ankle joint, using the GRF from the force-plate, the flow diagram lead the value to
a correct sum or rest of each value that is involving on the joint on their
respectively axis.
Figure 33. Flow diagram used to obtain the ankle force.
The same method is used to estimate the forces on the remaining joints.
Figure 34 shows an example to estimate the torques of the ankle joint, using the
GRF from the force-plate and the forces from each joint, which were estimate
before, also a flow diagram lead the value to a correct sum or rest of each value that
is involving on the joint on their respectively axis.

Biomechanical Analysis of Sit to Stand Transition
104
Figure 34. Flow diagram to obtain the ankle torque.