Biomechanical characteristics and determinants of instep soccer kick
Upload
khangminh22Category
view
4download
0
�����������������
Citation: Valamatos, M.J.; Abrantes,
J.M.; Carnide, F.; Valamatos, M.-J.;
Monteiro, C.P. Biomechanical
Performance Factors in the Track and
Field Sprint Start: A Systematic
Review. Int. J. Environ. Res. Public
Health 2022, 19, 4074. https://
doi.org/10.3390/ijerph19074074
Academic Editor: Paul B.
Tchounwou
Received: 14 February 2022
Accepted: 25 March 2022
Published: 29 March 2022
Publisher’s Note: MDPI stays neutral
with regard to jurisdictional claims in
published maps and institutional affil-
iations.
Copyright: © 2022 by the authors.
Licensee MDPI, Basel, Switzerland.
This article is an open access article
distributed under the terms and
conditions of the Creative Commons
Attribution (CC BY) license (https://
creativecommons.org/licenses/by/
4.0/).
International Journal of
Environmental Research
and Public Health
Systematic Review
Biomechanical Performance Factors in the Track and FieldSprint Start: A Systematic ReviewMaria João Valamatos 1,2,3,4,* , João M. Abrantes 1,3, Filomena Carnide 1,2,3, Maria-José Valamatos 1
and Cristina P. Monteiro 1,2,5
1 Sport and Health Department, Faculdade de Motricidade Humana, Universidade de Lisboa, Estrada da Costa,1499-688 Cruz-Quebrada, Portugal; [email protected] (J.M.A.); [email protected] (F.C.);[email protected] (M.-J.V.); [email protected] (C.P.M.)
2 Interdisciplinary Center for the Study of Human Performance (CIPER), Faculdade de Motricidade Humana,Universidade de Lisboa, Estrada da Costa, 1499-688 Cruz-Quebrada, Portugal
3 Biomechanics and Functional Morphology Laboratory, Faculdade Motricidade Humana, Universidade Lisboa,Estrada da Costa, 1499-688 Cruz-Quebrada, Portugal
4 Neuromuscular Research Laboratory, Faculdade Motricidade Humana, Universidade Lisboa, Estrada daCosta, 1499-688 Cruz-Quebrada, Portugal
5 Laboratory of Physiology and Biochemistry of Exercise, Faculdade de Motricidade Humana, Universidade deLisboa, 1499-688 Cruz-Quebrada, Portugal
* Correspondence: [email protected]; Tel.: +351-214-149-207
Abstract: In athletics sprint events, the block start performance can be fundamental to the outcome of arace. This Systematic Review aims to identify biomechanical factors of critical importance to the blockstart and subsequent first two steps performance. A systematic search of relevant English-languagearticles was performed on three scientific databases (PubMed, SPORTDiscus, and Web of Science) toidentify peer-reviewed articles published until June 2021. The keywords “Block Start”, “Track andField”, “Sprint Running”, and “Kinetics and Kinematics” were paired with all possible combinations.Studies reporting biomechanical analysis of the block start and/or first two steps, with track and fieldsprinters and reporting PB100m were sought for inclusion and analysis. Thirty-six full-text articles werereviewed. Several biomechanical determinants of sprinters have been identified. In the “Set” position,an anthropometry-driven block setting facilitating the hip extension and a rear leg contribution shouldbe encouraged. At the push-off, a rapid extension of both hips and greater force production seems to beimportant. After block exiting, shorter flight times and greater propulsive forces are the main featuresof best sprinters. This systematic review emphasizes important findings and recommendations thatmay be relevant for researchers and coaches. Future research should focus on upper limbs behaviorand on the analysis of the training drills used to improve starting performance.
Keywords: track and field; sprinters; sprint start; block start; block velocity; biomechanics; kinematics;kinetics; sprint running; initial acceleration; sprint first stance; sprint first two steps
1. Introduction
The 100 m race is perhaps the highlight of the Olympic Games, as it defines who is thefastest man and woman in the world. In this type of event, the block start performance andthe subsequent first two steps can be of critical importance since they have a direct influenceon the overall 100 m time [1–8]. Given the importance of the sprint start, a new body ofresearch has emerged in the past two decades that involved advanced technologies, high-precision methods, and sprinters of a higher performance level. For this reason, severaltechnical (kinematic) and dynamic (kinetic) aspects are currently identified as determinantfactors for starting block phase and initial sprint acceleration performances [1,4,6,9–25].However, the concepts, outcomes, and findings between studies are sometimes inconsistentand difficult to interpret and conclude from. These inconsistencies may be accounted for
Int. J. Environ. Res. Public Health 2022, 19, 4074. https://doi.org/10.3390/ijerph19074074 https://www.mdpi.com/journal/ijerph
Int. J. Environ. Res. Public Health 2022, 19, 4074 2 of 74
by different study designs, methods, technologies of measure (e.g., external reaction forcesunder or on the blocks), statistical analyses, or more importantly, the ambiguity betweensamples of sprinters with different performance levels (e.g., elite, sub-elite, well-trainedor trained) and/or between-group analyses based on the overall 100 m performance(i.e., personal best at 100 m—PB100m), and not on block performance. Although twoimportant narrative reviews have already been published [26,27], to our knowledge, noprevious review conducted a systematic search of literature exploring the inter-individualvariability on block start performance across different performance levels. Thus, the mainpurposes of this systematic review were: (a) determine the biomechanical parameters ofgreatest influence on the sprint start, including the “set” position and push-off phase, andthe first two steps of initial sprint acceleration and (b) identify the kinematic and kineticbiomechanical variables that best differentiate sprinters of different performance levels ineach of those three phases of the sprint start. Considering the impact of the sprint in thesports field and the absence of systematic studies on the kinematics and kinetics factorsthat determine success in block starts and initial sprint acceleration, we hypothesizedthat this systematic review will have a relevant impact on researchers to better designexperimental/intervention studies, as well as constituting relevant support for coaches andathletes in the definition of efficient strategies for performance in the 100 m race.
2. Materials and Methods2.1. Article Search, Eligibility, Inclusion, and Exclusion Criteria
The systematic search of relevant articles was conducted based on PRISMA (PreferredReporting Items for Systematic Reviews and Meta-analyses) guidelines [28]. PubMed, Webof Science, and SPORTDiscus databases were searched for the following mesh terms: “BlockStart” OR “Track and Field” OR “Sprint Running” OR “Acceleration” AND “Kinetics andKinematics” pairing them with all possible combinations. In addition, filters for ‘English’and ‘articles’ have been applied. The last search took place on 30 June 2021.
The inclusion criteria were: publications in English; original observational and ex-perimental studies published in peer-reviewed journals; studies mainly focused on theblock phase and/or one or two of the subsequent stance phases concerning kinematic andkinetic variables; and studies that included track and field sprinters with the indication oftheir PB100m. The following types of records were excluded: conference abstracts; studiesfocused exclusively on the acceleration phase (beyond the first two stance phases) or mainlyfocused on limitations imposed by motor and neurological impairments; studies reportingdata referring to samples evaluated in previously published papers; studies not mentioningthe performance level of the sprinters through their PB100m; case reports; and studieswithout reference to biomechanical variables.
The records identified from the databases with the aforementioned mesh terms wereexported to the reference manager software EndNote X8 that eliminated duplicates. Allarticles’ eligibility was then assessed independently by two reviewers’ authors (JMA andFC). The articles identified were first screened by title and abstract for relevance. Studiesthat raised any uncertainty in exclusion were conservatively retained for subsequent full-text review. The full text of the articles selected as relevant or having raised uncertaintyin exclusion was read and further scrutinized for meeting the inclusion criteria and theirquality was evaluated. Disagreements on final inclusion or exclusion of studies wereresolved by consensus, and if disagreement persisted, a third reviewer (first author, MJV)was available for adjudication. Articles that did not meet the selection criteria or presenteda quality score below 50% were excluded.
2.2. Quality of the Studies
The study quality of each publication was evaluated according to the guidelinesof the Strengthening the Reporting of Observational Studies in Epidemiology (STROBE)Initiative [29]. This analysis was based on 22 items. Title and abstract. Introduction: back-ground and rationale. Methods: study design, setting, participants, variables, data sources,

Int. J. Environ. Res. Public Health 2022, 19, 4074 3 of 74
bias, sample size, quantitative variables, and statistical methods. Results: participants,descriptive data, outcome data, main results, and other analyses. Discussion: key results,limitations, interpretation, and generalizability. Funding. These criteria were scored ona binary scale (1 = yes, 0 = no) independently by two of the authors, and a quality scorewas then calculated for each study by adding its binary scores and dividing the result bythe maximum possible score the study could have achieved. This was then expressed as apercentage to reflect a measure of methodological quality. The quality scores were classifiedas follows (a) low methodological quality for scores < 50%; (b) good methodological qualityfor scores between 50% and 75%; and (c) excellent methodological quality for scores > 75%.The studies with a score lower than 50% [30] were excluded from the systematic review. Theinter-rater reliability analysis was evaluated by the Cohen’s Kappa for nominal variables(2 dimensions) [31]. Standards for strength of agreement for the kappa coefficient were:≤0 = poor, 0.01–0.20 = slight, 0.21–0.40 = fair, 0.41–0.60 = moderate, 0.61–0.80 = substantial,and 0.81–1 = almost perfect [32].
2.3. Data Extraction
An Excel form was used for data extraction. Of each manuscript selected for review,the following information was extracted from each included study: (a) the primary focusof study, means the phase of sprint start, e.g., block phase, first stance, and study design;(b) the main purpose, e.g., associations between biomechanical variables of starting blocksand the sprint start performance, comparing athletes of different performance levels,comparing different footplate spacing and block angles; (c) type of kinematic and kineticanalyses systems used—two dimensional (2D) or three dimensional (3D) analysis andstarting blocks instrumented or placed on force platforms; (d) study sample—the numberper gender of participants, and per level of expertise of participants according with theauthors, and their PB100m; (e) biomechanical measurement protocols—the variables usedto characterize the biomechanical factors of sprint start, number and distance of repeatedtrials; and (f) key findings of sprint start kinematic and kinetic factors.
3. Results3.1. Search Results
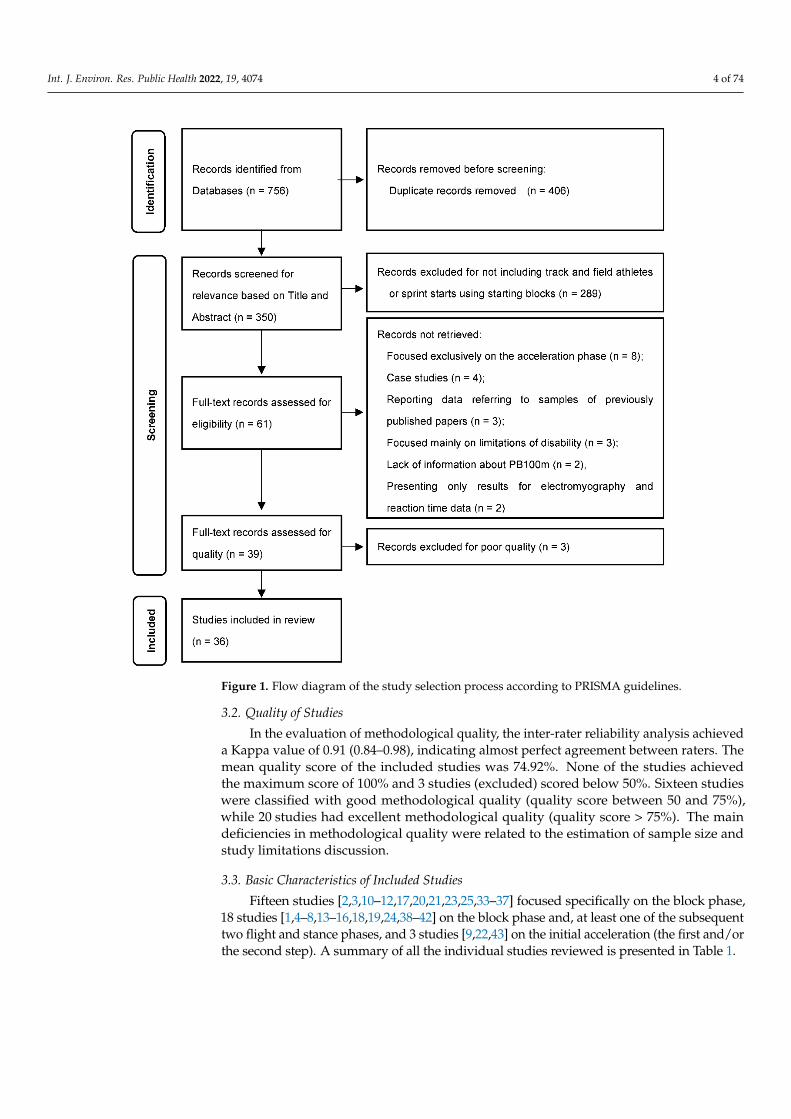
The initial search identified 756 titles in the described databases. With the reference man-ager software, 406 duplicates were eliminated automatically. The remaining 350 articles werethen screened according to title and abstract for relevance, resulting in another 289 studiesbeing eliminated from the database. The full text of the remaining 61 articles was read andanother 22 were rejected for not meeting the inclusion criteria defined for the current studyand 3 studies were excluded for not meeting the quality criteria (quality index < 50%). Atotal of 36 studies was fully reviewed.
Studies were excluded in the screening stage due to not including track and field athletesor sprint starts using starting blocks (n = 289). In the eligibility stage, there were severalreasons for exclusion, namely studies with results focused exclusively on the accelerationphase (n = 8), case studies (n = 4), studies reporting data referring to samples of previouslypublished papers (n = 3) or mainly focused on the limitations of disability (n = 3), lack of in-formation about the PB100m (n = 2) and studies presenting only results for electromyographyand reaction time data (n = 2). Figure 1 presents the complete flow diagram.
Int. J. Environ. Res. Public Health 2022, 19, 4074 4 of 74Int. J. Environ. Res. Public Health 2022, 19, x FOR PEER REVIEW 4 of 69
Figure 1. Flow diagram of the study selection process according to PRISMA guidelines.
3.2. Quality of Studies
In the evaluation of methodological quality, the inter-rater reliability analysis
achieved a Kappa value of 0.91 (0.84–0.98), indicating almost perfect agreement between
raters. The mean quality score of the included studies was 74.92%. None of the studies
achieved the maximum score of 100% and 3 studies (excluded) scored below 50%. Sixteen
studies were classified with good methodological quality (quality score between 50 and
75%), while 20 studies had excellent methodological quality (quality score > 75%). The
main deficiencies in methodological quality were related to the estimation of sample size
and study limitations discussion.
3.3. Basic Characteristics of Included Studies
Fifteen studies [2,3,10–12,17,20,21,23,25,33–37] focused specifically on the block
phase, 18 studies [1,4–8,13–16,18,19,24,38–42] on the block phase and, at least one of the
subsequent two flight and stance phases, and 3 studies [9,22,43] on the initial acceleration
(the first and/or the second step). A summary of all the individual studies reviewed is
presented in Table 1.
Figure 1. Flow diagram of the study selection process according to PRISMA guidelines.
3.2. Quality of Studies
In the evaluation of methodological quality, the inter-rater reliability analysis achieveda Kappa value of 0.91 (0.84–0.98), indicating almost perfect agreement between raters. Themean quality score of the included studies was 74.92%. None of the studies achievedthe maximum score of 100% and 3 studies (excluded) scored below 50%. Sixteen studieswere classified with good methodological quality (quality score between 50 and 75%),while 20 studies had excellent methodological quality (quality score > 75%). The maindeficiencies in methodological quality were related to the estimation of sample size andstudy limitations discussion.
3.3. Basic Characteristics of Included Studies
Fifteen studies [2,3,10–12,17,20,21,23,25,33–37] focused specifically on the block phase,18 studies [1,4–8,13–16,18,19,24,38–42] on the block phase and, at least one of the subsequenttwo flight and stance phases, and 3 studies [9,22,43] on the initial acceleration (the first and/orthe second step). A summary of all the individual studies reviewed is presented in Table 1.
Int. J. Environ. Res. Public Health 2022, 19, 4074 5 of 74
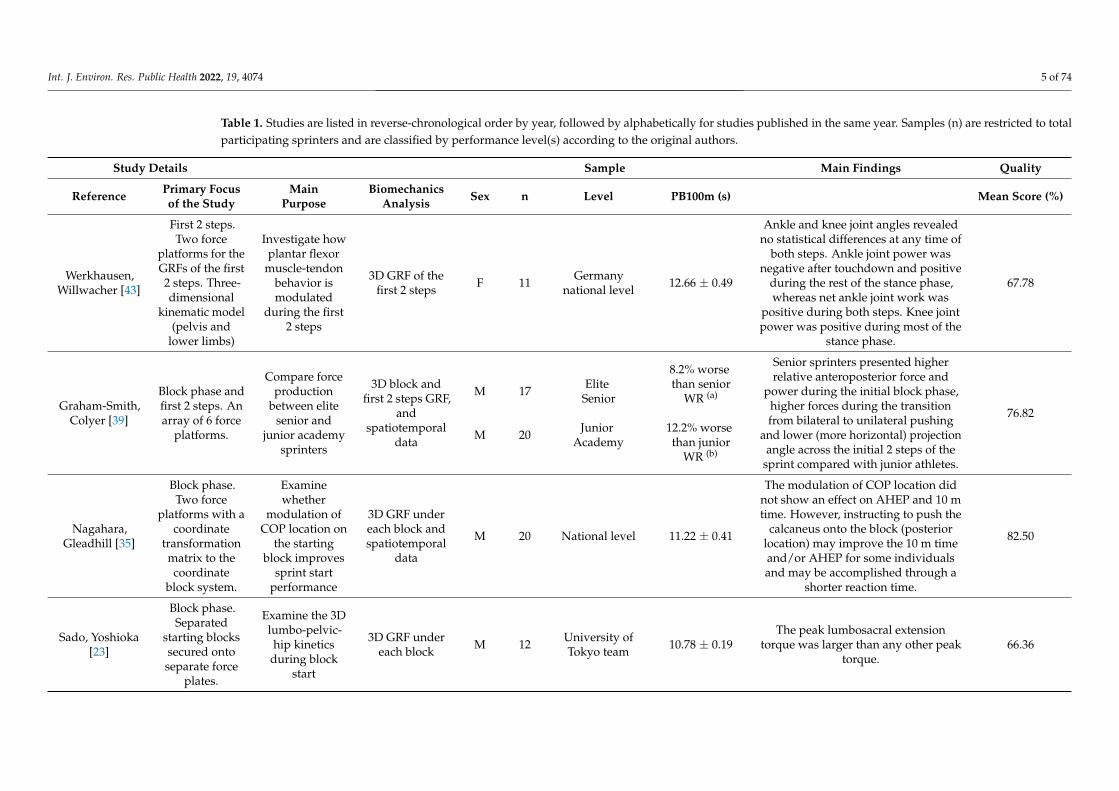
Table 1. Studies are listed in reverse-chronological order by year, followed by alphabetically for studies published in the same year. Samples (n) are restricted to totalparticipating sprinters and are classified by performance level(s) according to the original authors.
Study Details Sample Main Findings Quality
Reference Primary Focusof the Study
MainPurpose
BiomechanicsAnalysis Sex n Level PB100m (s) Mean Score (%)
Werkhausen,Willwacher [43]
First 2 steps.Two force
platforms for theGRFs of the first2 steps. Three-dimensional
kinematic model(pelvis and
lower limbs)
Investigate howplantar flexor
muscle-tendonbehavior ismodulated
during the first2 steps
3D GRF of thefirst 2 steps F 11 Germany
national level 12.66 ± 0.49
Ankle and knee joint angles revealedno statistical differences at any time of
both steps. Ankle joint power wasnegative after touchdown and positive
during the rest of the stance phase,whereas net ankle joint work was
positive during both steps. Knee jointpower was positive during most of the
stance phase.
67.78
Graham-Smith,Colyer [39]
Block phase andfirst 2 steps. Anarray of 6 force
platforms.
Compare forceproduction
between elitesenior and
junior academysprinters
3D block andfirst 2 steps GRF,
andspatiotemporal
data
M
M
17
20
EliteSenior
JuniorAcademy
8.2% worsethan senior
WR (a)
12.2% worsethan junior
WR (b)
Senior sprinters presented higherrelative anteroposterior force and
power during the initial block phase,higher forces during the transitionfrom bilateral to unilateral pushing
and lower (more horizontal) projectionangle across the initial 2 steps of the
sprint compared with junior athletes.
76.82
Nagahara,Gleadhill [35]
Block phase.Two force
platforms with acoordinate
transformationmatrix to thecoordinate
block system.
Examinewhether
modulation ofCOP location on
the startingblock improves
sprint startperformance
3D GRF undereach block andspatiotemporal
data
M 20 National level 11.22 ± 0.41
The modulation of COP location didnot show an effect on AHEP and 10 mtime. However, instructing to push the
calcaneus onto the block (posteriorlocation) may improve the 10 m timeand/or AHEP for some individualsand may be accomplished through a
shorter reaction time.
82.50
Sado, Yoshioka[23]
Block phase.Separated
starting blockssecured ontoseparate force
plates.
Examine the 3Dlumbo-pelvic-hip kinetics
during blockstart
3D GRF undereach block M 12 University of
Tokyo team 10.78 ± 0.19The peak lumbosacral extension
torque was larger than any other peaktorque.
66.36
Int. J. Environ. Res. Public Health 2022, 19, 4074 6 of 74
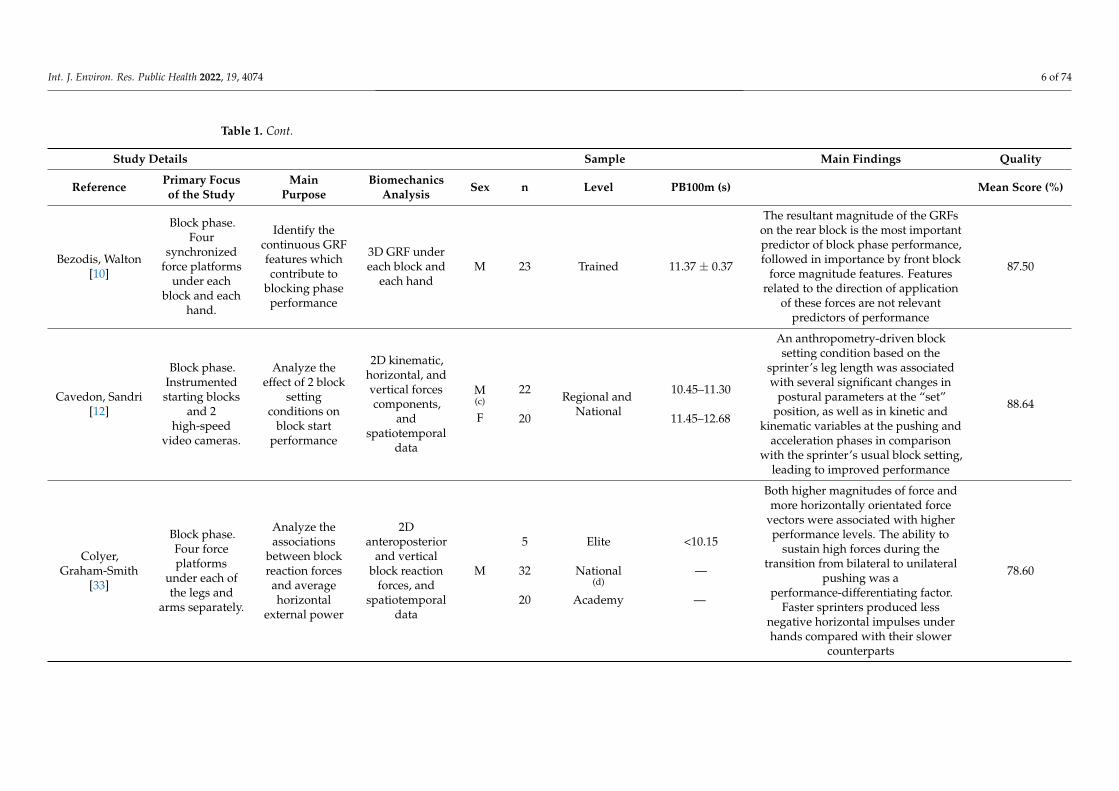
Table 1. Cont.
Study Details Sample Main Findings Quality
Reference Primary Focusof the Study
MainPurpose
BiomechanicsAnalysis Sex n Level PB100m (s) Mean Score (%)
Bezodis, Walton[10]
Block phase.Four
synchronizedforce platforms
under eachblock and each
hand.
Identify thecontinuous GRFfeatures whichcontribute to
blocking phaseperformance
3D GRF undereach block and
each handM 23 Trained 11.37 ± 0.37
The resultant magnitude of the GRFson the rear block is the most importantpredictor of block phase performance,followed in importance by front block
force magnitude features. Featuresrelated to the direction of application
of these forces are not relevantpredictors of performance
87.50
Cavedon, Sandri[12]
Block phase.Instrumentedstarting blocks
and 2high-speed
video cameras.
Analyze theeffect of 2 block
settingconditions on
block startperformance
2D kinematic,horizontal, andvertical forcescomponents,
andspatiotemporal
data
M(c)
F
22
20
Regional andNational
10.45–11.30
11.45–12.68
An anthropometry-driven blocksetting condition based on the
sprinter’s leg length was associatedwith several significant changes in
postural parameters at the “set”position, as well as in kinetic and
kinematic variables at the pushing andacceleration phases in comparison
with the sprinter’s usual block setting,leading to improved performance
88.64
Colyer,Graham-Smith
[33]
Block phase.Four forceplatforms
under each ofthe legs and
arms separately.
Analyze theassociations
between blockreaction forcesand averagehorizontal
external power
2Danteroposterior
and verticalblock reaction
forces, andspatiotemporal
data
M
5
32
20
Elite
National(d)
Academy
<10.15
—
—
Both higher magnitudes of force andmore horizontally orientated force
vectors were associated with higherperformance levels. The ability to
sustain high forces during thetransition from bilateral to unilateral
pushing was aperformance-differentiating factor.
Faster sprinters produced lessnegative horizontal impulses underhands compared with their slower
counterparts
78.60
Int. J. Environ. Res. Public Health 2022, 19, 4074 7 of 74
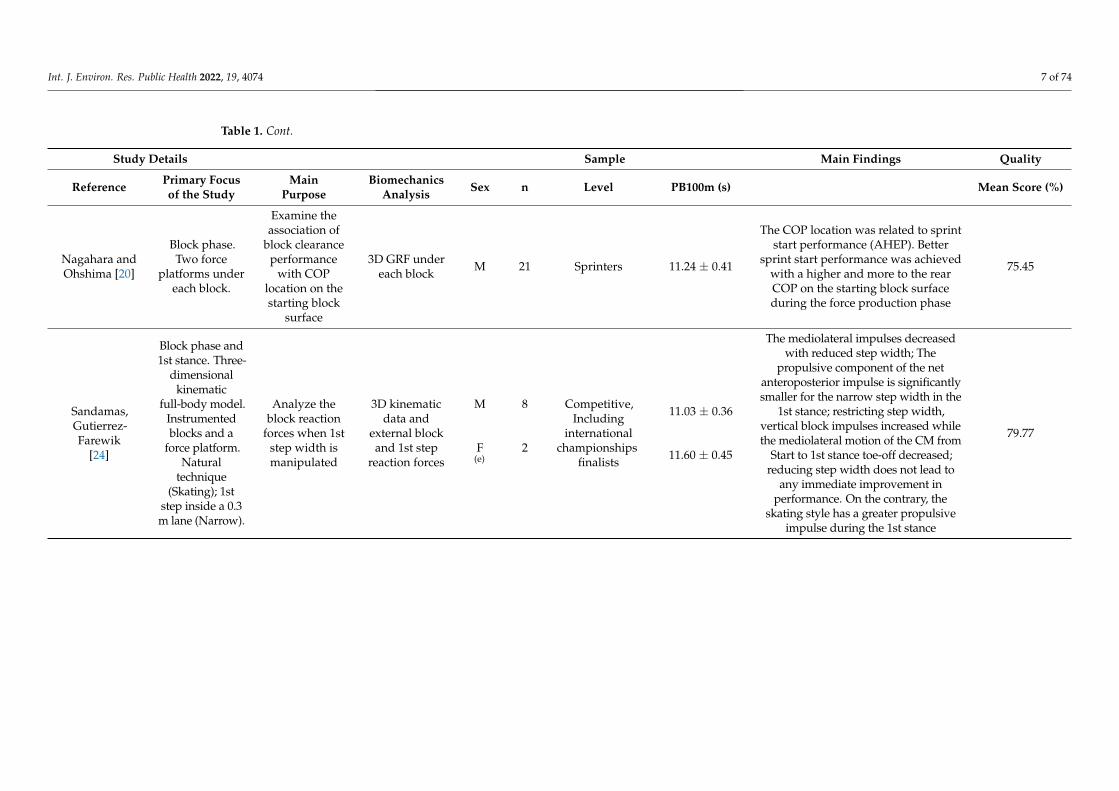
Table 1. Cont.
Study Details Sample Main Findings Quality
Reference Primary Focusof the Study
MainPurpose
BiomechanicsAnalysis Sex n Level PB100m (s) Mean Score (%)
Nagahara andOhshima [20]
Block phase.Two force
platforms undereach block.
Examine theassociation of
block clearanceperformance
with COPlocation on thestarting block
surface
3D GRF undereach block M 21 Sprinters 11.24 ± 0.41
The COP location was related to sprintstart performance (AHEP). Better
sprint start performance was achievedwith a higher and more to the rearCOP on the starting block surfaceduring the force production phase
75.45
Sandamas,Gutierrez-Farewik
[24]
Block phase and1st stance. Three-
dimensionalkinematic
full-body model.Instrumentedblocks and a
force platform.Natural
technique(Skating); 1st
step inside a 0.3m lane (Narrow).
Analyze theblock reaction
forces when 1ststep width ismanipulated
3D kinematicdata and
external blockand 1st step
reaction forces
M
F(e)
8
2
Competitive,Including
internationalchampionships
finalists
11.03 ± 0.36
11.60 ± 0.45
The mediolateral impulses decreasedwith reduced step width; The
propulsive component of the netanteroposterior impulse is significantlysmaller for the narrow step width in the
1st stance; restricting step width,vertical block impulses increased whilethe mediolateral motion of the CM from
Start to 1st stance toe-off decreased;reducing step width does not lead to
any immediate improvement inperformance. On the contrary, the
skating style has a greater propulsiveimpulse during the 1st stance
79.77

Int. J. Environ. Res. Public Health 2022, 19, 4074 8 of 74
Table 1. Cont.
Study Details Sample Main Findings Quality
Reference Primary Focusof the Study
MainPurpose
BiomechanicsAnalysis Sex n Level PB100m (s) Mean Score (%)
Aeles, Jonkers[9]
First stancephase.
3D kinematicfull-body model.Force platformto measure theGRFs of the 1st
step.
Compare youngand adult
sprinters inkinematic and
kineticparameters
during the 1ststance phase
3D kinematicsand 3D GRF of
1st step
MF
(f)
MF
79
1110
AdultWell-trained
YoungWell-trained
10.67 ± 0.1412.12 ± 0.41
11.47 ± 0.3412.75 ± 0.36
Well-trained young and adultsprinters have no differences in anklejoint stiffness, range of dorsiflexion orplantar flexor moment. Surprisingly,the young sprinters show a greater
maximal and mean ratio of horizontalto total GRF. Adult sprinters havemore MTU shortening and higher
maximal MTU shortening velocities inall plantar flexors and in the rectus
femoris.
80.68
Brazil, Exell [11]
Block phase.Force
instrumentedstarting blocks.
Three-dimensional
kinematic lowerlimb model.
Explore therelationships
between lowerlimb jointkinetics,
external forceproduction andstarting blockperformance
3D blockreaction forces
and 3Dkinematics
M 17 Sprinters 10.67 ± 0.32
86% of the variation in blockperformance is explained by the
horizontal force applied to the frontand rear blocks, and at the joint level
55% of the variation in blockperformance is explained by averagerear ankle extensor moment, front hip
extensor moment and front kneepositive extensor power.
87.73
Brazil, Exell [4]
Block phase and1st stance.
Three-dimensional
kinematic lowerlimb model.
Force platformto the
GRFs—1st step.
Examine lowerlimb joint
kinetics duringthe block and
1st stancephases
3D kinematicsand 3D blockand 1st step
reaction forces
M 10 Sprinters 10.50 ± 0.27
The asymmetrical nature of the blockphase is most pertinent at the kneejoint, and the leg extensor energy ispredominantly generated at the hipjoint in both the front and the rearblock whereas during 1st stance,
energy generation favors the anklejoint as a result of a significantreduction in relative hip work.
83.18

Int. J. Environ. Res. Public Health 2022, 19, 4074 9 of 74
Table 1. Cont.
Study Details Sample Main Findings Quality
Reference Primary Focusof the Study
MainPurpose
BiomechanicsAnalysis Sex n Level PB100m (s) Mean Score (%)
Ciacci, Merni[38]
Block phase andfirst 2 steps.
3D kinematicfull-body
model.
Comparekinematicdifferences
between sexes
3D kinematicdata
MF
MF
66
44
Elite
World-Class
10.74 ± 0.2111.95 ± 0.2410.03 ± 0.1411.10 ± 0.17
The start kinematics is only partiallyaffected by sex (men have shorter
pushing phase, higher blockhorizontal velocity, and shorter contacttimes of first 2 steps), whereas a biggerrole is played by the performance level(faster sprinters have CM closer to theground and a more flexed front kneein the “set” position, longer pushingphase, lower block vertical velocity,
and shorter contact times/longer flighttimes in first 2 steps.
85.23
Coh, Peharec [5]
Block phase andfirst 2 steps.
Twoindependent
force platformsfor 2
independentstarting block
pads.3D kinematic
full-bodymodel.
Compare thekinematic andkinetic factorsbetween faster
and slowerhigh-levelsprinters
3D GRF undereach block andspatiotemporal
data
M6
6
Faster
Slower
10.66 ± 0.18
11.00 ± 0.06
Faster sprinters show motor patternsof greater force development (rearblock total force, rear block verticalmaximal force, and the rate of force
development) than their slowercounterparts; The importance of other
indicators as block clearance time,block velocity, and block acceleration
was not confirmed in this study.
78.41
Debaere,Vanwanseele
[15]
Block phasethrough until
the start of 2ndtouchdown.
3D kinematicfull-body model
and 2 forceplatforms for
the first 2 steps.
Compare jointpower
generationbetween
well-trainedadult and young
sprinters
3D Kinematicsand 3D GRF ofthe first 2 steps
MF
MF
MF
86
810
56
Well-TrainedAdult
Under 18
Under 16
10.65 ± 0.0711.87 ± 0.14
11.21 ± 0.1112.42 ± 0.25
11.56 ± 0.0812.86 ± 0.30
Adult sprinters generated more jointpower at the knee during the 1st step
compared to young sprinters,inducing longer step length and
therefore higher velocity. Youngerathletes employed a different
technique: the hip contributes more tototal power generation, whereas thecontribution of the knee is far less.
82.95
Int. J. Environ. Res. Public Health 2022, 19, 4074 10 of 74
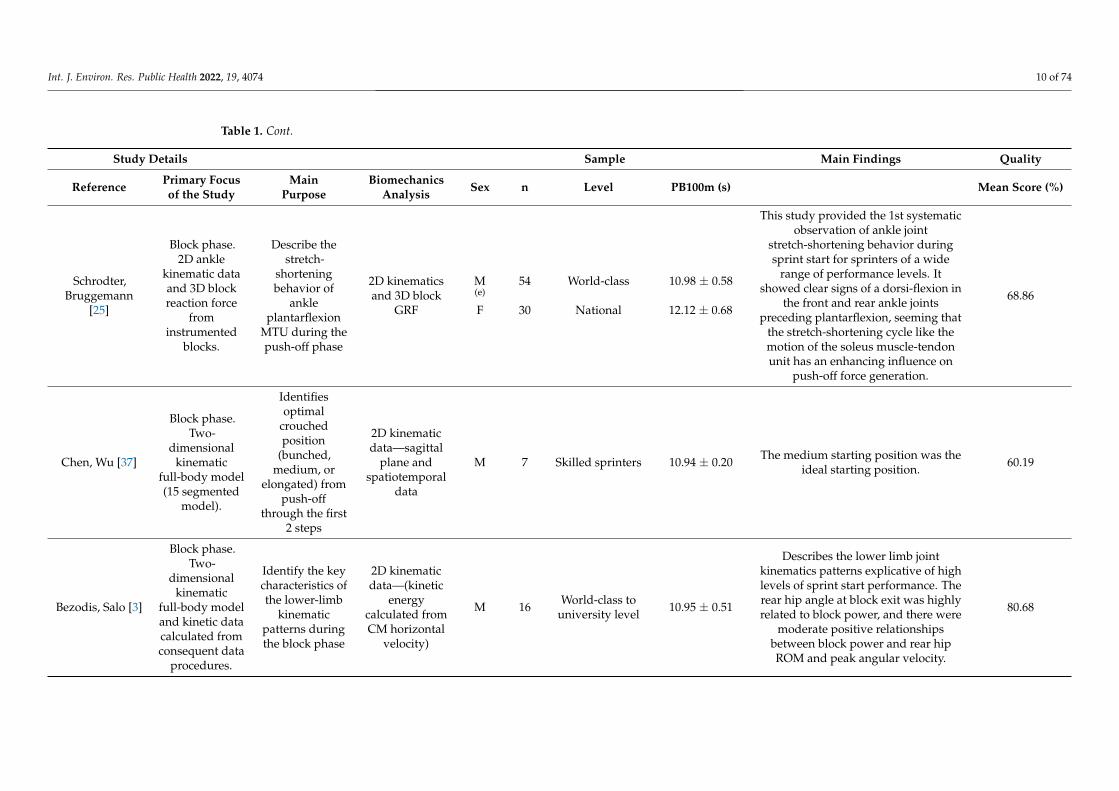
Table 1. Cont.
Study Details Sample Main Findings Quality
Reference Primary Focusof the Study
MainPurpose
BiomechanicsAnalysis Sex n Level PB100m (s) Mean Score (%)
Schrodter,Bruggemann
[25]
Block phase.2D ankle
kinematic dataand 3D blockreaction force
frominstrumented
blocks.
Describe thestretch-
shorteningbehavior of
ankleplantarflexion
MTU during thepush-off phase
2D kinematicsand 3D block
GRF
M(e)
F
54
30
World-class
National
10.98 ± 0.58
12.12 ± 0.68
This study provided the 1st systematicobservation of ankle joint
stretch-shortening behavior duringsprint start for sprinters of a wide
range of performance levels. Itshowed clear signs of a dorsi-flexion in
the front and rear ankle jointspreceding plantarflexion, seeming that
the stretch-shortening cycle like themotion of the soleus muscle-tendonunit has an enhancing influence on
push-off force generation.
68.86
Chen, Wu [37]
Block phase.Two-
dimensionalkinematic
full-body model(15 segmented
model).
Identifiesoptimal
crouchedposition
(bunched,medium, or
elongated) frompush-off
through the first2 steps
2D kinematicdata—sagittal
plane andspatiotemporal
data
M 7 Skilled sprinters 10.94 ± 0.20 The medium starting position was theideal starting position. 60.19
Bezodis, Salo [3]
Block phase.Two-
dimensionalkinematic
full-body modeland kinetic datacalculated fromconsequent data
procedures.
Identify the keycharacteristics ofthe lower-limb
kinematicpatterns duringthe block phase
2D kinematicdata—(kinetic
energycalculated fromCM horizontal
velocity)
M 16 World-class touniversity level 10.95 ± 0.51
Describes the lower limb jointkinematics patterns explicative of highlevels of sprint start performance. Therear hip angle at block exit was highlyrelated to block power, and there were
moderate positive relationshipsbetween block power and rear hipROM and peak angular velocity.
80.68
Int. J. Environ. Res. Public Health 2022, 19, 4074 11 of 74
Table 1. Cont.
Study Details Sample Main Findings Quality
Reference Primary Focusof the Study
MainPurpose
BiomechanicsAnalysis Sex n Level PB100m (s) Mean Score (%)
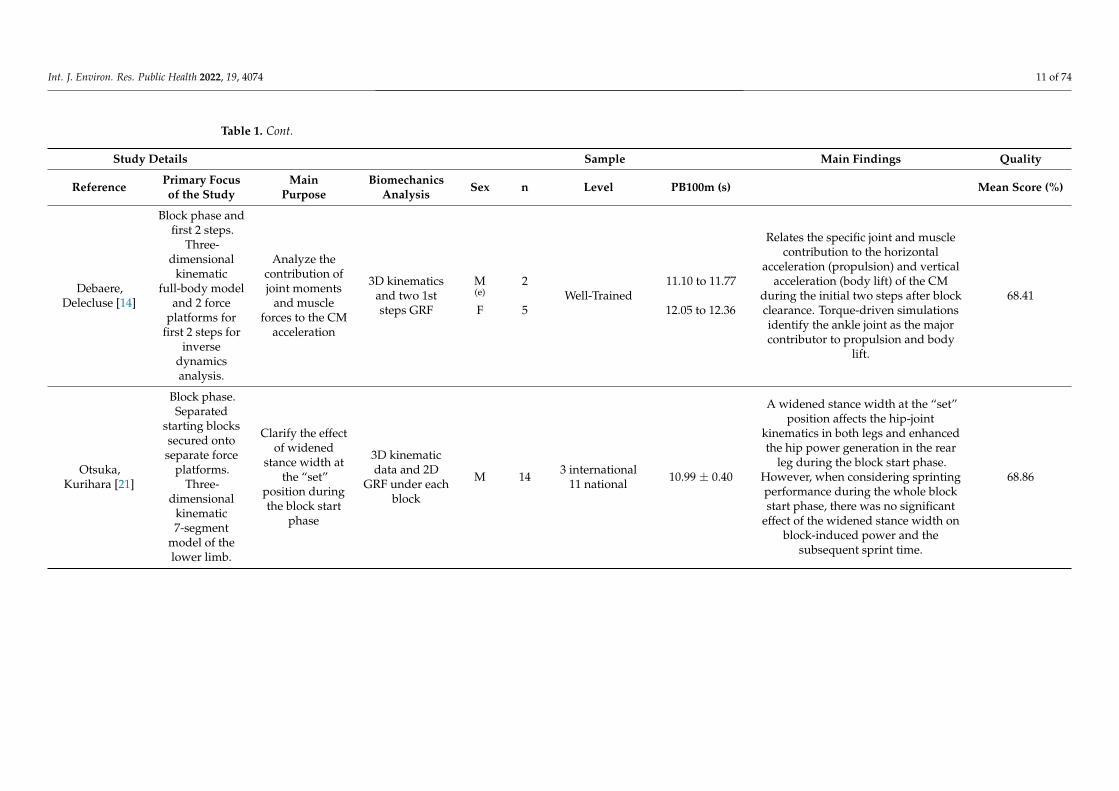
Debaere,Delecluse [14]
Block phase andfirst 2 steps.
Three-dimensional
kinematicfull-body model
and 2 forceplatforms for
first 2 steps forinverse
dynamicsanalysis.
Analyze thecontribution ofjoint moments
and muscleforces to the CM
acceleration
3D kinematicsand two 1ststeps GRF
M(e)
F
2
5Well-Trained
11.10 to 11.77
12.05 to 12.36
Relates the specific joint and musclecontribution to the horizontal
acceleration (propulsion) and verticalacceleration (body lift) of the CM
during the initial two steps after blockclearance. Torque-driven simulationsidentify the ankle joint as the majorcontributor to propulsion and body
lift.
68.41
Otsuka,Kurihara [21]
Block phase.Separated
starting blockssecured ontoseparate force
platforms.Three-
dimensionalkinematic7-segment
model of thelower limb.
Clarify the effectof widened
stance width atthe “set”
position duringthe block start
phase
3D kinematicdata and 2D
GRF under eachblock
M 14 3 international11 national 10.99 ± 0.40
A widened stance width at the “set”position affects the hip-joint
kinematics in both legs and enhancedthe hip power generation in the rear
leg during the block start phase.However, when considering sprintingperformance during the whole blockstart phase, there was no significant
effect of the widened stance width onblock-induced power and the
subsequent sprint time.
68.86
Int. J. Environ. Res. Public Health 2022, 19, 4074 12 of 74
Table 1. Cont.
Study Details Sample Main Findings Quality
Reference Primary Focusof the Study
MainPurpose
BiomechanicsAnalysis Sex n Level PB100m (s) Mean Score (%)
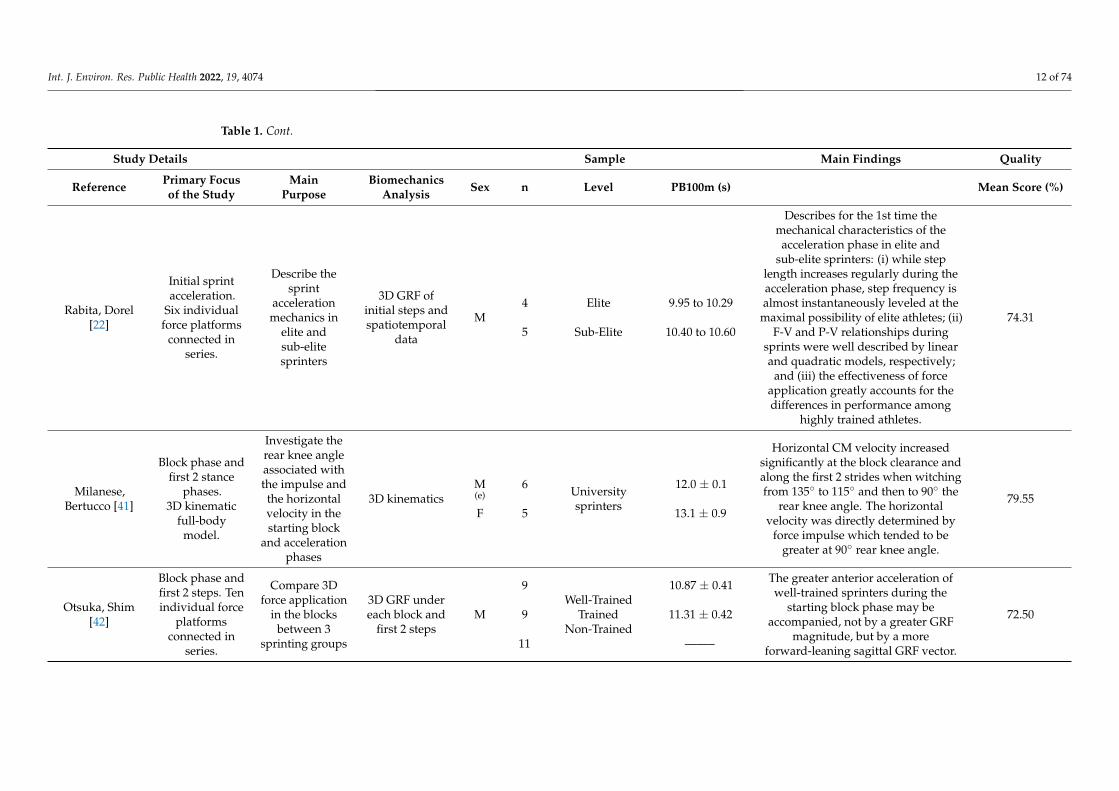
Rabita, Dorel[22]
Initial sprintacceleration.
Six individualforce platforms
connected inseries.
Describe thesprint
accelerationmechanics in
elite andsub-elitesprinters
3D GRF ofinitial steps andspatiotemporal
data
M4
5
Elite
Sub-Elite
9.95 to 10.29
10.40 to 10.60
Describes for the 1st time themechanical characteristics of theacceleration phase in elite and
sub-elite sprinters: (i) while steplength increases regularly during theacceleration phase, step frequency isalmost instantaneously leveled at the
maximal possibility of elite athletes; (ii)F-V and P-V relationships during
sprints were well described by linearand quadratic models, respectively;
and (iii) the effectiveness of forceapplication greatly accounts for thedifferences in performance among
highly trained athletes.
74.31
Milanese,Bertucco [41]
Block phase andfirst 2 stance
phases.3D kinematic
full-bodymodel.
Investigate therear knee angleassociated withthe impulse andthe horizontalvelocity in thestarting block
and accelerationphases
3D kinematicsM(e)
F
6
5
Universitysprinters
12.0 ± 0.1
13.1 ± 0.9
Horizontal CM velocity increasedsignificantly at the block clearance andalong the first 2 strides when witchingfrom 135◦ to 115◦ and then to 90◦ the
rear knee angle. The horizontalvelocity was directly determined by
force impulse which tended to begreater at 90◦ rear knee angle.
79.55
Otsuka, Shim[42]
Block phase andfirst 2 steps. Tenindividual force
platformsconnected in
series.
Compare 3Dforce application
in the blocksbetween 3
sprinting groups
3D GRF undereach block and
first 2 stepsM
9
9
11
Well-TrainedTrained
Non-Trained
10.87 ± 0.41
11.31 ± 0.42
——–
The greater anterior acceleration ofwell-trained sprinters during the
starting block phase may beaccompanied, not by a greater GRF
magnitude, but by a moreforward-leaning sagittal GRF vector.
72.50
Int. J. Environ. Res. Public Health 2022, 19, 4074 13 of 74
Table 1. Cont.
Study Details Sample Main Findings Quality
Reference Primary Focusof the Study
MainPurpose
BiomechanicsAnalysis Sex n Level PB100m (s) Mean Score (%)
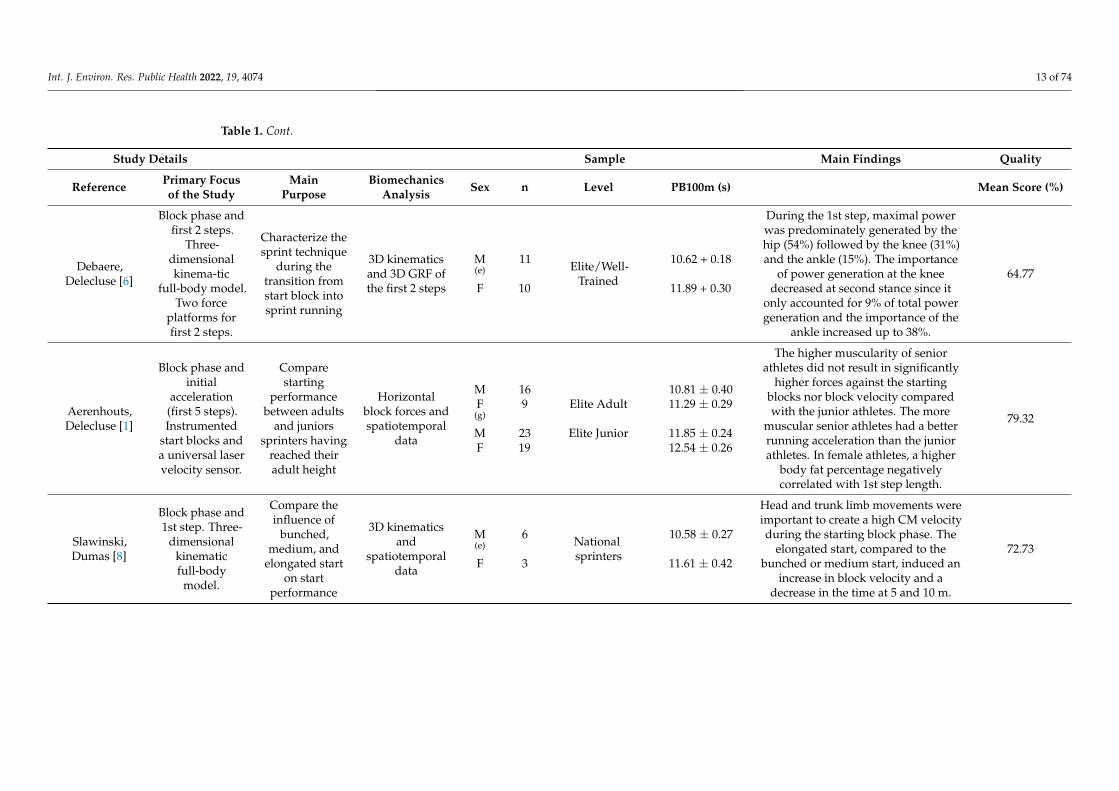
Debaere,Delecluse [6]
Block phase andfirst 2 steps.
Three-dimensionalkinema-tic
full-body model.Two force
platforms forfirst 2 steps.
Characterize thesprint technique
during thetransition fromstart block intosprint running
3D kinematicsand 3D GRF ofthe first 2 steps
M(e)
F
11
10
Elite/Well-Trained
10.62 + 0.18
11.89 + 0.30
During the 1st step, maximal powerwas predominately generated by thehip (54%) followed by the knee (31%)and the ankle (15%). The importance
of power generation at the kneedecreased at second stance since it
only accounted for 9% of total powergeneration and the importance of the
ankle increased up to 38%.
64.77
Aerenhouts,Delecluse [1]
Block phase andinitial
acceleration(first 5 steps).Instrumented
start blocks anda universal laservelocity sensor.
Comparestarting
performancebetween adults
and juniorssprinters having
reached theiradult height
Horizontalblock forces andspatiotemporal
data
MF
(g)
MF
169
2319
Elite Adult
Elite Junior
10.81 ± 0.4011.29 ± 0.29
11.85 ± 0.2412.54 ± 0.26
The higher muscularity of seniorathletes did not result in significantly
higher forces against the startingblocks nor block velocity comparedwith the junior athletes. The more
muscular senior athletes had a betterrunning acceleration than the juniorathletes. In female athletes, a higher
body fat percentage negativelycorrelated with 1st step length.
79.32
Slawinski,Dumas [8]
Block phase and1st step. Three-
dimensionalkinematicfull-body
model.
Compare theinfluence of
bunched,medium, and
elongated starton start
performance
3D kinematicsand
spatiotemporaldata
M(e)
F
6
3
Nationalsprinters
10.58 ± 0.27
11.61 ± 0.42
Head and trunk limb movements wereimportant to create a high CM velocityduring the starting block phase. The
elongated start, compared to thebunched or medium start, induced an
increase in block velocity and adecrease in the time at 5 and 10 m.
72.73
Int. J. Environ. Res. Public Health 2022, 19, 4074 14 of 74
Table 1. Cont.
Study Details Sample Main Findings Quality
Reference Primary Focusof the Study
MainPurpose
BiomechanicsAnalysis Sex n Level PB100m (s) Mean Score (%)
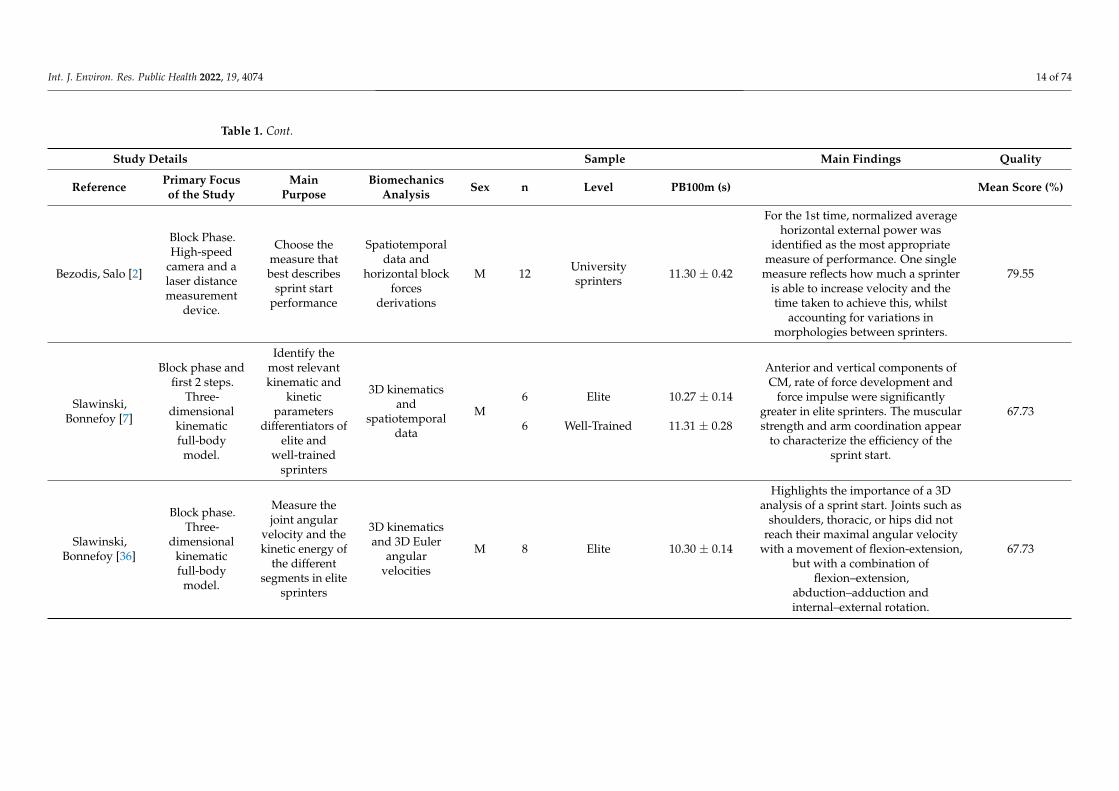
Bezodis, Salo [2]
Block Phase.High-speed
camera and alaser distancemeasurement
device.
Choose themeasure thatbest describes
sprint startperformance
Spatiotemporaldata and
horizontal blockforces
derivations
M 12 Universitysprinters 11.30 ± 0.42
For the 1st time, normalized averagehorizontal external power was
identified as the most appropriatemeasure of performance. One single
measure reflects how much a sprinteris able to increase velocity and thetime taken to achieve this, whilst
accounting for variations inmorphologies between sprinters.
79.55
Slawinski,Bonnefoy [7]
Block phase andfirst 2 steps.
Three-dimensional
kinematicfull-body
model.
Identify themost relevantkinematic and
kineticparameters
differentiators ofelite and
well-trainedsprinters
3D kinematicsand
spatiotemporaldata
M6
6
Elite
Well-Trained
10.27 ± 0.14
11.31 ± 0.28
Anterior and vertical components ofCM, rate of force development and
force impulse were significantlygreater in elite sprinters. The muscularstrength and arm coordination appear
to characterize the efficiency of thesprint start.
67.73
Slawinski,Bonnefoy [36]
Block phase.Three-
dimensionalkinematicfull-body
model.
Measure thejoint angular
velocity and thekinetic energy of
the differentsegments in elite
sprinters
3D kinematicsand 3D Euler
angularvelocities
M 8 Elite 10.30 ± 0.14
Highlights the importance of a 3Danalysis of a sprint start. Joints such as
shoulders, thoracic, or hips did notreach their maximal angular velocity
with a movement of flexion-extension,but with a combination of
flexion–extension,abduction–adduction andinternal–external rotation.
67.73
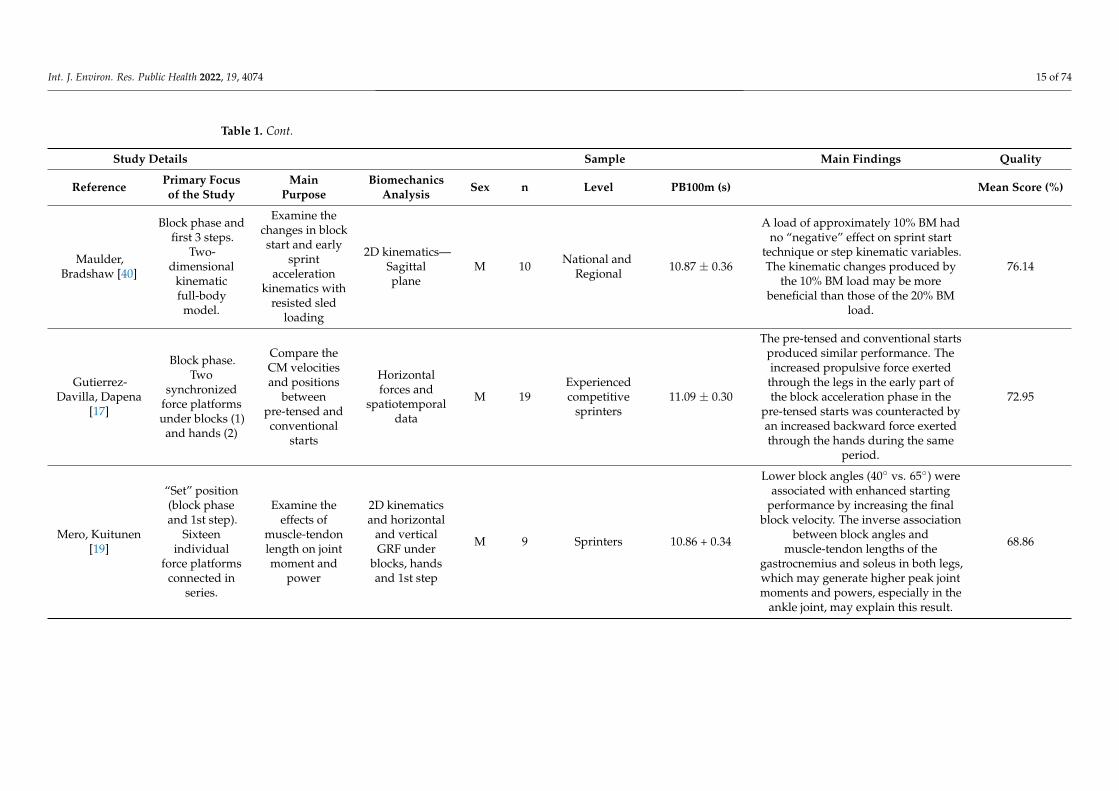
Int. J. Environ. Res. Public Health 2022, 19, 4074 15 of 74
Table 1. Cont.
Study Details Sample Main Findings Quality
Reference Primary Focusof the Study
MainPurpose
BiomechanicsAnalysis Sex n Level PB100m (s) Mean Score (%)
Maulder,Bradshaw [40]
Block phase andfirst 3 steps.
Two-dimensional
kinematicfull-body
model.
Examine thechanges in blockstart and early
sprintacceleration
kinematics withresisted sled
loading
2D kinematics—Sagittalplane
M 10 National andRegional 10.87 ± 0.36
A load of approximately 10% BM hadno “negative” effect on sprint start
technique or step kinematic variables.The kinematic changes produced by
the 10% BM load may be morebeneficial than those of the 20% BM
load.
76.14
Gutierrez-Davilla, Dapena
[17]
Block phase.Two
synchronizedforce platformsunder blocks (1)and hands (2)
Compare theCM velocitiesand positions
betweenpre-tensed andconventional
starts
Horizontalforces and
spatiotemporaldata
M 19Experiencedcompetitive
sprinters11.09 ± 0.30
The pre-tensed and conventional startsproduced similar performance. Theincreased propulsive force exertedthrough the legs in the early part ofthe block acceleration phase in the
pre-tensed starts was counteracted byan increased backward force exertedthrough the hands during the same
period.
72.95
Mero, Kuitunen[19]
“Set” position(block phaseand 1st step).
Sixteenindividual
force platformsconnected in
series.
Examine theeffects of
muscle-tendonlength on jointmoment and
power
2D kinematicsand horizontal
and verticalGRF under
blocks, handsand 1st step
M 9 Sprinters 10.86 + 0.34
Lower block angles (40◦ vs. 65◦) wereassociated with enhanced starting
performance by increasing the finalblock velocity. The inverse association
between block angles andmuscle-tendon lengths of the
gastrocnemius and soleus in both legs,which may generate higher peak jointmoments and powers, especially in the
ankle joint, may explain this result.
68.86

Int. J. Environ. Res. Public Health 2022, 19, 4074 16 of 74
Table 1. Cont.
Study Details Sample Main Findings Quality
Reference Primary Focusof the Study
MainPurpose
BiomechanicsAnalysis Sex n Level PB100m (s) Mean Score (%)
Fortier, Basset[16]
Block phase andfirst 2 steps.
Three-dimensional
full-bodykinematic
model.Instrumented
blocks.
Examine ifkinetic andkinematic
parameterscould
differentiateelite fromsub-elitesprinters
3D kinematicsand horizontal
block forces
M
M
6
6
Elite
Sub-Elite
<10.70
10.70 to 11.40
Four kinetic parameters differentiatingelite from sub-elite sprinters: delay
between the end of rear and front forceoffset, rear peak force, total block time,
and time to rear peak force.
72.73
Coh, Jost [13]
Block phase andfirst 2 steps.
Two-dimensional
kinematicfull-body model.
Instrumentedblocks.
Determine themost importantkinematic and
kineticparameters of
the “set”position and
push-off
Horizontalblock forces, 2Dkinematic andspatiotemporal
data
M
F
13
11
Slovenenational
team
10.73 ± 0.2
11.97 ± 2.6
Identification of three parameters thatbest define an efficient start for both
male and female sprinters: horizontalstart velocity, start reaction time andimpulse of push-off force from the
front starting block.
65.22
Guissard,Duchateau [34]
Block phase.Strain gaugesmounted on
each footplateand behind thestarting block.
Two-dimensional
kinematic frontleg model.
Analyze themechanicalparametersabout EMGactivity at
different frontblock
inclinations
EMG, 2Dkinematics andhorizontal GRFbehind blocks
MF
143 Trained 10.4 to 11.9
Decreasing front block obliquityinduced neural and mechanicalmodifications that contribute to
increasing the block start velocitywithout any increase in the duration of
the push-off phase.
76.36
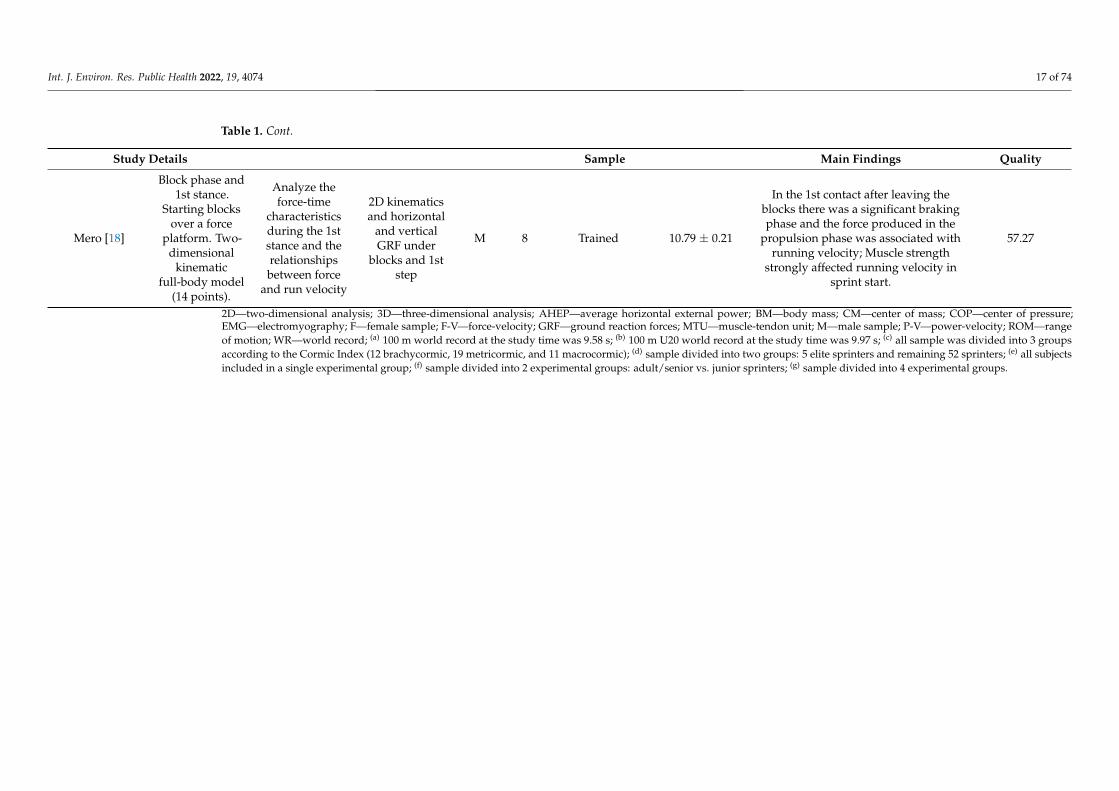
Int. J. Environ. Res. Public Health 2022, 19, 4074 17 of 74
Table 1. Cont.
Study Details Sample Main Findings Quality
Mero [18]
Block phase and1st stance.
Starting blocksover a force
platform. Two-dimensional
kinematicfull-body model
(14 points).
Analyze theforce-time
characteristicsduring the 1ststance and therelationshipsbetween force
and run velocity
2D kinematicsand horizontal
and verticalGRF under
blocks and 1ststep
M 8 Trained 10.79 ± 0.21
In the 1st contact after leaving theblocks there was a significant brakingphase and the force produced in the
propulsion phase was associated withrunning velocity; Muscle strength
strongly affected running velocity insprint start.
57.27
2D—two-dimensional analysis; 3D—three-dimensional analysis; AHEP—average horizontal external power; BM—body mass; CM—center of mass; COP—center of pressure;EMG—electromyography; F—female sample; F-V—force-velocity; GRF—ground reaction forces; MTU—muscle-tendon unit; M—male sample; P-V—power-velocity; ROM—rangeof motion; WR—world record; (a) 100 m world record at the study time was 9.58 s; (b) 100 m U20 world record at the study time was 9.97 s; (c) all sample was divided into 3 groupsaccording to the Cormic Index (12 brachycormic, 19 metricormic, and 11 macrocormic); (d) sample divided into two groups: 5 elite sprinters and remaining 52 sprinters; (e) all subjectsincluded in a single experimental group; (f) sample divided into 2 experimental groups: adult/senior vs. junior sprinters; (g) sample divided into 4 experimental groups.
Int. J. Environ. Res. Public Health 2022, 19, 4074 18 of 74
Study purposes included evaluation of specific block start and initial acceleration vari-ables and their influence on block performance (14 studies) [2–4,6,10,11,14,18,23,24,33,36,40,43];analysis of different “set” position or block configurations (11 studies): location [20] andmodulation [35] of center of pressure (COP) on the starting block surface, different blockspacing [8,12,37] and widened conditions [21], different block plate obliquities [19,25,34],changed “set” position knee angles [41] and block pre-tension [17]; and comparisons be-tween sprinters of different performance levels, despite the subjectivity associated with thedescriptor of the performance level of the athletes (11 studies) [1,5,7,9,13,15,16,22,38,39,42].The ambiguity in the performance level descriptors includes categories such as: elite vs.sub-elite or well-trained [7,16,22], world-class vs. elite [38], faster vs. slower [5], adultwell-trained vs. trained [9,15,42]; elite or well-trained senior vs. junior academy, elite junior,U18 or young well-trained [1,39]; and top sprinters [13]. All studies comparing groups ofathletes included male sprinters, but only 4 [1,9,15,38] included women of different perfor-mance levels. The studies included in the systematic review presented a cross-sectionalstudy design, except for one study that presented a follow-up design [16].
Twenty-one studies evaluated kinetic variables from blocks start placed on forceplatforms (12 studies) [5,10,17–21,23,33,35,39,42] or instrumented starting blocks sensors(9 studies) [1,4,11–13,16,24,25,34]. Twelve studies [4,6,9,14,15,18,19,22,24,39,42,43] used alarge variety of force platforms arrangements to analyze the dynamic characteristics of thefirst steps of the initial acceleration.
Concerning kinematic variables, a bi-dimensional analysis, including one or twohigh-speed digital cameras, was applied in 9 studies [3,12,13,18,19,25,34,37,40], and a 3Dkinematic analysis, including 3 [38], 6 [16], or 8 or more cameras [5–9,21,24,36,41] wasapplied in 11 studies.
Total participants are 766 track and field sprinters, including 179 women and 587 men,and 11 non-trained male subjects [42]. Regarding the sample size of the individual studiesselected, Chen, Wu [37] and Debaere, Delecluse [14] are those with the smallest number,7 participants, and Schrodter, Bruggemann [25] conducted the study with 84 subjects (thelargest sample size). The sample sizes from the other studies ranged from 8 [18,36] to67 [1] subjects, with a mean sample size of 20 participants per study. The mean age of theparticipants in the selected studies ranged from 15.3 years (under 16) to 28 years. For women,PB100m ranged from 11.10 s (world-class) to 13.10 s (university level), with more classificationterms being used, such as “elite” (11.29 to 11.95 s), “well-trained” (11.87 to 12.20 s), “trained”(<11.90 s), or “national level” (11.45 to 12.66) sprinters. Men were classified as “world-class” (10.03 to 10.98 s), “elite” (9.95 to 10.81 s), “sub-elite” (10.40 to 10.95 s), “well-trained”(10.65 to 11.77 s), “trained” (10.40 to 11.37 s), “national level” (10.58 to 11.22 s), “universitylevel” (10.78 to 12.00 s), or just “sprinters” (10.50 to 11.24 s). Among studies, male PB100mranged from 9.95 s to 12.00 s.
Through the analysis of the research setup protocols, it was possible to identify a“standard experimental setup”. Sixty-nine percent of the studies used distances between10 and 30 m, with distances shorter than 10 m used only in 4 studies [5,24,41,43] anddistances greater than 30 m used in 7 studies [10,20,22,33,37–39]. The number of trialsperformed ranged between 3 and 10 in 86% of the studies, but in 3 studies [10,20,38] theparticipants performed 1 or 2 trials, and in 2 studies [40,41] more than 10 trials. Fifty-eightpercent of the studies were carried out on an indoor track, 4 studies [12,37,38,40] on an outdoortrack, 2 studies [24,41] in a laboratory context, and 9 studies [1,8,10,16,20,23,25,42,44] did notmention the measurement location.
3.4. Data Organization and Analysis
There was a very large diversity of kinematic and kinetic variables reported amongselected studies. Since it is impossible to discuss them all, we will highlight those reportedas explicative of high levels of the sprint start performance and that best differentiatefaster from slower sprinters. Based on the main findings highlighted in Table 1, theexplanatory variables of superior performance levels were identified and systematized in a

Int. J. Environ. Res. Public Health 2022, 19, 4074 19 of 74
sequence of tables in Appendixes A–C, related to the “Set” position (Appendix A Table A1),block phase (Appendix B Tables A2 and A3), and first two steps of the initial acceleration(Appendix C Tables A4 and A5). With this strategy of results presentation, it is expectedthat readers will have access to the primary data extracted from all the studies included inthe systematic review. Therefore, Appendix A Table A1 summarizes the kinematic variablesin the “Set” position, showing that anthropometry-driven block setting and muscle-tendonunit (MTU) length have an important role in the block start performance. Furthermore,faster sprinters tend to move their center of mass (CM) closer to the starting line andcloser to the ground. Concerning joint angles, the knee angular position seems to be agreater performance predictor than any other lower limb joint. At the push-off phase(Appendix B Tables A2 and A3, for kinematic and kinetic variables, respectively) a rearhip extension range of motion (ROM) and a rapid extension of both hips appear to bepositively associated with block performance. Moreover, greater average force productionduring the push against the blocks, especially from the rear leg and particularly the hip,appears to be important for performance. A posterior COP location on block surfaces canalso improve sprint performance. Immediately after exiting the blocks, shorter first flightdurations and longer first stance durations (allowing more time to generate propulsiveforce) are the kinematic features of best sprinters (Table A4). During the first two stepsof initial acceleration, higher levels of performance seem to be associated with shorterflight times, longer contact times, and the ability to extend the knee throughout both stancephases (Table A5).
4. Discussion
This paper systematically reviews the kinematic and kinetic biomechanical variablesof the block start and initial sprint acceleration phase that influence performance and bestdifferentiate sprinters of different levels. Despite the large number of variables reported in thereviewed studies it was possible to identify some that effectively best describe the influentialfactors of these events as they are associated with better performance outcomes or bestdifferentiate sprinters of different performance levels. However, notice should be made to thedifficulty in analyzing data between studies as there are still no standards for reporting the data,such as measurement units (e.g., m vs. cm) [12,17,18,35], joint angular measurement normsand conventions [3,4,6,12,13,36,38] and/or data normalization methodologies (e.g., for full-height/lower limb length, body mass/body weight) [2,4,17,22,24,25]. Additionally, there issome subjectivity associated with inconsistent descriptors of performance level [26], confirmedby the variability of the sprinter’s classifications used (e.g., from just sprinters to well-trainedsprinters, elite sprinters, world-class sprinters, or high-level sprinters) [5,7,16,22,36,38,42].Another critical factor that somehow may influence data variability between studies is theperiod of the season in which the data collection took place (e.g., prior to the competitionphase of the indoor season vs. during the competitive indoor season or beginning of thesummer season) [18].
To better understand the determinant factors of sprint start, the findings from thereviewed studies have been organized into three focuses: (i) the “set” position, (ii) thepush-off phase, and (iii) the first two steps of initial acceleration, according to the datapresented in Appendixs A–C.
4.1. The “Set” Position
The “Set” position is the first performance key factor in the block start performancebecause it depends on block settings and the body posture assumed by sprinters. For thequestion: “Is there one optimal “Set” position which should be adopted by sprinters?” theanswer seems to be no. The researched studies [3,38] showed that it is not an importantdifferentiating factor of performance, since it does not present any correlation with PB100mor normalized block power [3]. However, there are some interesting aspects that sprintersshould look out for in a more effective “Set” position [5,12]. The ideal “Set” position
Int. J. Environ. Res. Public Health 2022, 19, 4074 20 of 74
depends on the individual anthropometric features [12], strength [38], and morphologiccharacteristics and motor abilities [13].
4.1.1. Block Settings
The “Set” position depends largely on the anteroposterior block distance, whichdefines the type of start used. There are three types of block starts based on inter-blockspacing: bunched—less than 0.30 m; medium—0.30 to 0.50 m; and elongated—greater than0.50 m [27,37].
Studies that reported block spacing based on the individual sprinter’spreferences [5,12,13,18,35] reported distances between 23.5 ± 1.9 cm (for female sprint-ers; PB100: 11.97 ± 2.6 s) [13] and 32 ± 5 cm (for male sprinters; PB100m: 10.79 ± 0.21) [18].This suggests that most sprinters adopt distances within or very close to the bunched starttype, favoring CM positioning closer to the starting line [7,38]. Slawinski, Dumas [8] havedemonstrated that elongated start settings increase the block velocity (i.e., horizontal CMvelocity at the block clearing [7]), but linked to an increase in the pushing time on theblocks which implies a significantly worse performance at 5 and 10 m compared to thebunched start. The same authors showed that the medium start offers the best compromisebetween the pushing time and the force exerted on the blocks, allowing better times at10 m [8]. Additionally, more recently, Cavedon, Sandri [12] have demonstrated that theanthropometry-driven block setting based on the sprinter’s leg length has an importantrole in the block start performance leading to a postural adaptation that promotes sev-eral kinematic and kinetic advantages [12]. Adjusting inter-block spacing to the relativelengths of the sprinter’s trunk and lower limbs (increasing 25.02% the usually bunchedstart inter-block spacing), allows greater force and impulse on the rear leg and greater totalnormalized average horizontal external power (NAHEP) [12], the latter one identified asthe best descriptor of starting block performance [2].
Other blocks setting features that should be considered in the “set” position arethe feet plate obliquity and the amount of pre-tension exerted on the blocks prior to thegunshot. The block inclination (relative to the track) affects the plantar flexor muscle-tendonunits’ (MTU) initial lengths and determines the muscle mechanics and the external forceparameters during the block phase [19,25,34]. Faster sprinters presumably produce the peaktorque at longer MTU lengths and adopting a more crouched position would allow them toproduce a higher force on the block phase [38]. Research data shows that reductions in bothfootplates’ inclinations (from 65 to 40◦), meaning more muscle-tendon pre-stretch, lead toacute increases in block velocity and higher peak joint moments and powers, especiallyin the ankle [19]. Reductions in front block inclination alone (from 70 to 30◦) also acutelyincrease block velocity without affecting push-off phase duration [34]. In another study [25],however, a greater mean rear block horizontal force was achieved by switching the rearfoot to a steeper position (to 65◦). This potential conflict between evidence might havearisen from differences in the location of the COP and the length of the footplates’ surfacebetween studies since a better sprint start performance is accomplished with a higher andmore to the rear COP on the starting block surface [20,35]. Conversely, a pre-tensionedstart does not seem to yield a performance advantage over a conventional start, becausethe increase in the propulsive force of the lower limbs is reversed by an increase in the backforce exerted through the hands during the same period [17].
4.1.2. Sprinter Body Posture
Apart from block configuration, the choice of the sprinter’s body posture also de-termines the effectiveness of the “Set” position on the subsequent block push-off phase.The horizontal distance between starting line and the vertical projection of the CM tothe ground in the “Set” position (XCM) [7] is a factor that differentiates sprinters withdifferent performance levels. As said before, faster sprinters tend to move their CM closerto the starting line [7,38] and closer to the ground [38]. Elite (PB100: 10.27 ± 0.14 s) andwell-trained (PB100: 11.31 ± 0.28 s) male sprinters showed XCM of 22.9 and 27.8 cm, re-
Int. J. Environ. Res. Public Health 2022, 19, 4074 21 of 74
spectively [7]. Likewise, world-class (PB100: 11.10 ± 0.17 s) and elite (PB100: 11.95 ± 0.24 s)female sprinters presented XCM of 16.2 and 24.8 cm, respectively [38]. This more crouchedposition is only possible due to the high explosive strength of best sprinters, which allowsthem to produce higher levels of strength in the blocks [38] and reduce the horizontal traveldistance of the CM. This body position is complemented by a more advanced shoulderposition, putting more tension on the arms, allowing greater blocking speed during thesubsequent phase [7].
Related to sprinter joint angles configuration in the “set” position, Milanese andBertucco [41] have shown that horizontal CM velocity at the block take-off and along thefirst two steps increases significantly when the rear knee angle is set to 90◦ instead of 135◦
or 115◦. A 90◦ rear knee angle allows for a better push-off of the rear leg than larger angles,showing such condition may be a strategy that allows some elite sprinters to maximize theirstrength capacity [41]. A more flexed front knee may facilitate the optimal joint momentproduction, but only in sprinters with exceptionally high levels of explosive strength [38].
4.2. The Push-Off Phase
The “block-phase” or “push-off phase” in the starting blocks initiates immediatelyafter the gunshot and is considered a complex motor task that helps to determine sprintstart performance [1]. Reaction time is the first factor in the time sequence of the blockphase and it is the period from the gun signal to the first measurable change of pressuredetected in the instrumented blocks [16]. While a sprinter’s ability to react is undeniablyimportant, it is related to the information-processing mechanisms that do not seem tocorrelate with the performance level [7,45] and, therefore, is beyond the scope of our review(for a review of factors that affect response times, see Milloz, Hayes [46]). Having reacted,the aim of the block phase is to maximize horizontal velocity in as little time as possible.The motion variables during the block phase are, therefore, the focus of this section.
4.2.1. Push-Off Kinematics Analysis
The efficiency of the starting action depends mainly on the compromise between horizon-tal start velocity (or block velocity) and the block time (referring to the time elapsing from thefirst movement at the “set” position to the exiting from the block [7]), resulting in the horizon-tal start acceleration [13]. Despite the horizontal block velocity could be considered the mainparameter for an efficient sprint start [13], it cannot be used solely [2] because an increasedblock velocity could be due to either an increase in the net propulsion force generated or to anincreased push-off duration [2,18]. Thus, best sprinters tend to present higher block velocityand greater block acceleration than slower sprinters [1,5,7,13,16,22,39,42], because they areable to produce a greater impulse in a shorter time [2,5,36] and optimize their force produc-tion on the blocks [16,19]. In fact, if sprinters increase their anteroposterior force impulse(FI = force × time) from a longer block time, they decrease their block acceleration [2,42] andthe performance at 5 and 10 m [8]. Studies comparing data between sprinters of differentperformance levels mostly show higher block velocities (3.38 ± 0.10 vs. 3.19 ± 0.19 m·s−1;3.48 ± 0.05 vs. 3.24 ± 0.18 m·s−1; 3.61 ± 0.08 vs. 3.17 ± 0.19 m·s−1; and 3.36 ± 0.15 vs.3.16 ± 0.18 m·s−1) [5,7,22,33] and greater block accelerations (9.5 vs. 8.8 m·s−2; 8.2 vs.7.9 m·s−2; 9.72 vs. 8.4 m·s−2; and 7.47 vs. 7.35 m·s−2) [1,5,7,42] for faster sprinters. Fur-thermore, higher performance levels also appear to be slightly related to lower block verticalvelocities [38] and more horizontal CM projection angles (i.e., resultant direction from the CMhorizontal and vertical block exit velocities) [33,39].
Lower limbs joints pattern during the pushing phase (i.e., from movement onset untilblock exit) is mostly associated with extension movements, especially on the hips andknees [3,4,6,25,36]. The front leg joints typically extend through a considerable ROM ina proximal-to-distal extension pattern [3], reaching their maximum at the beginning ofthe flight phase (e.g., hip: 183.2 ± 6.8◦, knee: 177.4 ± 5.2◦, and ankle: 133.1 ± 6.7◦) [6].Contrarily, the rear leg does not exhibit the same proximal-to-distal extension strategy, withthe knee reaching its peak angular velocity before the hip and the ankle [3,36]. This happens
Int. J. Environ. Res. Public Health 2022, 19, 4074 22 of 74
perhaps due to considerably less ROM of the rear knee compared to the front knee [3], as itstarts from a more extended angle in the “set” position (e.g., rear knee: 120.7 ± 9.7◦; frontknee: 91.0 ± 9.8◦). The movement of the ankles is more complex because it involves firsta dorsiflexion and after an extension resulting in a stretch-shortening cycle of the tricepssurae muscle [3,6,25,36]. The duration of the ankle’s flexion is greater for the rear ankle(50% of the block phase) than for the front ankle (20% of the block phase) [36]. Experimentalmanipulations on footplates’ inclinations [19,34] have shown an inverse association betweenblock angles and muscle-tendon lengths of the gastrocnemius and soleus, highlightingthat block angles steeper than 65◦ could have disadvantageous effects on plantar flexorfunction [19]. Peak angular velocities at both hips are reached by a combination of flexion–extension, abduction–adduction, and internal–external rotation [23,36], reinforcing theimportance of a 3D analysis of the sprint start [36]. Whilst there is a consistent trendamong sprinters in the joint angular velocity sequence during the block phase, the lackof comparative data between sprinters of different performance levels does not allow tohighlight the technical aspects critical to success. However, a rapid hip extension shouldbe one of the first aspects to consider on a sprinter’s technique during the start, as peakangular velocities at both hips and rear hip range of extension are positively associatedwith block power (r = 0.49) [3].
Although upper body kinematics in the push-off phase has been the focus of a smallnumber of studies, some important findings are noteworthy. The action of the upper limbsis more variable between sprinters than that observed for the lower limbs [36]. Despitethis, it is possible to recognize a 3D movement pattern for shoulders and trunk with acombination of flexion–extension, abduction–adduction, and internal–external rotationmovements, while the elbows exhibit an extension and pronation movement [36]. Thevelocity of the rear shoulder tends to be slightly greater than that of the other joints, butthe peak resultant angular velocities at the upper limb joints are comparable to those atlower limbs during the push-off phase, particularly that of both knees and front ankle [36].However, there is no evidence linking different upper limb kinematic patterns with anyblock phase performance predictor, and further research is needed to compile relevantrecommendations for athletes and coaches.
4.2.2. Push-Off Kinetic Analysis
According to Newton’s second law of motion, horizontal CM acceleration requires netpropulsive forces to be applied to the athlete’s body in the sprinting direction. Therefore,as said before, the horizontal force impulse, made up by the mean horizontal force andpush-off time, is the determining factor of the horizontal velocity at block exit [2,5,36,42].The relationship between these factors (i.e., horizontal force and push-off time) shows thatthe application of a greater amount of horizontal force is a key performance factor [42], asan increase in the time action (block time) conflicts with the criterion for 100 m performance:‘shortest time possible’. Thus, best sprinters generate greater average forces [10,22], higherrates of force development [7,25], and larger net [7] and horizontal [5] block impulsesthan their slower counterparts. Likewise, Graham-Smith, Colyer [39] comparing seniorto junior athletes also showed that sprinters with faster PB100m (senior athletes) exhibithigher relative horizontal force during the initial block phase and higher forces duringthe transition from bilateral to unilateral pushing [39]. The evident importance of theforce generated against the blocks for proficient execution of the starting block phase hasencouraged researchers to gain a deeper understanding of the kinetic determinants ofsuch a crucial phase of sprinting. Bezodis, Salo [2] tried to find the push-off performancemeasure that was more adequate, objective, and possible to quantify in the field. Fromtheir analysis, the NAHEP was identified as the most appropriate measure of performancebecause it objectively reflects, in a single measure, how much sprinters are able to increasetheir velocities and the associated length of time taken to achieve this, whilst accounting forvariations in morphologies between sprinters [2]. Later, the identification of the magnitudeof the force applied to both blocks and their optimal orientation as major determinants
Int. J. Environ. Res. Public Health 2022, 19, 4074 23 of 74
of performance encouraged researchers to gain a deeper understanding of the push-offforces applied against each block separately. Consequently, some studies support theimportance of the force generated by the front leg for forwards propulsion [6,42] and showthat faster sprinters are able to produce higher force impulses in the front block than slowersprinters [5,33] (for example: 221.3 ± 15.8 N·s vs. 178.3 ± 13.1 N·s for faster and slowersprinters, respectively [5]). Colyer, Graham-Smith [33] reinforce this feature highlightingthat higher front block force production during the transition (when the rear foot leaves theblock, 54% of the block push) and a more horizontally orientated front block force vectorin the block phase (81–92%) are important performance-differentiating factors. However,other evidence ensures that the rear block force magnitudes are the most predictive externalkinetic features of block power [10,33] and sprint performance [5,7,12,16]. For example, Coh,Peharec [5] found that a faster group of sprinters (PB100m = 10.66 ± 0.18 s; 913 ± 89.23 N)produced greater total forces against the rear block than a group of slower sprinters(PB100m = 11.00 ± 0.06 s; 771 ± 55.09 N). A longer relative rear leg push (i.e., as a percentageof the total push-off phase) is also positively associated (r = 0.53 [3]) with greater blockpower [3,10] and is present in sprinters with faster PB100m [5,7,33]. Modulations of theCOP on the starting block surface showed that COP location may also be related to initialsprint performance [20,35]. Better sprint start performance appears to be achieved with ahigher and more to the rear COP during the force production phase [20]. Thus, athletes andcoaches should keep in mind that pushing the calcaneus onto the block (posterior location)may improve the 10 m time and/or horizontal external power for some individuals [35].
Forces under the hands have been reported in relatively few studies [10,33,42], show-ing somewhat contradictory results. While some point to a primary support role [42],others point out that the best athletes produced less negative horizontal impulse underhands compared with their slower counterparts [33]. Therefore, the importance of thehands’ kinetics during the push-off phase remains unclear and should be the subject offuture research.
In addition to external kinetic analyses, which provide valuable insight into startingblock performance, the analysis of internal kinetics (i.e., joint kinetics) helps to increase theunderstanding of the segment motions that are responsible for CM acceleration. Recentresearch of joint kinetics has shown that 55% of the variance in NAHEP of a group ofsprinters with a PB100m of 10.67 s was mainly accounted for by rear ankle joint moment(23%), front hip joint moment (15%), and front knee joint power (15%). The remaining2% was shared by the remaining lower limbs joint kinetic variables [11]. In the rear block,the magnitude of the horizontal force produced is determined by the rear hip extensormoment and the rear hip extensor power coupled with large ankle joint plantarflexionmoment [4,11,19], without any significant knee joint contribution [4,11]. At the front block,a proximal–distal pattern of peak joint power is evident [4], highlighting a strategy oftenadopted in power demanding tasks, with the main periods of positive extensor powerat the front ankle and knee occurring after the rear foot has left the block [4]. In a studywith 12 sprinters from the University of Tokyo team (PB100m: 10.78 ± 0.19 s), Sado,Yoshioka [23] showed that the peak lumbosacral extension moment was significantly largerthan any other lumbosacral and lower-limb moment, being positively correlated with thestarting performance. This peak value appeared in the double-stance phase where both hipjoints exerted extension moments. The aforementioned evidence supports the findings ofSlawinski, Bonnefoy [36] who showed that the lower limbs and the head–trunk segmentsare the two main segments that contribute to the kinetic energy of the total body. Upperlimbs contribute 22% to the total body kinetic energy, demonstrating that their actions inthe pushing phase on the blocks are not negligible [36].
4.3. The First Two Steps
The primary goal of the first steps is to generate a high horizontal velocity [40]. How-ever, the transition between block start and the first steps represents a specific biomechanicalparadigm: integrate temporal and spatial acyclic movements into a cyclic action [5]. The
Int. J. Environ. Res. Public Health 2022, 19, 4074 24 of 74
efficiency of this transition depends on the biomechanical demands of the first stances afterblock clearance, which are very different from the other stances during acceleration [14].The sprinter aims to generate maximal forward acceleration during the transition from startblock into sprint running [2,14,22,42] while generating sufficient upward acceleration toerect itself from a flexed position in the start blocks to a more extended position [6,14]. Spe-cific technical (kinematic) and dynamic (kinetic) skills are therefore needed to successfullyachieve this transition, and they are the focus of this section.
4.3.1. First Two Steps Kinematic Analysis
The primary goal of the initial steps of a sprint running is to generate a high hor-izontal sprint velocity, which results from the product of the length and frequency ofthe sprinter’s steps [22,40]. Spatiotemporal parameters have shown that the sprinter’sstep length increases regularly during the acceleration phase, while step frequency is al-most instantaneously leveled to the maximum possible [22]. Typically, the step frequencyreaches the maximal values very quickly (80% at the first step and about 90% after thethird step) [22], achieving around 4 Hz immediately after block exit [26,40]. The lengthof the first steps is more variable between sprinters, ranging from 0.82 to 1.068 m (seniorfemales) [1,38] or 0.85 to 1.371 m (senior males) [1,7] on the first step, and from 1.06 to1.30 m (senior females) [1,13] or 1.053 to 2.10 m (senior males) [7,37] on the second step.Despite this variability, step length tends to be longer in faster sprinters, particularly inthe first step (e.g., 1.371 ± 0.090 vs. 1.208 ± 0.087 m [7]; 1.30 ± 0.51 vs. 1.06 ± 0.60 m [5];1.135 ± 0.025 vs. 0.968 ± 0.162 m [38]), exhibiting an increase of about 14 cm for every 1 sless in PB100m [38]. This may be a consequence of the lower vertical velocity of the CM atthe block clearing shown by faster sprinters, allowing them to travel a longer distance de-spite shorter flight times [38]. Indeed, the kinematics of faster sprinters is also characterizedby a tendency to assume long ground contact times in the first two steps (e.g., mean firstcontact duration for Diamond League sprinters is 0.210 s for males and 0.225 s for females,which is greater than those of lower-level Italian junior sprinters: 0.176 and 0.166 s, respec-tively), associated to short flight times (0.045 and 0.064 s, for the first flight of world-classand elite male sprinters, respectively) [38]. This strategy allows the high-level sprinters tooptimize the time during which propulsive force can be generated, minimizing the timespent in flight where force cannot be generated. Combined with this, best sprinters havetheir CM projected further forward [7] at the first touchdown, putting the foot behind thevertical projection of the CM [3], and minimizing the braking phase. At the takeoff of thefirst and second steps, the CM horizontal position is also greater in elite than well-trainedsprinters [7]. This means that the CM resultant and horizontal velocity in the first two stepsare generally greater in high-level sprinters [7,15]. Slawinski, Bonnefoy [7], for example,reported that elite sprinters have a CM resultant velocity 5.8% higher than well-trainedsprinters, at the end of the first step (4.69 ± 0.15 vs. 4.42 ± 0.11 m·s−1 for elite and well-trained sprinters, respectively). Furthermore, high-level sprinters also show slightly lowervertical velocities [7,39] and more horizontal CM projection angles at the end of the firsttwo support phases [39].
Lower limb joints pattern during the first two steps is associated with a proximal-to-distalsequence of the hip, knee, and ankle of the stance leg [4,9,43]. During both first and secondsteps, the ankle joint undergoes dorsiflexion during the first half of stance (e.g., 17 ± 3◦ and18 ± 3◦ for the first and second steps, respectively [43]) and subsequently a plantarflexionmovement (e.g., 45 ± 6◦ and 44 ± 5◦ for the first and second steps, respectively [43]).
The hip performs extension for the entire stances, the knee extends until the final 5%of stances, and the ankle is dorsi-flexed during the first half of stances before the plantarflexing action [6]. After leaving the rear block, there is a small increase in ankle jointdorsiflexion during the swing phase, preceding the plantarflexion that occurs just beforetouchdown [6]. Although the ankle plantar-flexes slightly at the end of the flight, the ankleis in a dorsi-flexed position at initial contact (e.g., first stance: 70.6 ± 5.8◦ and secondstance: 72.4 ± 7.1◦ [6]). During both first and second steps, the ankle joint dorsi-flexes
Int. J. Environ. Res. Public Health 2022, 19, 4074 25 of 74
during the first half of stance (e.g., 17 ± 3◦ and 18 ± 3◦ for the first and second steps,respectively [43]) and subsequently performs a plantarflexion movement (e.g., 45 ± 6◦
and 44 ± 5◦ for the first and second stance, respectively [43]). Note that a reduction inthe range of dorsiflexion during early stance, requiring high plantar flexor moments, hasalready been associated with increases in first stance power [47]. Maximal plantarflexionoccurs immediately following takeoff reaching, for example, 111.3◦ at the first stance and107.1◦ at the second stance [6]. The extension of both knees occurs just after the block exitand reaches its maximum at the beginning of the flight phase, with larger extension in thefront compared with the rear leg (e.g., rear: 134.9 ± 11.2◦; front: 177.4 ± 5.2◦) [6]. Froma flexed position at initial contact, the knee extensors generate power to induce extensionthroughout stance and to attain maximal extension at takeoff, achieving peak extensionangles of around 160–170◦ (not full extension; e.g., first stance: 165.2 ± 20.6◦; second stance:163.6 ± 17.7◦ [6]). This extension action of the knee during stances on its own may playa role in the rise of the CM during early acceleration [26]. The hip joints extend duringblock clearance to reach maximal extension during the beginning of the flight phase. Duringstance, the hips are in a flexed position at initial contact and continue to extend through-out stance, achieving maximal extension immediately following takeoff (e.g., first stance:180.6 ± 20.9◦; second stance: 181.1 ± 20.0◦ [6]). There is also a considerable ROM in hip andpelvis rotation during stance as well as abduction. Although there are detailed descriptionsof the lower limb angular kinematics during the first two stances and flight phases [3,6],there seems to be no clear evidence about the joint kinematic features that differentiate fasterfrom slower sprinters. Furthermore, there is also a lack of experimental data on arm actionsduring early acceleration and its relationship to performance descriptors, making necessaryfuture research in this area to help identify the most important performance features.
4.3.2. First Two Steps Kinetic Analysis
As said before, fast acceleration is a crucial determinant of performance in sprintrunning, where a high horizontal force impulse in a short time [13] is essential to reachhigh horizontal velocity [43]. Thus, as the highest CM acceleration during a sprint oc-curs during the first stances [7,9,14] (e.g., first stance: 0.36 ± 0.05 m·s−2; second stance:0.23 ± 0.04 m·s−2 [14]), the ability to generate during this phase greater absolute im-pulse [7,18], maximal external power [39,42], and a forward-leaning force oriented inthe sagittal plane [21,22,24,42] is linked to an overall higher sprint performance. Largerpropulsive horizontal forces are particularly important during early acceleration, being adiscriminating factor for superior levels of performance [48]. Experienced male sprinters(PB100m: 10.79 ± 0.21 s) can produce propulsive horizontal forces of around 1.1 body-weight during the first stance [18]. However, a negative horizontal force has also beenreported during the first contact after the block exit, even if the foot is properly placedbehind the vertical projection of the CM [18]. During the first stance, for example, thebraking phase represents about 13% of the total stance phase and the magnitude of thebraking forces can reach up to 40% of the respective propulsive forces [18].
Furthermore, 3D analysis studies also highlight a lower body motion outside thesagittal plane during the first few ground contact phases [6,21,22,24,36,42]. In fact, duringthe first steps of a sprinter, a stance medial deviation is often observed that results froman impulse in the transverse plane. Although the medial impulse is the smallest of thethree orthogonal stance impulses [21,22,42], the fact that it is non-zero can have an effecton the motion of the CM and on step width. However, it has been shown that well-trainedsprinters present similar step widths in the early acceleration to those of the trained andnon-trained sprinters [42]. Moreover, manipulations of both “set” position [21] and firststep [24] widths have shown no effect on block-induced power nor braking force or netanteroposterior impulse, showing that smaller step width is not a discriminator factor ofsuperior performance levels. Therefore, the perception that the adoption of a widened stanceduring initial acceleration (referred to as “skating style”) is detrimental to performance is not
Int. J. Environ. Res. Public Health 2022, 19, 4074 26 of 74
at all proven, and further research is needed to clarify the joint and muscular factors thatcontribute to the sprinters’ lateral motion in the initial phase of acceleration.
At joint level, the hip, knee, and ankle joints generate energy during stance legextension [6], although it appears that the ankle joint is the main contributor to CMacceleration [14]. However, experimental and simulation studies highlight that the kneeplays an important role during the first stance, being decisive for forward and upward CMacceleration [4,6,14,15]. The importance of power generation at the knee seems to be specificfor the first stance when the knee is in a more flexed position and the sprinter is leaning for-ward. From the second stance onwards, the knee becomes less and the ankle more dominantsince the plantar flexors are in a better position to contribute to forward progression [6]. Asthe knee is in a flexed position during the first step, the sprinter favors the immediate powergeneration of the knee extensors rather than preserving a stretch-shortening cycle [6]. In con-trast, a stretch-shortening mechanism can be confirmed at the hip and ankle [4,6,14,15]. Hipextensors maximal power generation occurs near touchdown [4,6] where the hip extensorsactively pull the body over the touchdown point [6]. The hip can effectively generate largejoint moments and power [14], but only contributes minimally to propulsion and bodylift during the first two stances [14]. Ankle plantar flexors act throughout both the firstand second stances under a stretch-shortening cycle. There is therefore an initial phase ofpower absorption preceding the forceful power generation at take-off [4,14]. As a majorcontributor to CM acceleration, the ankle joint can generate up to four times more powerthan it absorbs during the first two stances [43]. Nevertheless, the importance of anklestiffness during the first two stances remains unclear. While Charalambous, Irwin [49], ina case report, found a correlation between greater ankle stiffness and greater horizontalCM velocity at take-off (r = 0.74), Aeles, Jonkers [9] did not, still highlighting the lack ofdifferences between faster (senior) and slower (junior) sprinters. Future work is thereforeneeded to further clarify this issue. Furthermore, it remains unclear whether ankle stiffnessis influenced by foot structure and function (e.g., planus, rectus cavus, clubfoot) as well asother important performance variables such as greater maximal power, a forward-leaningforce oriented in the sagittal plane, or COP location during push-off.
Concerning kinetic factors differentiating senior and junior athletes, Graham-Smith,Colyer [39] reported that, contrarily to the block phase where there are marked differencesbetween groups, the force and power waveforms relating to the first two steps did not differconsiderably across groups. Still, senior sprinters are able to produce greater horizontal powerduring the initial part (10–19% of the stance phase) of the first and second ground contact(first step: 25.1 ± 3.6 W·kg−1 vs. 23.1 ± 6 W·kg−1 and second step: 26.7 ± 3.6 W·kg−1 vs.24.9 ± 4.5 W·kg−1, forsenior and junior sprinters, respectively), and also exhibit a higherproportion of forces immediately after braking forces are reversed (from 9% to 15% and 25%to 29% of stance phase) [39]. Furthermore, Debaere, Vanwanseele [15] also highlight that adultsprinters are able to generate more joint power at the knee during the first step comparedto young sprinters, inducing longer step length and therefore higher velocity [15]. Youngersprinters tend to prioritize a different technique: the hip contributes more to total powergeneration, while the knee contributes far less [15]. This indicates that younger sprinters lackthe specific technical skills observed in adult sprinters, likely due to less musculature thanadults [1,9,15]. However, there is no evidence of differences in ankle joint stiffness, range ofdorsiflexion, or plantar flexor moment between young and adult sprinters [9]. This indicatesthat the technical performance-related parameters of the first stances are not likely to explainthe better 100 m sprint times in adult compared to young sprinters [9].
4.4. Strengths, Limitations, and Recommendations
A strength of this review was that it allowed us to identify a body of knowledgethat provides fundamental information for athletes and coaches as relevant data that cancontribute to improving the training and/or preparation strategies for better performance,supported by scientific evidence.
Int. J. Environ. Res. Public Health 2022, 19, 4074 27 of 74
A possible limitation of this systematic review is that it only includes studies writtenin English, thereby potentially overlooking other relevant publications in other languages.Additionally, the present article reviewed only studies with mention to sprinters’ PB100m,eventually precluding publications with relevant samples that could also add knowledge.Furthermore, extending the biomechanical analysis to muscular features beyond the sim-ple kinematic and kinetic approach might have allowed a further understanding of thediscriminating factors of superior performance levels. Another obvious limitation is thelimited amount of research with female sprinters. Indeed, in the reviewed studies, there isa clear imbalance between the amount of female and male sprinters included (179 femalesvs. 587 males), questioning whether the biomechanical characteristics of the sprint startpreviously associated to female sprinters are attributable to sex-related aspects, or, rather, toaspects related to the 100 m time. Moreover, some of the studies included in this review werebased on a relatively small sample size, especially when elite or world-class sprinters wereincluded. This problem reflects the difficult access to high-level athletes, preventing the clearidentification of discriminatory factors of superior performance levels. Finally, the conflictingclassifications of sprinters level and the scarcity of information on effectively high-levelor world-class sprinters, makes it difficult to compare sprinters of different performancelevels. Considering entry standards for 100 m sprint event at the 2022 European AthleticsChampionships (10.16 s for men and 11.24 s for women), it can be said that a very smallpercentage of elite and/or world-class sprinters [50] was included in the reviewed studies.
Research on the biomechanics of the block and/or first stance phases has been thesubject of growing interest in the past few years. Nonetheless, there are some unclearfeatures in the studies published so far, which should be investigated in future studies for abetter understanding of: (i) the association between different upper limb patterns and themain block start performance predictors; (ii) the influence of foot type (e.g., planus, rectuscavus, clubfoot on sprint start performance; (iii) the association between ankle stiffnessduring dorsiflexion and the horizontal CM velocity at take-off; (iv) the specificity character-istics of training drills, utilizing temporal organization and intra-limb joint coordinationanalyses, to help the process of exercise selection to enhance block starting performance;(v) how technical and/or physical training can improve ankle and knee function duringfirst steps and increase horizontal velocity in the early acceleration; (vi) the influence ofsex (such as physical or muscle structures and/or anthropometric characteristics) on sprintstart performance descriptors. A major challenge for researchers is to align these researchlines with the need for greater information on world-class sprinters during competition.Whenever possible, research based on a marker-less methodology and obtained duringofficial top-level sprint competitions, during which the sprinters are supposedly moremotivated to produce their best performance, should be encouraged.
It is worth mentioning two new studies [51,52] published after the date of this sys-tematic review, which, meeting the defined inclusion criteria, could have added importantknowledge on some of the issues mentioned above.
5. Conclusions
Based on this review, some important conclusions and recommendations to helpathletes and coaches can be made, namely: (i) the choice of an anteroposterior block distancerelative to the sprinter’s leg length may be beneficial for some individuals, promotinggreater block start performance (greater normalized average horizontal external power);(ii) the use of footplate inclinations that individually facilitate initial dorsiflexion should beencouraged—footplate angles around the 40◦ are recommended and block angles steeperthan 65◦ should be avoided; (iii) pushing the calcaneus onto the block (posterior location)may be beneficial for some individuals, improving the 10 m time and/or horizontal externalpower; (iv) short block exit flight times and optimized first stance contact times should beencouraged, as they maximize the time during which propulsive force can be generated;(v) focus attention on the magnitude of force applied on the rear block, as it is considered tobe a primary determinant of block clearance; (vi) rapid hip extension during the push-off
Int. J. Environ. Res. Public Health 2022, 19, 4074 28 of 74
phase should be a priority in sprinter focus and coach feedback; (vii) the large role playedby the hips on the push-off phase and by both the knee and ankle at the early stance mustbe acknowledged within physical and technical training to ensure strength and power aredeveloped effectively for the nature of the sprint start.
Author Contributions: Conceptualization, M.J.V., J.M.A. and F.C.; methodology, M.J.V., J.M.A., F.C.and C.P.M.; formal analysis, M.J.V., J.M.A. and F.C.; writing—original draft preparation, M.J.V., J.M.A.and M.-J.V.; writing—review and editing, M.-J.V., F.C. and C.P.M.; visualization, M.J.V., M.-J.V., F.C.and C.P.M.; supervision, M.J.V., F.C. and C.P.M. All authors have read and agreed to the publishedversion of the manuscript.
Funding: This work was partly supported by a national grant through the FCT—Fundação para aCiência e Tecnologia within the unit I&D 447 (UIDB/00447/2020).
Institutional Review Board Statement: Not applicable.
Informed Consent Statement: Not applicable.
Data Availability Statement: Not applicable.
Conflicts of Interest: The authors declare no conflict of interest.
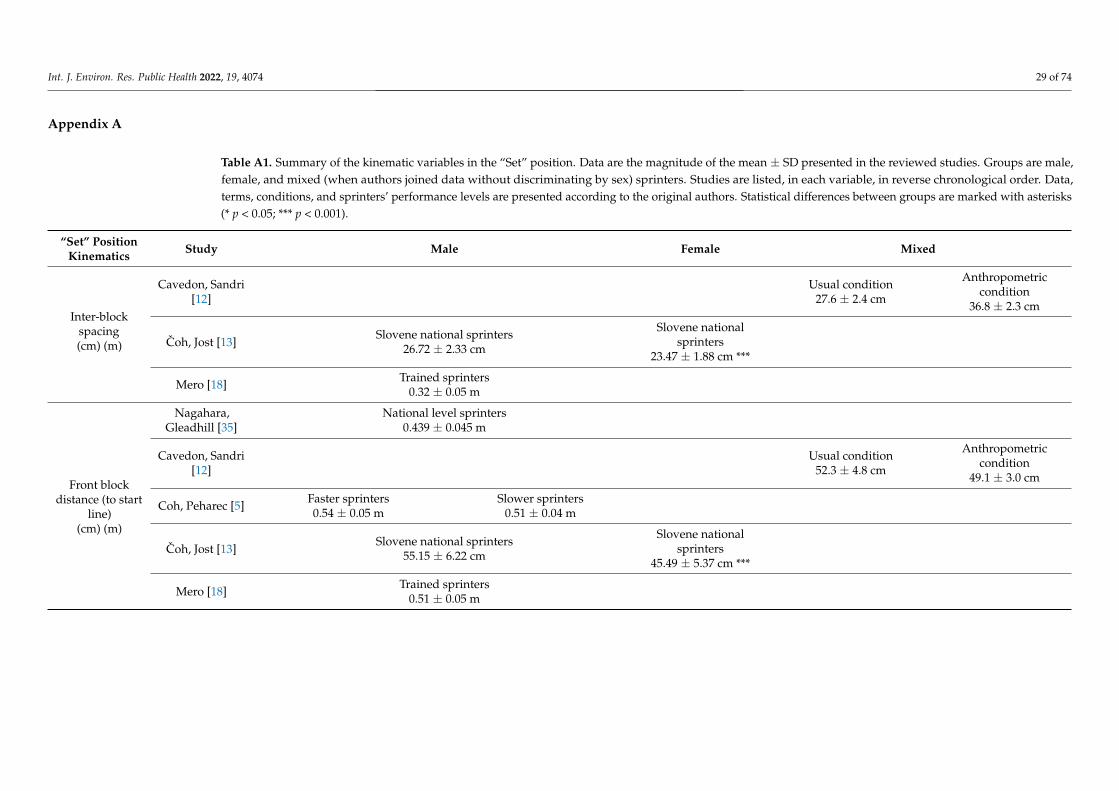
Int. J. Environ. Res. Public Health 2022, 19, 4074 29 of 74
Appendix A
Table A1. Summary of the kinematic variables in the “Set” position. Data are the magnitude of the mean ± SD presented in the reviewed studies. Groups are male,female, and mixed (when authors joined data without discriminating by sex) sprinters. Studies are listed, in each variable, in reverse chronological order. Data,terms, conditions, and sprinters’ performance levels are presented according to the original authors. Statistical differences between groups are marked with asterisks(* p < 0.05; *** p < 0.001).
“Set” PositionKinematics Study Male Female Mixed
Inter-blockspacing(cm) (m)
Cavedon, Sandri[12]
Usual condition27.6 ± 2.4 cm
Anthropometriccondition
36.8 ± 2.3 cm
Coh, Jost [13]Slovene national sprinters
26.72 ± 2.33 cm
Slovene nationalsprinters
23.47 ± 1.88 cm ***
Mero [18] Trained sprinters0.32 ± 0.05 m
Front blockdistance (to start
line)(cm) (m)
Nagahara,Gleadhill [35]
National level sprinters0.439 ± 0.045 m
Cavedon, Sandri[12]
Usual condition52.3 ± 4.8 cm
Anthropometriccondition
49.1 ± 3.0 cm
Coh, Peharec [5] Faster sprinters0.54 ± 0.05 m
Slower sprinters0.51 ± 0.04 m
Coh, Jost [13]Slovene national sprinters
55.15 ± 6.22 cm
Slovene nationalsprinters
45.49 ± 5.37 cm ***
Mero [18] Trained sprinters0.51 ± 0.05 m
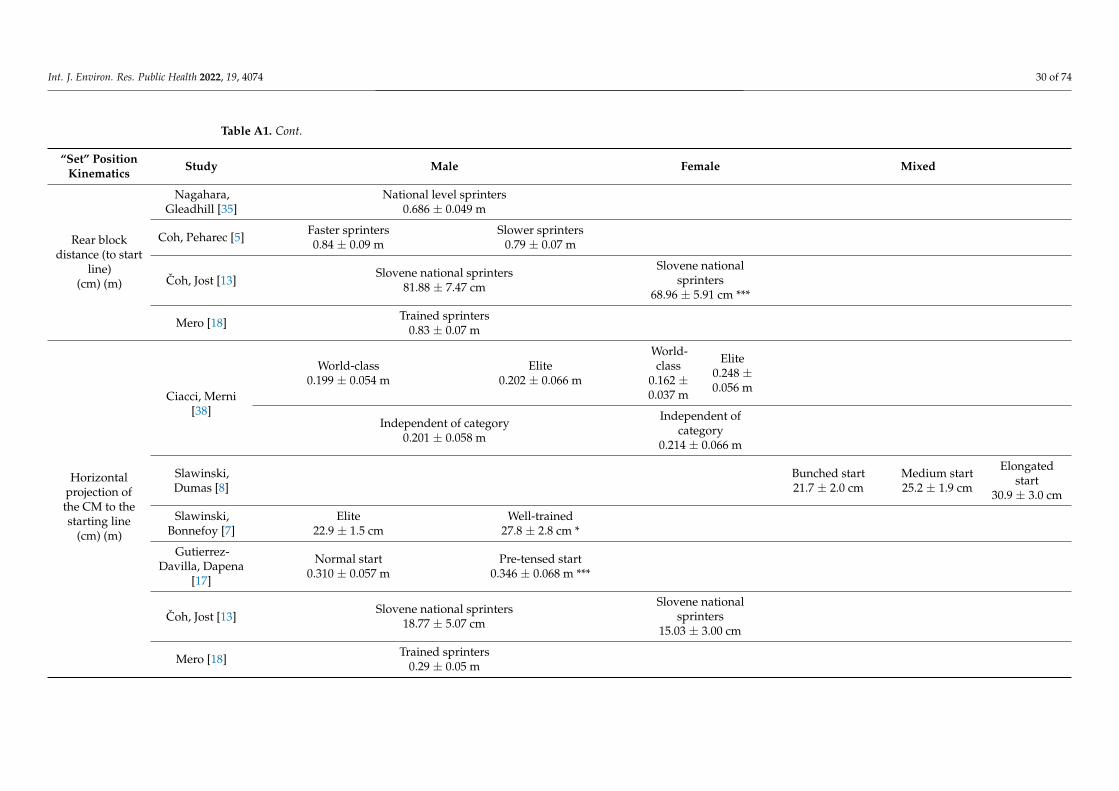
Int. J. Environ. Res. Public Health 2022, 19, 4074 30 of 74
Table A1. Cont.
“Set” PositionKinematics Study Male Female Mixed
Rear blockdistance (to start
line)(cm) (m)
Nagahara,Gleadhill [35]
National level sprinters0.686 ± 0.049 m
Coh, Peharec [5] Faster sprinters0.84 ± 0.09 m
Slower sprinters0.79 ± 0.07 m
Coh, Jost [13]Slovene national sprinters
81.88 ± 7.47 cm
Slovene nationalsprinters
68.96 ± 5.91 cm ***
Mero [18] Trained sprinters0.83 ± 0.07 m
Horizontalprojection ofthe CM to thestarting line
(cm) (m)
Ciacci, Merni[38]
World-class0.199 ± 0.054 m
Elite0.202 ± 0.066 m
World-class
0.162 ±0.037 m
Elite0.248 ±0.056 m
Independent of category0.201 ± 0.058 m
Independent ofcategory
0.214 ± 0.066 m
Slawinski,Dumas [8]
Bunched start21.7 ± 2.0 cm
Medium start25.2 ± 1.9 cm
Elongatedstart
30.9 ± 3.0 cm
Slawinski,Bonnefoy [7]
Elite22.9 ± 1.5 cm
Well-trained27.8 ± 2.8 cm *
Gutierrez-Davilla, Dapena
[17]
Normal start0.310 ± 0.057 m
Pre-tensed start0.346 ± 0.068 m ***
Coh, Jost [13]Slovene national sprinters
18.77 ± 5.07 cm
Slovene nationalsprinters
15.03 ± 3.00 cm
Mero [18] Trained sprinters0.29 ± 0.05 m
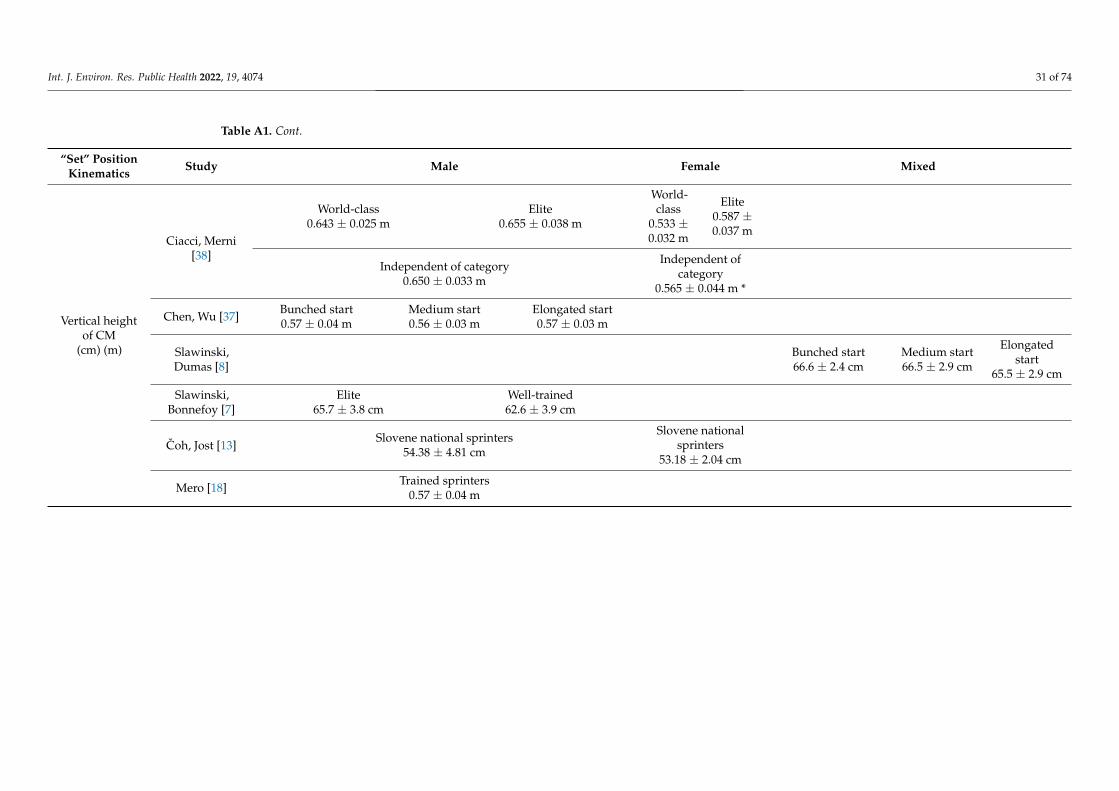
Int. J. Environ. Res. Public Health 2022, 19, 4074 31 of 74
Table A1. Cont.
“Set” PositionKinematics Study Male Female Mixed
Vertical heightof CM
(cm) (m)
Ciacci, Merni[38]
World-class0.643 ± 0.025 m
Elite0.655 ± 0.038 m
World-class
0.533 ±0.032 m
Elite0.587 ±0.037 m
Independent of category0.650 ± 0.033 m
Independent ofcategory
0.565 ± 0.044 m *
Chen, Wu [37] Bunched start0.57 ± 0.04 m
Medium start0.56 ± 0.03 m
Elongated start0.57 ± 0.03 m
Slawinski,Dumas [8]
Bunched start66.6 ± 2.4 cm
Medium start66.5 ± 2.9 cm
Elongatedstart
65.5 ± 2.9 cm
Slawinski,Bonnefoy [7]
Elite65.7 ± 3.8 cm
Well-trained62.6 ± 3.9 cm
Coh, Jost [13]Slovene national sprinters
54.38 ± 4.81 cm
Slovene nationalsprinters
53.18 ± 2.04 cm
Mero [18] Trained sprinters0.57 ± 0.04 m
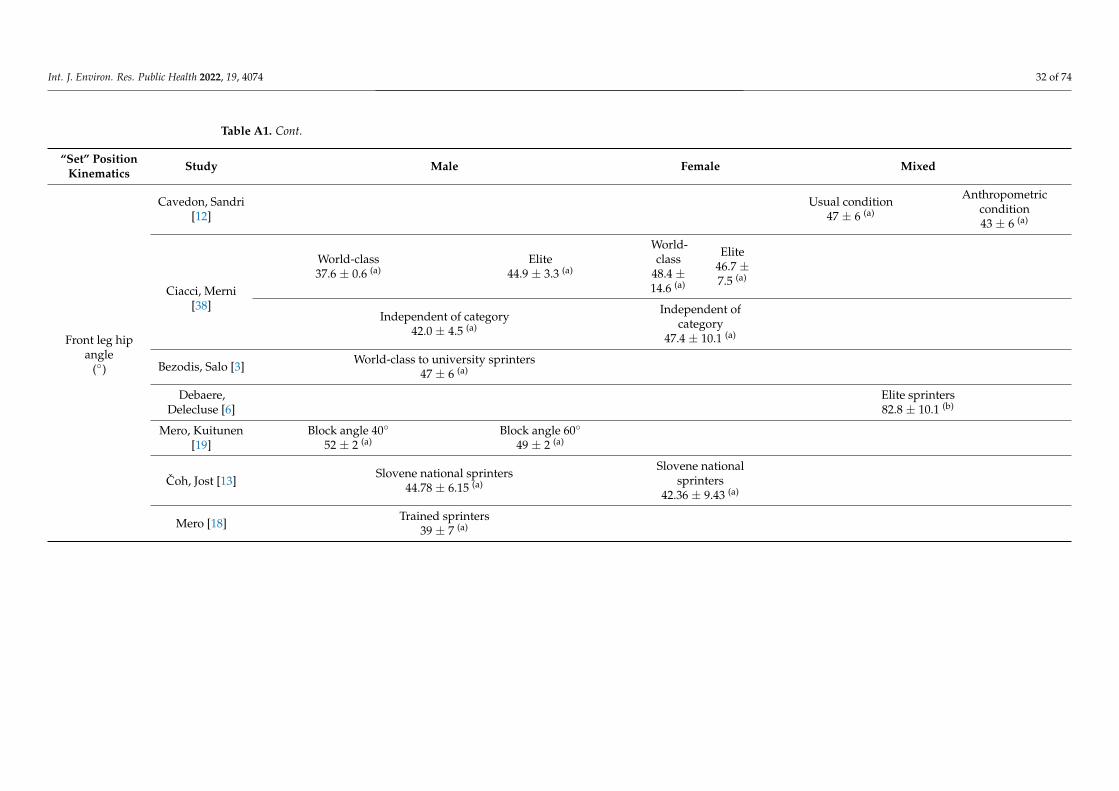
Int. J. Environ. Res. Public Health 2022, 19, 4074 32 of 74
Table A1. Cont.
“Set” PositionKinematics Study Male Female Mixed
Front leg hipangle
(◦)
Cavedon, Sandri[12]
Usual condition47 ± 6 (a)
Anthropometriccondition43 ± 6 (a)
Ciacci, Merni[38]
World-class37.6 ± 0.6 (a)
Elite44.9 ± 3.3 (a)
World-class
48.4 ±14.6 (a)
Elite46.7 ±7.5 (a)
Independent of category42.0 ± 4.5 (a)
Independent ofcategory
47.4 ± 10.1 (a)
Bezodis, Salo [3] World-class to university sprinters47 ± 6 (a)
Debaere,Delecluse [6]
Elite sprinters82.8 ± 10.1 (b)
Mero, Kuitunen[19]
Block angle 40◦
52 ± 2 (a)Block angle 60◦
49 ± 2 (a)
Coh, Jost [13]Slovene national sprinters
44.78 ± 6.15 (a)
Slovene nationalsprinters
42.36 ± 9.43 (a)
Mero [18] Trained sprinters39 ± 7 (a)
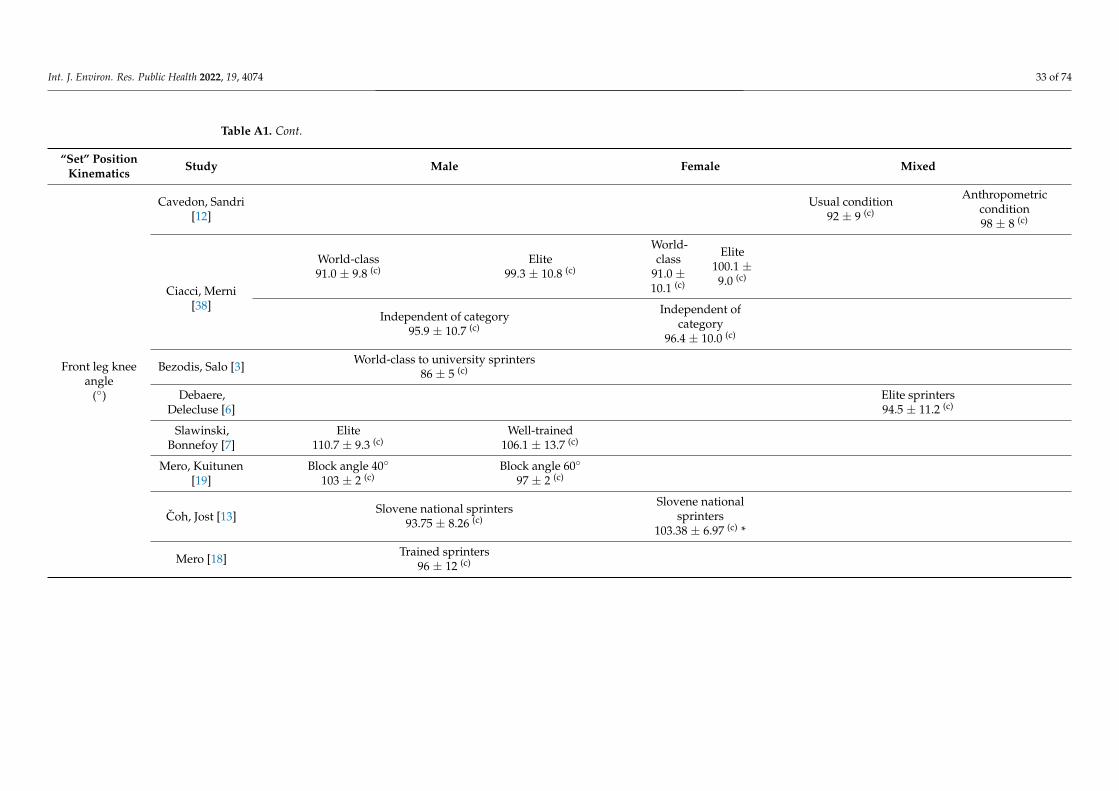
Int. J. Environ. Res. Public Health 2022, 19, 4074 33 of 74
Table A1. Cont.
“Set” PositionKinematics Study Male Female Mixed
Front leg kneeangle
(◦)
Cavedon, Sandri[12]
Usual condition92 ± 9 (c)
Anthropometriccondition98 ± 8 (c)
Ciacci, Merni[38]
World-class91.0 ± 9.8 (c)
Elite99.3 ± 10.8 (c)
World-class
91.0 ±10.1 (c)
Elite100.1 ±9.0 (c)
Independent of category95.9 ± 10.7 (c)
Independent ofcategory
96.4 ± 10.0 (c)
Bezodis, Salo [3] World-class to university sprinters86 ± 5 (c)
Debaere,Delecluse [6]
Elite sprinters94.5 ± 11.2 (c)
Slawinski,Bonnefoy [7]
Elite110.7 ± 9.3 (c)
Well-trained106.1 ± 13.7 (c)
Mero, Kuitunen[19]
Block angle 40◦
103 ± 2 (c)Block angle 60◦
97 ± 2 (c)
Coh, Jost [13]Slovene national sprinters
93.75 ± 8.26 (c)
Slovene nationalsprinters
103.38 ± 6.97 (c) *
Mero [18] Trained sprinters96 ± 12 (c)
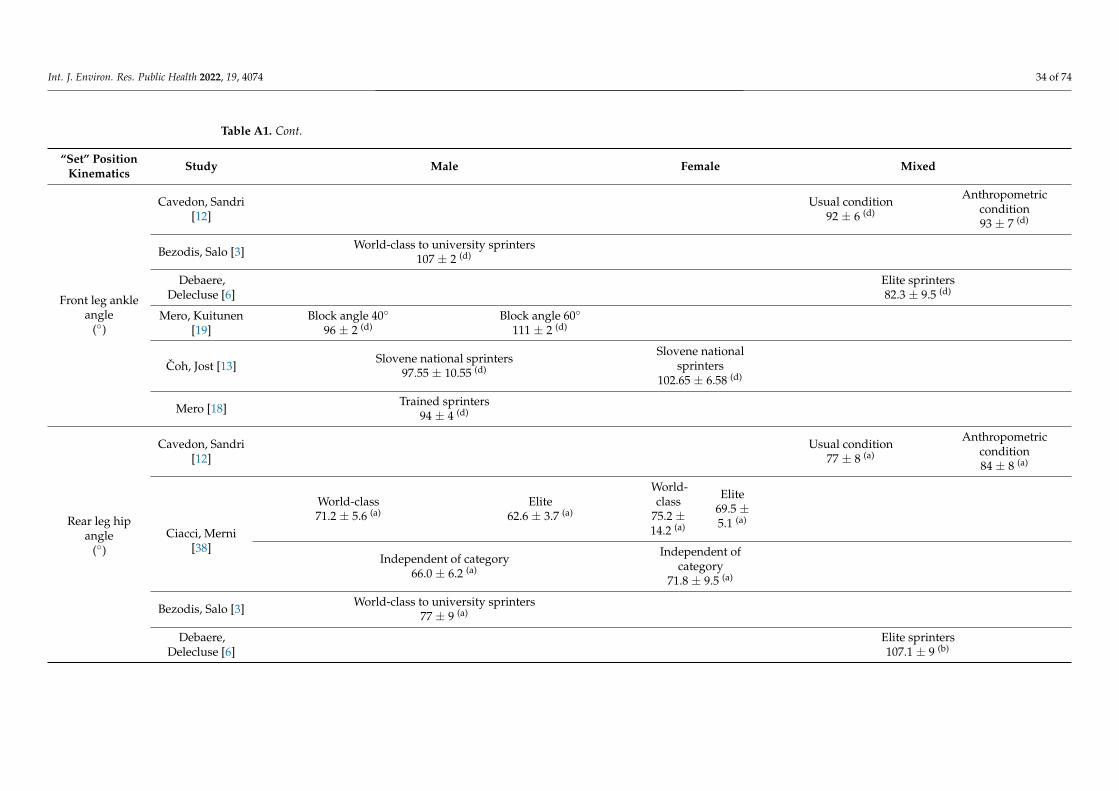
Int. J. Environ. Res. Public Health 2022, 19, 4074 34 of 74
Table A1. Cont.
“Set” PositionKinematics Study Male Female Mixed
Front leg ankleangle
(◦)
Cavedon, Sandri[12]
Usual condition92 ± 6 (d)
Anthropometriccondition93 ± 7 (d)
Bezodis, Salo [3] World-class to university sprinters107 ± 2 (d)
Debaere,Delecluse [6]
Elite sprinters82.3 ± 9.5 (d)
Mero, Kuitunen[19]
Block angle 40◦
96 ± 2 (d)Block angle 60◦
111 ± 2 (d)
Coh, Jost [13]Slovene national sprinters
97.55 ± 10.55 (d)
Slovene nationalsprinters
102.65 ± 6.58 (d)
Mero [18] Trained sprinters94 ± 4 (d)
Rear leg hipangle
(◦)
Cavedon, Sandri[12]
Usual condition77 ± 8 (a)
Anthropometriccondition84 ± 8 (a)
Ciacci, Merni[38]
World-class71.2 ± 5.6 (a)
Elite62.6 ± 3.7 (a)
World-class
75.2 ±14.2 (a)
Elite69.5 ±5.1 (a)
Independent of category66.0 ± 6.2 (a)
Independent ofcategory
71.8 ± 9.5 (a)
Bezodis, Salo [3] World-class to university sprinters77 ± 9 (a)
Debaere,Delecluse [6]
Elite sprinters107.1 ± 9 (b)
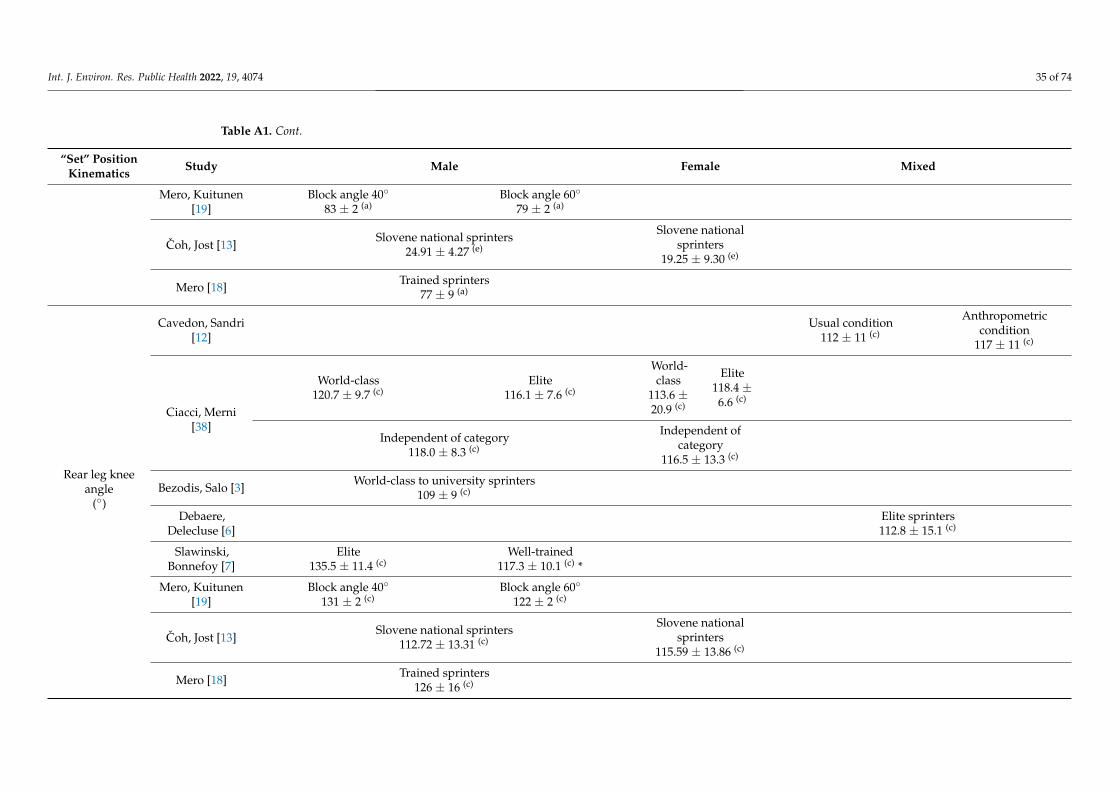
Int. J. Environ. Res. Public Health 2022, 19, 4074 35 of 74
Table A1. Cont.
“Set” PositionKinematics Study Male Female Mixed
Mero, Kuitunen[19]
Block angle 40◦
83 ± 2 (a)Block angle 60◦
79 ± 2 (a)
Coh, Jost [13]Slovene national sprinters
24.91 ± 4.27 (e)
Slovene nationalsprinters
19.25 ± 9.30 (e)
Mero [18] Trained sprinters77 ± 9 (a)
Rear leg kneeangle
(◦)
Cavedon, Sandri[12]
Usual condition112 ± 11 (c)
Anthropometriccondition
117 ± 11 (c)
Ciacci, Merni[38]
World-class120.7 ± 9.7 (c)
Elite116.1 ± 7.6 (c)
World-class
113.6 ±20.9 (c)
Elite118.4 ±6.6 (c)
Independent of category118.0 ± 8.3 (c)
Independent ofcategory
116.5 ± 13.3 (c)
Bezodis, Salo [3] World-class to university sprinters109 ± 9 (c)
Debaere,Delecluse [6]
Elite sprinters112.8 ± 15.1 (c)
Slawinski,Bonnefoy [7]
Elite135.5 ± 11.4 (c)
Well-trained117.3 ± 10.1 (c) *
Mero, Kuitunen[19]
Block angle 40◦
131 ± 2 (c)Block angle 60◦
122 ± 2 (c)
Coh, Jost [13]Slovene national sprinters
112.72 ± 13.31 (c)
Slovene nationalsprinters
115.59 ± 13.86 (c)
Mero [18] Trained sprinters126 ± 16 (c)
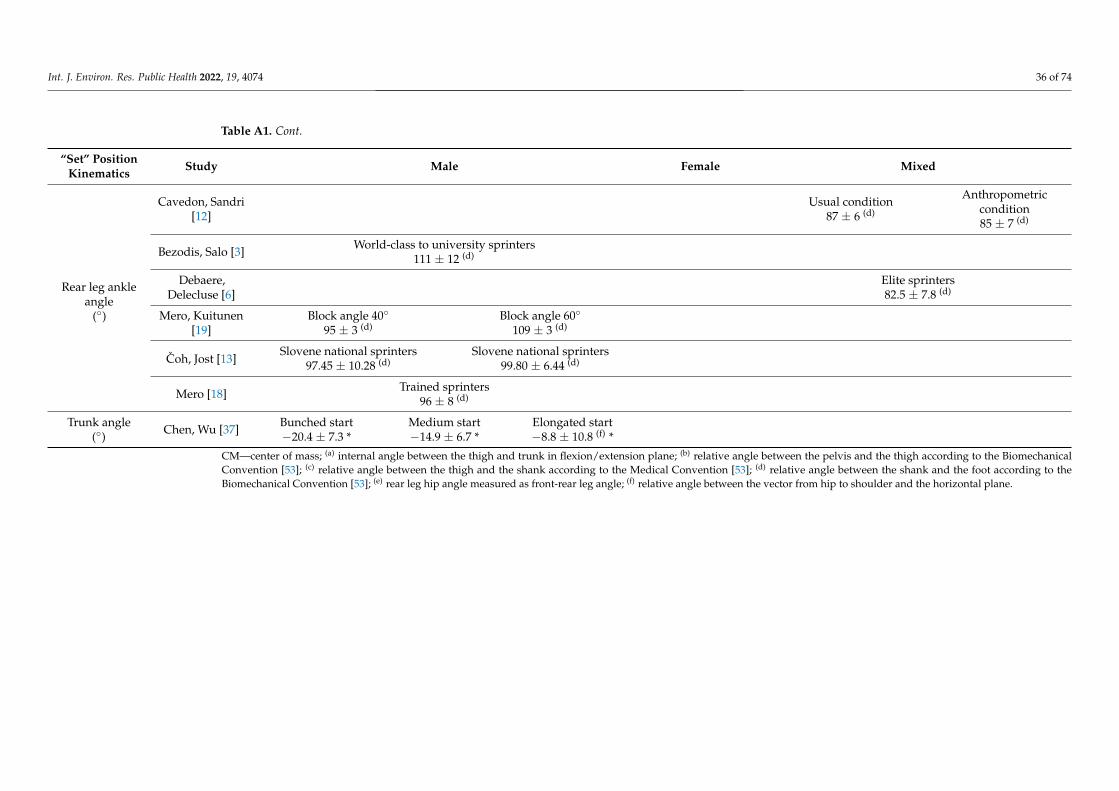
Int. J. Environ. Res. Public Health 2022, 19, 4074 36 of 74
Table A1. Cont.
“Set” PositionKinematics Study Male Female Mixed
Rear leg ankleangle
(◦)
Cavedon, Sandri[12]
Usual condition87 ± 6 (d)
Anthropometriccondition85 ± 7 (d)
Bezodis, Salo [3] World-class to university sprinters111 ± 12 (d)
Debaere,Delecluse [6]
Elite sprinters82.5 ± 7.8 (d)
Mero, Kuitunen[19]
Block angle 40◦
95 ± 3 (d)Block angle 60◦
109 ± 3 (d)
Coh, Jost [13]Slovene national sprinters
97.45 ± 10.28 (d)Slovene national sprinters
99.80 ± 6.44 (d)
Mero [18] Trained sprinters96 ± 8 (d)
Trunk angle(◦) Chen, Wu [37] Bunched start
−20.4 ± 7.3 *Medium start−14.9 ± 6.7 *
Elongated start−8.8 ± 10.8 (f) *
CM—center of mass; (a) internal angle between the thigh and trunk in flexion/extension plane; (b) relative angle between the pelvis and the thigh according to the BiomechanicalConvention [53]; (c) relative angle between the thigh and the shank according to the Medical Convention [53]; (d) relative angle between the shank and the foot according to theBiomechanical Convention [53]; (e) rear leg hip angle measured as front-rear leg angle; (f) relative angle between the vector from hip to shoulder and the horizontal plane.
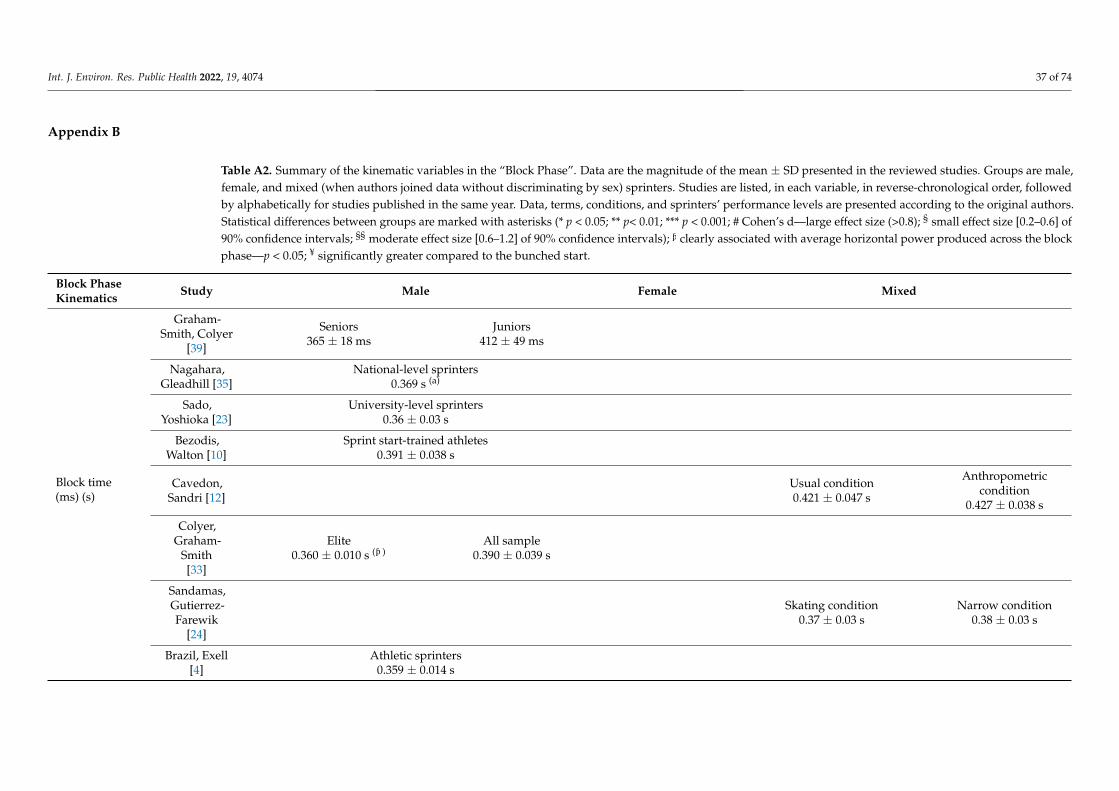
Int. J. Environ. Res. Public Health 2022, 19, 4074 37 of 74
Appendix B
Table A2. Summary of the kinematic variables in the “Block Phase”. Data are the magnitude of the mean ± SD presented in the reviewed studies. Groups are male,female, and mixed (when authors joined data without discriminating by sex) sprinters. Studies are listed, in each variable, in reverse-chronological order, followedby alphabetically for studies published in the same year. Data, terms, conditions, and sprinters’ performance levels are presented according to the original authors.Statistical differences between groups are marked with asterisks (* p < 0.05; ** p< 0.01; *** p < 0.001; # Cohen’s d—large effect size (>0.8); § small effect size [0.2–0.6] of90% confidence intervals; §§ moderate effect size [0.6–1.2] of 90% confidence intervals);
1
Ϯ adults; ƥ different from descending significantly greater compared with either leg in the block phase).
clearly associated with average horizontal power produced across the blockphase—p < 0.05; ¥ significantly greater compared to the bunched start.
Block PhaseKinematics Study Male Female Mixed
Block time(ms) (s)
Graham-Smith, Colyer
[39]
Seniors365 ± 18 ms
Juniors412 ± 49 ms
Nagahara,Gleadhill [35]
National-level sprinters0.369 s (a)
Sado,Yoshioka [23]
University-level sprinters0.36 ± 0.03 s
Bezodis,Walton [10]
Sprint start-trained athletes0.391 ± 0.038 s
Cavedon,Sandri [12]
Usual condition0.421 ± 0.047 s
Anthropometriccondition
0.427 ± 0.038 s
Colyer,Graham-
Smith[33]
Elite0.360 ± 0.010 s (
1
Ϯ adults; ƥ different from descending significantly greater compared with either leg in the block phase).
)All sample
0.390 ± 0.039 s
Sandamas,Gutierrez-Farewik
[24]
Skating condition0.37 ± 0.03 s
Narrow condition0.38 ± 0.03 s
Brazil, Exell[4]
Athletic sprinters0.359 ± 0.014 s
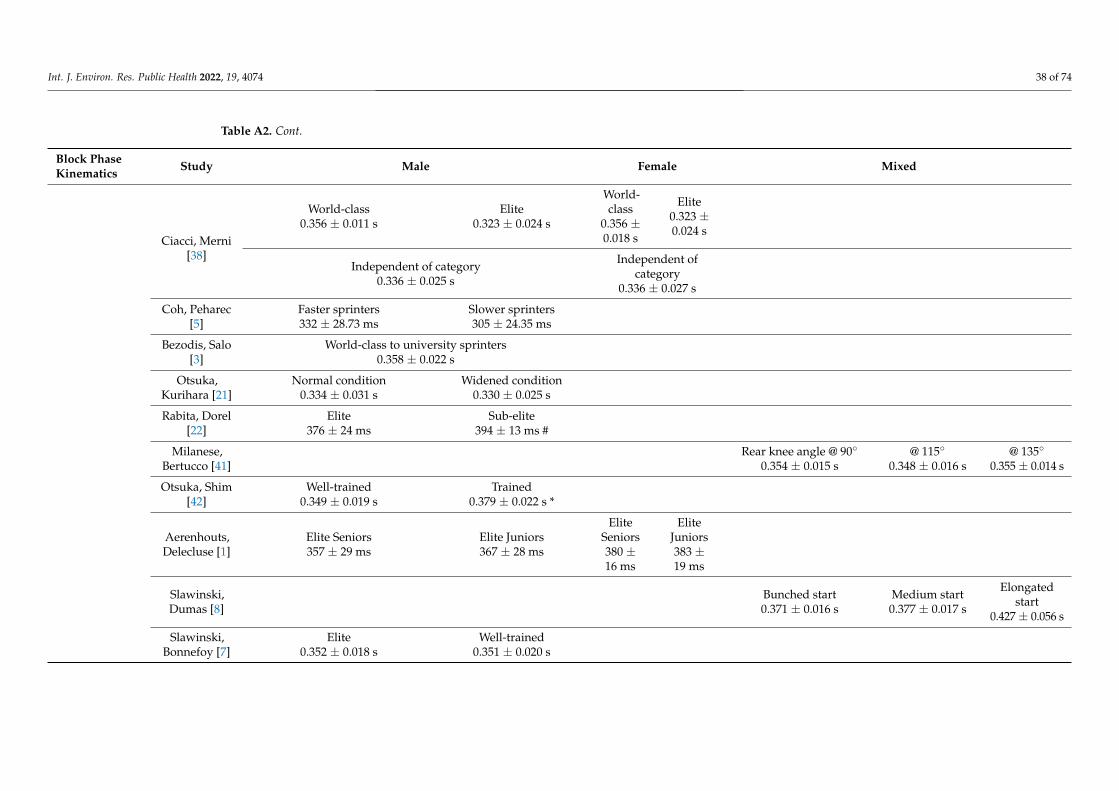
Int. J. Environ. Res. Public Health 2022, 19, 4074 38 of 74
Table A2. Cont.
Block PhaseKinematics Study Male Female Mixed
Ciacci, Merni[38]
World-class0.356 ± 0.011 s
Elite0.323 ± 0.024 s
World-class
0.356 ±0.018 s
Elite0.323 ±0.024 s
Independent of category0.336 ± 0.025 s
Independent ofcategory
0.336 ± 0.027 s
Coh, Peharec[5]
Faster sprinters332 ± 28.73 ms
Slower sprinters305 ± 24.35 ms
Bezodis, Salo[3]
World-class to university sprinters0.358 ± 0.022 s
Otsuka,Kurihara [21]
Normal condition0.334 ± 0.031 s
Widened condition0.330 ± 0.025 s
Rabita, Dorel[22]
Elite376 ± 24 ms
Sub-elite394 ± 13 ms #
Milanese,Bertucco [41]
Rear knee angle @ 90◦
0.354 ± 0.015 s@ 115◦
0.348 ± 0.016 s@ 135◦
0.355 ± 0.014 s
Otsuka, Shim[42]
Well-trained0.349 ± 0.019 s
Trained0.379 ± 0.022 s *
Aerenhouts,Delecluse [1]
Elite Seniors357 ± 29 ms
Elite Juniors367 ± 28 ms
EliteSeniors380 ±16 ms
EliteJuniors383 ±19 ms
Slawinski,Dumas [8]
Bunched start0.371 ± 0.016 s
Medium start0.377 ± 0.017 s
Elongatedstart
0.427 ± 0.056 s
Slawinski,Bonnefoy [7]
Elite0.352 ± 0.018 s
Well-trained0.351 ± 0.020 s
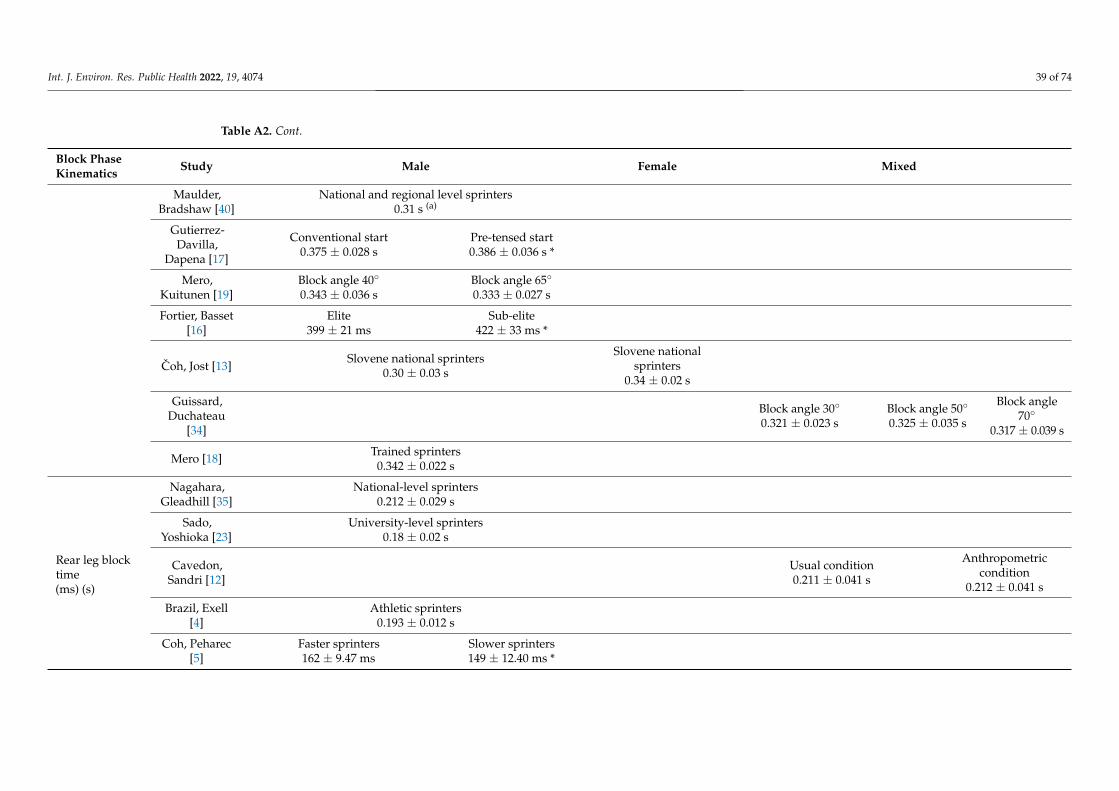
Int. J. Environ. Res. Public Health 2022, 19, 4074 39 of 74
Table A2. Cont.
Block PhaseKinematics Study Male Female Mixed
Maulder,Bradshaw [40]
National and regional level sprinters0.31 s (a)
Gutierrez-Davilla,
Dapena [17]
Conventional start0.375 ± 0.028 s
Pre-tensed start0.386 ± 0.036 s *
Mero,Kuitunen [19]
Block angle 40◦
0.343 ± 0.036 sBlock angle 65◦
0.333 ± 0.027 s
Fortier, Basset[16]
Elite399 ± 21 ms
Sub-elite422 ± 33 ms *
Coh, Jost [13]Slovene national sprinters
0.30 ± 0.03 s
Slovene nationalsprinters
0.34 ± 0.02 s
Guissard,Duchateau
[34]
Block angle 30◦
0.321 ± 0.023 sBlock angle 50◦
0.325 ± 0.035 s
Block angle70◦
0.317 ± 0.039 s
Mero [18] Trained sprinters0.342 ± 0.022 s
Rear leg blocktime(ms) (s)
Nagahara,Gleadhill [35]
National-level sprinters0.212 ± 0.029 s
Sado,Yoshioka [23]
University-level sprinters0.18 ± 0.02 s
Cavedon,Sandri [12]
Usual condition0.211 ± 0.041 s
Anthropometriccondition
0.212 ± 0.041 s
Brazil, Exell[4]
Athletic sprinters0.193 ± 0.012 s
Coh, Peharec[5]
Faster sprinters162 ± 9.47 ms
Slower sprinters149 ± 12.40 ms *
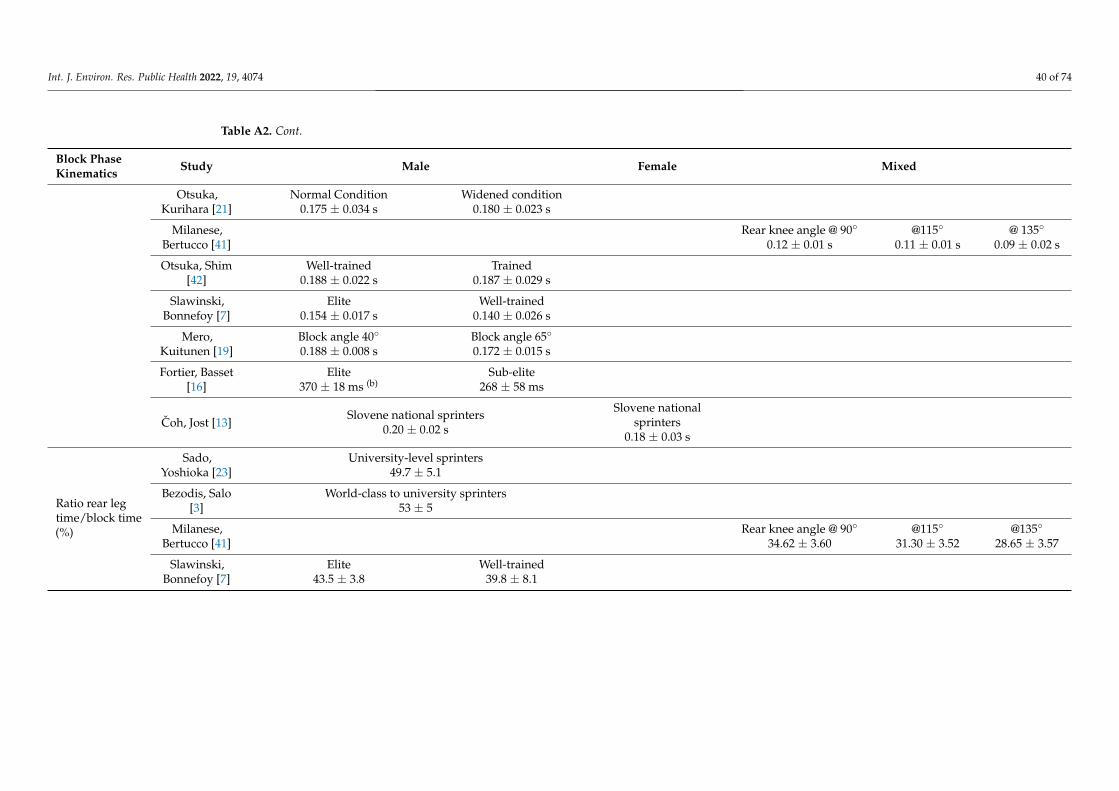
Int. J. Environ. Res. Public Health 2022, 19, 4074 40 of 74
Table A2. Cont.
Block PhaseKinematics Study Male Female Mixed
Otsuka,Kurihara [21]
Normal Condition0.175 ± 0.034 s
Widened condition0.180 ± 0.023 s
Milanese,Bertucco [41]
Rear knee angle @ 90◦
0.12 ± 0.01 s@115◦
0.11 ± 0.01 s@ 135◦
0.09 ± 0.02 s
Otsuka, Shim[42]
Well-trained0.188 ± 0.022 s
Trained0.187 ± 0.029 s
Slawinski,Bonnefoy [7]
Elite0.154 ± 0.017 s
Well-trained0.140 ± 0.026 s
Mero,Kuitunen [19]
Block angle 40◦
0.188 ± 0.008 sBlock angle 65◦
0.172 ± 0.015 s
Fortier, Basset[16]
Elite370 ± 18 ms (b)
Sub-elite268 ± 58 ms
Coh, Jost [13]Slovene national sprinters
0.20 ± 0.02 s
Slovene nationalsprinters
0.18 ± 0.03 s
Ratio rear legtime/block time(%)
Sado,Yoshioka [23]
University-level sprinters49.7 ± 5.1
Bezodis, Salo[3]
World-class to university sprinters53 ± 5
Milanese,Bertucco [41]
Rear knee angle @ 90◦
34.62 ± 3.60@115◦
31.30 ± 3.52@135◦
28.65 ± 3.57
Slawinski,Bonnefoy [7]
Elite43.5 ± 3.8
Well-trained39.8 ± 8.1
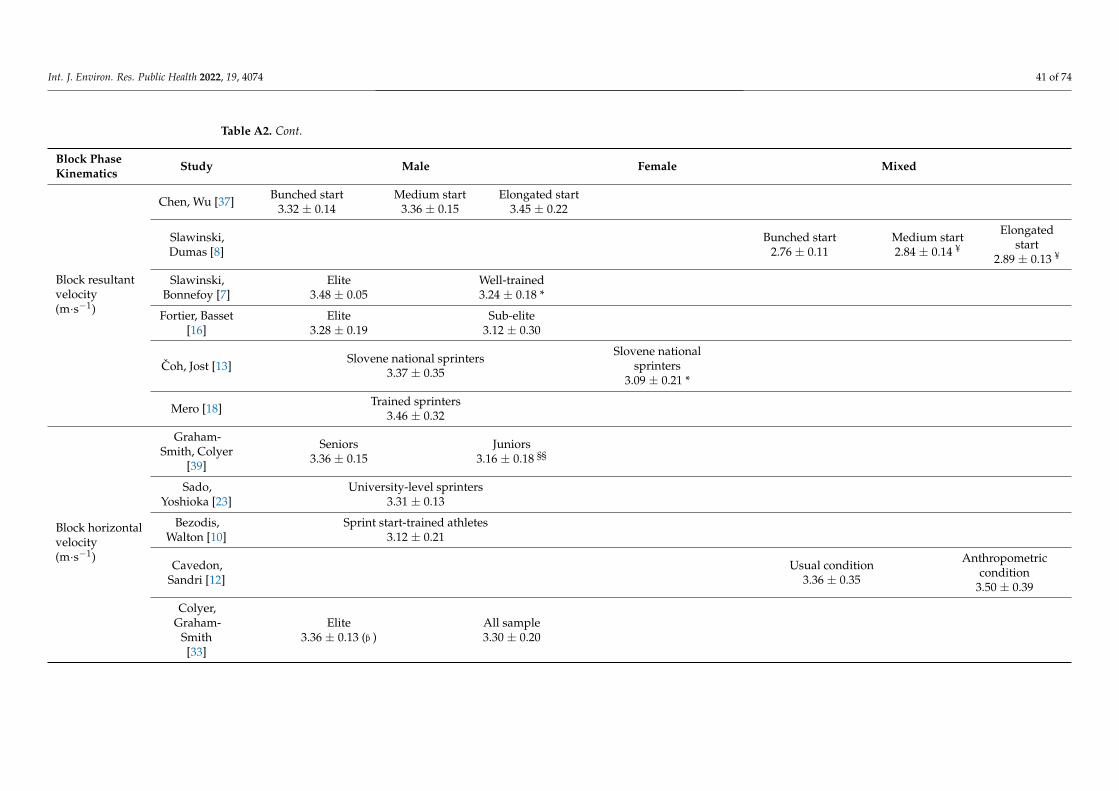
Int. J. Environ. Res. Public Health 2022, 19, 4074 41 of 74
Table A2. Cont.
Block PhaseKinematics Study Male Female Mixed
Block resultantvelocity(m·s−1)
Chen, Wu [37] Bunched start3.32 ± 0.14
Medium start3.36 ± 0.15
Elongated start3.45 ± 0.22
Slawinski,Dumas [8]
Bunched start2.76 ± 0.11
Medium start2.84 ± 0.14 ¥
Elongatedstart
2.89 ± 0.13 ¥
Slawinski,Bonnefoy [7]
Elite3.48 ± 0.05
Well-trained3.24 ± 0.18 *
Fortier, Basset[16]
Elite3.28 ± 0.19
Sub-elite3.12 ± 0.30
Coh, Jost [13]Slovene national sprinters
3.37 ± 0.35
Slovene nationalsprinters
3.09 ± 0.21 *
Mero [18] Trained sprinters3.46 ± 0.32
Block horizontalvelocity(m·s−1)
Graham-Smith, Colyer
[39]
Seniors3.36 ± 0.15
Juniors3.16 ± 0.18 §§
Sado,Yoshioka [23]
University-level sprinters3.31 ± 0.13
Bezodis,Walton [10]
Sprint start-trained athletes3.12 ± 0.21
Cavedon,Sandri [12]
Usual condition3.36 ± 0.35
Anthropometriccondition
3.50 ± 0.39
Colyer,Graham-
Smith[33]
Elite3.36 ± 0.13 (
1
Ϯ adults; ƥ different from descending significantly greater compared with either leg in the block phase).
)All sample3.30 ± 0.20
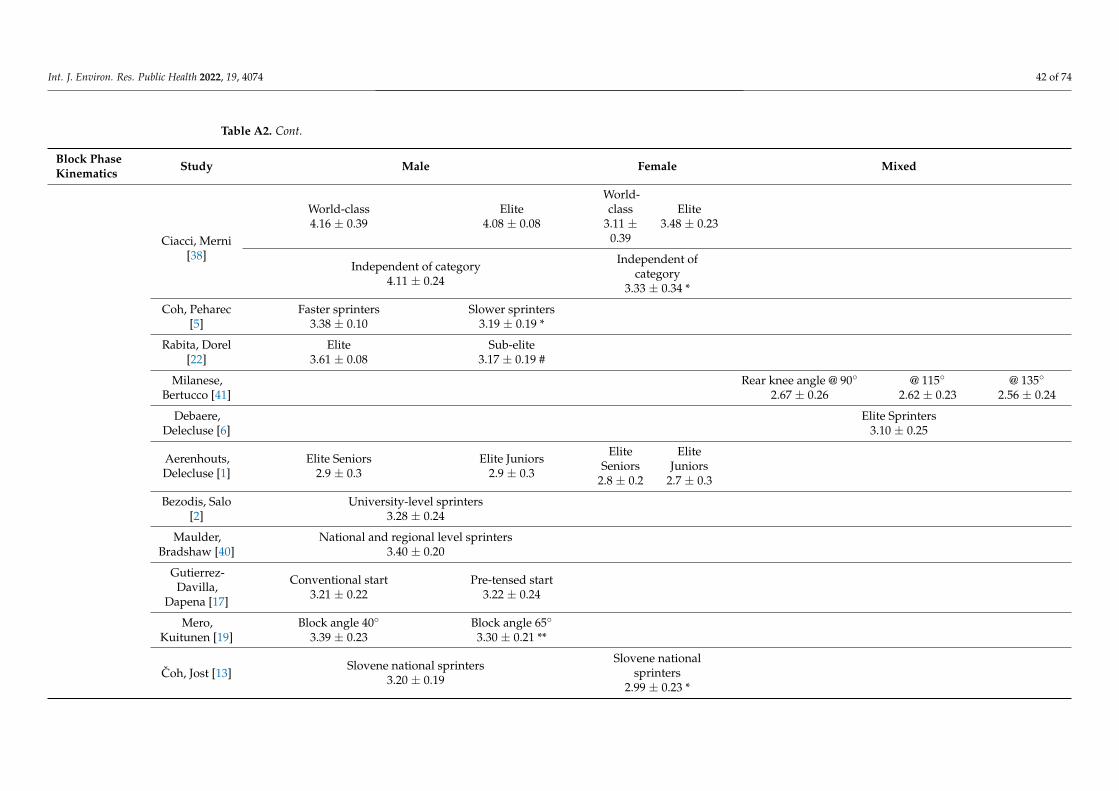
Int. J. Environ. Res. Public Health 2022, 19, 4074 42 of 74
Table A2. Cont.
Block PhaseKinematics Study Male Female Mixed
Ciacci, Merni[38]
World-class4.16 ± 0.39
Elite4.08 ± 0.08
World-class
3.11 ±0.39
Elite3.48 ± 0.23
Independent of category4.11 ± 0.24
Independent ofcategory
3.33 ± 0.34 *
Coh, Peharec[5]
Faster sprinters3.38 ± 0.10
Slower sprinters3.19 ± 0.19 *
Rabita, Dorel[22]
Elite3.61 ± 0.08
Sub-elite3.17 ± 0.19 #
Milanese,Bertucco [41]
Rear knee angle @ 90◦
2.67 ± 0.26@ 115◦
2.62 ± 0.23@ 135◦
2.56 ± 0.24
Debaere,Delecluse [6]
Elite Sprinters3.10 ± 0.25
Aerenhouts,Delecluse [1]
Elite Seniors2.9 ± 0.3
Elite Juniors2.9 ± 0.3
EliteSeniors
2.8 ± 0.2
EliteJuniors
2.7 ± 0.3
Bezodis, Salo[2]
University-level sprinters3.28 ± 0.24
Maulder,Bradshaw [40]
National and regional level sprinters3.40 ± 0.20
Gutierrez-Davilla,
Dapena [17]
Conventional start3.21 ± 0.22
Pre-tensed start3.22 ± 0.24
Mero,Kuitunen [19]
Block angle 40◦
3.39 ± 0.23Block angle 65◦
3.30 ± 0.21 **
Coh, Jost [13]Slovene national sprinters
3.20 ± 0.19
Slovene nationalsprinters
2.99 ± 0.23 *
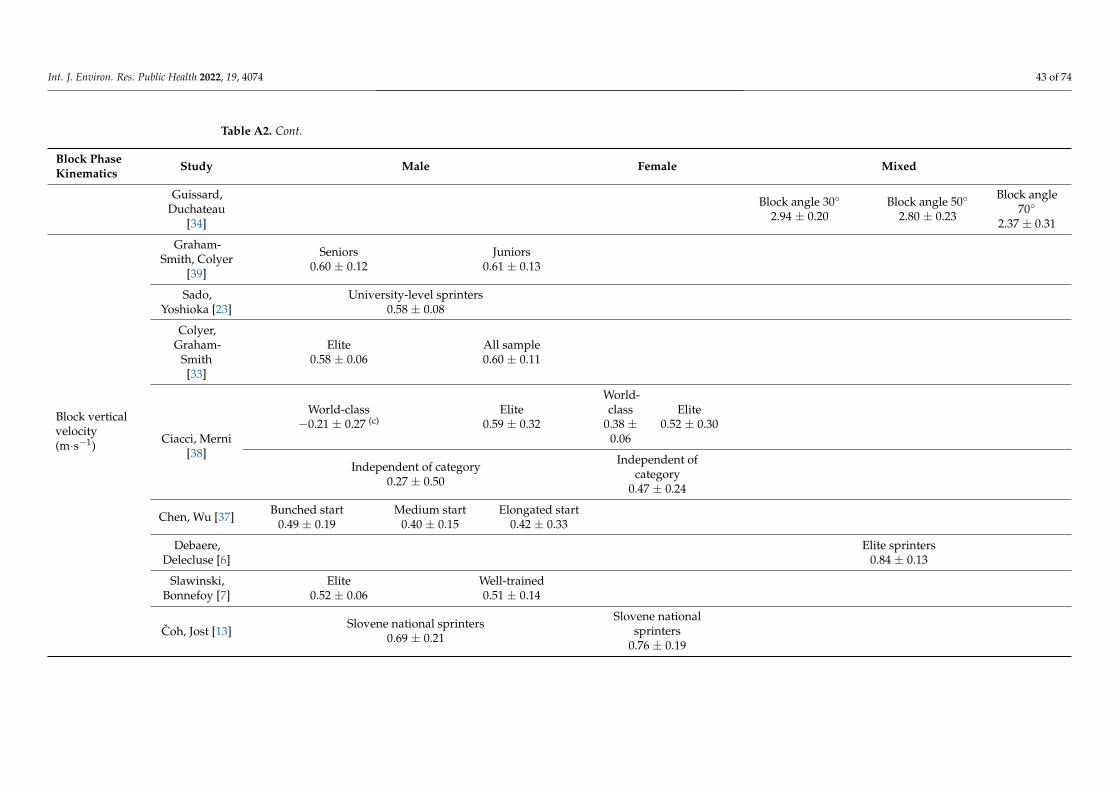
Int. J. Environ. Res. Public Health 2022, 19, 4074 43 of 74
Table A2. Cont.
Block PhaseKinematics Study Male Female Mixed
Guissard,Duchateau
[34]
Block angle 30◦
2.94 ± 0.20Block angle 50◦
2.80 ± 0.23
Block angle70◦
2.37 ± 0.31
Block verticalvelocity(m·s−1)
Graham-Smith, Colyer
[39]
Seniors0.60 ± 0.12
Juniors0.61 ± 0.13
Sado,Yoshioka [23]
University-level sprinters0.58 ± 0.08
Colyer,Graham-
Smith[33]
Elite0.58 ± 0.06
All sample0.60 ± 0.11
Ciacci, Merni[38]
World-class−0.21 ± 0.27 (c)
Elite0.59 ± 0.32
World-class
0.38 ±0.06
Elite0.52 ± 0.30
Independent of category0.27 ± 0.50
Independent ofcategory
0.47 ± 0.24
Chen, Wu [37] Bunched start0.49 ± 0.19
Medium start0.40 ± 0.15
Elongated start0.42 ± 0.33
Debaere,Delecluse [6]
Elite sprinters0.84 ± 0.13
Slawinski,Bonnefoy [7]
Elite0.52 ± 0.06
Well-trained0.51 ± 0.14
Coh, Jost [13]Slovene national sprinters
0.69 ± 0.21
Slovene nationalsprinters
0.76 ± 0.19
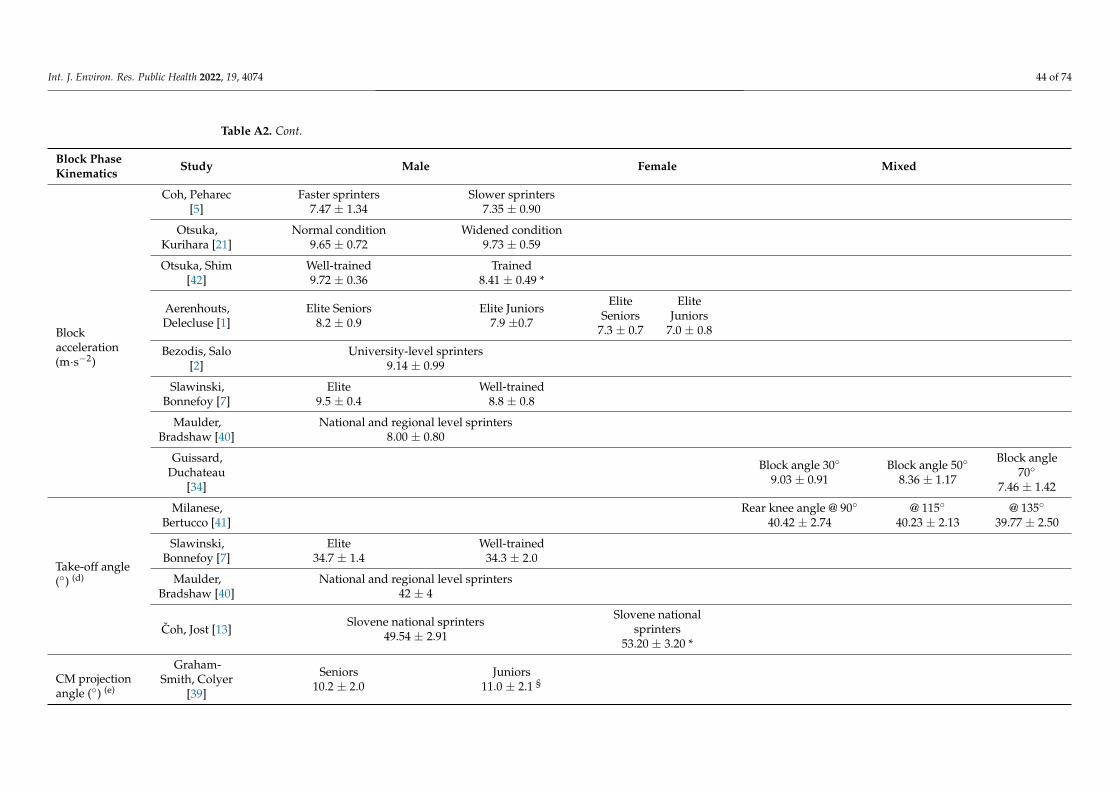
Int. J. Environ. Res. Public Health 2022, 19, 4074 44 of 74
Table A2. Cont.
Block PhaseKinematics Study Male Female Mixed
Blockacceleration(m·s−2)
Coh, Peharec[5]
Faster sprinters7.47 ± 1.34
Slower sprinters7.35 ± 0.90
Otsuka,Kurihara [21]
Normal condition9.65 ± 0.72
Widened condition9.73 ± 0.59
Otsuka, Shim[42]
Well-trained9.72 ± 0.36
Trained8.41 ± 0.49 *
Aerenhouts,Delecluse [1]
Elite Seniors8.2 ± 0.9
Elite Juniors7.9 ±0.7
EliteSeniors
7.3 ± 0.7
EliteJuniors
7.0 ± 0.8
Bezodis, Salo[2]
University-level sprinters9.14 ± 0.99
Slawinski,Bonnefoy [7]
Elite9.5 ± 0.4
Well-trained8.8 ± 0.8
Maulder,Bradshaw [40]
National and regional level sprinters8.00 ± 0.80
Guissard,Duchateau
[34]
Block angle 30◦
9.03 ± 0.91Block angle 50◦
8.36 ± 1.17
Block angle70◦
7.46 ± 1.42
Take-off angle(◦) (d)
Milanese,Bertucco [41]
Rear knee angle @ 90◦
40.42 ± 2.74@ 115◦
40.23 ± 2.13@ 135◦
39.77 ± 2.50
Slawinski,Bonnefoy [7]
Elite34.7 ± 1.4
Well-trained34.3 ± 2.0
Maulder,Bradshaw [40]
National and regional level sprinters42 ± 4
Coh, Jost [13]Slovene national sprinters
49.54 ± 2.91
Slovene nationalsprinters
53.20 ± 3.20 *
CM projectionangle (◦) (e)
Graham-Smith, Colyer
[39]
Seniors10.2 ± 2.0
Juniors11.0 ± 2.1 §
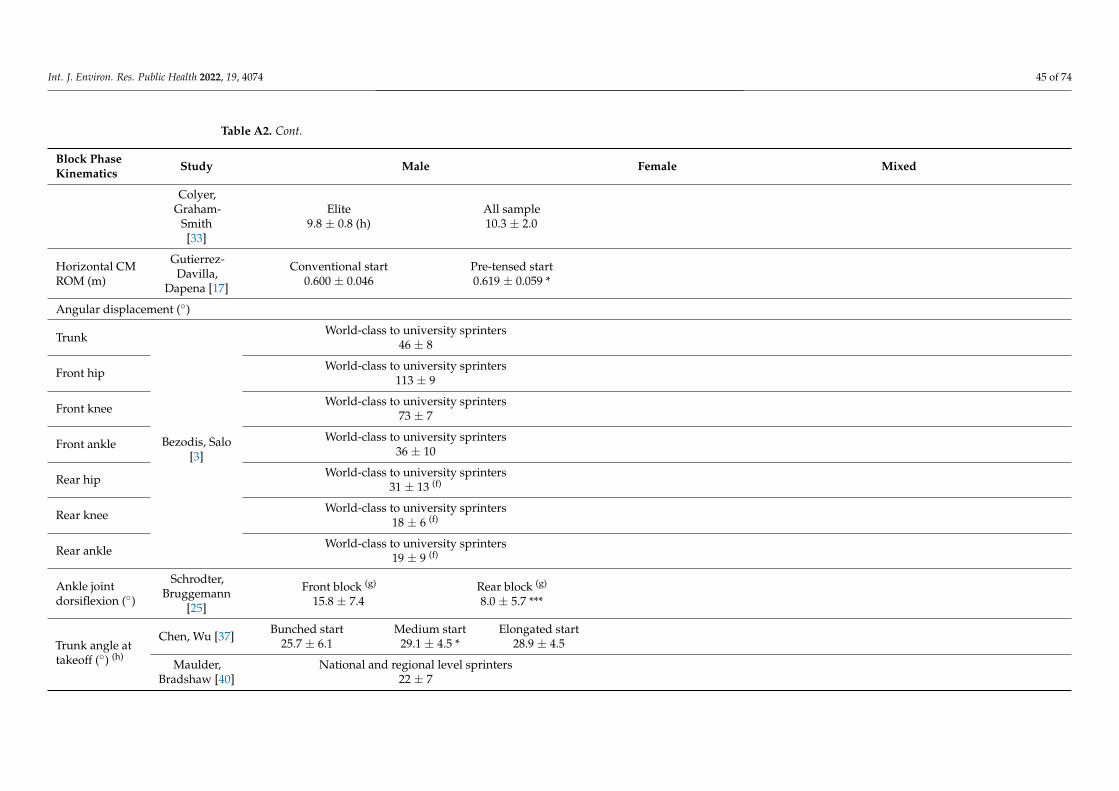
Int. J. Environ. Res. Public Health 2022, 19, 4074 45 of 74
Table A2. Cont.
Block PhaseKinematics Study Male Female Mixed
Colyer,Graham-
Smith[33]
Elite9.8 ± 0.8 (h)
All sample10.3 ± 2.0
Horizontal CMROM (m)
Gutierrez-Davilla,
Dapena [17]
Conventional start0.600 ± 0.046
Pre-tensed start0.619 ± 0.059 *
Angular displacement (◦)
Trunk
Bezodis, Salo[3]
World-class to university sprinters46 ± 8
Front hip World-class to university sprinters113 ± 9
Front knee World-class to university sprinters73 ± 7
Front ankle World-class to university sprinters36 ± 10
Rear hip World-class to university sprinters31 ± 13 (f)
Rear knee World-class to university sprinters18 ± 6 (f)
Rear ankle World-class to university sprinters19 ± 9 (f)
Ankle jointdorsiflexion (◦)
Schrodter,Bruggemann
[25]
Front block (g)
15.8 ± 7.4Rear block (g)
8.0 ± 5.7 ***
Trunk angle attakeoff (◦) (h)
Chen, Wu [37] Bunched start25.7 ± 6.1
Medium start29.1 ± 4.5 *
Elongated start28.9 ± 4.5
Maulder,Bradshaw [40]
National and regional level sprinters22 ± 7
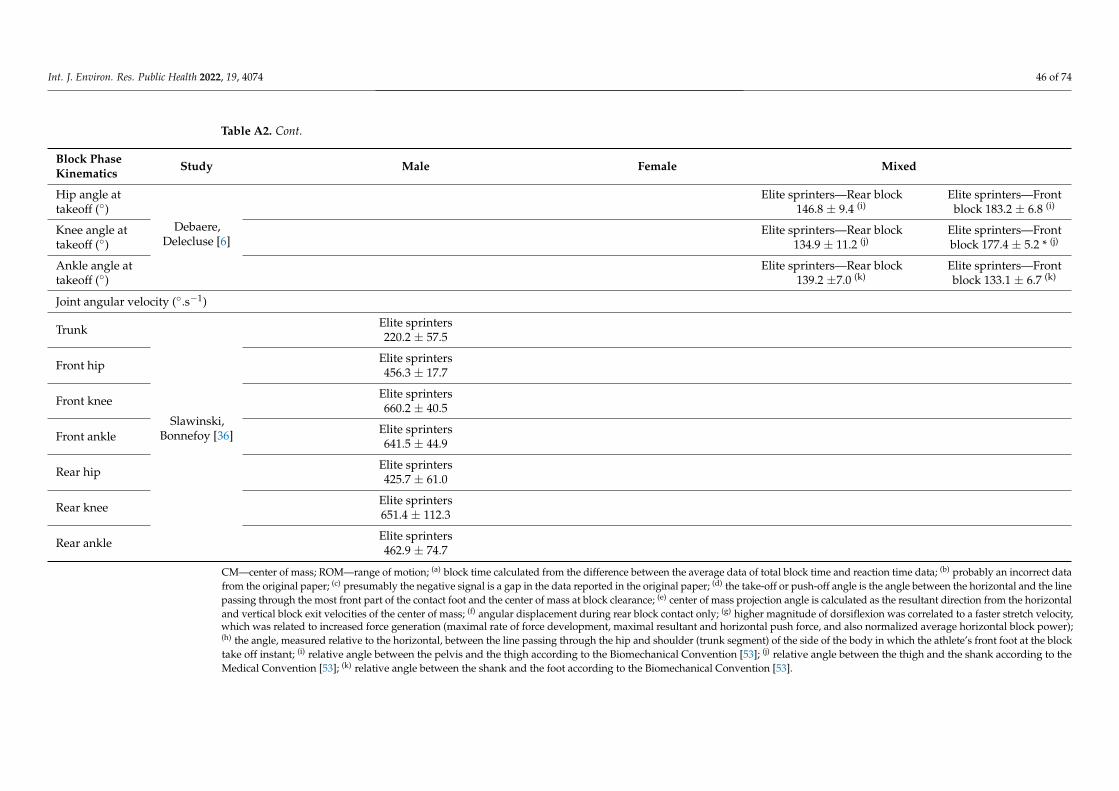
Int. J. Environ. Res. Public Health 2022, 19, 4074 46 of 74
Table A2. Cont.
Block PhaseKinematics Study Male Female Mixed
Hip angle attakeoff (◦)
Debaere,Delecluse [6]
Elite sprinters—Rear block146.8 ± 9.4 (i)
Elite sprinters—Frontblock 183.2 ± 6.8 (i)
Knee angle attakeoff (◦)
Elite sprinters—Rear block134.9 ± 11.2 (j)
Elite sprinters—Frontblock 177.4 ± 5.2 * (j)
Ankle angle attakeoff (◦)
Elite sprinters—Rear block139.2 ±7.0 (k)
Elite sprinters—Frontblock 133.1 ± 6.7 (k)
Joint angular velocity (◦.s−1)
Trunk
Slawinski,Bonnefoy [36]
Elite sprinters220.2 ± 57.5
Front hip Elite sprinters456.3 ± 17.7
Front knee Elite sprinters660.2 ± 40.5
Front ankle Elite sprinters641.5 ± 44.9
Rear hip Elite sprinters425.7 ± 61.0
Rear knee Elite sprinters651.4 ± 112.3
Rear ankle Elite sprinters462.9 ± 74.7
CM—center of mass; ROM—range of motion; (a) block time calculated from the difference between the average data of total block time and reaction time data; (b) probably an incorrect datafrom the original paper; (c) presumably the negative signal is a gap in the data reported in the original paper; (d) the take-off or push-off angle is the angle between the horizontal and the linepassing through the most front part of the contact foot and the center of mass at block clearance; (e) center of mass projection angle is calculated as the resultant direction from the horizontaland vertical block exit velocities of the center of mass; (f) angular displacement during rear block contact only; (g) higher magnitude of dorsiflexion was correlated to a faster stretch velocity,which was related to increased force generation (maximal rate of force development, maximal resultant and horizontal push force, and also normalized average horizontal block power);(h) the angle, measured relative to the horizontal, between the line passing through the hip and shoulder (trunk segment) of the side of the body in which the athlete’s front foot at the blocktake off instant; (i) relative angle between the pelvis and the thigh according to the Biomechanical Convention [53]; (j) relative angle between the thigh and the shank according to theMedical Convention [53]; (k) relative angle between the shank and the foot according to the Biomechanical Convention [53].
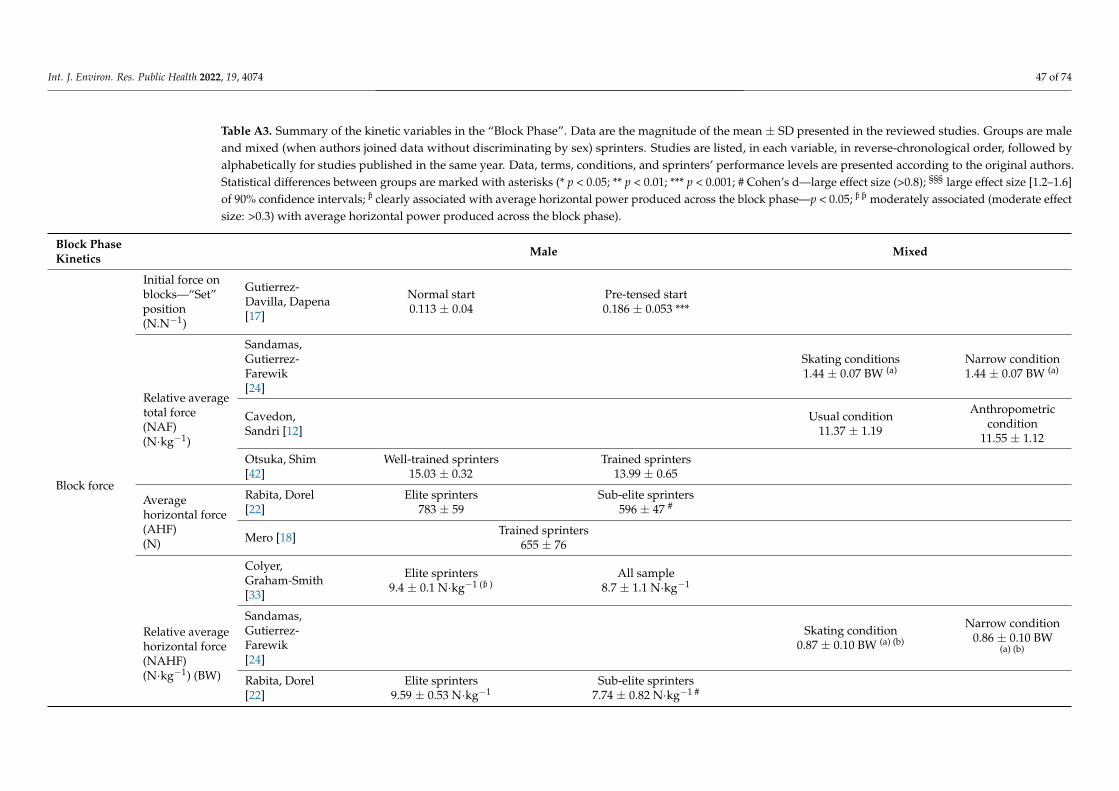
Int. J. Environ. Res. Public Health 2022, 19, 4074 47 of 74
Table A3. Summary of the kinetic variables in the “Block Phase”. Data are the magnitude of the mean ± SD presented in the reviewed studies. Groups are maleand mixed (when authors joined data without discriminating by sex) sprinters. Studies are listed, in each variable, in reverse-chronological order, followed byalphabetically for studies published in the same year. Data, terms, conditions, and sprinters’ performance levels are presented according to the original authors.Statistical differences between groups are marked with asterisks (* p < 0.05; ** p < 0.01; *** p < 0.001; # Cohen’s d—large effect size (>0.8); §§§ large effect size [1.2–1.6]of 90% confidence intervals;
1
Ϯ adults; ƥ different from descending significantly greater compared with either leg in the block phase).
clearly associated with average horizontal power produced across the block phase—p < 0.05;
1
Ϯ adults; ƥ different from descending significantly greater compared with either leg in the block phase).
1
Ϯ adults; ƥ different from descending significantly greater compared with either leg in the block phase).
moderately associated (moderate effectsize: >0.3) with average horizontal power produced across the block phase).
Block PhaseKinetics Male Mixed
Block force
Initial force onblocks—“Set”position(N.N−1)
Gutierrez-Davilla, Dapena[17]
Normal start0.113 ± 0.04
Pre-tensed start0.186 ± 0.053 ***
Relative averagetotal force(NAF)(N·kg−1)
Sandamas,Gutierrez-Farewik[24]
Skating conditions1.44 ± 0.07 BW (a)
Narrow condition1.44 ± 0.07 BW (a)
Cavedon,Sandri [12]
Usual condition11.37 ± 1.19
Anthropometriccondition
11.55 ± 1.12
Otsuka, Shim[42]
Well-trained sprinters15.03 ± 0.32
Trained sprinters13.99 ± 0.65
Averagehorizontal force(AHF)(N)
Rabita, Dorel[22]
Elite sprinters783 ± 59
Sub-elite sprinters596 ± 47 #
Mero [18] Trained sprinters655 ± 76
Relative averagehorizontal force(NAHF)(N·kg−1) (BW)
Colyer,Graham-Smith[33]
Elite sprinters9.4 ± 0.1 N·kg−1 (
1
Ϯ adults; ƥ different from descending significantly greater compared with either leg in the block phase).
)All sample
8.7 ± 1.1 N·kg−1
Sandamas,Gutierrez-Farewik[24]
Skating condition0.87 ± 0.10 BW (a) (b)
Narrow condition0.86 ± 0.10 BW
(a) (b)
Rabita, Dorel[22]
Elite sprinters9.59 ± 0.53 N·kg−1
Sub-elite sprinters7.74 ± 0.82 N·kg−1 #

Int. J. Environ. Res. Public Health 2022, 19, 4074 48 of 74
Table A3. Cont.
Block PhaseKinetics Male Mixed
Otsuka, Shim[42]
Well-trained sprinters9.72 ± 0.36 N·kg−1
Trained sprinters8.41 ± 0.49 N·kg−1 *
Peak-to-minimum horizontalforce average change(N·kg−1)(transition from bilateral tounilateral pushing)
Colyer,Graham-Smith[33]
Elite sprinters−10.3 ± 3.1 (
1
Ϯ adults; ƥ different from descending significantly greater compared with either leg in the block phase).
)All sample−10.6 ± 2.5
Resultant forcefront block resultant force(N)
Coh, Peharec [5] Faster sprinters1104 ± 82.53
Slower sprinters1073 ± 56.21
Relative front block resultantmean force(N·kg−1)
Nagahara,Gleadhill [35]
Normal condition9.25 ± 0.39
Anterior condition9.03 ± 0.63
Posterior condition9.44 ± 0.84
Otsuka, Shim[42]
Well-trained sprinters10.03 ± 1.07
Trained sprinters9.62 ± 0.94
Rear block resultant force(N) Coh, Peharec [5] Faster sprinters
913 ± 89.23Slower sprinters
771 ± 55.09 **
Relative rear block resultantmean force(N·kg−1)
Nagahara,Gleadhill [35]
Normal condition7.20 ± 0.52
Anterior condition6.05 ± 1.55
Posterior condition8.23 ± 1.13 * (c)
Otsuka, Shim[42]
Well-trained sprinters7.71 ± 1.24
Trained sprinters7.46 ± 1.04
Horizontal force
Front block horizontal maximalforce(N)
Coh, Peharec [5] Faster sprinters461 ± 51.05
Slower sprinters398 ± 56.73
Aerenhouts,Delecluse [1]
Elite Seniors686 ± 110
Elite Juniors623 ± 105
Elite Seniors (d)
482 ± 98Elite Juniors (d)
454 ± 65
Relative front blockhorizontal maximal force(N·kg−1)
Cavedon,Sandri [12]
Usual condition6.02 ± 0.71
Anthropometriccondition
5.91 ± 0.65
Relative front block horizontalmean force (N·kg−1)
Nagahara,Gleadhill [35]
Normal condition5.87 ± 0.38
Anterior condition5.93 ± 0.56
Posterior condition6.25 ± 0.64

Int. J. Environ. Res. Public Health 2022, 19, 4074 49 of 74
Table A3. Cont.
Block PhaseKinetics Male Mixed
Otsuka, Shim[42]
Well-trained sprinters6.70 ± 0.58
Trained sprinters5.99 ± 0.67
Rear block horizontal maximalforce(N)
Coh, Peharec [5] Faster sprinters460 ± 58.12
Slower sprinters423 ± 45.50
Aerenhouts,Delecluse [1]
Elite Seniors785 ± 220
Elite Juniors697 ± 143
Elite Seniors (d)
485 ± 986Elite Juniors (d)
435 ± 115
Relative rear blockhorizontal maximal force(N·kg−1)
Cavedon,Sandri [12]
Usual condition4.52 ± 1.09
Anthropometriccondition
4.95 ± 1.34 *
Relative rear blockhorizontal mean force(N·kg−1)
Nagahara,Gleadhill [35]
Normal condition5.18 ± 0.38
Anterior condition3.97 ± 1.17
Posterior condition6.14 ± 0.86 ** (c)
Otsuka, Shim[42]
Well-trained sprinters5.82 ± 0.71
Trained sprinters5.41 ± 0.88
Vertical force
Front block verticalmaximal force (N) Coh, Peharec [5] Faster sprinters
1019 ± 69.99Slower sprinters
978 ± 43.12
Relative front blockvertical maximal force (N·kg−1)
Cavedon,Sandri [12]
Usual condition6.13 ± 0.92
Anthropometriccondition
6.12 ± 0.90
Relative front blockvertical mean force (N·kg−1)
Nagahara,Gleadhill [35]
Normal condition7.15 ± 0.29
Anterior condition6.81 ± 0.40
Posterior condition7.07 ± 0.64
Otsuka, Shim[42]
Well-trained sprinters7.43 ± 1.01
Trained sprinters7.50 ± 0.78
Rear block verticalmaximal force (N) Coh, Peharec [5] Faster sprinters
795 ± 91.29Slower sprinters
645 ± 41.55 **
Relative rear block verticalmaximal force (N·kg−1)
Cavedon,Sandri [12]
Usual condition3.78 ± 1.12
Anthropometriccondition
3.96 ± 1.20

Int. J. Environ. Res. Public Health 2022, 19, 4074 50 of 74
Table A3. Cont.
Block PhaseKinetics Male Mixed
Relative rear blockvertical mean force(N·kg−1)
Nagahara,Gleadhill [35]
Normal condition4.99 ± 0.57
Anterior condition4.53 ± 1.17
Posterior condition5.47 ± 0.83
Otsuka, Shim[42]
Well-trained sprinters5.03 ± 1.15
Trained sprinters5.12 ± 0.68
Maximal rate of forcedevelopment(N·s−1) (N·kg−1·s−1)
Schrodter,Bruggemann[25]
World-class sprinters259 ± 79 N·kg−1.s−1
Well-trainedsprinters175 ± 86
N·kg−1.s−1 **
Slawinski,Bonnefoy [7]
Elite15505 ± 5397 N·s−1
Well-trained8459 ± 3811 N·s−1 *
Block power
Averagehorizontal blockpower(W) (e)
Bezodis, Walton[10]
Sprint start-trained athletes832 ± 113
Bezodis, Salo [3](f)
World-class to university sprinters1171 ± 268
Rabita, Dorel[22]
Elite sprinters1415 ± 118
Sub-elite sprinters949 ± 124 #
Bezodis, Salo [2](f)
University-level sprinters1094 ± 264
Relative averagehorizontalexternal power(W·kg−1)
Graham-Smith,Colyer [39]
Seniors sprinters15.5 ± 1.5
Juniors sprinters12.4 ± 2.2 §§§
Nagahara,Gleadhill [35]
Normal condition14.8 ± 1.0
Anterior condition13.2 ± 1.3
Posterior condition16.2 ± 2.1 ** (c)
Colyer,Graham-Smith[33]
Mix of elite, senior and junior sprinters14.3 ± 2.3
Nagahara andOhshima [20]
Sprinters14.7 ± 1.4
Rabita, Dorel[22]
Elite sprinters17.3 ± 1.3
Sub-elite sprinters12.3 ± 1.9 #
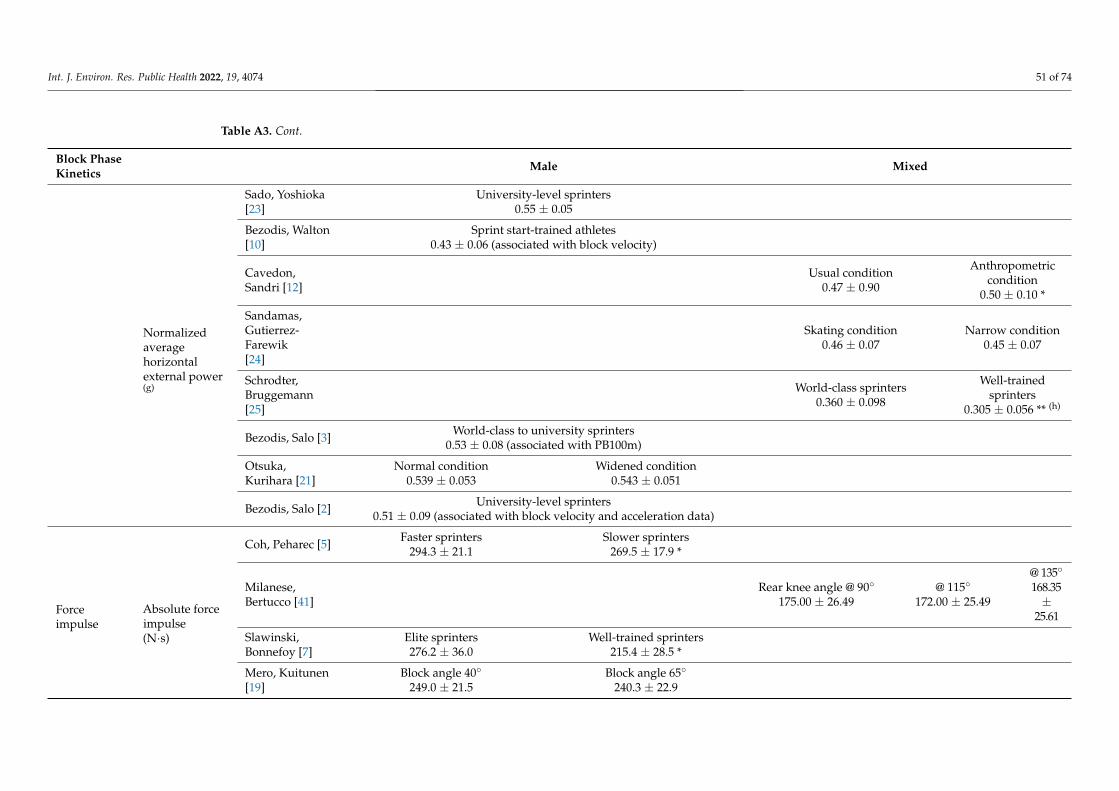
Int. J. Environ. Res. Public Health 2022, 19, 4074 51 of 74
Table A3. Cont.
Block PhaseKinetics Male Mixed
Normalizedaveragehorizontalexternal power(g)
Sado, Yoshioka[23]
University-level sprinters0.55 ± 0.05
Bezodis, Walton[10]
Sprint start-trained athletes0.43 ± 0.06 (associated with block velocity)
Cavedon,Sandri [12]
Usual condition0.47 ± 0.90
Anthropometriccondition
0.50 ± 0.10 *
Sandamas,Gutierrez-Farewik[24]
Skating condition0.46 ± 0.07
Narrow condition0.45 ± 0.07
Schrodter,Bruggemann[25]
World-class sprinters0.360 ± 0.098
Well-trainedsprinters
0.305 ± 0.056 ** (h)
Bezodis, Salo [3] World-class to university sprinters0.53 ± 0.08 (associated with PB100m)
Otsuka,Kurihara [21]
Normal condition0.539 ± 0.053
Widened condition0.543 ± 0.051
Bezodis, Salo [2] University-level sprinters0.51 ± 0.09 (associated with block velocity and acceleration data)
Forceimpulse
Absolute forceimpulse(N·s)
Coh, Peharec [5] Faster sprinters294.3 ± 21.1
Slower sprinters269.5 ± 17.9 *
Milanese,Bertucco [41]
Rear knee angle @ 90◦
175.00 ± 26.49@ 115◦
172.00 ± 25.49
@ 135◦
168.35±
25.61
Slawinski,Bonnefoy [7]
Elite sprinters276.2 ± 36.0
Well-trained sprinters215.4 ± 28.5 *
Mero, Kuitunen[19]
Block angle 40◦
249.0 ± 21.5Block angle 65◦
240.3 ± 22.9

Int. J. Environ. Res. Public Health 2022, 19, 4074 52 of 74
Table A3. Cont.
Block PhaseKinetics Male Mixed
Relative forceimpulse(N·s·kg−1)(m·s−1)
Cavedon,Sandri [12]
Usual condition4.76 ± 0.55 N·s·kg−1
Anthropometriccondition
4.93 ± 0.56N·s·kg−1
Sandamas,Gutierrez-Farewik[24]
Skating conditions3.27 ± 0.15 m·s−1
Narrow conditions3.25 ± 0.16 m·s−1
Horizontal forceimpulse(N·s)
Coh, Peharec [5] Faster sprinters140.7 ± 11.5
Slower sprinters112.8 ± 10.4 ***
Mero [18] Trained sprinters223 ± 18
Relativehorizontal forceimpulse(m·s−1)(N·s·kg−1)
Sandamas,Gutierrez-Farewik[24]
Skating condition3.21 ± 0.16 m·s−1
Narrow condition3.19 ± 0.16 m·s−1
Otsuka,Kurihara [21]
Normal condition3.20 ± 0.18 N·s·kg−1
Widened condition3.20 ± 0.20 N·s·kg−1
Otsuka, Shim[42]
Well-trained sprinters3.407 ± 0.149 N·s·kg−1
Trained sprinters3.179 ± 0.163 N·s·kg−1
Vertical forceimpulse(N·s)
Coh, Peharec [5] Faster sprinters256.1± 9.7
Slower sprinters209.8 ± 8.9 ***
Mero [18] Trained sprinters173 ± 30
Normalizedvertical forceimpulse (m·s−1)
Sandamas,Gutierrez-Farewik[24]
Skating condition0.54 ± 0.07
Narrow condition0.59 ± 0.08 *
Normalizedme-diolateral forceimpulse (m·s−1)
Sandamas,Gutierrez-Farewik [24]
Skating conditions0.23 ± 0.10
Narrow condition0.08 ± 0.05 *
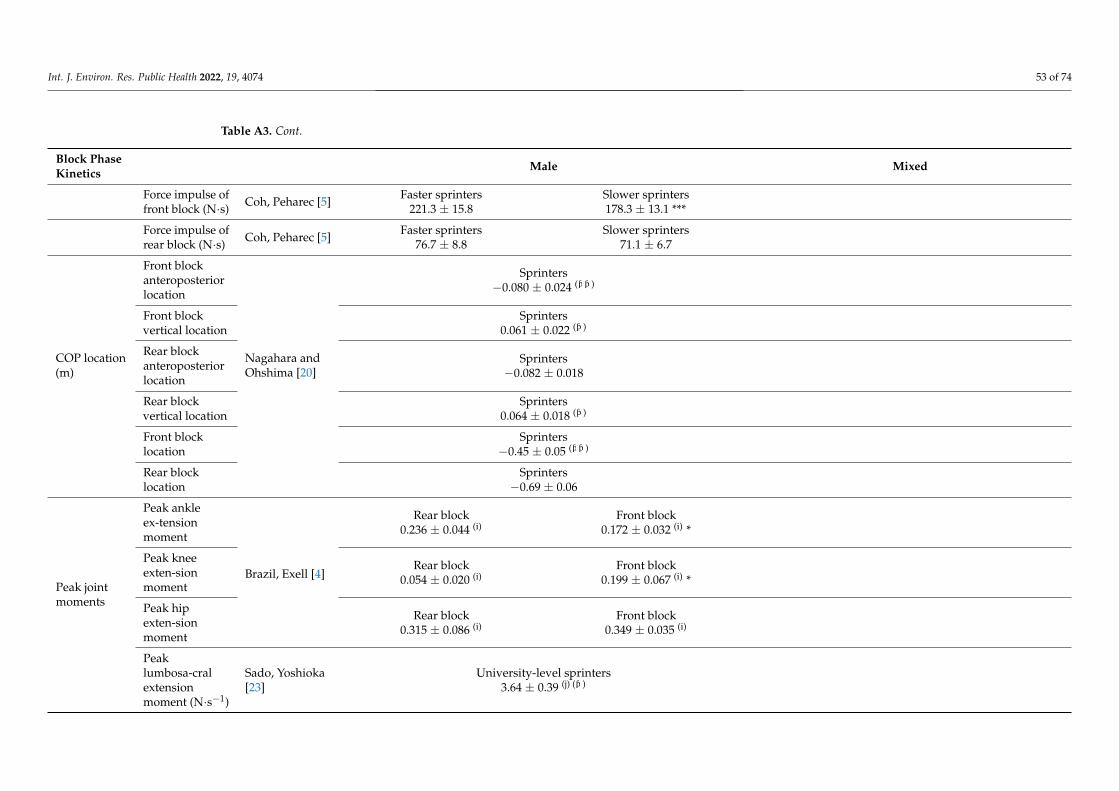
Int. J. Environ. Res. Public Health 2022, 19, 4074 53 of 74
Table A3. Cont.
Block PhaseKinetics Male Mixed
Force impulse offront block (N·s) Coh, Peharec [5] Faster sprinters
221.3 ± 15.8Slower sprinters178.3 ± 13.1 ***
Force impulse ofrear block (N·s) Coh, Peharec [5] Faster sprinters
76.7 ± 8.8Slower sprinters
71.1 ± 6.7
COP location(m)
Front blockanteroposteriorlocation
Nagahara andOhshima [20]
Sprinters−0.080 ± 0.024 (
1
Ϯ adults; ƥ different from descending significantly greater compared with either leg in the block phase).
1
Ϯ adults; ƥ different from descending significantly greater compared with either leg in the block phase).
)
Front blockvertical location
Sprinters0.061 ± 0.022 (
1
Ϯ adults; ƥ different from descending significantly greater compared with either leg in the block phase).
)
Rear blockanteroposteriorlocation
Sprinters−0.082 ± 0.018
Rear blockvertical location
Sprinters0.064 ± 0.018 (
1
Ϯ adults; ƥ different from descending significantly greater compared with either leg in the block phase).
)
Front blocklocation
Sprinters−0.45 ± 0.05 (
1
Ϯ adults; ƥ different from descending significantly greater compared with either leg in the block phase).
1
Ϯ adults; ƥ different from descending significantly greater compared with either leg in the block phase).
)
Rear blocklocation
Sprinters−0.69 ± 0.06
Peak jointmoments
Peak ankleex-tensionmoment
Brazil, Exell [4]
Rear block0.236 ± 0.044 (i)
Front block0.172 ± 0.032 (i) *
Peak kneeexten-sionmoment
Rear block0.054 ± 0.020 (i)
Front block0.199 ± 0.067 (i) *
Peak hipexten-sionmoment
Rear block0.315 ± 0.086 (i)
Front block0.349 ± 0.035 (i)
Peaklumbosa-cralextensionmoment (N·s−1)
Sado, Yoshioka[23]
University-level sprinters3.64 ± 0.39 (j) (
1
Ϯ adults; ƥ different from descending significantly greater compared with either leg in the block phase).
)
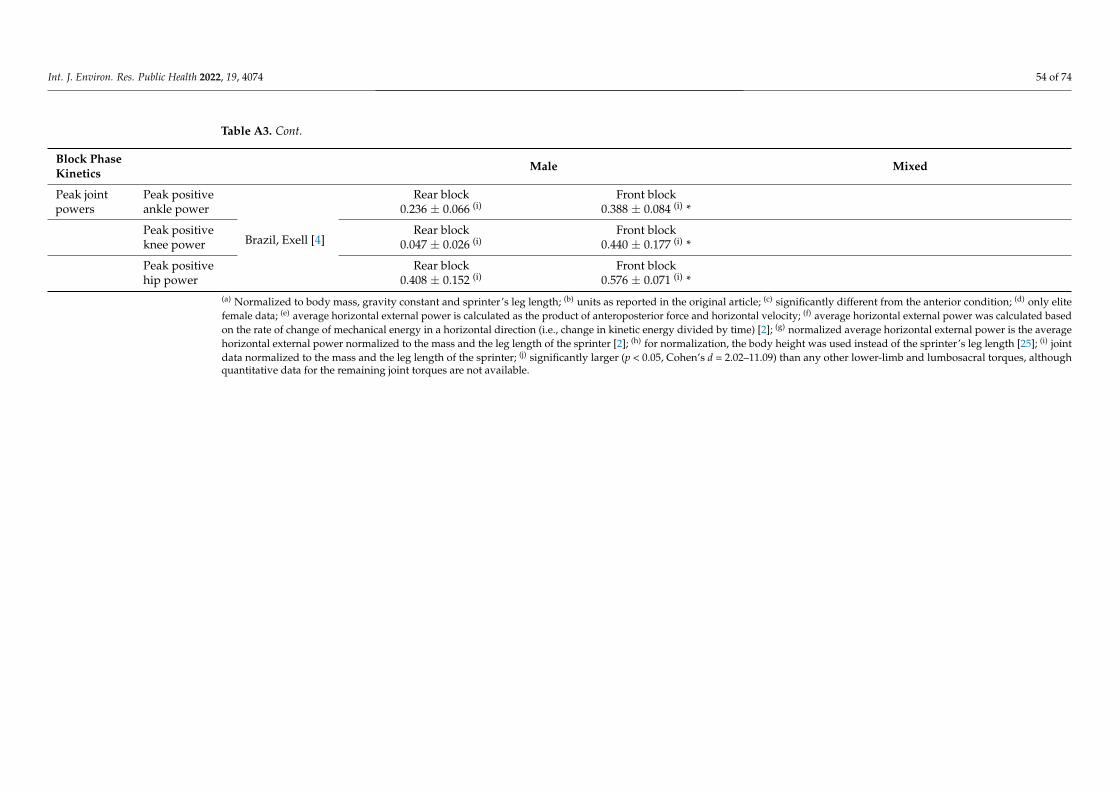
Int. J. Environ. Res. Public Health 2022, 19, 4074 54 of 74
Table A3. Cont.
Block PhaseKinetics Male Mixed
Peak jointpowers
Peak positiveankle power
Brazil, Exell [4]
Rear block0.236 ± 0.066 (i)
Front block0.388 ± 0.084 (i) *
Peak positiveknee power
Rear block0.047 ± 0.026 (i)
Front block0.440 ± 0.177 (i) *
Peak positivehip power
Rear block0.408 ± 0.152 (i)
Front block0.576 ± 0.071 (i) *
(a) Normalized to body mass, gravity constant and sprinter’s leg length; (b) units as reported in the original article; (c) significantly different from the anterior condition; (d) only elitefemale data; (e) average horizontal external power is calculated as the product of anteroposterior force and horizontal velocity; (f) average horizontal external power was calculated basedon the rate of change of mechanical energy in a horizontal direction (i.e., change in kinetic energy divided by time) [2]; (g) normalized average horizontal external power is the averagehorizontal external power normalized to the mass and the leg length of the sprinter [2]; (h) for normalization, the body height was used instead of the sprinter’s leg length [25]; (i) jointdata normalized to the mass and the leg length of the sprinter; (j) significantly larger (p < 0.05, Cohen’s d = 2.02–11.09) than any other lower-limb and lumbosacral torques, althoughquantitative data for the remaining joint torques are not available.
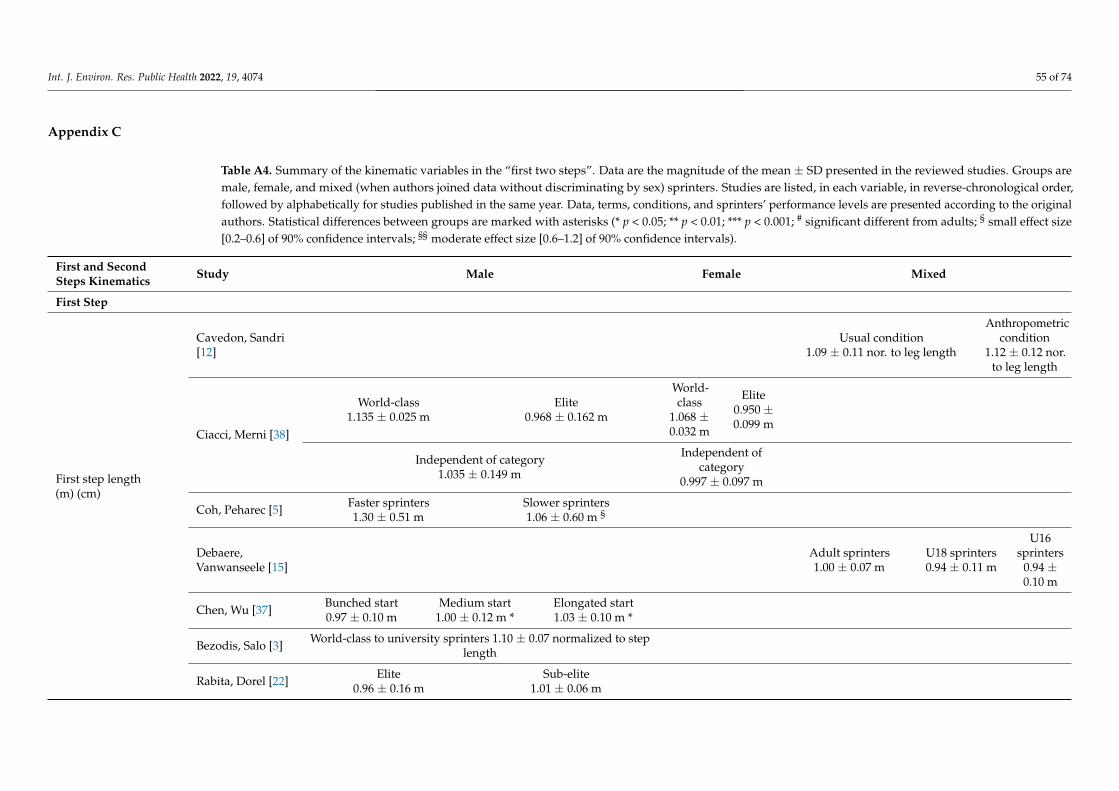
Int. J. Environ. Res. Public Health 2022, 19, 4074 55 of 74
Appendix C
Table A4. Summary of the kinematic variables in the “first two steps”. Data are the magnitude of the mean ± SD presented in the reviewed studies. Groups aremale, female, and mixed (when authors joined data without discriminating by sex) sprinters. Studies are listed, in each variable, in reverse-chronological order,followed by alphabetically for studies published in the same year. Data, terms, conditions, and sprinters’ performance levels are presented according to the originalauthors. Statistical differences between groups are marked with asterisks (* p < 0.05; ** p < 0.01; *** p < 0.001; # significant different from adults; § small effect size[0.2–0.6] of 90% confidence intervals; §§ moderate effect size [0.6–1.2] of 90% confidence intervals).
First and SecondSteps Kinematics Study Male Female Mixed
First Step
First step length(m) (cm)
Cavedon, Sandri[12]
Usual condition1.09 ± 0.11 nor. to leg length
Anthropometriccondition
1.12 ± 0.12 nor.to leg length
Ciacci, Merni [38]
World-class1.135 ± 0.025 m
Elite0.968 ± 0.162 m
World-class
1.068 ±0.032 m
Elite0.950 ±0.099 m
Independent of category1.035 ± 0.149 m
Independent ofcategory
0.997 ± 0.097 m
Coh, Peharec [5] Faster sprinters1.30 ± 0.51 m
Slower sprinters1.06 ± 0.60 m §
Debaere,Vanwanseele [15]
Adult sprinters1.00 ± 0.07 m
U18 sprinters0.94 ± 0.11 m
U16sprinters
0.94 ±0.10 m
Chen, Wu [37] Bunched start0.97 ± 0.10 m
Medium start1.00 ± 0.12 m *
Elongated start1.03 ± 0.10 m *
Bezodis, Salo [3] World-class to university sprinters 1.10 ± 0.07 normalized to steplength
Rabita, Dorel [22] Elite0.96 ± 0.16 m
Sub-elite1.01 ± 0.06 m
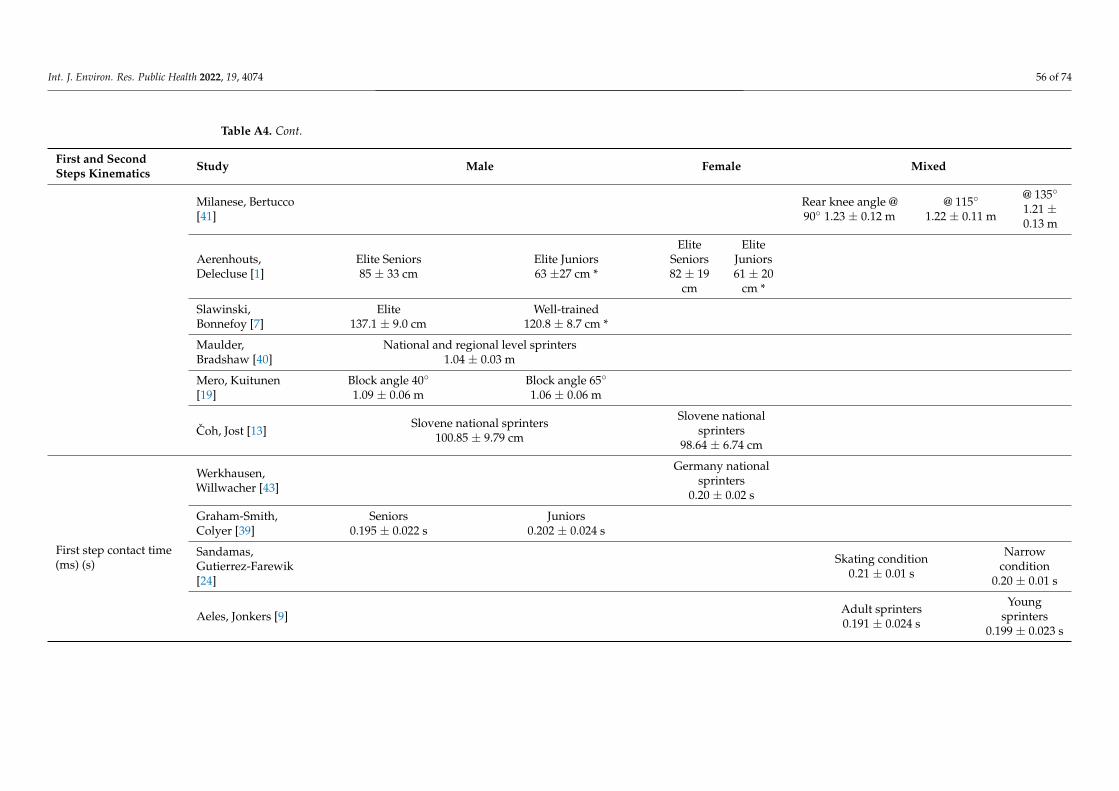
Int. J. Environ. Res. Public Health 2022, 19, 4074 56 of 74
Table A4. Cont.
First and SecondSteps Kinematics Study Male Female Mixed
Milanese, Bertucco[41]
Rear knee angle @90◦ 1.23 ± 0.12 m
@ 115◦
1.22 ± 0.11 m
@ 135◦
1.21 ±0.13 m
Aerenhouts,Delecluse [1]
Elite Seniors85 ± 33 cm
Elite Juniors63 ±27 cm *
EliteSeniors82 ± 19
cm
EliteJuniors61 ± 20
cm *
Slawinski,Bonnefoy [7]
Elite137.1 ± 9.0 cm
Well-trained120.8 ± 8.7 cm *
Maulder,Bradshaw [40]
National and regional level sprinters1.04 ± 0.03 m
Mero, Kuitunen[19]
Block angle 40◦
1.09 ± 0.06 mBlock angle 65◦
1.06 ± 0.06 m
Coh, Jost [13]Slovene national sprinters
100.85 ± 9.79 cm
Slovene nationalsprinters
98.64 ± 6.74 cm
First step contact time(ms) (s)
Werkhausen,Willwacher [43]
Germany nationalsprinters
0.20 ± 0.02 s
Graham-Smith,Colyer [39]
Seniors0.195 ± 0.022 s
Juniors0.202 ± 0.024 s
Sandamas,Gutierrez-Farewik[24]
Skating condition0.21 ± 0.01 s
Narrowcondition
0.20 ± 0.01 s
Aeles, Jonkers [9] Adult sprinters0.191 ± 0.024 s
Youngsprinters
0.199 ± 0.023 s

Int. J. Environ. Res. Public Health 2022, 19, 4074 57 of 74
Table A4. Cont.
First and SecondSteps Kinematics Study Male Female Mixed
Ciacci, Merni [38]
World-class0.210 ± 0.035 s
Elite0.176 ± 0.008 s
World-class
0.225 ±0.034 s
Elite0.166 ±0.017 s
Independent of category0.189 ± 0.027 s
Independent ofcategory
0.190 ± 0.038 s
Coh, Peharec [5] Faster sprinters170 ± 18.17 ms
Slower sprinters174 ± 16.94 ms
Aerenhouts,Delecluse [1]
Elite Seniors173 ± 67 ms
Elite Juniors199 ± 24 ms
EliteSeniors
196 ± 62ms
EliteJuniors
210 ± 17ms
Slawinski,Bonnefoy [7]
Elite0.173 ± 0.010 s
Well-trained0.167 ± 0.011 s
Maulder,Bradshaw [40]
National and regional level sprinters0.20 ± 0.02 s
Mero, Kuitunen[19]
Block angle 40◦
0.185 ± 0.020 sBlock angle 65◦
0.197 ± 0.019 s
First flight time(ms) (s)
Ciacci, Merni [38]
World-class0.045 ± 0.025 s
Elite0.064 ± 0.009 s
World-class
0.045 ±0.025 s
Elite0.085 ±0.011 s
Independent of category0.056 ± 0.019 s
Independent ofcategory
0.069 ± 0.027 s
Bezodis, Salo [3] World-class to university sprinters 0.073 ± 0.022 s
Rabita, Dorel [22] Elite81 ± 13 ms
Sub-elite70 ± 25 ms

Int. J. Environ. Res. Public Health 2022, 19, 4074 58 of 74
Table A4. Cont.
First and SecondSteps Kinematics Study Male Female Mixed
Slawinski,Bonnefoy [7]
Elite0.093 ± 0.009 s
Well-trained0.087 ± 0.021 s
Maulder,Bradshaw [40]
National and regional level sprinters0.07 ± 0.01 s
Horizontal CMposition—first steptouchdown (cm) (a)
Slawinski,Bonnefoy [7]
Elite68.5 ± 4.7
Well-trained58.0 ± 8.1 *
Normalized first steptouchdown distance (b) Bezodis, Salo [3] World-class to university sprinters
−0.20 ± 0.07
Horizontal CMposition—first steptakeoff (cm) (a)
Slawinski,Bonnefoy [7]
Elite137.1 ± 9.0
Well-trained120.8 ± 8.7 *
First step resultantvelocity (m·s−1)
Debaere,Vanwanseele [15]
Adult sprinters4.34 ± 0.25
U18 sprinters4.06 ± 0.24 #
U16sprinters
4.01 ±0.25 #
Slawinski, Dumas[8]
Bunched start3.81 ± 0.18
Medium start3.85 ± 0.16
Elongatedstart
3.90 ±0.15
Slawinski,Bonnefoy [7]
Elite4.69 ± 0.15
Well-trained4.42 ± 0.11 *
Coh, Jost [13]Slovene national sprinters
4.48 ± 0.29
Slovene nationalsprinters
4.29 ± 0.18
Mero [18] Trained sprinters4.65 ± 0.28
First step horizontalvelocity (touchdown)(m·s−1)
Sandamas,Gutierrez-Farewik[24]
Skating condition3.10 ± 0.16
Narrowcondition
3.08 ± 0.16
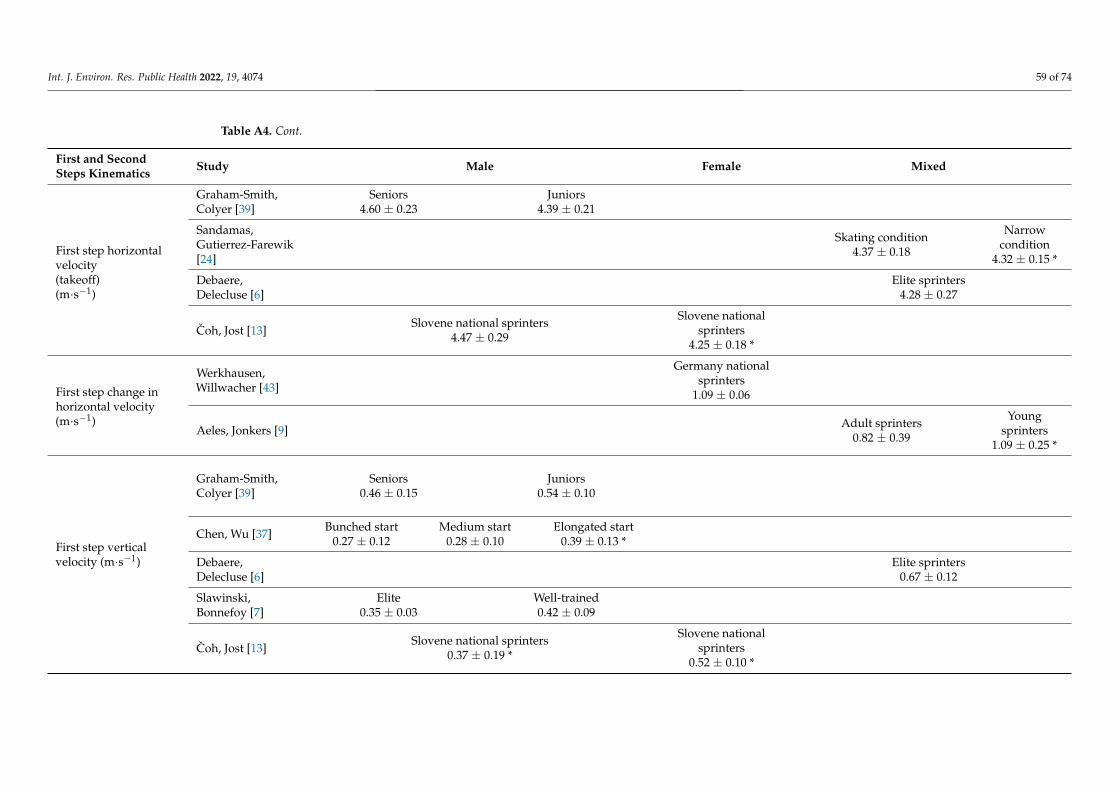
Int. J. Environ. Res. Public Health 2022, 19, 4074 59 of 74
Table A4. Cont.
First and SecondSteps Kinematics Study Male Female Mixed
First step horizontalvelocity(takeoff)(m·s−1)
Graham-Smith,Colyer [39]
Seniors4.60 ± 0.23
Juniors4.39 ± 0.21
Sandamas,Gutierrez-Farewik[24]
Skating condition4.37 ± 0.18
Narrowcondition
4.32 ± 0.15 *
Debaere,Delecluse [6]
Elite sprinters4.28 ± 0.27
Coh, Jost [13]Slovene national sprinters
4.47 ± 0.29
Slovene nationalsprinters
4.25 ± 0.18 *
First step change inhorizontal velocity(m·s−1)
Werkhausen,Willwacher [43]
Germany nationalsprinters
1.09 ± 0.06
Aeles, Jonkers [9] Adult sprinters0.82 ± 0.39
Youngsprinters
1.09 ± 0.25 *
First step verticalvelocity (m·s−1)
Graham-Smith,Colyer [39]
Seniors0.46 ± 0.15
Juniors0.54 ± 0.10
Chen, Wu [37] Bunched start0.27 ± 0.12
Medium start0.28 ± 0.10
Elongated start0.39 ± 0.13 *
Debaere,Delecluse [6]
Elite sprinters0.67 ± 0.12
Slawinski,Bonnefoy [7]
Elite0.35 ± 0.03
Well-trained0.42 ± 0.09
Coh, Jost [13]Slovene national sprinters
0.37 ± 0.19 *
Slovene nationalsprinters
0.52 ± 0.10 *
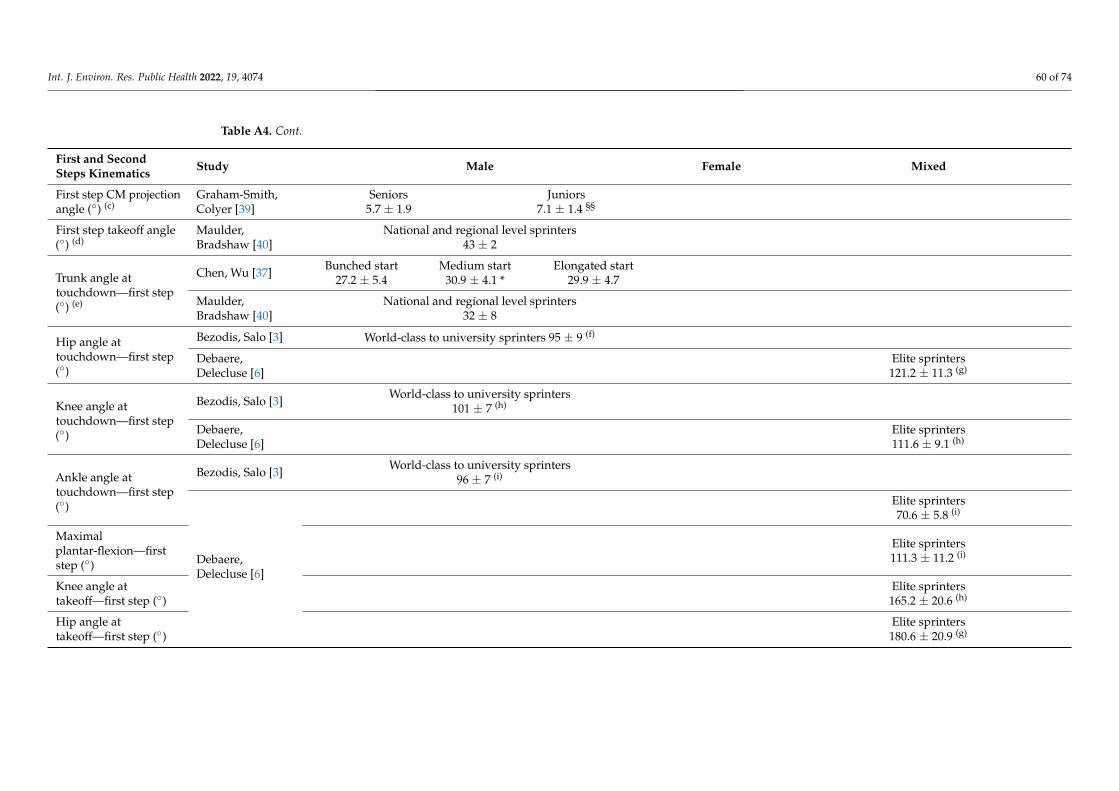
Int. J. Environ. Res. Public Health 2022, 19, 4074 60 of 74
Table A4. Cont.
First and SecondSteps Kinematics Study Male Female Mixed
First step CM projectionangle (◦) (c)
Graham-Smith,Colyer [39]
Seniors5.7 ± 1.9
Juniors7.1 ± 1.4 §§
First step takeoff angle(◦) (d)
Maulder,Bradshaw [40]
National and regional level sprinters43 ± 2
Trunk angle attouchdown—first step(◦) (e)
Chen, Wu [37] Bunched start27.2 ± 5.4
Medium start30.9 ± 4.1 *
Elongated start29.9 ± 4.7
Maulder,Bradshaw [40]
National and regional level sprinters32 ± 8
Hip angle attouchdown—first step(◦)
Bezodis, Salo [3] World-class to university sprinters 95 ± 9 (f)
Debaere,Delecluse [6]
Elite sprinters121.2 ± 11.3 (g)
Knee angle attouchdown—first step(◦)
Bezodis, Salo [3] World-class to university sprinters101 ± 7 (h)
Debaere,Delecluse [6]
Elite sprinters111.6 ± 9.1 (h)
Ankle angle attouchdown—first step(◦)
Bezodis, Salo [3] World-class to university sprinters96 ± 7 (i)
Debaere,Delecluse [6]
Elite sprinters70.6 ± 5.8 (i)
Maximalplantar-flexion—firststep (◦)
Elite sprinters111.3 ± 11.2 (i)
Knee angle attakeoff—first step (◦)
Elite sprinters165.2 ± 20.6 (h)
Hip angle attakeoff—first step (◦)
Elite sprinters180.6 ± 20.9 (g)
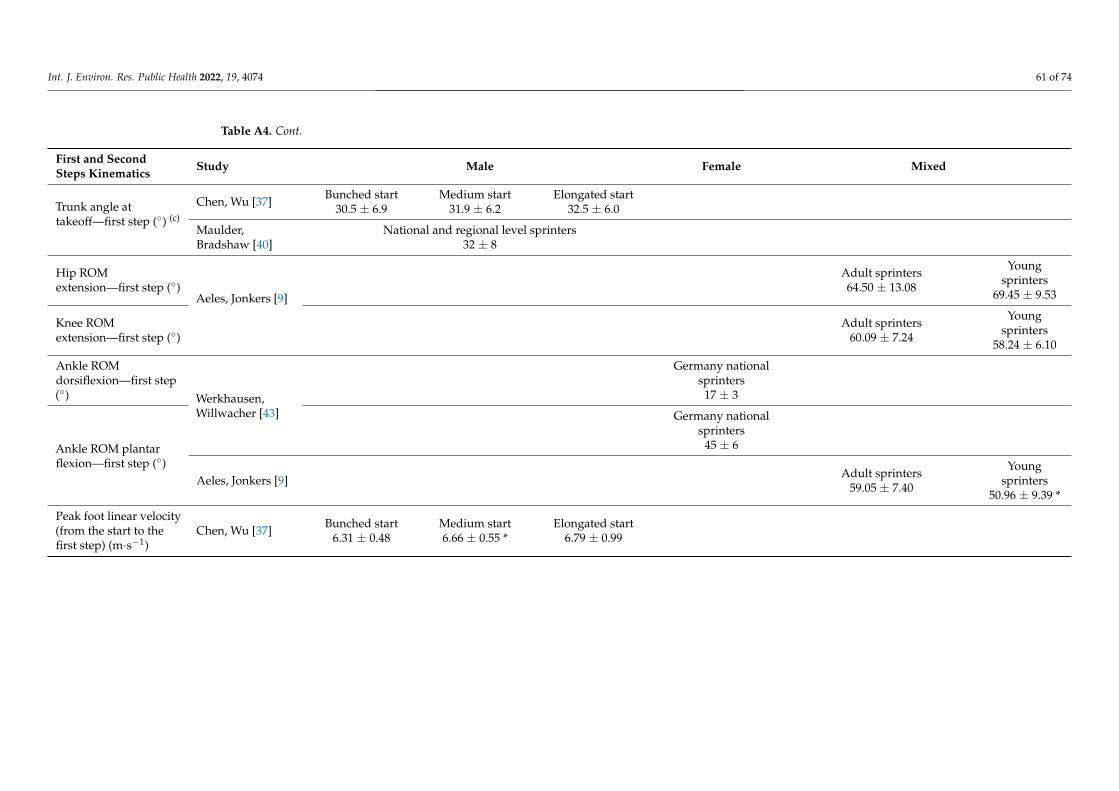
Int. J. Environ. Res. Public Health 2022, 19, 4074 61 of 74
Table A4. Cont.
First and SecondSteps Kinematics Study Male Female Mixed
Trunk angle attakeoff—first step (◦) (c)
Chen, Wu [37] Bunched start30.5 ± 6.9
Medium start31.9 ± 6.2
Elongated start32.5 ± 6.0
Maulder,Bradshaw [40]
National and regional level sprinters32 ± 8
Hip ROMextension—first step (◦)
Aeles, Jonkers [9]
Adult sprinters64.50 ± 13.08
Youngsprinters
69.45 ± 9.53
Knee ROMextension—first step (◦)
Adult sprinters60.09 ± 7.24
Youngsprinters
58.24 ± 6.10
Ankle ROMdorsiflexion—first step(◦) Werkhausen,
Willwacher [43]
Germany nationalsprinters
17 ± 3
Ankle ROM plantarflexion—first step (◦)
Germany nationalsprinters
45 ± 6
Aeles, Jonkers [9] Adult sprinters59.05 ± 7.40
Youngsprinters
50.96 ± 9.39 *
Peak foot linear velocity(from the start to thefirst step) (m·s−1)
Chen, Wu [37] Bunched start6.31 ± 0.48
Medium start6.66 ± 0.55 *
Elongated start6.79 ± 0.99
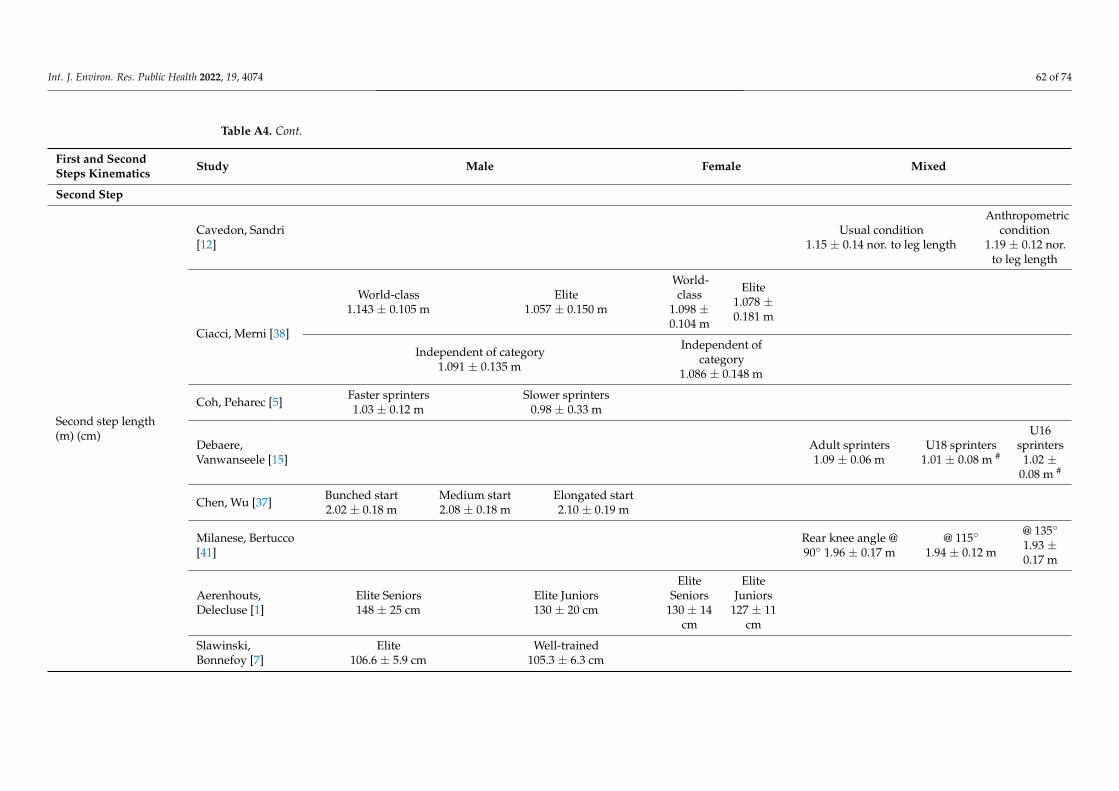
Int. J. Environ. Res. Public Health 2022, 19, 4074 62 of 74
Table A4. Cont.
First and SecondSteps Kinematics Study Male Female Mixed
Second Step
Second step length(m) (cm)
Cavedon, Sandri[12]
Usual condition1.15 ± 0.14 nor. to leg length
Anthropometriccondition
1.19 ± 0.12 nor.to leg length
Ciacci, Merni [38]
World-class1.143 ± 0.105 m
Elite1.057 ± 0.150 m
World-class
1.098 ±0.104 m
Elite1.078 ±0.181 m
Independent of category1.091 ± 0.135 m
Independent ofcategory
1.086 ± 0.148 m
Coh, Peharec [5] Faster sprinters1.03 ± 0.12 m
Slower sprinters0.98 ± 0.33 m
Debaere,Vanwanseele [15]
Adult sprinters1.09 ± 0.06 m
U18 sprinters1.01 ± 0.08 m #
U16sprinters
1.02 ±0.08 m #
Chen, Wu [37] Bunched start2.02 ± 0.18 m
Medium start2.08 ± 0.18 m
Elongated start2.10 ± 0.19 m
Milanese, Bertucco[41]
Rear knee angle @90◦ 1.96 ± 0.17 m
@ 115◦
1.94 ± 0.12 m
@ 135◦
1.93 ±0.17 m
Aerenhouts,Delecluse [1]
Elite Seniors148 ± 25 cm
Elite Juniors130 ± 20 cm
EliteSeniors
130 ± 14cm
EliteJuniors
127 ± 11cm
Slawinski,Bonnefoy [7]
Elite106.6 ± 5.9 cm
Well-trained105.3 ± 6.3 cm
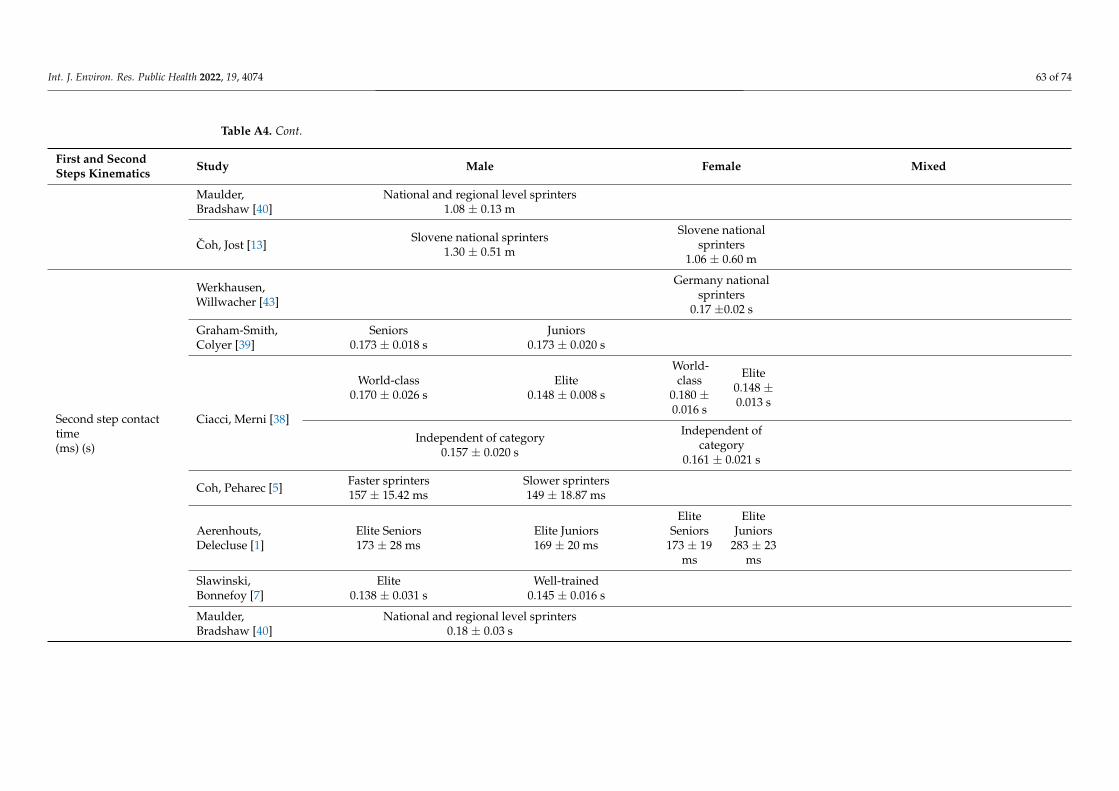
Int. J. Environ. Res. Public Health 2022, 19, 4074 63 of 74
Table A4. Cont.
First and SecondSteps Kinematics Study Male Female Mixed
Maulder,Bradshaw [40]
National and regional level sprinters1.08 ± 0.13 m
Coh, Jost [13]Slovene national sprinters
1.30 ± 0.51 m
Slovene nationalsprinters
1.06 ± 0.60 m
Second step contacttime(ms) (s)
Werkhausen,Willwacher [43]
Germany nationalsprinters
0.17 ±0.02 s
Graham-Smith,Colyer [39]
Seniors0.173 ± 0.018 s
Juniors0.173 ± 0.020 s
Ciacci, Merni [38]
World-class0.170 ± 0.026 s
Elite0.148 ± 0.008 s
World-class
0.180 ±0.016 s
Elite0.148 ±0.013 s
Independent of category0.157 ± 0.020 s
Independent ofcategory
0.161 ± 0.021 s
Coh, Peharec [5] Faster sprinters157 ± 15.42 ms
Slower sprinters149 ± 18.87 ms
Aerenhouts,Delecluse [1]
Elite Seniors173 ± 28 ms
Elite Juniors169 ± 20 ms
EliteSeniors
173 ± 19ms
EliteJuniors
283 ± 23ms
Slawinski,Bonnefoy [7]
Elite0.138 ± 0.031 s
Well-trained0.145 ± 0.016 s
Maulder,Bradshaw [40]
National and regional level sprinters0.18 ± 0.03 s
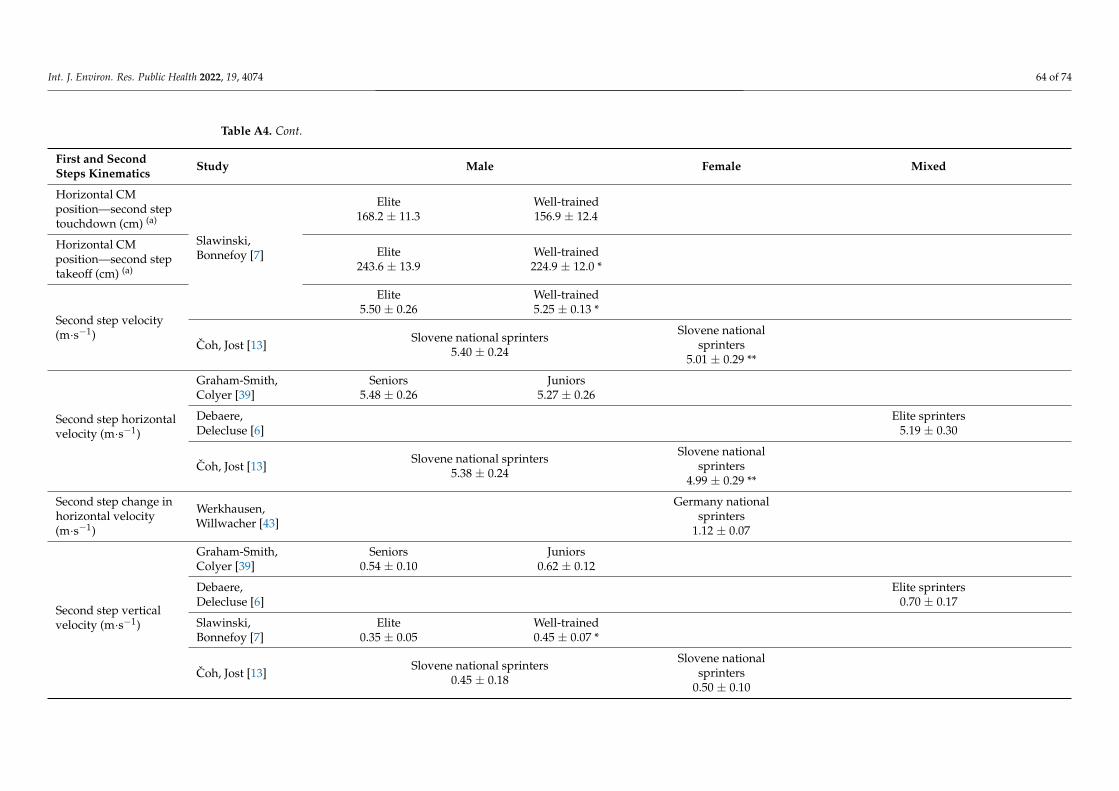
Int. J. Environ. Res. Public Health 2022, 19, 4074 64 of 74
Table A4. Cont.
First and SecondSteps Kinematics Study Male Female Mixed
Horizontal CMposition—second steptouchdown (cm) (a)
Slawinski,Bonnefoy [7]
Elite168.2 ± 11.3
Well-trained156.9 ± 12.4
Horizontal CMposition—second steptakeoff (cm) (a)
Elite243.6 ± 13.9
Well-trained224.9 ± 12.0 *
Second step velocity(m·s−1)
Elite5.50 ± 0.26
Well-trained5.25 ± 0.13 *
Coh, Jost [13]Slovene national sprinters
5.40 ± 0.24
Slovene nationalsprinters
5.01 ± 0.29 **
Second step horizontalvelocity (m·s−1)
Graham-Smith,Colyer [39]
Seniors5.48 ± 0.26
Juniors5.27 ± 0.26
Debaere,Delecluse [6]
Elite sprinters5.19 ± 0.30
Coh, Jost [13]Slovene national sprinters
5.38 ± 0.24
Slovene nationalsprinters
4.99 ± 0.29 **
Second step change inhorizontal velocity(m·s−1)
Werkhausen,Willwacher [43]
Germany nationalsprinters
1.12 ± 0.07
Second step verticalvelocity (m·s−1)
Graham-Smith,Colyer [39]
Seniors0.54 ± 0.10
Juniors0.62 ± 0.12
Debaere,Delecluse [6]
Elite sprinters0.70 ± 0.17
Slawinski,Bonnefoy [7]
Elite0.35 ± 0.05
Well-trained0.45 ± 0.07 *
Coh, Jost [13]Slovene national sprinters
0.45 ± 0.18
Slovene nationalsprinters
0.50 ± 0.10
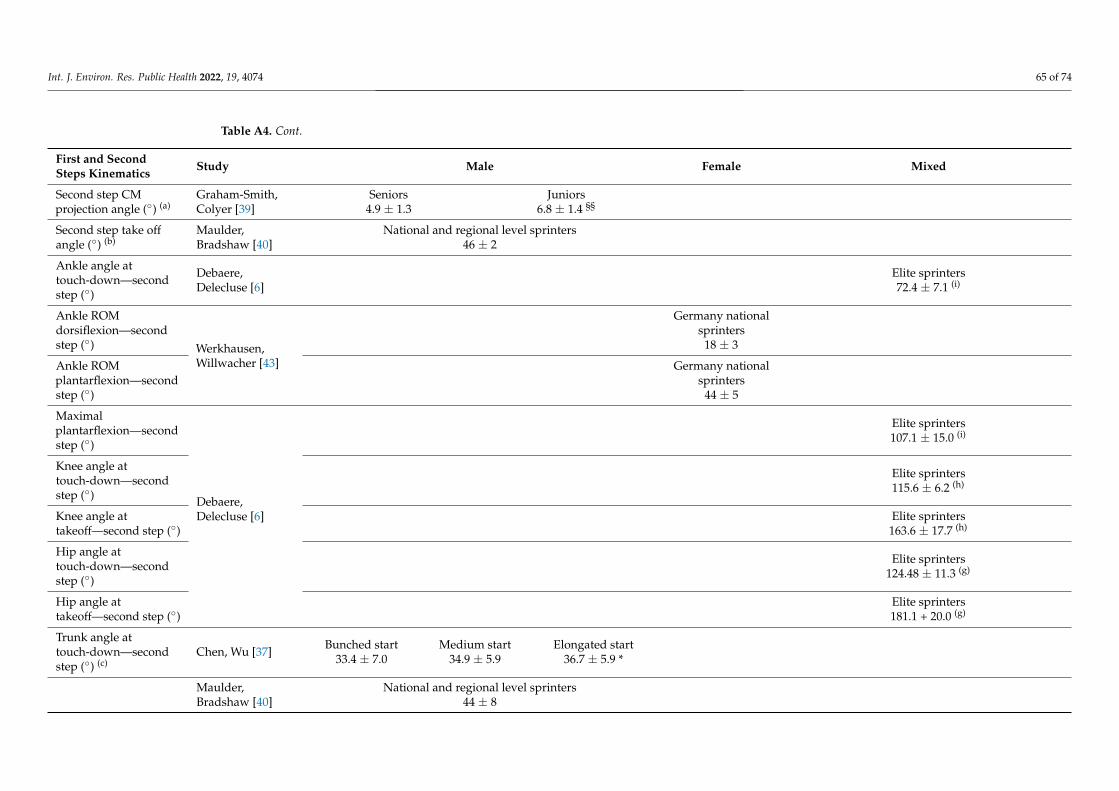
Int. J. Environ. Res. Public Health 2022, 19, 4074 65 of 74
Table A4. Cont.
First and SecondSteps Kinematics Study Male Female Mixed
Second step CMprojection angle (◦) (a)
Graham-Smith,Colyer [39]
Seniors4.9 ± 1.3
Juniors6.8 ± 1.4 §§
Second step take offangle (◦) (b)
Maulder,Bradshaw [40]
National and regional level sprinters46 ± 2
Ankle angle attouch-down—secondstep (◦)
Debaere,Delecluse [6]
Elite sprinters72.4 ± 7.1 (i)
Ankle ROMdorsiflexion—secondstep (◦) Werkhausen,
Willwacher [43]
Germany nationalsprinters
18 ± 3
Ankle ROMplantarflexion—secondstep (◦)
Germany nationalsprinters
44 ± 5
Maximalplantarflexion—secondstep (◦)
Debaere,Delecluse [6]
Elite sprinters107.1 ± 15.0 (i)
Knee angle attouch-down—secondstep (◦)
Elite sprinters115.6 ± 6.2 (h)
Knee angle attakeoff—second step (◦)
Elite sprinters163.6 ± 17.7 (h)
Hip angle attouch-down—secondstep (◦)
Elite sprinters124.48 ± 11.3 (g)
Hip angle attakeoff—second step (◦)
Elite sprinters181.1 + 20.0 (g)
Trunk angle attouch-down—secondstep (◦) (c)
Chen, Wu [37] Bunched start33.4 ± 7.0
Medium start34.9 ± 5.9
Elongated start36.7 ± 5.9 *
Maulder,Bradshaw [40]
National and regional level sprinters44 ± 8
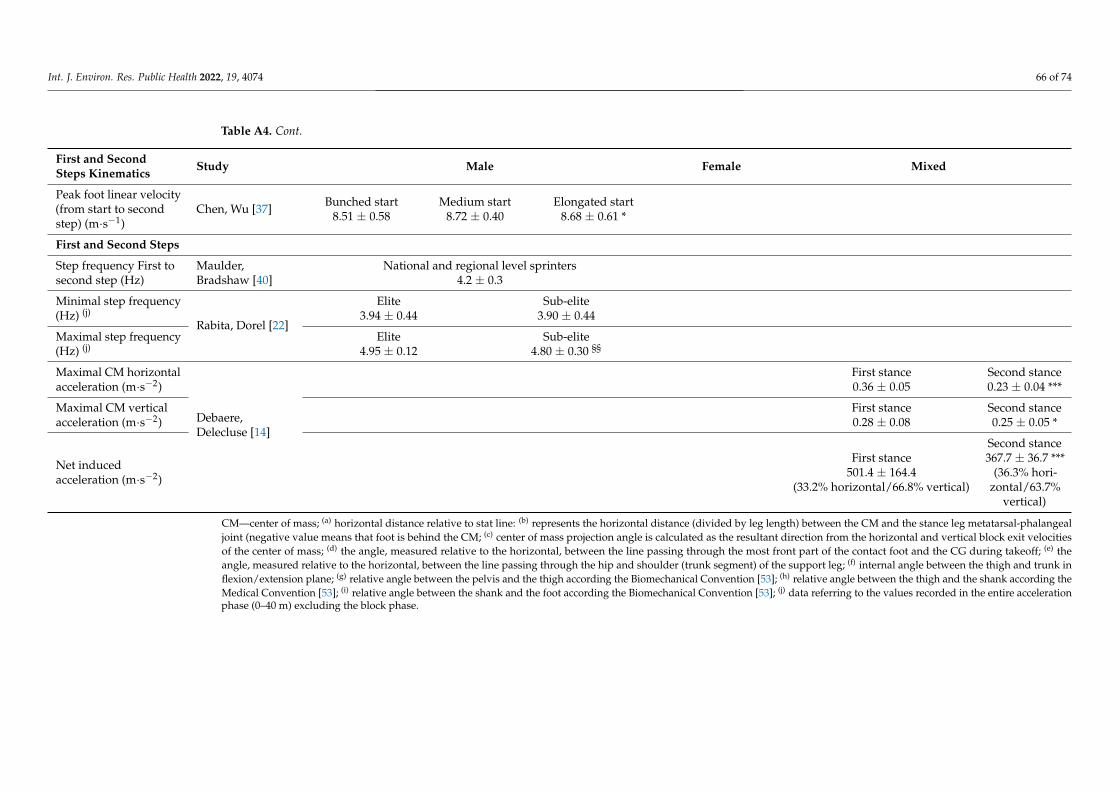
Int. J. Environ. Res. Public Health 2022, 19, 4074 66 of 74
Table A4. Cont.
First and SecondSteps Kinematics Study Male Female Mixed
Peak foot linear velocity(from start to secondstep) (m·s−1)
Chen, Wu [37] Bunched start8.51 ± 0.58
Medium start8.72 ± 0.40
Elongated start8.68 ± 0.61 *
First and Second Steps
Step frequency First tosecond step (Hz)
Maulder,Bradshaw [40]
National and regional level sprinters4.2 ± 0.3
Minimal step frequency(Hz) (j)
Rabita, Dorel [22]
Elite3.94 ± 0.44
Sub-elite3.90 ± 0.44
Maximal step frequency(Hz) (j)
Elite4.95 ± 0.12
Sub-elite4.80 ± 0.30 §§
Maximal CM horizontalacceleration (m·s−2)
Debaere,Delecluse [14]
First stance0.36 ± 0.05
Second stance0.23 ± 0.04 ***
Maximal CM verticalacceleration (m·s−2)
First stance0.28 ± 0.08
Second stance0.25 ± 0.05 *
Net inducedacceleration (m·s−2)
First stance501.4 ± 164.4
(33.2% horizontal/66.8% vertical)
Second stance367.7 ± 36.7 ***
(36.3% hori-zontal/63.7%
vertical)
CM—center of mass; (a) horizontal distance relative to stat line: (b) represents the horizontal distance (divided by leg length) between the CM and the stance leg metatarsal-phalangealjoint (negative value means that foot is behind the CM; (c) center of mass projection angle is calculated as the resultant direction from the horizontal and vertical block exit velocitiesof the center of mass; (d) the angle, measured relative to the horizontal, between the line passing through the most front part of the contact foot and the CG during takeoff; (e) theangle, measured relative to the horizontal, between the line passing through the hip and shoulder (trunk segment) of the support leg; (f) internal angle between the thigh and trunk inflexion/extension plane; (g) relative angle between the pelvis and the thigh according the Biomechanical Convention [53]; (h) relative angle between the thigh and the shank according theMedical Convention [53]; (i) relative angle between the shank and the foot according the Biomechanical Convention [53]; (j) data referring to the values recorded in the entire accelerationphase (0–40 m) excluding the block phase.
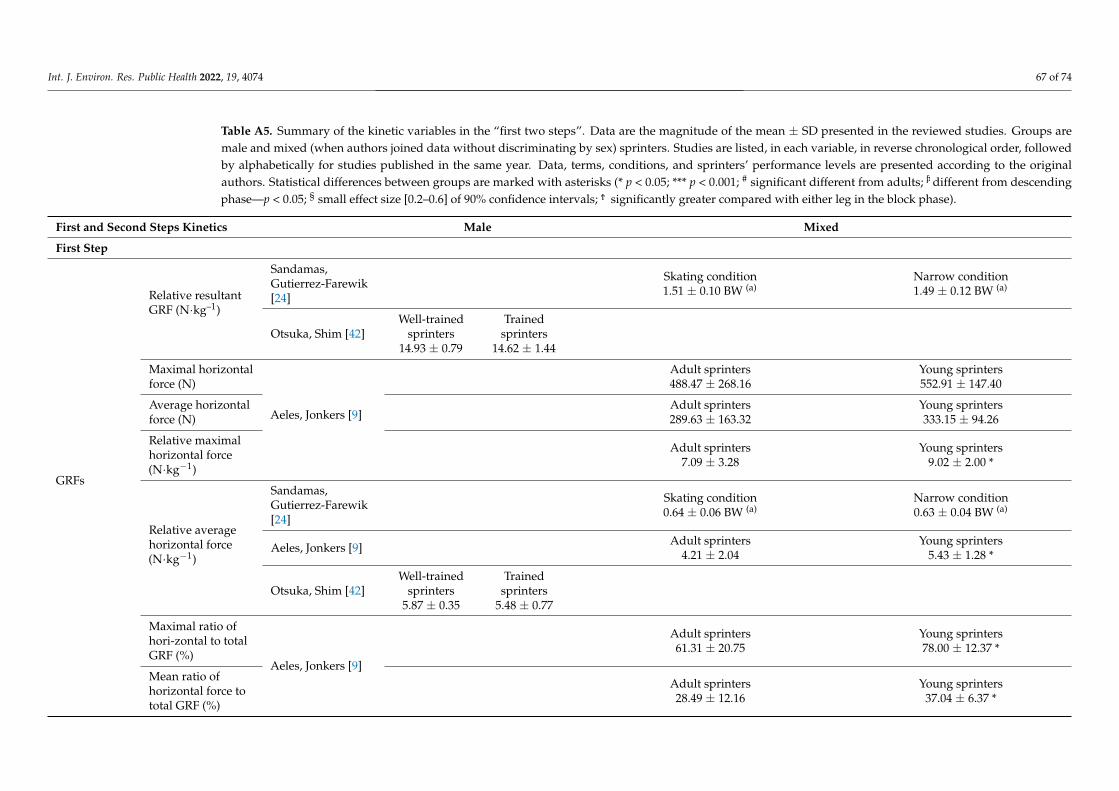
Int. J. Environ. Res. Public Health 2022, 19, 4074 67 of 74
Table A5. Summary of the kinetic variables in the “first two steps”. Data are the magnitude of the mean ± SD presented in the reviewed studies. Groups aremale and mixed (when authors joined data without discriminating by sex) sprinters. Studies are listed, in each variable, in reverse chronological order, followedby alphabetically for studies published in the same year. Data, terms, conditions, and sprinters’ performance levels are presented according to the originalauthors. Statistical differences between groups are marked with asterisks (* p < 0.05; *** p < 0.001; # significant different from adults;
1
Ϯ adults; ƥ different from descending significantly greater compared with either leg in the block phase).
different from descendingphase—p < 0.05; § small effect size [0.2–0.6] of 90% confidence intervals;
1
Ϯ significantly greater compared with either leg in the block phase).
significantly greater compared with either leg in the block phase).
First and Second Steps Kinetics Male Mixed
First Step
GRFs
Relative resultantGRF (N·kg–1)
Sandamas,Gutierrez-Farewik[24]
Skating condition1.51 ± 0.10 BW (a)
Narrow condition1.49 ± 0.12 BW (a)
Otsuka, Shim [42]Well-trained
sprinters14.93 ± 0.79
Trainedsprinters
14.62 ± 1.44
Maximal horizontalforce (N)
Aeles, Jonkers [9]
Adult sprinters488.47 ± 268.16
Young sprinters552.91 ± 147.40
Average horizontalforce (N)
Adult sprinters289.63 ± 163.32
Young sprinters333.15 ± 94.26
Relative maximalhorizontal force(N·kg−1)
Adult sprinters7.09 ± 3.28
Young sprinters9.02 ± 2.00 *
Relative averagehorizontal force(N·kg−1)
Sandamas,Gutierrez-Farewik[24]
Skating condition0.64 ± 0.06 BW (a)
Narrow condition0.63 ± 0.04 BW (a)
Aeles, Jonkers [9] Adult sprinters4.21 ± 2.04
Young sprinters5.43 ± 1.28 *
Otsuka, Shim [42]Well-trained
sprinters5.87 ± 0.35
Trainedsprinters
5.48 ± 0.77
Maximal ratio ofhori-zontal to totalGRF (%)
Aeles, Jonkers [9]
Adult sprinters61.31 ± 20.75
Young sprinters78.00 ± 12.37 *
Mean ratio ofhorizontal force tototal GRF (%)
Adult sprinters28.49 ± 12.16
Young sprinters37.04 ± 6.37 *
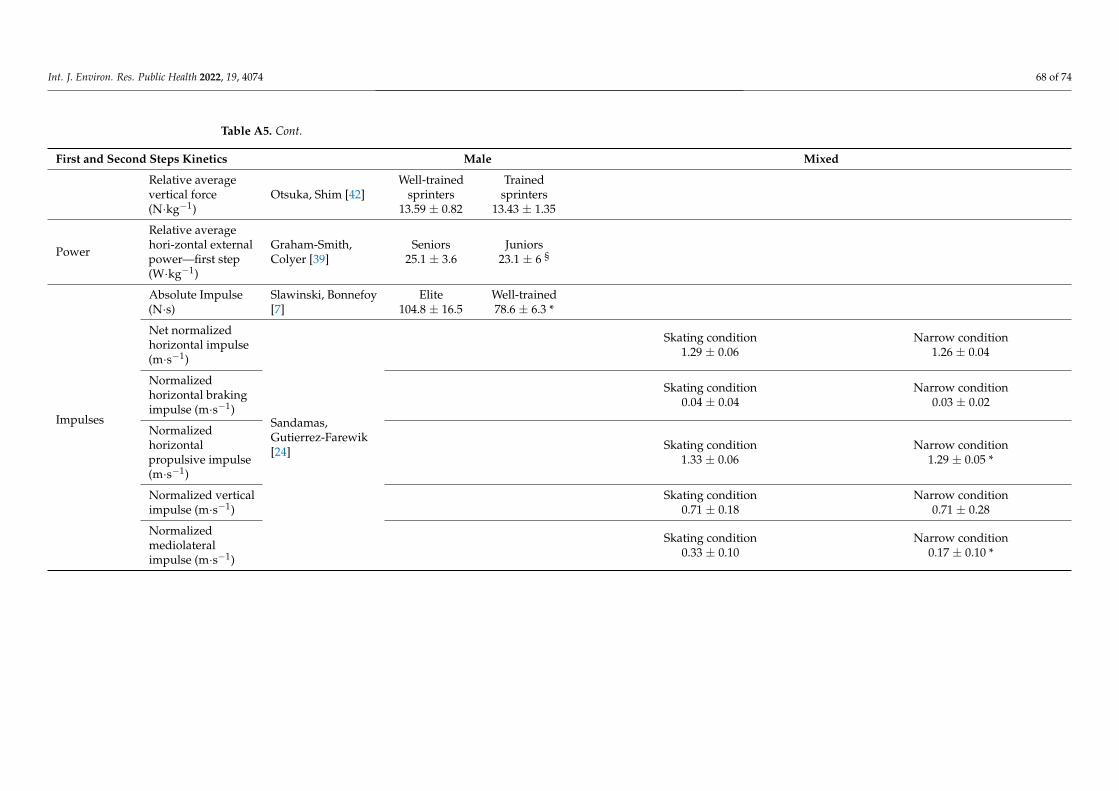
Int. J. Environ. Res. Public Health 2022, 19, 4074 68 of 74
Table A5. Cont.
First and Second Steps Kinetics Male Mixed
Relative averagevertical force(N·kg−1)
Otsuka, Shim [42]Well-trained
sprinters13.59 ± 0.82
Trainedsprinters
13.43 ± 1.35
Power
Relative averagehori-zontal externalpower—first step(W·kg−1)
Graham-Smith,Colyer [39]
Seniors25.1 ± 3.6
Juniors23.1 ± 6 §
Impulses
Absolute Impulse(N·s)
Slawinski, Bonnefoy[7]
Elite104.8 ± 16.5
Well-trained78.6 ± 6.3 *
Net normalizedhorizontal impulse(m·s−1)
Sandamas,Gutierrez-Farewik[24]
Skating condition1.29 ± 0.06
Narrow condition1.26 ± 0.04
Normalizedhorizontal brakingimpulse (m·s−1)
Skating condition0.04 ± 0.04
Narrow condition0.03 ± 0.02
Normalizedhorizontalpropulsive impulse(m·s−1)
Skating condition1.33 ± 0.06
Narrow condition1.29 ± 0.05 *
Normalized verticalimpulse (m·s−1)
Skating condition0.71 ± 0.18
Narrow condition0.71 ± 0.28
Normalizedmediolateralimpulse (m·s−1)
Skating condition0.33 ± 0.10
Narrow condition0.17 ± 0.10 *
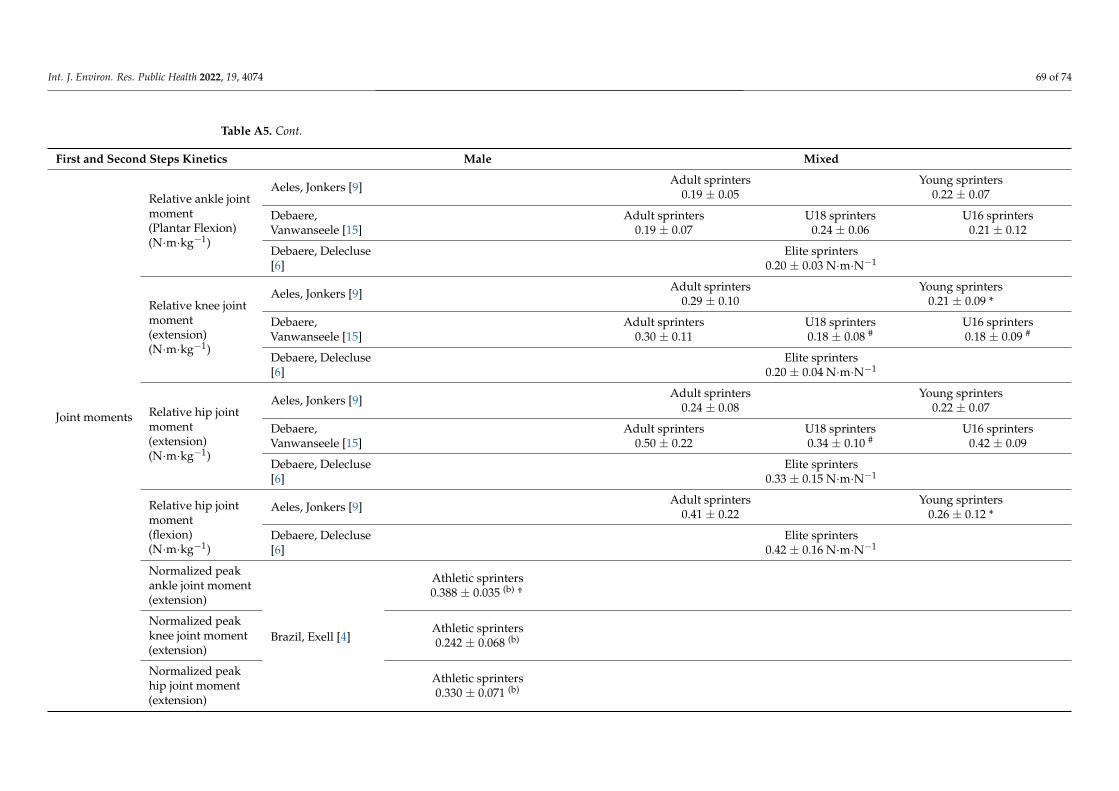
Int. J. Environ. Res. Public Health 2022, 19, 4074 69 of 74
Table A5. Cont.
First and Second Steps Kinetics Male Mixed
Joint moments
Relative ankle jointmoment(Plantar Flexion)(N·m·kg−1)
Aeles, Jonkers [9] Adult sprinters0.19 ± 0.05
Young sprinters0.22 ± 0.07
Debaere,Vanwanseele [15]
Adult sprinters0.19 ± 0.07
U18 sprinters0.24 ± 0.06
U16 sprinters0.21 ± 0.12
Debaere, Delecluse[6]
Elite sprinters0.20 ± 0.03 N·m·N−1
Relative knee jointmoment(extension)(N·m·kg−1)
Aeles, Jonkers [9] Adult sprinters0.29 ± 0.10
Young sprinters0.21 ± 0.09 *
Debaere,Vanwanseele [15]
Adult sprinters0.30 ± 0.11
U18 sprinters0.18 ± 0.08 #
U16 sprinters0.18 ± 0.09 #
Debaere, Delecluse[6]
Elite sprinters0.20 ± 0.04 N·m·N−1
Relative hip jointmoment(extension)(N·m·kg−1)
Aeles, Jonkers [9] Adult sprinters0.24 ± 0.08
Young sprinters0.22 ± 0.07
Debaere,Vanwanseele [15]
Adult sprinters0.50 ± 0.22
U18 sprinters0.34 ± 0.10 #
U16 sprinters0.42 ± 0.09
Debaere, Delecluse[6]
Elite sprinters0.33 ± 0.15 N·m·N−1
Relative hip jointmoment(flexion)(N·m·kg−1)
Aeles, Jonkers [9] Adult sprinters0.41 ± 0.22
Young sprinters0.26 ± 0.12 *
Debaere, Delecluse[6]
Elite sprinters0.42 ± 0.16 N·m·N−1
Normalized peakankle joint moment(extension)
Brazil, Exell [4]
Athletic sprinters0.388 ± 0.035 (b)
1
Ϯ significantly greater compared with either leg in the block phase).
Normalized peakknee joint moment(extension)
Athletic sprinters0.242 ± 0.068 (b)
Normalized peakhip joint moment(extension)
Athletic sprinters0.330 ± 0.071 (b)
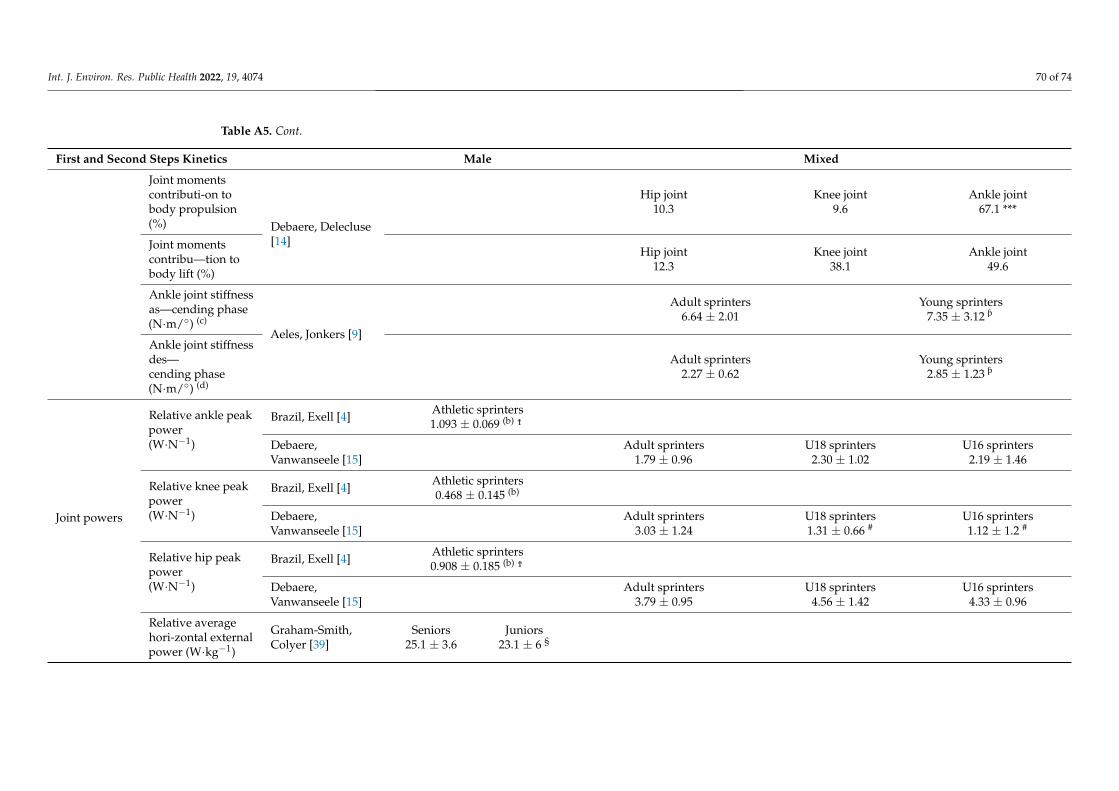
Int. J. Environ. Res. Public Health 2022, 19, 4074 70 of 74
Table A5. Cont.
First and Second Steps Kinetics Male Mixed
Joint momentscontributi-on tobody propulsion(%) Debaere, Delecluse
[14]
Hip joint10.3
Knee joint9.6
Ankle joint67.1 ***
Joint momentscontribu—tion tobody lift (%)
Hip joint12.3
Knee joint38.1
Ankle joint49.6
Ankle joint stiffnessas—cending phase(N·m/◦) (c)
Aeles, Jonkers [9]
Adult sprinters6.64 ± 2.01
Young sprinters7.35 ± 3.12
1
Ϯ adults; ƥ different from descending significantly greater compared with either leg in the block phase).
Ankle joint stiffnessdes—cending phase(N·m/◦) (d)
Adult sprinters2.27 ± 0.62
Young sprinters2.85 ± 1.23
1
Ϯ adults; ƥ different from descending significantly greater compared with either leg in the block phase).
Joint powers
Relative ankle peakpower(W·N−1)
Brazil, Exell [4] Athletic sprinters1.093 ± 0.069 (b)
1
Ϯ significantly greater compared with either leg in the block phase).
Debaere,Vanwanseele [15]
Adult sprinters1.79 ± 0.96
U18 sprinters2.30 ± 1.02
U16 sprinters2.19 ± 1.46
Relative knee peakpower(W·N−1)
Brazil, Exell [4] Athletic sprinters0.468 ± 0.145 (b)
Debaere,Vanwanseele [15]
Adult sprinters3.03 ± 1.24
U18 sprinters1.31 ± 0.66 #
U16 sprinters1.12 ± 1.2 #
Relative hip peakpower(W·N−1)
Brazil, Exell [4] Athletic sprinters0.908 ± 0.185 (b)
1
Ϯ significantly greater compared with either leg in the block phase).
Debaere,Vanwanseele [15]
Adult sprinters3.79 ± 0.95
U18 sprinters4.56 ± 1.42
U16 sprinters4.33 ± 0.96
Relative averagehori-zontal externalpower (W·kg−1)
Graham-Smith,Colyer [39]
Seniors25.1 ± 3.6
Juniors23.1 ± 6 §

Int. J. Environ. Res. Public Health 2022, 19, 4074 71 of 74
Table A5. Cont.
First and Second Steps Kinetics Male Mixed
Joint momentscontributi-on tobody propulsion(%) Debaere, Delecluse
[14]
Hip joint10.3
Knee joint9.6
Ankle joint67.1 ***
Joint momentscontributi-on tobody lift (%)
Hip joint12.3
Knee joint38.1
Ankle joint49.6 ***
Joint work
Ankle negativework (J·kg−1) Werkhausen,
Willwacher [43]
Germany national sprinters−0.32 ± 0.14 (e)
Ankle positive work(J·kg−1)
Germany national sprinters1.58 ± 0.17 (e)
Second Step
GRFs
Relative resultantGRF (N·kg−1)
Otsuka, Shim [42]
Well-trainedsprinters
14.93 ± 0.79
Trainedsprinters
14.62 ± 1.44
Relative averagehorizontal force(N·kg−1)
Well-trainedsprinters
4.83 ± 0.70
Trainedsprinters
4.79 ± 0.47
Relative averagevertical force(N·kg−1)
Well-trainedsprinters
13.22 ± 1.15
Trainedsprinters
13.72 ± 1.18
Power
Relative averagehorizontal externalpower—second step(W·kg−1)
Graham-Smith,Colyer [39]
Seniors26.7 ± 3.6
Juniors24.9 ± 4.5 §
Impulses Absolute impulse(N·s)
Slawinski, Bonnefoy[7]
Elite75.0 ± 15.8
Well-trained55.9 ± 9.4 *
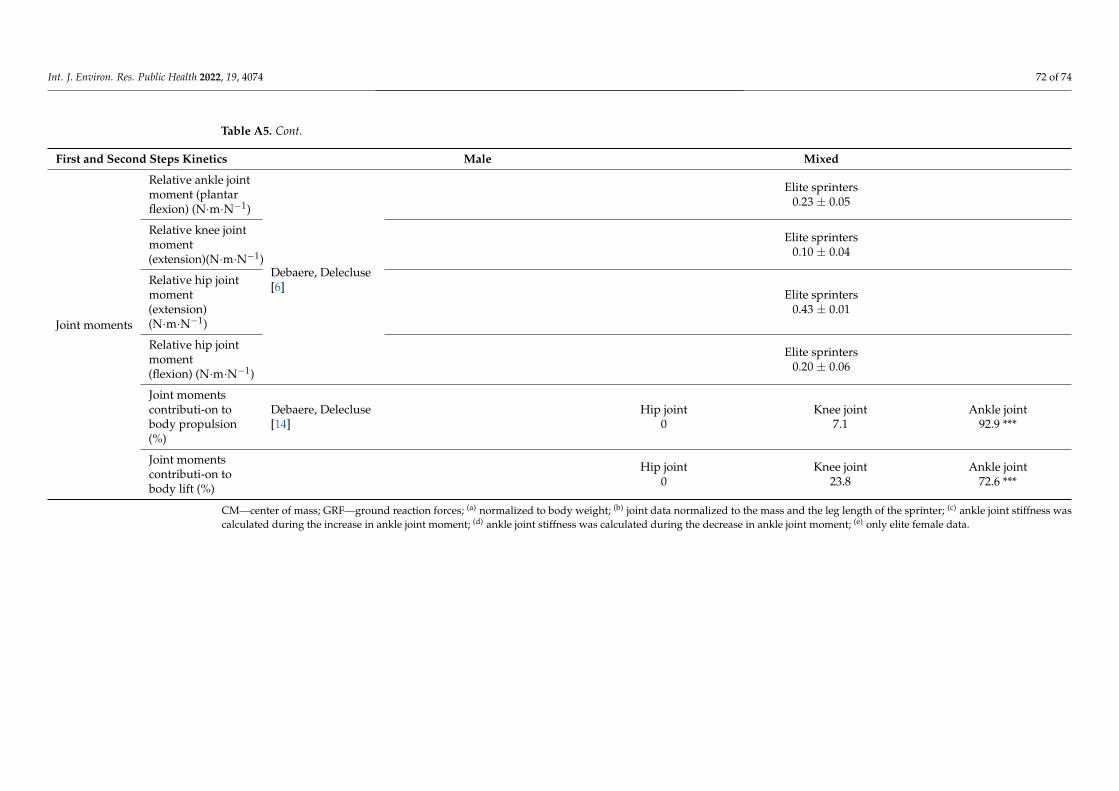
Int. J. Environ. Res. Public Health 2022, 19, 4074 72 of 74
Table A5. Cont.
First and Second Steps Kinetics Male Mixed
Joint moments
Relative ankle jointmoment (plantarflexion) (N·m·N−1)
Debaere, Delecluse[6]
Elite sprinters0.23 ± 0.05
Relative knee jointmoment(extension)(N·m·N−1)
Elite sprinters0.10 ± 0.04
Relative hip jointmoment(extension)(N·m·N−1)
Elite sprinters0.43 ± 0.01
Relative hip jointmoment(flexion) (N·m·N−1)
Elite sprinters0.20 ± 0.06
Joint momentscontributi-on tobody propulsion(%)
Debaere, Delecluse[14]
Hip joint0
Knee joint7.1
Ankle joint92.9 ***
Joint momentscontributi-on tobody lift (%)
Hip joint0
Knee joint23.8
Ankle joint72.6 ***
CM—center of mass; GRF—ground reaction forces; (a) normalized to body weight; (b) joint data normalized to the mass and the leg length of the sprinter; (c) ankle joint stiffness wascalculated during the increase in ankle joint moment; (d) ankle joint stiffness was calculated during the decrease in ankle joint moment; (e) only elite female data.
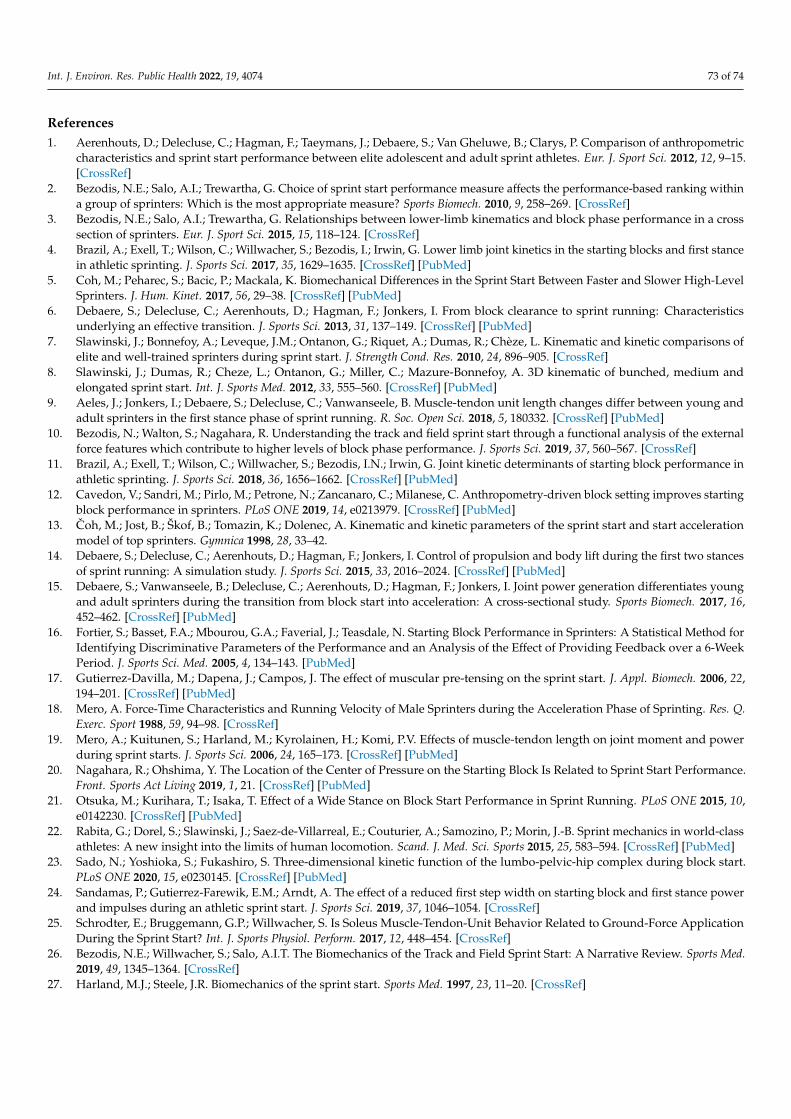
Int. J. Environ. Res. Public Health 2022, 19, 4074 73 of 74
References1. Aerenhouts, D.; Delecluse, C.; Hagman, F.; Taeymans, J.; Debaere, S.; Van Gheluwe, B.; Clarys, P. Comparison of anthropometric
characteristics and sprint start performance between elite adolescent and adult sprint athletes. Eur. J. Sport Sci. 2012, 12, 9–15.[CrossRef]
2. Bezodis, N.E.; Salo, A.I.; Trewartha, G. Choice of sprint start performance measure affects the performance-based ranking withina group of sprinters: Which is the most appropriate measure? Sports Biomech. 2010, 9, 258–269. [CrossRef]
3. Bezodis, N.E.; Salo, A.I.; Trewartha, G. Relationships between lower-limb kinematics and block phase performance in a crosssection of sprinters. Eur. J. Sport Sci. 2015, 15, 118–124. [CrossRef]
4. Brazil, A.; Exell, T.; Wilson, C.; Willwacher, S.; Bezodis, I.; Irwin, G. Lower limb joint kinetics in the starting blocks and first stancein athletic sprinting. J. Sports Sci. 2017, 35, 1629–1635. [CrossRef] [PubMed]
5. Coh, M.; Peharec, S.; Bacic, P.; Mackala, K. Biomechanical Differences in the Sprint Start Between Faster and Slower High-LevelSprinters. J. Hum. Kinet. 2017, 56, 29–38. [CrossRef] [PubMed]
6. Debaere, S.; Delecluse, C.; Aerenhouts, D.; Hagman, F.; Jonkers, I. From block clearance to sprint running: Characteristicsunderlying an effective transition. J. Sports Sci. 2013, 31, 137–149. [CrossRef] [PubMed]
7. Slawinski, J.; Bonnefoy, A.; Leveque, J.M.; Ontanon, G.; Riquet, A.; Dumas, R.; Chèze, L. Kinematic and kinetic comparisons ofelite and well-trained sprinters during sprint start. J. Strength Cond. Res. 2010, 24, 896–905. [CrossRef]
8. Slawinski, J.; Dumas, R.; Cheze, L.; Ontanon, G.; Miller, C.; Mazure-Bonnefoy, A. 3D kinematic of bunched, medium andelongated sprint start. Int. J. Sports Med. 2012, 33, 555–560. [CrossRef] [PubMed]
9. Aeles, J.; Jonkers, I.; Debaere, S.; Delecluse, C.; Vanwanseele, B. Muscle-tendon unit length changes differ between young andadult sprinters in the first stance phase of sprint running. R. Soc. Open Sci. 2018, 5, 180332. [CrossRef] [PubMed]
10. Bezodis, N.; Walton, S.; Nagahara, R. Understanding the track and field sprint start through a functional analysis of the externalforce features which contribute to higher levels of block phase performance. J. Sports Sci. 2019, 37, 560–567. [CrossRef]
11. Brazil, A.; Exell, T.; Wilson, C.; Willwacher, S.; Bezodis, I.N.; Irwin, G. Joint kinetic determinants of starting block performance inathletic sprinting. J. Sports Sci. 2018, 36, 1656–1662. [CrossRef] [PubMed]
12. Cavedon, V.; Sandri, M.; Pirlo, M.; Petrone, N.; Zancanaro, C.; Milanese, C. Anthropometry-driven block setting improves startingblock performance in sprinters. PLoS ONE 2019, 14, e0213979. [CrossRef] [PubMed]
13. Coh, M.; Jost, B.; Škof, B.; Tomazin, K.; Dolenec, A. Kinematic and kinetic parameters of the sprint start and start accelerationmodel of top sprinters. Gymnica 1998, 28, 33–42.
14. Debaere, S.; Delecluse, C.; Aerenhouts, D.; Hagman, F.; Jonkers, I. Control of propulsion and body lift during the first two stancesof sprint running: A simulation study. J. Sports Sci. 2015, 33, 2016–2024. [CrossRef] [PubMed]
15. Debaere, S.; Vanwanseele, B.; Delecluse, C.; Aerenhouts, D.; Hagman, F.; Jonkers, I. Joint power generation differentiates youngand adult sprinters during the transition from block start into acceleration: A cross-sectional study. Sports Biomech. 2017, 16,452–462. [CrossRef] [PubMed]
16. Fortier, S.; Basset, F.A.; Mbourou, G.A.; Faverial, J.; Teasdale, N. Starting Block Performance in Sprinters: A Statistical Method forIdentifying Discriminative Parameters of the Performance and an Analysis of the Effect of Providing Feedback over a 6-WeekPeriod. J. Sports Sci. Med. 2005, 4, 134–143. [PubMed]
17. Gutierrez-Davilla, M.; Dapena, J.; Campos, J. The effect of muscular pre-tensing on the sprint start. J. Appl. Biomech. 2006, 22,194–201. [CrossRef] [PubMed]
18. Mero, A. Force-Time Characteristics and Running Velocity of Male Sprinters during the Acceleration Phase of Sprinting. Res. Q.Exerc. Sport 1988, 59, 94–98. [CrossRef]
19. Mero, A.; Kuitunen, S.; Harland, M.; Kyrolainen, H.; Komi, P.V. Effects of muscle-tendon length on joint moment and powerduring sprint starts. J. Sports Sci. 2006, 24, 165–173. [CrossRef] [PubMed]
20. Nagahara, R.; Ohshima, Y. The Location of the Center of Pressure on the Starting Block Is Related to Sprint Start Performance.Front. Sports Act Living 2019, 1, 21. [CrossRef] [PubMed]
21. Otsuka, M.; Kurihara, T.; Isaka, T. Effect of a Wide Stance on Block Start Performance in Sprint Running. PLoS ONE 2015, 10,e0142230. [CrossRef] [PubMed]
22. Rabita, G.; Dorel, S.; Slawinski, J.; Saez-de-Villarreal, E.; Couturier, A.; Samozino, P.; Morin, J.-B. Sprint mechanics in world-classathletes: A new insight into the limits of human locomotion. Scand. J. Med. Sci. Sports 2015, 25, 583–594. [CrossRef] [PubMed]
23. Sado, N.; Yoshioka, S.; Fukashiro, S. Three-dimensional kinetic function of the lumbo-pelvic-hip complex during block start.PLoS ONE 2020, 15, e0230145. [CrossRef] [PubMed]
24. Sandamas, P.; Gutierrez-Farewik, E.M.; Arndt, A. The effect of a reduced first step width on starting block and first stance powerand impulses during an athletic sprint start. J. Sports Sci. 2019, 37, 1046–1054. [CrossRef]
25. Schrodter, E.; Bruggemann, G.P.; Willwacher, S. Is Soleus Muscle-Tendon-Unit Behavior Related to Ground-Force ApplicationDuring the Sprint Start? Int. J. Sports Physiol. Perform. 2017, 12, 448–454. [CrossRef]
26. Bezodis, N.E.; Willwacher, S.; Salo, A.I.T. The Biomechanics of the Track and Field Sprint Start: A Narrative Review. Sports Med.2019, 49, 1345–1364. [CrossRef]
27. Harland, M.J.; Steele, J.R. Biomechanics of the sprint start. Sports Med. 1997, 23, 11–20. [CrossRef]
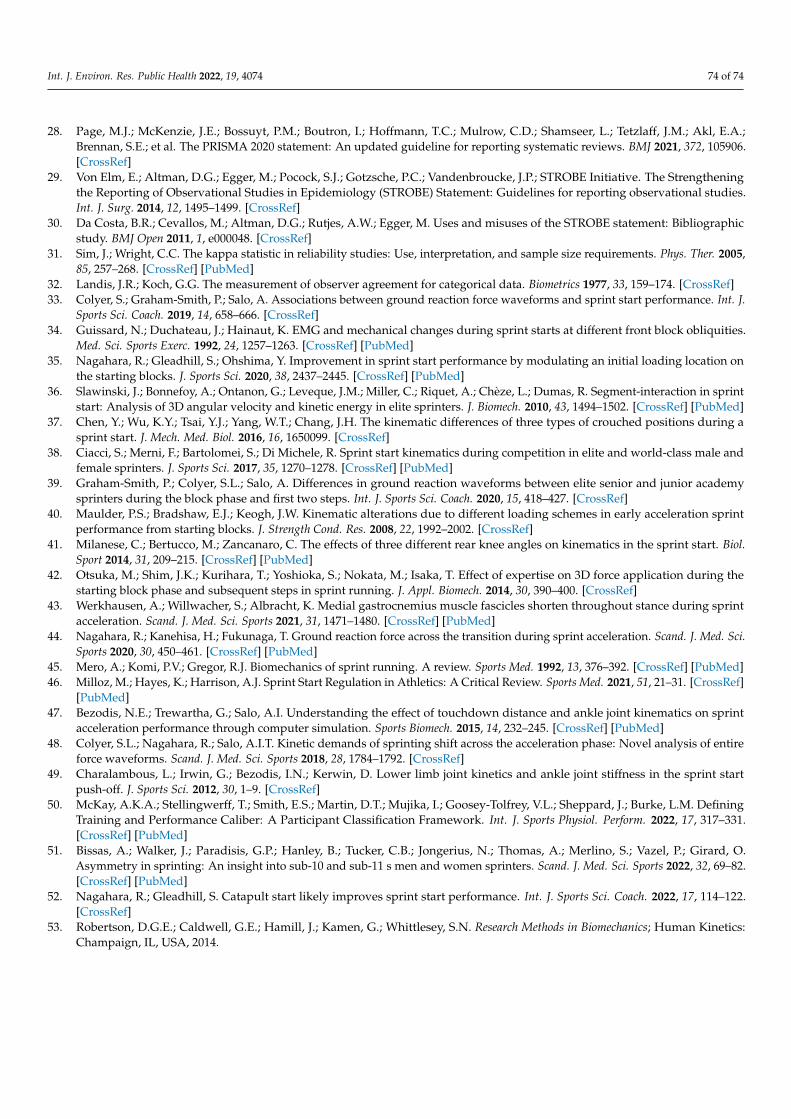
Int. J. Environ. Res. Public Health 2022, 19, 4074 74 of 74
28. Page, M.J.; McKenzie, J.E.; Bossuyt, P.M.; Boutron, I.; Hoffmann, T.C.; Mulrow, C.D.; Shamseer, L.; Tetzlaff, J.M.; Akl, E.A.;Brennan, S.E.; et al. The PRISMA 2020 statement: An updated guideline for reporting systematic reviews. BMJ 2021, 372, 105906.[CrossRef]
29. Von Elm, E.; Altman, D.G.; Egger, M.; Pocock, S.J.; Gotzsche, P.C.; Vandenbroucke, J.P.; STROBE Initiative. The Strengtheningthe Reporting of Observational Studies in Epidemiology (STROBE) Statement: Guidelines for reporting observational studies.Int. J. Surg. 2014, 12, 1495–1499. [CrossRef]
30. Da Costa, B.R.; Cevallos, M.; Altman, D.G.; Rutjes, A.W.; Egger, M. Uses and misuses of the STROBE statement: Bibliographicstudy. BMJ Open 2011, 1, e000048. [CrossRef]
31. Sim, J.; Wright, C.C. The kappa statistic in reliability studies: Use, interpretation, and sample size requirements. Phys. Ther. 2005,85, 257–268. [CrossRef] [PubMed]
32. Landis, J.R.; Koch, G.G. The measurement of observer agreement for categorical data. Biometrics 1977, 33, 159–174. [CrossRef]33. Colyer, S.; Graham-Smith, P.; Salo, A. Associations between ground reaction force waveforms and sprint start performance. Int. J.
Sports Sci. Coach. 2019, 14, 658–666. [CrossRef]34. Guissard, N.; Duchateau, J.; Hainaut, K. EMG and mechanical changes during sprint starts at different front block obliquities.
Med. Sci. Sports Exerc. 1992, 24, 1257–1263. [CrossRef] [PubMed]35. Nagahara, R.; Gleadhill, S.; Ohshima, Y. Improvement in sprint start performance by modulating an initial loading location on
the starting blocks. J. Sports Sci. 2020, 38, 2437–2445. [CrossRef] [PubMed]36. Slawinski, J.; Bonnefoy, A.; Ontanon, G.; Leveque, J.M.; Miller, C.; Riquet, A.; Chèze, L.; Dumas, R. Segment-interaction in sprint
start: Analysis of 3D angular velocity and kinetic energy in elite sprinters. J. Biomech. 2010, 43, 1494–1502. [CrossRef] [PubMed]37. Chen, Y.; Wu, K.Y.; Tsai, Y.J.; Yang, W.T.; Chang, J.H. The kinematic differences of three types of crouched positions during a
sprint start. J. Mech. Med. Biol. 2016, 16, 1650099. [CrossRef]38. Ciacci, S.; Merni, F.; Bartolomei, S.; Di Michele, R. Sprint start kinematics during competition in elite and world-class male and
female sprinters. J. Sports Sci. 2017, 35, 1270–1278. [CrossRef] [PubMed]39. Graham-Smith, P.; Colyer, S.L.; Salo, A. Differences in ground reaction waveforms between elite senior and junior academy
sprinters during the block phase and first two steps. Int. J. Sports Sci. Coach. 2020, 15, 418–427. [CrossRef]40. Maulder, P.S.; Bradshaw, E.J.; Keogh, J.W. Kinematic alterations due to different loading schemes in early acceleration sprint
performance from starting blocks. J. Strength Cond. Res. 2008, 22, 1992–2002. [CrossRef]41. Milanese, C.; Bertucco, M.; Zancanaro, C. The effects of three different rear knee angles on kinematics in the sprint start. Biol.
Sport 2014, 31, 209–215. [CrossRef] [PubMed]42. Otsuka, M.; Shim, J.K.; Kurihara, T.; Yoshioka, S.; Nokata, M.; Isaka, T. Effect of expertise on 3D force application during the
starting block phase and subsequent steps in sprint running. J. Appl. Biomech. 2014, 30, 390–400. [CrossRef]43. Werkhausen, A.; Willwacher, S.; Albracht, K. Medial gastrocnemius muscle fascicles shorten throughout stance during sprint
acceleration. Scand. J. Med. Sci. Sports 2021, 31, 1471–1480. [CrossRef] [PubMed]44. Nagahara, R.; Kanehisa, H.; Fukunaga, T. Ground reaction force across the transition during sprint acceleration. Scand. J. Med. Sci.
Sports 2020, 30, 450–461. [CrossRef] [PubMed]45. Mero, A.; Komi, P.V.; Gregor, R.J. Biomechanics of sprint running. A review. Sports Med. 1992, 13, 376–392. [CrossRef] [PubMed]46. Milloz, M.; Hayes, K.; Harrison, A.J. Sprint Start Regulation in Athletics: A Critical Review. Sports Med. 2021, 51, 21–31. [CrossRef]
[PubMed]47. Bezodis, N.E.; Trewartha, G.; Salo, A.I. Understanding the effect of touchdown distance and ankle joint kinematics on sprint
acceleration performance through computer simulation. Sports Biomech. 2015, 14, 232–245. [CrossRef] [PubMed]48. Colyer, S.L.; Nagahara, R.; Salo, A.I.T. Kinetic demands of sprinting shift across the acceleration phase: Novel analysis of entire
force waveforms. Scand. J. Med. Sci. Sports 2018, 28, 1784–1792. [CrossRef]49. Charalambous, L.; Irwin, G.; Bezodis, I.N.; Kerwin, D. Lower limb joint kinetics and ankle joint stiffness in the sprint start
push-off. J. Sports Sci. 2012, 30, 1–9. [CrossRef]50. McKay, A.K.A.; Stellingwerff, T.; Smith, E.S.; Martin, D.T.; Mujika, I.; Goosey-Tolfrey, V.L.; Sheppard, J.; Burke, L.M. Defining
Training and Performance Caliber: A Participant Classification Framework. Int. J. Sports Physiol. Perform. 2022, 17, 317–331.[CrossRef] [PubMed]
51. Bissas, A.; Walker, J.; Paradisis, G.P.; Hanley, B.; Tucker, C.B.; Jongerius, N.; Thomas, A.; Merlino, S.; Vazel, P.; Girard, O.Asymmetry in sprinting: An insight into sub-10 and sub-11 s men and women sprinters. Scand. J. Med. Sci. Sports 2022, 32, 69–82.[CrossRef] [PubMed]
52. Nagahara, R.; Gleadhill, S. Catapult start likely improves sprint start performance. Int. J. Sports Sci. Coach. 2022, 17, 114–122.[CrossRef]
53. Robertson, D.G.E.; Caldwell, G.E.; Hamill, J.; Kamen, G.; Whittlesey, S.N. Research Methods in Biomechanics; Human Kinetics:Champaign, IL, USA, 2014.
Copyright © 2022 FDOKUMEN