Drug impurity profiling by capillary electrophoresis/mass spectrometry using various ionization...
187
1 New approaches for capillary electrophoresis-mass spectrometry in drug analysis Evaluation of photo-, chemical and thermospray ionization Paul Hommerson
-
Upload
independent -
Category
Documents
-
view
0 -
download
0
Transcript of Drug impurity profiling by capillary electrophoresis/mass spectrometry using various ionization...
1
New approaches for
capillary electrophoresis-mass spectrometry
in drug analysis
Evaluation of photo-, chemical and thermospray ionization
Paul Hommerson
2
Printing: Gildeprint Drukkerijen, Enschede
ISBN: 978-90-393-5101-7
NUR 913
3
New approaches for
capillary electrophoresis–mass spectrometry
in drug analysis
Evaluation of photo-, chemical and thermospray ionization
Nieuwe benaderingen voor
capillaire elektroforese–massaspectrometrie
in geneesmiddelanalyse
Evaluatie van foto-, chemische en thermospray ionisatie
(met een samenvatting in het Nederlands)
Proefschrift
ter verkrijging van de graad van doctor aan de Universiteit Utrecht
op gezag van de rector magnificus, prof.dr. J.C. Stoof,
ingevolge het besluit van het college voor promoties
in het openbaar te verdedigen
op vrijdag 10 juli 2009
des middags te 2.30 uur
door
Paul Hommerson
geboren op 20 augustus 1980 te Rhenen

4
Promotor: Prof.dr. G.J. de Jong
Co-promotor: Dr. G.W. Somsen
Dit proefschrift werd mede mogelijk gemaakt met financiële steun van AstraZeneca, Global
PR&D, UK.
5
Contents
1. General introduction 7
2. Ionization techniques in capillary electrophoresis-mass spectrometry: 15
principles, design and application
3. Comparison of atmospheric pressure photoionization and electrospray ionization for 61
capillary zone electrophoresis–mass spectrometry of drugs
4. Comparison of electrospray ionization and atmospheric pressure photoionization for 83
coupling of micellar electrokinetic chromatography with ion trap mass spectrometry
5. Photon-independent gas-phase-ion formation in capillary electrophoresis- 103
mass spectrometry using atmospheric pressure photoionization
6. Capillary electrophoresis-atmospheric pressure chemical ionization mass 121
spectrometry using an orthogonal interface: set-up and system parameters
7. Drug impurity profiling by capillary electrophoresis-mass spectrometry using 139
various ionization techniques
8. Conclusions and future perspectives 157
Samenvatting in het Nederlands 167
List of abbreviations 177
Curriculum Vitae 181
List of publications 185

6

7
Chapter 1
General introduction

Chapter 1
8
General introduction
9
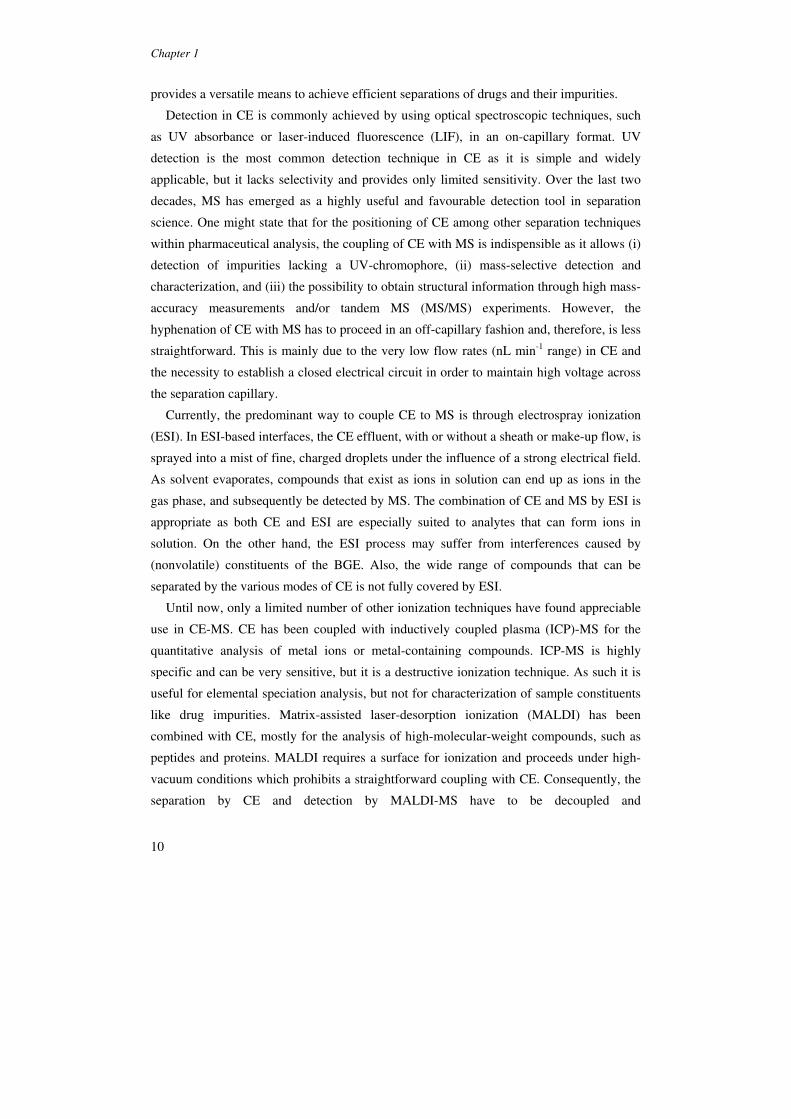
1. General remarks
Drug analysis is one of the core activities in the development and quality assurance of
pharmaceutical products. The overall characteristics, safety and efficacy of drugs largely
depend on the content and chemical purity of active ingredients and excipients. The valid
quality standards for pharmaceutical compounds that are on the market are often described
in pharmacopeias. These monographs prescribe a number of distinct analytical tests to
ensure, for example, the required identity, content and purity of drug substance and
excipients. During the drug development process, the impurities of candidate drugs are
often unknown and have to be determined by a number of analytical techniques. For drugs
with a maximum daily dose of 2 g/day, current regulations require all organic impurities
present at or above an apparent level of 0.1% to be identified. Since the synthetic route and
production scale often change during the development process, the profiling of impurities in
bulk drug substances is a recurring task of the analytical departments of pharmaceutical
industries.
Highly selective spectrometric techniques, such as mass spectrometry (MS) and nuclear
magnetic resonance (NMR), may be used for the impurity profiling of drug candidates.
However, reliable and comprehensive determination of drug impurities, especially when
they are present at relatively low levels, typically requires a separation technique that
efficiently resolves impurities from the parent drug and from each other. For this reason,
drug analysis generally follows a two-staged line where detection of the compounds of
interest (e.g. by UV absorbance or MS detection) is preceded by a separation step. Due to
its wide applicability (including thermolabile analytes) and robustness, liquid
chromatography (LC) has become the workhorse separation tool in the field of
pharmaceutical analysis. Nevertheless, a priori no separation method is capable of resolving
all potential impurities in a drug and, therefore, the availability of alternative separation
techniques is of utmost importance.
Capillary electrophoresis (CE), which is based on differential mobility of charged
species in an electrical field, has shown to be very suitable for the analysis of ionogenic
drugs and impurities. CE provides highly efficient separations, short analysis times, and
low sample and solvent consumption. The separation mechanism of its most widely used
mode, capillary zone electrophoresis (CZE), allows analyte differentiation according to
charge-to-size ratio, thus yielding valuable orthogonality with common separation
techniques such as reversed-phase LC. Furthermore, the possibility in CE to adjust the
selectivity simply by changing the composition of the background electrolyte (BGE)
Chapter 1
10
provides a versatile means to achieve efficient separations of drugs and their impurities.
Detection in CE is commonly achieved by using optical spectroscopic techniques, such
as UV absorbance or laser-induced fluorescence (LIF), in an on-capillary format. UV
detection is the most common detection technique in CE as it is simple and widely
applicable, but it lacks selectivity and provides only limited sensitivity. Over the last two
decades, MS has emerged as a highly useful and favourable detection tool in separation
science. One might state that for the positioning of CE among other separation techniques
within pharmaceutical analysis, the coupling of CE with MS is indispensible as it allows (i)
detection of impurities lacking a UV-chromophore, (ii) mass-selective detection and
characterization, and (iii) the possibility to obtain structural information through high mass-
accuracy measurements and/or tandem MS (MS/MS) experiments. However, the
hyphenation of CE with MS has to proceed in an off-capillary fashion and, therefore, is less
straightforward. This is mainly due to the very low flow rates (nL min-1 range) in CE and
the necessity to establish a closed electrical circuit in order to maintain high voltage across
the separation capillary.
Currently, the predominant way to couple CE to MS is through electrospray ionization
(ESI). In ESI-based interfaces, the CE effluent, with or without a sheath or make-up flow, is
sprayed into a mist of fine, charged droplets under the influence of a strong electrical field.
As solvent evaporates, compounds that exist as ions in solution can end up as ions in the
gas phase, and subsequently be detected by MS. The combination of CE and MS by ESI is
appropriate as both CE and ESI are especially suited to analytes that can form ions in
solution. On the other hand, the ESI process may suffer from interferences caused by
(nonvolatile) constituents of the BGE. Also, the wide range of compounds that can be
separated by the various modes of CE is not fully covered by ESI.
Until now, only a limited number of other ionization techniques have found appreciable
use in CE-MS. CE has been coupled with inductively coupled plasma (ICP)-MS for the
quantitative analysis of metal ions or metal-containing compounds. ICP-MS is highly
specific and can be very sensitive, but it is a destructive ionization technique. As such it is
useful for elemental speciation analysis, but not for characterization of sample constituents
like drug impurities. Matrix-assisted laser-desorption ionization (MALDI) has been
combined with CE, mostly for the analysis of high-molecular-weight compounds, such as
peptides and proteins. MALDI requires a surface for ionization and proceeds under high-
vacuum conditions which prohibits a straightforward coupling with CE. Consequently, the
separation by CE and detection by MALDI-MS have to be decoupled and
General introduction
11
electropherograms cannot easily be obtained in real-time.
So far, the employment in CE of atmospheric pressure chemical ionization (APCI) and
photoionization (APPI), which are highly useful ionization techniques for low-molecular
weight compounds, has been very limited. Notably, the use of APCI is very common in
LC-MS and regarded a strong alternative for ESI. Although much more recently introduced
and yet less widely applied, APPI can also be considered an accepted ionization technique
for LC-MS. At the start of the research project described in this thesis, only a few attempts
to implement APCI in CE-MS had been published demonstrating a first proof-of-principle.
However, reported detection limits were indifferent and not allowing any relevant
application in pharmaceutical analysis. The design of a CE system with APPI-MS detection
had just been described for the first time, and the preliminary results looked very
promising. But the overall performance of CE-APPI-MS with respect to ESI, and its
applicability for drug impurity analysis, still had to be established.
2. Scope and outline of the thesis
The studies described in this thesis deal with the design and performance of alternative
ionization techniques for CE-MS. The aim of the work was to expand the ionization
potential available for CE-MS in order to widen its applicability, particularly for
pharmaceutical analysis. Furthermore, it was investigated whether the selectivities provided
by alternative ionization principles could circumvent limitations posed by the ESI process.
The potential of three ionization techniques, viz. APPI, APCI and thermospray ionization
(TSI) for CE-MS was studied and evaluated. In all cases, sheath-liquid interfacing applying
a coaxial sprayer was used in combination with orthogonal ionization sources originally
designed for LC-MS. Relatively simple adaptations to the interface enabled effective CE-
MS coupling through the respective ionization techniques. In the entire study, ion trap MS
was used for mass analysis and, in some instances, for MSn experiments.
As novel CE-MS set ups were examined, due attention was given to the influence of
interface parameters in order to attain optimal analyte signals with the respective ionization
techniques. Another primary aspect was the selectivity of the developed methods. For that
purpose, the impact of compound nature on the MS response was systematically
investigated using various drugs with different molecular characteristics. A further point of
recurring concern was the effect of the BGE composition on analyte responses. In this
respect, the compatibility of the studied ionization techniques with non-volatile salts and

Chapter 1
12
surfactants was a major item of interest. For every developed method, the achievable limits
of detection were evaluated with a particular focus on the potential for drug impurity
profiling, that is, on the possibility to accomplish impurity detection down to the 0.1%
(m/m) level. Throughout the study, comparisons with ESI were made when appropriate.
To set the stage, an overview providing the state of the art of the employment of soft
ionization techniques for CE-MS is presented in Chapter 2. First, the fundamentals and
challenges of hyphenating CE and MS are outlined. After elaborating the characteristics
and role of ESI, emphasis is put on alternative soft ionization techniques used for CE-MS.
These are individually covered, including discussions on the ionization mechanisms,
experimental set-up, and strengths and limitations for interfacing CE to MS. The
applicability of the various systems is illustrated by a number of typical examples.
In Chapter 3 a comparative study of APPI and ESI for CZE-MS is presented. The
APPI-MS interface parameters have been optimized on the basis of signal intensities for
test drugs comprising quaternary ammonium compounds, organic amines, and steroids,
whereas generic ESI-MS conditions were employed. Effects of volatile and nonvolatile
BGEs on background spectra, analyte signal intensities are reported for both systems. With
BGEs of sodium phosphate and ammonium acetate, good separation efficiencies (plate
numbers 70.000-200.000) were achieved, resulting in baseline-separation of most test drugs
without further optimization. Signal-to-noise ratios (S/Ns) in CZE-MS are established and
compared for APPI and ESI, employing both volatile and nonvolatile BGEs. Using the
APPI source, an additional ionization mechanism was observed which appeared to be
independent of photoirradiation and also occurred when the VUV excitation source was
shut off.
In Chapter 4 APPI and ESI are evaluated for the coupling of micellar electrokinetic
chromatography (MEKC), employing sodium dodecyl sulfate (SDS) as pseudostationary
phase, with MS. Model compounds comprised ionic, ionogenic and neutral species with
different functional groups. The effects of SDS on source contamination and background
spectra are described for each ionization technique. Consideration is given to the risk of
overloading the ion trap with background ions, which may lead to space-charge effects and
a reduced trap performance. It is shown that in ESI-MS analyte signals are reduced to less
than 10% when 50 mM of SDS is added to the BGE, whereas signals in APPI remain
unaffected. Detection limits for basic and neutral test compounds are established in MEKC-
ESI-MS and MEKC-APPI-MS, respectively, by using BGEs containing 20-50 mM SDS.

General introduction
13
The photon-independent ionization mechanism observed with the APPI source is further
explored in Chapter 5. First the interface conditions required for the formation and
detection of analytes in the absence of VUV excitation are elucidated. Then, the selectivity
of photon-independent ionization is determined on the basis of a range of analytes of
different polarities. The effects of vaporizer temperature and BGE composition are
described. Based on these results, it is argued that photon-independent ionization occurs
through a liquid-phase ionization mechanism which may largely be similar to that of
thermospray ionization (TSI). Although minor differences with pure TSI may exist, the
photon-independent ionization is referred to as TSI in Chapter 6 and 7. Finally, the
feasibility of employing simultaneous photon-induced (APPI) and photon-independent
ionization in CE-MS is demonstrated.
Chapter 6 reports on the coupling of CE with APCI-MS. The design of a CE-MS
system using an orthogonal APCI source is outlined, and the sprayer position is optimized
on the basis of analyte signal intensities. The effects of basic interface parameters like
corona current, transfer voltage, vaporizer temperature and nebulizing gas pressure are
studied for a range of compound polarities, in both positive and negative ion mode. In
addition, it is demonstrated by infusion experiments that APCI-MS signals are not
significantly affected by either nonvolatile BGEs or SDS. The feasibility of using
nonvolatile BGEs is further evaluated by CZE-APCI-MS of a test mixture comprising basic
drugs and a steroid. S/Ns in APCI-MS are established using volatile and non-volatile
BGEs.
In Chapter 7 the applicability of ESI, APCI, APPI and TSI as ionization methods for
drug impurity profiling by CZE-MS is evaluated. As test compounds, the drugs carbachol,
lidocaine and proguanil, representing different molecular properties, are used. Each drug is
spiked with its potential impurities. Relevant aspects such as detection limits, relative
responses, in-source fragmentation and spectral interpretation are elaborated. The potential
of the respective CE-MS systems for the identification of an unknown impurity in
carbachol is studied.
Chapter 8 provides some general conclusions and comments on the developed CE-MS
systems. Perspectives and recommendations are presented.

14

15
Chapter 2
Ionization techniques in capillary
electrophoresis–mass spectrometry:
principles, design and application
P. Hommerson, A.M. Khan, G.J. de Jong, G.W. Somsen,
manuscript in preparation
Chapter 2
16
Summary
A major step forward in the development and application of capillary electrophoresis (CE)
was its coupling to ESI-MS, first reported in 1987. More than two decades later, ESI has
remained the principal ionization technique in CE-MS, but a number of other ionization
techniques have also been implemented in CE-MS. In this review the state-of-the art in the
employment of soft ionization techniques for CE-MS is presented. First the fundamentals
and general challenges of hyphenating CE and MS are outlined. After elaborating on the
characteristics and role of ESI, emphasis is put on alternative ionization techniques
including sonic spray ionization (SSI), thermospray ionization (TSI), atmospheric pressure
chemical ionization (APCI), atmospheric pressure photoionization (APPI), matrix-assisted
laser desorption ionization (MALDI) and continuous-flow fast-atom bombardment (CF-
FAB). The principle of each ionization technique is outlined and the experimental set-ups
of the CE-MS couplings are described. The strengths and limitations of each ionization
technique with respect to CE-MS are discussed and put into perspective through
comparisons with ESI. The applicability of the various CE-MS systems is illustrated by a
number of typical examples.
Ionization techniques in CE-MS
17
1. Introduction
Capillary electrophoresis (CE) is a microscale separation technique that is highly suitable
for separation of complex samples. CE provides high separation efficiency, short analysis
times, and low sample and solvent consumption. The separation mechanism of CE is based
on differential mobility of charged species in an electrical field, thus providing valuable
orthogonality with most chromatographic techniques. Furthermore, the possibility to adjust
the selectivity simply by changing the composition of the background electrolyte (BGE)
provides a versatile means to achieve efficient separations of charged and neutral species.
Detection in CE is often achieved in an on-capillary configuration through optical
spectroscopic techniques, such as UV absorbance or laser-induced fluorescence (LIF). UV
detection is the most common detection technique in CE as it is simple and widely
applicable, but it lacks selectivity and provides only limited sensitivity. LIF is much more
sensitive, but can only be used for fluorescent compounds. Detection by mass spectrometry
(MS), which is currently one of the most powerful detectors for liquid-phase separation
techniques, is obviously an attractive alternative providing sensitivity and selectivity.
However, the hyphenation of CE with MS has to proceed in an off-capillary fashion and is
less straightforward. Challenges are posed by the very low flow rates (nL min-1 range) in
CE and the necessity to establish a closed electrical circuit in order to maintain high voltage
across the separation capillary. A significant progress in the development and application of
CE was its coupling to electrospray ionization (ESI)-MS which was first reported in 1987
[1]. Since then, in CE-MS attention has mainly focussed on interface design, particularly in
relation to the various means of providing the joint electrical contact for CE and ESI. These
developments, which led to a number of improvements in sensitivity, robustness and/or
user-friendliness, have been described in detail in a number of excellent technology-based
reviews [2-5]. During the past twenty years, a number of other soft ionization techniques
have been implemented in CE-MS, including fast-atom bombardment (FAB), matrix-
assisted laser-desorption ionization (MALDI), sonic spray ionization (SSI), atmospheric
pressure chemical ionization (APCI), and more recently, atmospheric pressure
photoionization (APPI). Cai and Henion gave a comprehensive overview of CE-MS in
1995 which covered ESI, ion spray (ISP), and FAB [6]. Some of the more recently used
ionization techniques have been treated as a part of general CE-MS reviews [5,7,8], or in
specific reviews on CE-MALDI-MS [9-11].
Chapter 2
18
The aim of the present paper is to give an overview of the soft ionization techniques that
have been used in CE-MS throughout the years. The review is mainly devoted to on-line
CE-MS couplings, but also CE-MALDI-MS, which predominantly follows an off-line
approach, is discussed. Only aqueous CE-MS is considered; detailed treatment of
nonaqueous CE-ESI-MS can be found in a review by Scriba et al. [12]. In the present
review a classification into spray ionization, gas-phase ionization and desorption ionization
techniques has been made. Ionization mechanisms are described, and the advantages and
drawbacks in relation to CE-MS are scrutinized, including sensitivity and BGE
compatibility. An overview of applications will be given in tables, whereas a selection of
applications will be treated to illustrate the potential of the various CE-MS approaches. The
characteristics of ESI will be covered, but for extensive overviews of the numerous
applications of CE-ESI-MS the reader is referred to several recent reviews [7,13,14].
2. Interfacing in CE-MS
The challenge in hyphenating CE to MS is to preserve high CE separation efficiency while
achieving high MS sensitivity. This requires an interface that allows application of
electrical contact causing no or only minimal band broadening. As additional requirements,
the interface should provide good ionization conditions and interference of the BGE with
analyte ionization has to be limited. The latter aspects are clearly linked with the type of
ionization technique employed for the hyphenation.
In a common CE setup both ends of the separation capillary are immersed in buffer vials
to which electrodes are added to provide a high voltage gradient. With off-capillary
detection the outlet vial cannot be retained, which means that the CE-MS interface has to
provide the electrical contact to the outlet of the separation capillary. With some mass
spectrometers, the high voltage can be applied to the ion sampling orifice. This means that
the shared CE/ESI electrode can be grounded and the ESI voltage is applied to the MS-
inlet. This is clearly a flexible approach as it enables to set the CE and ESI voltages
independently. The first successful interface for coupling CE and ESI-MS was reported by
Olivares et al. [1]. In this work, the CE capillary was inserted into a stainless steel capillary
sheath, which functioned both as CZE cathode and emitter tip for ESI. This type of
interface, however, showed a number of restrictions: (i) stable electrosprays were only
obtained with a high electroosmotic flow (EOF), i.e. with specific BGEs or capillary
coatings; (ii) purely aqueous or high-ionic strength (>10-2 M) BGEs could not be efficiently

Ionization techniques in CE-MS
19
electrosprayed; (iii) ionization efficiency was strongly affected by the BGE composition.
Subsequently, the same group at the Battelle Pacific Northwest Laboratory described a
design that utilizes a make-up flow [15]. In this set-up, the metal contact at the CZE
terminus was replaced with a thin sheath of flowing liquid (5-10 µL min-1). The sheath
liquid was in electrical contact with an electrode which was held at 4-7 kV with respect to
the ion sampling orifice. The sheath-liquid interface circumvented a number of previous
limitations, such as the necessity of a high flow rate and restrictions to the BGE
composition. Also, the sheath liquid could be optimized to provide favourable and stable
ionization conditions, and no pre-treatment of the CE capillary was needed. An inherent
drawback of the coaxial sheath-flow interface is the dilution of the CE effluent, which
results in a loss of sensitivity.
A third type of interface employed in CE-MS is the liquid-junction interface [16,17]. In
this type of interface the sheath-liquid is delivered upstream through a T-junction, which
separates the CE capillary and the ESI needle by a 25-50 µm gap. The positive features of
the liquid-junction interface are a lower dilution factor than the coaxial arrangement, and
often better electrode stability than in sheathless designs. Unfortunately, the disruption of
the CE flow path potentially leads to dead volumes, loss of the plug-like flow profile, and
therefore, loss of CE separation efficiency.
The past twenty years saw a number of major improvements in all three interface
designs. With the sheathless design, the diameter of the emitter tip has been reduced in
order to achieve more stable electrosprays and higher sensitivity. Tapered emitters in CE-
MS are often obtained by heating and subsequently shaping the terminal end of the CE
capillary. The electrical contact can then be established in a number of ways, for instance
by coating the outer surface of the emitter tip with a conductive material, such as gold [18],
silver [19] or graphite [20]. Unfortunately the deposition of a conductive agent at the
capillary terminus entails a time-consuming capillary preparation process and the (metal)
deposit erodes slowly due to electrochemical reactions, demanding frequent replacement of
the CE capillary. More recently, the need for laborious CE capillary pretreatment in
sheathless interfacing has been circumvented by the use of disposable tips that can be
attached to the CE capillary [21-23]. Detailed overviews on technical developments of
sheathless interfacing can be found elsewhere [2,3,5,24-26]. Developments in sheath-liquid
interfacing include the design of bevelled tips [27], and interfaces for high sample
throughput [28]. In addition, attempts have been undertaken to lower the dilution factor by
the sheath-liquid [29,30]. The sheath-liquid interface is generally considered to yield less
Chapter 2
20
favourable detection limits than the sheath-liquid interface [31], although roughly equal
sensitivities have been reported in a recent comparative study on the CE-MS analysis of
peptides [32]. On the other hand, sheath-liquid interfaces tend to be more robust and user-
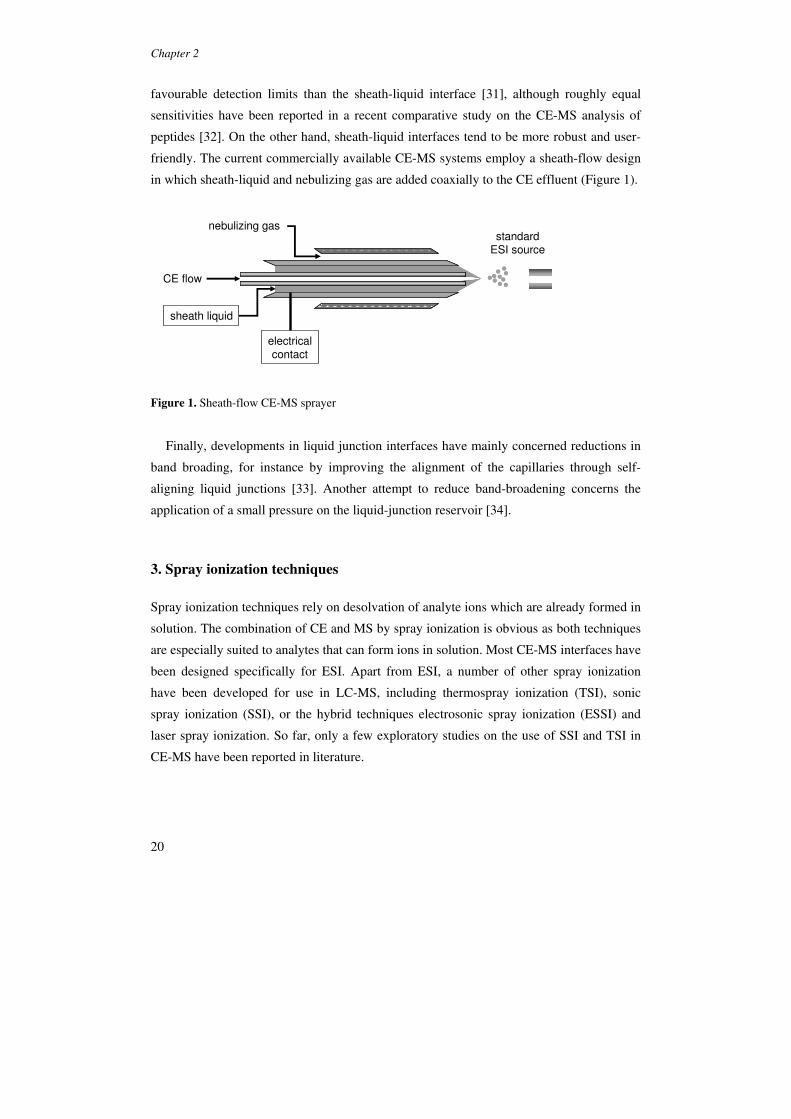
friendly. The current commercially available CE-MS systems employ a sheath-flow design
in which sheath-liquid and nebulizing gas are added coaxially to the CE effluent (Figure 1).
CE flow
nebulizing gas
sheath liquid
electricalcontact
••••••
••••••••••
••••
standardESI source
Figure 1. Sheath-flow CE-MS sprayer
Finally, developments in liquid junction interfaces have mainly concerned reductions in
band broading, for instance by improving the alignment of the capillaries through self-
aligning liquid junctions [33]. Another attempt to reduce band-broadening concerns the
application of a small pressure on the liquid-junction reservoir [34].
3. Spray ionization techniques
Spray ionization techniques rely on desolvation of analyte ions which are already formed in
solution. The combination of CE and MS by spray ionization is obvious as both techniques
are especially suited to analytes that can form ions in solution. Most CE-MS interfaces have
been designed specifically for ESI. Apart from ESI, a number of other spray ionization
have been developed for use in LC-MS, including thermospray ionization (TSI), sonic
spray ionization (SSI), or the hybrid techniques electrosonic spray ionization (ESSI) and
laser spray ionization. So far, only a few exploratory studies on the use of SSI and TSI in
CE-MS have been reported in literature.

Ionization techniques in CE-MS
21
3.1. ESI
Although the first experiments with electrosprays date back to the 18th century, it was not
until 1968 that ESI was introduced in the field of analytical chemistry. Dole et al.
demonstrated that gas-phase ions can be formed and detected when a solution of
polystyrene was electrosprayed [35,36]. Nevertheless, ESI remained a lab curiosity for two
more decades and only gained widespread use after the experiments by Fenn et al. in the
1980s [37,38].
In ESI, a spray of fine droplets is created under the influence of a strong electrical field.
The electrical gradient provides a driving force for electrochemical reactions at the sprayer
tip and for charge separation, so that the spray droplets obtain excess charge. After
subsequent solvent evaporation, the electrostatic repulsion due to the excess charge
overcomes the surface tension at a certain point. A cascade of Coulomb fissions then
occurs, resulting in the formation of a number of smaller offspring droplets. The exact
mechanism by which gas phase ions are then formed from the charged offspring droplets is
still subject of debate [39]. In short, investigations have mainly focused on Dole’s charged
residue model (CRM) [35] and the ion evaporation model (IEM) proposed by Iribarne and
Thomson [40]. According to the CRM, coulomb fissions continue to occur until
nanodroplets are formed that only contain a single analyte molecule. After further
desolvation, the analyte retains the droplet’s excess charge. In the IEM, it is assumed that at
a certain point in the fissioning process the charge density on the droplet’s surface becomes
high enough for solvated analyte ions to be ejected immediately into the gas phase. Detailed
discussions on both mechanisms can be found in the literature [39,41-44].
As mentioned earlier, a wide variety of sheathless, sheath-liquid and liquid-junction
interfaces has been used for the coupling of CE with ESI-MS. The sheathless designs are
commonly used in combination with pure electrospray, which is restricted to flow rates
below ∼10 µL min-1 [45]. With sheath-liquid interfaces, a coaxial flow of nebulizing gas is
commonly added, as in ion spray [46]. This permits stable electrospray operation at higher
flow rates and therefore facilitates the use of ion sources that have specifically been
designed for LC-MS. Liquid junction interfaces have been employed with either pure ESI
[34] or ion spray [17], depending on the size of the emitter tip and flow rate. In most
publications on CE-MS, both pure ESI and nebulising gas supported ESI are shared under
the common denominator of ESI. Nevertheless, substantial mechanistical differences exist,
eventhough spectra may often be similar [47].
Inherent to its liquid-phase mechanism, ESI is prone to analyte signal suppression by
Chapter 2
22
high buffer concentrations, nonvolatile constituents and surfactants. Moreover, nonvolatile
constituents may cause source contamination and high background signals. Therefore,
relatively low concentrations of nonvolatile BGEs, usually comprising formate, acetate
and/or ammonia, are typical BGEs for CE-ESI-MS. Common BGEs for CE-UV, such as
phosphate or borate buffers of high ionic strength, are rarely employed in CE-ESI-MS.
Nevertheless, it has been demonstrated that the use of relatively low concentrations of
nonvolatile BGEs can be feasible in CE-ESI-MS using various sheath-liquid designs [48-
50]. Usually, a modest amount of analyte signal suppression is observed but this can,
depending on exact conditions, be limited to approximately 30-50%. Furthermore,
background clusters such as [Nan(H2PO4)n-1]+, are well defined and may be removed from
the spectra upon background subtraction.
It should be noted that in CE-MS the composition of the CE effluent may differ from the
composition of the BGE in the inlet vial due to mobility differences of BGE constituents.
For example, using a sodium phosphate BGE in the positive ion mode applying a normal
CE voltage, the CE effluent will be reduced in phosphate but enriched in sodium. This may
affect both ionization conditions and the type of background clusters observed [51]. As a
favourable side effect of the low flow rate of CE, the degree of source contamination in CE-
MS is usually modest, even when nonvolatile BGEs are employed.
In CE, separation of neutral compounds or enhancement of selectivity can often be
achieved by the addition of pseudostationary phases (PSPs) such as in micellar
electrokinetic chromatography (MEKC) or microemulsion electrokinetic chromatography
(MEEKC). One challenge in coupling these modes to ESI-MS is the potential interference
of PSPs, such as sodium dodecyl sulphate (SDS), with the ionization process. In order to
achieve MEKC-MS a number of approaches have been developed in which the introduction
of PSPs into the ESI source is avoided. These include partial-filling MEKC [52,53], and the
use of reverse-migrating micelles [54]. Another strategy is the use of special pseudo-
stationary phases like, e.g., volatile surfactants [55,56], or high molecular weight PSPs [57],
which cause less ion suppression and/or do not interfere with the m/z range of the analytes.
The direct coupling of SDS-MEKC with ESI-MS for the analysis of basic analytes has also
been reported [58-60]. As expected, these studies revealed strong background ions
[(SDS)n+Na]+ and significant analyte ionization suppression by SDS (∼90%) but the
resulting detection limits (∼1 µg/mL) were still sufficient for relevant analytical tasks like
drug impurity profiling [59]. Neutral analytes, which require the addition of PSPs for
separation, were found to yield less favorable detection limits (> 20 µM) with the direct
Ionization techniques in CE-MS
23
SDS-MEKC-ESI-MS approach [61]. An attempt to couple MEEKC directly with ESI-MS
has been reported as a part of a study on MEEKC-APPI-MS [62]. Using a BGE containing
2.33% w/w SDS, no analyte peaks could be observed when a mixture of doping agents (20
mg/mL) was injected. This was attributed to strong suppression of the ESI process by SDS.
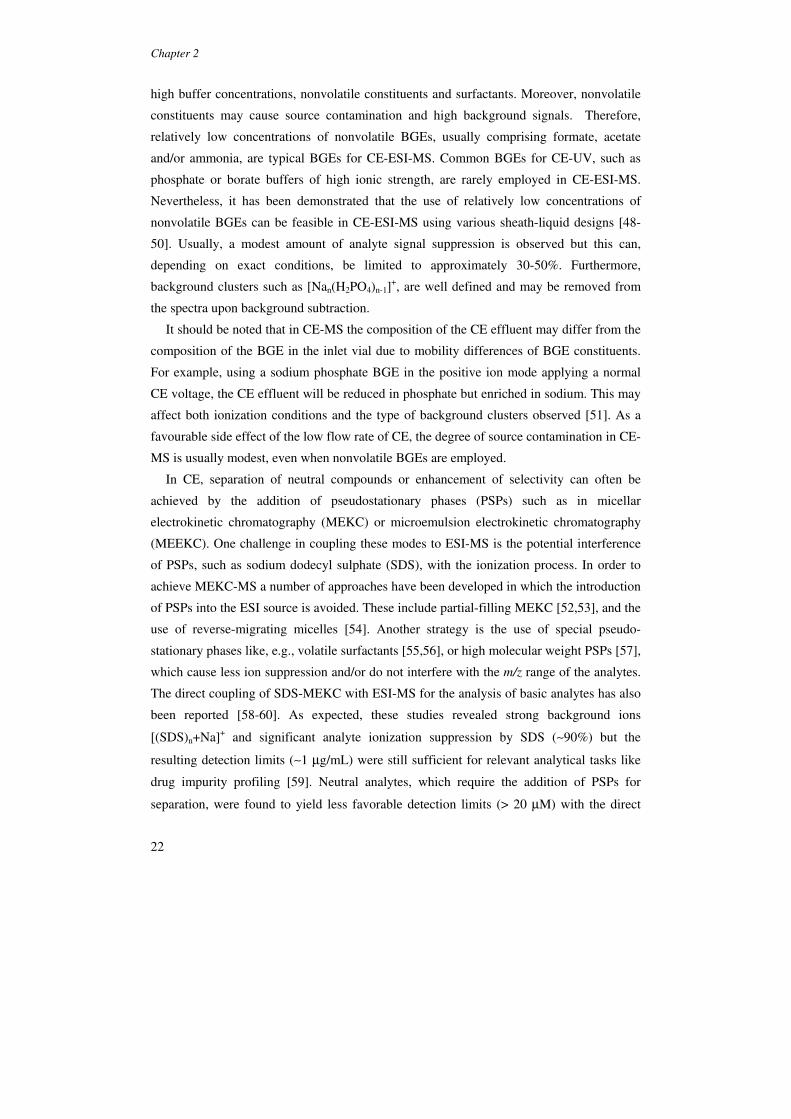
Figure 2. Selected ion electropherograms for cationic metabolites of B. subtilis. The numbers in the upper left corner of each trace are the abundances associated with the tallest peak in the electropherogram, for each m/z, and the numbers of tops of peaks are relative migration times normalized with methionine sulfone as internal standard. Reproduced from [76].

Chapter 2
24
Over the years CE-ESI-MS matured into an accepted analytical technique that has now
found application in many fields of research, including pharmaceutical analysis [63,64],
proteomics [65,66], peptidomics [67], food analysis [68], metabolomics [69], and
biomarker discovery [70-72]. Applications involve a wide range of analytes, e.g drugs [13],
peptides [67], carbohydrates [73,74] and intact proteins [75]. Soga et al. [76] demonstrated
that CE-ESI-MS can be a powerful tool for comprehensive and quantitative analysis of
metabolites (Figure 2). The method enabled detection of 1692 metabolites from Bacillus
subtilis extracts, and revealed significant changes in metabolite levels during sporulation.
Balaguer and Neussüs [77] developed a CE-ESI-TOF MS method for the analysis of
glycans and intact glycoproteins. Excellent separation, high-quality mass spectra, high
dynamic range and good sensitivity were achieved. Figure 3 shows the ESI-TOF-MS
analysis of the main N-glycans released from bovine fetuin, bovine AGP, and rHuEPO.
This example illustrates the possibilities of CE-ESI-MS for analysis of intact proteins and
analysis of biopharmaceuticals.
3.2. Other spray ionization techniques
Next to ESI, which has been the predominant ionization technique for over 20 years, two
other spray ionization techniques have been implemented in CE-MS. These nebulization
ionization techniques differ from ESI in that the spray formation occurs in the absence of an
electrical field. Consequently, charge separation and field-induced electrohydrodynamic
droplet disintegration (fissioning), both of which strongly contribute to the charge density
on the spray droplets, are absent.
3.2.1. Sonic Spray ionization
Sonic spray ionization was introduced by Hirabayashi et al. in 1994 [78]. In contrast to
previously developed ionization techniques at atmospheric pressure, SSI does not require
the use of a high voltage, corona discharge, or heat to aid the ionization of solutes. Instead,
the formation of gas-phase ions is brought about by a coaxial nebulizer gas (nitrogen) at a
speed close to the speed of sound (i.e. sonic speed). Although the exact mechanism is not
entirely understood, it is assumed that a mist of charged droplets is created by the shear
stress due to the high-speed gas flow. Several authors [79-81] have reached the conclusion
that the spray formation follows Dodd’s statistical charging model [82]. The formation of
gas phase ions is then in accordance with the CRM model [35,83] described above for ESI.

Ionization techniques in CE-MS
25
Figure 3. Extracted ion electropherograms obtained for the main glycans released from bovine fetuin
(a), bovine AGP (b), and Pharmacopoeia rHuEPO (c). Reproduced from [77].
An alternative mechanism has been proposed by Deguchi et al. [84] which focuses on
counter ion distribution surrounding the solvated analyte.
Like ESI, the ionization efficiency in SSI is usually highest for analytes that are ionized
in solution. One strong point of SSI is that, as the spray is generated by nitrogen flow only,
Chapter 2
26
sprays formed by SSI are stable at any solution flow rate and at various buffer conditions.
On the other hand, the high-speed coaxial gas-flow in SSI may cause severe band
broadening in CE. This is because the gas-flow creates a pressure reduction at the sample-
introduction capillary of the ion source, which causes a pressure drop along the CE
capillary, and consequently a hydrodynamic flow and loss of resolution. One elegant way to
cancel out such suction effects is the proportional reduction of the pressure in the inlet vial.
However, for large pressure differences between both ends of the capillary this approach
may not be so easy to establish.
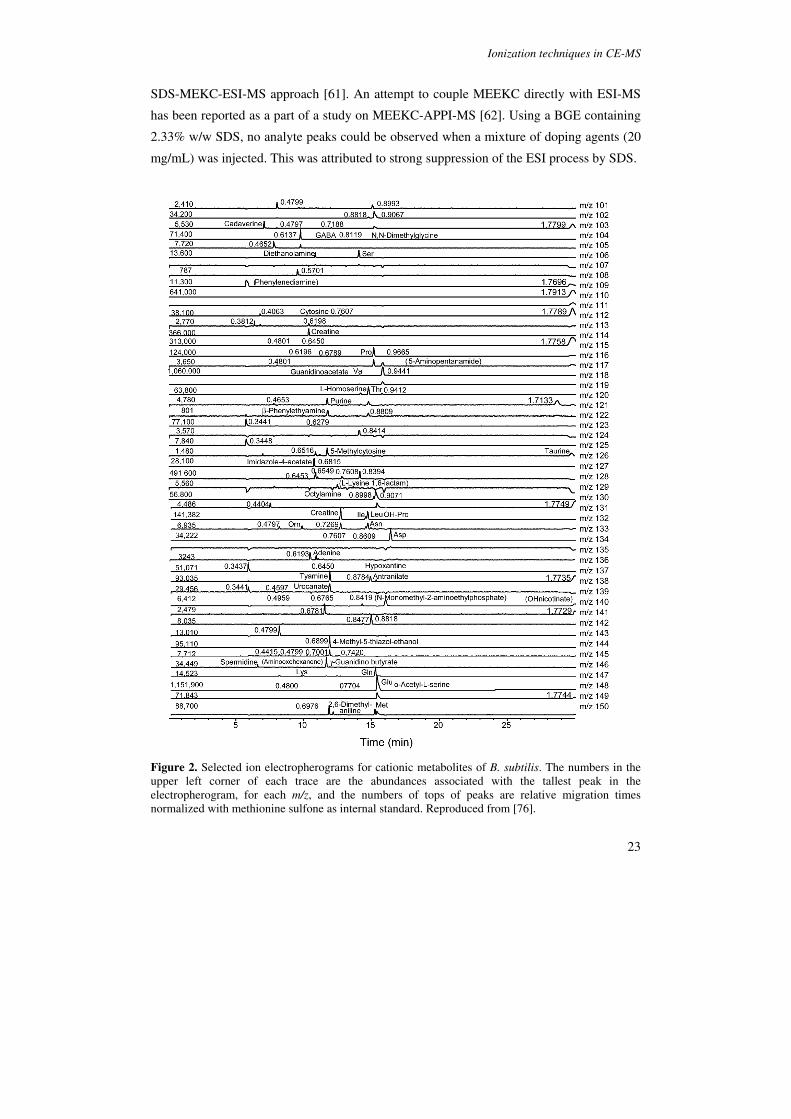
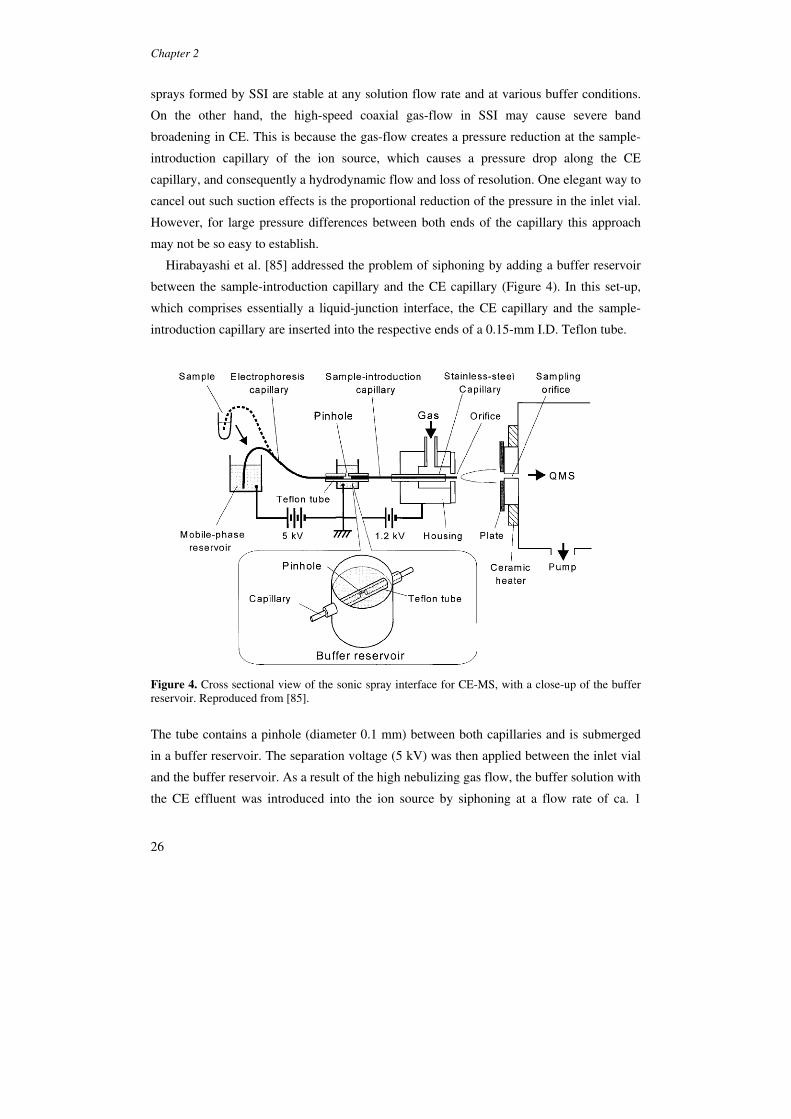
Hirabayashi et al. [85] addressed the problem of siphoning by adding a buffer reservoir
between the sample-introduction capillary and the CE capillary (Figure 4). In this set-up,
which comprises essentially a liquid-junction interface, the CE capillary and the sample-
introduction capillary are inserted into the respective ends of a 0.15-mm I.D. Teflon tube.
Figure 4. Cross sectional view of the sonic spray interface for CE-MS, with a close-up of the buffer reservoir. Reproduced from [85].
The tube contains a pinhole (diameter 0.1 mm) between both capillaries and is submerged
in a buffer reservoir. The separation voltage (5 kV) was then applied between the inlet vial
and the buffer reservoir. As a result of the high nebulizing gas flow, the buffer solution with
the CE effluent was introduced into the ion source by siphoning at a flow rate of ca. 1
Ionization techniques in CE-MS
27
µL/min. As this flow is approximately 10 times larger than the EOF, the CE effluent was
assumed not to diffuse significantly into the buffer reservoir.
Although in SSI the spray remains stable under a wide range of conditions, the
ionization process was found to be suppressed when a phosphate buffer was used.
However, with the liquid-junction interface, the separation buffer is largely diluted by a
volatile buffer solution from the buffer reservoir. For this reason, the use of a 15 mM
phosphate buffer (pH 6.3) for the separation was feasible, and even led to an increase in
S/N by a factor 2-4 as compared to a run in which both reservoirs were filled with 15 mM
ammonium acetate buffer (pH 6.3). However, for the two model compounds dopamine and
GABA, separation efficiencies of only 10,000 and 30,000 theoretical plates were obtained,
while detection limits were slightly lower than 12 and 15 pmol, respectively [85].
3.2.2. Thermospray ionization
TSI was first described by Vestal et al. [86] in 1980 as an ionization technique suitable for
LC-MS. In a TSI-interface, the sample is vaporized as it passes through a heated capillary
tube [87]. This creates a superheated mist carried in a supersonic jet of vapor. The droplets
of the mist are charged positively or negatively according to statistical variations for
random sampling of neutral fluid containing positive and negative ions, in accordance with
Dodd’s statistical charging model [82]. The desorption of charged analytes into the gas
phase may proceed via the CRM or IEV model, as described above for ESI. Although TSI
is largely replaced by ESI nowadays, it has been shown to be a valuable technique for LC-
MS which may even outperform ESI under certain conditions.
One important aspect with regard to CE-MS is that the conventional TSI sources have
not been shown to be effective for liquid flow rates below a few hundred µL min-1. In
addition, the high temperature in the vaporizer could impede establishment of the contact at
the terminal end of the capillary. Although both potential difficulties can be addressed by
using a liquid-junction interface, the original TSI design has, to our knowledge, never been
used in CE-MS.
Recently, an APPI source has been used for CE-MS (see Section 4.2) with the VUV-
source turned off [88,89]. In this case, analyte ionization proceeds through a photon-
independent ionization mechanism, which is similar to that of TSI [90]. Detection of
analytes by this TSI-like mechanism only appeared to be possible when the MS capillary
voltage was set within a narrow range (500-800 V). This is in large contrast with common
APPI-MS (VUV-source on), in which the capillary voltage is less critical as analyte signals

Chapter 2
28
could typically be obtained over a wide range (200-5000 V). Presumably, in TSI, analyte
ions are formed inside the vaporizer rather than in the vicinity of the VUV beam. In this
case, thermospray ions must follow a relatively long and arcing path to reach the sampling
capillary from the vaporizer, and presumably at voltages over 800 V, the thermospray ions
are directed to, and neutralized at, the endplate above the inlet [90]. The formation of ions
through TSI has also been observed during a study on CE-APCI-MS when the corona
current was set at 0 nA [91]. In this study an Agilent APCI source was used, which is
largely similar in design as the Agilent PhotoMate APPI source.
As is common for spray-ionization methods, in CE-TSI-MS analytes are invariably
detected as even-electron ions, such as protonated molecules ([M+H]+) or cations (M+). In
contrast to ESI, the formation of alkali-ion adducts (e.g. [M+Na]+) has hardly been
observed in TSI, even when the BGE consists of sodium phosphate (pH 7.5) [88]. TSI
appears to be efficient only for analytes that are already charged in solution, e.g. for basic
amines and ionic compounds. For compounds that are (largely) uncharged in solution, e.g.
hydrocortisone and 2,6-dimethylaniline hardly any signal has been observed with TSI-MS
[88,89], whereas these compounds are detectable with ESI [51]. Conditions can be selected
at which both TSI and APPI proceed simultaneously. In comparison to APPI-only, this
mixed-mode ionization extends the applicability of CE-APPI-MS towards ionic compounds
and often leads to increased sensitivity for compounds that are already charged in solution.
The sensitivity of TSI and ESI is comparable for highly polar or ionic compounds
[88,89]. The ionization efficiency of ESI appears to be superior but this is compensated for
by the low background noise obtained in TSI-MS. The use of sodium phosphate buffers in
CE-TSI-MS does not show significant background ions. This is in contrast to ESI, in which
sodium phosphate or sodium formate clusters are commonly observed. In a study on CE-
TSI-MS, the effect of nonvolatile BGEs on the signal intensity of mebeverine (basic amine)
and methyl atropine (quaternary ammonium compound) was investigated. It was observed
that phosphate buffer and especially SDS cause a significant signal reduction, roughly
similar to that of a sheath-flow CE-ESI-MS set-up. The feasibility of CE-TSI-ion trap
(IT)MS for drug impurity profiling has recently been studied. For quaternary ammonium
compounds and organic amines, detection limits of ∼100 µg/mL were achieved in full scan
mode, which enabled detection of this type of impurities when 1 mg/mL of parent
compound was injected [89].
Ionization techniques in CE-MS
29
4. Gas-phase ionization techniques
The common feature of gas-phase ionization techniques is that the formation of analyte ions
is preceded by vaporization of the sample. Consequently, this type of ionization relies on
gas-phase thermodynamic properties, such as ionization energy (IE) and proton-affinity
(PA), rather than on liquid-phase properties as in the ionization techniques described in
section 3. The ionization mechanisms of gas-phase techniques performed at atmospheric
pressure are often complex, and may involve a number of ion-molecule reactions. A
favourable characteristic of gas phase ionization techniques is their suitability for less polar
compounds which may not be (efficiently) ionized by spray ionization techniques. In
addition, gas-phase ionization techniques have often been reported to be less susceptible to
ion suppression than ESI or TSI. An inherent drawback is the potential decomposition of
(thermolabile) compounds during sample volatilization. Furthermore, gas-phase ionization
sources often behave like mass-flow sensitive devices. This is relatively unfavorable for
microscale separation techniques like CE, in which absolute injected sample amounts are
inherently low. Moreover, these sources are specifically designed for LC-MS. For instance,
the vaporizer used in these sources is often optimized for flow rates ≥200 µL/min. The most
widely used gas-phase ionization techniques, i.e. APCI and APPI, have both been
implemented in CE-MS.
4.1. APCI
The first APCI source was developed by Horning et al. in 1973 [92]. The original design
contained a radioactive beta source (63Ni) which delivered the low-energy electrons
required for generation of primary ions. Subsequently the 63Ni foil was replaced by a
corona discharge needle, which resulted in similar spectra but a higher dynamic range due
to a one hundred fold increase in reagent ion intensity [93-95]. The source that housed a
corona needle has become the prototype for commercially available APCI sources. In the
positive ion mode, the main primary ions produced by the corona discharge are N2+• and
N4+• [92,96].
N2 + e- → N2+• + 2e- (1)
N2+• + 2N2 → N4
+• + N2 (2)

Chapter 2
30
Due to the high collision rate at atmospheric pressure these primary ions extensively react
with vapor molecules to form reagent ions, such as H+(H2O)n [96].
N4+• + H2O → H2O
+• + 2N2 (3)
H2O+• + H2O → H3O
+ + OH• (4)
H3O+ + H2O + N2 → H+(H2O)2 + N2 (5)
H+(H2O)n-1 + H2O + N2 → H+(H2O)n + N2 (6)
When species are present that have a higher PA than water (691 kJ mol-1), such as ammonia
(853 kJ mol-1) or methanol (754 kJ mol-1), the hydronium ion reacts to yield reactant ions
such as NH4+(H2O)n and CH3OH2
+(H2O)n(CH3OH)m. Since methanol is often added to the
sheath-liquid in CE-MS, the latter type of reagent ions are likely to be highly abundant.
However, when the BGE or sheath-liquid contains ammonia, NH4+(H2O)n-ions are likely to
be dominant. Protonated analyte ions (MH+) are subsequently formed by gas-phase ion-
molecule reactions with reagent ions (BH+):
M + BH+ → MH+ + B (if PAM >> PAB) (7)
The feasibility of using APCI in CE-MS was indicated by Takada et al. [97,98], who
employed a laboratory-made sheath-flow sprayer in combination with a commercially
available APCI source. The design of the sheath-flow sprayer was based on the work of
Smith et al. [15] and employed a coaxial addition of sheath-liquid at a flow rate of 5-10 µL
min-1. Although the proof-of-principle was demonstrated [97,98], the system provided
unfavourable sensitivity. In these studies, the nebulization of the CE effluent and sheath
liquid fully relied on the formation of an electrospray, and efficient analyte introduction
and/or transfer through the vaporizer was probably not achieved. Tanaka et al. [99]
substantially improved the CE-APCI-MS set-up by employing nebulizing gas to enhance
the ionization process (Figure 5). Modification of the APCI source was required in order to
achieve a sufficient penetration of the CE-MS sprayer into the vaporizer.
Recently, CE-APCI-MS was performed using a similar interface but with the sprayer in
orthogonal position [91]. Enhanced sensitivity was reported, which was attributed to a
higher sample transmission through the vaporizer and/or a lower noise level from the
orthogonal set-up.
Ionization techniques in CE-MS
31
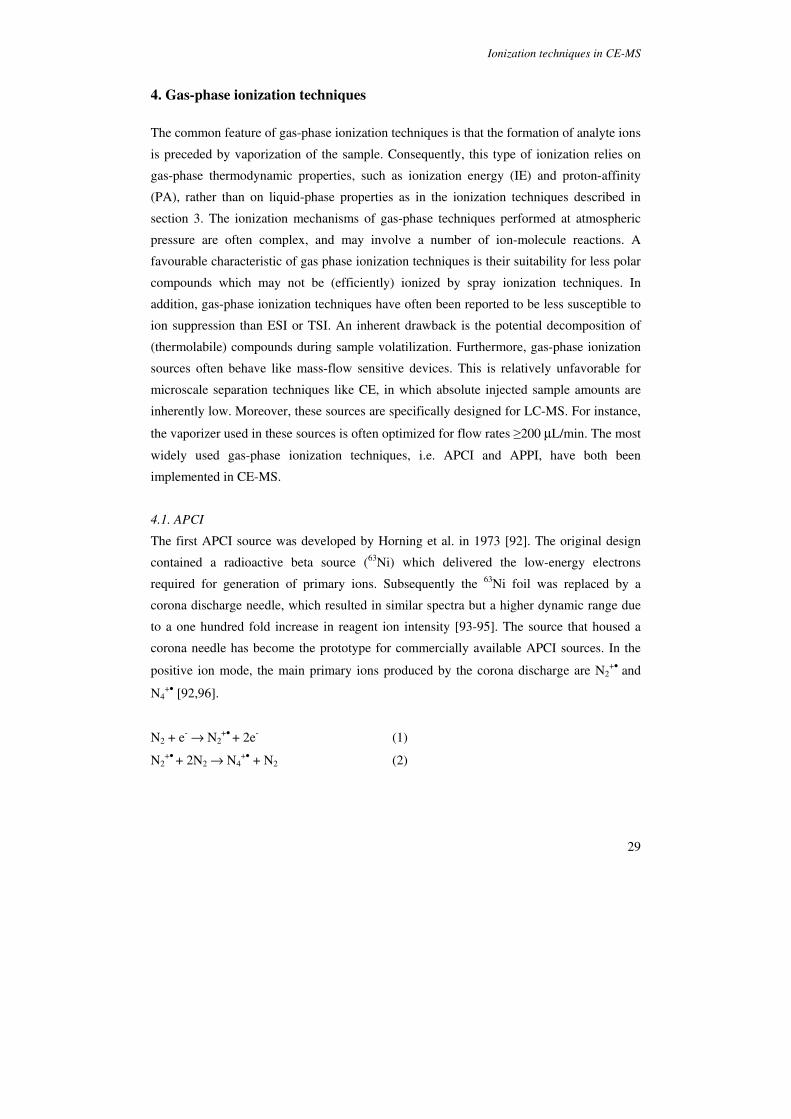
Figure 5. Schematic diagram of (a) the modified APCI interface for CE-MS and (b) details of coaxial sheath-flow configurations in the APCI interface. Reproduced from [99].
The CE-APCI-MS systems in which sample nebulization was supported by a coaxial
flow of nitrogen showed clearly better sensitivity than the set-ups that employed a sheath-
liquid only. The system reported by Tanaka showed detection limits around 25 µg/mL or
better for organic amines in the full-scan mode. With the orthogonal set-up, detection limits
in the range 0.7-2.0 µg/mL were obtained in the full-scan mode for a set of model drugs
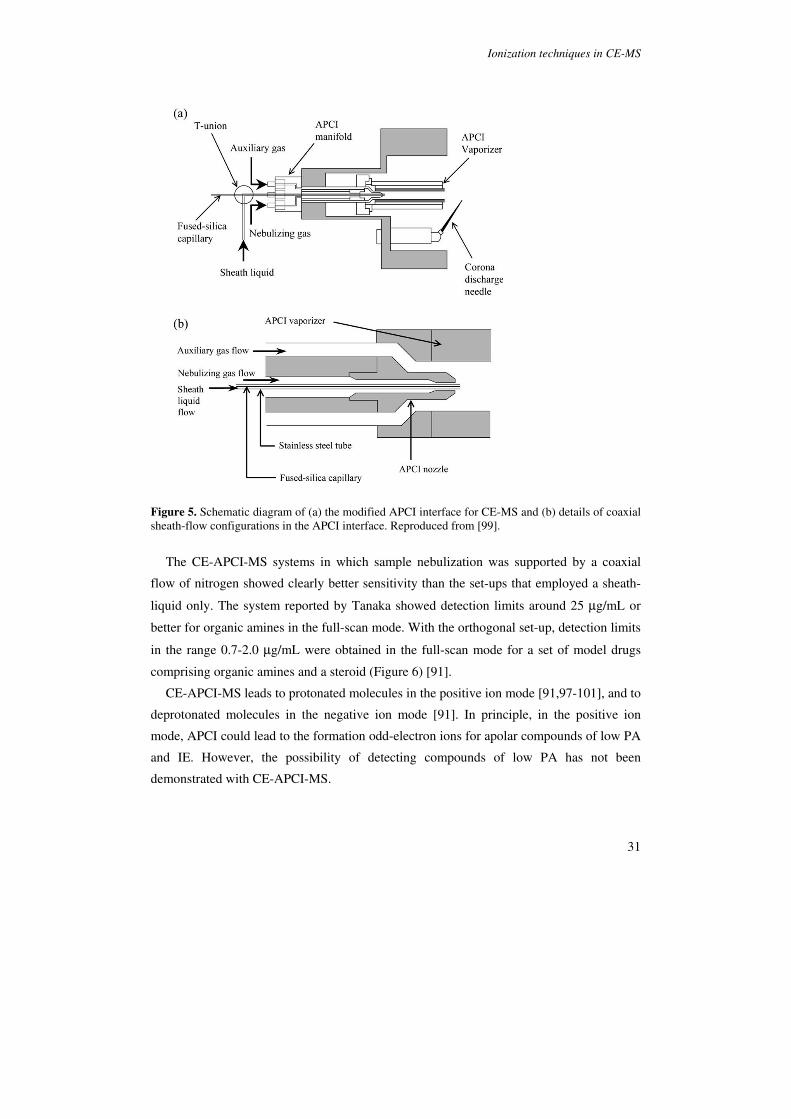
comprising organic amines and a steroid (Figure 6) [91].
CE-APCI-MS leads to protonated molecules in the positive ion mode [91,97-101], and to
deprotonated molecules in the negative ion mode [91]. In principle, in the positive ion
mode, APCI could lead to the formation odd-electron ions for apolar compounds of low PA
and IE. However, the possibility of detecting compounds of low PA has not been
demonstrated with CE-APCI-MS.
Chapter 2
32
4 6 8 10 12 14 16 18 20
0.0
1.0x10⁶
0.0
9.4x10⁵
0.0
9.8x10⁵
0.0
1.1x10⁶
0.0
6.6x10⁵
Time (min)
m/z 290
m/z 163
S/N = 66
S/N = 81
S/N = 70
S/N = 107
m/z 226
m/z 430
m/z 363
AS/N = 30
4 6 8 10 12 14 16 18 20
0.0
7.5x10⁵
0.0
7.5x10⁵
0.0
7.5x10⁵
0.0
8.0x10⁵
0.0
7.5x10⁵
Time (min)
S/N = 55
S/N = 49
S/N = 41
m/z 363
m/z 430
m/z 226
S/N = 94
S/N = 22
B
m/z 290
m/z 163
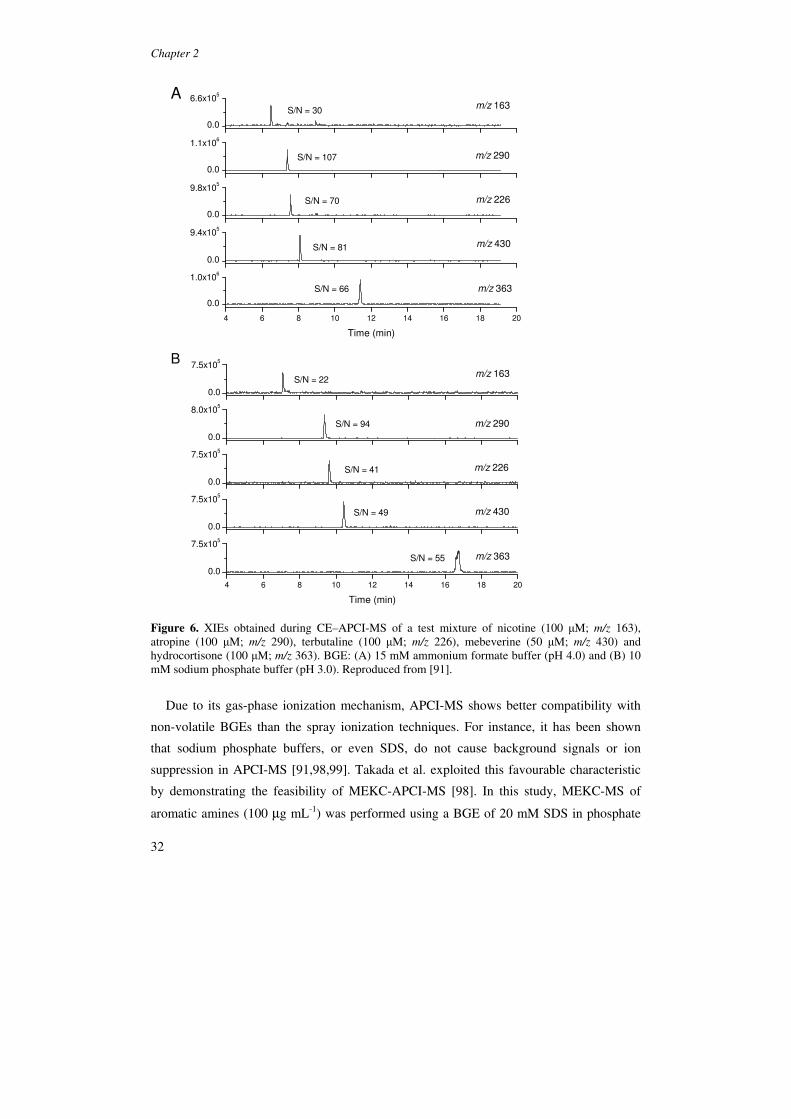
Figure 6. XIEs obtained during CE–APCI-MS of a test mixture of nicotine (100 µM; m/z 163), atropine (100 µM; m/z 290), terbutaline (100 µM; m/z 226), mebeverine (50 µM; m/z 430) and hydrocortisone (100 µM; m/z 363). BGE: (A) 15 mM ammonium formate buffer (pH 4.0) and (B) 10 mM sodium phosphate buffer (pH 3.0). Reproduced from [91].
Due to its gas-phase ionization mechanism, APCI-MS shows better compatibility with
non-volatile BGEs than the spray ionization techniques. For instance, it has been shown
that sodium phosphate buffers, or even SDS, do not cause background signals or ion
suppression in APCI-MS [91,98,99]. Takada et al. exploited this favourable characteristic
by demonstrating the feasibility of MEKC-APCI-MS [98]. In this study, MEKC-MS of
aromatic amines (100 µg mL-1) was performed using a BGE of 20 mM SDS in phosphate
Ionization techniques in CE-MS
33
buffer (20 mM), which yielded roughly equal S/Ns as a CZE-MS analysis with a phosphate
buffer (20 mM). Isoo et al. [101] demonstrated a promising perspective for MEKC-MS. In
a study on partial-filling MEKC-APCI-MS, the authors demonstrated that a 100-600 fold
enhancement in sensitivity can be achieved by employing sweeping as an online sample
concentration technique.
4.2. APPI
APPI is a gas-phase ionization technique similar to APCI and was originally developed to
broaden the range of compounds that can be analyzed by LC-MS towards nonpolar analytes
[102]. APPI sources are similar design as APCI sources. Instead of a corona needle, an
APPI source houses a gas-discharge lamp, usually a Krypton discharge lamp which emits
VUV photons of 10.0 and 10.6 eV energy. Most organic molecules have ionization energies
(IE) in the range 7-10 eV, whereas most solvents that are commonly used in LC (and CE)
have higher IEs (e.g., methanol, IE = 10.8 eV, water, IE = 12.6 eV). Therefore, in principle,
APPI may selectively ionize analyte molecules by direct photoionization.
M + hν → M+• + e- (7)
However, molecular ions are only observed for analytes that possess a low PA, and most
analytes are detected as pronotated molecules. As proposed by Syage [103], the latter type
of ions may be formed following reaction 7 by hydrogen atom abstraction from a protic
solvent.
M+• + S → MH+ + S(-H) • (8)
The rate of primary ion formation can often be increased by the addition of a dopant (D),
which is a substance that has a low IE, and is added to enhance the rate of reagent ion
formation.
D + hν → D+• + e- (9)
Depending on the type of dopant and solvents used, the dopant radical cation may then
further react by either charge exchange or proton-transfer reactions:
Chapter 2
34
D+• + M → D + M+• (10)
D+• + nS → D(-H) • + SnH+ (11)
SnH+ + M → nS + MH+ (12)
Due to the high collision rate at atmospheric pressure, species with a high PA (reactions
11,12) or low IE (reaction 10) tend to dominate the positive ion spectra.
It should be noted that 2-propanol, which is sometimes used in the sheath-liquid for CE-
MS, has an IE of 10.2 eV and may therefore enhance primary ion formation in a similar
way as a dopant. A more detailed treatment on the ionization pathways involved in direct
APPI and dopant-assisted (DA)-APPI can be found elsewhere [90].
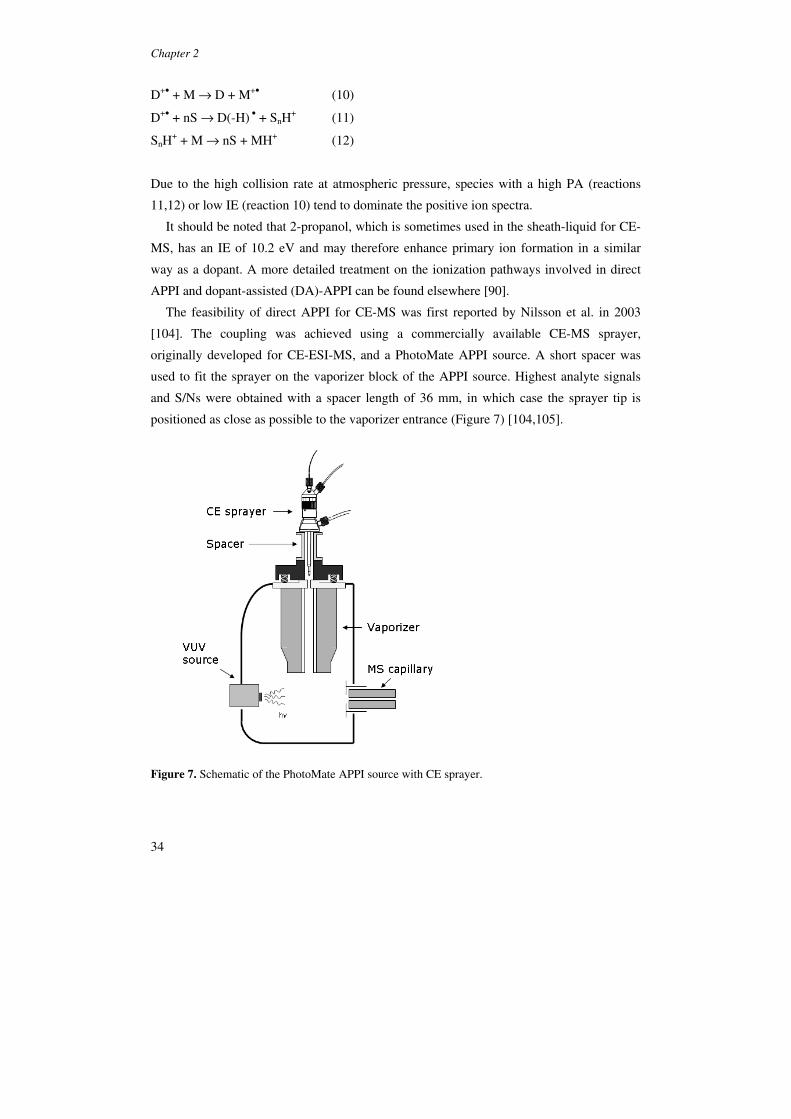
The feasibility of direct APPI for CE-MS was first reported by Nilsson et al. in 2003
[104]. The coupling was achieved using a commercially available CE-MS sprayer,
originally developed for CE-ESI-MS, and a PhotoMate APPI source. A short spacer was
used to fit the sprayer on the vaporizer block of the APPI source. Highest analyte signals
and S/Ns were obtained with a spacer length of 36 mm, in which case the sprayer tip is
positioned as close as possible to the vaporizer entrance (Figure 7) [104,105].
Figure 7. Schematic of the PhotoMate APPI source with CE sprayer.
Ionization techniques in CE-MS
35
In this case, the sprayer tip is about 5 mm closer to the vaporizer entrance than an LC-
sprayer in LC-APPI-MS. This may be a consequence of the substantially different
nebulizing gas pressures used in LC-MS (∼60 psi) and CE-MS (≤ 25 psi). The nebulizing
gas pressure in CE-MS is limited to ∼25 psi since higher values entail significant siphoning
effects, band broadening, and the risk of CE current drops.
In the positive ion mode, APPI generally yields protonated molecules for basic and polar
neutral compounds [104,105]. With transfer voltages around -650 V, even-electron ions
may also result from TSI (section 3.2.2). In the abovementioned study by Nilsson et al.
[104], in which the optimized transfer voltage was reported to be -650 V, TSI may have
(substantially) contributed to the analyte signals obtained. Later CE-APCI-MS studies
usually employed transfer voltages of ∼-1000 V [105,106]. Under this condition, analyte
ionization can be fully attributed to APPI as no analyte and background ions are observed
when the Krypton lamp is switched off [105]. Apolar compounds, such as naphthalene and
diphenyl sulphide can be detected as molecular ion [105]. So far CE-APPI-MS has hardly
been employed in the negative ion mode.
Generally, analyte signal intensities in CE-APPI-MS can be improved by the addition of
a dopant. Mol et al. [105] indicated that CE-DA-APPI can be performed simply by adding a
dopant (acetone, toluene) to the sheath-liquid. The addition of acetone to the sheath liquid
significantly increased the ionization of polar analytes whereas toluene was more efficient
for the ionization of nonpolar compounds [105]. Schappler et al. employed an experimental
design methodology for optimizing a number of APPI parameters [106]. In this study it was
observed that highest sensitivity for basic analytes could be achieved when the sheath-
liquid contained a high percentage of 2-propanol. This effect was attributed to the lower
volatility of this compound as compared to water. An alternative explanation may be that 2-
propanol, which is ionized by the VUV beam, enhances ionization of polar compounds by
acting as a dopant.
APPI has shown to be highly compatible with nonvolatile BGEs. The application of
sodium phosphate buffers or SDS in APPI-MS does not lead to significant background
signals or analyte signal suppression [51,61,105]. Comparative studies of APPI and ESI for
CZE-MS indicated that when volatile or low concentrations of nonvolatile BGEs are used,
APPI provides approximately 3-10 times higher detection limits than ESI for basic
compounds [51,106]. Detection limits for basic compounds are currently in the high ng/mL
range, whereas detection limits of ∼60 ng/mL (S/N=3) have been reported in the SIM mode
[106].

Chapter 2
36
CE-APPI-MS has invariably been employed for the analysis of small molecules such as
drugs [105,107] or doping agents [62] (Table 1). Mol et al. demonstrated the feasibility of
MEKC-DA-APPI-MS [108]. Separation and detection of polar and apolar test compounds
was achieved with a BGE consisting of 20-50 mM SDS and 25% acetonitrile. The
applicability of the method for pharmaceutical analysis was demonstrated by the analysis of
a sample of the basic drug mebeverine (2 mg/mL) containing two basic and one neutral
impurity at 0.25% (w/w). With toluene as dopant, MEKC-APPI-MS allowed detection of
all three spiked impurities. Himmelsbach et al. reported the feasibility of MEEKC-MS
[107,109]. Employing BGEs containing up to 3% SDS, nine basic pharmaceutical
compounds could be separated and detected at 0.5-5 µg/mL in the MS/MS mode. Schappler
et al. studied the feasibility of MEEKC-MS for the analysis of doping agents, i.e.
betablockers, diuretics and steroids, in positive and negative ion mode [62] (Figure 8).
Figure 8. MEEKC-APPI-MS electropherograms obtained by injecting a mixture of four doping agents detected in negative ionization mode. TIE and XIE in SIM mode of probenecid, hydrochlorthiazide, chlortalidone and bendroflumethiazide at 50 µg/mL each. Reproduced from [62].
The developed methods showed excellent selectivity and sub-µg/ml detection limits in
the positive ion mode with SIM. However, it was concluded that a further gain in sensitivity
is still required to achieve the 10-500 ng/mL required in doping analysis.
.
Ionization techniques in CE-MS
37
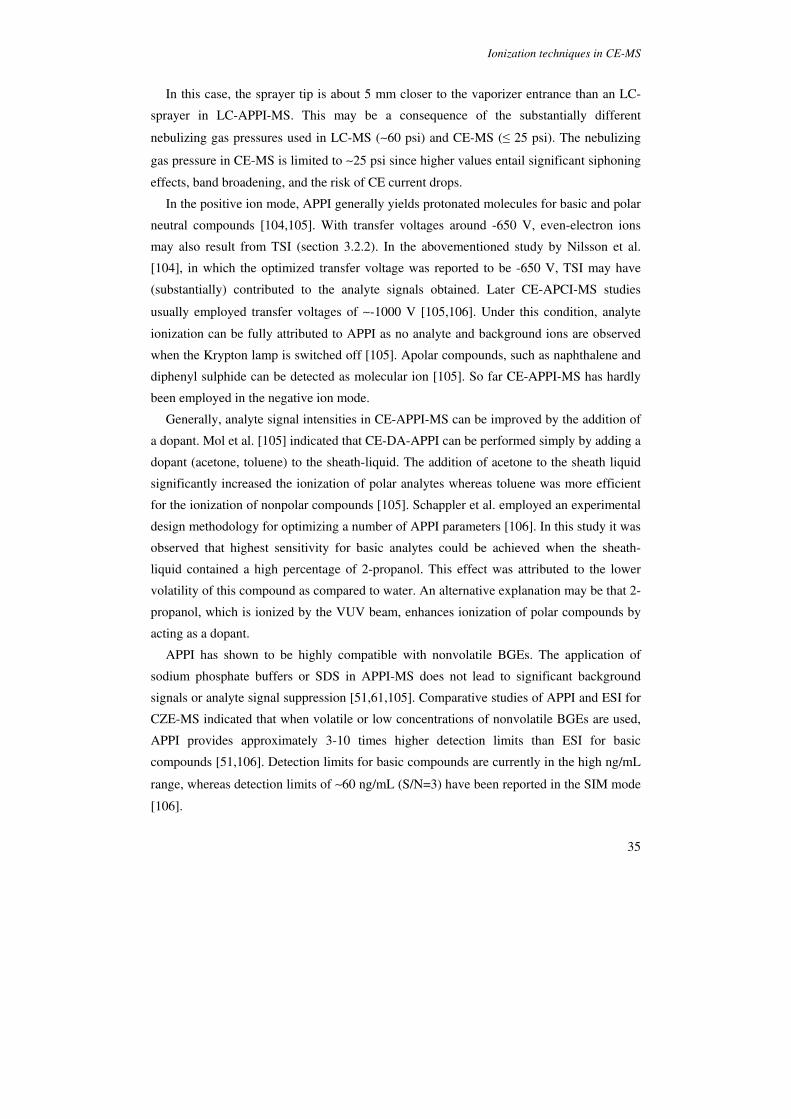
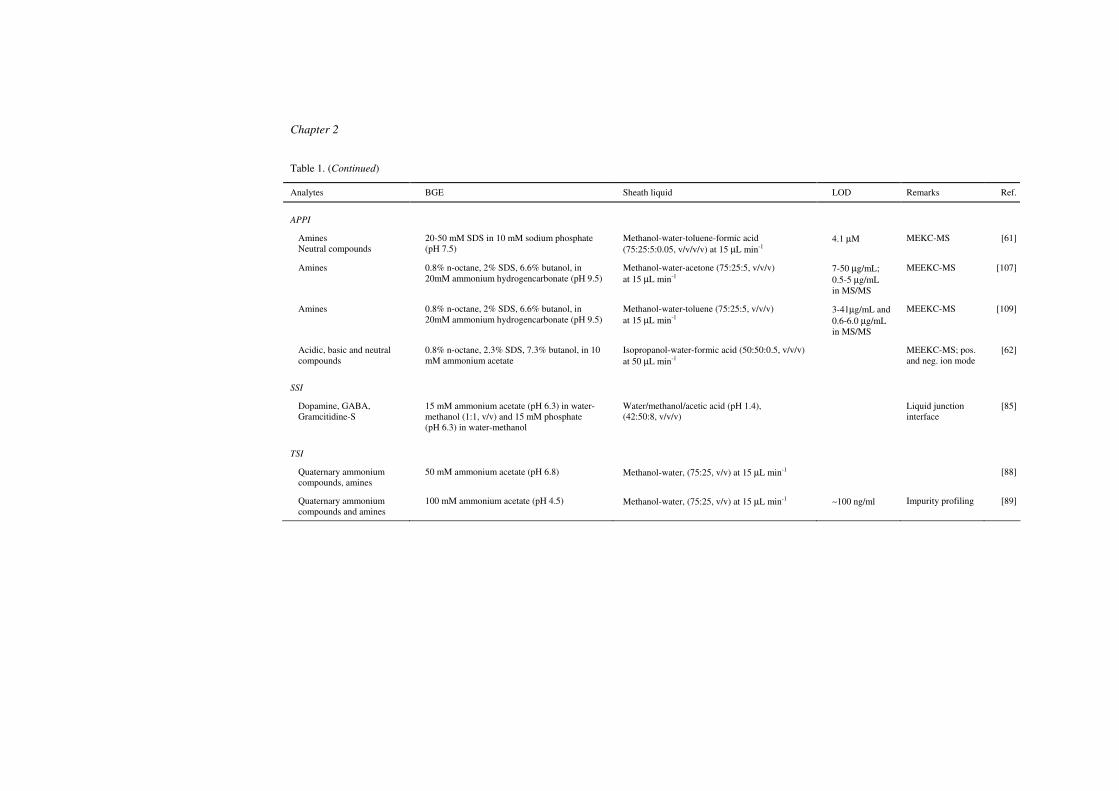
Table 1. Applications of CE-MS using APCI, APPI, SSI and TSI
Analytes BGE Sheath liquid LOD Remarks Ref.
APCI
Caffeine 20 mM sodium phosphate (pH 6.6) 100% methanol at 5 µL min-1 SIM [97]
Aromatic amines 20 mM SDS in phosphate 100% methanol at 10 µL min-1 MEKC-MS; SIM
[98]
Caffeine, ethenzamide 25 mM SDS in 20 mM ammonium acetate (pH 10)
100% methanol at 30 µL min-1 PF-MEKC [100]
Amines 50 mM SDS in 10 mM phosphate- 20 mM borate buffer (pH 7)
100% Methanol at 30 µL min-1 0.4 ppm PF-MEKC; Sweeping; SIM
[101]
Pindolol, trimipramine, sulpiride, nicardipine
50 mM ammonium formate (pH 5) 50 mM ammonium formate (pH 5)-methanol, (1:1, v/v)
<25 µg/mL [99]
Amines, hydrocortisone 15 mM ammonium formate (pH 4.0) and 10 mM sodium phosphate (pH 3.0)
Methanol-water-formic acid (75:25:0.1, v/v/v) at 15 µL min-1
1.6-10 µM Orthogonal interface
[91]
APPI
Amines 50 mM ammonium formate (pH 2.6) and 50 mM potassium phosphate (pH 2.5)
10 mM formic acid-methanol (1:1) at 25 µL min-1 Direct APPI [104]
Amines and apolar compounds
20 mM SDS in 10 mM sodium phosphate (pH 7.5)-acetonitrile (75:25, v/v)
Acetonitrile-methanol-acetone (75:25:5, v/v/v) and methanol-water-toluene (75:25:5, v/v/v) at 15 µL min-1
∼2 µg/mL DA-APPI CZE-MS and MEKC-MS
[105]
Amines, hydrocortisone 10 mM sodium phosphate (pH 3 and 7), 50 mM ammonium acetate (pH 3 and 6.8)
Methanol-water-toluene-formic acid (75:25:5:0.1 v/v/v/v) at 15 µL min-1
0.3-2.5 µM [51]
Amines 15 mM (ionic strength) ammonium formate (pH 2.5)
2-propanol-water-acetone (50:50:0.5, v/v/v) at 50 µL min-1
∼60 ng/mL (SIM)
Experimental design; SIM
[106]
Amines and apolar compounds
20 mM SDS in 10 mM sodium phosphate (pH 7.5)-acetonitrile (75:25, v/v)
Acetonitrile-methanol-acetone (75:25:5, v/v/v) and Methanol-water-toluene (75:25:5, v/v/v) at 15 µL min-1
0.8 µg/mL, ∼100 ng/mL (SIM)
MEKC-MS SIM
[108]
Chapter 2
38
Table 1. (Continued)
Analytes BGE Sheath liquid LOD Remarks Ref.
APPI
Amines Neutral compounds
20-50 mM SDS in 10 mM sodium phosphate (pH 7.5)
Methanol-water-toluene-formic acid (75:25:5:0.05, v/v/v/v) at 15 µL min-1
4.1 µM MEKC-MS [61]
Amines 0.8% n-octane, 2% SDS, 6.6% butanol, in 20mM ammonium hydrogencarbonate (pH 9.5)
Methanol-water-acetone (75:25:5, v/v/v) at 15 µL min-1
7-50 µg/mL; 0.5-5 µg/mL in MS/MS
MEEKC-MS [107]
Amines 0.8% n-octane, 2% SDS, 6.6% butanol, in 20mM ammonium hydrogencarbonate (pH 9.5)
Methanol-water-toluene (75:25:5, v/v/v) at 15 µL min-1
3-41µg/mL and 0.6-6.0 µg/mL in MS/MS
MEEKC-MS [109]
Acidic, basic and neutral compounds
0.8% n-octane, 2.3% SDS, 7.3% butanol, in 10 mM ammonium acetate
Isopropanol-water-formic acid (50:50:0.5, v/v/v) at 50 µL min-1
MEEKC-MS; pos. and neg. ion mode
[62]
SSI
Dopamine, GABA, Gramcitidine-S
15 mM ammonium acetate (pH 6.3) in water-methanol (1:1, v/v) and 15 mM phosphate (pH 6.3) in water-methanol
Water/methanol/acetic acid (pH 1.4), (42:50:8, v/v/v)
Liquid junction interface
[85]
TSI
Quaternary ammonium compounds, amines
50 mM ammonium acetate (pH 6.8) Methanol-water, (75:25, v/v) at 15 µL min-1 [88]
Quaternary ammonium compounds and amines
100 mM ammonium acetate (pH 4.5) Methanol-water, (75:25, v/v) at 15 µL min-1 ∼100 ng/ml Impurity profiling [89]
Ionization techniques in CE-MS
39
5. Desorption ionization techniques
With the introduction of desorption ionization techniques in the early 1970s, mass
spectrometry became applicable to nonvolatile and thermally labile analytes which were not
amenable to electron ionization (EI) or chemical ionization (CI) [110]. In all DI techniques,
the sample is admixed into a suitable solid or liquid matrix, whereupon release of analyte
(desorption) and ionization are achieved by introduction of relatively large amounts of
energy. The specific techniques use different sources of energy, e.g. energetic atoms (FAB),
nuclear fission fragments (plasma desorption) or photons (MALDI). Although the merit of
being suitable for nonvolatile and thermally labile compounds has lost part of its original
significance since the introduction of ESI, some DI techniques are still in wide use.
MALDI, along with ESI, has been the predominant technique for MS analysis of
biopolymers and other thermally labile compounds. Generally, DI techniques require little
sample preparation and detection limits in the nanomolar range can be obtained. Positive
and negative ions in DI are generated by cation/anion attachment, proton transfer, and other
ion-molecule reactions. In contrast to ESI, multiply-charged ions are seldom observed in DI
techniques and macromolecules with a molecular mass of a few thousand Da are usually
detected as singly charged even-electron ions.
5.1. MALDI
The term “matrix-assisted laser desorption” was first used by Karas et al. in the mid 1980s
[111]. In subsequent years, MALDI gained enormous importance as an ionization technique
for (large) biomolecules, and, together with ESI, it became the method of choice in the field
of proteomics. In a typical MALDI experiment the sample is diluted and co-crystallized on
a probe with a suitable matrix. Thereafter, the probe is transferred into a high vacuum
ionization chamber and the required energy input for analyte desorption is provided by
irradiating the sample spot with a laser beam. The matrix usually consists of one or more
organic acids that co-crystallize well with the analytes and that absorb strongly at the
wavelength of the laser. The most widely used laser in MALDI is a nitrogen laser (337 nm),
but a range of other lasers has been used as well [111-113]. Due to the high dilution factor
in the matrix, analyte molecules are not irradiated directly. For analyte ionization two main
models have been proposed, viz. photochemical ionization [114] and cluster ionization
[115-117]. In the photochemical ionization model, matrix molecules are desorbed and
ionized upon absorption of laser photons. Analyte ions are subsequently produced by
Chapter 2
40
(de)protonation when analyte molecules collide with matrix ions in the gas phase.
According to the cluster ionization model, analyte ions are already precharged in the matrix
crystals. Charged clusters of analyte and matrix molecules are then desorbed upon laser
irradiation, and analyte ions are subsequently produced by desolvation of matrix from the
cluster ions. More detailed discussions on ionization mechanisms of MALDI can be found
elsewhere [117,118]. The MALDI process commonly results in even-electron singly-
charged analyte ions, mostly [M+H]+ or [M-H]-, but alkali-ion adducts are also observed
frequently. The formation of multiply charged ions, such as [M+nH]n+, is less common,
even for macromolecules, but may nevertheless occur under certain conditions. Due to the
extended mass range required for detection of singly-charged macromolecules, and the
pulsed nature of ion generation, MALDI is predominantly combined with time-of-flight
(TOF) mass analyzers.
A variety of different approaches have been described to combine CE with MALDI-MS
including both on-line and off-line methods. Challenges in developing online approaches
are posed by the need to mix the sample with a matrix and by the introduction of the sample
in the high-vacuum ion chamber. Preissler et al. developed a number of continuous vacuum
deposition (VD) interfaces suitable for the online coupling of CE with MALDI-MS [119-
121]. In these systems, the matrix is mixed with the CE stream through a liquid junction,
which also serves as the electrical contact. This mixture is then introduced at 100-400
nL/min into the vacuum system through a narrow fused silica capillary. In the original
interface, the effluent from the capillary was deposited onto a rotating quartz wheel. A
direct contact between the vacuum end of the inlet capillary and the quarts wheel appeared
essential, as this prevents freezing of the sample at the capillary exit. Once the sample is
deposited, the solvent rapidly evaporates due to the vacuum, leaving a narrow trace
deposited on the wheel. Rotation of the wheel then transports the sample trace to a slit in a
repeller plate where it is irradiated by the MALDI laser. The feasibility of the approach was
demonstrated by the online CE-MALDI-TOF-MS analysis of peptide mixtures [119]. A
restriction of this rotating wheel interface is that the area available for sample deposition is
limited and the wheel has to be cleaned after each complete turn (3 min), which entails
breaking up the vacuum. In an improved version the wheel was therefore replaced by a
disposable moving tape (80 m) which enabled 24 hours of continuous analysis [120]. In a
subsequent study, this interface was adapted for capillary array electrophoresis (CAE)-
MALDI-MS [121]. In this approach, eight CE capillaries were used in parallel and
connected to eight infusion capillaries via a common liquid junction. Using a fast-scanning
Ionization techniques in CE-MS
41
mirror, the positions of the eight sample traces on the tape were automatically determined
and subsequently analysed by MALDI-MS. The system enabled high sample-throughput
without compromising separation performance and sensitivity of analysis and with no
sample cross talk.
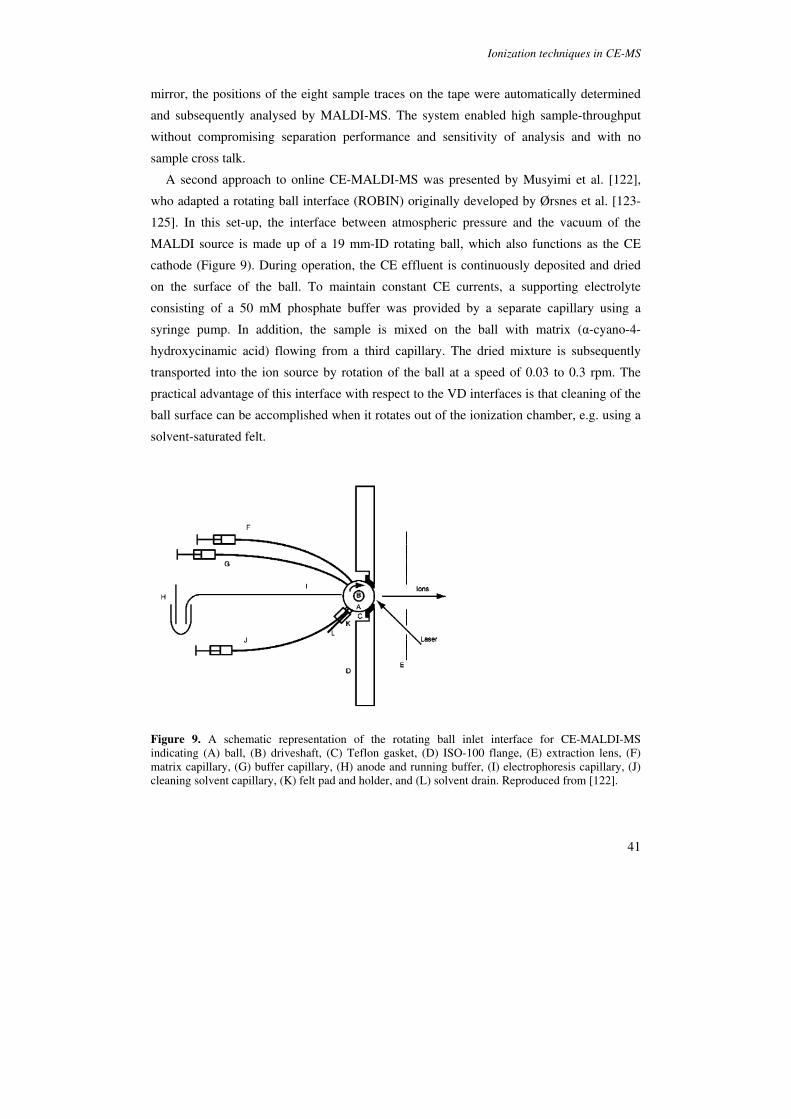
A second approach to online CE-MALDI-MS was presented by Musyimi et al. [122],
who adapted a rotating ball interface (ROBIN) originally developed by Ørsnes et al. [123-
125]. In this set-up, the interface between atmospheric pressure and the vacuum of the
MALDI source is made up of a 19 mm-ID rotating ball, which also functions as the CE
cathode (Figure 9). During operation, the CE effluent is continuously deposited and dried
on the surface of the ball. To maintain constant CE currents, a supporting electrolyte
consisting of a 50 mM phosphate buffer was provided by a separate capillary using a
syringe pump. In addition, the sample is mixed on the ball with matrix (α-cyano-4-
hydroxycinamic acid) flowing from a third capillary. The dried mixture is subsequently
transported into the ion source by rotation of the ball at a speed of 0.03 to 0.3 rpm. The
practical advantage of this interface with respect to the VD interfaces is that cleaning of the
ball surface can be accomplished when it rotates out of the ionization chamber, e.g. using a
solvent-saturated felt.
Figure 9. A schematic representation of the rotating ball inlet interface for CE-MALDI-MS indicating (A) ball, (B) driveshaft, (C) Teflon gasket, (D) ISO-100 flange, (E) extraction lens, (F) matrix capillary, (G) buffer capillary, (H) anode and running buffer, (I) electrophoresis capillary, (J) cleaning solvent capillary, (K) felt pad and holder, and (L) solvent drain. Reproduced from [122].
Chapter 2
42
Both the VD and ROBIN interfaces yield the possibility to obtain CE-MALDI-MS results
almost in real-time while no, or limited, sample handling is needed. In addition, both
interfaces yield good efficiency and sensitivity for online CE-MS (Table 2). However, these
interfaces have only been used with very short capillaries (10-20 cm) which might not be
appropriate when complex samples are analyzed. Also, due to the transport time between
sample deposition and laser irradiation, there is still a delay of 100 s or more between CE
separation and TOF analysis.
In the off-line combination of CE with MALDI-MS the sample is usually deposited on a
MALDI target plate before introduction into the mass spectrometer. The off-line
combination of CE with MALDI-MS has a number of advantages: (i) no adaptation of the
MS instrument is required, (ii) separation and detection can be optimized largely
independently, (iii) chemical or enzymatic sample processing prior to MS analysis is
possible, (iv) data-acquisition rate is not critical, and (v) repeated measurements of the
same sample spot are possible.
The most widely used method of offline MALDI-MS concerns the collection of fractions of
the CE effluent, either off-target or directly onto the MALDI target plate. The matrix may
then be added prior to, or after sample deposition. Several ways of applying the electrical
contact have been described in the literature including sheathless [126] and sheath-liquid
interfaces [127,128]. Alternative options include the use of porous glass [129,130] or
polymer joints [131], an electrically connected membrane target [132], a silver epoxy
coating [133], or a droplet of buffer [134]. Addition of matrix and application of the
electrical contact may also be achieved simultaneously by incorporating the matrix in the
sheath liquid [127]. Figure 10 shows a typical example of a sheath-liquid configuration. In
this set-up the CE capillary is inserted into a fixed steel needle and a sheath-liquid is added
to facilitate sample collection. The MALDI target plate is integrated in an automated x-y-z
motion system. The main drawback of the fractionation process is the accumulation of CE
effluent over discrete time intervals, which reduces the resolution achieved by CE. This
effect may (partly) be reduced by deposition of the CE effluent as a continuous streak
[10,127,132,136,137]. Liu et al. presented the offline combination of open microchannel
electrophoresis with MALDI-MS [138]. Based on this work, Jacksén et al. developed an
off-line CE MALDI-MS system comprising a CE capillary coupled to a silicon chip with an
open microcanal [139]. The chip is used as a MALDI target, which is thus forms an
integrated part of the fluidic system.

Ionization techniques in CE-MS
43
Figure 10. Schematic of the experimental setup of an offline CE/MALDI-MS interface. The CE capillary enters the T-connection from the top and exits at the outlet of the steel needle. CE effluent is transported onto the MALDI target by a liquid sheath flow. At a set time interval, the sample support is lowered and moved to the next position. Reproduced from [135].
MALDI is known to be relatively tolerant towards salts and non-volatile buffers, at least
in comparison with ESI. Still, it has been observed that (high levels of) salts, buffers and
surfactants may cause significant suppression of MALDI signals [140,141]. For this reason,
co-collection of non-volatile buffers on the sample spots is often avoided, even though
phosphate buffers provide excellent resolution for CE of proteins and peptides [142-144].
Nevertheless, nonvolatile BGEs have been employed a number of times, especially in
capillary isoelectric focussing (cIEF) MALDI-MS [145-147]. Chartogne et al. [147]
observed that the MALDI-MS signal intensity of myoglobin was reduced when the
ampholyte concentration on the target spot was above 0.5%. However, due to the low flow
rate in the capillary and dilution by the sheath liquid, the ampholyte concentration on the
spot was estimated to be around 0.2% when 5% carrier ampholytes was used. Under this
condition, the effect of carrier ampholyte on the protein mass spectra was found to be
negligible [147].
Applications of CE MALDI-MS mainly concern analysis of peptides and (biological)
macromolecules [9,25,75]. For instance, Choudhary et al. [148] analysed crude urine
samples of cancer patients exhibiting cachexia and observed characteristic ions at m/z

Chapter 2
44
values of ∼24 and ∼67 kDa that were not present in the control group. The 24-kDa peak
was identified as the glycoprotein associated with cachexia. Recently, Zuberovic et al.
[149] employed offline CE MALDI-MS to quantitatively monitor the protein content in
human ventricular cerebrospinal fluid with iTRAQTM labelling. The analysis yielded 43
identified proteins that could be monitored over time.
5.2. CF-FAB
FAB was introduced by Barber et al. in 1981 [150]. In a typical FAB experiment with a
direct insertion probe, the sample is first dissolved in a matrix (usually glycerol) and then
introduced into a low-pressure (∼10-4 mbar) ionization chamber. Ionization of analytes is
subsequently achieved by exposing the matrix to a beam of high-energy (3-8 keV) atoms of
argon or xenon. Typically, the matrix largely consists of glycerol (80-95%) so that the
liquid droplet survives introduction into the vacuum system. As with MALDI, the
mechanism or mechanisms by which analyte ions are formed in FAB has not been resolved
completely. In the cases of salts, the ions are already preformed and are desorbed into the
gas-phase upon the sudden energy input by the beam of atoms. In some studies it has been
found that analyte responses depend on PA [151,152], which suggests that ions are formed
by ion-molecule reactions immediately above the FAB target [153]. Detailed discussions on
the ionization mechanisms in FAB can be found in the literature [154].
The online coupling of liquid-phase separation techniques requires a suitable means to
continuously introduce the sample into the FAB source. Caprioli et al. [155] developed a
continuous-flow sample introduction probe that enabled a flow of 5 µL/min of a solution
containing as little as 10% of glycerol. The FAB matrix was mixed with the analyte before
introduction into the FAB probe, typically by means of a liquid-junction. Another probe for
continuous-flow (CF)-FAB was developed by De Wit et al. [156]. In this design the matrix
was added through via sheath-liquid interface, which allowed separate control of the matrix
and sample flow.
The CE-CF-FAB systems reported in literature have all been based on either the liquid-
junction [157-160] or the sheath-flow design [161-166]. The feasibility of CE-CF-FAB-MS
was first reported by Minard et al. [157] with a liquid-junction interface. In this set-up the
CE and the CF-FAB capillaries were separated by a distance of 20 µm and immersed into
the FAB matrix containing methanol or methanol-acetonitrile with 4 to 20% glycerol
(Figure 11A). An important aspect of this interface is the amount of band broadening
produced from mixing of the CE effluent with the CF-FAB matrix. Initial liquid-junction
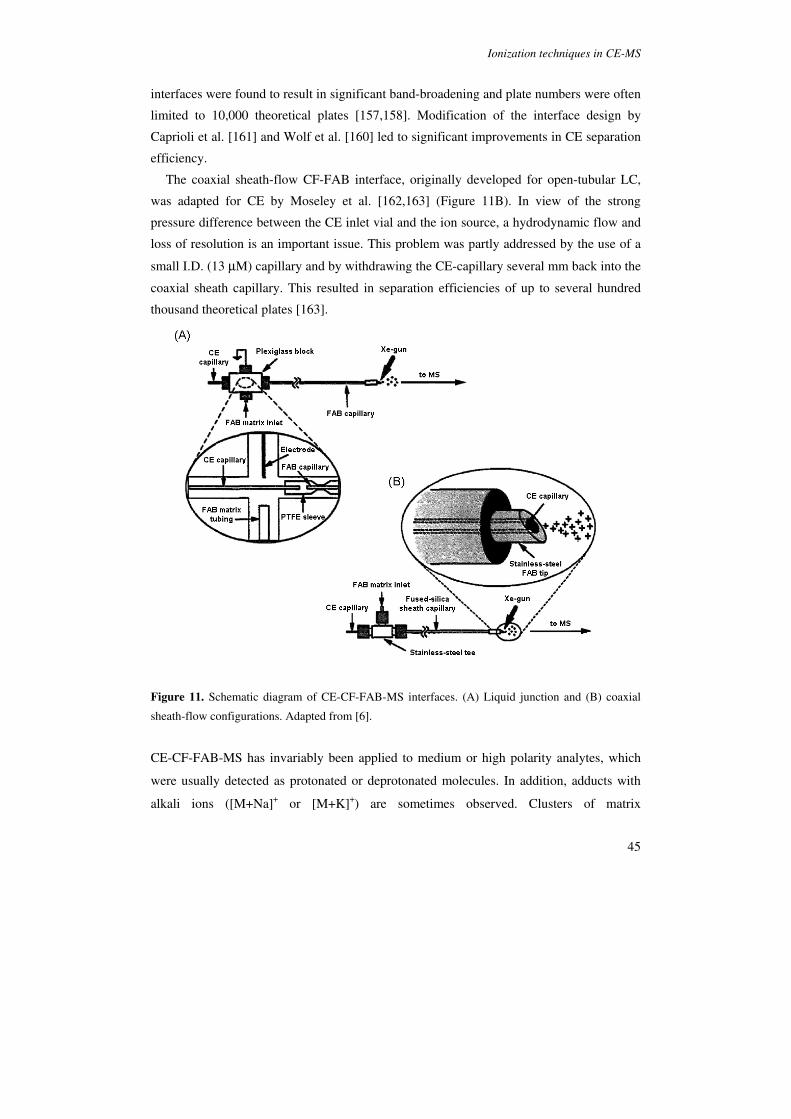
Ionization techniques in CE-MS
45
interfaces were found to result in significant band-broadening and plate numbers were often
limited to 10,000 theoretical plates [157,158]. Modification of the interface design by
Caprioli et al. [161] and Wolf et al. [160] led to significant improvements in CE separation
efficiency.
The coaxial sheath-flow CF-FAB interface, originally developed for open-tubular LC,
was adapted for CE by Moseley et al. [162,163] (Figure 11B). In view of the strong
pressure difference between the CE inlet vial and the ion source, a hydrodynamic flow and
loss of resolution is an important issue. This problem was partly addressed by the use of a
small I.D. (13 µM) capillary and by withdrawing the CE-capillary several mm back into the
coaxial sheath capillary. This resulted in separation efficiencies of up to several hundred
thousand theoretical plates [163].
Figure 11. Schematic diagram of CE-CF-FAB-MS interfaces. (A) Liquid junction and (B) coaxial
sheath-flow configurations. Adapted from [6].
CE-CF-FAB-MS has invariably been applied to medium or high polarity analytes, which
were usually detected as protonated or deprotonated molecules. In addition, adducts with
alkali ions ([M+Na]+ or [M+K]+) are sometimes observed. Clusters of matrix

Chapter 2
46
Table 2. Applications of CE-MS using MALDI and CF-FAB.
Analytes BGE Matrix LOD Remarks Ref.
MALDI
glycopeptides 50mM ammonium formiate (pH 2.7), 50mM triethylammonium acetate (pH 5.0), 50mM ammonium formiate (pH 8.0)
Triaxial sheath flow interface
[167]
Peptides α-cyano-4-hydroxycinnamic acid and 3,5-dimethoxy-4-hydroxy-cinnamic acid
Droplet electrocoupling
[134]
Neuropeptides Acetonitrile 10% in 100 mM ammonium formate (pH 3.9)
1.5 nM 75 attomoles
[131]
[Lsy8] vasopressin Substance P neurotensin
50 mM phosphate pH 2.5 α-cyano-4-hydroxycinnamic acid
Low fmole- range
Online RB
[122]
Peptides, Angiotensins
10 mM citric acid 10 mM α-cyano-4- hydroxycinnamic acid
OnlineVD Liquid junction; PVA coating
[119]
Angiotensins 10 mM α-cyano-4-hydroxycinnamic acid in methanol-water (1:1, v/v)
10 mM α-cyano-4-hydroxycinnamic acid in methanol-water (1:1, v/v)
Low nanomolar Online VD Liquid junction; PVA coating
[120]
Angiotensins, Myoglobin digest
10 mM α-cyano-4-hydroxycinnamic acid in methanol-water (1:1, v/v)
10 mM α-cyano-4-hydroxycinnamic acid in methanol-water (1:1, v/v)
Online VD Liquid junction, CAE
[121]
Proteins in human follicular fluid
1% (w/v) Ampholyte solution pH 3-10 (IEF) 10 mM acetic acid (CE)
α-cyano-4- hydroxycinnamic acid
IEF-digestion-CE MALDI-MS/MS; PolyE-323 coating
[168]
Tryptic digestions of ovalbumin and plasma-derived human anti- thrombin
2.5% ampholyte mixture, 15 mM H3PO4 (analyte) and 20 mM NaOH (catholyte)
10 mg/mL THAP and 10 mg/mL ammonium hydrogen citrate in methanol/ water 5:1 or 2:1 (v/v)
~200 fmole cIEF MALDI-MS PVA coating
[145]
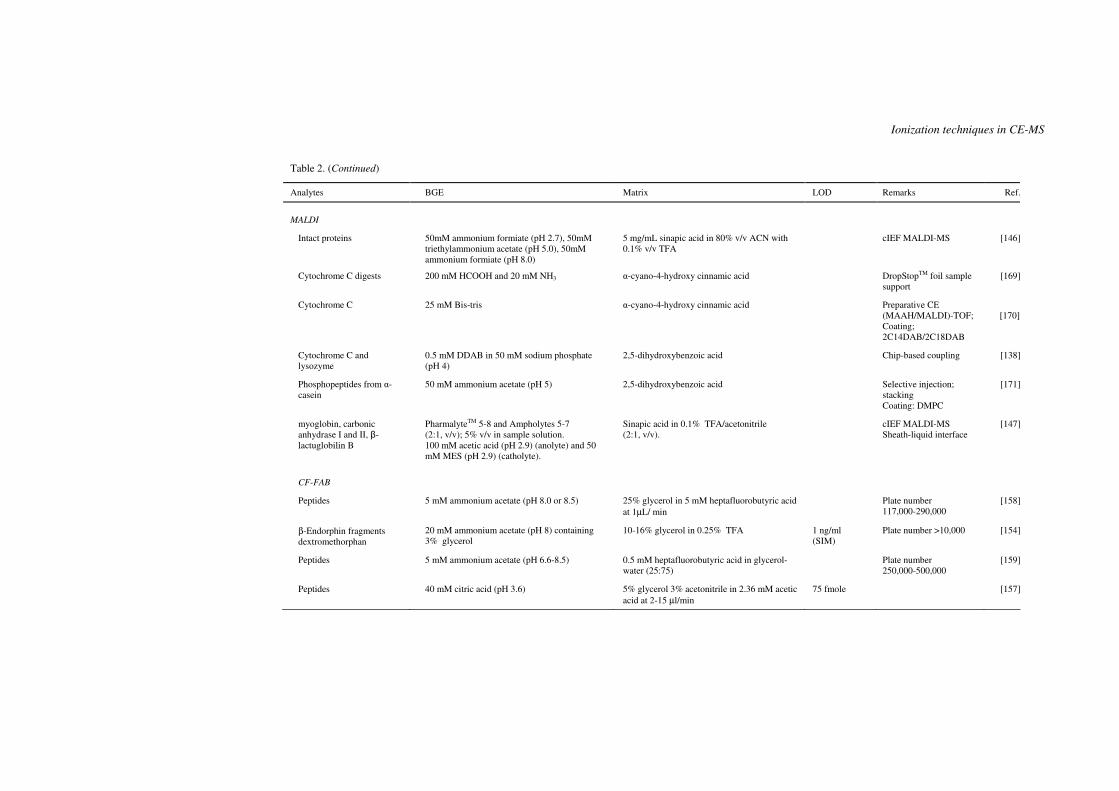
Ionization techniques in CE-MS
47
Table 2. (Continued)
Analytes BGE Matrix LOD Remarks Ref.
MALDI
Intact proteins 50mM ammonium formiate (pH 2.7), 50mM triethylammonium acetate (pH 5.0), 50mM ammonium formiate (pH 8.0)
5 mg/mL sinapic acid in 80% v/v ACN with 0.1% v/v TFA
cIEF MALDI-MS [146]
Cytochrome C digests 200 mM HCOOH and 20 mM NH3
α-cyano-4-hydroxy cinnamic acid
DropStopTM foil sample support
[169]
Cytochrome C 25 mM Bis-tris α-cyano-4-hydroxy cinnamic acid
Preparative CE (MAAH/MALDI)-TOF; Coating; 2C14DAB/2C18DAB
[170]
Cytochrome C and lysozyme
0.5 mM DDAB in 50 mM sodium phosphate (pH 4)
2,5-dihydroxybenzoic acid Chip-based coupling [138]
Phosphopeptides from α-casein
50 mM ammonium acetate (pH 5) 2,5-dihydroxybenzoic acid Selective injection; stacking Coating: DMPC
[171]
myoglobin, carbonic anhydrase I and II, β-lactuglobilin B
PharmalyteTM 5-8 and Ampholytes 5-7 (2:1, v/v); 5% v/v in sample solution. 100 mM acetic acid (pH 2.9) (anolyte) and 50 mM MES (pH 2.9) (catholyte).
Sinapic acid in 0.1% TFA/acetonitrile (2:1, v/v).
cIEF MALDI-MS Sheath-liquid interface
[147]
CF-FAB
Peptides 5 mM ammonium acetate (pH 8.0 or 8.5) 25% glycerol in 5 mM heptafluorobutyric acid at 1µL/ min
Plate number 117,000-290,000
[158]
β-Endorphin fragments dextromethorphan
20 mM ammonium acetate (pH 8) containing 3% glycerol
10-16% glycerol in 0.25% TFA 1 ng/ml (SIM)
Plate number >10,000 [154]
Peptides 5 mM ammonium acetate (pH 6.6-8.5) 0.5 mM heptafluorobutyric acid in glycerol-water (25:75)
Plate number 250,000-500,000
[159]
Peptides 40 mM citric acid (pH 3.6) 5% glycerol 3% acetonitrile in 2.36 mM acetic acid at 2-15 µl/min
75 fmole [157]
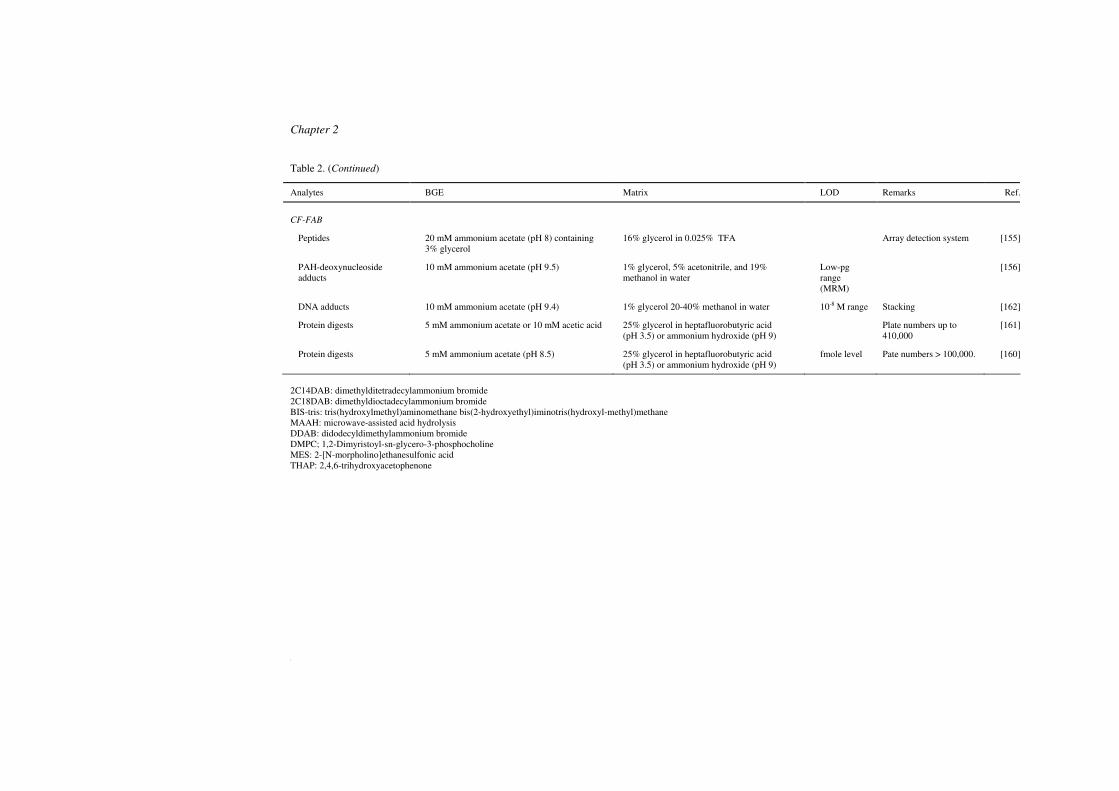
Chapter 2
48
Table 2. (Continued)
Analytes BGE Matrix LOD Remarks Ref.
CF-FAB
Peptides 20 mM ammonium acetate (pH 8) containing 3% glycerol
16% glycerol in 0.025% TFA Array detection system [155]
PAH-deoxynucleoside adducts
10 mM ammonium acetate (pH 9.5) 1% glycerol, 5% acetonitrile, and 19% methanol in water
Low-pg range (MRM)
[156]
DNA adducts 10 mM ammonium acetate (pH 9.4) 1% glycerol 20-40% methanol in water 10-8 M range Stacking [162]
Protein digests 5 mM ammonium acetate or 10 mM acetic acid 25% glycerol in heptafluorobutyric acid (pH 3.5) or ammonium hydroxide (pH 9)
Plate numbers up to 410,000
[161]
Protein digests 5 mM ammonium acetate (pH 8.5) 25% glycerol in heptafluorobutyric acid (pH 3.5) or ammonium hydroxide (pH 9)
fmole level Pate numbers > 100,000. [160]
2C14DAB: dimethylditetradecylammonium bromide 2C18DAB: dimethyldioctadecylammonium bromide BIS-tris: tris(hydroxylmethyl)aminomethane bis(2-hydroxyethyl)iminotris(hydroxyl-methyl)methane MAAH: microwave-assisted acid hydrolysis DDAB: didodecyldimethylammonium bromide DMPC; 1,2-Dimyristoyl-sn-glycero-3-phosphocholine MES: 2-[N-morpholino]ethanesulfonic acid THAP: 2,4,6-trihydroxyacetophenone

Ionization techniques in CE-MS
49
molecules (glycerol) tend to be abundant especially at lower m/z values. Detection limits
reported with CE-CF-FAB systems vary, but are generally in the µM range. In most cases,
detection was achieved in the SIM or multiple reaction monitoring (MRM) mode, in which
cases LODs of 1 ng/mL for dextromethorphan [158] or in the low fmol range for peptides
[161-163] have been obtained (Table 2). Nonvolatile BGEs may cause deleterious effects in
CF-FAB. One of the problems is that nonvolatile cations (Na, K) can strongly compete with
protons in the formation of analyte ions which leads to lower S/Ns [163]. In addition,
nonvolatile constituents may accumulate at the probe tip, or clog the capillary, leading to
unstable conditions [155,162]. Nevertheless, the use of low concentration of nonvolatile
BGEs has been shown to be feasible [155]. Factors that contribute to this compatibility are
the low CE flow rates and a 10-30 fold dilution by the FAB matrix in both the liquid-
junction and sheath-liquid interfaces.
CE-CF-FAB-MS has mainly been employed for target analysis of peptides mixtures
[159,161-163] and protein digests [164,165] in either MS or MS/MS mode (Table 2).
Figure 12. (a) XIE-traces (m/z 373) from the CZE-CF-FAB-MS analysis of a 175 nL stacking injection (b) Full scan FAB mass spectrum of the C8-AAF-dGMP adduct. Reproduced from [162].
Chapter 2
50
Wolf et al. [160] employed CE-CF-FAB-MS for the identification of deoxynucleoside-
polyaromatic hydrocarbon adducts, which may be formed in animals and humans after
exposure to carcinogenic PAHs. Using a polyimide coated capillary and a liquid-junction
interface, constant neutral loss scanning with a triple-quadrupole mass analyzer provided
low-ng detection of unknown adducts. Subsequently, low pictogram detection limits were
obtained in MRM mode. In a follow-up study by the same authors, the detection limits were
improved by roughly three orders of magnitude, which enabled detection in the 10-8 M
range. The technique could then be applied to the analysis of adducts formed in the in vitro
reaction of N-acetoxy-N-acetyl-2-amino fluorene with calf thymus DNA. Figure 12 shows
the separation of two characteristic isomeric adducts formed during the reaction, i.e. C8-
AAF-dGMP and N2-AAF-dGMP, as well as a full-scan spectrum of the former adduct.
5. Conclusions
An overview of soft ionization techniques that have found application in CE-MS is
presented. The area of CE-MS is clearly dominated by ESI and the majority of the
developments since 1987 concerned improvements of CE-ESI-MS interface designs. ESI
has been used with all three main type interfaces, i.e. sheathless, sheath-liquid and liquid
junction interfaces. A similar flexibility in choice of interface is not yet offered by other
ionization techniques for online CE-MS. With ionization techniques that by nature entail
significantly reduced pressures at the capillary outlet, e.g. due to high nebulising gas
pressure or operation at low pressure, a liquid junction interface is often used (SSI, MALDI
or CF-FAB). Gas phase ionization techniques have only been employed with sheath-liquid
interfaces. This is mainly because CE-MS with APPI or APCI is achieved with dedicated
LC sources that require higher flow rates for optimal performance. While it is generally
acknowledged that sheathless interfaces yield better sensitivity in ESI-MS than the ones
that employ a coaxial sheath-flow (Section 3.1), this may not necessarily be true with other
ionization techniques, in particular the ones that show mass-flow sensitivity.
Since CE, in all its modes, is an extremely versatile separation technique, the
applicability of a CE-MS system is strongly determined (and limited) by the specific
ionization technique used. For instance, for macromolecules and thermolabile compounds,
only ESI, CF-FAB and MALDI have been shown to be effective. Each of the presented
techniques can in principle be applied to the analysis of small molecules, although MALDI
has seldom been used for this purpose. The spray ionization techniques, ESI, SSI and TSI,
Ionization techniques in CE-MS
51
show optimal sensitivity when applied to “preformed ions” and yield significantly lower
responses for neutral analytes. For the latter type of compounds, APCI and APPI, in which
analyte ionization is often proton-affinity driven, may be useful alternatives. Nevertheless,
the limited sensitivity that has been obtained with the current APCI and APPI source
designs still prevents their widespread use as full complements to ESI and MALDI.
A main strength of the gas-phase ionization techniques is their excellent compatibility
with nonvolatile BGEs and SDS, which is underlined by the feasibility of directly coupling
MEKC or MEEKC with APPI-MS. In contrast, with non-volatile BGEs or especially SDS,
severe ionization suppression has been observed in ESI-MS with either sheahless or sheath-
liquid interfaces. While it generally perceived that desorption ionization techniques tolerate
modest amount of nonvolatile constituents, the use of phosphate or borate buffer in CE-
MALDI-MS and CE-CF-FAB-MS appeared unfavourable in many cases and has generally
been avoided.
Some of the presented techniques do not seem to be in use anymore (CF-FAB), but
others are frequently employed (MALDI) or mainly in development (APPI). Currently, ESI
and MALDI yield unsurpassed sensitivity compared to alternative techniques. However, the
development of CE-MS through these interfaces has evolved over for many years.
Significant gains in sensitivity are likely to be achievable with alternative techniques,
particularly APCI and APPI.
Acknowledgements
This study was financially supported by AstraZeneca, Global PR&D, External Science
Group (Macclesfield, UK)
References
1 J.A. Olivares, N.T. Nguyen, C.R. Yonker, R.D. Smith, Anal. Chem. 1987, 59, 1230.
2 E.J. Maxwell, D.Y. Chen, Analytica Chimica Acta 2008, 627, 25.
3 D.A. Zamfir, J. Chromatogr. A 2007, 1159, 2.
4 M. Moini, Anal Bioanal Chem 2002, 373, 466.
5 P. Schmitt-Kopplin, M. Frommberger, Electrophoresis 2003, 24, 3837.
6 J. Cai, J. Henion, J. Chromatogr. A 1995, 703, 667.
Chapter 2
52
7 C.W. Klampfl, Electrophoresis 2006, 27, 3.
8 J. Schappler, J.-L. Veuthey, S. Rudaz, In: Capillary electrophoresis methods for
pharmaceutical analysis, S. Ahuja and M.I. Jimidar (Ed.), Elsevier, NL, 2008.
9 C.W. Huck, R. Bakry, L.A. Huber, G.K. Bonn, Electrophoresis 2006, 27, 2063.
10 K.K. Murray, Mass Spectrom. Rev. 1997, 16, 283.
11 F. Foret, J. Preisler, Proteomics 2002, 2, 360.
12 G.K.E. Scriba, J. Chromatogr. A 2007, 1159, 28.
13 W.F. Smyth, V. Rodriguez, J. Chromatogr. A 2007, 1159, 159.
14 D. Fliser, S. Wittke, H. Mischak, Electrophoresis 2005, 26, 2708.
15 R.D. Smith, C.J. Barinaga, H.R. Udseth, Anal. Chem. 1988, 60, 1948.
16 E.D. Lee, W. Mück, J.D. Henion, T.R. Covey, J. Chromatogr. 1988, 458, 313.
17 E.D. Lee, W. Mück, J.D. Henion, T.R. Covey, Biomed. Environ. Mass Spectrom.
1989, 18, 844.
18 S. Nilsson, O. Klett, M. Svedberg, A. Amirkhani, L. Nyholm, Rapid Commun. Mass
Spectrom. 2003, 17, 1535.
19 Y.R. Chen, G.R. Her, Rapid Commun. Mass Spectrom. 2003, 17, 437.
20 Y.Z. Chang, G.R. Her, Anal. Chem. 2000, 72, 626.
21 A. Zamfir, D.G. Seidler, D.G. Schönherr, H. Kresse, J. Peter-Katalinic,
Electrophoresis 2004, 25, 2010.
22 V. Sanz-Nebot, F. Benavente, E. Giménez, J. Barbosa, Electrophoresis 2005,
26, 1457.
23 G.M. Janini, K.C. Chan, T.P. Conrads, H.J. Issaq, T.D. Veenstra, Electrophoresis
2004, 25, 1973.
24 H.J. Issaq, G.M. Janini, K.C. Chan, T.D. Veenstra, J. Chromatogr. A 2004, 1053, 37.
25 H. Stutz, Electrophoresis 2005, 26, 1254.
26 M. Moini, Anal. Chem. 2001, 73, 3497.
27 M.-C. Tseng, Y.-R. Chen, G.-R. Her, Electrophoresis 2004, 25, 2084.
28 Li, F.-A.; Wu, M.-C.; Her, G.-R. Anal. Chem. 2006, 78, 5316.
29 S. Fanali, G. D'Orazio, F. Foret, K. Kleparnik, Z. Aturki, Electrophoresis 2006, 27,
4666.
30 C.C. Liu, J. Zhang, N.J. Dovichi, Rapid Commun Mass Spectrom. 2005, 19, 187.
31 D.C. Gale, R.D. Smith, Rapid Commun Mass Spectrom. 1993, 7, 1017.
32 V. Sanz-Nebot, E. Balaguer, F. Benavente, J. Barbosa, Electrophoresis 2005, 26,
1457.
Ionization techniques in CE-MS
53
33 T. Wachs, R.L. Sheppard, J. Henion, J. Chromatogr. B 1996, 685, 335.
33 P. Kusý, K. Klepárník, Z. Aturki, S. Fanali, F. Foret, Electrophoresis, 2007, 28, 1964.
35 M. Dole, L.L. Mack, R.L. Hines, R.C. Mobley, L.D. Ferguson, M.B. Alice, J. Chem.
Phys. 1968, 49, 2240.
36 M. Dole, R.L. Hines, L.L. Mack, R.C. Mobley, L.D. Ferguson, M.B. Alice,
Macromolecules 1968, 1, 96.
37 M. Yamashita, J.B. Fenn, J. Chem. Phys. 1984, 88, 4451.
38 J.B. Fenn, M. Mann, C.K. Meng, S.F. Wong, C.M. Whitehouse, Science 1989, 246,
64.
39 S. Nguyen, J.B. Fenn, Proc. Natl. Acad. 2007, 104, 1111.
40 J.V. Iribarne, B.A. Thomson, J. Chem. Phys. 1975, 64, 2287.
41 G. Wang, R.B. Cole, Anal. Chim. Acta. 2000, 406, 53.
42 M. Gamero-Castaño, J. Fernandez De La Mora, J. Mass Spectrom. 2000, 35, 790.
43 R.B. Cole, J. Mass Spectrom. 2000, 35, 763.
44 M. Gamero-Castaño, J. Fernandez De La Mora, Anal. Chim. Acta. 2000, 406, 67.
45 C.M. Whitehouse, R.N. Dreyer, M. Yamashita, J.B. Fenn, Anal. Chem. 1985, 57, 675.
46 A.P. Bruins, T.R. Covey, J.D. Henion, Anal. Chem. 1987, 59, 2642.
47 M.G. Ikonomou, A.T. Blades, P. Kebarle, Anal. Chem., 1991, 63, 1989.
48 J. H. C. Eriksson, R. Mol, G.W. Somsen, W.L.J Hinrichs, H.W. Frijlink, G.J. De
Jong, Electrophoresis 2004, 25, 43.
49 A.M. Van Wijk, P.G. Muijselaar, K. Stegman, G.J. De Jong, J. Chromatogr. A 2007,
1159, 175.
50 M.-C. Tseng, Y.-R. Chen, G.-R. Her, Anal. Chem. 2004, 76, 6306.
51 P. Hommerson, A.M. Khan, G.J. De Jong, G.W. Somsen, Electrophoresis 2007, 28,
1444.
52 W.M. Nelson, Q. Tang, A. Kamel Harrata, C.S. Lee, J. Chromatogr. A 1996, 749,
219.
53 P.G. Muijselaar, K. Otsuka, S. Terabe, J. Chromatogr. A 1998, 802, 3.
54 Yang, L.; Kamel Harrata, A.; Lee, C. S. Anal. Chem. 1997, 69, 1820.
55 Ishihama, Y.; Katayama, H.; Asakawa, N. Anal. Biochem. 2000, 287, 45-54.
56 P. Petersson, M. Jörntén-Karlsson, M. Stålebro, Electrophoresis 2003, 24, 999.
57 H. Ozaki, N. Itou, S. Terabe, Y. Takada, M. Sakairi, H. Koizumi, J. Chrom A 1995,
716, 69.
58 G.W. Somsen, R. Mol, G.J. De Jong, J. Chromatogr. A 2003, 1000, 953.
Chapter 2
54
59 R. Mol, E. Kragt, I. Jimidar, G.J. De Jong, G.W. Somsen, J. Chromatogr. B 2006,
843, 283.
60 H.L. Cheng, M.-C. Tseng, P.-L. Tsai, G.R. Her, Rapid Commun. Mass Spectrom.
2001, 15, 1473.
61 P. Hommerson, A.M. Khan, G.J. De Jong, G.W. Somsen, J. Chromatogr. A 2008,
1204, 197.
62 J. Schappler, D. Guillarme, S. Rudaz, J.-L. Veuthey, Electrophoresis 2008, 29, 11.
63 F. Smyth, J. Chromatogr. A 2007, 1159, 159.
64 D. Visky, I. Jimidar, W. Van Ael, D. Redlich, Am. Phar. Rev. 2006, 9, 159.
65 J.J. Coon, P. Zürbig, M. Dakna, A.F. Dominiczak, S. Decramer, D. Fliser, Proteomics
Clin. Appl. 2008, 2, 964.
66 P. Schmitt-Kopplin, M. Engelmann, M. Electrophoresis 2005, 26, 1209.
67 M. Herrero, E. Ibañez, A. Cifuentes, Electrophoresis 2008, 29, 2148.
68 G. Font, M.J. Ruiz, M. Fernández, Y. Picó, Electrophoresis 2008, 29, 2059.
69 M.R.N. Monton, T. Soga, J. Chromatogr. A 2007, 1168, 237.
70 A.-C. Servais, J. Crommen, M. Fillet, Electrophoresis 2006, 27, 2616.
71 E.M. Weissinger, B. Hertenstein, H. Mischak, A. Ganser, Exp. Rev. Proteome 2005,
2, 639.
72 W. Kolch, C. Neusüss, M. Pelzing, H. Mischak, Mass Spectom. Rev. 2005, 24, 959.
73 A. Zamfir, J. Peter-Katalini , Electrophoresis 2004, 25, 1949.
74 C. Campa, A. Coslovi, A. Flamigni, M. Rossi, Electrophoresis 2006, 27, 2027.
75 R. Haselberg, G.J. De Jong, G.W. Somsen, J. Chromatogr. A 2007, 1159, 81.
76 T. Soga, Y. Ohashi, Y. Ueno, H. Naraoka, M. Tomita, T. Nishioka, J. Proteome Res.
2003, 2, 488.
77 E. Balaguer, C. Neusüss, Anal. Chem. 2006, 78, 5384.
78 A. Hirabayashi, M. Sakairi, H. Koizumi, Anal. Chem. 1994, 66, 4557.
79 Z. Takats, S.C. Nanita, R.G. Cooks, G. Schlosser, K. Vekey, Anal. Chem. 2003, 75,
1514.
80 D. Touboul, M.C. Jecklin, R. Zenobi, Chimia 2008, 62, 282.
81 D. Touboul, M.C. Jecklin, R. Zenobi, Rapid Commun. Mass Spectrom. 2008, 22,
1062.
82 E.E. Dodd, J. Appl. Phys. 1953, 24, 73.
83 P. Kebarle, L. Tang, Anal. Chem. 1993, 65, 972A.
Ionization techniques in CE-MS
55
84 K. Deguchi, Y. Takegawa, A. Hirabayashi, H. Nakagawa, S.-I. Nishimura, Rapid
Commun. Mass Spectrom. 2005, 19, 2325.
85 Y. Hirabayashi, A. Hirabayashi, H. Koizumi, Rapid Commun. Mass Spectrom. 1999,
13, 712.
86 C.R. Blakley, J.J. Carmody, M.L. Vestal, J. Am. Chem. Soc. 1980, 102, 5931.
87 K.D.R. Setchell, C.H. Vestal, J. Lipid Res. 1989, 30, 1459.
88 P. Hommerson, A.M. Khan, T. Bristow, W. Niessen, G.J. De Jong, G.W. Somsen,
Anal. Chem. 2007, 79, 5351.
89 P. Hommerson, A.M. Khan, T. Bristow, M.W. Harrison, G.J. De Jong, G.W. Somsen,
Submitted
90 D.B. Robb, M.W. Blades, Anal. Chim. Acta 2008, 627, 34.
91 P. Hommerson, A.M. Khan, G.J. De Jong, G.W. Somsen, J. Am. Soc. Mass Spectrom.
2009, in press.
92 E.C. Horning, M.G. Horning, D.I. Carroll, I. Dzidic, R.N. Stillwell, Anal. Chem.
1973, 45, 936.
93 E.C. Horning, D.I. Carroll, I. Dzidic, K.D. Haegele, M.G. Horning, J. Chrom. Sci.
1974, 12, 725.
94 E.C. Horning, D.I. Carroll, I. Dzidic, K.D. Haegele, M.G. Horning, R.N. Stillwell, J.
Chromatogr. 1974, 99, 13-21.
95 D.I. Carroll, I. Dzidic, R.N. Stillwell, K.D. Haegele, E.C. Horning, Anal. Chem. 1975,
47, 2369.
96 I. Dzidic, D.I. Carroll, R.N. Stillwell, E.C. Horning, Anal. Chem. 1976, 48, 1763.
97 Y. Takada, M. Sakairi, H. Koizumi, Anal. Chem. 1995, 67, 1474.
98 Y. Takada, M. Sakairi, H. Koizumi, Rapid Commun. Mass Spectrom. 1995, 9, 488.
99 Y. Tanaka, K. Otsuka, S. Terabe, J. Pharm. Biomed. Anal. 2003, 30, 1889.
100 P.G. Muijselaar, K. Otsuka, S. Terabe, J. Chromatogr. A 1998, 802, 3.
101 K. Isoo, K. Otsuka, S. Terabe, Electrophoresis 2001, 22, 3426.
102 D.B. Robb, T.R. Covey, A.P. Bruins, Anal. Chem. 2000, 72, 3653.
103 J.A. Syage, J. Am. Soc. Mass Spectrom. 2004, 15, 1521.
104 S.L. Nilsson, C. Andersson, P.J.R. Sjöberg, D. Bylund, P. Petersson, M. Jörntén-
Karlsson, K.E. Markides, Rapid Commun. Mass Spectrom. 2003, 17, 2267.
105 R. Mol, G.J. De Jong, G.W. Somsen, Electrophoresis 2005, 26, 146.
106 J. Schappler, D. Guillarme, J. Prat, J.-L. Veuthey, S. Rudaz, Electrophoresis 2007, 28,
3078.
Chapter 2
56
107 M. Himmelsbach, M. Haunschmidt, W. Buchberger, C.W. Klampfl, Anal. Chem.
2007, 79, 1564.
108 R. Mol, G.J. De Jong, G.W. Somsen, Anal. Chem. 2005, 77, 5277.
109 M. Himmelsbach, M. Haunschmidt, W. Buchberger, C.W. Klampfl, J. Chromatogr.
A. 2007, 1159, 58.
110 K.L. Busch, J. Mass Spectrom. 1995, 30, 233.
111 M. Karas, D. Bachmann, F. Hillenkamp, Anal. Chem. 1985, 57, 2935.
112 A. Overberg, M. Karas, U. Bahr, R. Kaufmann, F. Hillenkamp, Rapid Commun. Mass
Spectrom. 1990, 4, 293.
113 A. Overberg, M. Karas, F. Hillenkamp, Rapid Commun. Mass Spectrom. 1991, 5,
128.
114 H. Ehring, M. Karas, F. Hillenkamp, Org. Mass Spectrom. 1992, 27, 427.
115 M. Karas, M. Glückmann, J. Schäfer, J. Mass Spectrom. 2000, 35, 1.
116 R. Krüger, A. Pfenninger, I. Fournier, M. Glückmann, M. Karas, Anal. Chem. 2001,
73, 5812.
117 M. Karas, R. Krüger, Chem. Rev. 2003, 103, 427.
118 W.C. Chang, L.C.L. Huang, Y.-S. Wang, W.-P. Peng, H.C. Chang, N.Y. Hsu, W.B.
Yang, C.H. Chen, Anal. Chim. Acta 2006, 582, 1.
119 J. Preisler, F. Foret, B.L. Karger, Anal. Chem. 1998, 70, 5278.
120 J. Preisler, P. Hu, T. Rejtar, B.L. Karger, Anal. Chem. 2000, 72, 4785.
121 J. Preisler, P. Hu, T. Rejtar, E. Moskovets, B.L. Karger, Anal. Chem. 2002, 74, 17.
122 H.K. Musyimi, D.A. Narcisse, X. Zhang, W. Stryjewski, S.A. Soper, K.K. Murray,
Anal. Chem. 2004, 76, 5968.
123 H. Ørsnes, T.Graf, S. Bohatka, H. Degn, Rapid Commun. Mass Spectrom. 1998, 12,
1.
124 H. Ørsnes, T. Graf, H. Degn, K.K. Murray, Anal. Chem. 2000, 72, 251.
125 H. Ørsnes, R. Zenobi, Chem. Soc. Rev. 2001, 30, 104.
126 R.W. Chiu, K.L. Walker, J.J. Hagen, C.A. Monnig, C.L. Wilkins, Anal. Chem. 1995,
67, 4190.
127 P.A. Van Veelen, U.R. Tjaden, J. Van Der Greef, A. Ingendoh, F. Hillenkamp, J.
Chrom. 1993, 647, 367.
128 T. Johnson, J. Bergquist, R. Ekman, E. Nordhoff, M. Schrenberg, K.-D. Klöppel, M.
Müller, H. Lehrach, J. Gobom, Anal. Chem. 2001, 73, 1670.
129 T. Keough, R. Takigiku, M.P. Lacey, M. Purdon, M. Anal. Chem. 1992, 64, 1594.
Ionization techniques in CE-MS
57
130 G.S. McLeod, J. Axelsson, R. Self, P.J. Derrick, Rapid Commun. Mass Spectrom.
1997, 11, 214.
131 J. Wang, M. Ma, R. Chen, L. Li, Anal. Chem. 2008, 80, 6168.
132 H. Zhang, R.M. Caprioli, J. Mass Spectrom. 1996, 31, 1039.
133 J.S. Page, S.S. Rubakhin, J. V. Sweedler, Analyst 2000, 125, 555.
134 N. Ojima, T. Shingaki, T. Yamamoto, T. Masujima, Electrophoresis 2001, 22, 3478.
135 A. Zuberovic, S. Ullsten, U. Hellman, K.E. Markides, J. Bergquist, Rapid Commun.
Mass Spectrom. 2004, 18, 2946.
136 T. Rejtar, P. Hu, P. Juhasz, J.M. Campbell, M.L. Vestal, J. Preisler, B.L. Karger, J.
Proteome Res. 2002, 1, 171.
137 A.I. Gusev, Fresenius J. Anal. Chem. 2000, 366, 691.
138 J. Liu, K. Tseng, B. Garcia, C.B. Lebrilla, E. Mukerjee, S. Collins, R. Smith, Anal.
Chem. 2001, 73, 2147.
139 J. Jacksén, T. Frisk, T. Redeby, V. Parmar, W. Van der Wijngaart, G. Stemme, Å.
Emmer, Electrophoresis 2007, 28, 2458.
140 A.-C. Bergman, T. Bergman, Febs Letters 1996, 397, 45.
141 E. J. Zaluzec, D.A. Gage, J.T. Watson, Prot. Expr. Pur. 1995, 6, 109.
142 M. Albin, S.-M. Chen, A. Louie, C. Pairaud, J. Colburn, J. Wiktorowicz, Anal.
Biochem. 1992, 206, 382.
143 H.J. Boss, M.F. Rohde, R.S. Rush, Anal. Biochem. 1995, 230, 123.
144 K.L. Walker, R.W. Chiu, C.A. Monnig, C.L. Wilkins, Anal. Chem. 1995, 67, 4197.
145 M. Lechner, A. Seifner, A.M. Rizzi, Electrophoresis, 2008, 29, 1974.
146 L.H.H. Silvertand, J.S. Sastre-Toraño, G.J. de Jong, W.P. van Bennekom,
Electrophoresis 2008, 29, 1985.
147 A. Chartogne, M. Gaspari, S. Jespersen, B. Buscher, E. Verheij, R. van der Heijden,
U. Tjaden, J. van der Greef, Rapid Commun. Mass Spectrom. 2002, 16, 201.
148 G. Choudhary, J. Chakel, W. Hancock, A. Torres-Duarte, G. McMahon, I. Wainer,
Anal. Chem. 1999, 71, 855.
149 A. Zuberovic, M. Wetterhall, J. Hanrieder, J. Bergquist, Electrophoresis 2009, in
press.
150 M. Barber, R.S. Bordoli, R.D. Sedgwick, A.N. Tyler, Nature 1981, 293, 270.
151 J. Sunner, A. Morales, P. Kebarle, Anal. Chem. 1987, 59, 1378.
152 J. Sunner, A. Morales, P. Kebarle, Anal. Chem. 1988, 60, 98-104.
153 R.G. Cooks, K.L. Busch, Int. J. Mass Spectrom. lon Phys. 1983, 53, 111.
Chapter 2
58
154 G. Székely, J. Allison, J. Am. Soc. Mass Spectrom. 1997, 8, 337.
155 R.M. Caprioli, T. Fan, J.S. Cottrell, Anal. Chem. 1986, 58, 2949.
156 J.S.M. De Wit, L.J. Deterding, M.A. Moseley, K.B. Tomer, Rapid Commun. Mass
Spectrom. 1988, 2, 100.
157 R.D. Minard, D. Chin-Fatt, P. Curry, A.G. Ewing, Proceedings of the 36th
ASMS
Conference on Mass Spectrometry and Allied Topics, San Francisco, CA, June 5-10,
1988; pp. 950.
158 N.J. Reinhoud, W.M.A. Niessen, U.R. Tjaden, L.G. Gramberg, E.R. Verheij, J. Van
der Greef, Rapid Commun. Mass Spectrom. 1989, 3, 348.
159 N.J. Reinhoud, E. Schröder, U.R. Tjaden, W.M.A. Niessen, M.C. Ten Noever de
Brauw, J. Van der Greef, J. Chromatogr. 1990, 516, 147.
160 S.M. Wolf, P. Vouros, C. Norwood, E. Jackim, J. Am. Soc. Mass Spectrom. 1992, 3,
757.
161 R.M. Caprioli, W.T. Moore, M. Martin, B.B. Dague, K. Wilson, S. Moring, J.
Chromatogr. 1989, 480, 247.
162 M.A. Moseley, L.J. Deterding, K.B. Tomer, Rapid Commun. Mass Spectrom. 1989, 3,
87.
163 M.A. Moseley, L.J. Deterding, K.B. Tomer, J. Chromatogr. 1989, 480, 197.
164 M.A. Moseley, L.J. Deterding, K.B. Tomer, J.W. Jorgenson, J. Chromatogr. 1990,
516, 167.
165 M.A. Moseley, L.J. Deterding, K.B. Tomer, J.W. Jorgenson, Anal. Chem. 1991, 63,
109.
166 S.M. Wolf, P. Vouros, Anal. Chem., 1995, 67, 891.
167 S. Amon, A. Plematl, A. Rizzi, Electrophoresis 2006, 27, 1209.
168 J. Hanrieder, A. Zuberovic, J. Bergquist, J. Chromatogr. A 2009, 1216, 3621.
169 J. Rechthaler, A. Rizzi, G. Allmaier, Int. J. Mass Spectrom. 2007, 268, 131.
170 M.M. Yassine, N. Guo, H. Zhong, L. Li, C.A. Lucy, Anal. Chim. Acta 2007, 597, 41.
171 H. Zhang, G.K. Hunter, H.A. Goldberg, G.A. Lajoie, K.K.-C. Yeung, Anal. Chim
Acta, 2007, 581, 268.

59

60

61
Chapter 3
Comparison of atmospheric pressure
photoionization and electrospray ionization
for capillary zone electrophoresis–
mass spectrometry of drugs
P. Hommerson, A.M. Khan, G.J. de Jong, G.W. Somsen,
Electrophoresis 2006, 28, 1444-1453.
Chapter 3
62
Summary
The performance of atmospheric pressure photoionization (APPI) and electrospray
ionization (ESI) for capillary zone electrophoresis (CZE) was compared using a set of
seven drugs (basic amines, quaternary amines and steroids) and four different background
electrolytes (BGEs). The influence of volatile and nonvolatile BGEs of acidic and neutral
pH on the MS responses of test compounds was evaluated by infusion of test solutions into
the respective ion sources, and by actual CZE–MS experiments. The infusion experiments
indicate that sodium phosphate buffers cause ionization suppression in ESI-MS, although
for the amines the suppression was modest (25-60% signal reduction). By contrast, APPI-
MS responses were not affected by nonvolatile BGEs. With phosphate buffers, ESI-MS
responses for the basic amines were still a factor 3-13 higher than the APPI-MS signals,
whereas the steroids yielded similar responses in ESI-MS and APPI-MS. The quaternary
amines could readily be detected in ESI-MS, but detection in APPI-MS required specific
interface conditions. Using typical CZE–APPI-MS settings, quaternary amines remained
undetected. Remarkably, the signal-to-noise ratios (S/Ns) observed in CZE–ESI-MS for the
test compounds, were generally similar when using volatile and nonvolatile BGEs. For
basic compounds, the S/Ns obtained in CZE–ESI-MS were a factor 2-5 higher than in
CZE–APPI-MS, whereas steroids yielded equal S/Ns in both methods. Overall, it is
concluded that when using relatively low BGE concentrations, the sensitivity of ESI-MS
detection in CZE is more favorable than APPI-MS detection, even when nonvolatile BGEs
are employed.

Comparison of APPI and ESI for CZE-MS
63
1. Introduction
Since its introduction in 1987 [1], capillary zone electrophoresis–mass spectrometry (CZE–
MS) has emerged as a powerful analytical tool that is well suited to the analysis of
pharmaceutical samples. CZE–MS combines efficient and fast separation with mass-
selective detection. Furthermore, the separation principle of CZE is fundamentally different
from reversed-phase liquid chromatography (LC), and CZE–MS can therefore be
considered as orthogonal to LC–MS. So far, the coupling of CZE with MS has
predominantly been performed through electrospray ionization (ESI)-based interfaces [2,
3]. This can be explained by the fact that both CZE and ESI usually deal with analytes that
are (or can be) ionized in solution. Numerous successful applications of CZE–ESI-MS have
been reported, including stability studies [4] and impurity profiling of drugs [5, 6], and the
analysis of drugs in biological samples [7]. Nevertheless, the use of ESI for CZE–MS has
an inherent drawback. Since ESI of analytes is negatively affected by other ionic species,
such as (nonvolatile) buffer salts, the choice of background electrolyte (BGE) in CZE–ESI-
MS is restricted. Conventional BGEs, like phosphate and borate buffers, are known to
cause ionisation suppression, and lead to reduced, or even complete loss of analyte signals
[8]. Therefore, CZE–ESI-MS has commonly been employed using volatile BGEs such as
formic acid or ammonium acetate, which may result in compromised efficiency and
resolution. In addition, transfer of optimized phosphate- or borate-based CZE–UV methods
to MS detection can be time-consuming or unsuccessful.
Recently, atmospheric pressure photoionization (APPI) has been introduced as a novel
interface for LC–MS [9]. In the APPI source, the sample is firstly vaporized after which
ionization of analytes is initiated by VUV light (123.9 nm) emitted by a krypton discharge
lamp. Two approaches towards APPI-MS detection have been described: direct APPI
[10,11] and dopant-assisted APPI (DA-APPI) [9,12]. In principle, analytes having
ionization energies (IE) below the energy of the 10-eV photons can be ionized directly.
Ionization efficiencies of both polar and apolar compounds can often be enhanced by the
addition of a so-called dopant (e.g. toluene or acetone), which is a substance that is easily
photoionized and serves as intermediate for ionization of compounds of interest. The
dopant radical cation may transfer its energy to the analyte by either charge-exchange or
proton-transfer reactions [13]. Meanwhile, APPI sources have become commercially
available, the main sources being the PhotoMate, developed by Syage et al. [14] and the
PhotoSpray, developed by Robb et al. [9]. The former source often shows a good
Chapter 3
64
performance in direct APPI, whereas the latter requires the use of dopants.
APPI sources were originally developed to broaden the range of compounds that can be
analyzed by LC–MS towards less polar compounds. These species often cannot be ionized
by ESI or atmospheric pressure chemical ionization (APCI). During the latter years, LC–
APPI-MS of a wide range of compounds, including steroids [15], antibiotics [16],
flavonoids [17] and other pharmaceutical compounds [18, 19] has been reported. The
feasibility of APPI for CZE–MS was indicated by Nilsson [20], and studied in more detail
in our laboratory [21]. The on-line coupling of CZE with APPI-MS was achieved by
adapting a sheath-flow interface for CZE–ESI-MS to fit on an LC–MS PhotoMate source of
Agilent Technologies. It was shown that the APPI process was less susceptible to
nonvolatile buffer constituents than ESI, which opened up the possibility to use optimal
CZE buffers without serious ionization suppression effects. Subsequently, even the on-line
coupling of micellar electrokinetic chromatography (MEKC), in which nonvolatile
surfactants were used, with APPI-MS was shown to be feasible [22].
Despite these attractive features of APPI, it is still uncertain how its performance
compares to that of ESI. So far, quantitative data are available from LC–MS studies only.
For polar compounds, most LC–MS studies indicate that APPI is somewhat less sensitive
than ESI [19, 23]. Cai et al. [18], on the other hand, found that APPI generally showed
better sensitivity than ESI for polar drugs. Since LC–MS is substantially different from
CZE–MS in several aspects, including interface design and flow rates employed, results
obtained with LC cannot be extrapolated directly to CZE. Moreover, in the aforementioned
LC–MS studies only mobile phases with volatile buffers were used.
The aim of the present study was to draw a quantitative comparison between the
performance of a CZE–ESI-MS and a CZE–APPI-MS system, with emphasis on analyte
characteristics and BGE effects. As analyte responses in CZE–MS are dependent on both
intrinsic ionization efficiency and CZE behavior, the responses of test compounds were
investigated in two ways. Firstly, the influence of volatile and nonvolatile BGEs on the MS
responses of various pharmaceutical compounds was measured by infusion of test
solutions. Secondly, signal-to-noise ratios (S/Ns) of the test compounds were determined
under actual CZE–MS conditions using the respective BGEs. An overview of analyte
responses, S/Ns and acquired electropherograms is presented and discussed.
Comparison of APPI and ESI for CZE-MS
65
2. Materials and methods
2.1. Chemicals and materials
Phosphoric acid, sodium dihydrogen phosphate, disodium hydrogen phosphate and sodium
hydroxide were supplied by Merck (Darmstadt, Germany). Acetic acid, formic acid, toluene
and terbutaline were purchased from Sigma-Aldrich (Zwijndrecht, The Netherlands).
Acetone was purchased from Fluka (Zwijndrecht, The Netherlands). Methanol and
acetonitrile were from Biosolve (Valkenswaard, The Netherlands). Fluvoxamine and
mebeverine were obtained from Solvay Pharmaceuticals (Weesp, The Netherlands).
Carbachol, methylatropine, ephedrine, hydrocortisone and prednisone were obtained from
Fagron (Nieuwerkerk a/d IJssel, The Netherlands). Deionized water was filtered and
degassed before use. Fused-silica capillaries were from BGB Analytik (Boekten,
Switzerland). For the ESI-MS infusion experiments, 5-µM solutions of test compounds
were prepared in 50 mM ammonium acetate (pH 6.8), 50 mM acetic acid (pH 3.0), 10 mM
sodium phosphate (pH 7.0) and 10 mM sodium phosphate (pH 3.0), respectively. The
sodium phosphate buffers of pH 3.0 and 7.0 were prepared by adjusting a 10 mM solution
of sodium dihydrogen phosphate with a solution of 10 mM phosphoric acid or 10 mM
disodium hydrogen phosphate, respectively. For the APPI-MS infusion experiments, test
solutions were prepared at concentrations of 250 µM. For CZE–MS experiments, a test
mixture of methylatropine and mebeverine (20 µM each), fluvoxamine (80 µM), carbachol,
ephedrine, terbutaline and hydrocortisone (160 µM each) was prepared in water. The
composition of the sheath liquid was acetonitrile-water-formic acid (75:25:0.1, v/v/v) in
ESI-MS and methanol-water-toluene-formic acid (75:25:5:0.1, v/v/v/v) in APPI-MS, unless
stated otherwise.
2.2. CE system
CZE was performed using a PrinCE CE system (Prince Technologies, Emmen, The
Netherlands) with a fused silica capillary of 50 µm ID and a length of 90 cm. The
capillaries were flushed at 1500 mbar with 1 M sodium hydroxide (10 min) and water (10
min) prior to use. Injection of sample was carried out at a pressure of 35 mbar for 6 s.
During injection, the nebulizer gas flow of the CE–MS sprayer was switched off. A
separation voltage of 30 kV was applied for all CZE analyses. To minimize negative effects
(e.g., peak broadening and loss of resolution) due to the hydrodynamic flow caused by the
nebulizer gas, a reduced pressure of approximately -60 or -90 mbar was applied at the inlet
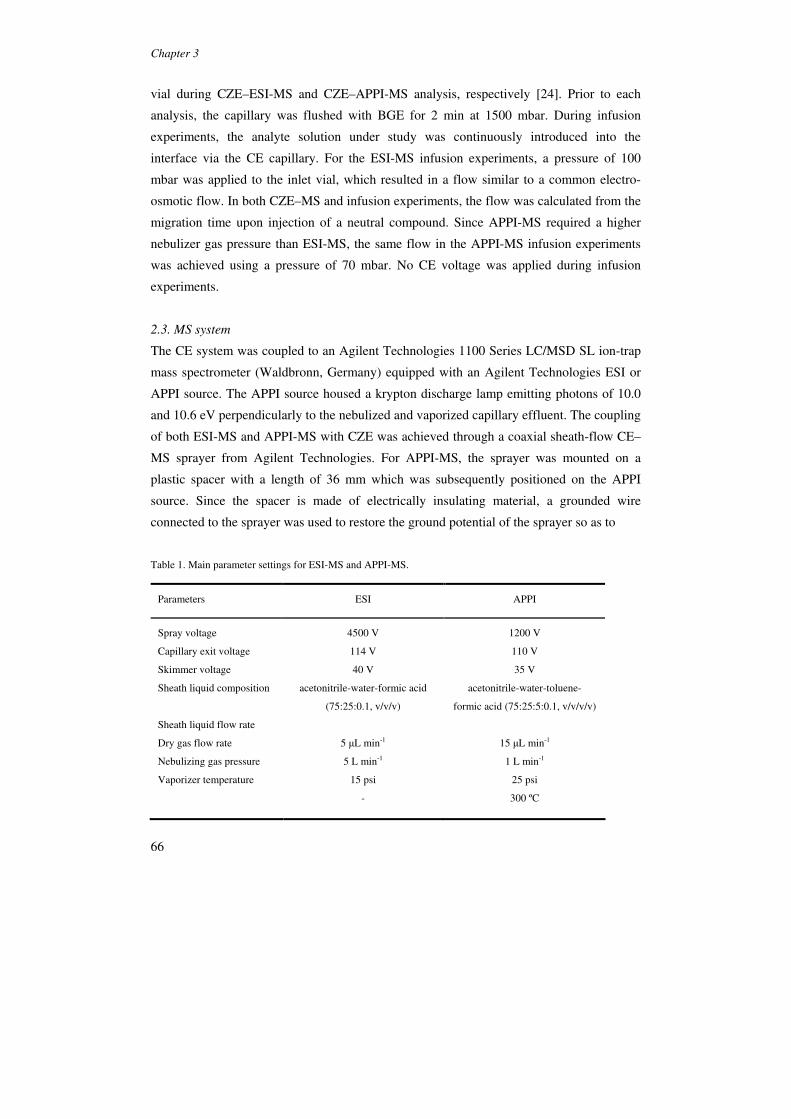
Chapter 3
66
vial during CZE–ESI-MS and CZE–APPI-MS analysis, respectively [24]. Prior to each
analysis, the capillary was flushed with BGE for 2 min at 1500 mbar. During infusion
experiments, the analyte solution under study was continuously introduced into the
interface via the CE capillary. For the ESI-MS infusion experiments, a pressure of 100
mbar was applied to the inlet vial, which resulted in a flow similar to a common electro-
osmotic flow. In both CZE–MS and infusion experiments, the flow was calculated from the
migration time upon injection of a neutral compound. Since APPI-MS required a higher
nebulizer gas pressure than ESI-MS, the same flow in the APPI-MS infusion experiments
was achieved using a pressure of 70 mbar. No CE voltage was applied during infusion
experiments.
2.3. MS system
The CE system was coupled to an Agilent Technologies 1100 Series LC/MSD SL ion-trap
mass spectrometer (Waldbronn, Germany) equipped with an Agilent Technologies ESI or
APPI source. The APPI source housed a krypton discharge lamp emitting photons of 10.0
and 10.6 eV perpendicularly to the nebulized and vaporized capillary effluent. The coupling
of both ESI-MS and APPI-MS with CZE was achieved through a coaxial sheath-flow CE–
MS sprayer from Agilent Technologies. For APPI-MS, the sprayer was mounted on a
plastic spacer with a length of 36 mm which was subsequently positioned on the APPI
source. Since the spacer is made of electrically insulating material, a grounded wire
connected to the sprayer was used to restore the ground potential of the sprayer so as to
Table 1. Main parameter settings for ESI-MS and APPI-MS.
Parameters ESI APPI
Spray voltage
Capillary exit voltage
Skimmer voltage
Sheath liquid composition
Sheath liquid flow rate
Dry gas flow rate
Nebulizing gas pressure
Vaporizer temperature
4500 V
114 V
40 V
acetonitrile-water-formic acid
(75:25:0.1, v/v/v)
5 µL min-1
5 L min-1
15 psi
-
1200 V
110 V
35 V
acetonitrile-water-toluene-
formic acid (75:25:5:0.1, v/v/v/v)
15 µL min-1
1 L min-1
25 psi
300 ºC
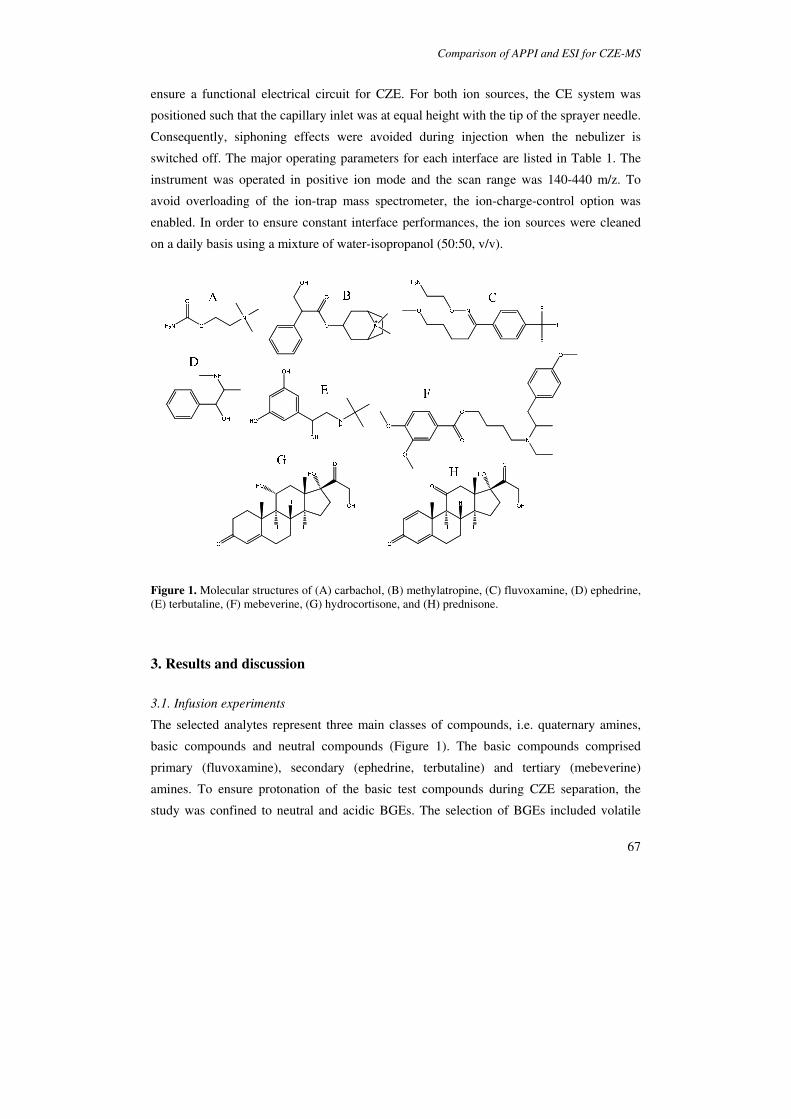
Comparison of APPI and ESI for CZE-MS
67
ensure a functional electrical circuit for CZE. For both ion sources, the CE system was
positioned such that the capillary inlet was at equal height with the tip of the sprayer needle.
Consequently, siphoning effects were avoided during injection when the nebulizer is
switched off. The major operating parameters for each interface are listed in Table 1. The
instrument was operated in positive ion mode and the scan range was 140-440 m/z. To
avoid overloading of the ion-trap mass spectrometer, the ion-charge-control option was
enabled. In order to ensure constant interface performances, the ion sources were cleaned
on a daily basis using a mixture of water-isopropanol (50:50, v/v).
Figure 1. Molecular structures of (A) carbachol, (B) methylatropine, (C) fluvoxamine, (D) ephedrine, (E) terbutaline, (F) mebeverine, (G) hydrocortisone, and (H) prednisone.
3. Results and discussion
3.1. Infusion experiments
The selected analytes represent three main classes of compounds, i.e. quaternary amines,
basic compounds and neutral compounds (Figure 1). The basic compounds comprised
primary (fluvoxamine), secondary (ephedrine, terbutaline) and tertiary (mebeverine)
amines. To ensure protonation of the basic test compounds during CZE separation, the
study was confined to neutral and acidic BGEs. The selection of BGEs included volatile

Chapter 3
68
and nonvolatile BGEs of mid pH (50 mM ammonium acetate (pH 6.8) and 10 mM sodium
phosphate buffer (pH 7.0)) and of low pH (50 mM acetic acid (pH 3.0) and 10 mM sodium
phosphate (pH 3.0)).
In the first stage of the study, the effects of BGE and analyte characteristics on the
ESI/APPI sensitivity in CZE were investigated by infusion experiments. The analyte
solutions in each respective buffer were infused through the CE capillary into the ion
source. No separation voltage was applied during the infusion experiments, as it would
have led to different flow rates and mobilities among the test compounds, thereby hindering
proper comparison. Before carrying out the BGE study, first the appropriate interfacing
conditions were selected.
3.1.1. ESI and APPI conditions
With ESI, a sheath liquid composition of acetonitrile-water-formic acid (75:25:0.1, v/v/v)
delivered at a flow rate of 5 µL min-1 was selected in combination with a nebulizer gas
pressure of 15 psi. In earlier experiments in our laboratory, these conditions were found to
be suitable for CZE–MS yielding a stable electrospray. MS parameter settings were
optimized for each test compound separately using the tuning software of the MS
instrument. Compared with volatile BGEs, the infusion of phosphate buffers resulted in
elevated total ion currents (TICs), which mainly resulted from sodium phosphate clusters.
By contrast, the TIC obtained with volatile BGEs did not significantly differ from the
background signal that was obtained when only sheath liquid was fed into the sprayer.
Interfacing conditions for APPI-MS as used in a previous paper [21] were taken as a
starting point for this study. Some additional experiments were carried out in order to select
a sheath liquid composition suitable for a broad range of compounds. Initial investigations
were carried out using sheath liquids of acetonitrile-methanol (75:25, v/v) and methanol-
water (75:25, v/v) containing 5 vol% acetone or toluene as dopant. However, with these
sheath liquids, analyte signals during infusion were not constant. The stability of the signals
could be improved by adding formic acid to the sheath liquid. Although the nonaqueous
sheath liquids, i.e. acetonitrile-methanol-formic acid (75:25:0.1, v/v/v) containing acetone
or toluene, yielded highest responses during infusion experiments, sudden current drops
were sometimes observed when these sheath liquids were used in CZE–MS. The sheath
liquids of methanol-water-formic acid (75:25:0.1, v/v/v) with dopant yielded more stable
currents, and were therefore selected for the ensuing experiments.
Figure 2 shows the APPI-MS signal intensities of the test compounds obtained using the
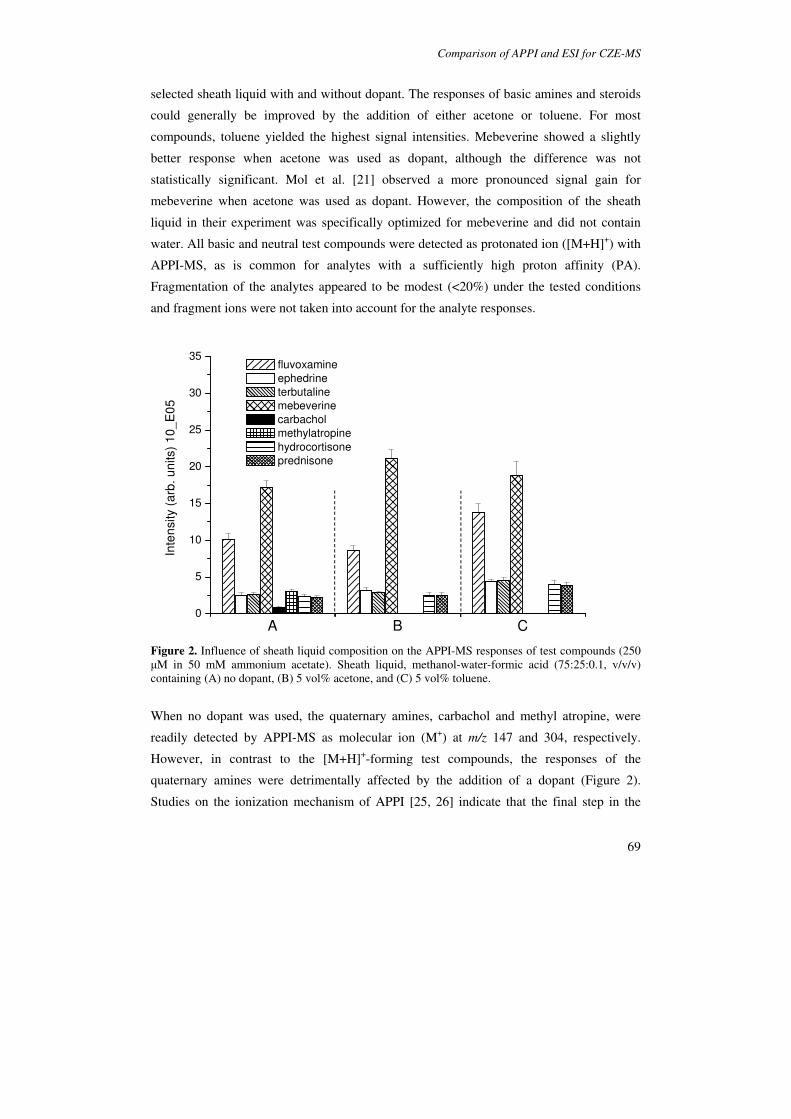
Comparison of APPI and ESI for CZE-MS
69
selected sheath liquid with and without dopant. The responses of basic amines and steroids
could generally be improved by the addition of either acetone or toluene. For most
compounds, toluene yielded the highest signal intensities. Mebeverine showed a slightly
better response when acetone was used as dopant, although the difference was not
statistically significant. Mol et al. [21] observed a more pronounced signal gain for
mebeverine when acetone was used as dopant. However, the composition of the sheath
liquid in their experiment was specifically optimized for mebeverine and did not contain
water. All basic and neutral test compounds were detected as protonated ion ([M+H]+) with
APPI-MS, as is common for analytes with a sufficiently high proton affinity (PA).
Fragmentation of the analytes appeared to be modest (<20%) under the tested conditions
and fragment ions were not taken into account for the analyte responses.
A B C0
5
10
15
20
25
30
35
fluvoxamine
ephedrine
terbutaline
mebeverine
carbachol
methylatropine
hydrocortisone
prednisone
Inte
nsity (
arb
. u
nits)
10
_E
05
Figure 2. Influence of sheath liquid composition on the APPI-MS responses of test compounds (250 µM in 50 mM ammonium acetate). Sheath liquid, methanol-water-formic acid (75:25:0.1, v/v/v) containing (A) no dopant, (B) 5 vol% acetone, and (C) 5 vol% toluene.
When no dopant was used, the quaternary amines, carbachol and methyl atropine, were
readily detected by APPI-MS as molecular ion (M+) at m/z 147 and 304, respectively.
However, in contrast to the [M+H]+-forming test compounds, the responses of the
quaternary amines were detrimentally affected by the addition of a dopant (Figure 2).
Studies on the ionization mechanism of APPI [25, 26] indicate that the final step in the
Chapter 3
70
ionization process is either charge transfer to form M+• or proton transfer to form [M+H]+.
None of these processes can be involved in the ionization of the quaternary amines, so the
observed M+ signals cannot be attributed to APPI. Consequently, a side mechanism must
exist that brings about ionization of these compounds, and which is apparently suppressed
or opposed by dopant. This conclusion is supported by the fact that when excitation of
dopant was avoided by turning off the VUV light source, the signals for quaternary amines
were almost fully restored. In contrast, the MS signals for the basic amines and steroids
fully diminished when the light source was switched off, indicating a true photon-induced
ionization mechanism. Interestingly, after reoptimizing the MS capillary voltage with the
light source switched off, it appeared that the basic amines could nevertheless be detected
when a relatively low voltage (approximately 700 V) was selected. Under these conditions
the steroids remained undetected. Thus, using our APPI set-up, the ionization of the
steroids could only be achieved by light excitation, whereas compounds that can form
preformed ions in solution could in principle also be ionized through a photon-independent
mechanism. We are currently studying this interesting side-mechanism of APPI in more
detail, and will report on this in a separate paper. In the present study, we focused on true
photoionization effects, and therefore, in further experiments a toluene-containing sheath
liquid was used in combination with a spray voltage of 1200 V. Consequently, quaternary
amines could not be detected in the subsequent DA-APPI experiments.
3.1.2. ESI-MS and APPI-MS detection
The effect of the various BGEs on the ESI-MS signal of the test compounds as studied by
infusion, is shown in Figure 3. Irrespective of the type of BGE, the quaternary amines were
detected as molecular ion (M+) and the basic amines as protonated molecule ([M+H]+).
Furthermore, no significant fragmentation or adduct formation was observed for these
compounds during ESI. The steroids were detected as protonated molecule in the presence
of a volatile BGE, but yielded primarily sodium adducts ([M+Na]+) when sodium
phosphate buffers were used. With the phosphate buffer of pH 7.0, the signal of the sodium
adducts of the steroids was approximately 4 times higher than the signal resulting from
[M+H]+. With the phosphate buffer (pH 3.0), the intensities of the steroid [M+H]+ and
[M+Na]+ signals were almost similar. This difference in relative signal intensities may be
explained by the higher sodium concentration of the mid-pH phosphate buffer. In Figure 3,
only the signal of the most abundant ion is depicted for every compound. Although the
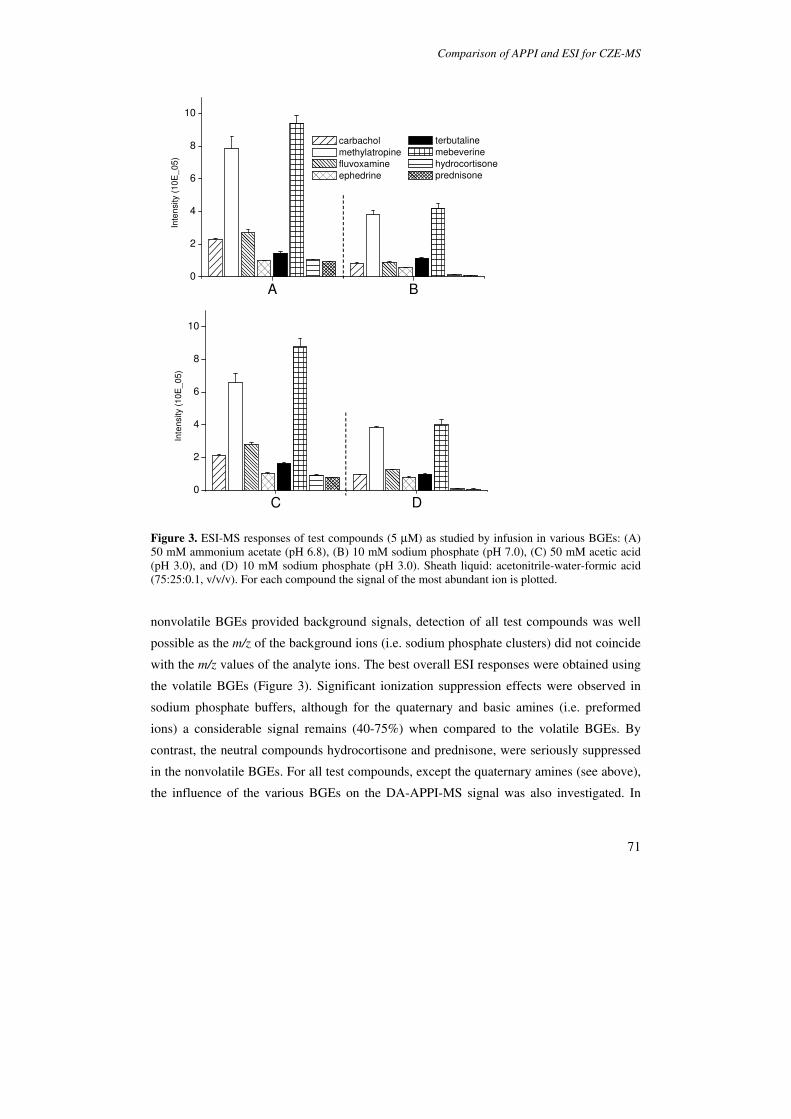
Comparison of APPI and ESI for CZE-MS
71
A B0
2
4
6
8
10
terbutaline
mebeverine
hydrocortisone
prednisone
carbachol
methylatropine
fluvoxamine
ephedrineIn
ten
sity
(10E
_0
5)
C D0
2
4
6
8
10
Inte
nsity
(10
E_
05
)
Figure 3. ESI-MS responses of test compounds (5 µM) as studied by infusion in various BGEs: (A) 50 mM ammonium acetate (pH 6.8), (B) 10 mM sodium phosphate (pH 7.0), (C) 50 mM acetic acid (pH 3.0), and (D) 10 mM sodium phosphate (pH 3.0). Sheath liquid: acetonitrile-water-formic acid (75:25:0.1, v/v/v). For each compound the signal of the most abundant ion is plotted.
nonvolatile BGEs provided background signals, detection of all test compounds was well
possible as the m/z of the background ions (i.e. sodium phosphate clusters) did not coincide
with the m/z values of the analyte ions. The best overall ESI responses were obtained using
the volatile BGEs (Figure 3). Significant ionization suppression effects were observed in
sodium phosphate buffers, although for the quaternary and basic amines (i.e. preformed
ions) a considerable signal remains (40-75%) when compared to the volatile BGEs. By
contrast, the neutral compounds hydrocortisone and prednisone, were seriously suppressed
in the nonvolatile BGEs. For all test compounds, except the quaternary amines (see above),
the influence of the various BGEs on the DA-APPI-MS signal was also investigated. In
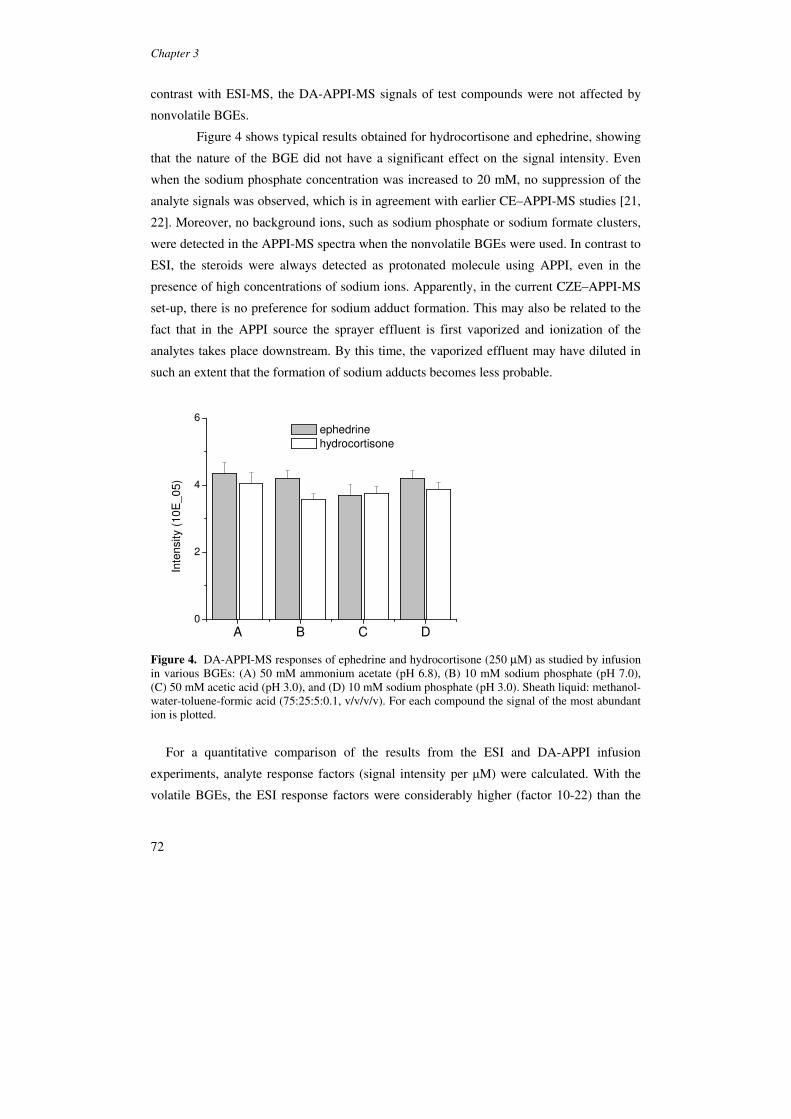
Chapter 3
72
contrast with ESI-MS, the DA-APPI-MS signals of test compounds were not affected by
nonvolatile BGEs.
Figure 4 shows typical results obtained for hydrocortisone and ephedrine, showing
that the nature of the BGE did not have a significant effect on the signal intensity. Even
when the sodium phosphate concentration was increased to 20 mM, no suppression of the
analyte signals was observed, which is in agreement with earlier CE–APPI-MS studies [21,
22]. Moreover, no background ions, such as sodium phosphate or sodium formate clusters,
were detected in the APPI-MS spectra when the nonvolatile BGEs were used. In contrast to
ESI, the steroids were always detected as protonated molecule using APPI, even in the
presence of high concentrations of sodium ions. Apparently, in the current CZE–APPI-MS
set-up, there is no preference for sodium adduct formation. This may also be related to the
fact that in the APPI source the sprayer effluent is first vaporized and ionization of the
analytes takes place downstream. By this time, the vaporized effluent may have diluted in
such an extent that the formation of sodium adducts becomes less probable.
A B C D0
2
4
6
Inte
nsity (
10E
_0
5)
ephedrine
hydrocortisone
Figure 4. DA-APPI-MS responses of ephedrine and hydrocortisone (250 µM) as studied by infusion in various BGEs: (A) 50 mM ammonium acetate (pH 6.8), (B) 10 mM sodium phosphate (pH 7.0), (C) 50 mM acetic acid (pH 3.0), and (D) 10 mM sodium phosphate (pH 3.0). Sheath liquid: methanol-water-toluene-formic acid (75:25:5:0.1, v/v/v/v). For each compound the signal of the most abundant ion is plotted.
For a quantitative comparison of the results from the ESI and DA-APPI infusion
experiments, analyte response factors (signal intensity per µM) were calculated. With the
volatile BGEs, the ESI response factors were considerably higher (factor 10-22) than the

Comparison of APPI and ESI for CZE-MS
73
ones found for DA-APPI. Even using the nonvolatile BGEs, ESI-MS appeared to be more
favorable than DA-APPI-MS for the basic amines. Table 2 lists the responses obtained
using the BGE of 10 mM sodium phosphate (pH 7.0). Although the phosphate buffer
suppressed the signals of all analytes in ESI, the remaining intensities for the amine drugs
were still a factor 3-13 higher than the signals obtained with DA-APPI. The steroids, which
were seriously suppressed in ESI, showed similar signals in DA-APPI-MS and ESI-MS
when dissolved in nonvolatile BGE.
3.2. CZE–MS
The performances of ESI and DA-APPI in combination with the various BGEs were further
evaluated in an on-line CZE–MS setting. To this end a mixture of the test compounds was
analyzed repeatedly (n = 3) by both CZE–ESI-MS and CZE–APPI-MS using the different
BGEs. The test mixture contained all test compounds (20-160 µM in water) except
prednisone. As prednisone and hydrocortisone are uncharged, they would co-migrate under
all conditions. MS parameter settings for CZE–MS were based on a compromise between
optimal values for the individual test compounds in ESI-MS and DA-APPI-MS,
respectively.
Table 2. Concentration-normalized ESI-MS and DA-APPI-MS responses of test compounds obtained during infusiona.
Compound ESI-MS response
(x 103 arb. units)
DA-APPI-MS response
(x 103 arb. units)
Carbachol
Methylatropine
Fluvoxamine
Ephedrine
Terbutaline
Mebeverine
Hydrocortisone
Prednisone
17 ± 1
76 ± 5
18 ± 1
11.3 ± 0.6
22 ± 1
84 ± 6
2.4 ± 0.4
1.7 ± 0.3
0
0
5.5 ± 0.6
1.74 ± 0.07
1.6 ± 0.2
8.5 ± 0.7
1.6 ± 0.2
1.7 ± 0.1
a Test compounds dissolved in 10 mM sodium phosphate buffer (pH 7.0). Normalized analyte responses were calculated as signal intensity (arb. units) divided by analyte concentration in µM. Results are expressed as means ± SD (n=3).

Chapter 3
74
3.2.1. Separation performance
Although the separation of the test mixture was not optimized, most compounds were
baseline separated in each BGE. Typical extracted ion electropherograms (XIEs) obtained
with ESI and DA-APPI using volatile and nonvolatile BGEs of mid pH are shown in Figure
5. Only the peaks of terbutaline (m/z 226) and fluvoxamine (m/z 319) showed a small
overlay when the BGEs of mid pH were employed. The plate numbers were compound
dependent, but the character of the BGE appeared to have an overall effect. Best plate
numbers (ranging from 80,000 to 200,000) were found in CZE–ESI-MS when ammonium
acetate (pH 6.8) or sodium phosphate (pH 7.0) was used as BGE. For sodium phosphate
(pH 3.0) the CZE–ESI-MS plate numbers were slightly worse (70,000 - 180,000), whereas
with acetic acid (pH 3.0) the plate numbers for the analytes were 50,000 - 140,000.
The minor peaks in the m/z 304 traces obtained with CZE–APPI-MS (Figure 5C and 5D)
which co-migrate with the hydrocortisone peak (m/z 363), are not related to methylatropine,
which cannot be detected under the current settings and obviously would not co-migrate
with a neutral compound. The signals most probably can be attributed to a fragment of
hydrocortisone (loss of C-17 side chain) which is formed during APPI. In CZE–APPI-MS,
plate numbers appeared to be somewhat lower (50,000 - 130,000 for both neutral BGEs)
than observed in CZE–ESI-MS. The loss of separation efficiency may be a consequence of
a slight hydrodynamic flow in the capillary, which results from a small mismatch of the
pressure induced by the nebulizer at the capillary outlet and the compensating pressure
applied on the inlet vial (see Experimental section). Since the nebulizer pressure in APPI is
higher than in ESI, the consequences of such a mismatch are more severe when using APPI.
Extra band broadening in CZE–APPI-MS may also result from a temperature gradient
along the capillary [27], which is brought about by the high temperature in the vaporizer
region.
3.2.2. Signal-to-noise ratios in CZE–ESI-MS and CZE–APPI-MS
The use of phosphate buffers in CZE–ESI-MS caused increased noise levels in the total ion
electropherogram (TIE), however, for most analytes similar noise levels were observed in
the XIEs, irrespective of the BGE used. This can be explained by the fact that the noise in
the TIE using phosphate buffers is predominantly caused by some discrete sodium formate
clusters (see below). In other words, as long as analyte signals do not coincide with the m/z
values of the sodium formate clusters, XIE noise levels are not increased.
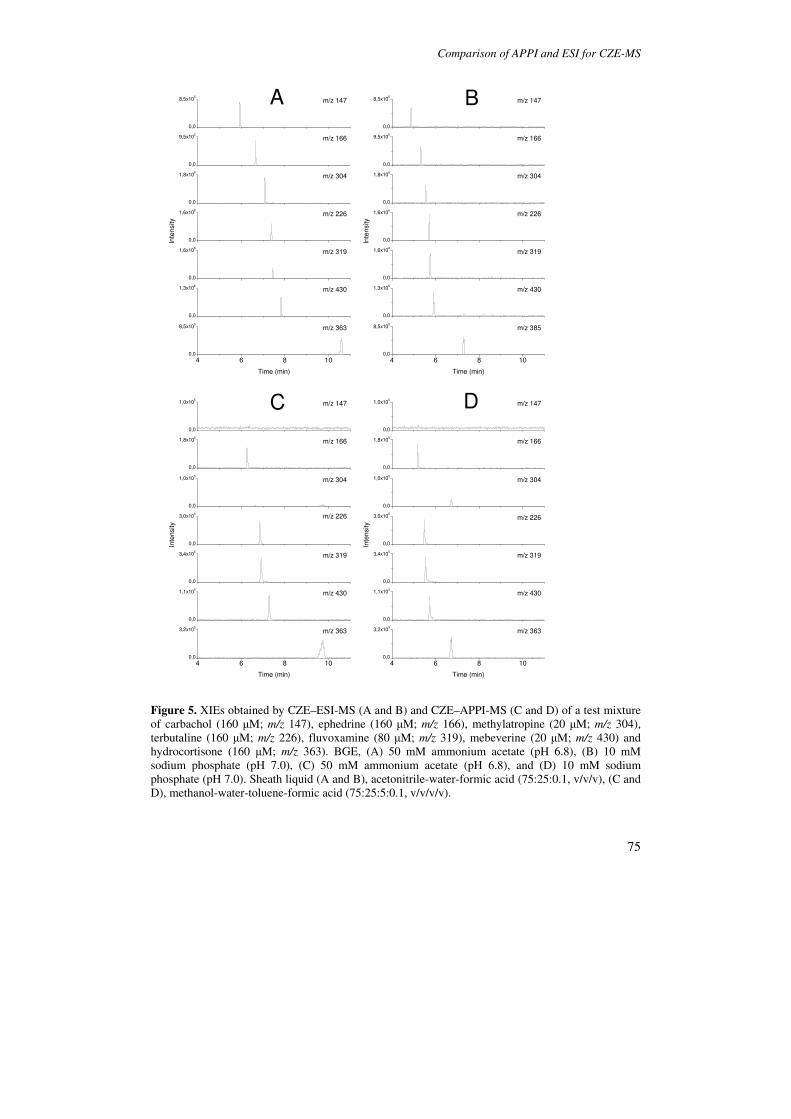
Comparison of APPI and ESI for CZE-MS
75
0,0
8,5x10⁵
0,0
8,5x10⁵
0,0
9,5x10⁵
0,0
9,5x10⁵
0,0
1,8x10⁶
0,0
1,8x10⁶
0,0
1,6x10⁶
0,0
1,6x10⁶
0,0
1,6x10⁶
0,0
1,6x10⁶
0,0
1,3x10⁶
0,0
1,3x10⁶
4 6 8 100,0
8,5x10⁵
4 6 8 100,0
8,5x10⁵
0,0
1,0x10⁵
0,0
1,0x10⁵
0,0
1,8x10⁵
0,0
1,8x10⁵
0,0
1,0x10⁵
0,0
1,0x10⁵
0,0
3,0x10⁵
0,0
3,0x10⁵
0,0
3,4x10⁵
0,0
3,4x10⁵
0,0
1,1x10⁵
0,0
1,1x10⁵
4 6 8 100,0
3,2x10⁵
4 6 8 100,0
3,2x10⁵
m/z 147
D
m/z 147
m/z 166 m/z 166
m/z 304 m/z 304In
tensity
m/z 226
Inte
nsity
m/z 226
m/z 319 m/z 319
m/z 430 m/z 430
Time (min)
m/z 363
Time (min)
m/z 385
m/z 147 m/z 147
m/z 166 m/z 166
m/z 304 m/z 304
Inte
nsity
m/z 226
Inte
nsity
m/z 226
m/z 319 m/z 319
m/z 430 m/z 430
Time (min)
m/z 363
BA
C
Time (min)
m/z 363
Figure 5. XIEs obtained by CZE–ESI-MS (A and B) and CZE–APPI-MS (C and D) of a test mixture of carbachol (160 µM; m/z 147), ephedrine (160 µM; m/z 166), methylatropine (20 µM; m/z 304), terbutaline (160 µM; m/z 226), fluvoxamine (80 µM; m/z 319), mebeverine (20 µM; m/z 430) and hydrocortisone (160 µM; m/z 363). BGE, (A) 50 mM ammonium acetate (pH 6.8), (B) 10 mM sodium phosphate (pH 7.0), (C) 50 mM ammonium acetate (pH 6.8), and (D) 10 mM sodium phosphate (pH 7.0). Sheath liquid (A and B), acetonitrile-water-formic acid (75:25:0.1, v/v/v), (C and D), methanol-water-toluene-formic acid (75:25:5:0.1, v/v/v/v).

Chapter 3
76
For the test compounds, concentration-normalized signal-to-noise ratios (S/N), as
determined from the extracted ion traces obtained with the mid-pH BGEs, are listed for
both ESI and DA-APPI in Table 3. Similar trends were observed for the low-pH BGEs, and
therefore, in the following we confine our discussion to the results obtained with the BGEs
of mid pH.
Remarkably, for most compounds, in CZE–ESI-MS no clear S/N differences were observed
between the volatile and nonvolatile BGE; only for mebeverine (m/z 430) a clearly lower
S/N was observed when the nonvolatile BGE was used. The latter could be attributed to a
large increase in background noise in the m/z 430 trace caused by a sodium formate cluster.
Table 3: Concentration-normalized S/N ratios obtained during CZE–MSa.
ESI DA-APPI
50 mM
amm. acetate
(pH 6.8)
10 mM
sodium phosphate
(pH 7.0)
50 mM
amm. acetate
(pH 6.8)
10 mM
sodium phosphate
(pH 7.0)
Carbachol
Methylatropine
Ephedrine
Terbutaline
Fluvoxamine
Mebeverine
Hydrocortisone
9 ± 2
57 ± 7
8 ± 1
7.1 ± 0.2
12 ± 2
20 ± 3
2.6 ± 0.4
7.9 ± 0.7
49 ± 4
9 ± 2
7.7 ± 0.4
16 ± 4
3.8 ± 0.5
2.3 ± 0.2b
0
0
1.2 ± 0.3
2.8 ± 0.6
7 ± 1
11 ± 3
1.9 ± 0.2
0
0
2.1 ± 0.4
4 ± 1
7 ± 2
11± 3
2.8 ± 0.9
a Concentration-normalized S/Ns are calculated as S/N divided by analyte concentration in µM. Results are expressed as means ± SD (n=3). b Detected as sodium adduct.
The similar analyte S/Ns among the BGEs in CZE–ESI-MS does not seem to be in line
with the infusion experiments which indicated lower analyte signals when using nonvolatile
BGEs. Apparently, with the phosphate buffer more favorable signals were obtained under
CZE–ESI-MS conditions, as noise levels in the XIE traces were similar. With respect to the
volatile BGE, the relatively good responses obtained with the phosphate BGE can be
explained by the fact that shorter migration times, and thus narrower and sharper peaks are
obtained with the phosphate buffer. A further explanation could be that the application of
separation voltage affects the ionic composition of the effluent, and therefore, the analyte
Comparison of APPI and ESI for CZE-MS
77
ionization conditions in CZE–ESI-MS. Such an effect of the separation voltage is, for
example, apparent when the ESI background spectra of the nonvolatile BGE obtained
during infusion and CZE–MS are compared. In infusion ESI-MS, the background ions were
mainly sodium phosphate clusters, whereas in CZE–ESI-MS, the background spectra were
dominated by sodium formate clusters. The separation voltage induces an effective mobility
of the phosphate ions towards the capillary inlet (anode) and thus a reduced flux of
phosphate out of the capillary into the ion source. The influence of the separation voltage
also follows from the fact that hydrocortisone showed strong [M+Na]+ signals in CZE–ESI-
MS, whereas during infusion only very moderate [M+Na]+ signals were observed. This is
explained by the increased flux of sodium ions out of the capillary upon application of
voltage. Apparently, the ionic composition of the capillary effluent in CZE is more
favorable than in infusion.
For all test compounds, the CZE–APPI-MS method yields similar S/Ns employing both
volatile and nonvolatile BGEs (Table 3). Generally, there are no clear differences in S/Ns
between the volatile and nonvolatile BGE. These results are in line with the infusion
experiments which indicated that DA-APPI-MS responses are hardly affected by the nature
of the BGE.
Since all CZE experiments were performed using the same test sample, the normalized
S/N ratios in Table 3 can be used for a direct comparison of the performance of the CZE–
ESI-MS and CZE–APPI-MS methods. For the basic amines, the S/Ns observed in CZE–
ESI-MS are a factor of 2-5 higher than observed in CZE–APPI-MS, regardless of the BGE
employed. Mebeverine is an exception to this trend, as APPI-MS yields a higher S/N than
ESI-MS when a sodium phosphate buffer is used. This reveals a potential disadvantage of
using a nonvolatile BGE in CZE–ESI-MS; when the XIE trace of the analyte coincides with
the m/z of a background cluster, then the noise level increases dramatically, resulting in
compromised sensitivity. However, this problem could be circumvented, e.g., by switching
to a potassium phosphate BGE, or by using acetic acid instead of formic acid in the sheath
liquid. Both approaches yield background ion clusters at other positions in the mass
spectrum. This kind of background problems are not encountered in APPI-MS, so that all
APPI amenable compounds can be properly analyzed using a nonvolatile BGE employing
one set of conditions. For the neutral compound hydrocortisone CZE–APPI-MS and ESI-
MS detection yielded similar S/Ns. Overall, these observations indicate that for preformed
ions, the sensitivity of CZE–ESI-MS is generally superior to CZE–APPI-MS, even when a
nonvolatile BGE is used.
Chapter 3
78
4. Concluding remarks
The present paper has compared the performance of ESI and APPI for CZE–MS using
volatile and nonvolatile BGEs. Infusion experiments indicated that nonvolatile BGEs entail
ionization suppression effects in ESI, but hardly affect DA-APPI-MS responses.
Nevertheless, even in the presence of nonvolatile buffer, the ESI-MS responses for amine
drugs are substantially higher than the signals obtained with APPI-MS. For steroids, which
were severely suppressed in ESI-MS, APPI-MS did yield similar responses. The S/Ns
obtained with CZE–ESI-MS were generally a factor 2-5 higher than obtained with CZE–
APPI-MS while only the steroid yielded equal S/Ns in both methods. Analyte peak heights
and S/Ns obtained in CZE–ESI-MS were generally similar among the volatile and
nonvolatile BGEs. This suggests that the employment of nonvolatile BGEs in CZE–ESI-
MS may not be as detrimental for detection limits as is often thought. On the other hand,
the use of nonvolatile BGEs inevitably leads to source contamination and potentially
interfering background ions.
The better performance of ESI with respect to APPI in CZE–MS seems to be
contradicted by comparative LC–MS studies, in which APPI often yielded similar or only
slightly lower signal intensities than ESI for basic drugs [18, 19]. One factor that may
explain this discrepancy is the fact that the flow rates employed in LC–MS studies (0.2-2
ml min-1) are much higher than the flows encountered in CZE–MS. Since the ESI efficiency
is known to decrease with increasing flow rate [28, 29], the higher flow rates employed in
LC may have been relatively favorable for APPI in which signal intensities are essentially
linear with flow rates up to 1 ml/min [30]. The geometry of the APPI source is another
factor that may contribute to different performances of APPI in LC–MS and CZE–MS. The
ESI and APPI sources used in the present study are originally developed and optimized for
LC–MS, and may be less suitable for coupling with CZE. The vaporizer in the APPI source
is designed to handle much higher volumetric flow-rates than typically encountered in CZE,
and for example, the distance between the sprayer tip and the ionization region may be too
large for optimal APPI performance in CZE–MS. In fact, previous CE–APPI-MS studies
[20, 21] indicate that APPI signals improve with decreasing spacer lengths.
In conclusion, this study showed that the CZE–ESI-MS system generally provides a
better sensitivity than the CZE–APPI-MS set-up, even when modest concentrations of
nonvolatile BGEs are employed. Nevertheless, APPI may be particularly advantageous in
cases where ionization suppression effects and background signals in ESI are more severe,
Comparison of APPI and ESI for CZE-MS
79
such as in micellar electrokinetic chromatography [22] and microemulsion electrokinetic
chromatography.
Acknowledgements
This study was financially supported by AstraZeneca, Global PR&D, External Science
Group (Macclesfield, UK). The authors thank Dr. Gerard P. Rozing of Agilent
Technologies (Waldbronn, Germany) for the loan of the APPI source.
References
1 J.A. Olivares, N.T. Nguyen, C.R. Yonker, R.D. Smith, Anal. Chem. 1987, 59, 1230.
2 W.F. Smyth, Electrophoresis 2005, 26, 1334.
3 C.W. Huck, G. Stecher, H. Scherz, G. Bonn, Electrophoresis 2005, 26, 1319.
4 S. De Boni, C. Neususs, M. Pelzing, G.K.E. Scriba, Electrophoresis 2003, 24, 874.
5 E.F. Hilder, C.W. Klampfl, W. Buchberger, P.R. Haddad, Electrophoresis 2002, 23,
414.
6 D. Visky, I. Jimidar, I. Van Ael, T. Vennekens, D. Redlich, M. De Smet,
Electrophoresis 2005, 26, 1541.
7 M. Moini, Anal. Bioanal. Chem. 2002, 373, 466.
8 N.B. Cech, C.G. Enke, Mass Spectrom. Rev. 2001, 20, 362.
9 D.B. Robb, T.R. Covey, A.P. Bruins, Anal. Chem. 2000, 72, 3653.
10 J.A. Syage, M.D. Evans, Spectroscopy 2001, 16, 14.
11 J.A. Syage, K. A. Hanold, M.D. Evans, Y. Liu, Patent No. WO0197252, 2001.
12 D.B. Robb, A.P. Bruins, Patent No. WO0133605, 2001.
13 A. Raffaelli, A. Saba, Mass Spectrom. Rev. 2003, 22, 318.
14 J.A. Syage, M.D. Evans, K.A. Hanold, Am. Lab. 2000, 32, 24.
15 M.J. Greig, B. Bolaños, T. Quenzer, J.M.R. Bylund, Rapid Commun. Mass Spectrom.
2003, 17, 2763.
16 G.F. Wang, Y. Hsieh, W.A. Korfmacher, Anal. Chem. 2005, 77, 541.
17 J.P. Rauha, H. Vuorela, R. Kostiainen, J. Mass Spectrom. 2001, 36, 1269.
18 Y.X. Cai, D. Kingery, O. McConnell, A.C. Bach, Rapid Commun. Mass Spectrom.
2005, 19, 1717.
Chapter 3
80
19 K.S. Hakala, L. Laitinen, A.M. Kaukonen, J. Hirvonen, R. Kostiainen, T. Kotiaho,
Anal. Chem. 2003, 75, 5969.
20 S.L. Nilsson, C. Andersson, P.J.R. Sjöberg, D. Bylund, P. Petersson, M. Jörntén-
Karlsson, K.E. Markides, Rapid Commun. Mass Spectrom. 2003, 17, 2267.
21 R. Mol, G.J. De Jong, G.W. Somsen, Electrophoresis 2005, 26, 146.
22 R. Mol, G.J. De Jong, G.W. Somsen, Anal. Chem. 2005, 77, 5277.
23 H. Keski-Hynnila, M. Kurkela, E. Elovaara, L. Antonio, J. Magdalou, L. Luukkanen,
J. Taskinen, R. Kostiainen, Anal. Chem. 2002, 74, 3449.
24 J.R. Catai, J. Sastre Toraño, G.J. De Jong, G.W. Somsen, Electrophoresis 2006, 27,
2091.
25 T.J. Kauppila, T. Kuuranne, E.C. Meurer, M.N. Eberlin, T. Kotiaho, R. Kostiainen,
Anal. Chem. 2002, 74, 5470.
26 J.A. Syage, J. Am. Soc. Mass Spectrom. 2004, 15, 1521.
27 X.C. Xuan, D.Q. Li, Electrophoresis 2005, 26, 166.
28 M.S. Wilm, M. Mann, Int. J. Mass. Spectrom. Ion Processes 1994, 136, 167.
29 A. El-Faramawy, K.W.M. Siu, B.A. Thomson, J. Am. Soc. Mass Spectrom. 2005, 16,
1702.
30 K.A. Hanold, S.M. Fischer, P.H. Cormia, C.E. Miller, J.A. Syage, Anal. Chem. 2004,
76, 2842.

81

82
83
Chapter 4
Comparison of electrospray ionization and
atmospheric pressure photoionization
for coupling of micellar electrokinetic
chromatography with ion trap
mass spectrometry
P. Hommerson, A. M. Khan, G. J. de Jong, G. W. Somsen,
J. Chromatogr. A 2008, 1204, 197-203.
Chapter 4
84
Summary
The performance of dopant-assisted atmospheric pressure photoionization (DA-APPI) and
electrospray ionization (ESI) for the coupling of micellar electrokinetic chromatography
(MEKC) with ion trap mass spectrometry (ITMS) was compared using a set of test drugs
comprising basic amines, steroids, esters, phenones and a quaternary ammonium
compound. The influence of the surfactant sodium dodecyl sulfate (SDS) on analyte signals
was studied by infusion of sample through the CE capillary into the respective ion sources.
It was found that BGEs containing 20-50 mM SDS in 10 mM sodium phosphate (pH 7.5)
caused major ionization suppression for both polar and apolar compounds in ESI-MS,
whereas APPI-MS signal intensities remained largely unaffected. ESI gave rise to the
formation of SDS clusters, which occasionally may cause space-charge effects in the ion
trap. Furthermore, extensive sodium-adduct formation was observed for medium polar
compounds with ESI-MS, whereas these compounds were detected as their protonated
molecules with APPI-MS. Using the BGE containing 20 mM SDS, MEKC-ESI-MS still
provides slightly lower limits of detection (LODs) (2.6-3.1 µM) than MEKC-APPI-MS
(4.3-6.4 µM) for basic amines. For less polar compounds, highest S/Ns were obtained with
APPI-MS detection (LODs, 4.5-71 µM). For BGEs containing 50 mM SDS, the limits of
detection for MEKC-APPI-MS were more favorable (factor 1.5-12) than MEKC-ESI-MS
for nearly all tested drugs. Spray shield contamination by SDS was lower in DA-APPI-MS
than in ESI-MS. It is concluded that DA-APPI shows the most favorable characteristics for
MEKC-MS, especially when compounds of low polarity have to be analyzed.

Comparison of APPI and ESI for MEKC-MS
85
1. Introduction
Micellar electrokinetic chromatography (MEKC) is an electrodriven separation technique
characterized by the addition of surfactants to the background electrolyte (BGE) [1]. The
separation of analytes in MEKC is based on a differential partitioning between the micellar
and aqueous phase, and on differences in electrophoretic mobility, enabling simultaneous
analysis of both neutral and charged solutes. Therefore, MEKC is particularly useful for
profiling studies in which the full nature of the sample components may be unknown.
MEKC-UV is a widely accepted technique which found application into many areas of
analytical science, including forensic, pharmaceutical and environmental analysis [2,3]. For
a further extension of the applicability of MEKC, its coupling with mass spectrometry (MS)
would be highly desirable. However, the direct coupling of MEKC with MS has always
been considered problematic, as commonly used pseudo-stationary phases (PSPs), such as
sodium dodecyl sulfate (SDS), cause ionization suppression, source contamination and/or
high background signals in electrospray ionization (ESI)-MS [4-6]. Over the past few years,
several approaches to MEKC-ESI-MS have been developed including partial-filling MEKC
[7,8], and the use of reverse-migrating micelles [9]. These modifications often require
analyte-specific optimization and, therefore, are less suitable for the development of generic
MEKC-MS methods. A promising approach to MEKC-MS is the use of special pseudo-
stationary phases like, e.g., volatile surfactants [10,11], or high molecular weight PSPs [12].
The latter type of PSPs have also been shown to be highly suitable for chiral MEKC-MS
[13-15].
The direct coupling of SDS-MEKC and ESI-MS for the analysis of basic compounds has
been reported [16-19]. These studies revealed significant analyte ionization suppression by
SDS but the resulting detection limits were still sufficient for relevant analytical tasks like
drug impurity profiling. An alternative strategy for MEKC-MS concerns the use of
ionization techniques that show a better compatibility with PSPs. Takada et al. introduced
the use of atmospheric pressure chemical ionization (APCI) for MEKC-MS and showed
that buffer additives such as SDS did not significantly compromise ionization efficiency of
amine compounds [20]. However, the detection limits obtained were rather unfavorable.
Recently, our group described the hyphenation of MEKC and MS using atmospheric
pressure photoionization (APPI) [21]. It appeared that APPI of amine model compounds
was not significantly affected by SDS, while detection limits down to 1 µg/mL (full scan
mode) could be achieved.

Chapter 4
86
Although MEKC-MS may be especially suitable for analysis of neutral compounds, little
quantitative data for this type of analytes is currently available, neither with ESI-MS, nor
with APPI-MS detection. Recent comparative studies of ESI and APPI for capillary zone
electrophoresis (CZE)-MS indicated that when volatile or low concentrations of nonvolatile
BGEs are used, ESI provides more favorable detection limits than APPI for basic
compounds [22,23]. APPI showed to be most promising when BGEs containing strong
ionization-suppressing agents, like surfactants, have to be used. Therefore, in the present
study, a direct comparison of the performance of ESI-MS and APPI-MS is made under
MEKC conditions, i.e., with SDS added to the BGE, with a focus on neutral test
compounds. The effect of the BGE on analyte ionization, analyte signal intensity,
background signals and source contamination is evaluated and discussed
2 Experimental
2.1. Chemicals and materials
Sodium dodecyl sulfate, sodium dihydrogen phosphate, disodium hydrogen phosphate and
sodium hydroxide were supplied by Merck (Darmstadt, Germany). Formic acid, toluene
and diphenyl sulfide were purchased from Sigma-Aldrich (Zwijndrecht, The Netherlands).
Acetophenone and valerophenone were purchased from Fluka (Zwijndrecht, The
Netherlands). Methanol was from Biosolve (Valkenswaard, The Netherlands). Fluvoxamine
and mebeverine were obtained from Solvay Pharmaceuticals (Weesp, The Netherlands).
Methyl atropine, hydrocortisone, prednisone, methyl 4-hydroxybenzoate (MOB) and propyl
4-hydroxybenzoate (POB) were from Fagron (Nieuwekerk a/d IJssel, The Netherlands).
Molecular structures of the test compounds are depicted in Figure 1. Deionized water was
filtered and degassed before use. Fused-silica capillaries were from BGB Analytik
(Boekten, Switzerland).
For the APPI-MS and ESI-MS infusion experiments, solutions of test compounds were
prepared in 50 mM ammonium acetate (pH 6.8) and 10 mM sodium phosphate (pH 7.5)
containing 0, 20 or 50 mM SDS. All BGEs were filtered through a 0.20 micron filter before
use. Analyte concentrations in ESI-MS infusion experiments were 5 µM for methyl
atropine, mebeverine and fluvoxamine, and 100 µM for the additional test compounds,
whereas in APPI-MS infusion experiments the concentrations were 100 µM for methyl
atropine, mebeverine and fluvoxamine, and 500 µM for the additional test compounds.
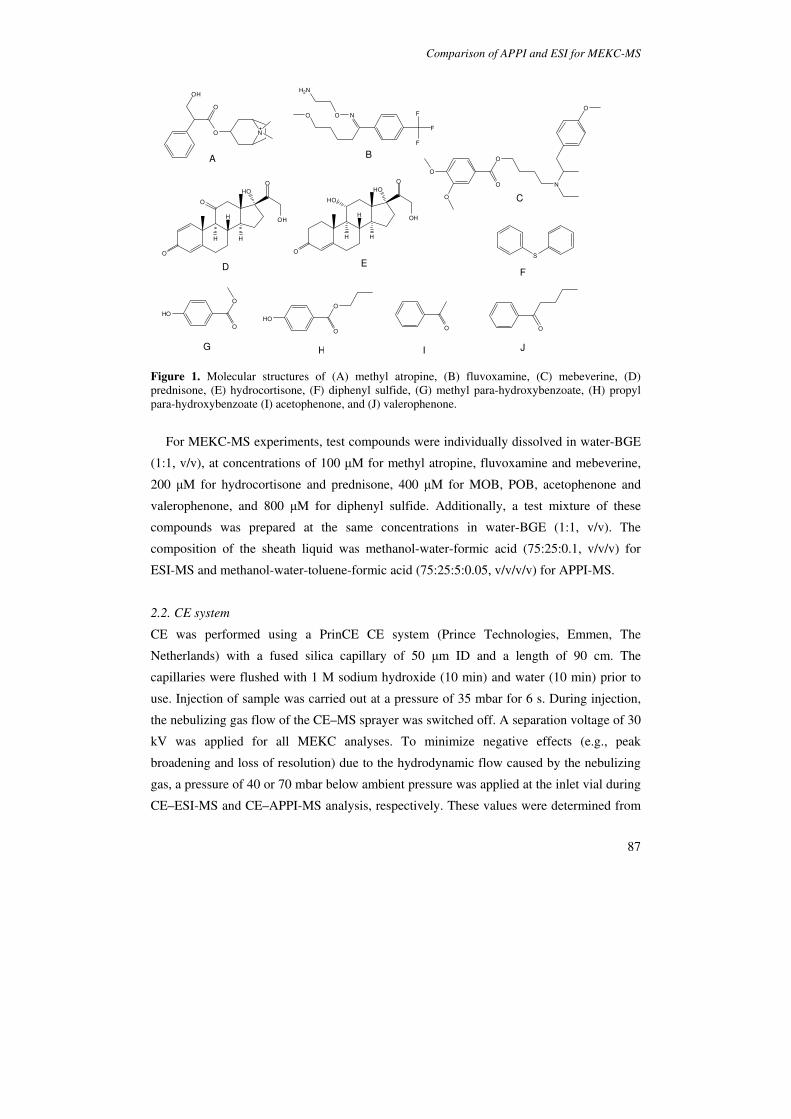
Comparison of APPI and ESI for MEKC-MS
87
OH
O N
O
NO
H2N
F
F
F
O
O
O
O
O
N
O
O
O
OH
HO
HO
H
H
H
O
O
OH
HO
O
H
H
H
O O
S
O
HO
O
O
HO
O
A B
C
D EF
G H I J
Figure 1. Molecular structures of (A) methyl atropine, (B) fluvoxamine, (C) mebeverine, (D) prednisone, (E) hydrocortisone, (F) diphenyl sulfide, (G) methyl para-hydroxybenzoate, (H) propyl para-hydroxybenzoate (I) acetophenone, and (J) valerophenone.
For MEKC-MS experiments, test compounds were individually dissolved in water-BGE
(1:1, v/v), at concentrations of 100 µM for methyl atropine, fluvoxamine and mebeverine,
200 µM for hydrocortisone and prednisone, 400 µM for MOB, POB, acetophenone and
valerophenone, and 800 µM for diphenyl sulfide. Additionally, a test mixture of these
compounds was prepared at the same concentrations in water-BGE (1:1, v/v). The
composition of the sheath liquid was methanol-water-formic acid (75:25:0.1, v/v/v) for
ESI-MS and methanol-water-toluene-formic acid (75:25:5:0.05, v/v/v/v) for APPI-MS.
2.2. CE system
CE was performed using a PrinCE CE system (Prince Technologies, Emmen, The
Netherlands) with a fused silica capillary of 50 µm ID and a length of 90 cm. The
capillaries were flushed with 1 M sodium hydroxide (10 min) and water (10 min) prior to
use. Injection of sample was carried out at a pressure of 35 mbar for 6 s. During injection,
the nebulizing gas flow of the CE–MS sprayer was switched off. A separation voltage of 30
kV was applied for all MEKC analyses. To minimize negative effects (e.g., peak
broadening and loss of resolution) due to the hydrodynamic flow caused by the nebulizing
gas, a pressure of 40 or 70 mbar below ambient pressure was applied at the inlet vial during
CE–ESI-MS and CE–APPI-MS analysis, respectively. These values were determined from
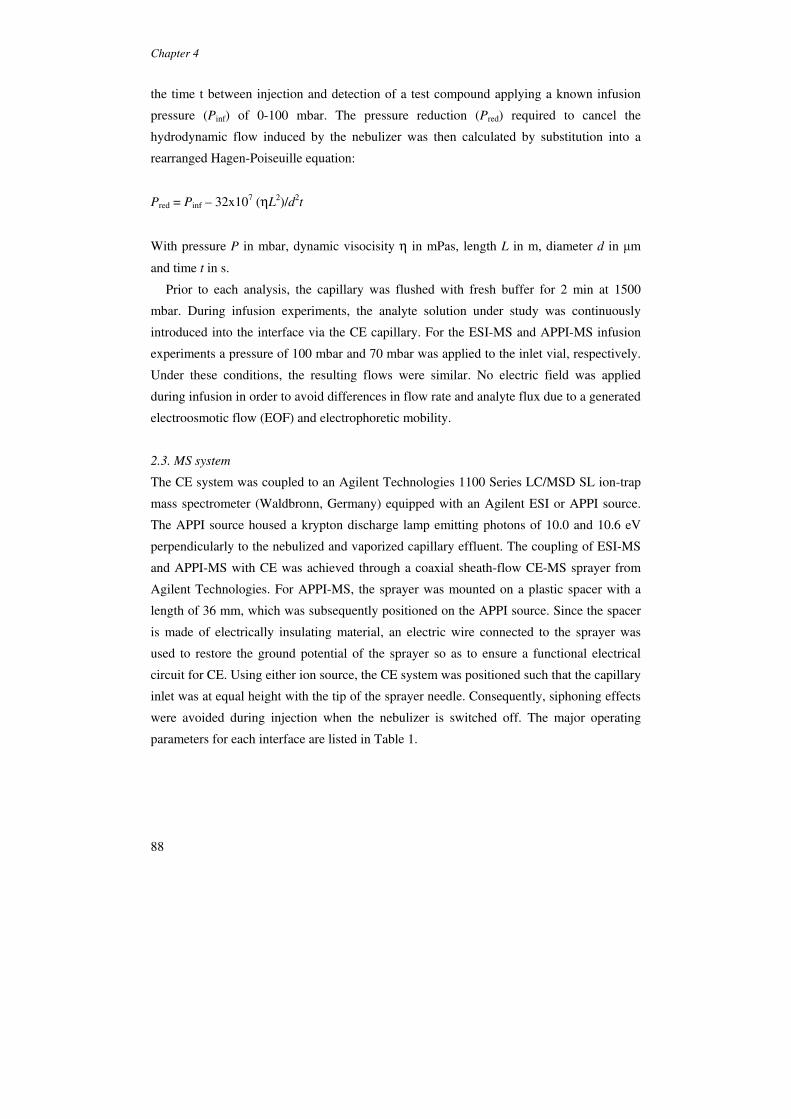
Chapter 4
88
the time t between injection and detection of a test compound applying a known infusion
pressure (Pinf) of 0-100 mbar. The pressure reduction (Pred) required to cancel the
hydrodynamic flow induced by the nebulizer was then calculated by substitution into a
rearranged Hagen-Poiseuille equation:
Pred = Pinf – 32x107 (ηL2)/d2
t
With pressure P in mbar, dynamic visocisity η in mPas, length L in m, diameter d in µm
and time t in s.
Prior to each analysis, the capillary was flushed with fresh buffer for 2 min at 1500
mbar. During infusion experiments, the analyte solution under study was continuously
introduced into the interface via the CE capillary. For the ESI-MS and APPI-MS infusion
experiments a pressure of 100 mbar and 70 mbar was applied to the inlet vial, respectively.
Under these conditions, the resulting flows were similar. No electric field was applied
during infusion in order to avoid differences in flow rate and analyte flux due to a generated
electroosmotic flow (EOF) and electrophoretic mobility.
2.3. MS system
The CE system was coupled to an Agilent Technologies 1100 Series LC/MSD SL ion-trap
mass spectrometer (Waldbronn, Germany) equipped with an Agilent ESI or APPI source.
The APPI source housed a krypton discharge lamp emitting photons of 10.0 and 10.6 eV
perpendicularly to the nebulized and vaporized capillary effluent. The coupling of ESI-MS
and APPI-MS with CE was achieved through a coaxial sheath-flow CE-MS sprayer from
Agilent Technologies. For APPI-MS, the sprayer was mounted on a plastic spacer with a
length of 36 mm, which was subsequently positioned on the APPI source. Since the spacer
is made of electrically insulating material, an electric wire connected to the sprayer was
used to restore the ground potential of the sprayer so as to ensure a functional electrical
circuit for CE. Using either ion source, the CE system was positioned such that the capillary
inlet was at equal height with the tip of the sprayer needle. Consequently, siphoning effects
were avoided during injection when the nebulizer is switched off. The major operating
parameters for each interface are listed in Table 1.

Comparison of APPI and ESI for MEKC-MS
89
Table 1: Main parameter settings for ESI and APPI
Conditions Electrospray ionization
(ESI)
Atmospheric pressure ionization
(APPI)
Spray voltage
Capillary exit voltage
Skimmer voltage
Sheath liquid
Sheath liquid flow rate
Dry gas flow rate
Dry gas temperature
Nebulizing gas
Vaporizer temperature
5000 V
114 V
40 V
methanol-water-formic acid
(75:25:0.1, v/v/v)
5 µL min-1
5 L min-1
200 oC
15 psi
-
1300 V
110 V
35 V
methanol-water-toluene-formic acid
(75:25:5:0.05, v/v/v/v)
15 µL min-1
3 L min-1
200 oC
25 psi
300 ºC
The instrument was operated in positive ion mode and the scan range was 100-440 m/z,
unless otherwise indicated. MS parameter settings, such as lenses and trap drive, were
optimized for each compound individually by infusion of analyte solutions in 50 mM
ammonium acetate. The value for the ion-charge control (ICC) was subsequently set at the
highest value that allowed proper mass analysis even in the presence of 50 mM SDS. In
order to ensure constant interface performances, the ion sources were cleaned daily by
wiping the ionization chamber surface, spray shield and capillary cap using a mixture of
water-isopropanol (50:50, v/v).
3. Results and discussion
3.1. Infusion experiments
Infusion experiments were performed to study the effect of analyte nature and BGE
composition on the MS signal intensity using ESI-MS and APPI-MS detection. The analyte
under study was continuously introduced through the CE capillary into the interface. The
test compounds were selected to cover a wide range of compounds potentially separable by
MEKC and included a quaternary ammonium compound (methyl atropine), basic amines
(fluvoxamine and mebeverine), steroids (prednisone and hydrocortisone), alkyl esters of p-
hydroxybenzoic acid (MOB and POB), alkylphenones (acetophenone and valerophenone)
and diphenyl sulfide. As a starting point, interface conditions, such as composition and flow

Chapter 4
90
rate of the sheath liquid, and nebulizing gas pressure, that were found suitable for MEKC-
ESI-MS and MEKC-APPI-MS in previous studies, were used [17,21].
3.1.1. ESI-MS
With ESI-MS using a volatile BGE of 50 mM ammonium acetate, the test compounds were
detected as protonated molecule ([M+H]+), except for methyl atropine which was detected
as even-electron ion M+, and diphenyl sulfide which could not be detected in ESI-MS.
When a BGE of sodium phosphate (pH 7.5) was employed, the basic compounds and
quaternary ammonium compound were detected as [M+H]+ and M+, respectively, whereas
the analytes that do not form ions in aqueous solution, i.e. the steroids, alkylketones, MOB
and POB, were detected as sodium adducts [M+Na]+ upon ESI. This adduct formation can
be attributed to the lack of a basic group and the presence of a carbonyl or ester group in
these compounds. The ESI background spectrum was dominated by several sodium
phosphate clusters at m/z 143, 165, 263, and 383. Addition of SDS to the sodium phosphate
BGE did not change the nature of the formed ions; the steroids, the alkylphenones, MOB
and POB were still detected as sodium adduct. However, employing SDS-containing BGEs,
several analytes were occasionally detected at increased m/z values (+0.2-1.0). These mass
shifts are indicative for space-charge effects, which arise when the trap is filled with too
many ions [24]. As a result of this over-filling, the quadrupole electrical field becomes
distorted which, in addition to mass shifts, may lead to significantly reduced signal
intensities or even complete failure to detect analyte ions. The space-charge effects may be
related to the formation of SDS clusters which are observed in the background spectrum
when SDS-containing BGEs are infused into the electrospray ion source (Figure 2). Space-
charge effects may also lead to reduced signal intensities or even failure to detect analyte
ions. Therefore, in order to allow proper comparisons, ion-charge-control (ICC) target
values were optimized for each compound individually during infusion experiments (see
Experimental Section) to avoid over-filling of the trap.
Figure 3 shows the effect of the different BGEs on the relative signal intensity obtained
with ESI-MS for methyl atropine (quaternary amine), mebeverine (basic compound) and
hydrocortisone and valerophenone (neutral compounds). For all test compounds, the BGE
of 10 mM sodium phosphate (pH 7.5) caused a signal reduction of 50-70% with respect to
the signal obtained with the ammonium acetate BGE. When 20 mM SDS was added to the

Comparison of APPI and ESI for MEKC-MS
91
200 400 600 800 10000
4x10⁶
[3SDS+Na]+
[2SDS+Na]+
[SDS+Na]+
515 887667
559
447
379
311In
ten
sity
m/z
Figure 2. ESI mass spectrum obtained during continuous infusion of 50 mM SDS in 10 mM sodium phosphate (pH 7.5).
BGE, the signals were 5-10% of the signal obtained with the volatile BGE, which is in
agreement with previous studies [16]. The ionization suppression by SDS was slightly more
pronounced for neutral compounds than for the quaternary ammonium compound and the
basic amines. Increasing the SDS-concentration to 50 mM led to a further decrease in signal
intensity, although the relative reduction was modest compared to that observed when the
SDS concentration was increased from 0 to 20 mM.
A B C D0
20
40
60
80
100
120
[M+H]+
M+
Rela
tive inte
nsity (
%)
Methyl atropine
A B C D
Mebeverine
A B C D
[M+Na]+
[M+Na]+
[M+H]+[M+H]
+
Hydrocortisone
A B C D
[M+Na]+[M+Na]
+
[M+Na]+
[M+Na]+
Valerophenone
Figure 3. Relative ESI-MS responses of methyl atropine, mebeverine, hydrocortisone and valerophenone as studied by continuous infusion using various BGEs. (A) 50 mM ammonium acetate (pH 6.8), (B) 10 mM sodium phosphate (pH 7.5), (C) 20 mM SDS in 10 mM sodium phosphate (pH 7.5), and (D) 50 mM SDS in 10 mM sodium phosphate (pH 7.5). Analyte concentrations: methyl atropine and mebeverine, 5 µM; hydrocortisone and valerophenone, 100 µM. Other experimental conditions, see Experimental section.

Chapter 4
92
3.1.2. DA-APPI-MS
Ionization efficiencies in CE-APPI-MS can be enhanced by the addition of a so-called
dopant to the sheath liquid [21,23,25]. Dopants are compounds with relatively low
ionization energies which are readily ionized by the Vacuum UV (VUV) light (123.9 nm)
from the Krypton lamp. Upon ionization, a dopant radical cation may bring about analyte
ion formation by proton-transfer or charge-exchange, either directly, or through
intermediate reactions with solvent molecules [26]. Acetone was found to be primarily
effective for the ionization of relatively polar compounds, whereas toluene was found
suitable for both polar and nonpolar compounds [25]. For a broad applicability of MEKC-
MS, a versatile dopant would be most useful and, therefore, toluene was selected in the
present study for dopant-assisted (DA) APPI. Furthermore, the conductivity of the sheath
liquid was enhanced by the addition of 0.05 vol% of formic acid.
When the test compounds were infused in the ammonium acetate BGE, the apolar
diphenyl sulfide was detected by DA-APPI as radical cation (M+•), whereas the basic and
neutral compounds were all detected as protonated molecules ([M+H]+) and the quaternary
ammonium compound methyl atropine remained undetected. The latter observation is in
line with previous studies which indicated that quaternary ammonium compounds can be
detected by APPI-MS only when specific interface conditions are employed [23,27]. The
nature of the ions formed for the test compounds with DA-APPI did not change when
nonvolatile BGEs were employed, even when they contained SDS. Mass shifts were not
observed during the DA-APPI-MS infusion experiments, indicating that the ion trap
performance is not compromised by space-charge effects.
200 400 600 800 10000
6x10⁶
295
92
449
Inte
nsity
m/z
Figure 4. DA-APPI mass spectrum obtained during continuous infusion of 50 mM SDS in 10 mM sodium phosphate (pH 7.5). Experimental conditions, see Table 1.
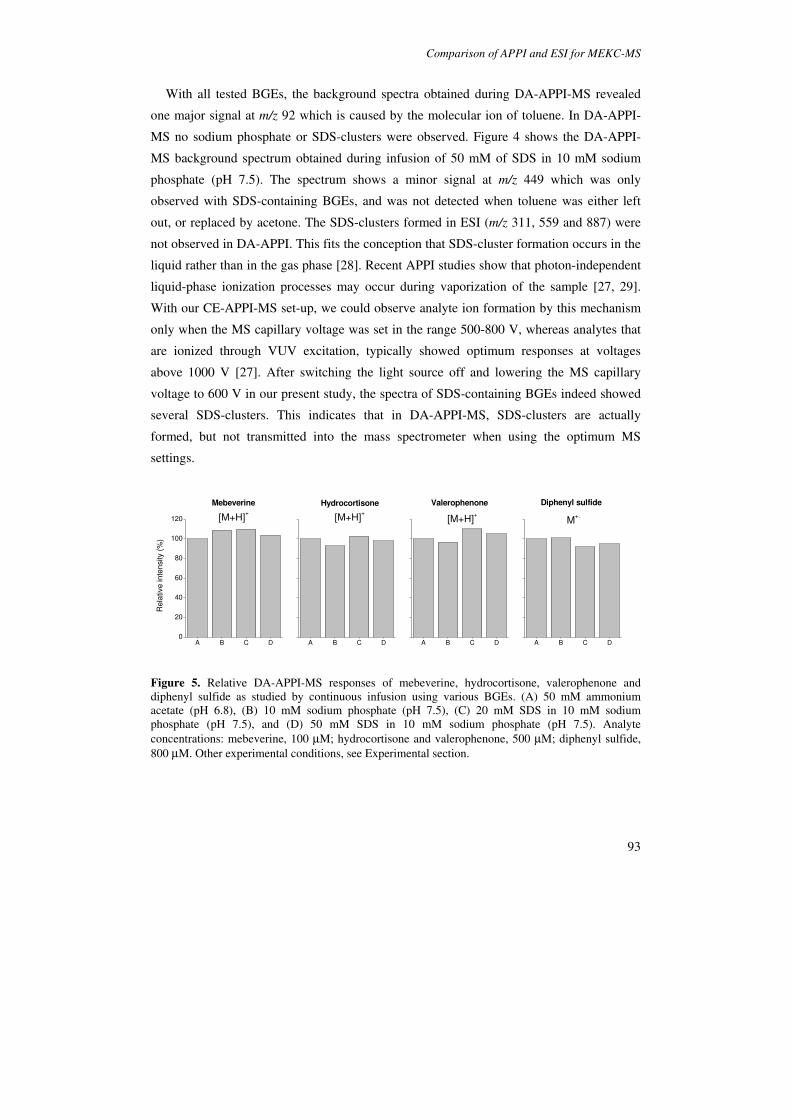
Comparison of APPI and ESI for MEKC-MS
93
With all tested BGEs, the background spectra obtained during DA-APPI-MS revealed
one major signal at m/z 92 which is caused by the molecular ion of toluene. In DA-APPI-
MS no sodium phosphate or SDS-clusters were observed. Figure 4 shows the DA-APPI-
MS background spectrum obtained during infusion of 50 mM of SDS in 10 mM sodium
phosphate (pH 7.5). The spectrum shows a minor signal at m/z 449 which was only
observed with SDS-containing BGEs, and was not detected when toluene was either left
out, or replaced by acetone. The SDS-clusters formed in ESI (m/z 311, 559 and 887) were
not observed in DA-APPI. This fits the conception that SDS-cluster formation occurs in the
liquid rather than in the gas phase [28]. Recent APPI studies show that photon-independent
liquid-phase ionization processes may occur during vaporization of the sample [27, 29].
With our CE-APPI-MS set-up, we could observe analyte ion formation by this mechanism
only when the MS capillary voltage was set in the range 500-800 V, whereas analytes that
are ionized through VUV excitation, typically showed optimum responses at voltages
above 1000 V [27]. After switching the light source off and lowering the MS capillary
voltage to 600 V in our present study, the spectra of SDS-containing BGEs indeed showed
several SDS-clusters. This indicates that in DA-APPI-MS, SDS-clusters are actually
formed, but not transmitted into the mass spectrometer when using the optimum MS
settings.
A B C D0
20
40
60
80
100
120
Rela
tive in
ten
sity (
%)
Mebeverine
A B C D
[M+H]+
Hydrocortisone
A B C D
[M+H]+
Valerophenone
A B C D
M+.[M+H]
+
Diphenyl sulfide
Figure 5. Relative DA-APPI-MS responses of mebeverine, hydrocortisone, valerophenone and diphenyl sulfide as studied by continuous infusion using various BGEs. (A) 50 mM ammonium acetate (pH 6.8), (B) 10 mM sodium phosphate (pH 7.5), (C) 20 mM SDS in 10 mM sodium phosphate (pH 7.5), and (D) 50 mM SDS in 10 mM sodium phosphate (pH 7.5). Analyte concentrations: mebeverine, 100 µM; hydrocortisone and valerophenone, 500 µM; diphenyl sulfide, 800 µM. Other experimental conditions, see Experimental section.

Chapter 4
94
Figure 5 shows the effect of the BGE composition on the relative DA-APPI-MS signal
intensities for a number of test compounds. The DA-APPI-MS responses were not affected
by the presence of sodium phosphate or SDS. This observation holds for both types of gas
phase ions that can be formed by DA-APPI-MS, i.e., radical cations and protonated
molecules. Apparently, the presence of sodium phosphate or SDS does not significantly
affect the gas phase reactions involved in DA-APPI. The deleterious effect of SDS as
observed in ESI-MS can be attributed to the adverse influence of SDS on spray droplet
formation and analyte ion evaporation as also follows from fundamental ESI studies [30].
With regard to the effect of SDS on the ionization process, it can be concluded that DA-
APPI detection is more advantageous than ESI-MS. The detection limits that may be
achieved in MEKC-MS, however, depend on both absolute signal intensities and noise
levels, and are also affected by band broadening processes. Therefore, in order to make a
useful quantitative evaluation of ESI and DA-APPI, analyte signal-to-noise ratios (S/Ns)
were compared under MEKC-MS conditions (Section 3.2).
3.2. MEKC-ESI-MS vs MEKC-APPI-MS
For a quantitative comparison of ESI-MS and DA-APPI-MS as detection methods in
MEKC, optimized MS parameters (e.g. lenses, trap drive) and ICC target values were used
for each test compound, while the interface parameters were kept at predefined values as
listed in Table 1. Each compound was analyzed individually by MEKC-ESI-MS and
MEKC-APPI-MS using BGEs of 20 mM and 50 mM SDS in 10 mM sodium phosphate
(pH 7.5).
With ESI-MS detection, no signal was observed for diphenyl sulfide and acetophenone,
whereas the less polar test compounds were invariably detected as their sodium adducts.
DA-APPI-MS allowed the detection of the apolar diphenyl sulfide but methyl atropine
could not be detected. The plate numbers were analyte-dependent, but ESI-MS generally
yielded slightly higher efficiencies than APPI-MS. Highest plate numbers (up to 140,000)
were obtained with MEKC-ESI-MS using the BGE containing 20 mM SDS, whereas
MEKC-DA-APPI-MS yielded typical plate numbers of 60,000-90,000. This slight loss in
separation efficiency has also been observed in comparative CZE-MS studies and can
probably be attributed to the higher nebulizing gas pressure required for optimal DA-APPI-
MS performance [23]. Using the BGE with 20 mM SDS, the test compounds migrated
within 6-14 minutes, whereas with 50 mM SDS the analyte migration times were 8-20
minutes.
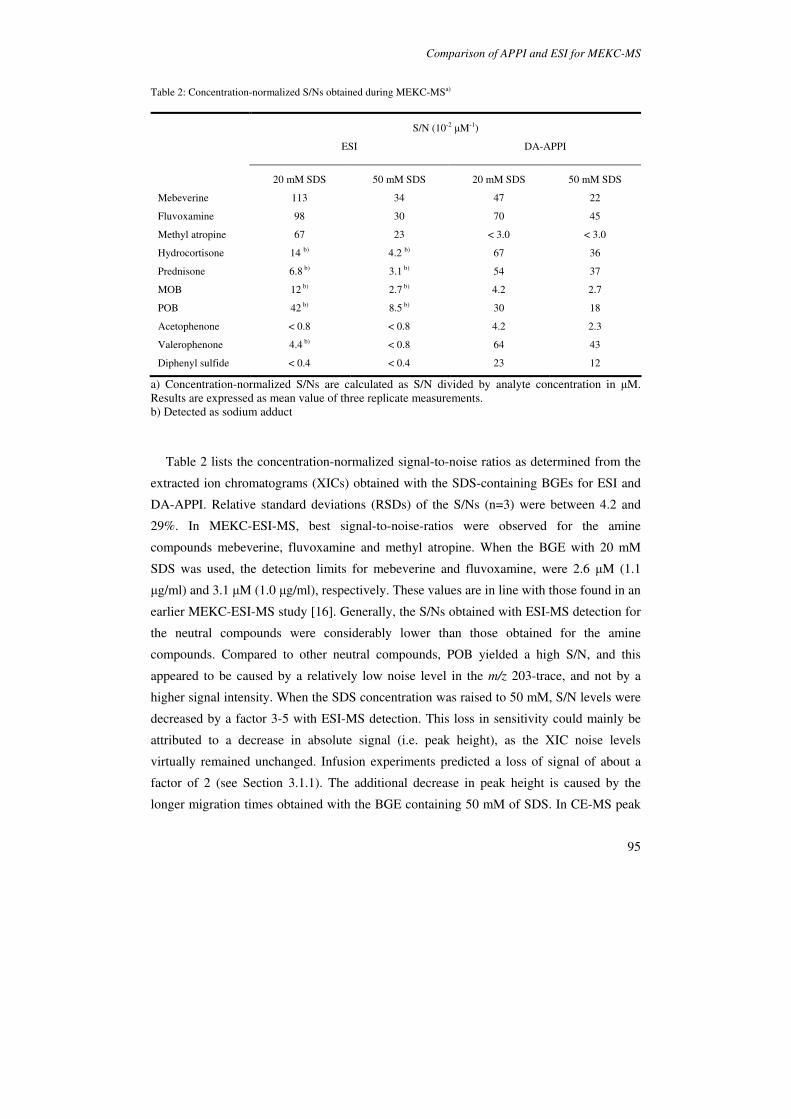
Comparison of APPI and ESI for MEKC-MS
95
Table 2: Concentration-normalized S/Ns obtained during MEKC-MSa)
S/N (10-2 µM-1)
ESI DA-APPI
20 mM SDS 50 mM SDS 20 mM SDS 50 mM SDS
Mebeverine 113 34 47 22
Fluvoxamine 98 30 70 45
Methyl atropine 67 23 < 3.0 < 3.0
Hydrocortisone 14 b) 4.2 b) 67 36
Prednisone 6.8 b) 3.1 b) 54 37
MOB 12 b) 2.7 b) 4.2 2.7
POB 42 b) 8.5 b) 30 18
Acetophenone < 0.8 < 0.8 4.2 2.3
Valerophenone 4.4 b) < 0.8 64 43
Diphenyl sulfide < 0.4 < 0.4 23 12
a) Concentration-normalized S/Ns are calculated as S/N divided by analyte concentration in µM. Results are expressed as mean value of three replicate measurements. b) Detected as sodium adduct
Table 2 lists the concentration-normalized signal-to-noise ratios as determined from the
extracted ion chromatograms (XICs) obtained with the SDS-containing BGEs for ESI and
DA-APPI. Relative standard deviations (RSDs) of the S/Ns (n=3) were between 4.2 and
29%. In MEKC-ESI-MS, best signal-to-noise-ratios were observed for the amine
compounds mebeverine, fluvoxamine and methyl atropine. When the BGE with 20 mM
SDS was used, the detection limits for mebeverine and fluvoxamine, were 2.6 µM (1.1
µg/ml) and 3.1 µM (1.0 µg/ml), respectively. These values are in line with those found in an
earlier MEKC-ESI-MS study [16]. Generally, the S/Ns obtained with ESI-MS detection for
the neutral compounds were considerably lower than those obtained for the amine
compounds. Compared to other neutral compounds, POB yielded a high S/N, and this
appeared to be caused by a relatively low noise level in the m/z 203-trace, and not by a
higher signal intensity. When the SDS concentration was raised to 50 mM, S/N levels were
decreased by a factor 3-5 with ESI-MS detection. This loss in sensitivity could mainly be
attributed to a decrease in absolute signal (i.e. peak height), as the XIC noise levels
virtually remained unchanged. Infusion experiments predicted a loss of signal of about a
factor of 2 (see Section 3.1.1). The additional decrease in peak height is caused by the
longer migration times obtained with the BGE containing 50 mM of SDS. In CE-MS peak
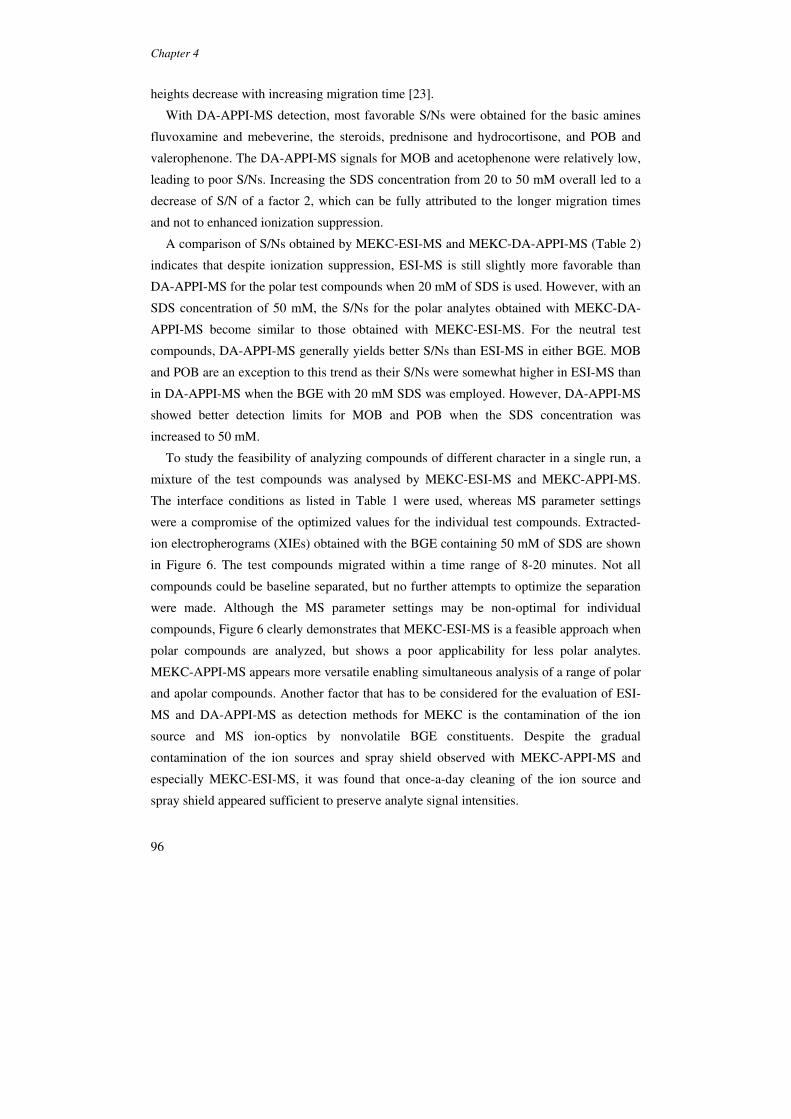
Chapter 4
96
heights decrease with increasing migration time [23].
With DA-APPI-MS detection, most favorable S/Ns were obtained for the basic amines
fluvoxamine and mebeverine, the steroids, prednisone and hydrocortisone, and POB and
valerophenone. The DA-APPI-MS signals for MOB and acetophenone were relatively low,
leading to poor S/Ns. Increasing the SDS concentration from 20 to 50 mM overall led to a
decrease of S/N of a factor 2, which can be fully attributed to the longer migration times
and not to enhanced ionization suppression.
A comparison of S/Ns obtained by MEKC-ESI-MS and MEKC-DA-APPI-MS (Table 2)
indicates that despite ionization suppression, ESI-MS is still slightly more favorable than
DA-APPI-MS for the polar test compounds when 20 mM of SDS is used. However, with an
SDS concentration of 50 mM, the S/Ns for the polar analytes obtained with MEKC-DA-
APPI-MS become similar to those obtained with MEKC-ESI-MS. For the neutral test
compounds, DA-APPI-MS generally yields better S/Ns than ESI-MS in either BGE. MOB
and POB are an exception to this trend as their S/Ns were somewhat higher in ESI-MS than
in DA-APPI-MS when the BGE with 20 mM SDS was employed. However, DA-APPI-MS
showed better detection limits for MOB and POB when the SDS concentration was
increased to 50 mM.
To study the feasibility of analyzing compounds of different character in a single run, a
mixture of the test compounds was analysed by MEKC-ESI-MS and MEKC-APPI-MS.
The interface conditions as listed in Table 1 were used, whereas MS parameter settings
were a compromise of the optimized values for the individual test compounds. Extracted-
ion electropherograms (XIEs) obtained with the BGE containing 50 mM of SDS are shown
in Figure 6. The test compounds migrated within a time range of 8-20 minutes. Not all
compounds could be baseline separated, but no further attempts to optimize the separation
were made. Although the MS parameter settings may be non-optimal for individual
compounds, Figure 6 clearly demonstrates that MEKC-ESI-MS is a feasible approach when
polar compounds are analyzed, but shows a poor applicability for less polar analytes.
MEKC-APPI-MS appears more versatile enabling simultaneous analysis of a range of polar
and apolar compounds. Another factor that has to be considered for the evaluation of ESI-
MS and DA-APPI-MS as detection methods for MEKC is the contamination of the ion
source and MS ion-optics by nonvolatile BGE constituents. Despite the gradual
contamination of the ion sources and spray shield observed with MEKC-APPI-MS and
especially MEKC-ESI-MS, it was found that once-a-day cleaning of the ion source and
spray shield appeared sufficient to preserve analyte signal intensities.

Comparison of APPI and ESI for MEKC-MS
97
0,0
4,0x10⁵
0,0
4,0x10⁵
0,0
4,0x10⁵
0,0
4,0x10⁵
0,0
1,8x10⁴
0,0
1,8x10⁴
0,0
3,5x10⁵
0,0
3,5x10⁵
0,0
3,0x10⁵
0,0
3,0x10⁵
0,0
1,3x10⁵
0,0
1,1x10⁵
0,0
1,3x10⁵
0,0
1,2x10⁵
0,0
1,0x10⁶
0,0
8,5x10⁴
0,0
2,0x10⁵
0,0
8,0x10⁴
5 10 15 200,0
2,5x10⁵
5 10 15 200,0
2,5x10⁵
BA
m/z 304, M+ Methyl atropine
m/z 304, M+
m/z 143, [M+Na]+ Acetophenone
m/z 121, [M+H]+
m/z 175, [M+Na]+ MOB
m/z 153, [M+H]+
m/z 203, [M+Na]+ POB
m/z 181, [M+H]+
Inte
nsity m/z 183, [M+Na]
+ Valerophenone
m/z 163, [M+H]+
m/z 381, [M+Na]+ Prednisone
m/z 359, [M+H]+
m/z 385, [M+Na]+ Hydrocortisone
m/z 363, [M+H]+
m/z 430, [M+H]+ Mebeverine
m/z 430, [M+H]+
m/z 319, [M+H]+ Fluvoxamine
m/z 319, [M+H]+
Time (min)
m/z 203, [M+Na]+
Time (min)
Diphenyl sulfide
m/z 186, M+.
Figure 6. Extracted-ion traces obtained by (A) MEKC-ESI-MS and (B) MEKC-APPI-MS of a test mixture of methyl atropine (100 µM; m/z 304), acetophenone (400 µM; m/z 121), MOB (400 µM; m/z 153), POB (160 µM; m/z 181), valerophenone (400 µM; m/z 163), prednisone (200 µM; m/z 359) hydrocortisone (200 µM; m/z 363), mebeverine (100 µM; m/z 430), fluvoxamine (100 µM; m/z 319), and diphenyl sulfide (800 µM; m/z 186). BGE, 50 mM SDS in 10 mM sodium phosphate (pH 7.5). Other experimental conditions, see Experimental section.
Although the use of nonvolatile salts and surfactants should preferably be avoided using
atmospheric pressure ionization sources, MEKC-MS benefits from very low CE flow rates
(∼100 nL/min). Additionally, in the present set-up, the orthogonal position of the CE
sprayer with respect to the mass spectrometer inlet, sampling of neutral BGE constituents is
largely avoided thereby reducing contamination of the spray shield and ion optics.
Nevertheless, during MEKC-ESI-MS, the spray shield gradually became contaminated by
sodium phosphate and SDS depositions. This was also observed in MEKC-DA-APPI-MS,
albeit to a much lower extent. From the degree of spray shield contamination and the
number of SDS-related background signals (Figures 2 and 4) one may conclude that ion-
optics contamination is more substantial in MEKC-ESI-MS than in MEKC-APPI-MS. This

Chapter 4
98
conclusion could be rationalized by taking the specific interface characteristics into
account. In ESI, the sprayer tip is positioned relatively close to the inlet of the mass
spectrometer and a relatively substantial part of the spray is sampled. In DA-APPI, the CE
sprayer is located further away from the inlet and the sample is first vaporized. Although
SDS-clusters are in fact formed in DA-APPI during vaporization of the sample, these
clusters are not transmitted towards the inlet at the conditions used in this study.
Furthermore, the photoionization process itself hardly produces SDS-related ions.
4. Conclusions
This study has compared the performance of ESI-MS and DA-APPI-MS as detection
techniques for MEKC. Whereas the presence of 20-50 mM of SDS in the BGE results in
major ionization suppression of polar and medium polar compounds in ESI, DA-APPI
responses are not affected by BGE constituents. In DA-APPI-MS, also the type of ions
formed was not influenced by the BGE composition, whereas in ESI-MS, neutral
compounds were detected as sodium adducts in the presence of SDS or sodium phosphate.
This implies that detection of neutral compounds by ESI-MS is strongly affected by the
specific composition of the BGE. As a consequence, a change of BGE may yield analyte
ions at different m/z values and with different signal intensities. With ESI-MS detection,
several SDS-clusters are formed and detected in the background spectrum, whereas DA-
APPI-MS spectra shows only one SDS-related background ion at m/z 449. The formation of
SDS clusters may also result in space-charge effects when ion-trap MS is used. In this case,
a reduction of the ICC target value is indicated, although this results in a loss of sensitivity.
In this respect, a (triple) quadrupole instrument may be more suited for the coupling of
MEKC with ESI-MS. When using 20 mM of SDS in the BGE, MEKC-ESI-MS yields
slightly higher S/Ns for polar compounds than MEKC-DA-APPI-MS. With 50 mM of SDS,
or when analysing less polar compounds, S/Ns obtained with DA-APPI are more
favourable. Overall, it can be concluded that APPI is particularly useful for MEKC-MS
when SDS concentrations higher than 20 mM are used and a wide range of compounds (i.e.
polar/apolar, neutral/charged) has to be analyzed.
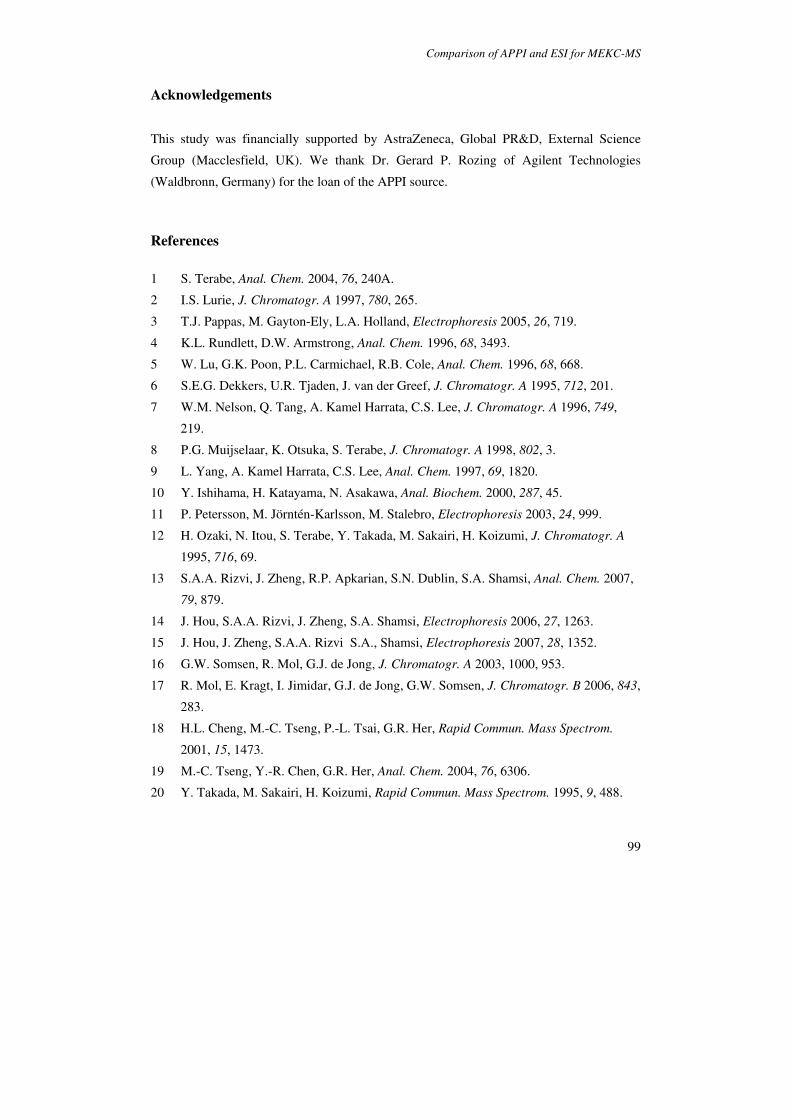
Comparison of APPI and ESI for MEKC-MS
99
Acknowledgements
This study was financially supported by AstraZeneca, Global PR&D, External Science
Group (Macclesfield, UK). We thank Dr. Gerard P. Rozing of Agilent Technologies
(Waldbronn, Germany) for the loan of the APPI source.
References
1 S. Terabe, Anal. Chem. 2004, 76, 240A.
2 I.S. Lurie, J. Chromatogr. A 1997, 780, 265.
3 T.J. Pappas, M. Gayton-Ely, L.A. Holland, Electrophoresis 2005, 26, 719.
4 K.L. Rundlett, D.W. Armstrong, Anal. Chem. 1996, 68, 3493.
5 W. Lu, G.K. Poon, P.L. Carmichael, R.B. Cole, Anal. Chem. 1996, 68, 668.
6 S.E.G. Dekkers, U.R. Tjaden, J. van der Greef, J. Chromatogr. A 1995, 712, 201.
7 W.M. Nelson, Q. Tang, A. Kamel Harrata, C.S. Lee, J. Chromatogr. A 1996, 749,
219.
8 P.G. Muijselaar, K. Otsuka, S. Terabe, J. Chromatogr. A 1998, 802, 3.
9 L. Yang, A. Kamel Harrata, C.S. Lee, Anal. Chem. 1997, 69, 1820.
10 Y. Ishihama, H. Katayama, N. Asakawa, Anal. Biochem. 2000, 287, 45.
11 P. Petersson, M. Jörntén-Karlsson, M. Stalebro, Electrophoresis 2003, 24, 999.
12 H. Ozaki, N. Itou, S. Terabe, Y. Takada, M. Sakairi, H. Koizumi, J. Chromatogr. A
1995, 716, 69.
13 S.A.A. Rizvi, J. Zheng, R.P. Apkarian, S.N. Dublin, S.A. Shamsi, Anal. Chem. 2007,
79, 879.
14 J. Hou, S.A.A. Rizvi, J. Zheng, S.A. Shamsi, Electrophoresis 2006, 27, 1263.
15 J. Hou, J. Zheng, S.A.A. Rizvi S.A., Shamsi, Electrophoresis 2007, 28, 1352.
16 G.W. Somsen, R. Mol, G.J. de Jong, J. Chromatogr. A 2003, 1000, 953.
17 R. Mol, E. Kragt, I. Jimidar, G.J. de Jong, G.W. Somsen, J. Chromatogr. B 2006, 843,
283.
18 H.L. Cheng, M.-C. Tseng, P.-L. Tsai, G.R. Her, Rapid Commun. Mass Spectrom.
2001, 15, 1473.
19 M.-C. Tseng, Y.-R. Chen, G.R. Her, Anal. Chem. 2004, 76, 6306.
20 Y. Takada, M. Sakairi, H. Koizumi, Rapid Commun. Mass Spectrom. 1995, 9, 488.
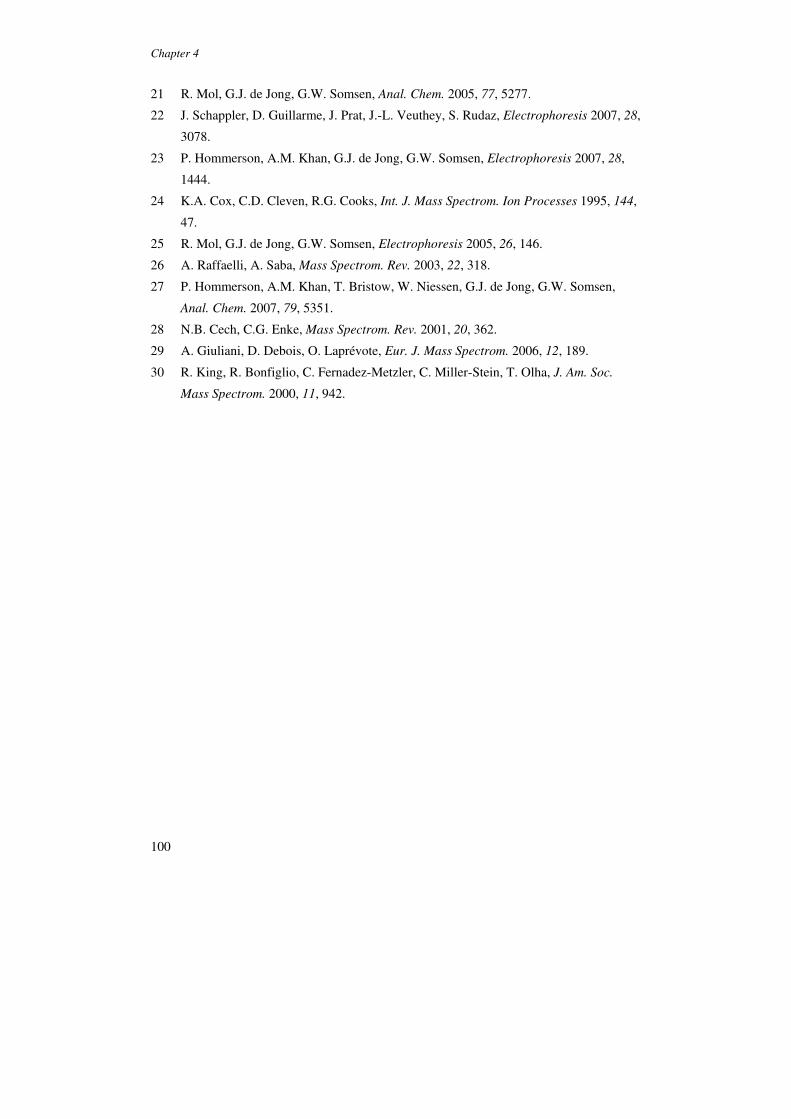
Chapter 4
100
21 R. Mol, G.J. de Jong, G.W. Somsen, Anal. Chem. 2005, 77, 5277.
22 J. Schappler, D. Guillarme, J. Prat, J.-L. Veuthey, S. Rudaz, Electrophoresis 2007, 28,
3078.
23 P. Hommerson, A.M. Khan, G.J. de Jong, G.W. Somsen, Electrophoresis 2007, 28,
1444.
24 K.A. Cox, C.D. Cleven, R.G. Cooks, Int. J. Mass Spectrom. Ion Processes 1995, 144,
47.
25 R. Mol, G.J. de Jong, G.W. Somsen, Electrophoresis 2005, 26, 146.
26 A. Raffaelli, A. Saba, Mass Spectrom. Rev. 2003, 22, 318.
27 P. Hommerson, A.M. Khan, T. Bristow, W. Niessen, G.J. de Jong, G.W. Somsen,
Anal. Chem. 2007, 79, 5351.
28 N.B. Cech, C.G. Enke, Mass Spectrom. Rev. 2001, 20, 362.
29 A. Giuliani, D. Debois, O. Laprévote, Eur. J. Mass Spectrom. 2006, 12, 189.
30 R. King, R. Bonfiglio, C. Fernadez-Metzler, C. Miller-Stein, T. Olha, J. Am. Soc.
Mass Spectrom. 2000, 11, 942.

101

102
103
Chapter 5
Photon-independent gas-phase-ion formation in
capillary electrophoresis–mass spectrometry
using atmospheric pressure photoionization
P. Hommerson, A. M. Khan, T. Bristow, W. Niessen, G. J. de Jong, G. W. Somsen
Anal. Chem. 2007, 79, 5351-5357

Chapter 5
104
Summary
In a previous study on capillary electrophoresis–atmospheric pressure photoionization mass
spectrometry (CE–APPI-MS), it was observed that the formation of gas-phase ions does not
always proceed through photon-induced mechanisms (Electrophoresis, 2007, 28, 1444-
1453). That is, analyte signals were observed when the VUV excitation source was
switched off. The aim of the present study was to further explore this photon-independent
ionization (PII) process. Parameters such as MS capillary voltage, compound nature,
background electrolyte (BGE) composition and presence of dopants were studied using a
CE–APPI-MS set-up. Infusion experiments showed a relatively low MS-capillary voltage
of ca. 600 V to be the main prerequisite for PII. Quaternary ammonium compounds showed
strong responses in PII-MS but could not be observed in dopant-assisted APPI. Basic
amines could be ionized by both photoionization (PI) and PII, whereas neutral compounds
(steroids) could only be observed using PI. Nonvolatile BGEs appeared to cause substantial
ionization suppression in PII, while PI signals remained largely unaffected. Selection of the
proper interface and MS settings allowed PI and PII to proceed simultaneously, which
broadened the range of compounds that could be analyzed in a single CE–APPI-MS run.
Based on the observed characteristics, it is concluded that PII most probably occurs by a
liquid phase ionization mechanism which appears to arise in the APPI source when specific
conditions are selected.
Photon-independent gas-phase-ion formation
105
1. Introduction
Over the past two decades capillary electrophoresis–electrospray ionization-mass
spectrometry (CE–ESI-MS) has developed into a powerful analytical tool that is well suited
to the analysis of complex mixtures [1,2]. CE–MS has found its way into many areas of
application, including environmental, bioanalytical and pharmaceutical analysis [3-5]. The
coupling of CE and MS is predominantly achieved using electrospray ionization (ESI)-
based interfaces achieving high mass sensitivities. Nevertheless, ESI-MS also entails some
disadvantages. One limitation is the interference of the CE background electrolyte (BGE)
with the ESI process, which may cause serious suppression of the MS signal of the
analytes. Furthermore, effective ESI is limited to relatively polar compounds that can be
(de)protonated easily.
Atmospheric pressure photoionization (APPI) is a recent arrival in the field of soft
ionization techniques suitable for coupling liquid-phase separation techniques to MS [6]. In
an APPI source, the sample is firstly vaporized after which ionization of analytes is initiated
by VUV light (123.9 nm) emitted by a krypton discharge lamp. The APPI mechanism has
been the subject of several studies [7,8]. In brief, analytes with an ionization energy (IE)
below the energy of the photons can usually be ionized directly. This is often true for
relatively apolar analytes. In these cases, molecular ions, i.e., odd-electron ions, may be
generated. Ionization efficiency of both polar and apolar compounds can often be enhanced
by the addition of a so-called dopant, which is a substance that is readily ionized and serves
as intermediate for ionization of the compounds of interest. After ionization, the dopant
radical cation may react directly with the analyte or through solvent molecules by proton-
transfer reactions.
Presently, APPI sources are commercially available, the main sources being the
PhotoSpray source based on the work of Robb et al. [6,9], and the PhotoMate source
developed by Syage et al. [10,11] These ion sources mainly differ in the geometry of the
analyte ionization region. In the PhotoSpray source, the ionization takes place inside a
narrow, 7 mm I.D. metal tube, whereas the PhotoMate source has a spherical and more
spatial geometry for ionization. These differences appear to affect the photoionization and
its efficiency. For example, the PhotoMate source generally shows good performance in
direct APPI [10], while the PhotoSpray source requires the use of a dopant [6].
Recently, APPI has been implemented in CE–MS and it was shown that some ESI-
related limitations can be circumvented using APPI [12-14]. The coupling was achieved
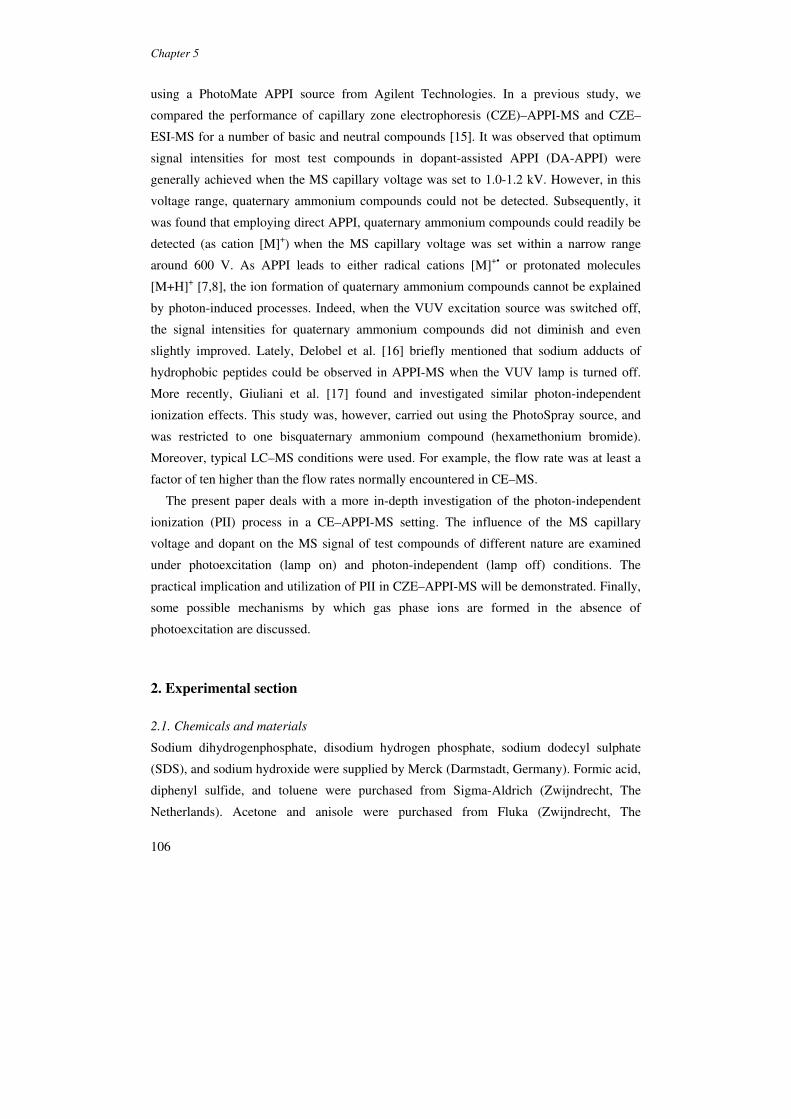
Chapter 5
106
using a PhotoMate APPI source from Agilent Technologies. In a previous study, we
compared the performance of capillary zone electrophoresis (CZE)–APPI-MS and CZE–
ESI-MS for a number of basic and neutral compounds [15]. It was observed that optimum
signal intensities for most test compounds in dopant-assisted APPI (DA-APPI) were
generally achieved when the MS capillary voltage was set to 1.0-1.2 kV. However, in this
voltage range, quaternary ammonium compounds could not be detected. Subsequently, it
was found that employing direct APPI, quaternary ammonium compounds could readily be
detected (as cation [M]+) when the MS capillary voltage was set within a narrow range
around 600 V. As APPI leads to either radical cations [M]+• or protonated molecules
[M+H]+ [7,8], the ion formation of quaternary ammonium compounds cannot be explained
by photon-induced processes. Indeed, when the VUV excitation source was switched off,
the signal intensities for quaternary ammonium compounds did not diminish and even
slightly improved. Lately, Delobel et al. [16] briefly mentioned that sodium adducts of
hydrophobic peptides could be observed in APPI-MS when the VUV lamp is turned off.
More recently, Giuliani et al. [17] found and investigated similar photon-independent
ionization effects. This study was, however, carried out using the PhotoSpray source, and
was restricted to one bisquaternary ammonium compound (hexamethonium bromide).
Moreover, typical LC–MS conditions were used. For example, the flow rate was at least a
factor of ten higher than the flow rates normally encountered in CE–MS.
The present paper deals with a more in-depth investigation of the photon-independent
ionization (PII) process in a CE–APPI-MS setting. The influence of the MS capillary
voltage and dopant on the MS signal of test compounds of different nature are examined
under photoexcitation (lamp on) and photon-independent (lamp off) conditions. The
practical implication and utilization of PII in CZE–APPI-MS will be demonstrated. Finally,
some possible mechanisms by which gas phase ions are formed in the absence of
photoexcitation are discussed.
2. Experimental section
2.1. Chemicals and materials
Sodium dihydrogenphosphate, disodium hydrogen phosphate, sodium dodecyl sulphate
(SDS), and sodium hydroxide were supplied by Merck (Darmstadt, Germany). Formic acid,
diphenyl sulfide, and toluene were purchased from Sigma-Aldrich (Zwijndrecht, The
Netherlands). Acetone and anisole were purchased from Fluka (Zwijndrecht, The
Photon-independent gas-phase-ion formation
107
Netherlands). Methanol was from Biosolve (Valkenswaard, The Netherlands). Fluvoxamine
and mebeverine were obtained from Solvay Pharmaceuticals (Weesp, The Netherlands).
Carbachol, methyl atropine, ephedrine and hydrocortisone were from Fagron (Nieuwerkerk
a/d IJssel, The Netherlands). Deionized water was filtered and degassed before use. Fused-
silica capillaries were from BGB Analytik (Boekten, Switzerland). For the infusion
experiments, test solutions were prepared in 50 mM ammonium acetate (pH 6.8) or 10 mM
sodium phosphate (pH 7.0), with or without 20 mM of SDS, at concentrations of 50 µM for
fluvoxamine, mebeverine, and methyl atropine, and 100 µM for carbachol, diphenyl
sulphide, and hydrocortisone. The sodium phosphate buffer was prepared by adjusting a 10
mM solution of sodium dihydrogen phosphate with a solution of 10 mM disodium
hydrogen phosphate. For the CZE–APPI-MS experiments, a test mixture of mebeverine (20
µM), methyl atropine (40 µM), carbachol, ephedrine, and hydrocortisone (200 µM each)
was prepared in water. Molecular structures of the test compounds are depicted in Fig. 1.
The composition of the sheath liquid in CZE–APPI-MS was methanol-water-formic acid
(75:25:0.1, v/v/v) or methanol-water-toluene-formic acid (75:25:5:5:0.1, v/v/v/v).
O
O
O
O
N
O
N+
OH2N
O
OH
NH
O
O
OH
HO
HO
H
H
H
A B C
D
E
N+ O
O OH
Figure 1. Molecular structures of test compounds (A) carbachol (m/z 147), (B) methyl atropine (m/z 304), (C) ephedrine (m/z 166), (D) mebeverine (m/z 430), and (E) hydrocortisone (m/z 363).
2.2. CE system
CE was performed using a PrinCE CE system (Prince Technologies, Emmen, The
Netherlands) with a fused silica capillary of 50 µm ID and a length of 90 cm. The
capillaries were flushed with 1 M sodium hydroxide (10 min) and water (10 min) prior to
use. A separation voltage of 30 kV was applied for all CZE–MS analyses. Injection of
sample was carried out at a pressure of 35 mbar for 6 s. During injection, the nebulizer gas

Chapter 5
108
flow of the CE–MS sprayer was switched off. To minimize negative effects (e.g., peak
broadening and loss of resolution) due to the hydrodynamic flow caused by the nebulizer
gas, a reduced pressure of approximately -70 mbar was applied at the inlet vial during
CZE–APPI-MS analysis.18 Prior to each analysis, the capillary was flushed with fresh BGE
for 2 min at 1500 mbar. During infusion experiments, the analyte solution under study was
continuously introduced into the interface via the CE capillary applying a pressure of 100
mbar to the inlet vial. No electric field was applied during infusion in order to avoid
differences in flow rate and analyte flux due to a generated electroosmotic flow (EOF).
2.3. MS system
The CE system was coupled to an Agilent Technologies 1100 Series LC/MSD SL ion-trap
mass spectrometer (Waldbronn, Germany) equipped with an Agilent APPI source. The
APPI source housed a krypton discharge lamp emitting photons of 10.0 and 10.6 eV
perpendicularly to the nebulized and vaporized capillary effluent (Fig 2). The coupling of
CE with APPI-MS was achieved through a coaxial sheath-flow CE–MS sprayer from
Agilent Technologies. The sprayer was mounted on a plastic spacer with a length of 36 mm
which was subsequently positioned on the APPI source. Since the spacer is made of
electrically insulating material, an electric wire connected to the sprayer was used to restore
the ground potential of the sprayer so as to ensure a functional electrical circuit for CE. The
CE system was positioned such that the capillary inlet was at equal height with the tip of
the sprayer needle. Consequently, siphoning effects were avoided during injection when the
nebulizer is switched off. The vaporizer temperature was set at 300 oC and the sheath liquid
flow-rate was 15 µL/min. The nebulizer gas pressure and the dry gas flow were 25 psi and
1 L/min, respectively. The instrument was operated in positive ion mode and the scan
range was 140-440 m/z. To avoid overloading of the ion trap, the ion-charge-control option
was enabled.
3. Results and discussion
3.1. Ion formation in the absence of photo irradiation
In a previous contribution on CE–APPI-MS [15], we found that quaternary ammonium
compounds could be ionized through a photon-independent mechanism. The most
important prerequisite for detection of these compounds appeared to be the MS capillary
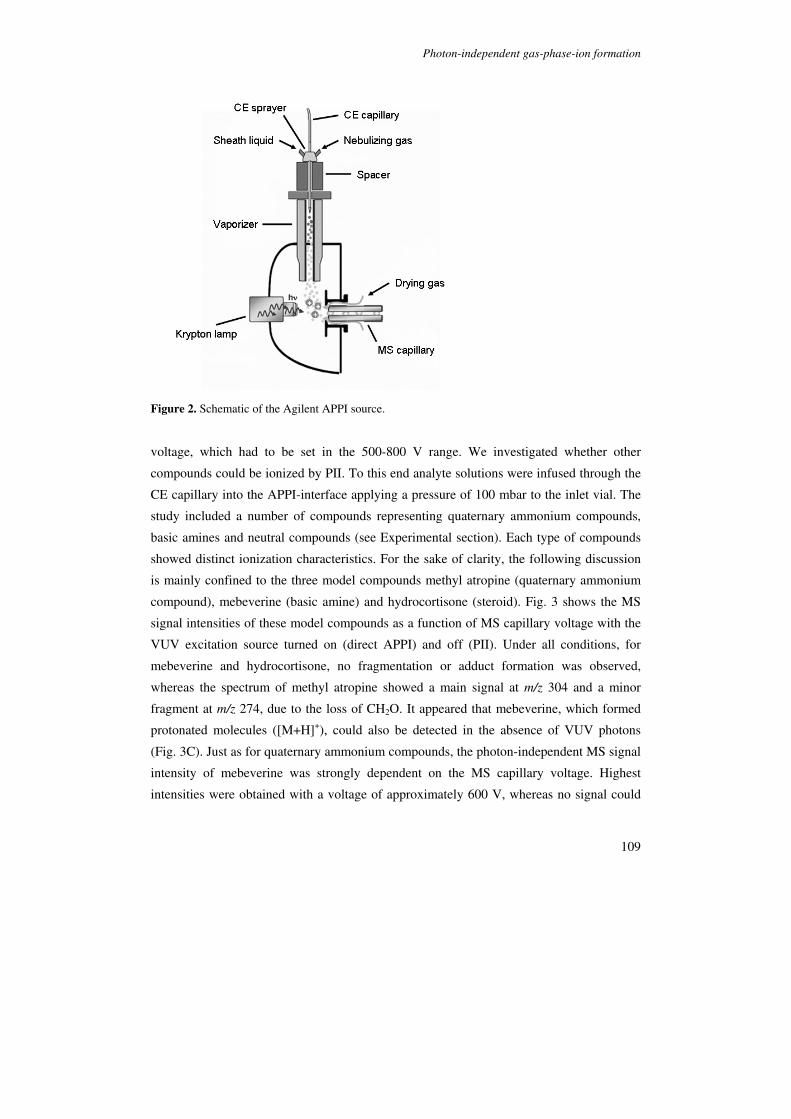
Photon-independent gas-phase-ion formation
109
Figure 2. Schematic of the Agilent APPI source.
voltage, which had to be set in the 500-800 V range. We investigated whether other
compounds could be ionized by PII. To this end analyte solutions were infused through the
CE capillary into the APPI-interface applying a pressure of 100 mbar to the inlet vial. The
study included a number of compounds representing quaternary ammonium compounds,
basic amines and neutral compounds (see Experimental section). Each type of compounds
showed distinct ionization characteristics. For the sake of clarity, the following discussion
is mainly confined to the three model compounds methyl atropine (quaternary ammonium
compound), mebeverine (basic amine) and hydrocortisone (steroid). Fig. 3 shows the MS
signal intensities of these model compounds as a function of MS capillary voltage with the
VUV excitation source turned on (direct APPI) and off (PII). Under all conditions, for
mebeverine and hydrocortisone, no fragmentation or adduct formation was observed,
whereas the spectrum of methyl atropine showed a main signal at m/z 304 and a minor
fragment at m/z 274, due to the loss of CH2O. It appeared that mebeverine, which formed
protonated molecules ([M+H]+), could also be detected in the absence of VUV photons
(Fig. 3C). Just as for quaternary ammonium compounds, the photon-independent MS signal
intensity of mebeverine was strongly dependent on the MS capillary voltage. Highest
intensities were obtained with a voltage of approximately 600 V, whereas no signal could
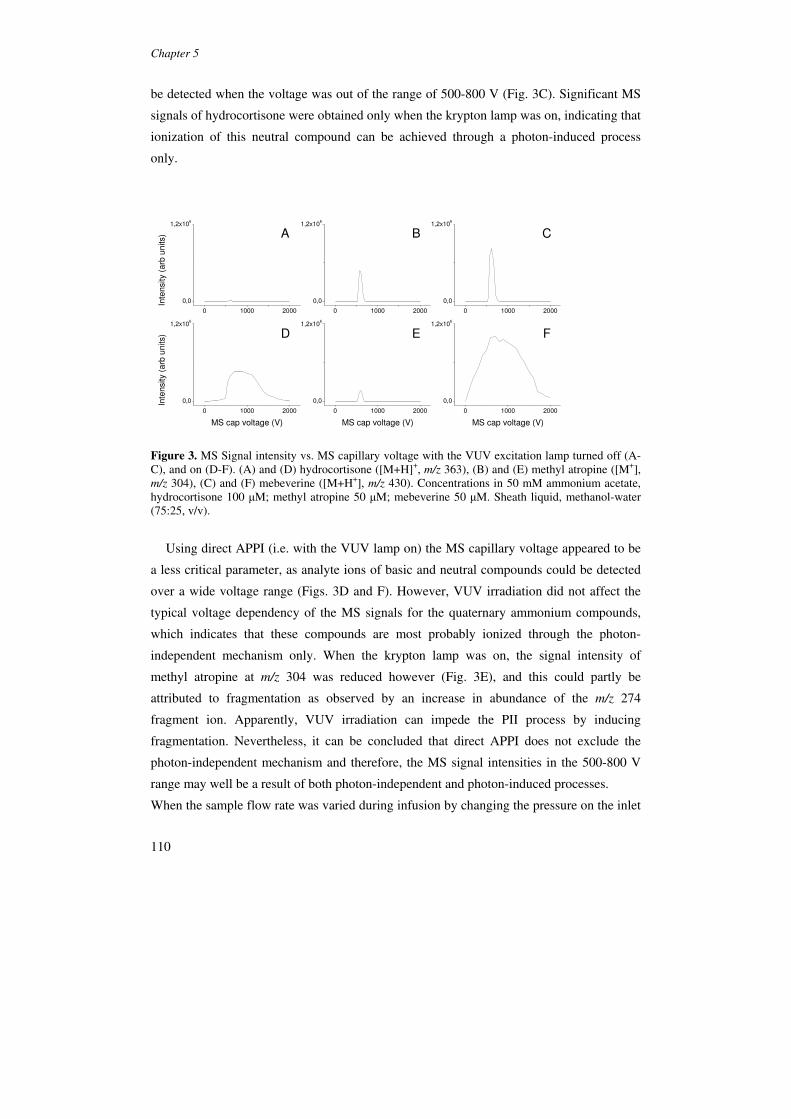
Chapter 5
110
be detected when the voltage was out of the range of 500-800 V (Fig. 3C). Significant MS
signals of hydrocortisone were obtained only when the krypton lamp was on, indicating that
ionization of this neutral compound can be achieved through a photon-induced process
only.
0 1000 2000
0,0
1,2x10⁶
0 1000 2000
0,0
1,2x10⁶
0 1000 2000
0,0
1,2x10⁶
0 1000 2000
0,0
1,2x10⁶
0 1000 2000
0,0
1,2x10⁶
0 1000 2000
0,0
1,2x10⁶
Inte
nsity (
arb
un
its) A B C
Inte
nsity (
arb
un
its)
MS cap voltage (V)
D
MS cap voltage (V)
E
MS cap voltage (V)
F
Figure 3. MS Signal intensity vs. MS capillary voltage with the VUV excitation lamp turned off (A-C), and on (D-F). (A) and (D) hydrocortisone ([M+H]+, m/z 363), (B) and (E) methyl atropine ([M+], m/z 304), (C) and (F) mebeverine ([M+H+], m/z 430). Concentrations in 50 mM ammonium acetate, hydrocortisone 100 µM; methyl atropine 50 µM; mebeverine 50 µM. Sheath liquid, methanol-water (75:25, v/v).
Using direct APPI (i.e. with the VUV lamp on) the MS capillary voltage appeared to be
a less critical parameter, as analyte ions of basic and neutral compounds could be detected
over a wide voltage range (Figs. 3D and F). However, VUV irradiation did not affect the
typical voltage dependency of the MS signals for the quaternary ammonium compounds,
which indicates that these compounds are most probably ionized through the photon-
independent mechanism only. When the krypton lamp was on, the signal intensity of
methyl atropine at m/z 304 was reduced however (Fig. 3E), and this could partly be
attributed to fragmentation as observed by an increase in abundance of the m/z 274
fragment ion. Apparently, VUV irradiation can impede the PII process by inducing
fragmentation. Nevertheless, it can be concluded that direct APPI does not exclude the
photon-independent mechanism and therefore, the MS signal intensities in the 500-800 V
range may well be a result of both photon-independent and photon-induced processes.
When the sample flow rate was varied during infusion by changing the pressure on the inlet

Photon-independent gas-phase-ion formation
111
vial, it was found that photoionization (PI) and PII show different flow dependencies. The
analyte signals resulting from PI appeared to be approximately linear with the applied
pressure on the inlet vial, whereas the analyte signals from PII did not significantly change
with increasing pressure. Nevertheless, the optimum MS capillary voltages of APPI and PII
appeared to be independent of the sample flow rate. As a consequence, changes in infusion
pressure may result in different relative sensitivities of APPI and PII, but do not affect the
position and shape of the curves shown in Fig 3.
3.2. Effect of dopant
Although the PhotoMate source generally yields good analyte responses in direct APPI,
previous studies have indicated that PI signals in CE–APPI-MS may be enhanced by the
addition of a dopant [13-15]. The signal intensity of mebeverine, hydrocortisone and
methyl atropine obtained by DA-APPI-MS using toluene as dopant was studied by infusion
experiments. Fig. 4 shows the MS voltage dependencies of MS signals obtained for the
three model compounds with the VUV lamp switched on.
0 1000 2000
0,0
1,2x10⁶
0 1000 2000
0,0
1,2x10⁶
0 1000 2000
0,0
1,2x10⁶
Inte
nsity
(arb
units)
MS cap voltage (V)
A
MS cap voltage (V)
B
MS cap voltage (V)
C
Figure 4. Signal intensity vs. MS capillary voltage in DA-APPI for (A) hydrocortisone ([M+H]+, m/z 363), (B) methyl atropine ([M+], m/z 304), (C) mebeverine ([M+H+], m/z 430). Concentrations, see Fig 3. Sheath liquid, methanol-water-toluene (75:25:5, v/v/v).
The compounds that are amenable to photoionization (hydrocortisone, mebeverine) were
still detected as protonated molecules only and highest DA-APPI-MS signals were obtained
when the MS capillary voltage was in the range of 1000-1200 V (Figs. 4A and C). With
such a voltage no contribution of PII to the MS signal will be expected. Indeed, in
optimized CZE–DA-APPI-MS experiments for basic compounds no signals were observed
when the VUV lamp was turned off [13,15]. Under the used DA-APPI-MS conditions (i.e.
with the VUV lamp on) neither methyl atropine (M+) nor any of its fragments could be
detected (Fig. 4B). When lower toluene concentrations (<1%) were used, very modest
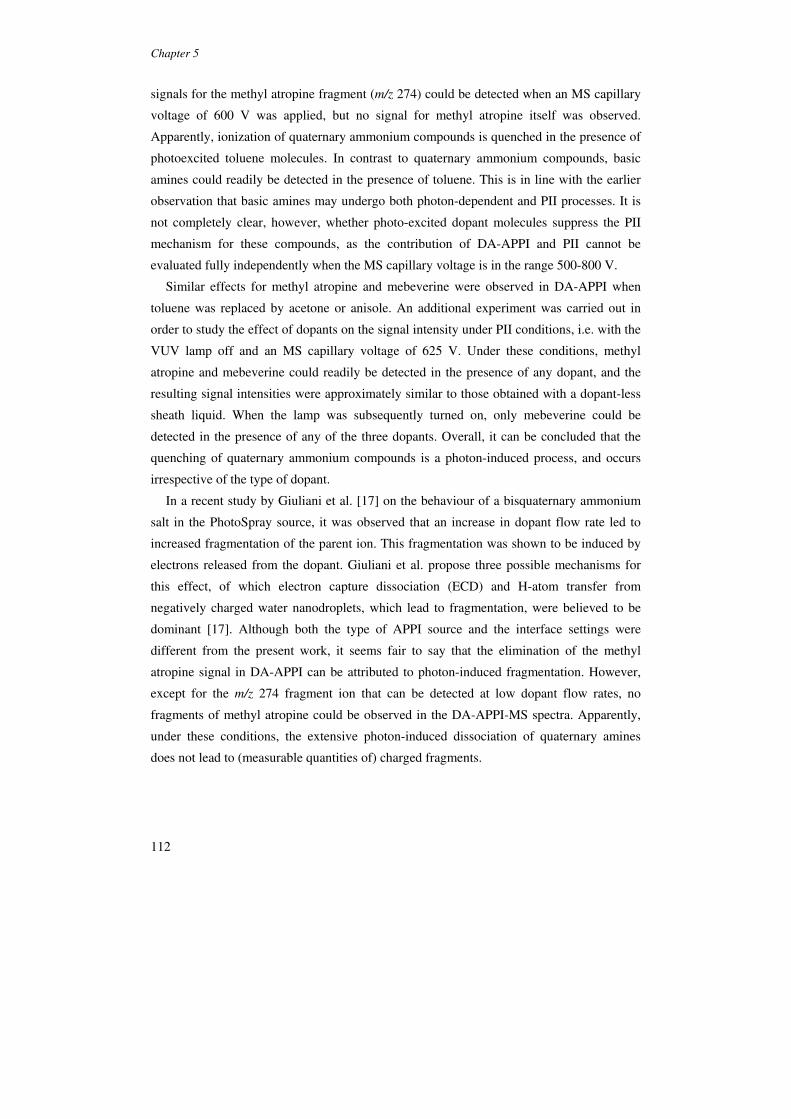
Chapter 5
112
signals for the methyl atropine fragment (m/z 274) could be detected when an MS capillary
voltage of 600 V was applied, but no signal for methyl atropine itself was observed.
Apparently, ionization of quaternary ammonium compounds is quenched in the presence of
photoexcited toluene molecules. In contrast to quaternary ammonium compounds, basic
amines could readily be detected in the presence of toluene. This is in line with the earlier
observation that basic amines may undergo both photon-dependent and PII processes. It is
not completely clear, however, whether photo-excited dopant molecules suppress the PII
mechanism for these compounds, as the contribution of DA-APPI and PII cannot be
evaluated fully independently when the MS capillary voltage is in the range 500-800 V.
Similar effects for methyl atropine and mebeverine were observed in DA-APPI when
toluene was replaced by acetone or anisole. An additional experiment was carried out in
order to study the effect of dopants on the signal intensity under PII conditions, i.e. with the
VUV lamp off and an MS capillary voltage of 625 V. Under these conditions, methyl
atropine and mebeverine could readily be detected in the presence of any dopant, and the
resulting signal intensities were approximately similar to those obtained with a dopant-less
sheath liquid. When the lamp was subsequently turned on, only mebeverine could be
detected in the presence of any of the three dopants. Overall, it can be concluded that the
quenching of quaternary ammonium compounds is a photon-induced process, and occurs
irrespective of the type of dopant.
In a recent study by Giuliani et al. [17] on the behaviour of a bisquaternary ammonium
salt in the PhotoSpray source, it was observed that an increase in dopant flow rate led to
increased fragmentation of the parent ion. This fragmentation was shown to be induced by
electrons released from the dopant. Giuliani et al. propose three possible mechanisms for
this effect, of which electron capture dissociation (ECD) and H-atom transfer from
negatively charged water nanodroplets, which lead to fragmentation, were believed to be
dominant [17]. Although both the type of APPI source and the interface settings were
different from the present work, it seems fair to say that the elimination of the methyl
atropine signal in DA-APPI can be attributed to photon-induced fragmentation. However,
except for the m/z 274 fragment ion that can be detected at low dopant flow rates, no
fragments of methyl atropine could be observed in the DA-APPI-MS spectra. Apparently,
under these conditions, the extensive photon-induced dissociation of quaternary amines
does not lead to (measurable quantities of) charged fragments.
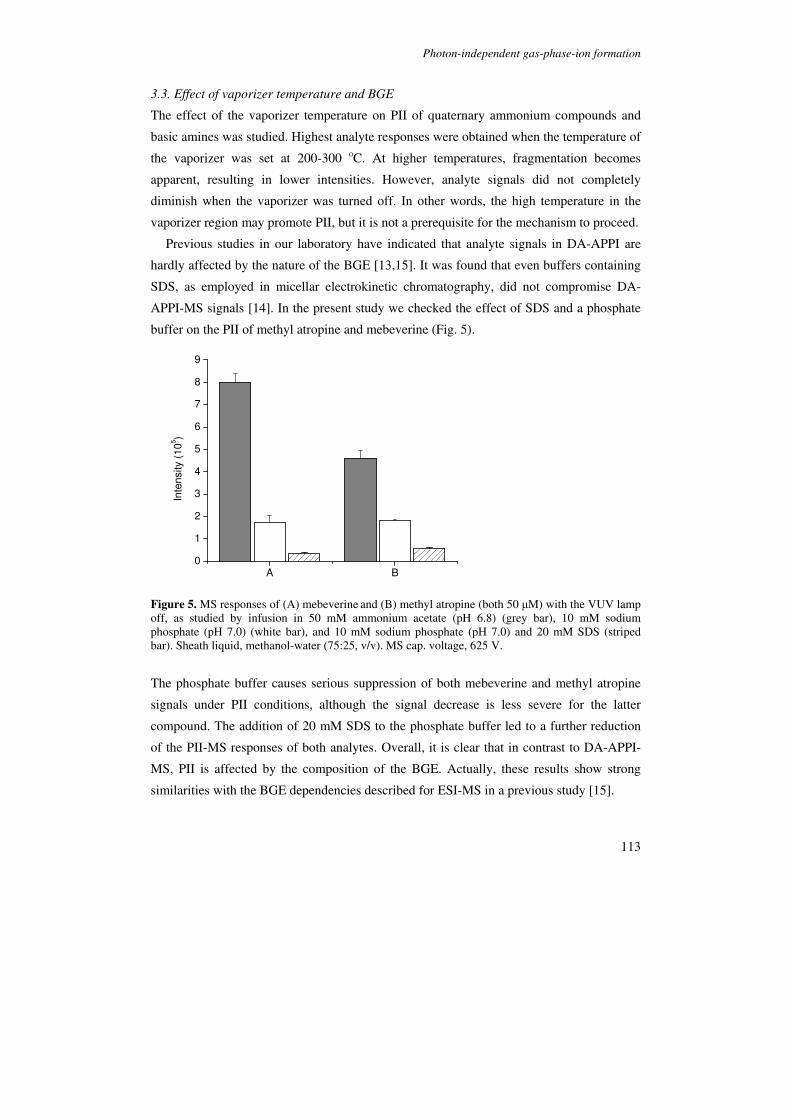
Photon-independent gas-phase-ion formation
113
3.3. Effect of vaporizer temperature and BGE
The effect of the vaporizer temperature on PII of quaternary ammonium compounds and
basic amines was studied. Highest analyte responses were obtained when the temperature of
the vaporizer was set at 200-300 oC. At higher temperatures, fragmentation becomes
apparent, resulting in lower intensities. However, analyte signals did not completely
diminish when the vaporizer was turned off. In other words, the high temperature in the
vaporizer region may promote PII, but it is not a prerequisite for the mechanism to proceed.
Previous studies in our laboratory have indicated that analyte signals in DA-APPI are
hardly affected by the nature of the BGE [13,15]. It was found that even buffers containing
SDS, as employed in micellar electrokinetic chromatography, did not compromise DA-
APPI-MS signals [14]. In the present study we checked the effect of SDS and a phosphate
buffer on the PII of methyl atropine and mebeverine (Fig. 5).
A B0
1
2
3
4
5
6
7
8
9
Inte
nsity (
10
5)
Figure 5. MS responses of (A) mebeverine and (B) methyl atropine (both 50 µM) with the VUV lamp off, as studied by infusion in 50 mM ammonium acetate (pH 6.8) (grey bar), 10 mM sodium phosphate (pH 7.0) (white bar), and 10 mM sodium phosphate (pH 7.0) and 20 mM SDS (striped bar). Sheath liquid, methanol-water (75:25, v/v). MS cap. voltage, 625 V.
The phosphate buffer causes serious suppression of both mebeverine and methyl atropine
signals under PII conditions, although the signal decrease is less severe for the latter
compound. The addition of 20 mM SDS to the phosphate buffer led to a further reduction
of the PII-MS responses of both analytes. Overall, it is clear that in contrast to DA-APPI-
MS, PII is affected by the composition of the BGE. Actually, these results show strong
similarities with the BGE dependencies described for ESI-MS in a previous study [15].
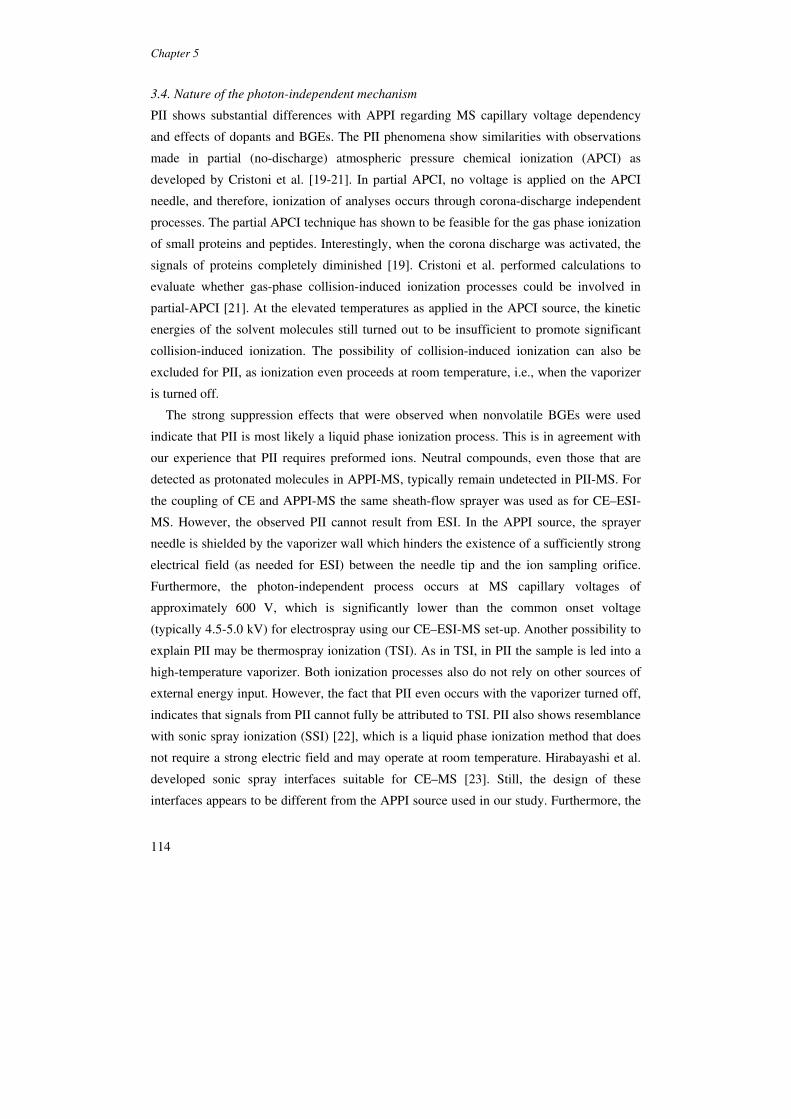
Chapter 5
114
3.4. Nature of the photon-independent mechanism
PII shows substantial differences with APPI regarding MS capillary voltage dependency
and effects of dopants and BGEs. The PII phenomena show similarities with observations
made in partial (no-discharge) atmospheric pressure chemical ionization (APCI) as
developed by Cristoni et al. [19-21]. In partial APCI, no voltage is applied on the APCI
needle, and therefore, ionization of analyses occurs through corona-discharge independent
processes. The partial APCI technique has shown to be feasible for the gas phase ionization
of small proteins and peptides. Interestingly, when the corona discharge was activated, the
signals of proteins completely diminished [19]. Cristoni et al. performed calculations to
evaluate whether gas-phase collision-induced ionization processes could be involved in
partial-APCI [21]. At the elevated temperatures as applied in the APCI source, the kinetic
energies of the solvent molecules still turned out to be insufficient to promote significant
collision-induced ionization. The possibility of collision-induced ionization can also be
excluded for PII, as ionization even proceeds at room temperature, i.e., when the vaporizer
is turned off.
The strong suppression effects that were observed when nonvolatile BGEs were used
indicate that PII is most likely a liquid phase ionization process. This is in agreement with
our experience that PII requires preformed ions. Neutral compounds, even those that are
detected as protonated molecules in APPI-MS, typically remain undetected in PII-MS. For
the coupling of CE and APPI-MS the same sheath-flow sprayer was used as for CE–ESI-
MS. However, the observed PII cannot result from ESI. In the APPI source, the sprayer
needle is shielded by the vaporizer wall which hinders the existence of a sufficiently strong
electrical field (as needed for ESI) between the needle tip and the ion sampling orifice.
Furthermore, the photon-independent process occurs at MS capillary voltages of
approximately 600 V, which is significantly lower than the common onset voltage
(typically 4.5-5.0 kV) for electrospray using our CE–ESI-MS set-up. Another possibility to
explain PII may be thermospray ionization (TSI). As in TSI, in PII the sample is led into a
high-temperature vaporizer. Both ionization processes also do not rely on other sources of
external energy input. However, the fact that PII even occurs with the vaporizer turned off,
indicates that signals from PII cannot fully be attributed to TSI. PII also shows resemblance
with sonic spray ionization (SSI) [22], which is a liquid phase ionization method that does
not require a strong electric field and may operate at room temperature. Hirabayashi et al.
developed sonic spray interfaces suitable for CE–MS [23]. Still, the design of these
interfaces appears to be different from the APPI source used in our study. Furthermore, the

Photon-independent gas-phase-ion formation
115
magnitude of the MS capillary voltage employed in SSI was less critical than in our PII set-
up.
At this moment we are not able to fully elucidate the PII process. However we presume
that PII starts with the formation of charged droplets in the region just after the capillary tip.
Subsequent steps in PII may be similar to other liquid phase ionization techniques,
involving droplet shrinkage, ion evaporation and/or charged residue mechanisms [24].
3.5. CZE–MS using PII
As the infusion experiments described above indicate, PII may be an alternative to DA-
APPI for the analysis of compounds that give preformed ions in solution. In order to
evaluate this, both DA-APPI and PII were employed in CZE–MS using a test mixture
comprising quaternary ammonium compounds (carbachol and methyl atropine), basic
amines (ephedrine and mebeverine) and a neutral compound (hydrocortisone). In DA-APPI
toluene was used as dopant and an MS capillary voltage of 1200 V was applied. For PII, the
krypton lamp was turned off, the MS capillary voltage was set at 600 V, and a dopant-free
sheath-liquid was used. Figs. 6A and B show the electropherograms of the test mixture
obtained by CZE–DA-APPI-MS and CZE–PII-MS, respectively, using a BGE of
ammonium acetate. As expected, DA-APPI allowed the analysis of the basic amines and
the steroid, but the quaternary ammonium compounds could not be detected. The photon-
independent mode, on the other hand, allowed analysis of all preformed ions, but failed to
detect the steroid. With the volatile BGE, the basic amines showed a somewhat (ephedrine)
or even seriously (mebeverine) lower response in DA-APPI than in PII. This is not in line
with the infusion experiments, which yielded similar signal intensities for mebeverine in
both PII and DA-APPI (Figs. 3C and 4C). Apparently, in comparison with the infusion
experiments, the conditions during CZE–MS were more favourable for PII than for DA-
APPI. This may partly be explained by the fact that the EOF observed during CZE–MS was
slightly lower than the sample flow rate employed during the infusion experiments.
Furthermore, as was outlined in a previous study [15], analyte ionization conditions in
CZE–MS differ from the conditions during infusion experiments, since the application of
separation voltage affects the ionic composition of the CE effluent.
Noise levels as determined from the XIC traces in Fig. 6 were also invariably higher in
DA-APPI than in PII. Overall, signal-to noise ratios (S/Ns) for the amines in PII were up to
a factor of ten higher than in DA-APPI. On the other hand, the DA-APPI mode appeared to
be the most suitable method for the analysis of the neutral compound.
Chapter 5
116
Fig. 3 predicts that there are conditions in which PII and direct APPI can proceed
simultaneously. Therefore, conditions were selected that could allow both PI and PII, that
is, the VUV excitation source was turned on, the MS capillary voltage was set at 600 V,
and no dopant was added to the sheath liquid (Fig. 6C). Using this method, all test
compounds could be analysed in a single run. The selected conditions appear to be quite
similar to those employed by Nilsson et al. when performing CZE–APPI-MS [12].
However, as Fig. 6 shows, these conditions are less suitable for hydrocortisone as the signal
of the m/z 363-trace is highly compromised in comparison with DA-APPI. Furthermore, it
should be noted that when a volatile BGE is used, highest signal intensities for amine
compounds are obtained when the krypton lamp is turned off, i.e. applying pure PII (Fig.
6). However, the PII method does not yield the BGE independent responses that are typical
for CZE–DA-APPI-MS.
0,0
7,5x10⁵
0,0
7,5x10⁵
0,0
7,5x10⁵
0,0
1,0x10⁶
0,0
1,0x10⁶
0,0
1,0x10⁶
0,0
1,8x10⁶
0,0
1,8x10⁶
0,0
1,8x10⁶
0,0
5,0x10⁵
0,0
2,3x10⁶
0,0
2,3x10⁶
0 2 4 6 8 10 12
0,0
5,0x10⁵
0 2 4 6 8 10 12
0,0
5,0x10⁵
0 2 4 6 8 10 12
0,0
5,0x10⁵
(C) PI + PII(B) PII
carbachol
(m/z 147)
ephedrine
(m/z 166)
Sig
na
l in
ten
sity
methyl atropine
(m/z 304)
mebeverine
(m/z 430)
Time (min) Time (min)
(A) DA-APPI
Time (min)
hydrocortisone
(m/z 363)
Figure 6. XIEs obtained by CZE–MS of a test mixture of carbachol (200 µM; m/z 147), ephedrine (200 µM; m/z 166), methyl atropine (40 µM; m/z 304), mebeverine (20 µM; m/z 430) and hydrocortisone (200 µM; m/z 363), using a background electrolyte of 50 mM ammonium acetate (pH 6.8). Interface conditions: (A) lamp on, MS capillary voltage: 1200V, sheath liquid: methanol-water-toluene-formic acid (75:25:5:0.1, v/v/v/v), (B) lamp off, MS capillary voltage: 600V, sheath liquid: methanol-water-formic acid (75:25:0.1, v/v/v), and (C) lamp on, further conditions as (B).
Photon-independent gas-phase-ion formation
117
The simultaneously occurring PI and PII essentially results in a mixed mode
ionization, in a way similar to dual sources as applied in LC–MS [25]. Indeed, also with
these sources the operation of two ionizers simultaneously may lead to mutual
interferences. For example, the ESI/APPI combi source showed the total suppression of
ions formed by ESI when the APPI source was switched on [25]. These interferences have
been attributed to the generation of radical cations and electrons by photoionization, which
leads to increased possibilities for ion-molecule reactions.
4. Conclusions
This study shows that analyte ionization in CE–APPI-MS may not only proceed through
photon-induced processes, but also by a mechanism that is not dependent on VUV
excitation. This photon-independent mechanism only occurs noticeably when the MS
capillary voltage is set within a narrow range around 600 V, whereas this parameter is less
critical in direct APPI or DA-APPI. Generally, in CZE–APPI-MS using a volatile BGE,
nonpolar compounds with low proton-affinity are most efficiently ionized by direct APPI or
DA-APPI, whereas for quaternary ammonium compounds and basic amines highest S/Ns
are obtained when the excitation source is turned off. Eventhough the optimal settings for
PII and direct APPI vary widely, in principle, both mechanisms can be combined in a single
CZE–APPI-MS run. Still, when the MS capillary voltage is lowered from 1200 to 600
volts, direct APPI-MS responses are often compromised. It may therefore be beneficial to
employ both PII and APPI by a rapid, continuous switching of the MS capillary voltage
between 600 and 1200 V. Such a mode of operation, however, is not (yet) supported by the
MS software of our equipment.
Although the exact PII mechanism has not been revealed, it can be concluded that
several characteristics, such as selectivity, BGE and temperature dependency, show
similarities with common liquid phase ionization techniques. Therefore we assume PII to be
initiated by charged droplet formation, followed by droplet shrinkage, ion evaporation
and/or charged residue mechanisms. This would imply that the gas phase ion formation by
PII already takes place inside the vaporizer and not in the vicinity of the VUV beam.
The favourable S/N ratios obtained with PII-MS for polar compounds offer some
attractive perspectives for further research. Currently we are investigating the usefulness of
CZE–PII-MS for the analysis of pharmaceutical samples, and at the same time, aim to gain
further insight into the PII mechanism.
Chapter 5
118
So far, the coupling of CE with APPI-MS has only been carried out using the PhotoMate
ion source. The question arises whether PII is also manifest in the PhotoSpray source.
Recent infusion experiments by Giuliani et al. [17] with a bisquaternary ammonium salt,
indeed indicated that these phenomena can be observed with the PhotoSpray source.
However, in LC–MS, the PhotoSpray source requires the use of a dopant which seems to
indicate that under these conditions the photon-independent mechanism is at least less
efficient than DA-APPI. Still, it would be interesting to study PII in CE–MS with the
PhotoSpray source, as several critical variables (flow rates, sprayer design) may be more
favourable than in LC–MS.
Acknowledgement
This study was financially supported by AstraZeneca, Global PR&D, External Science
Group (Macclesfield, UK). We thank Dr. Gerard P. Rozing of Agilent Technologies
(Waldbronn, Germany) for the loan of the APPI source.
References
1 P. Schmitt-Kopplin, M. Frommberger, Electrophoresis 2003, 24, 3837.
2 P. Schmitt-Kopplin, M. Engelmann, Electrophoresis 2005, 26, 1209.
3 E. Dabek-Zlotorzynska, H. Chen, L. Ding, Electrophoresis 2003, 24, 4128.
4 M. Moini, Anal. Bionanal. Chem. 2002, 373, 466.
5 W.F. Smyth, Electrophoresis 2006, 27, 2051.
6 D.B. Robb, T.R. Covey, A.P. Bruins, Anal. Chem. 2000, 72, 3653.
7 T.J. Kauppila, T. Kuuranne, E.C. Meurer, M.N. Eberlin, T. Kotiaho, R. Kostiainen,
Anal. Chem. 2002, 74, 5470.
8 J.A. Syage, J. Am. Soc. Mass Spectrom. 2004, 15, 1521.
9 D.B. Robb, A.P. Bruins, Patent No. WO0133605, 2001.
10 J.A. Syage, M.D. Evans, K.A. Hanold, Am. Lab. 2000, 32, 24.
11 J.A. Syage, K.A. Hanold, M.D. Evans, Y. Liu. Patent No. WO0197252, 2001.
12 S.L. Nilsson, C. Andersson, P.J.R. Sjöberg, D. Bylund, P. Petersson, M. Jörntén-
Karlsson, K.E. Markides, Rapid Commun. Mass Spectrom. 2003, 17, 2267.
13 R. Mol, G.J. De Jong, G.W. Somsen, Electrophoresis 2005, 26, 146.
Photon-independent gas-phase-ion formation
119
14 R. Mol, G.J. De Jong, G.W. Somsen, Anal. Chem. 2005, 77, 5277.
15 P. Hommerson, A.M. Khan, G.J. De Jong, G.W. Somsen, Electrophoresis 2007, 28,
1444.
16 A. Delobel, F. Halgand, B. Laffranchise-Gosse, H. Snijders, O. Laprévote, O. Anal.
Chem. 2003, 75, 5961.
17 A. Giuliani, D. Debois, O. Laprévote, Eur. J. Mass Spectrom. 2006, 12, 189.
18 J.R. Catai, J. Sastre-Toraño, G.J. De Jong, G.W. Somsen, Electrophoresis 2006, 27,
2091.
19 S. Cristoni, L.R. Bernardi, I. Biunno, F. Guidugli, Rapid Commun. Mass Spectrom.
2002, 16, 1153.
20 S. Cristoni, L.R. Bernardi, I. Biunno, F. Guidugli, Rapid Commun. Mass Spectrom.
2002, 16, 1686.
21 S. Cristoni, L.R. Bernardi, F. Guidugli, M. Tubaro, P. Traldi, J. Mass Spectrom. 2005,
40, 1550.
22 A. Hirabayashi, M. Sakairi, H. Koizumi, Anal. Chem. 1994, 66, 4557.
23 Y. Hirabayashi, A. Hirabayashi, H. Koizumi, Rapid Commun. Mass Spectrom. 1999,
13, 712.
24 N.B. Cech, C.G. Enke, Mass Spectrom. Rev. 2001, 20, 362.
25 J.A. Syage, K.A. Hanold, T.C. Lynn, J.A. Horner, R.A. Thakur, J. Chromatogr., A
2004, 1050, 137.

120

121
Chapter 6
Capillary electrophoresis-atmospheric pressure
chemical ionization mass spectrometry
using an orthogonal interface:
set-up and system parameters
P. Hommerson, A. M. Khan, G. J. de Jong, G. W. Somsen,
J. Am. Soc. Mass Spectrom. 2009, in press
Chapter 6
122
Summary
The feasibility of atmospheric pressure chemical ionization (APCI) as an alternative
ionization technique for capillary electrophoresis-mass spectrometry (CE-MS) was
investigated using a grounded sheath-flow CE-MS sprayer and an orthogonal APCI source.
Infusion experiments indicated that highest analyte signals were achieved when the sprayer
tip was in close vicinity of the vaporizer entrance. The APCI-MS set-up enabled detection
of basic, neutral, and acidic compounds, whereas apolar and ionic compounds could not be
detected. In the positive ion mode, analytes could be detected in the entire transfer voltage
range (0-5 kV), whereas highest signal intensities were observed when the corona discharge
current was between 1000 and 2000 nA. In the negative ion mode, the transfer voltage
typically was 500 V and the optimum corona discharge current was 6000 nA. Analyte
signals raised with increasing nebulizing gas pressure, but the pressure was limited to 25 psi
to avoid siphoning and current drops. Signal intensities appeared to be optimal and constant
over a wide range of sheath liquid flow rate (5-25 µL/min) and vaporizer temperature (200-
350 °C). APCI-MS signals were unaffected by the composition of the background
electrolyte (BGE), even when it contained sodium phosphate and sodium dodecyl sulfate
(SDS). Consequently, BGE composition, sheath-liquid flow rate and vaporizer temperature,
can be optimized with respect to the CE separation without affecting the APCI-MS
response. The analysis of a mixture of basic compounds and a steroid using volatile and
nonvolatile BGEs further demonstrates the feasibility of CE-APCI-MS. Detection limits
(S/N=3) were 1.6-10 µM injected concentrations.

Coupling of CE and APCI-MS
123
1. Introduction
Since its introduction in 1987 [1], capillary electrophoresis-mass spectrometry (CE-MS)
has evolved into a powerful combination, which is now routinely applied for a number of
analytical tasks. The coupling of CE and MS has predominantly been achieved using
electrospray ionization (ESI)-based interfaces. This is because CE is commonly applied to
compounds that are charged in solution, and, therefore, inherently suited to ESI-MS. Still,
ESI-MS entails a number of limitations. First, the ESI process is very susceptible for
nonvolatile background electrolytes (BGEs) and constituents, and this restricts the choice of
BGEs amenable to CE-MS. Second, effective ESI is limited to relatively polar compounds,
and may therefore not be a suitable option when neutral and/or less polar compounds are to
be analyzed. In an attempt to overcome these limitations, only few studies explored the
potential of alternative ionization techniques for CE-MS, such as atmospheric pressure
chemical ionization (APCI) [2-5], and more recently, atmospheric pressure photoionization
(APPI) [6-9]. Owing to its capability to form both even and odd-electron ions, the latter
technique was found suitable for ionization of both polar and apolar compounds.
Furthermore, APPI appeared to be unaffected by the BGE composition, and even enabled
the coupling of micellar electrokinetic chromatography (MEKC) and microemulsion
electrokinetic chromatography (MEEKC) with MS [10,11].
APCI is another ionization technique in which analyte ionization occurs through gas-
phase ion-molecule reactions. In LC-MS, APCI is routinely used and regarded a strong
alternative for ESI. The use of APCI in CE-MS, however, has been limited to a few
explorative studies only. The possibility of CE-APCI-MS was indicated by Takada et al.
[2], who employed a laboratory-made sheath-flow sprayer in combination with a
commercially available APCI source. The signal intensity of the model compound caffeine
was hardly affected when using a sodium phosphate BGE. However, the caffeine
concentration (1 mM) was not representative for most analytical tasks. Muijselaar et al. [3]
evaluated APCI as a part of a study on partial-filling MEKC-MS. For caffeine and
ethenzamide concentrations of 0.5 mg/mL detectable signals were obtained. In a follow-up
study by Isoo et al. [4], initial sample concentrations (100-1000 µg/mL) were also high, but
a 100-600 fold enhancement in sensitivity was achieved using on-line sample
concentration. In these preliminary studies, the nebulization of the CE effluent and sheath
liquid relied on electrospray only, and probably efficient analyte introduction and/or
transfer through the vaporizer was not achieved. Tanaka et al. [5] improved the CE-APCI-
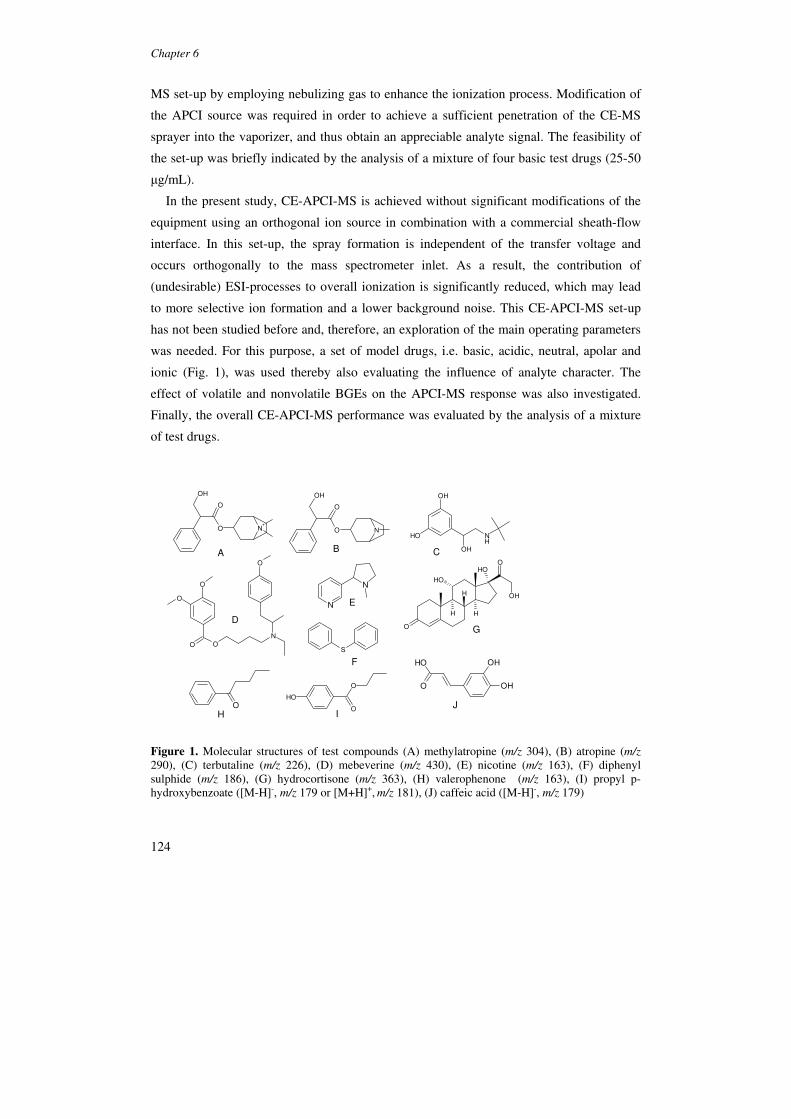
Chapter 6
124
MS set-up by employing nebulizing gas to enhance the ionization process. Modification of
the APCI source was required in order to achieve a sufficient penetration of the CE-MS
sprayer into the vaporizer, and thus obtain an appreciable analyte signal. The feasibility of
the set-up was briefly indicated by the analysis of a mixture of four basic test drugs (25-50
µg/mL).
In the present study, CE-APCI-MS is achieved without significant modifications of the
equipment using an orthogonal ion source in combination with a commercial sheath-flow
interface. In this set-up, the spray formation is independent of the transfer voltage and
occurs orthogonally to the mass spectrometer inlet. As a result, the contribution of
(undesirable) ESI-processes to overall ionization is significantly reduced, which may lead
to more selective ion formation and a lower background noise. This CE-APCI-MS set-up
has not been studied before and, therefore, an exploration of the main operating parameters
was needed. For this purpose, a set of model drugs, i.e. basic, acidic, neutral, apolar and
ionic (Fig. 1), was used thereby also evaluating the influence of analyte character. The
effect of volatile and nonvolatile BGEs on the APCI-MS response was also investigated.
Finally, the overall CE-APCI-MS performance was evaluated by the analysis of a mixture
of test drugs.
N+
OH
O
O
OH
OH
OH
NH
O
H
O
OH
OH
HH
OH
S
OH
O
O
O
O
O
O O
N
O
N
OH
O
O
B
OH
OH
OH
O
N
N
A C
D
E
F
G
H IJ
Figure 1. Molecular structures of test compounds (A) methylatropine (m/z 304), (B) atropine (m/z 290), (C) terbutaline (m/z 226), (D) mebeverine (m/z 430), (E) nicotine (m/z 163), (F) diphenyl sulphide (m/z 186), (G) hydrocortisone (m/z 363), (H) valerophenone (m/z 163), (I) propyl p-hydroxybenzoate ([M-H]-, m/z 179 or [M+H]+, m/z 181), (J) caffeic acid ([M-H]-, m/z 179)
Coupling of CE and APCI-MS
125
2. Experimental
2.1. Chemicals and materials
Sodium dihydrogen phosphate, disodium hydrogen phosphate, sodium dodecyl sulfate
(SDS), sodium hydroxide, ammonium acetate and ammonia solution (25%) were supplied
by Merck (Darmstadt, Germany). Formic acid, terbutaline, atropine, nicotine, caffeic acid
and diphenyl sulfide were purchased from Sigma-Aldrich (Zwijndrecht, The Netherlands).
Methanol was from Biosolve (Valkenswaard, The Netherlands). Mebeverine was obtained
from Solvay Pharmaceuticals (Weesp, The Netherlands). Methyl atropine, hydrocortisone
and propyl p-hydroxybenzoate (POB) were from Fagron (Nieuwerkerk a/d IJssel, The
Netherlands). Ultrapure water was obtained from a Synergy UV water system from
Millipore (Molsheim, France). Fused-silica capillaries were from BGB Analytik (Boekten,
Switzerland).
For the infusion experiments, a solution of diphenyl sulphide was prepared in methanol,
whereas solutions of the other test compounds were prepared in water, in 50 mM
ammonium acetate (pH 6.8), in 10 mM sodium phosphate (pH 7.5), and in 10 mM sodium
phosphate (pH 7.5) containing 20 mM of SDS. Test compound concentrations were 100
µM, except for mebeverine (50 µM). The sodium phosphate BGE (pH 7.5) was prepared by
mixing 10 mM sodium dihydrogen phosphate with 10 mM disodium hydrogen phosphate to
the proper pH.
For the CE-APCI-MS experiments, a test mixture of nicotine, atropine, terbutaline,
hydrocortisone (each 100 µM) and mebeverine (50 µM) was prepared in water and
analysed using BGEs of ammonium formate (pH 4.0) and sodium sodium phosphate (pH
3.0). The BGE of ammonium formate was prepared by adjusting 15-mM formic acid with 1
M ammonium hydroxide to pH 4.0. The sodium phosphate BGE was prepared by mixing
10 mM phosphoric acid with 10 mM sodium dihydrogen phosphate to achieve pH 3.0. The
composition of the sheath liquid was methanol-water-formic acid (75:25:0.1, v/v/v), unless
stated otherwise.
2.2. CE system
CE was performed using a PrinCE CE system (Prince Technologies, Emmen, The
Netherlands) with a fused-silica capillary of 50 µm ID and a length of 90 cm. The
capillaries were flushed at 1500 mbar with 1 M sodium hydroxide (10 min) and water (10
min) prior to use. During infusion experiments, the analyte solution under study was
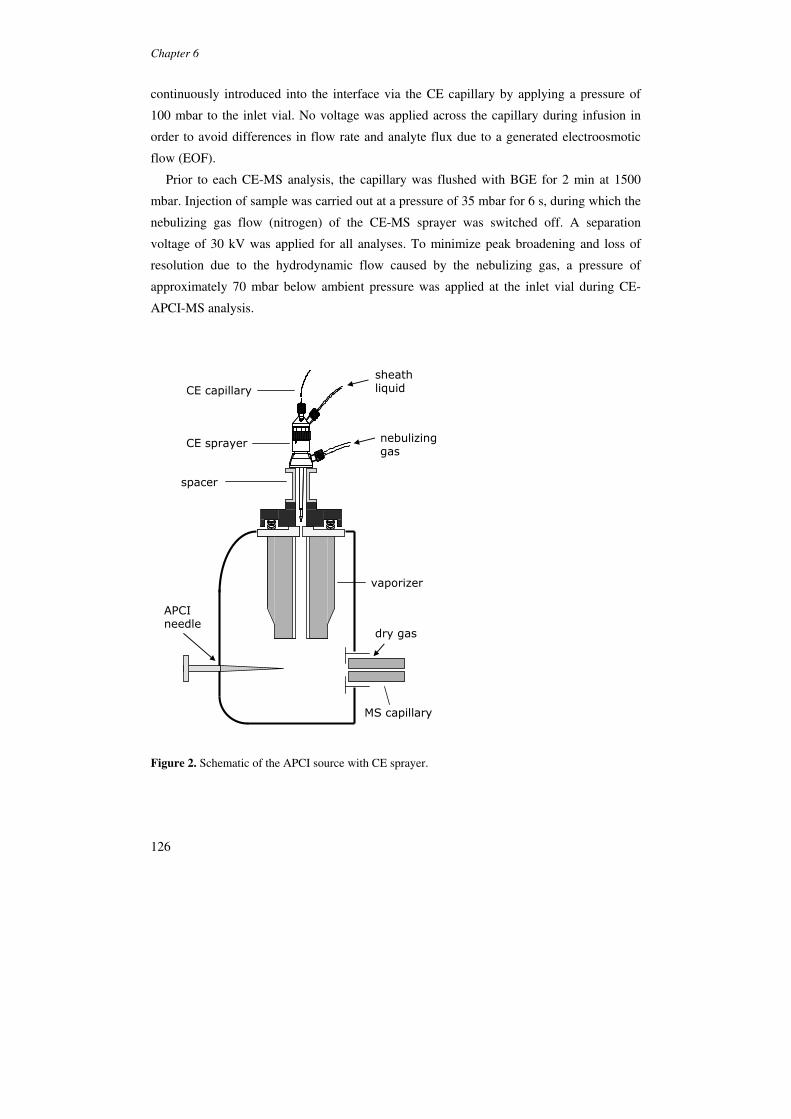
Chapter 6
126
continuously introduced into the interface via the CE capillary by applying a pressure of
100 mbar to the inlet vial. No voltage was applied across the capillary during infusion in
order to avoid differences in flow rate and analyte flux due to a generated electroosmotic
flow (EOF).
Prior to each CE-MS analysis, the capillary was flushed with BGE for 2 min at 1500
mbar. Injection of sample was carried out at a pressure of 35 mbar for 6 s, during which the
nebulizing gas flow (nitrogen) of the CE-MS sprayer was switched off. A separation
voltage of 30 kV was applied for all analyses. To minimize peak broadening and loss of
resolution due to the hydrodynamic flow caused by the nebulizing gas, a pressure of
approximately 70 mbar below ambient pressure was applied at the inlet vial during CE-
APCI-MS analysis.
CE sprayer
MS capillary
vaporizer
spacer
APCI needle
nebulizinggas
dry gas
sheath liquidCE capillary
Figure 2. Schematic of the APCI source with CE sprayer.
Coupling of CE and APCI-MS
127
2.3. MS system
The CE system was coupled to an Agilent Technologies 1100 Series LC/MSD SL ion trap
mass spectrometer (Waldbronn, Germany) equipped with an Agilent APCI source (Fig. 2).
The coupling of CE with APCI-MS was achieved through a coaxial sheath-flow CE-MS
sprayer from Agilent Technologies. The sprayer was mounted on a plastic spacer with a
length of 36 mm, which was subsequently positioned on the APCI source. An electric wire
grounded the sprayer to ensure a functional electrical circuit for CE. The CE system was
positioned such that the capillary inlet was at the same height as the tip of the sprayer
needle in order to avoid siphoning effects.
During this study, the corona current was varied over the range of 0-5,000 nA and 0-
10,000 nA in the positive and negative ion mode, respectively. Using either mode, the
transfer voltage (i.e. the voltage on the ion sampling orifice) was studied between 0 and
5,000 V. The effect of the vaporizer temperature was examined over the range of 200-325
°C, and the sheath-liquid flow rate between 1.7 and 25 µL/min. The drying gas temperature
and flow rate were set at 300 °C and 5 L/min, respectively. The MS instrument was
operated in positive ion mode with a scan range of 100-500 m/z, unless stated otherwise. To
avoid overloading of the ion trap, the ion-charge-control option was enabled.
3. Results and Discussion
3.1. Set-up
In the Agilent APCI source, the sprayer and vaporizer are aligned in such a way that the
spray formation occurs orthogonally to the MS inlet. The corona-discharge needle is
positioned perpendicular to the vaporizer and in-line with the MS entrance (Fig. 2). The
coupling of CE with APCI-MS was achieved with a sheath-flow CE-MS sprayer which is
originally designed for CE-ESI-MS. Since the APCI source is normally used in
combination with a shorter, dedicated LC-APCI-MS sprayer, plastic spacers (36-41 mm)
were used to fit the longer CE-MS sprayer on the APCI source. To ensure a closed
electrical CE circuit, an electrical wire was used to connect the CE sprayer with the ground
of the CE instrument. During the initial infusion experiments, it was observed that higher
analyte signal intensities were obtained when the sprayer tip was positioned as close as
possible to the vaporizer entrance, i.e., using a short spacer. This phenomenon has also been
observed in CE-APPI-MS studies with the Agilent PhotoMate APPI source [6,7], which has
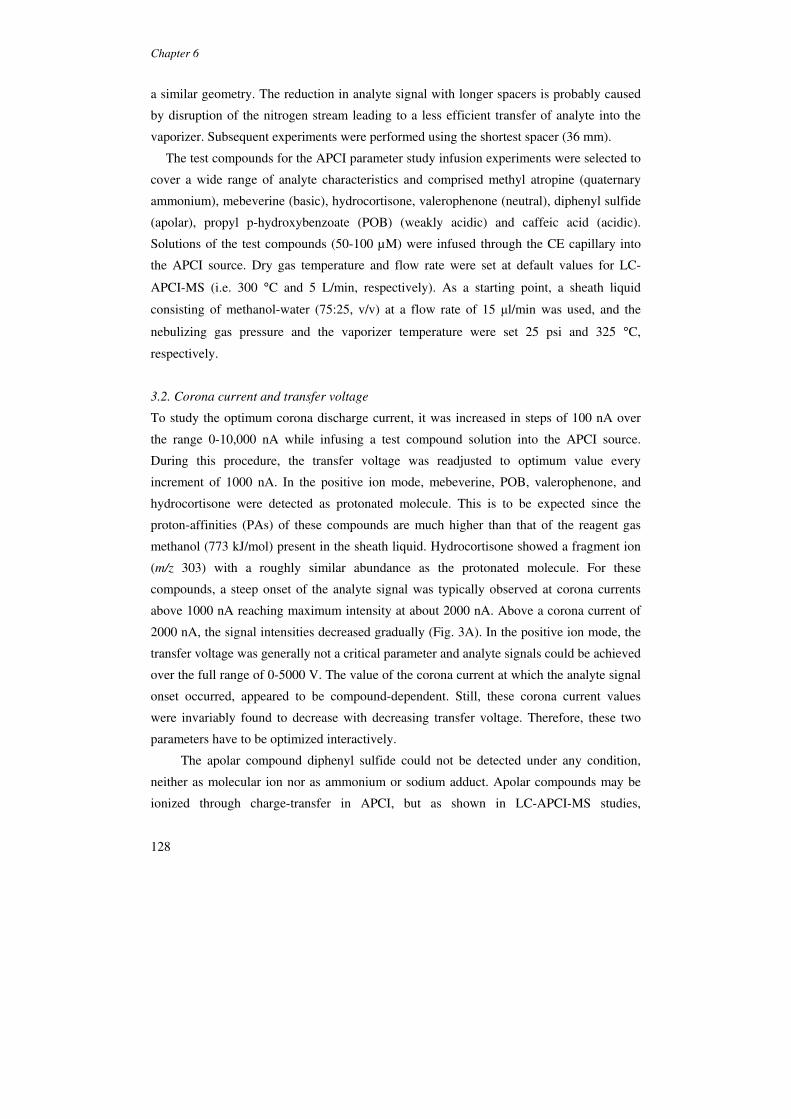
Chapter 6
128
a similar geometry. The reduction in analyte signal with longer spacers is probably caused
by disruption of the nitrogen stream leading to a less efficient transfer of analyte into the
vaporizer. Subsequent experiments were performed using the shortest spacer (36 mm).
The test compounds for the APCI parameter study infusion experiments were selected to
cover a wide range of analyte characteristics and comprised methyl atropine (quaternary
ammonium), mebeverine (basic), hydrocortisone, valerophenone (neutral), diphenyl sulfide
(apolar), propyl p-hydroxybenzoate (POB) (weakly acidic) and caffeic acid (acidic).
Solutions of the test compounds (50-100 µM) were infused through the CE capillary into
the APCI source. Dry gas temperature and flow rate were set at default values for LC-
APCI-MS (i.e. 300 °C and 5 L/min, respectively). As a starting point, a sheath liquid
consisting of methanol-water (75:25, v/v) at a flow rate of 15 µl/min was used, and the
nebulizing gas pressure and the vaporizer temperature were set 25 psi and 325 °C,
respectively.
3.2. Corona current and transfer voltage
To study the optimum corona discharge current, it was increased in steps of 100 nA over
the range 0-10,000 nA while infusing a test compound solution into the APCI source.
During this procedure, the transfer voltage was readjusted to optimum value every
increment of 1000 nA. In the positive ion mode, mebeverine, POB, valerophenone, and
hydrocortisone were detected as protonated molecule. This is to be expected since the
proton-affinities (PAs) of these compounds are much higher than that of the reagent gas
methanol (773 kJ/mol) present in the sheath liquid. Hydrocortisone showed a fragment ion
(m/z 303) with a roughly similar abundance as the protonated molecule. For these
compounds, a steep onset of the analyte signal was typically observed at corona currents
above 1000 nA reaching maximum intensity at about 2000 nA. Above a corona current of
2000 nA, the signal intensities decreased gradually (Fig. 3A). In the positive ion mode, the
transfer voltage was generally not a critical parameter and analyte signals could be achieved
over the full range of 0-5000 V. The value of the corona current at which the analyte signal
onset occurred, appeared to be compound-dependent. Still, these corona current values
were invariably found to decrease with decreasing transfer voltage. Therefore, these two
parameters have to be optimized interactively.
The apolar compound diphenyl sulfide could not be detected under any condition,
neither as molecular ion nor as ammonium or sodium adduct. Apolar compounds may be
ionized through charge-transfer in APCI, but as shown in LC-APCI-MS studies,
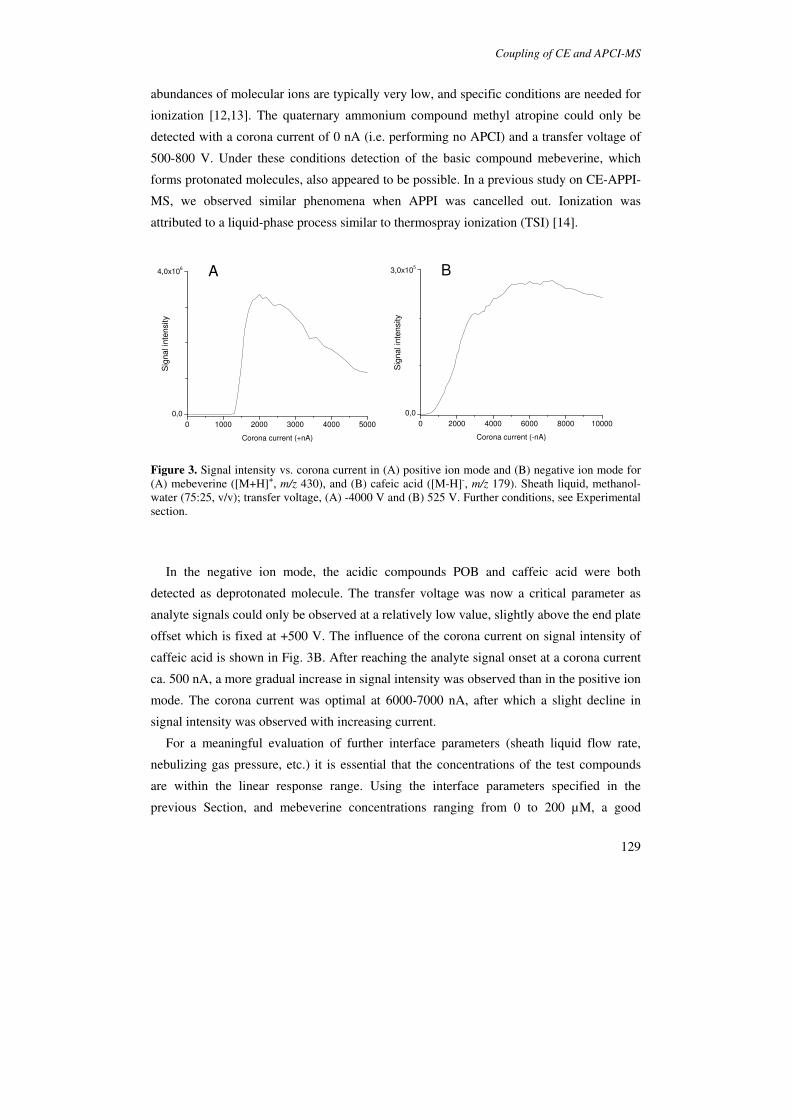
Coupling of CE and APCI-MS
129
abundances of molecular ions are typically very low, and specific conditions are needed for
ionization [12,13]. The quaternary ammonium compound methyl atropine could only be
detected with a corona current of 0 nA (i.e. performing no APCI) and a transfer voltage of
500-800 V. Under these conditions detection of the basic compound mebeverine, which
forms protonated molecules, also appeared to be possible. In a previous study on CE-APPI-
MS, we observed similar phenomena when APPI was cancelled out. Ionization was
attributed to a liquid-phase process similar to thermospray ionization (TSI) [14].
0 1000 2000 3000 4000 5000
0,0
4,0x10⁶
Sig
nal in
tensity
Corona current (+nA)
A
0 2000 4000 6000 8000 10000
0,0
3,0x10⁵ B
Sig
nal in
ten
sity
Corona current (-nA)
Figure 3. Signal intensity vs. corona current in (A) positive ion mode and (B) negative ion mode for (A) mebeverine ([M+H]+, m/z 430), and (B) cafeic acid ([M-H]-, m/z 179). Sheath liquid, methanol-water (75:25, v/v); transfer voltage, (A) -4000 V and (B) 525 V. Further conditions, see Experimental section.
In the negative ion mode, the acidic compounds POB and caffeic acid were both
detected as deprotonated molecule. The transfer voltage was now a critical parameter as
analyte signals could only be observed at a relatively low value, slightly above the end plate
offset which is fixed at +500 V. The influence of the corona current on signal intensity of
caffeic acid is shown in Fig. 3B. After reaching the analyte signal onset at a corona current
ca. 500 nA, a more gradual increase in signal intensity was observed than in the positive ion
mode. The corona current was optimal at 6000-7000 nA, after which a slight decline in
signal intensity was observed with increasing current.
For a meaningful evaluation of further interface parameters (sheath liquid flow rate,
nebulizing gas pressure, etc.) it is essential that the concentrations of the test compounds
are within the linear response range. Using the interface parameters specified in the
previous Section, and mebeverine concentrations ranging from 0 to 200 µM, a good
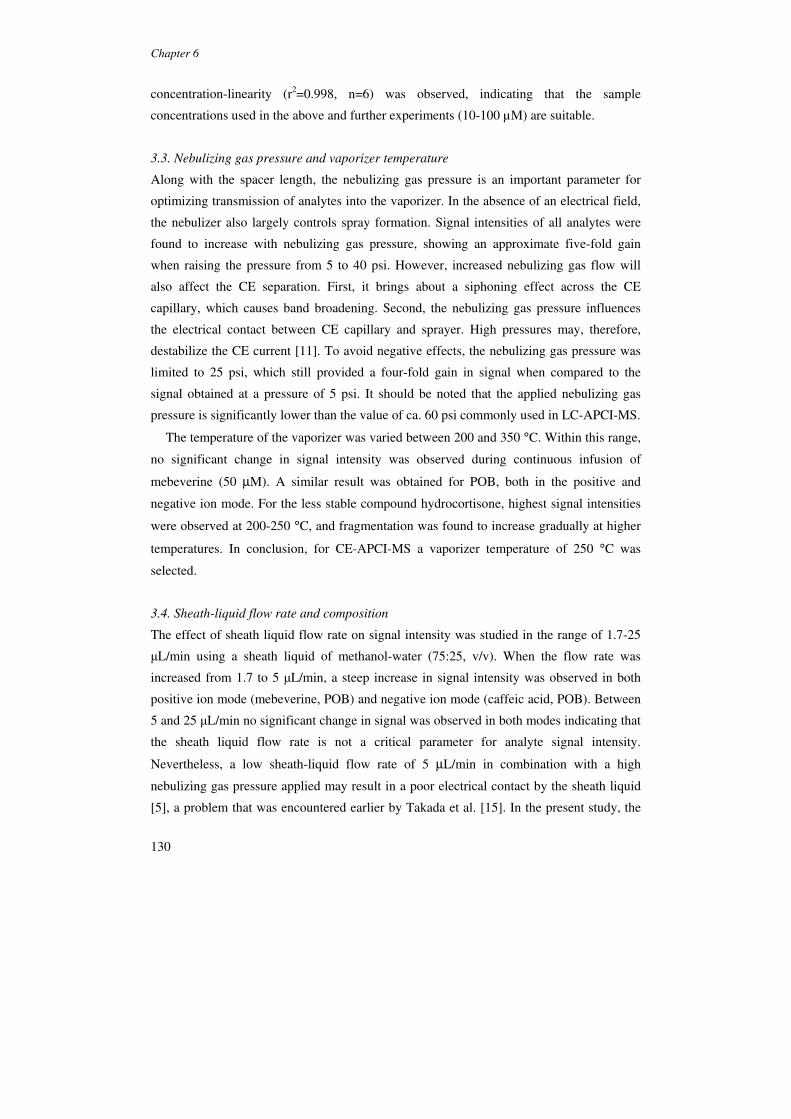
Chapter 6
130
concentration-linearity (r2=0.998, n=6) was observed, indicating that the sample
concentrations used in the above and further experiments (10-100 µM) are suitable.
3.3. Nebulizing gas pressure and vaporizer temperature
Along with the spacer length, the nebulizing gas pressure is an important parameter for
optimizing transmission of analytes into the vaporizer. In the absence of an electrical field,
the nebulizer also largely controls spray formation. Signal intensities of all analytes were
found to increase with nebulizing gas pressure, showing an approximate five-fold gain
when raising the pressure from 5 to 40 psi. However, increased nebulizing gas flow will
also affect the CE separation. First, it brings about a siphoning effect across the CE
capillary, which causes band broadening. Second, the nebulizing gas pressure influences
the electrical contact between CE capillary and sprayer. High pressures may, therefore,
destabilize the CE current [11]. To avoid negative effects, the nebulizing gas pressure was
limited to 25 psi, which still provided a four-fold gain in signal when compared to the
signal obtained at a pressure of 5 psi. It should be noted that the applied nebulizing gas
pressure is significantly lower than the value of ca. 60 psi commonly used in LC-APCI-MS.
The temperature of the vaporizer was varied between 200 and 350 °C. Within this range,
no significant change in signal intensity was observed during continuous infusion of
mebeverine (50 µM). A similar result was obtained for POB, both in the positive and
negative ion mode. For the less stable compound hydrocortisone, highest signal intensities
were observed at 200-250 °C, and fragmentation was found to increase gradually at higher
temperatures. In conclusion, for CE-APCI-MS a vaporizer temperature of 250 °C was
selected.
3.4. Sheath-liquid flow rate and composition
The effect of sheath liquid flow rate on signal intensity was studied in the range of 1.7-25
µL/min using a sheath liquid of methanol-water (75:25, v/v). When the flow rate was
increased from 1.7 to 5 µL/min, a steep increase in signal intensity was observed in both
positive ion mode (mebeverine, POB) and negative ion mode (caffeic acid, POB). Between
5 and 25 µL/min no significant change in signal was observed in both modes indicating that
the sheath liquid flow rate is not a critical parameter for analyte signal intensity.
Nevertheless, a low sheath-liquid flow rate of 5 µL/min in combination with a high
nebulizing gas pressure applied may result in a poor electrical contact by the sheath liquid
[5], a problem that was encountered earlier by Takada et al. [15]. In the present study, the
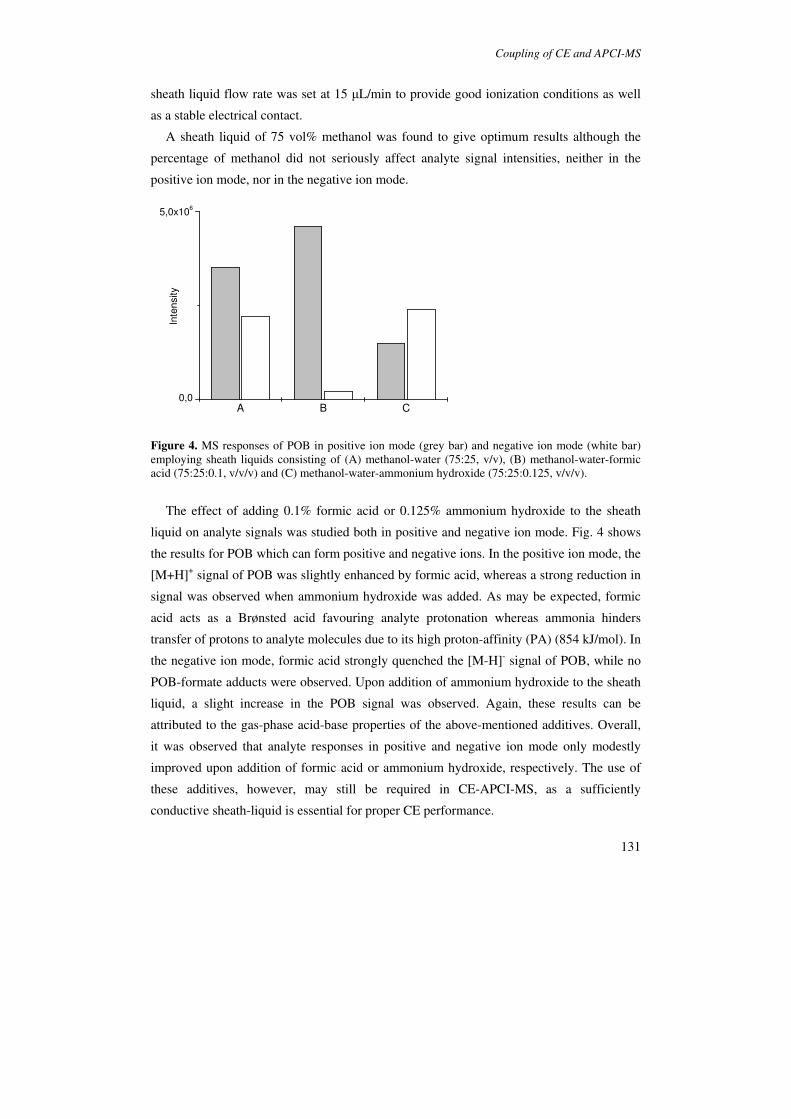
Coupling of CE and APCI-MS
131
sheath liquid flow rate was set at 15 µL/min to provide good ionization conditions as well
as a stable electrical contact.
A sheath liquid of 75 vol% methanol was found to give optimum results although the
percentage of methanol did not seriously affect analyte signal intensities, neither in the
positive ion mode, nor in the negative ion mode.
A B C0,0
5,0x10⁶
Inte
nsity
Figure 4. MS responses of POB in positive ion mode (grey bar) and negative ion mode (white bar) employing sheath liquids consisting of (A) methanol-water (75:25, v/v), (B) methanol-water-formic acid (75:25:0.1, v/v/v) and (C) methanol-water-ammonium hydroxide (75:25:0.125, v/v/v).
The effect of adding 0.1% formic acid or 0.125% ammonium hydroxide to the sheath
liquid on analyte signals was studied both in positive and negative ion mode. Fig. 4 shows
the results for POB which can form positive and negative ions. In the positive ion mode, the
[M+H]+ signal of POB was slightly enhanced by formic acid, whereas a strong reduction in
signal was observed when ammonium hydroxide was added. As may be expected, formic
acid acts as a Brønsted acid favouring analyte protonation whereas ammonia hinders
transfer of protons to analyte molecules due to its high proton-affinity (PA) (854 kJ/mol). In
the negative ion mode, formic acid strongly quenched the [M-H]- signal of POB, while no
POB-formate adducts were observed. Upon addition of ammonium hydroxide to the sheath
liquid, a slight increase in the POB signal was observed. Again, these results can be
attributed to the gas-phase acid-base properties of the above-mentioned additives. Overall,
it was observed that analyte responses in positive and negative ion mode only modestly
improved upon addition of formic acid or ammonium hydroxide, respectively. The use of
these additives, however, may still be required in CE-APCI-MS, as a sufficiently
conductive sheath-liquid is essential for proper CE performance.
Chapter 6
132
3.5. BGE composition
BGEs may cause interfering background signals and analyte ion suppression in MS. We
studied the background spectra obtained with APCI-MS during infusion of different BGEs.
In the positive ion mode, the background spectra obtained by infusion of water, 50 mM
ammonium acetate (pH 6.8), 10 mM sodium phosphate (pH 7.5), and 20 mM SDS in 10
mM sodium phosphate (pH 7.5) did not show significant peaks. This is in sharp contrast
with ESI-MS, in which particularly sodium phosphate and SDS-containing BGEs have
been found to give rise to abundant clusters [8,16]. Also in the negative ion mode, infusion
of the ammonium acetate and sodium phosphate BGEs did not result in detectable
background ions. When the SDS-containing BGE was employed, a strong background
signal was observed for dodecyl sulphate ([SDS-Na]-, m/z 265). This ion can also be
observed in the negative ion mode when ionization techniques such as ESI-MS and APPI-
MS are employed [17].
The effect of the BGE composition on the signal intensities of mebeverine,
valerophenone (both positive ion mode) and caffeic acid (negative ion mode) was studied.
In the positive ion mode, ammonium acetate did not affect signal intensities of mebeverine
and valerophenone. Ammonium adduct formation was not observed, eventhough the
proton-affinity of valerophenone (~860 kJ/mole) is only slightly higher than that of
ammonia (854 kJ/mole). The nonvolatile BGE of sodium phosphate was also found to
cause neither adduct formation nor ionization suppression. This observation is in line with
findings by Takada et al. [2] who demonstrated a similar effect for caffeine, albeit using a
different, laboratory-made interface and much higher analyte concentrations. In sharp
contrast to these APCI results, the efficiency of ESI is known to decrease significantly in
the presence of nonvolatile constituents such as sodium phosphate [2,8]. SDS, which is
often employed as a pseudo-stationary phase in micellar electrokinetic chromatography
(MEKC), is known to be an even stronger ion suppressor in ESI [18,19]. However, the
infusion experiments indicated that the addition of 20 mM SDS did not result in reduced
signal intensities in APCI-MS. For hydrocortisone, SDS even caused a slight signal
increase. The enhancement of the [M+H]+ signal was accompanied by a reduction of the
signal intensity of the fragment ion with m/z 303. SDS apparently induces softer ionization
conditions for this compound. In the negative ion mode, signal intensities of caffeic acid
were also not affected by either sodium phosphate or SDS. For the ammonium acetate BGE
a signal enhancement of 30-40% was observed as compared to infusion of caffeic acid in
water. Similar results were also obtained for POB. The presence of ammonia in the BGE
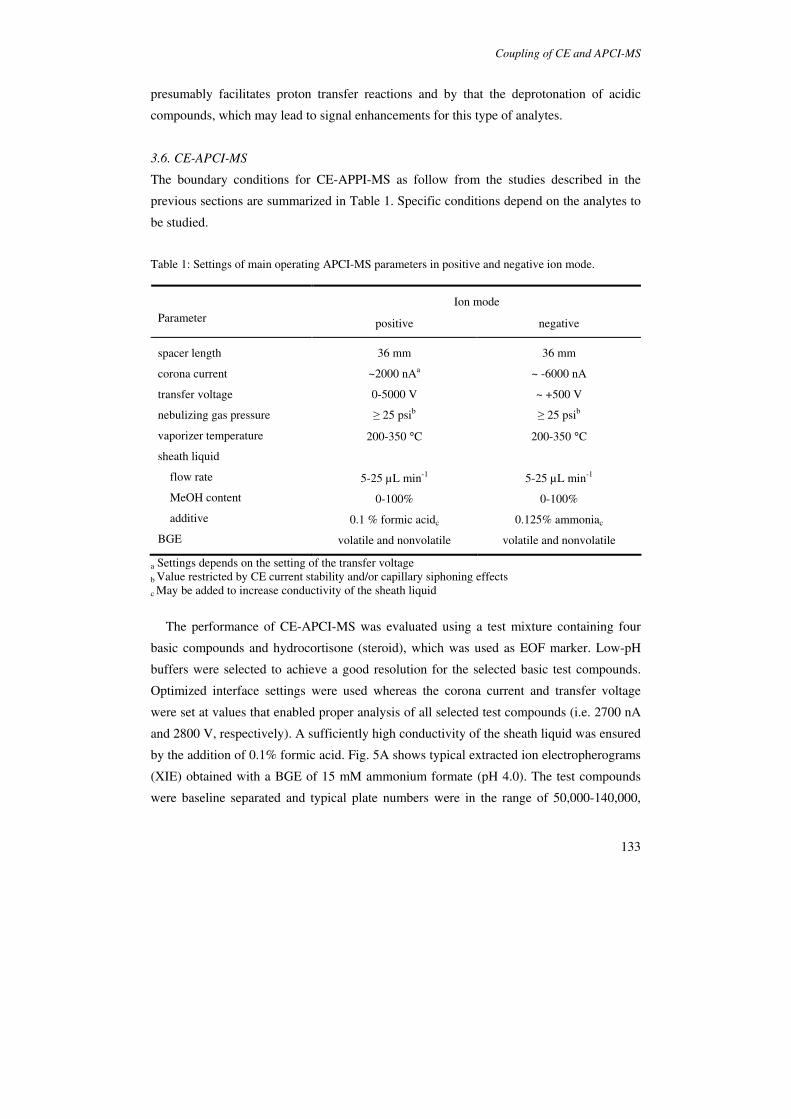
Coupling of CE and APCI-MS
133
presumably facilitates proton transfer reactions and by that the deprotonation of acidic
compounds, which may lead to signal enhancements for this type of analytes.
3.6. CE-APCI-MS
The boundary conditions for CE-APPI-MS as follow from the studies described in the
previous sections are summarized in Table 1. Specific conditions depend on the analytes to
be studied.
Table 1: Settings of main operating APCI-MS parameters in positive and negative ion mode.
Ion mode
Parameter positive negative
spacer length
corona current
transfer voltage
nebulizing gas pressure
vaporizer temperature
sheath liquid
flow rate
MeOH content
additive
BGE
36 mm
~2000 nAa
0-5000 V
≥ 25 psib
200-350 °C
5-25 µL min-1
0-100%
0.1 % formic acidc
volatile and nonvolatile
36 mm
~ -6000 nA
~ +500 V
≥ 25 psib
200-350 °C
5-25 µL min-1
0-100%
0.125% ammoniac
volatile and nonvolatile
a Settings depends on the setting of the transfer voltage b
Value restricted by CE current stability and/or capillary siphoning effects
c May be added to increase conductivity of the sheath liquid
The performance of CE-APCI-MS was evaluated using a test mixture containing four
basic compounds and hydrocortisone (steroid), which was used as EOF marker. Low-pH
buffers were selected to achieve a good resolution for the selected basic test compounds.
Optimized interface settings were used whereas the corona current and transfer voltage
were set at values that enabled proper analysis of all selected test compounds (i.e. 2700 nA
and 2800 V, respectively). A sufficiently high conductivity of the sheath liquid was ensured
by the addition of 0.1% formic acid. Fig. 5A shows typical extracted ion electropherograms
(XIE) obtained with a BGE of 15 mM ammonium formate (pH 4.0). The test compounds
were baseline separated and typical plate numbers were in the range of 50,000-140,000,
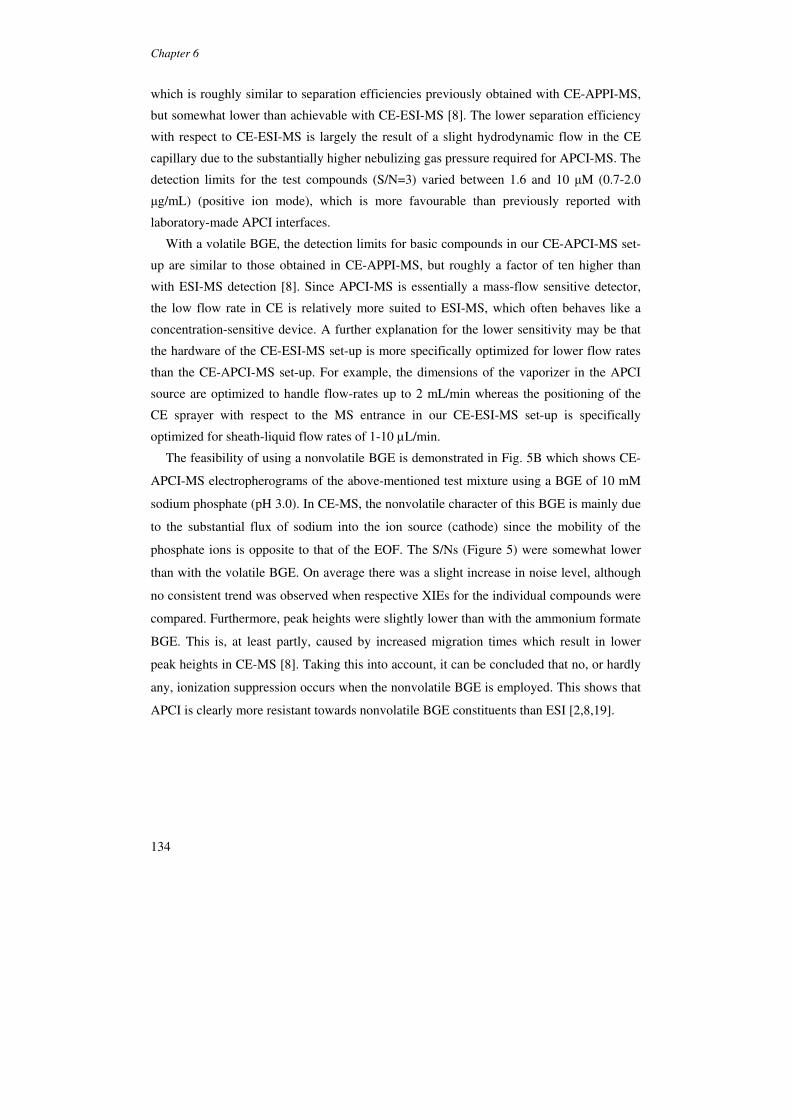
Chapter 6
134
which is roughly similar to separation efficiencies previously obtained with CE-APPI-MS,
but somewhat lower than achievable with CE-ESI-MS [8]. The lower separation efficiency
with respect to CE-ESI-MS is largely the result of a slight hydrodynamic flow in the CE
capillary due to the substantially higher nebulizing gas pressure required for APCI-MS. The
detection limits for the test compounds (S/N=3) varied between 1.6 and 10 µM (0.7-2.0
µg/mL) (positive ion mode), which is more favourable than previously reported with
laboratory-made APCI interfaces.
With a volatile BGE, the detection limits for basic compounds in our CE-APCI-MS set-
up are similar to those obtained in CE-APPI-MS, but roughly a factor of ten higher than
with ESI-MS detection [8]. Since APCI-MS is essentially a mass-flow sensitive detector,
the low flow rate in CE is relatively more suited to ESI-MS, which often behaves like a
concentration-sensitive device. A further explanation for the lower sensitivity may be that
the hardware of the CE-ESI-MS set-up is more specifically optimized for lower flow rates
than the CE-APCI-MS set-up. For example, the dimensions of the vaporizer in the APCI
source are optimized to handle flow-rates up to 2 mL/min whereas the positioning of the
CE sprayer with respect to the MS entrance in our CE-ESI-MS set-up is specifically
optimized for sheath-liquid flow rates of 1-10 µL/min.
The feasibility of using a nonvolatile BGE is demonstrated in Fig. 5B which shows CE-
APCI-MS electropherograms of the above-mentioned test mixture using a BGE of 10 mM
sodium phosphate (pH 3.0). In CE-MS, the nonvolatile character of this BGE is mainly due
to the substantial flux of sodium into the ion source (cathode) since the mobility of the
phosphate ions is opposite to that of the EOF. The S/Ns (Figure 5) were somewhat lower
than with the volatile BGE. On average there was a slight increase in noise level, although
no consistent trend was observed when respective XIEs for the individual compounds were
compared. Furthermore, peak heights were slightly lower than with the ammonium formate
BGE. This is, at least partly, caused by increased migration times which result in lower
peak heights in CE-MS [8]. Taking this into account, it can be concluded that no, or hardly
any, ionization suppression occurs when the nonvolatile BGE is employed. This shows that
APCI is clearly more resistant towards nonvolatile BGE constituents than ESI [2,8,19].
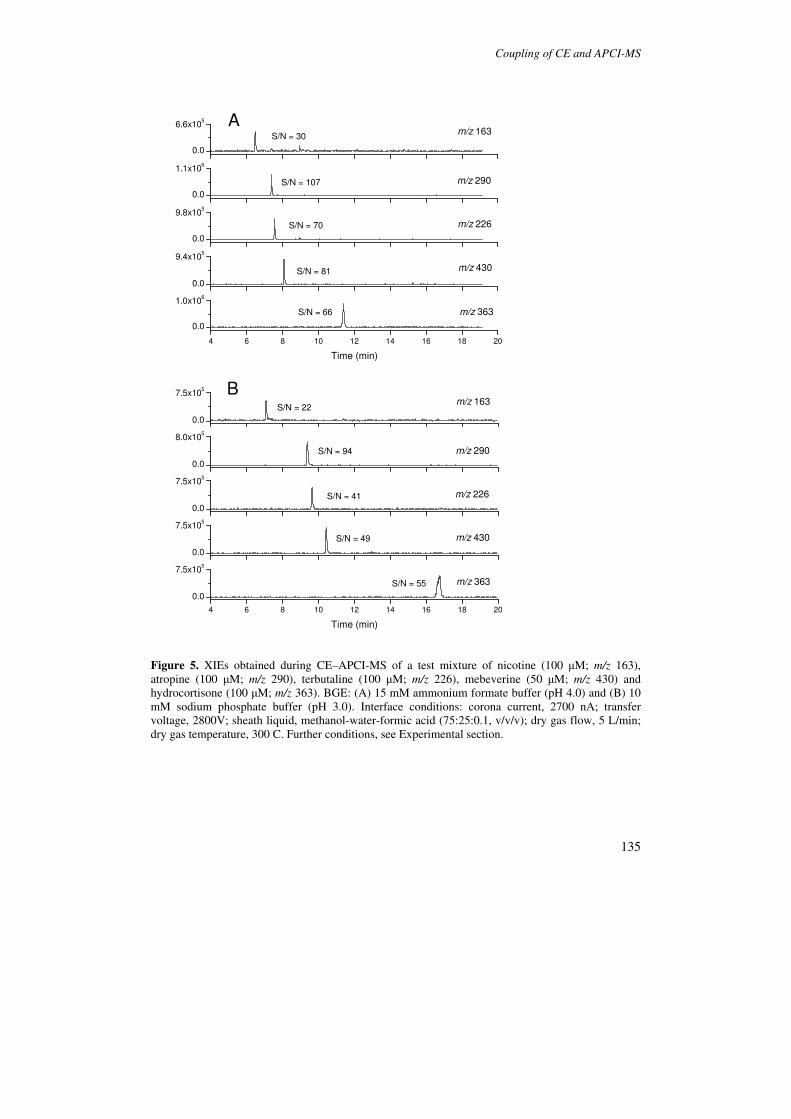
Coupling of CE and APCI-MS
135
4 6 8 10 12 14 16 18 20
0.0
1.0x10⁶
0.0
9.4x10⁵
0.0
9.8x10⁵
0.0
1.1x10⁶
0.0
6.6x10⁵
Time (min)
m/z 290
m/z 163
S/N = 66
S/N = 81
S/N = 70
S/N = 107
m/z 226
m/z 430
m/z 363
AS/N = 30
4 6 8 10 12 14 16 18 20
0.0
7.5x10⁵
0.0
7.5x10⁵
0.0
7.5x10⁵
0.0
8.0x10⁵
0.0
7.5x10⁵
Time (min)
S/N = 55
S/N = 49
S/N = 41
m/z 363
m/z 430
m/z 226
S/N = 94
S/N = 22
B
m/z 290
m/z 163
Figure 5. XIEs obtained during CE–APCI-MS of a test mixture of nicotine (100 µM; m/z 163), atropine (100 µM; m/z 290), terbutaline (100 µM; m/z 226), mebeverine (50 µM; m/z 430) and hydrocortisone (100 µM; m/z 363). BGE: (A) 15 mM ammonium formate buffer (pH 4.0) and (B) 10 mM sodium phosphate buffer (pH 3.0). Interface conditions: corona current, 2700 nA; transfer voltage, 2800V; sheath liquid, methanol-water-formic acid (75:25:0.1, v/v/v); dry gas flow, 5 L/min; dry gas temperature, 300 C. Further conditions, see Experimental section.
Chapter 6
136
4. Conclusions
The present paper has investigated the possibility of CE-APCI-MS using an orthogonal
interface set-up. This coupling required specific optimization, especially because CE entails
low flow rates and the requirement of a closed electrical circuit. In the positive ion mode,
the optimum setting of the corona current was found to depend on the transfer voltage,
which means that in our set-up these parameters have to be optimized simultaneously for
optimal analyte response. Other parameters, such as sheath-liquid composition and flow
rate, and vaporizer temperature only have a modest effect on analyte signals. These
parameters can therefore be optimized with respect to the separation performance and
stability of the CE current. Another favourable characteristic of APCI-MS is its strong
resistance towards ionization suppression by nonvolatile BGEs and SDS, thereby showing
good potential for the coupling of MEKC with MS.
The detection limits achieved with the presented CE-APCI-MS system are within the
high ng/mL to low µg/mL range, which is more favourable than previously reported
systems. The improved performance is likely to be due to higher sample transmission
through the vaporizer, and/or a lower noise level resulting from the orthogonal set-up. A
further improvement in sensitivity may be achieved by adapting the APCI source to the low
flow rates encountered in CE-MS. Indeed, the strong effects of the spacer length and
nebulizing gas pressure on signal responses seem to indicate that sample transmission
through the vaporizer is the most critical step in our CE-APCI-MS set-up. It may therefore
be advantageous to achieve the CE-MS coupling through a Multimode ESI/APCI source,
which lacks a long vaporizer tube, and instead uses an infrared emitter for sample
vaporization. As an additional advantage, the multimode source requires a lower nebulizing
gas pressure (20 psi) in LC-MS than the dedicated APCI source (60 psi), which would
reduce siphoning effects and thus enhance separation efficiency in CE-MS.
Acknowledgements
This study was financially supported by AstraZeneca, Global PR&D, External Science
Group (Macclesfield, UK).
Coupling of CE and APCI-MS
137
References
1 J. A. Olivares, N.T. Nguyen, C.R. Yonker, R.D. Smith, Anal. Chem.
1987, 59, 1230.
2 Y. Takada, M. Sakairi, H. Koizumi, Anal.Chem. 1995, 67, 1474.
3 P.G. Muijselaar, K. Otsuka, S. Terabe, J. Chromatogr. A 1998, 802, 3.
4 K. Isoo, K. Otsuka, S. Terabe, Electrophoresis 2001, 22, 3426.
5 Y. Tanaka, K. Otsuka, S. Terabe, J. Pharm. Biomed. Anal. 2003, 30, 1889.
6 S.L. Nilsson, C. Andersson, P.J.R. Sjöberg, D. Bylund, P. Petersson, M. Jörntén-
Karlsson, K.E. Markides, Rapid Commun. Mass Spectrom. 2003, 17, 2267.
7 R. Mol, G.J. De Jong, G.W. Somsen, Electrophoresis 2005, 26, 146.
8 P. Hommerson, A.M. Khan, G.J. De Jong, G.W. Somsen, Electrophoresis 2007, 28,
1444.
9 J. Schappler, D. Guillarme, J. Prat, J.-L. Veuthey, S. Rudaz, Electrophoresis 2007, 28,
3078.
10 R. Mol, G.J. De Jong, G.W. Somsen, Anal. Chem. 2005, 77, 5277.
11 M. Himmelsbach, M. Haunschmidt, W. Buchberger, C. Klampfl, Anal. Chem. 2007,
79, 1564.
12 B.M. Kolakowski, J.S. Grossert, L. Ramaley, J. Am. Soc. Mass Spectrom. 2004, 15,
301.
13 C. Perazzolli, I. Mancini, G. Guella, Rapid Commun. Mass Spectrom. 2005, 19, 461.
14 P. Hommerson, A.M. Khan, T. Bristow, W. Niessen, G.J. De Jong, G.W. Somsen,
Anal. Chem. 2007, 79, 5351.
15 S. Takeda, Y. Tanaka, M. Yamane, Z. Siroma, S. Wakida, K. Otsuka, S. Terabe, J.
Chromatogr. A 2001, 924, 415.
16. P. Hommerson, A.M. Khan, G.J. De Jong, G.W. Somsen, J. Chromatogr. A 2008,
1204, 197.
17 J. Schappler, D. Guillarme, S. Rudaz, J.-L. Veuthey, Electrophoresis, 2008, 29, 11.
18 K.L. Rundlett, D.W. Armstrong, Anal. Chem. 1996, 68, 3493.
19 G.W. Somsen, R. Mol, G.J. De Jong, J. Chromatogr. A 2003, 1000, 953.

138
139
Chapter 7
Drug impurity profiling by
capillary electrophoresis-mass spectrometry
using various ionization techniques
P. Hommerson, A.M. Khan, T. Bristow, M.W. Harrison,
G.J. de Jong, G.W. Somsen, submitted

Chapter 7
140
Summary
Capillary electrophoresis-mass spectrometry (CE-MS) is predominantly carried out using
electrospray ionization (ESI). Recently, atmospheric pressure chemical ionization (APCI)
and atmospheric pressure photoionization (APPI) have become available for CE-MS. With
the VUV-lamp turned off, the APPI source may also be used for CE-MS by thermospray
ionization (TSI). In the present study the suitability of ESI, APCI, APPI and TSI for drug
impurity profiling by CE-MS in the positive ion mode is evaluated. The drugs carbachol,
lidocaine and proguanil and their potential impurities were used as test compounds,
representing different molecular polarities. A background electrolyte of 100 mM acetic acid
(pH 4.5) provided baseline separation of nearly all impurities from the respective drugs.
APPI yielded both even and odd-electron ions, whereas the other ionization techniques
produced even-electron ions only. In-source fragmentation was more pronounced with
APCI and APPI than with ESI and TSI, which was most obvious for proguanil and its
impurities. In general, ESI and TSI appeared the most efficient ionization techniques for
impurities that are charged in solution achieving detection limits of 100 ng/mL (full-scan
mode). APPI and APCI showed a lower efficiency, but allowed ionization of low and high
polarity analytes, although quaternary ammonium compounds (e.g. carbachol) could not be
detected. Largely neutral compounds, such as the lidocaine impurity 2,6-dimethylaniline,
could not be detected by TSI, and yielded similar detection limits (500 ng/mL) for ESI,
APPI and APCI. In many cases, impurity detection at the 0.1% (w/w) level was possible
when 1 mg/mL of parent drug was injected with at least one of the CE-MS systems.
Overall, the tested CE-MS systems provide complementary information as illustrated by the
detection and identification of an unknown, impurity in carbachol.
Drug impurity profiling by CE-MS
141
1. Introduction
The safety of drug therapy is often connected with the purity of the pharmaceutically active
ingredient(s) [1]. The profiling of impurities in bulk drug substances, therefore, is an
important analytical task of the pharmaceutical industry [2,3]. For drugs with a maximum
daily dose of 2 g/day, current regulations require all recurring organic impurities present at,
or above, an apparent level of 0.1% to be identified [4]. Although selective detection
techniques, such as mass spectrometry (MS) and nuclear magnetic resonance (NMR), may
be used as stand-alone methods, comprehensive characterization of impurities typically
requires a number of separation methods to be employed. Liquid chromatography (LC)
with UV absorbance and MS detection is most widely used for this purpose. Nevertheless, a
priori no separation method is capable of separating all potential impurities and, therefore,
the availability of alternative separation techniques is invaluable. Capillary electrophoresis
(CE) has been shown to be highly suitable for the analysis of ionogenic drugs and
impurities [5-9]. The separation mechanism of CE is based on a differential mobility of
charged compounds in an electrical field, and can be considered “orthogonal” to reversed-
phase LC. With respect to detection in drug impurity profiling, MS is a method of choice as
it allows (i) detection of impurities lacking a UV-chromophore, (ii) mass-selective
detection, and (iii) the possibility to obtain structural information through MS/MS.
Currently, the predominant way to couple CE to MS is through electrospray ionization
(ESI)-based interfaces. This is an appropriate combination as both CE and ESI are
especially suitable for analytes that can form ions in solution. The feasibility of CE-ESI-MS
for drug impurity profiling has been indicated by a number of studies [10-13]. Nevertheless,
ESI is most effective for relatively polar compounds and, consequently, less polar
impurities may not be detectable at the 0.1% level. Alternative ionization techniques, such
as atmospheric pressure photoionization (APPI) and atmospheric pressure chemical
ionization (APCI) are known to be more suitable than ESI for ionization of less polar
compounds, and are therefore often used as complementary techniques in LC-MS. In APCI
and APPI, the sample is vaporized, after which primary ion formation is initiated by,
respectively, a corona-needle discharge or absorption of high energy (10 eV) photons
emitted by a krypton lamp. Detailed information on the ionization mechanisms of APCI
and APPI can be found elsewhere [14-16]. In contrast to LC-MS, the use of APCI and
APPI in CE-MS is relatively unexplored, and the feasibility of these approaches has only
been demonstrated recently [17-21]. In addition, it was found that in CE-APPI-MS,

Chapter 7
142
efficient analyte ionization of polar compounds could still be achieved when the excitation
source was turned off, provided that the ion transfer voltage was set within certain confines
[22]. Under these conditions, analyte ionization occurs through a liquid-phase ionization
mechanism that is supposedly similar to that of thermospray ionization (TSI) [16,22].
The aim of the present study was to investigate the applicability of ESI, APCI, APPI and
TSI as ionization methods for impurity profiling by CE-MS. Aspects, such as detection
limits, relative responses, in-source fragmentation, spectral interpretation and identification
of unknown impurities are studied on the basis of three drug substances of and their
potential impurities. These test compounds concern water-soluble drugs of different
polarity representing a range of compounds that may be amended to CZE-MS.
2. Experimental
2.1. Chemicals and materials
Glacial acetic acid, formic acid (0.25 M), ammonia (35%), ammonia (0.25 M), methanol,
and sodium hydroxide were obtained from Fisher Scientific (Loughborough, UK). Formic
acid, 4-chloroaniline, carbamylcholine chloride, choline chloride, terbutaline hemisulfate,
lidocaine hydrochloride, 2,6-dimethylaniline were purchased from Sigma-Aldrich (Poole,
UK). Proguanil hydrochloride, isopropyl biguanide, and proguanil biscompound were
supplied by AstraZeneca Analytical Development, PAR&D (Macclesfield, UK). Molecular
structures of drugs and impurities are shown in Figure 1. Deionized ultrapure water was
obtained from a Milli-Q system (Millipore, Watford, UK). Bare fused-silica capillaries
were from Composite Metal Services (The Chase, Hallow, UK).
BGEs were prepared by adjusting 50-100 mM solutions of formic acid or acetic acid to the
required pH with a solution of 2 M ammonia. Prior to use, the BGEs were filtered through a
0.45 µm filter and degassed by sonication. For CE-MS experiments, the parent drugs were
dissolved in water and spiked with their respective impurities listed in Figure 1 at
concentrations of 0.1% and 0.01% (w/w). The composition of the sheath liquid was
methanol-water-formic acid (75:25:0.1, v/v/v) during ESI-MS, and methanol-water (75:25,
v/v) during TSI-MS, APPI-MS, and APCI-MS, unless stated otherwise.
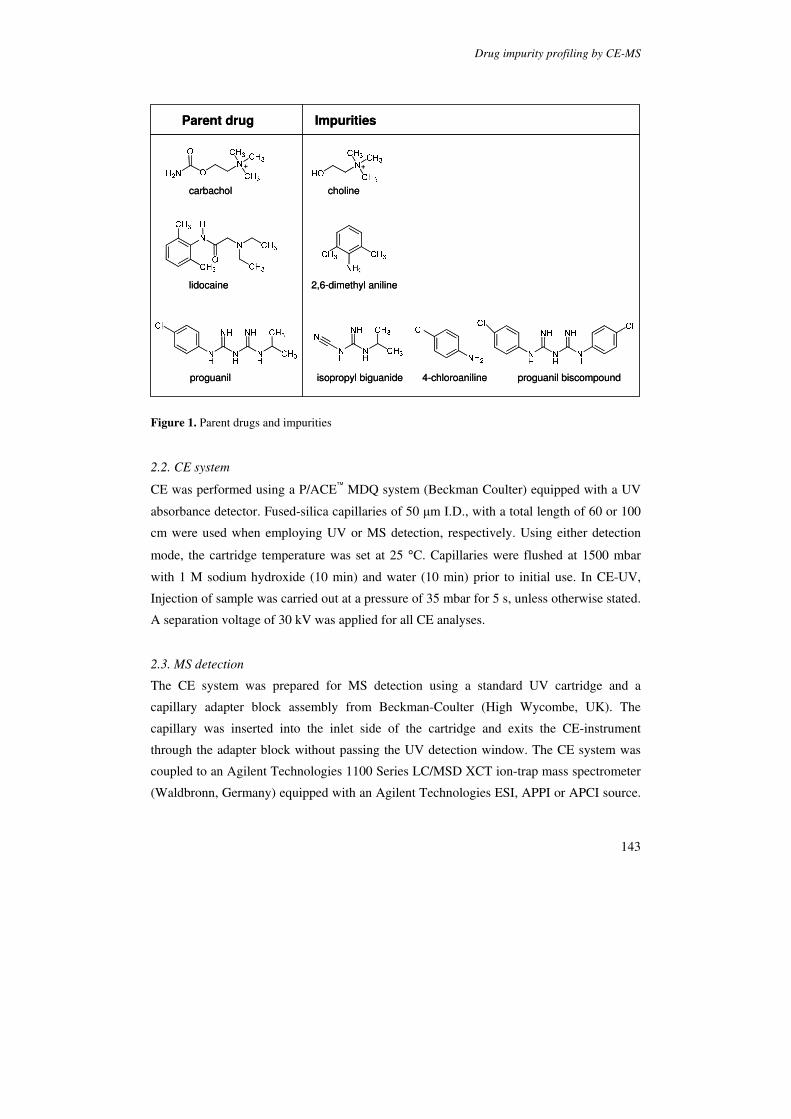
Drug impurity profiling by CE-MS
143
Parent drug Impurities
carbachol choline
lidocaine 2,6-dimethyl aniline
proguanil isopropyl biguanide 4-chloroaniline proguanil biscompound
+ +
Parent drug Impurities
carbachol choline
lidocaine 2,6-dimethyl aniline
proguanil isopropyl biguanide 4-chloroaniline proguanil biscompound
+ +
Figure 1. Parent drugs and impurities
2.2. CE system
CE was performed using a P/ACE MDQ system (Beckman Coulter) equipped with a UV
absorbance detector. Fused-silica capillaries of 50 µm I.D., with a total length of 60 or 100
cm were used when employing UV or MS detection, respectively. Using either detection
mode, the cartridge temperature was set at 25 °C. Capillaries were flushed at 1500 mbar
with 1 M sodium hydroxide (10 min) and water (10 min) prior to initial use. In CE-UV,
Injection of sample was carried out at a pressure of 35 mbar for 5 s, unless otherwise stated.
A separation voltage of 30 kV was applied for all CE analyses.
2.3. MS detection
The CE system was prepared for MS detection using a standard UV cartridge and a
capillary adapter block assembly from Beckman-Coulter (High Wycombe, UK). The
capillary was inserted into the inlet side of the cartridge and exits the CE-instrument
through the adapter block without passing the UV detection window. The CE system was
coupled to an Agilent Technologies 1100 Series LC/MSD XCT ion-trap mass spectrometer
(Waldbronn, Germany) equipped with an Agilent Technologies ESI, APPI or APCI source.
Chapter 7
144
All CE-MS couplings were achieved through a coaxial sheath-flow CE-MS sprayer from
Agilent Technologies. For delivery of the sheath liquid (5-15 µL/min) an 1100 Series
HPLC pump was used in combination with a 1:100 flow splitter (both Agilent
Technologies, Waldbronn, Germany).
For APPI-MS, TSI-MS and APCI-MS the sprayer was mounted on a plastic spacer with
a length of 36 mm which was then mounted on the source. Since the spacer is made of
electrically insulating material, a grounded wire connected to the sprayer was used to
restore the ground potential of the sprayer so as to ensure a functional electrical circuit for
CZE. For each ion source, the CE system was positioned such that the capillary inlet was at
equal height with the tip of the sprayer needle. Unless otherwise indicated, in CE-MS
injection was carried out at 35 mbar for 5 s, during which the nebulizer was switched off to
avoid siphoning effects. To minimize negative effects in CE-MS (e.g., peak broadening and
loss of resolution) due to the hydrodynamic flow caused by the nebulizer gas, a reduced
pressure of approximately -30 mbar was applied at the inlet vial during CE-ESI-MS and -80
mbar during CE-APPI-MS and CE-APCI-MS analysis, respectively [23]. Prior to each run,
the capillary was rinsed with BGE for 3 min at 1500 mbar.
The major operating parameters for each interface are listed in Table 1. The mass
spectrometer was operated in positive ion mode and the scan range was 100–500 m/z. To
avoid overloading of the ion-trap mass spectrometer, the ion-charge control option was
enabled. The ion sources were cleaned daily using a mixture of water-2-propanol (50:50,
v/v).
3. Results and discussion
Detection of drug impurities down to the 0.1% level usually implies that relatively high
concentrations of the parent drug are injected. When applying aqueous CE, the parent drug
should, therefore, be readily water-soluble. The selected test drugs were the polar
compounds carbachol (quaternary amine), lidocaine (tertiary amine, pKa 7.9) and proguanil
(secondary amine, pKa 10.4). Selection of potential impurities was based on the respective
monographs in the European Pharmacopoeia (Ph.Eur.) [24] or the United States
Pharmacopoeia (USP) [25]. The molecular structures of the parent drugs and their potential
impurities are depicted in Figure 1.
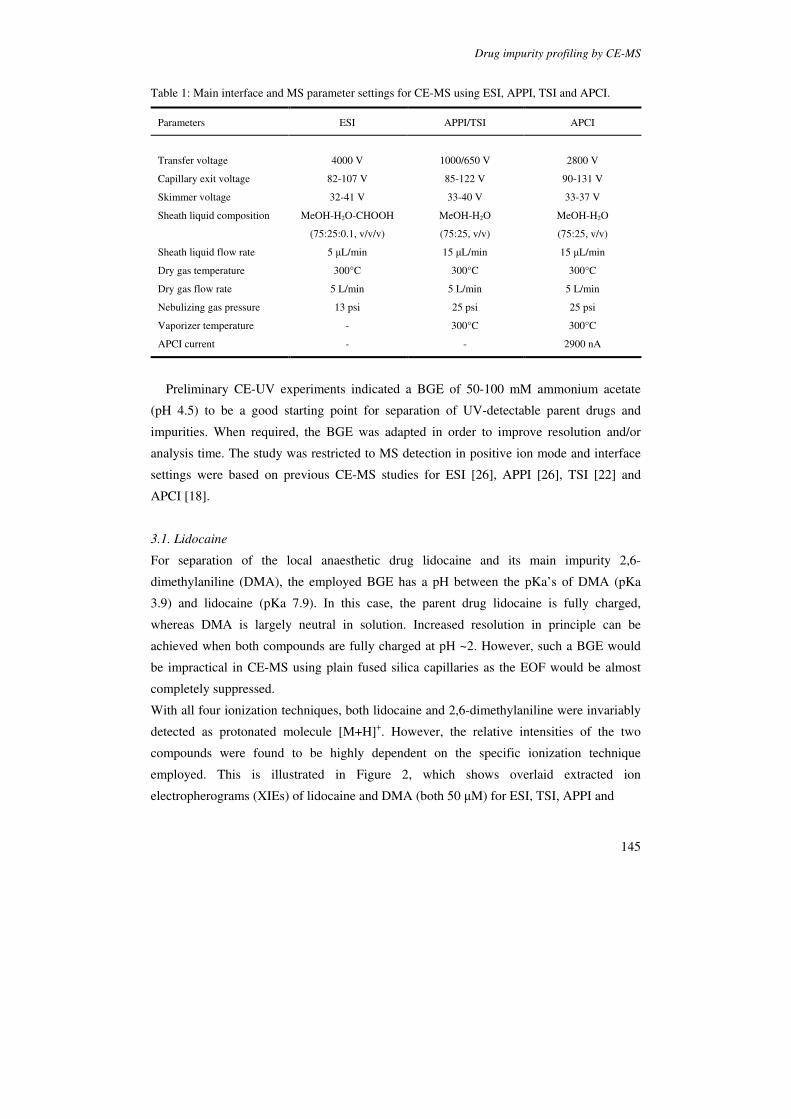
Drug impurity profiling by CE-MS
145
Table 1: Main interface and MS parameter settings for CE-MS using ESI, APPI, TSI and APCI.
Parameters ESI APPI/TSI APCI
Transfer voltage
4000 V
1000/650 V
2800 V
Capillary exit voltage 82-107 V 85-122 V 90-131 V
Skimmer voltage 32-41 V 33-40 V 33-37 V
Sheath liquid composition MeOH-H2O-CHOOH
(75:25:0.1, v/v/v)
MeOH-H2O
(75:25, v/v)
MeOH-H2O
(75:25, v/v)
Sheath liquid flow rate 5 µL/min 15 µL/min 15 µL/min
Dry gas temperature 300°C 300°C 300°C
Dry gas flow rate 5 L/min 5 L/min 5 L/min
Nebulizing gas pressure 13 psi 25 psi 25 psi
Vaporizer temperature - 300°C 300°C
APCI current - - 2900 nA
Preliminary CE-UV experiments indicated a BGE of 50-100 mM ammonium acetate
(pH 4.5) to be a good starting point for separation of UV-detectable parent drugs and
impurities. When required, the BGE was adapted in order to improve resolution and/or
analysis time. The study was restricted to MS detection in positive ion mode and interface
settings were based on previous CE-MS studies for ESI [26], APPI [26], TSI [22] and
APCI [18].
3.1. Lidocaine
For separation of the local anaesthetic drug lidocaine and its main impurity 2,6-
dimethylaniline (DMA), the employed BGE has a pH between the pKa’s of DMA (pKa
3.9) and lidocaine (pKa 7.9). In this case, the parent drug lidocaine is fully charged,
whereas DMA is largely neutral in solution. Increased resolution in principle can be
achieved when both compounds are fully charged at pH ~2. However, such a BGE would
be impractical in CE-MS using plain fused silica capillaries as the EOF would be almost
completely suppressed.
With all four ionization techniques, both lidocaine and 2,6-dimethylaniline were invariably
detected as protonated molecule [M+H]+. However, the relative intensities of the two
compounds were found to be highly dependent on the specific ionization technique
employed. This is illustrated in Figure 2, which shows overlaid extracted ion
electropherograms (XIEs) of lidocaine and DMA (both 50 µM) for ESI, TSI, APPI and

Chapter 7
146
0
4x10⁵
0
4x10⁶
0 2 4 6 8 10 12 14
0
4x10⁵
0
5x10⁵
APCI
Inte
nsity
Time (min)
APPI
TS
lidocaine (m/z 235)
DMA (m/z 122)ESI
Figure 2. XIEs obtained during CE-MS of a mixture of lidocaine and 2,6-dimethylaniline (50 µM each) using ESI, TSI, APPI and APCI. BGE, 50 mM acetate buffer (pH 4.5).
APCI, using a 50 mM ammonium acetate BGE. In ESI, and TSI in particular, DMA yields
a much lower response than lidocaine. By contrast, with APPI and APCI detection, roughly
equal signal intensities were obtained for both compounds. These results can presumably be
explained from the fact that ESI and TSI are predominantly liquid-phase ionization
techniques that require preformed ions for optimal performance. By contrast, in APCI and
APPI, gas-phase proton transfers tend to dominate, and these are promoted by high analyte
proton-affinity (PA). Although the pKa’s of lidocaine and DMA are substantially different,
their PAs are similar (> 900 kJ/mole). For lidocaine, which is fully charged at pH 4.5,
analyte responses were found to decrease in the order ESI>TSI>APPI≈APCI.
When a mixture of 1 mg/mL of lidocaine and 1 µg/mL of DMA was analysed using a BGE
of 100 mM ammonium acetate (pH 4.5), DMA could not be detected by TSI-MS. This
unfavourable response for DMA was not improved when 0.1% of formic acid was added to
the sheath-liquid. With ESI, APPI and APCI, detection limits for DMA were about 500
ng/mL (S/N=3), which means that DMA could be detected at the 0.1% level when injecting
1 mg/mL of lidocaine. As an example, typical XIEs obtained by CE-APPI-MS are shown in
Figure 3. Although liquid-phase ionization techniques such as ESI and TSI generally yield
favourable sensitivity for charged, polar or polarisable compounds, significantly lower
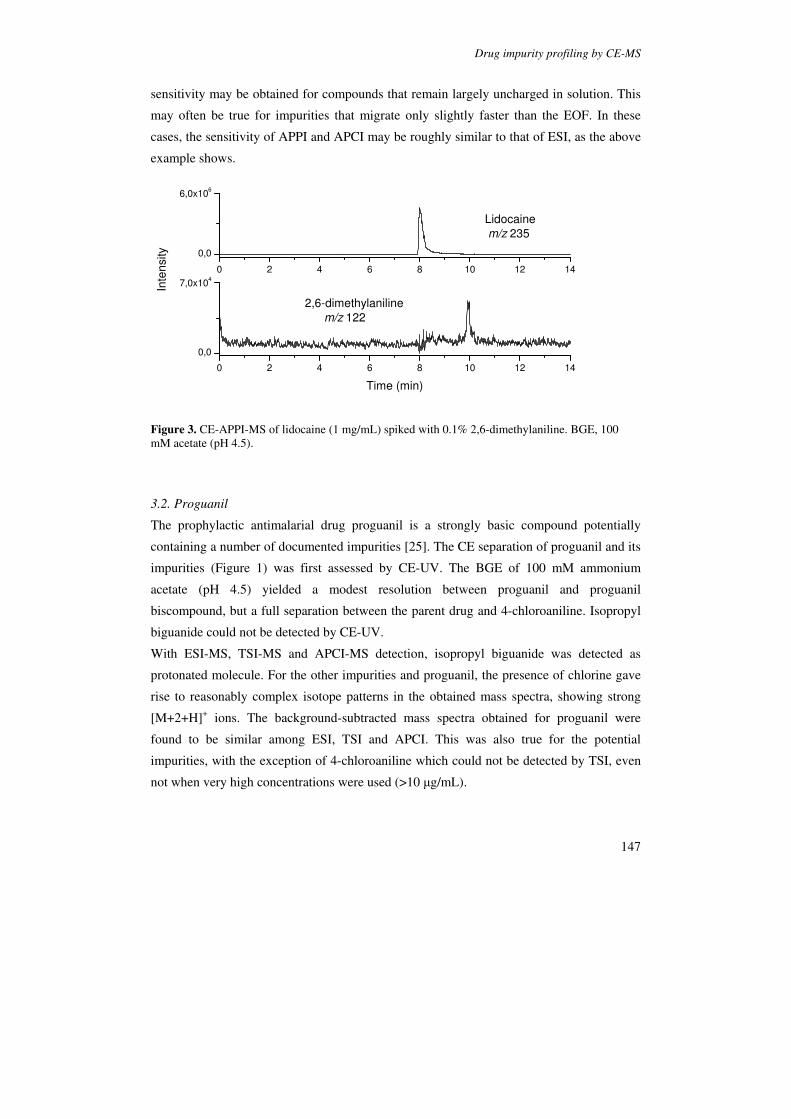
Drug impurity profiling by CE-MS
147
sensitivity may be obtained for compounds that remain largely uncharged in solution. This
may often be true for impurities that migrate only slightly faster than the EOF. In these
cases, the sensitivity of APPI and APCI may be roughly similar to that of ESI, as the above
example shows.
0 2 4 6 8 10 12 14
0,0
7,0x10⁴
0 2 4 6 8 10 12 14
0,0
6,0x10⁶
Time (min)
2,6-dimethylaniline
m/z 122
Inte
nsity
Lidocaine
m/z 235
Figure 3. CE-APPI-MS of lidocaine (1 mg/mL) spiked with 0.1% 2,6-dimethylaniline. BGE, 100 mM acetate (pH 4.5).
3.2. Proguanil
The prophylactic antimalarial drug proguanil is a strongly basic compound potentially
containing a number of documented impurities [25]. The CE separation of proguanil and its
impurities (Figure 1) was first assessed by CE-UV. The BGE of 100 mM ammonium
acetate (pH 4.5) yielded a modest resolution between proguanil and proguanil
biscompound, but a full separation between the parent drug and 4-chloroaniline. Isopropyl
biguanide could not be detected by CE-UV.
With ESI-MS, TSI-MS and APCI-MS detection, isopropyl biguanide was detected as
protonated molecule. For the other impurities and proguanil, the presence of chlorine gave
rise to reasonably complex isotope patterns in the obtained mass spectra, showing strong
[M+2+H]+ ions. The background-subtracted mass spectra obtained for proguanil were
found to be similar among ESI, TSI and APCI. This was also true for the potential
impurities, with the exception of 4-chloroaniline which could not be detected by TSI, even
not when very high concentrations were used (>10 µg/mL).
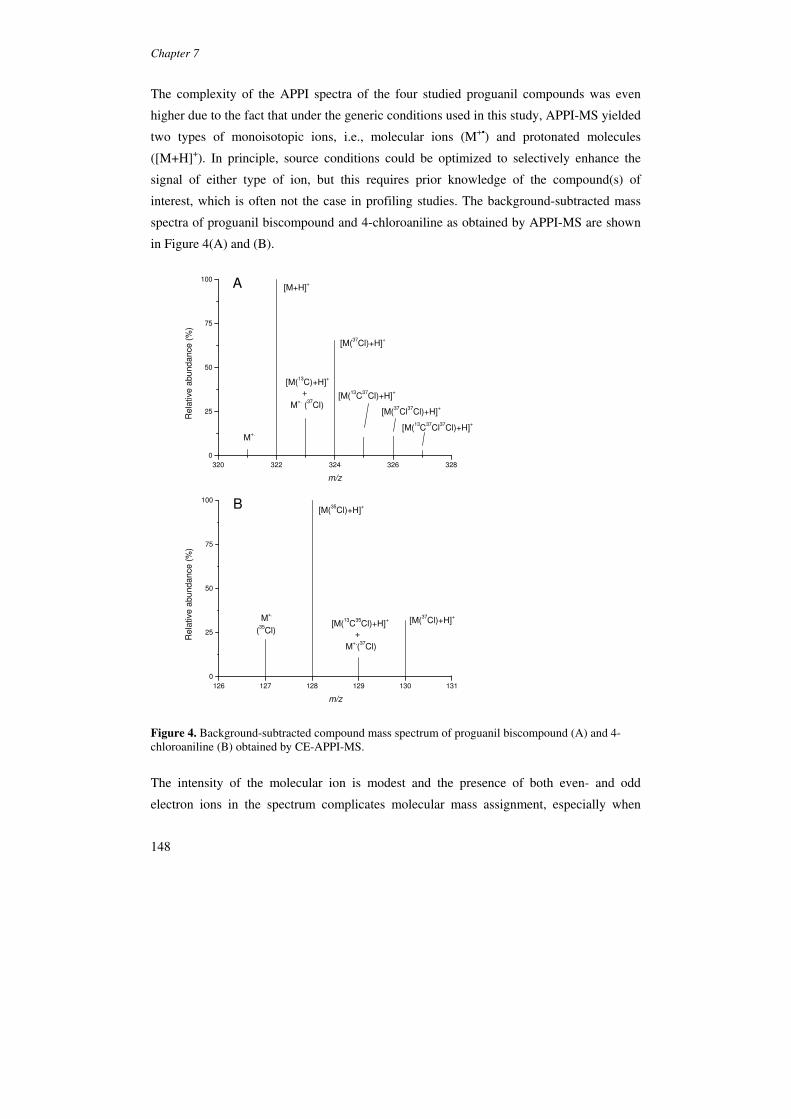
Chapter 7
148
The complexity of the APPI spectra of the four studied proguanil compounds was even
higher due to the fact that under the generic conditions used in this study, APPI-MS yielded
two types of monoisotopic ions, i.e., molecular ions (M+•) and protonated molecules
([M+H]+). In principle, source conditions could be optimized to selectively enhance the
signal of either type of ion, but this requires prior knowledge of the compound(s) of
interest, which is often not the case in profiling studies. The background-subtracted mass
spectra of proguanil biscompound and 4-chloroaniline as obtained by APPI-MS are shown
in Figure 4(A) and (B).
320 322 324 326 328
0
25
50
75
100
[M(13
C37
Cl37
Cl)+H]+
A
Re
lative
ab
un
da
nce
(%
)
m/z
[M(13
C37
Cl)+H]+
[M(37
Cl)+H]+
[M(13
C)+H]+
+
M+. (
37Cl)
[M(37
Cl37
Cl)+H]+
[M+H]+
M+.
126 127 128 129 130 131
0
25
50
75
100
[M(13
C35
Cl)+H]+
+
M+.(
37Cl)
[M(37
Cl)+H]+
Re
lative a
bu
nda
nce (
%)
m/z
[M(35
Cl)+H]+
M+.
(35
Cl)
B
Figure 4. Background-subtracted compound mass spectrum of proguanil biscompound (A) and 4-chloroaniline (B) obtained by CE-APPI-MS.
The intensity of the molecular ion is modest and the presence of both even- and odd
electron ions in the spectrum complicates molecular mass assignment, especially when

Drug impurity profiling by CE-MS
149
highly abundant isotopes, such as 37Cl, are present. Furthermore, obtaining structural
information through the nitrogen rule or through the isotope pattern may not be easy. This
is exemplified in Figure 4(B) in which the intensity of the m/z 129 ion does not reflect the
number of carbons present in 4-chloroaniline, as there is also a strong contribution from the 37Cl isotope of the molecular ion. For such compounds, ESI, TSI and APCI spectra are
more suitable for obtaining structural information in a straightforward fashion.
In CE-APPI-MS and CE-APCI-MS, proguanil biscompound could be detected at a level of
1 µg/mL whereas 4-chloroaniline and isopropyl biguanide required higher concentrations
(1-10 µg/mL). Furthermore, substantial fragmentation of the parent drug (1 mg/mL) into
m/z 127 and 128 was observed. Fragmentation of proguanil was more modest in TSI and
virtually absent with ESI-MS detection. With TSI, isopropyl biguanide could be detected at
0.1%, but proguanil biscompound showed a poor response. Best results were obtained by
CE-ESI-MS (Figure 5) with strong signals for proguanil biscompound and isopropyl
biguanide (S/Ns > 10) enabling their detection at the 0.1% level. 4-Chloroaniline was found
difficult to analyse with each ionization mode and could not be detected (S/N≥ 3) at the
0.1% level under the present conditions.
0 5 10 15 20
0,0
5,0x10⁴ 0 5 10 15 20
0,0
1,5x10⁴ 0 5 10 15 20
0,0
5,0x10⁴ 0 5 10 15 20
0,0
8,0x10⁶
Time (min)
4-chloroaniline
m/z 128
Inte
nsity
isopropyl biguanide
m/z 127
proguanil biscompound
m/z 322
proguanil
m/z 254
Figure 5. CE-ESI-MS of proguanil (1 mg/mL) spiked with proguanil biscompound, 4-chloroaniline, and isopropyl biguanide (all 1 µg/mL). BGE, 100 mM ammonium acetate (pH 4.5).
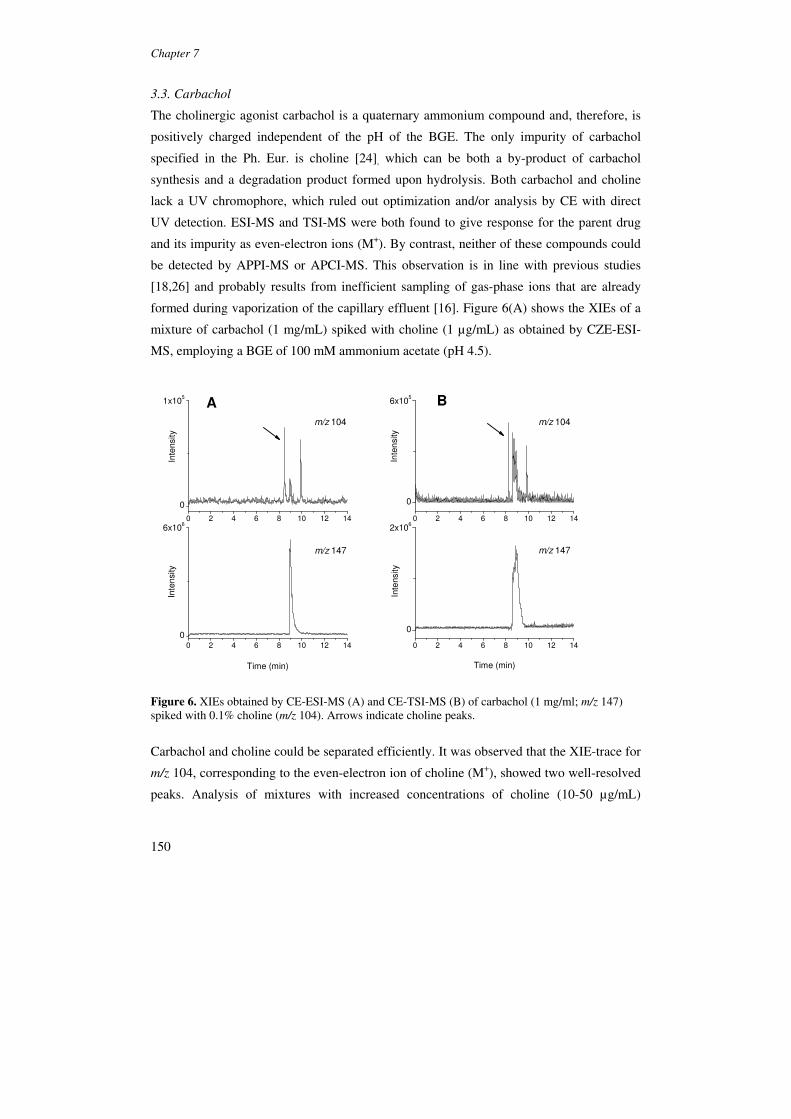
Chapter 7
150
3.3. Carbachol
The cholinergic agonist carbachol is a quaternary ammonium compound and, therefore, is
positively charged independent of the pH of the BGE. The only impurity of carbachol
specified in the Ph. Eur. is choline [24], which can be both a by-product of carbachol
synthesis and a degradation product formed upon hydrolysis. Both carbachol and choline
lack a UV chromophore, which ruled out optimization and/or analysis by CE with direct
UV detection. ESI-MS and TSI-MS were both found to give response for the parent drug
and its impurity as even-electron ions (M+). By contrast, neither of these compounds could
be detected by APPI-MS or APCI-MS. This observation is in line with previous studies
[18,26] and probably results from inefficient sampling of gas-phase ions that are already
formed during vaporization of the capillary effluent [16]. Figure 6(A) shows the XIEs of a
mixture of carbachol (1 mg/mL) spiked with choline (1 µg/mL) as obtained by CZE-ESI-
MS, employing a BGE of 100 mM ammonium acetate (pH 4.5).
0 2 4 6 8 10 12 14
0
1x10⁵
0 2 4 6 8 10 12 14
0
6x10⁵
0 2 4 6 8 10 12 14
0
6x10⁶
0 2 4 6 8 10 12 14
0
2x10⁶
m/z 147
m/z 104
Inte
nsity
m/z 104
m/z 147
BIn
ten
sity
Inte
nsity
Inte
nsity
Time (min)
A
Time (min)
Figure 6. XIEs obtained by CE-ESI-MS (A) and CE-TSI-MS (B) of carbachol (1 mg/ml; m/z 147) spiked with 0.1% choline (m/z 104). Arrows indicate choline peaks.
Carbachol and choline could be separated efficiently. It was observed that the XIE-trace for
m/z 104, corresponding to the even-electron ion of choline (M+), showed two well-resolved
peaks. Analysis of mixtures with increased concentrations of choline (10-50 µg/mL)

Drug impurity profiling by CE-MS
151
revealed that the first peak could be ascribed to choline (see arrow in Figure 6(A)), whereas
the second peak is of unknown origin.
Figure 6(B) shows XIE-traces obtained by CE-TSI-MS for the same mixture. As with
ESI-MS detection, two peaks could be observed for the XIE of m/z 104. Using either ESI or
TSI, a detection limit of <100 ng/mL of choline could be achieved, which corresponds to an
impurity level of 0.01%. The concentration of parent drug (1 mg/mL) and the injection
volume (2.96 nL, 0.15% of cap. length) used in these experiments were relatively modest,
and further gain in sensitivity is feasible.
Despite similarities between the ESI-MS and TSI-MS traces of the carbachol-choline
mixture, two differences were observed. Using either ionization technique, a baseline
disturbance was observed in the m/z 104 trace at the migration time of carbachol (Figure
6(A)) which is presumably caused by fragmentation of the parent drug into choline during
ESI-MS. However, this disturbance was invariably more pronounced with TSI, indicating
that ESI is the softer ionization technique. Secondly, with ESI, the peak area ratio of the
impurity and parent drug is ~0.4%, whereas TSI yields a higher ratio of 1.8%. While both
techniques do not reflect the actual amount of choline (0.1%) present in the sample, TSI-
MS shows a stronger tendency to overestimate the amount of impurity.
As mentioned above, an unknown compound was observed in the XIE with m/z 104. This
signal was observed by both ESI-MS and TSI-MS when a pure solution of carbachol (1.0
mg/mL) was analyzed, and, therefore, must originate from an impurity present in the
carbachol standard. In order to further investigate the potential of CE-MS for impurity
profiling, and the merits of various ionization techniques in particular, an attempt at
identification of the impurity was undertaken. CE-MS experiments demonstrated that the
impurity could not be detected by either APPI-MS or APCI-MS. Compounds that form
protonated molecules upon TSI, usually show a significant response in APPI as well.
Therefore, this specific ion most likely stems from either an ionic compound (e.g. a
quaternary ammonium compound) or an alkali ion adduct. With our CE-TSI-MS set-up,
however, the formation of adducts is seldom observed. The background-subtracted mass
spectrum of the unknown compound as obtained by CE-ESI-MS is shown in Figure 7. The
spectrum reveals a strong signal at m/z 190 which is probably the molecular ion of the
impurity. Structural information on the m/z 190 compound was subsequently obtained by
MS2 and MS3 experiments. The MS2 spectrum (Figure 7) shows main fragments at m/z 147
and m/z 104, i.e., the same masses as those of carbachol and choline, respectively. Indeed,
the MS3 spectra of the two main fragments and MS2 spectra of carbachol and choline
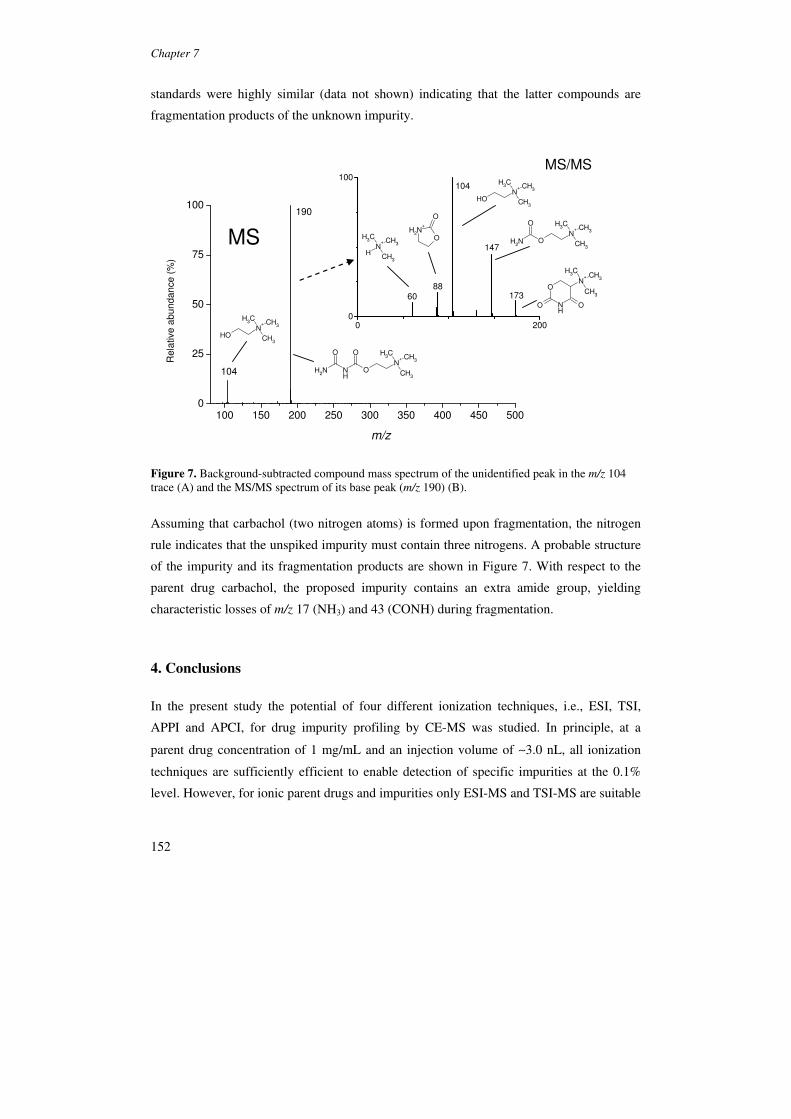
Chapter 7
152
standards were highly similar (data not shown) indicating that the latter compounds are
fragmentation products of the unknown impurity.
MS
MS/MS
100 150 200 250 300 350 400 450 5000
25
50
75
100
104
Rela
tive
ab
un
da
nce
(%
)
m/z
190
0 2000
100
173
147
104
8860
OHN
+ CH3
CH3
CH3
O
ON
+ CH3
CH3
CH3
NH
O
NH2
N+ CH
3
CH3
CH3
H
O
ON
+ CH3
CH3
CH3
NH2
ON
+ CH3
CH3
CH3
O NH
O
NH2
+
O
O
OHN
+ CH3
CH3
CH3
Figure 7. Background-subtracted compound mass spectrum of the unidentified peak in the m/z 104 trace (A) and the MS/MS spectrum of its base peak (m/z 190) (B).
Assuming that carbachol (two nitrogen atoms) is formed upon fragmentation, the nitrogen
rule indicates that the unspiked impurity must contain three nitrogens. A probable structure
of the impurity and its fragmentation products are shown in Figure 7. With respect to the
parent drug carbachol, the proposed impurity contains an extra amide group, yielding
characteristic losses of m/z 17 (NH3) and 43 (CONH) during fragmentation.
4. Conclusions
In the present study the potential of four different ionization techniques, i.e., ESI, TSI,
APPI and APCI, for drug impurity profiling by CE-MS was studied. In principle, at a
parent drug concentration of 1 mg/mL and an injection volume of ∼3.0 nL, all ionization
techniques are sufficiently efficient to enable detection of specific impurities at the 0.1%
level. However, for ionic parent drugs and impurities only ESI-MS and TSI-MS are suitable
Drug impurity profiling by CE-MS
153
as this type of compounds cannot be detected by our CE-APCI-MS and CE-APPI-MS set-
ups. Although this may be seen as a disadvantage of the latter two ionization techniques,
this characteristic could be useful to discriminate between ionic and non-ionic impurities, as
shown for the unknown carbachol impurity.
The ionization efficiency of ESI and TSI appeared to be strongly affected by the charge
state of the analyte in solution. Under the conditions investigated, especially TSI gave poor
responses when the analytes are not preformed ions. As may be expected, analyte responses
in APPI and APCI appeared to correlate with PA. For compounds that are charged in
solution, the sensitivity of CE-MS decreased in the order ESI≥TSI>APPI≈APCI. APPI and
APCI appear most useful for analytes that are largely uncharged in solution. For example,
the lidocaine impurity DMA, which is largely neutral in the acetate buffer, was found to
yield roughly equal responses with the APPI-MS, APCI-MS and ESI-MS detection
methods. As was demonstrated before, APPI and APCI can also be practical when non-
volatile BGEs are employed [18,26].
One striking characteristic of ESI-MS with respect to the other tested ionization
techniques is its softness, as a modest amount of fragmentation was usually observed with
the other tested techniques. A specific feature of APPI for CZE-MS is its tendency to yield
both even- and odd-electron species. Although this characteristic may be useful in rare
cases where analyte ionization cannot be achieved by proton-transfer, generic conditions
may lead to the appearance of multiple analyte ions which complicates spectral
interpretation, such as the recognition of specific isotopic patterns.
In CE-MS, best detection limits are generally achieved when analytes migrate relatively
fast [26]. In such cases, ESI is sufficiently universal, and most often the best ionization
technique due to its sensitivity and softness. For less polar compounds APPI and APCI may
be useful, although the absolute ESI signal may still be significant. TSI was found to be a
useful complementary technique to APPI and APCI, and their combination seems to be
especially strong when the bulk drug substance potentially contains ionic impurities.
Acknowledgements
This study was financially supported by AstraZeneca, Global PR&D, External Science
Group (Macclesfield, UK).
Chapter 7
154
References
1 S. Görög, Trends Anal. Chem. 2003, 22, 407.
2 S. Görög, Trends Anal. Chem. 2006, 25, 756.
3 S. Görög, J. Pharm. Biomed Anal. 2008, 48, 247.
4 ICH Q3A(R2): Impurities in New Drug Substances (Revised Guideline), Fed. Regist.
68 (2003) 6924.
5 K.D. Altria, J. Chromatogr. 1993, 634, 323.
6 M.J. Hilhorst, G.W. Somsen, G.J. De Jong, Electrophoresis 2002, 21, 2542.
7 U. Holzgrabe, D. Brinz, S. Kopec, C. Weber, Y. Bitar, Electrophoresis 2006, 27, 2283.
8 M. Hammitzsch, R.N. Rao, G.K.E. Scriba, Electrophoresis 2006, 27, 4334.
9 M.A. Kelly, K.D. Altria, C. Grace, B.J. Clark, J. Chromatogr. A 1998, 798, 297.
10 D. Visky, I. Jimidar, W. Van Ael, T. Venekens, D. Redlich, M. De Smet,
Electrophoresis 2005, 26, 1541.
11 A. Vassort, D.A. Barret, P.N. Shaw, P.D. Ferguson, R. Szucs, Electrophoresis 2005,
26, 1712.
12 W.M.A. Niessen, Chimia 1999, 53, 478.
13 A.M. Van Wijk, P.G. Muijselaar, K. Stegman, G.J. De Jong, J. Chromatogr. A 2007,
1159, 175.
14 A.P. Bruins, Mass Spectrom. Rev. 1991, 10, 53.
15 W.M.A. Niessen, Liquid Chromatography-Mass Spectrometry. Taylor & Francis:
Boca Raton Fl, 2006.
16 D.B. Robb, M.W. Blades, Anal. Chim. Acta 2008, 627, 34.
17 Y. Tanaka, K. Otsuka, S. Terabe, J. Pharm. Biomed. Anal. 2003, 30, 1889.
18 P. Hommerson, A.M. Khan, G.J. De Jong, G.W. Somsen, J. Am. Soc. Mass Spectrom.
2009, in press
19 S.L. Nilsson, C. Andersson, P.J.R. Sjöberg, D. Bylund, P. Petersson, M. Jörntén-
Karlsson, K.E. Markides, Rapid Commun. Mass Spectrom. 2003, 17, 2267.
20 R. Mol, G.J. De Jong, G.W. Somsen, Electrophoresis 2005, 26, 146.
21 J. Schappler, D. Guillarme, J. Prat, J.-L. Veuthey, S. Rudaz, Electrophoresis 2007, 28,
3078.
22 P. Hommerson, A.M. Khan, T. Bristow, W. Niessen, G.J. De Jong, G.W. Somsen,
Anal. Chem. 2007, 79, 5351.
Drug impurity profiling by CE-MS
155
23 P. Hommerson, A.M. Khan, G.J. De Jong, G.W. Somsen J. Chromatogr. A 2008,
1204, 197.
24 European Pharmacopoeia, 5, Council of Europe, Strasbourg, 2007.
25 The United States Pharmacopeia, 30, USP Convention, Rockville, MD, 2007.
26 P. Hommerson, A.M. Khan, G.J. De Jong, G.W. Somsen, Electrophoresis 2007, 28,
1444.

156

157
Chapter 8
Conclusions and future perspectives
Chapter 8
158
In this thesis, three alternative approaches for CE-MS, based on respectively photo-,
chemical and thermospray ionization, have been studied. The atmospheric pressure photo-
and chemical ionization (APPI and APCI) sources used in these studies were originally
developed for LC-MS, but a few adaptations enabled their use in CE-MS. With the APPI
source, polar analytes could also be detected with the VUV-excitation source turned off,
provided that specific interface conditions were met. The characteristics of this photon-
independent ionization process are largely similar to that of thermospray ionization (TSI).
The studies described in this thesis cover the set-ups of the CE-MS systems, the
optimization of operating parameters and evaluations of their performance. Particular
attention was given to detection selectivity, interfacing, BGE compatibility, limits of
detection (LODs), and applicability to pharmaceutical analysis. These aspects are
elaborated below.
1. Selectivity
The ionization mechanisms of ESI and TSI are similar in that the production of gas-phase
ions occurs through desolvation of analyte ions into the gase phase. In CE-MS using
positive ion mode, both ESI and TSI are most suited when applied to basic and ionic
compounds, and invariably yield even-electron ions. A pivotal difference between TSI and
ESI is that the latter technique also enables ionization of neutral compounds, provided that
the proton-affinity (PA) is sufficiently high. In capillary zone electrophoresis (CZE)-TSI-
MS, neutral compounds often remain undetected, irrespective of the sheath-liquid
composition. ESI is more suited than TSI for the analysis of neutral or slightly charged
compounds, although the ESI efficiency still may be low.
For the gas-phase ionization techniques APCI and APPI, analyte responses appear to be
largely determined by gas-phase thermodynamic properties. Both techniques proved to be a
viable alternative to ESI or TSI for analytes that are largely uncharged in solution. With
APCI-MS, analytes are invariably detected as even-electron ions whereas APPI can also
lead to the formation of odd-electron ions. Detection by APCI-MS in the positive ion mode
is only feasible for compounds possessing a sufficiently high PA. APPI-MS also enables
detection of low-PA compounds, provided that their ionization energy (IE) is below the
energy of the VUV-photons. With APPI using generic operating conditions, compounds
with a low IE and high PA are sometimes detected as protonated molecule and radical
cation simultaneously. This is generally unfavourable, as the occurrence of two ionization
pathways for the same analyte seldom results in optimal sensitivity. In addition, the
Conclusions and future perspectives
159
interpretation of the resulting spectra is more complicated. For these reasons APPI may
require some compound-specific optimization for selectively guiding the formation of
even- or odd-electron ions.
Using either the APPI or APCI source, gas-phase ions of ionogenic compounds may be
formed by TSI during sample vaporization. Under common APCI or APPI conditions, i.e.
with a transfer voltage above 800 V, ionic compounds, such as quaternary ammonium
compounds, are not detected. At these voltages, ions that are formed inside the vaporizer
are presumably directed to the endplate above the inlet and therefore not sampled by the
mass spectrometer. The lack of detection for ionic compounds in APCI and APPI may be
seen as a disadvantage, but on the other hand it has the merit of yielding complementary
information to TSI. For instance, carrying out CE-TSI-MS and CE-APPI-MS on the same
sample could prove useful for discrimination between ionic and non-ionic compounds, as
shown for the carbachol impurity in Chapter 7.
With the APPI source, ionic, ionogenic and apolar compounds can be analyzed in a
single run when interface settings are used that enable APPI-MS and TSI-MS to proceed
simultaneously, resulting in mixed-mode ionization. With the APCI source, however, a
similar mixed-mode approach is not feasible as the application of a low corona current in
APCI already prevents detection of ions produced by TSI. This is probably the result of an
alteration of the electrical field in the ion source by the corona discharge leading to
inadequate sampling of ions formed by TSI.
2. Interface parameters
A sheath-liquid interface was used throughout all CE-MS studies described in this thesis.
The purpose of the sheath-liquid is to establish the electrical contact with the CE effluent
and to provide suitable ionization conditions. Generally, TSI, APPI and APCI require
higher sheath-liquid flow rates than ESI for achievement of stable CE currents. This at least
partly caused by the high vaporizer temperature and the higher nebulizing gas pressures
used with the APPI and APCI sources. A drawback of using a sheath-liquid interface for
CE-ESI-MS is the dilution of the CE effluent, which may compromise sensitivity. With
APPI-MS and APCI-MS detection, the influence of the sheath-liquid flow rate on analyte
intensities is relatively small. This may be due to the fact that these detection principles
show a mass-flow sensitive behaviour. Signal intensities in TSI-MS often increase with
increasing sheath-liquid flow rates, indicating that this ionization mode does not exhibit the
same kind of concentration sensitivity as ESI. The sheath-liquid is often composed of a

Chapter 8
160
mixture of organic modifier, water and a volatile acid or base. In ESI-MS, formic acid is
commonly added to lower the pH of the sheath liquid and thereby enhance the ionization of
basic analytes. With the other three ionization techniques, analyte signals are usually not
improved by formic acid, but its addition may still be indicated to achieve stable CE
currents. Furthermore, in APPI-MS, a dopant such as acetone or toluene may be added to
the sheath liquid to enhance ionization efficiencies of both polar and apolar compounds. In
the reported CE-APPI-MS work, the addition of 5 vol% of toluene resulted in an
approximate signal enhancement for basic analytes of a factor of 1.5.
The optimum vaporizer temperature in TSI, APCI and APPI is often in the range 250
°C-350 °C depending on the BGE composition and sheath liquid flow rate. At lower values,
sample evaporation may be incomplete, whereas the upper limit is often restricted by the
stability of the CE-current. Too high temperatures may cause solvent boiling and bubble
formation within the capillary end, thereby compromising the required electrical contact. At
temperatures above 300 °C, an increase of analyte ion fragmentation may also occur.
It is often observed that the coupling of CE with MS results in lower plate numbers as
compared to CE-UV. The loss of separation efficiency may partially be caused by a number
of ion source-independent factors, such as height differences between both ends of the CE
capillary and the (partial) lack of capillary cooling. Furthermore, in CE-MS, the
composition of the BGE and the sheath liquid are usually different, which also may cause
band-broadening. Although all four ionization techniques described in this thesis are
operated at atmospheric pressure, the apparent pressure difference between both sides of the
CE capillary still is an important factor for band-broadening in CE-MS. The nebulizing gas
flow brings about a pressure reduction at the capillary outlet and therefore causes siphoning
towards the ion source. This causes shorter analyte migration times, lower peak
efficiencies, and compromised resolution. Such nebulizer-induced siphoning effects can be
reduced by a proportional reduction of the pressure at the inlet vial. Plate numbers are
usually higher with ESI (150,000-200,000) than with TSI-MS, APPI-MS or APCI-MS
detection (100,000-150,000), as the latter techniques require higher nebulizing gas
pressures (ca. 25 psi) than ESI (≤15 psi).
3. BGE composition
The choice of BGE in CE-MS may be a compromise between resolution and sensitivity.
High molarity BGEs often favour separation and peak width, but may also cause increased
ionization suppression in ESI and TSI. Furthermore, with bare fused-silica capillaries, best
Conclusions and future perspectives
161
resolutions for basic analytes are often obtained using low-pH BGEs which, however, yield
relatively long migration times due to a very low EOF. As in CE-MS, peak heights decrease
with longer migration times, slow migrating analytes show less favourable detection limits.
So from a sensitivity viewpoint, a high EOF may be advantageous. In addition, a high EOF
also avoids migration of ions from the sheath liquid into the CE capillary which may affect
the CE current and cause alterations of analyte migration times as the local composition of
the BGE changes.
BGEs that are normally used in CE(-UV) are frequently nonvolatile as they yield best
separation performances. Such BGEs, like e.g. sodium phosphate buffers, are found to
cause significant ion suppression in ESI-MS and TSI-MS. With nonvolatile BGEs, neutral
compounds also show a strong tendency to be detected as alkali-ion adducts upon ESI.
Even stronger ion suppression is observed in ESI when pseudo-stationary phases (PSPs),
such as sodium dodecyl sulphate (SDS), are employed. SDS is used in micellar
electrokinetic chromatography (MEKC) to enhance CE selectivity or to enable the
separation of neutral analytes. With nonvolatile BGEs, ESI gives rise to the formation of
abundant clusters, such as [Nan(CHOO)n-1]+ or [(SDS)n+Na]+ clusters, which cause
significant background signals and may interfere with analyte detection, especially when a
unit-resolution mass spectrometer is used. Furthermore, the formation of SDS clusters may
result in space-charge effects when ion-trap MS is used. In this case, a reduction of the
loading of the trap is indicated, although this results in a loss of sensitivity.
Gas-phase ionization by APPI or APCI is much more compatible with nonvolatile
BGEs. With these techniques, the use of sodium phosphate or SDS does not result in
significant ion suppression, space-charge effects or formation of background clusters.
Furthermore, compounds that require MEKC for separation are frequently uncharged in
solution and more efficiently ionized by APPI/APCI than by ESI or TSI. In fact, using
SDS, in Chapter 4 detection limits for MEKC-APPI-MS (4.5-71 µM) were found to be a
factor of 1.5-12 better than for MEKC-ESI-MS. In addition, the contamination of the spray
shield by SDS was clearly lower in DA-APPI-MS than in ESI-MS. It is probable that in the
APPI source charged SDS clusters are formed to a much lesser extent with than with ESI-
MS. In addition, in APPI the sprayer tip is located further away from the inlet of the mass
spectrometer which implies that a smaller part of the sample reaches the sampling capillary
or spray shield.
The use of nonvolatile BGEs unavoidably results in contamination of the ion source and
ion-optics of the mass spectrometer. However, due to the low volume flow rates in CE and
Chapter 8
162
the orthogonal design of the ion sources in this thesis, these effects were not pronounced.
For instance, even with MEKC-ESI-MS it was found that once-a-day cleaning of the ion
source and spray shield is sufficient to preserve analyte signal intensities.
4. Applicability
Due to its unique separation principle, CE displays true orthogonality to (reversed-phase)
liquid chromatography (RP)LC. CE-MS can therefore be employed to obtain
complementary information to LC-MS, for instance in the development of stability-
indicating methods or drug impurity profiling. This could enhance the resolving power for
impurities that have high or no retention in LC, or that co-elute with the parent compound.
Additionally, mass spectrometric detection in CE facilitates cross-correlation with
compounds found by e.g. LC-MS, which is indispensible for conclusive characterization of
impurity profiles. CE-MS can also be used for structure elucidation, i.e. by accurate mass
measurements or by MSn experiments, as is for example illustrated by the identification of
an unknown impurity in carbachol (Chapter 7).
The ionization techniques evaluated in these studies are highly complementary and
enable a wide range of analytes to be ionized and detected. For instance, ESI and TSI are
highly suitable for charged impurities, but are relatively inefficient at ionizing compounds
that are (largely) neutral in solution. This type of impurities may be screened for by
employing APPI or APCI. The CE-APPI-MS and CE-APCI-MS systems are suitable for
polar and apolar compounds, but ionic impurities will be missed. In this respect APPI/APCI
and TSI form a strong, complementary combination, which is especially attractive as these
ionization modes can be performed sequentially using a single source, simply by changing
source conditions.
Detection of relevant impurities in bulk drug substances requires minimum detection
limits of 0.1% m/m. This is achievable in CE-MS with each of the four ionization
techniques presented in this thesis. With ESI and TSI detection limits for ionic or ionogenic
compounds are in the low ng/mL range in the full-scan mode. Responses for APPI and
APCI are generally lower than for ESI or TSI, but the developed systems still provide sub-
µM detection limits for most polar and apolar compounds. The detection of impurities
down to the 0.1% level can thus be achieved when 1 mg/mL of parent drug is injected.
Injection of relatively high concentrations of the parent drug carries an intrinsic risk of
(severe) band broadening due to electromigration dispersion and consequently a loss of
resolution. In practice this effect can be limited by selection of an appropriate BGE, for
Conclusions and future perspectives
163
instance by matching the effective mobility of the BGE co-ion with that of the parent drug.
When ESI or TSI is used, choices are often limited as (non-volatile) BGE constituents may
cause ionization suppression and thus compromised sensitivity. APCI and APPI, on the
other hand, enable a much more independent optimization of BGE characteristics, due to
their enhanced compatibility with non-volatile constituents. This feature also facilitates
transfer of common CE-UV methods to CE-MS.
Both neutral and charged compounds may be analysed by MEKC-APPI-MS using SDS
as PSP. In this case, no precautions are needed to prevent SDS from entering the ion source.
However, for neutral compounds, detection limits can be > 1 µg/mL and impurity profiling
may require injection of over 1 mg/mL of parent drug and/or the use of suitable stacking
techniques such as sweeping.
5. Perspectives
Improvement of sensitivity is an issue that deserves further attention in CE-MS. Especially
for CE-APPI-MS and CE-APCI-MS, detection of a broader range of compounds in the
ng/mL-range would be desirable. Furthermore, an improvement in detection limits by one
or perhaps even two orders of magnitude could make CE-ESI-MS or CE-TSI-MS strong
candidates for profiling of low-level impurities such as potential genotoxic compounds
(PGIs). These impurities are often small polar compounds and can therefore readily be
separated by CE.
One option to gain sensitivity in CE-MS is the implementation of on-line sample pre-
concentration by appropriate stacking techniques, such as field-amplified or pH-mediated
stacking. In addition, in MEKC-MS sweeping, which is another stacking technique based
on the reduction in apparent mobility that occurs when analytes reach the PSP zone, may be
explored.
It is widely acknowledged that ionization efficiency in ESI increases with decreasing
flow rates. Therefore, reduction of the sheath-liquid flow rate or the use of sheathless
interfaces is a serious strategy for increasing sensitivity in ESI-MS. However, the practical
application of the latter type of interfaces, which may operate in the nL min-1 range, is
clearly hampered by limited robustness. This problem might be resolvable in the near
future, for instance through robust couplings on a chip, which could increase the use of
nanospray CE-MS systems in pharmaceutical analysis.
With the current APPI and APCI sources, a reduction in sheath-liquid flow rate does not
lead to increased sensitivities. This is mainly because both sources are originally developed
Chapter 8
164
to operate at higher LC flow-rates (≥200 µL min-1). Furthermore, APCI and APPI often
appear to be mass-sensitive ionization techniques, which implies that a reduction in flow
rate would not lead to a gain in sensitivity. Instead, it could be advantageous to redesign the
current APPI and APCI sources to fit the low flow rates of CE. This may, for example, be
achieved by reducing the length of the vaporizer tube or by using an infrared emitter for
sample vaporization.
The use of a multimode ESI/APCI source could provide a number of advantages over
dedicated ion sources. Simultaneous operation of two ionization principles leads to a
broader range of compounds that can be ionized in a single run. Furthermore, the currently
available ESI/APCI source employs infrared drying and can be operated at lower nebulising
gas pressures. This would reduce nebulizer-induced siphoning effects and may thus result
in higher CE separation efficiencies.
A further step could concern the development of microfabricated ion sources that are
specifically optimized for flow rates in the nL min-1 to low-µL min-1 range. These ion
sources may be especially suitable for coupling on-chip CE with MS. In principle, the main
purposes of miniaturization in analytical chemistry are the achievement of faster analysis
times, lower sample consumption, the possibility for multiplexing and a higher degree of
user-friendliness. The limited loadability of CE capillaries, or CE microchannels, may
(partly) be compensated by the possibility to place the CE terminal closer to the sampling
orifice. First investigations in this field have recently reported by the group of Kostiainen
who developed micro-APCI, APPI, and sonic spray ionization (SSI) sources.
Finally, a range of different mass analyzers, including ion trap (IT), triple-quadrupole
(QqQ), time-of-flight (TOF), and hybrid mass spectrometers can be used in CE-MS. These
analyzers bring in a number of additional options regarding sensitivity, mass accuracy,
acquisition rate and MSn capabilities. Currently, CE coupled to time-of-flight (TOF)-MS
appears a powerful combination for pharmaceutical analysis owing to the high sensitivity,
mass accuracy and acquisition rate of the TOF mass analyzer.

165

166

167
Samenvatting in het
Nederlands
Samenvatting in het Nederlands
168
Chemische analyse speelt een essentiële rol bij de ontwikkeling en kwaliteitscontrole van
farmaceutische producten. De werkzaamheid en veiligheid van geneesmiddelen zijn
namelijk in sterke mate gerelateerd aan de chemische zuiverheid van werkzame stof en
hulpstoffen. Onzuiverheden in geneesmiddelen kunnen bijvoorbeeld ontstaan als ongewenst
bijproduct tijdens de synthese of als degradatieproduct. Wijzigingen in bijv. syntheseroute
en productieschaal kunnen aanleiding geven tot nieuwe verontreinigingen. Volgens
internationale richtlijnen dienen alle onzuiverheden waarvan het gehalte boven een
bepaalde limiet (< 0.05-0.1% t.o.v. de werkzame stof) uitkomt, geïdentificeerd te worden.
Tijdens het ontwikkelingsproces van potentiële geneesmiddelen zijn de onzuiverheden
vaak nog onbekend. Het onzuiverheidsprofiel dient door middel van een aantal analytische
technieken vastgesteld te worden. Voor een betrouwbare karakterisering is het vereist dat
de onzuiverheden en werkzame stof eerst van elkaar gescheiden en daarna gedetecteerd
worden. De meest gebruikte scheidingstechniek in de farmaceutische industrie is
vloeistofchromatografie (LC), onder meer vanwege een brede toepasbaarheid voor
thermolabiele en niet-vluchtige verbindingen, en hoge robuustheid. De gangbare methodes
voor drug impurity profiling zijn daarom meestal gebaseerd op scheiding met LC gevolgd
door detectie d.m.v. een spectrometrische techniek zoals ultraviolet (UV) absorptie of
massaspectrometrie (MS). Geen enkele scheidingsmethode is echter op voorhand in staat
om alle mogelijke onzuiverheden van elkaar en van de hoofdverbinding te scheiden en
daarom is de beschikbaarheid van alternatieve scheidingstechnieken van groot belang.
Capillaire elektroforese (CE) is de afgelopen twintig jaar ontwikkeld tot een krachtige
techniek die zeer geschikt is voor scheiding van geneesmiddelen. CE levert zeer efficiënte
scheidingen, korte analysetijden, en verbruikt zeer weinig oplosmiddel en monster. In de
meest basale vorm, capillaire zone elektroforese (CZE), berust het scheidingsprincipe op
verschillen in mobiliteit van geladen verbindingen in een elektrisch veld. De componenten
worden van elkaar gescheiden op basis van de verhouding van lading en molecuulmassa.
Het scheidingsprincipe is niet gecorreleerd aan dat van LC, waarbij scheiding gebaseerd is
op verschillen in verdeling van moleculen tussen een mobiele en een stationaire fase. CZE
kan daarom als een complementaire techniek ten opzichte van LC worden beschouwd. Een
beperking van CZE is dat alleen geladen verbindingen (zuren, basen en zouten) gescheiden
kunnen worden. Voor analyse van neutrale verbindingen is een andere vorm van CE, nl.
micellaire elektrokinetische chromatografie (MEKC), meer geschikt. Deze techniek
combineert de scheidingsprincipes van CZE en LC waardoor zowel geladen als neutrale
verbindingen in één enkele run gescheiden kunnen worden. MEKC kan uitgevoerd worden
Samenvatting in het Nederlands
169
door een oppervlakte-actieve stof zoals natrium dodecylsulfaat (SDS) aan de runbuffer toe
te voegen. Detectie in CE and MEKC wordt meestal op een transparant gedeelte van het
capillair uitgevoerd door middel van een optische techniek als UV spectrometrie. Deze
techniek is echter weinig selectief en wordt gekenmerkt door relatief hoge detectielimieten
vanwege de korte optische weglengte door het CE capillair (<50-100 µm).
De laatste decennia is massaspectrometrie (MS) opgekomen als een krachtige
detectietechniek voor diverse scheidingmethoden. Ten opzichte van andere, gangbare
technieken levert MS een aantal waardevolle mogelijkheden waaronder (i) detectie van
verbindingen zonder UV chromofoor of fluorofoor (ii) massa-selectieve detectie, en (iii) de
mogelijkheid tot het verkrijgen van structuurinformatie via nauwkeurige bepalingen van
molecuulmassa’s en/of molecuulfragmentatie met tandem MS (MS/MS) technieken. Voor
een brede toepasbaarheid van CE binnen de farmaceutische analyse is MS-detectie
onmisbaar. In tegenstelling tot optische technieken kan de koppeling van CE met MS echter
alleen voorbij het uiteinde van het CE capillair plaats vinden. Een dergelijke koppeling is
door het lage debiet in CE (∼100 nanoliter/min) en de noodzaak om een gesloten elektrisch
circuit te vormen, niet eenvoudig.
Momenteel wordt voor de koppeling van CE met MS vrijwel uitsluitend gebruik
gemaakt van interfaces gebaseerd op electrospray ionisatie (ESI). In deze interfaces wordt
de vloeistof uit het CE capillair onder invloed van een sterk elektrisch veld verneveld in een
spray van kleine, geladen, vloeistofdruppels. Tijdens het verdampen van de vloeistof
kunnen verbindingen die in oplossing geladen zijn (ionen) vervolgens door elektrostatische
afstoting in de gasfase terecht komen. Deze ionen kunnen het vacuümgedeelte van de
massaspectrometer worden binnengeleid en vervolgens worden gedetecteerd. Aangezien
zowel CE als ESI met name geschikt zijn voor verbindingen die in oplossing geladen zijn,
is ESI in principe een logische keuze voor de koppeling van CE met MS. Anderzijds wordt
het ESI proces verstoord door niet-vluchtige bestanddelen zoals natrium, fosfaat en boraat,
die vaak in de runbuffer aanwezig zijn voor optimale CE scheidingen. Daarnaast wordt de
brede range van verbindingen die met CE gescheiden kan worden niet volledig afgedekt
door ESI.
Tot op heden hebben er slechts een beperkt aantal andere ionisatietechnieken toepassing
gevonden in CE-MS. CE is gekoppeld met inductief gekoppeld plasma (ICP)-MS voor de
kwantitatieve analyse van metaal bevattende ionen. ICP-MS is erg specifiek en kan zeer
gevoelig zijn, maar geeft geen moleculaire structuurinformatie. Als zodanig is ICP
waardevol voor kwantitatieve bepaling van elementen maar niet voor karakterisering van

Samenvatting in het Nederlands
170
bijvoorbeeld onzuiverheidsprofielen van geneesmiddelen. Een andere techniek die met
enige regelmaat in combinatie met CE wordt gebruikt, is matrix-geassisteerde laser
desorptie ionisatie (MALDI). Deze combinatie is met name geschikt voor de analyse van
biomacromoleculen zoals peptiden en eiwitten. MALDI vereist een speciaal oppervlak voor
ionisatie en vindt plaats onder hoog-vacuum, waardoor een directe koppeling met CE niet
eenvoudig is. In de meeste gevallen worden daarom eerst de fracties van de CE scheiding
opgevangen waarna de MALDI-MS analyse pas in een later stadium wordt uitgevoerd.
Voor laagmoleculaire verbindingen zoals de meeste geneesmiddelen zijn atmosferische
druk chemische ionisatie (APCI), atmosferische druk fotoionisatie (APPI) en thermospray
ionisatie (TSI) zeer geschikte ionisatietechnieken. Met name APCI is een gebruikelijke
techniek in LC-MS en wordt algemeen als sterk alternatief voor ESI beschouwd. APPI is
een nieuwere techniek en minder wijdverbreid, maar is inmiddels een geaccepteerde
techniek in (farmaceutische) laboratoria. In zowel APCI en APPI wordt de vloeistofstroom
van de scheidingstechniek eerst volledig verdampt. De energie benodigd voor ionisatie
wordt vervolgens geleverd door een elektrische ontlading (APCI) of door vacuum-UV licht
(APPI). TSI is net als ESI een vloeistoffase ionisatietechniek waarbij gas-fase ionen
ontstaan tijdens het verdampingsproces.
Bij de start van het project beschreven in dit proefschrift waren er slechts enkele
pogingen tot implementatie van APCI in CE-MS gepubliceerd. Hoewel de haalbaarheid van
deze koppeling is gedemonstreerd, bleken de detectielimieten nog te hoog voor relevante
toepassingen binnen de farmaceutische analyse. De experimentele opstelling voor een CE
systeem met APPI-MS detectie was kort tevoren geïntroduceerd en de voorlopige resultaten
leken veelbelovend. De algemene karakteristieken en mogelijkheden van CE-APPI-MS
waren echter nog nauwelijks in kaart gebracht en vergelijkende gegevens met ESI waren
nog niet beschikbaar. Ook de toepasbaarheid van het systeem voor drug impurity profiling
was nog nauwelijks bestudeerd. De koppeling van CE en MS via TSI was nog niet eerder in
de literatuur beschreven.
In dit proefschrift worden de mogelijkheden onderzocht voor de toepassing van
alternatieve ionisatietechnieken voor de koppeling van CE met MS. Het hoofddoel van de
studies was het uitbreiden van het ionisatiepotentieel om zo de toepasbaarheid van deze
techniek te verbreden, in het bijzonder voor farmaceutische analyse. Daarnaast is
onderzocht of beperkingen van het ESI proces voor CE-MS omzeild kunnen worden door
gebruik van alternatieve ionisatieprincipes. In de onderhavige studie zijn APPI, APCI en
thermospray ionisatie (TSI) als alternatieve ionisatietechnieken onderzocht. Bij alle

Samenvatting in het Nederlands
171
koppelingen is gebruik gemaakt van een CE-MS sprayer met een zgn. sheath-liquid
interface waarbij een elektrisch geleidende vloeistof (1-15 µL/min) langs het uiteinde van
het CE capillair stroomt. De extra vloeistof (sheath-liquid) maakt zowel contact met de
vloeistof uit het CE capillair als met het metalen deel van de sprayer. De metalen sprayer is
eenvoudig te aarden waardoor de stroomkring voor CE gesloten kan worden. De
ionenbronnen die in de studies gebruikt zijn, waren oorspronkelijk ontwikkeld voor LC-
MS. Door een aantal eenvoudige aanpassingen van de hardware kon de koppeling van CE
met MS verwezenlijkt worden. Bij alle studies werd er gebruik gemaakt van een ion trap
massa analysator voor massa-selectieve detectie en MS/MS experimenten. Bij de
ontwikkelde methodes is de invloed van moleculaire eigenschappen op de MS respons
steeds geëvalueerd aan de hand van een reeks testgeneesmiddelen met verschillende
functionele groepen. Daarnaast zijn haalbare detectielimieten van de verschillende CE-MS
systemen in kaart gebracht en vergeleken met ESI. In alle studies is bovendien de
verenigbaarheid van de verschillende systemen met niet vluchtige buffers en SDS
onderzocht aan de hand van de achtergrond massa spectra en ionisatie-efficiëntie van de
analieten.
In hoofdstuk 1 van dit proefschrift worden de uitgangspunten en het doel van het
uitgevoerde onderzoek beschreven. Een literatuuroverzicht van zachte ionisatie technieken
die toepassing hebben gevonden in CE-MS wordt gepresenteerd in Hoofdstuk 2. Allereerst
worden de fundamentele aspecten van de koppeling van CE met MS uiteengezet.
Vervolgens wordt er ingegaan op de principes van ESI en de centrale positie van deze
techniek in CE-MS. De alternatieve ionisatietechnieken worden daarna afzonderlijk
gepresenteerd waarbij de principes en de experimentele set-up van de CE-MS koppelingen
beschreven worden. Daarnaast wordt er ingegaan op de selectiviteit van de verschillende
ionisatie technieken en hun compatibiliteit met niet-vluchtige CE buffers. Ter illustratie
wordt voor iedere techniek een aantal representatieve CE-MS toepassingen behandeld.
In hoofdstuk 3 wordt een vergelijkende studie van APPI en ESI voor CZE-MS
gepresenteerd. De studie omvat een reeks testgeneesmiddelen met verschillende
moleculaire eigenschappen waaronder quaternaire ammonium verbindingen, amines en
steroïden. Daarnaast zijn zowel vluchtige als niet-vluchtige buffers bestudeerd. De
verschillende APPI-MS parameters zijn geoptimaliseerd op basis van signaalintensiteiten
voor de testverbindingen terwijl generieke condities voor ESI-MS zijn gebruikt. Infusie
experimenten laten zien dat niet-vluchtige buffers zoals 10 mM natriumfosfaat (pH 7,0) in

Samenvatting in het Nederlands
172
ESI-MS een signaalreductie van 25-60% veroorzaken ten opzichte van vluchtige buffers.
Bovendien leidt het gebruik van niet-vluchtige buffers tot sterke achtergrondsignalen in de
massaspectra. Daarentegen worden met APPI-MS noch de signaalintensiteiten, noch de
achtergrondspectra beïnvloed door niet-vluchtige buffers. De koppeling van CZE met MS
via zowel ESI als APPI levert efficiënte scheidingen op (schotelgetallen 70.000-200.000)
waardoor vrijwel alle testverbindingen zonder verdere optimalisatie volledig van elkaar
gescheiden kunnen worden. Dankzij de hoge gevoeligheid van ESI blijken de signaal-ruis
verhoudingen in CZE-ESI-MS hoger dan in CZE-APPI-MS detectie, zelfs wanneer niet-
vluchtige buffers worden gebruikt. Tijdens de APPI-MS experimenten is een extra
ionisatiemechanisme waargenomen dat niet afhankelijk is van UV-licht en daardoor ook
optreedt wanneer de stralingsbron word uitgezet.
In hoofdstuk 4 worden APPI en ESI geëvalueerd voor de koppeling van MEKC met
MS. De testverbindingen betreffen zowel geladen verbindingen als neutrale componenten
met verschillende proton affiniteiten (PAs). Om scheiding van neutrale verbindingen
mogelijk te maken is SDS toegevoegd aan een natrium fosfaat buffer van pH 7,5. In ESI-
MS leidt het gebruik van SDS in de runbuffer er toe dat MS signalen voor meer dan 90%
onderdrukt worden. Daarnaast zijn er sterke achtergrondsignalen waargenomen die
toegeschreven kunnen worden aan clusters van SDS. De grote hoeveelheid
achtergrondionen leidt soms tot het optreden van zgn. space-charge effecten in de ion trap.
Deze effecten treden op wanneer de ion trap overvuld is, waardoor de ionen elkaar
elektrostatisch af gaan stoten en de trap niet meer optimaal functioneert. In tegenstelling tot
ESI zijn ion suppressie, SDS-clusters en space-charge effecten niet waargenomen bij
detectie met APPI-MS. Met een lage concentratie SDS (20 mM) levert MEKC-ESI-MS
niettemin iets lagere detectielimieten (2.6-3.1 µM) op voor amines dan MEKC-APPI-MS.
Voor neutrale verbindingen en bij hogere SDS concentraties (50 mM) blijkt MEKC-APPI-
MS echter een factor 1,5-12 gevoeliger. Aangezien de toevoeging van SDS met name van
belang is voor scheiding van neutrale verbindingen, kan geconcludeerd worden dat APPI
een geschiktere ionisatie techniek is voor MEKC-MS dan ESI.
In hoofdstuk 5 wordt het foton-onafhankelijke ionisatie mechanisme (PII), dat
waargenomen is met de APPI bron, verder onderzocht. Wanneer de lichtbron wordt
uitgezet, blijkt detectie van testverbindingen alleen mogelijk wanneer de spanning op het
MS capillair wordt ingesteld binnen de range 500-800 V. In geval van foto-ionisatie
(lichtbron aan) worden de hoogste signaal intensiteiten daarentegen verkregen bij een
spanning van 1000 V of hoger. Verder blijkt PII-MS detectie alleen mogelijk voor
Samenvatting in het Nederlands
173
testverbindingen die reeds in oplossing geladen zijn. Hierdoor kunnen APPI en PII als
complementaire technieken worden beschouwd; neutrale verbindingen kunnen alleen
geïoniseerd worden door APPI, terwijl permanent geladen analieten zoals quaternaire
ammonium verbindingen alleen door PII-MS gedetecteerd kunnen worden. Basische
verbindingen als amines kunnen via beide mechanismen geïoniseerd en gedetecteerd
worden. In tegenstelling tot APPI blijkt het PII proces onderdrukt te worden door de niet-
vluchtige buffer bestanddelen natriumfosfaat en SDS. PII-MS blijkt ook plaats te vinden
wanneer de vaporizer op 25 ◦C wordt gezet, al zijn de signaalintensiteiten in dit geval lager
dan bij 300 ◦C. Op basis van deze bevindingen wordt geconcludeerd dat PII verloopt via
een vloeistoffase ionisatiemechanisme dat vergelijkbaar is met dat van TSI. Hoewel er
kleine verschillen met TSI bestaan, wordt het PII-mechanisme in hoofdstuk 2, 6 en 7 verder
aangeduid als TSI. Tot slot wordt aangetoond dat APPI en PII onder bepaalde condities
(vacuüm UV bron aan, MS voltage 625 V) tegelijkertijd plaats kunnen vinden waardoor
een bredere range van verbindingen in één CE-MS run gedetecteerd kan worden.
Hoofdstuk 6 beschrijft de koppeling van CE-MS via een orthogonale APCI bron. De
positie van de CE sprayer ten opzichte van de ingang van de APCI bron is geoptimaliseerd
op basis van signaalintensiteiten van een aantal geselecteerde testverbindingen. De
gebruikte APCI-MS opstelling blijkt geschikt voor detectie van zuren, basen en polaire
neutrale componenten. Daarentegen kunnen apolaire verbindingen en zouten niet
gedetecteerd worden. Voor detecteerbare testverbindingen zijn de effecten van de interface
parameters zoals APCI stroomsterkte, MS capillair voltage, temperatuur en de druk van het
vernevelinggas bestudeerd in zowel positieve als negatieve ionen modus. Infusie
experimenten tonen aan dat de APCI-MS signalen niet sterk beïnvloed worden door niet-
vluchtige BGEs of SDS. Dit wordt geïllustreerd door CZE-APCI-MS met vluchtige en niet-
vluchtige BGEs van een testmengsel bestaande uit amines en een steroïde. De
detectiegrenzen voor deze testverbindingen liggen in de range 1-10 µM.
In hoofdstuk 7 wordt de toepasbaarheid van ESI, APCI, APPI en TSI als
ionisatiemethoden voor drug impurity profiling met CZE-MS geëvalueerd. Hiervoor zijn
drie geneesmiddelen geanalyseerd waarvan vooraf potentiële onzuiverheden waren
toegevoegd tot een gehalte van 0.1% (m/m). De geneesmiddelen carbachol, lidocaïne en
proguanil zijn geselecteerd op basis van hun sterk verschillende moleculaire eigenschappen.
In vrijwel alle gevallen kunnen de onzuiverheden zonder verdere optimalisatie van de
moederverbinding worden gescheiden met CZE en op het 0.1% niveau worden
gedetecteerd met behulp van minstens een van de vier CE-MS systemen. Over het

Samenvatting in het Nederlands
174
algemeen blijken ESI en TSI de meest efficiënte ionisatietechnieken, met name voor
onzuiverheden die in oplossing geladen zijn. Voor deze verbindingen zijn detectielimieten
tot 100 ng/mL bereikt in de full-scan mode. De signaalrespons voor APCI en APPI is vaak
lager dan voor ESI, maar was meestal nog voldoende voor detectie op het 0.1% niveau bij
injectie van 1 mg/mL van de moederverbinding. De mogelijkheden van CE-MS voor
impurity profiling worden verder gedemonstreerd door stuctuuropheldering van een
onbekende onzuiverheid in carbachol.
Hoofdstuk 8 geeft algemene conclusies over de ontwikkelde CE-MS systemen. Tot slot
worden er aanbevelingen gedaan voor verder onderzoek en worden toekomstperspectieven
besproken.

175

176

177
List of abbreviations
List of abbreviations
178
APCI atmospheric pressure chemical ionization
APPI atmospheric pressure photoionization
BGE background electrolyte
BIS-tris: tris(hydroxylmethyl)aminomethane bis(2-hydroxyethyl) iminotris
(hydroxyl-methyl)methane
CAE capillary array electrophoresis
2C14DAB dimethylditetradecylammonium bromide
2C18DAB dimethyldioctadecylammonium bromide
CE capillary electrophoresis
CF-FAB continuous-flow fast-atom bombardment
CI chemical ionization
CRM charged residue model
CZE capillary zone electrophoresis
DA-APPI dopant-assisted atmospheric pressure photoionization
DDAB didodecyldimethylammonium bromide
DMA 2,6-dimethylaniline
DMPC 1,2-dimyristoyl-sn-glycero-3-phosphocholine
ECD electron capture dissociation
EESI electrosonic spray ionization
EI electon ionization
ESI electrospray ionization
FAB fast-atom bombardment
ICC ion-charge control
ICP inductively coupled plasma
IE ionization energy
IEM ion evaporation model
ISP ion spray
IT ion trap
LC liquid chromatography
LOD limit of detection
MAAH microwave-assisted acid hydrolysis
MALDI matrix-assisted laser desorption ionization
MEEKC microemulsion electrokinetic chromatography
MEKC micellar electrokinetic chromatography
List of abbreviations
179
MES 2-[N-morpholino]ethanesulfonic acid
MOB methyl 4-hydroxybenzoate
MS mass spectrometry
MS/MS tandem MS
m/z mass-to-charge ratio
NMR nuclear magnetic resonance
PA proton affinity
PAH polycyclic aromatic hydrocarbon
PGI potential genotoxic impurity
Ph.Eur. European Pharmacopoeia
PI photoionization
PII photon-independent ionization
POB propyl 4-hydroxybenzoate
PSP pseudostationary phase
QqQ triple-quadrupole
ROBIN rotating ball interface
RPLC reversed-phase liquid chromatography
RSD relative standard deviation
SDS sodium dodecyl sulfate
SIM selected-ion monitoring
S/N signal-to-noise ratio
SSI sonic spray ionization
THAP 2,4,6-trihydroxyacetophenone
TIC total ion current
TIE total ion electropherogram
TOF time-of-flight
TSI thermospray ionization
USP United States Pharmacopoeia
UV ultra violet
VD vacuum deposition
VUV vacuum ultra violet
XIE extracted-ion electropherogram

180

181
Curriculum vitae

Curriculum vitae
182
Curriculum vitae
183
Paul Hommerson werd geboren op 20 augustus 1980 te Rhenen. Na het behalen van het
gymnasium diploma aan de Philips van Horne scholengemeenschap te Weert begon hij in
1998 met de studie farmacie aan de Universiteit Utrecht. De doctoraalfase werd afgerond
met een onderzoeksstage bij de disciplinegroep farmacotherapie en farmacoepidemiologie
onder supervisie van Dr. O.H. Klungel. Tijdens de apothekersopleiding volgde Paul als
specialisatie het geneesmiddel-profiel waarbij hij kennis maakte met het onderzoek van de
groep van Prof. dr. G.J. de Jong. In augustus 2004 behaalde hij het apothekersdiploma. In
oktober van datzelfde jaar begon hij aan het onderzoek beschreven in dit proefschrift onder
leiding van Prof. dr. G.J. de Jong. Een deel van dit onderzoek werd uitgevoerd bij
AstraZeneca Pharmaceuticals (Macclesfield, Engeland). Onderzoeksresultaten zijn onder
meer gepresenteerd in de vorm van lezingen tijdens de Young Pharmaceutical Scientist
Meeting van het Pharmaceutical Sciences World Congress in Amsterdam (2007) en tijdens
de jaarlijkse bijeenkomst van de American Society for Mass Spectrometry in Denver
(2008). Na afloop van het promotieonderzoek is Paul aangesteld als docent/onderzoeker.
Zijn huidige onderzoek richt zich op de multivariate analyse van CE-MS data voor
metabolomics. Een gedeelte van dit onderzoek werd uitgevoerd aan de Universiteit van
Uppsala (Zweden) in samenwerking met de groep van Prof. dr. J. Bergquist.

184

185
List of publications

186
List of publications
187
P. Hommerson, A.M. Khan, G.J. de Jong, G.W. Somsen, Ionization techniques in capillary
electrophoresis–mass spectrometry: principles, design and application. To be submitted
(Chapter 2).
P. Hommerson, A.M. Khan, G.J. de Jong, G.W. Somsen, Comparison of atmospheric
pressure photoionization and electrospray ionization for capillary zone electrophoresis–
mass spectrometry of drugs. Electrophoresis 2006, 28 (9), 1444-1453 (Chapter 3).
P. Hommerson, A. M. Khan, G. J. de Jong, G. W. Somsen, Comparison of electrospray
ionization and atmospheric pressure photoionization for coupling of micellar electrokinetic
chromatography with ion trap mass spectrometry. Journal of Chromatography A 2008,
1204 (2), 197-203 (Chapter 4).
P. Hommerson, A. M. Khan, T. Bristow, W. Niessen, G. J. de Jong, G. W. Somsen,
Photon-independent gas-phase-ion formation in capillary electrophoresis–mass
spectrometry using atmospheric pressure photoionization. Analytical Chemistry 2007, 79
(14), 5351-5357 (Chapter 5).
P. Hommerson, A. M. Khan, G. J. de Jong, G. W. Somsen, Capillary electrophoresis-
atmospheric pressure chemical ionization mass spectrometry using an orthogonal
interface: set-up and system parameters. Journal of the American Society for Mass
Spectrometry 2009, in press (Chapter 6).
P. Hommerson, A.M. Khan, T. Bristow, M.W. Harrison, G.J. de Jong, G.W. Somsen, Drug
impurity profiling by capillary electrophoresis-mass spectrometry using various ionization
techniques. Submitted (Chapter 7).