Ionization characteristics of amino acids in direct analysis in ...
18
Analyst Ionization characteristics of amino acids in direct analysis in real time mass spectrometry Kanako Sekimoto 1* , Motoshi Sakakura 2 , Takatomo Kawamukai 2 , Hiroshi Hike 2 , Teruhisa Shiota 2 , Fumihiko Usui 2 , Yasuhiko Bando 2 and Mitsuo Takayama 1 1 Graduate School of Nanobioscience, Yokohama City University, 22-2 Seto, Kanazawa-ku, Yokohama, Kanagawa, 236-0027 Japan 2 AMR Inc., 13-18 Nakane-2, Meguro-ku, Tokyo, 152-0031 Japan Electronic Supplementary Material Electronic Supplementary Material (ESI) for Analyst. This journal is © The Royal Society of Chemistry 2014
-
Upload
khangminh22 -
Category
Documents
-
view
5 -
download
0
Transcript of Ionization characteristics of amino acids in direct analysis in ...

Analyst
Ionization characteristics of amino acids in direct analysis in real time
mass spectrometry
Kanako Sekimoto1*, Motoshi Sakakura2, Takatomo Kawamukai2, Hiroshi Hike2, Teruhisa
Shiota2, Fumihiko Usui2, Yasuhiko Bando2 and Mitsuo Takayama1
1 Graduate School of Nanobioscience, Yokohama City University, 22-2 Seto, Kanazawa-ku,
Yokohama, Kanagawa, 236-0027 Japan
2 AMR Inc., 13-18 Nakane-2, Meguro-ku, Tokyo, 152-0031 Japan
Electronic Supplementary Material
Electronic Supplementary Material (ESI) for Analyst.This journal is © The Royal Society of Chemistry 2014

Figure S1. (a) Positive- and (b) negative-ion DART mass spectra of glycine (Gly; Mr 75).
ABP represents the absolute abundance (arbitrary units) of the base peak in each mass
spectrum.

Figure S2. (a) Positive- and (b) negative-ion DART mass spectra of L-alanine (Ala; Mr 89).
ABP represents the absolute abundance (arbitrary units) of the base peak in each mass
spectrum.
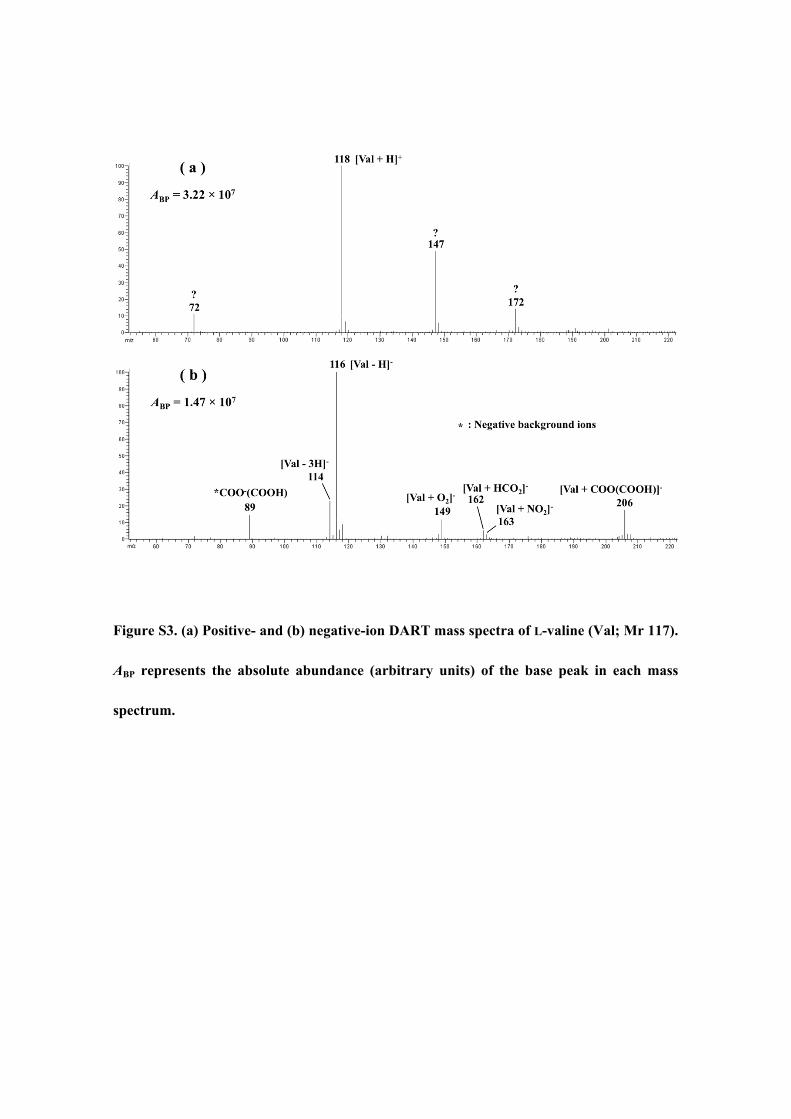
Figure S3. (a) Positive- and (b) negative-ion DART mass spectra of L-valine (Val; Mr 117).
ABP represents the absolute abundance (arbitrary units) of the base peak in each mass
spectrum.

Figure S4. (a) Positive- and (b) negative-ion DART mass spectra of L-leucine (Leu; Mr
131). ABP represents the absolute abundance (arbitrary units) of the base peak in each
mass spectrum.

Figure S5. (a) Positive- and (b) negative-ion DART mass spectra of L-isoleucine (Ile; Mr
131). ABP represents the absolute abundance (arbitrary units) of the base peak in each
mass spectrum.

Figure S6. (a) Positive- and (b) negative-ion DART mass spectra of L-serine (Ser; Mr 105).
ABP represents the absolute abundance (arbitrary units) of the base peak in each mass
spectrum.

Figure S7. (a) Positive- and (b) negative-ion DART mass spectra of L-threonine (Thr; Mr
119). ABP represents the absolute abundance (arbitrary units) of the base peak in each
mass spectrum.

Figure S8. (a) Positive- and (b) negative-ion DART mass spectra of L-glutamine (Gln; Mr
146). ABP represents the absolute abundance (arbitrary units) of the base peak in each
mass spectrum.

Figure S9. (a) Positive- and (b) negative-ion DART mass spectra of L-lysine (Lys; Mr 146).
ABP represents the absolute abundance (arbitrary units) of the base peak in each mass
spectrum.

Figure S10. (a) Positive- and (b) negative-ion DART mass spectra of L-aspartic acid (Asp;
Mr 133). ABP represents the absolute abundance (arbitrary units) of the base peak in each
mass spectrum.

Figure S11. (a) Positive- and (b) negative-ion DART mass spectra of L-methionine (Met;
Mr 149). ABP represents the absolute abundance (arbitrary units) of the base peak in each
mass spectrum.

Figure S12. (a) Positive- and (b) negative-ion DART mass spectra of L-cysteine (Cys; Mr
121). ABP represents the absolute abundance (arbitrary units) of the base peak in each
mass spectrum.

Figure S13. (a) Positive- and (b) negative-ion DART mass spectra of L-phenylalanine (Phe;
Mr 165). ABP represents the absolute abundance (arbitrary units) of the base peak in each
mass spectrum.

Figure S14. (a) Positive- and (b) negative-ion DART mass spectra of L-proline (Pro; Mr
115). ABP represents the absolute abundance (arbitrary units) of the base peak in each
mass spectrum.

Figure S15. (a) Positive- and (b) negative-ion DART mass spectra of L-tryptophane (Trp;
Mr 204). ABP represents the absolute abundance (arbitrary units) of the base peak in each
mass spectrum.
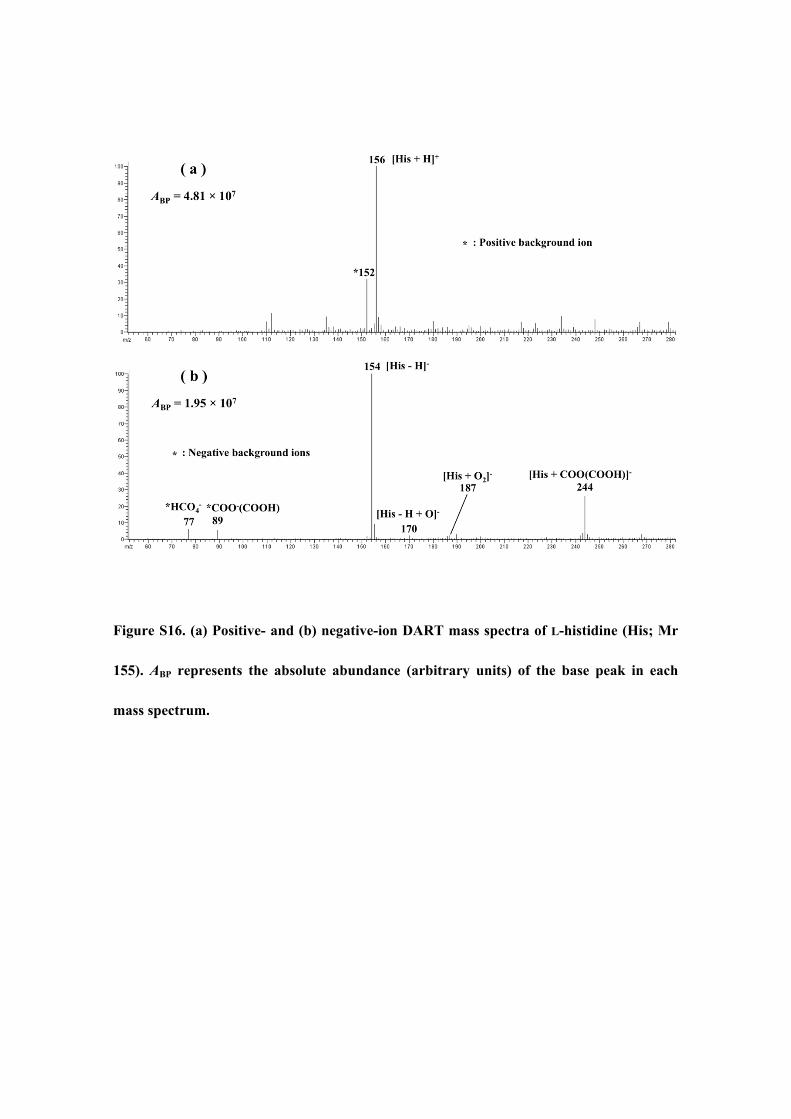
Figure S16. (a) Positive- and (b) negative-ion DART mass spectra of L-histidine (His; Mr
155). ABP represents the absolute abundance (arbitrary units) of the base peak in each
mass spectrum.

Table S1. Absolute abundances of deprotonated analytes [M – H]- (M: Gly, Val, Asp and
Phe) obtained under ambient air condition and N2 atmosphere condition in the closed
analyte ionization area.