
A Reexamination of Correlations of Amino Acids with Particular Secondary Structures
13
A Reexamination of Correlations of Amino Acids with Particular Secondary Structures Sas ˇa N. Malkov Miodrag V. Z ˇ ivkovic ´ Milos ˇ V. Beljanski Srd ¯an Ð. Stojanovic ´ Snez ˇana D. Zaric ´ Published online: 12 March 2009 Ó Springer Science+Business Media, LLC 2009 Abstract Using the data from Protein Data Bank the correlations of primary and secondary structures of proteins were analyzed. The correlation values of the amino acids and the eight secondary structure types were calculated, where the position of the amino acid and the position in sequence with the particular secondary structure differ at most 25. The diagrams describing these results indicate that correlations are significant at distances between -9 and 10. The results show that the substituents on Cb or Cc atoms of amino acid play major role in their preference for particular secondary structure at the same position in the sequence, while the polarity of amino acid has significant influence on a-helices and strands at some distance in the sequence. The diagrams corresponding to polar amino acids are noticeably asymmetric. The diagrams point out the exchangeability of residues in the proteins; the amino acids with similar diagrams have similar local folding requirements. Keywords Protein Amino acid Protein secondary structure Statistical correlation Abbreviations DSSP Define secondary structure of proteins the standard method for assigning secondary structure to the amino acids of a protein with determined atomic-resolution coordinates of the protein PDB Protein data bank a repository for 3-D structural data of proteins and nucleic acids PDBSELECT PDB selection of a representative set of PDB chains 1 Introduction Understanding relation of primary and secondary structure of proteins is very important. There are many methods that consider protein folding and many of them use some information about the protein secondary structure [6, 8, 17–19, 30, 34, 35, 37, 38, 47, 56, 60, 61, 66]. Conformational preferences of amino acids, usually called propensities, are used to predict secondary and tertiary structures of pro- teins. Propensities of amino acids were introduced long time ago and it is known that amino acids have various propensities for the adoption of helical, strand, and random Electronic supplementary material The online version of this article (doi:10.1007/s10930-009-9166-3) contains supplementary material, which is available to authorized users. S. N. Malkov M. V. Z ˇ ivkovic ´ Department of Mathematics, University of Belgrade, Studentski Trg 16, 11000 Belgrade, Serbia S. N. Malkov e-mail: [email protected] M. V. Z ˇ ivkovic ´ e-mail: [email protected] M. V. Beljanski Institute of General and Physical Chemistry, Studentski Trg 16, 11000 Belgrade, Serbia e-mail: [email protected] S. Ð. Stojanovic ´ IHTM—Department of Chemistry, University of Belgrade, Njegos ˇeva 12, 11001 Belgrade, Serbia e-mail: [email protected] S. D. Zaric ´(&) Department of Chemistry, University of Belgrade, Studentski Trg 16, 11000 Belgrade, Serbia e-mail: [email protected] 123 Protein J (2009) 28:74–86 DOI 10.1007/s10930-009-9166-3
Transcript of A Reexamination of Correlations of Amino Acids with Particular Secondary Structures
A Reexamination of Correlations of Amino Acids with ParticularSecondary Structures
Sasa N. Malkov Æ Miodrag V. Zivkovic ÆMilos V. Beljanski Æ Srdan Ð. Stojanovic ÆSnezana D. Zaric
Published online: 12 March 2009
� Springer Science+Business Media, LLC 2009
Abstract Using the data from Protein Data Bank the
correlations of primary and secondary structures of proteins
were analyzed. The correlation values of the amino acids
and the eight secondary structure types were calculated,
where the position of the amino acid and the position in
sequence with the particular secondary structure differ at
most 25. The diagrams describing these results indicate that
correlations are significant at distances between -9 and 10.
The results show that the substituents on Cb or Cc atoms of
amino acid play major role in their preference for particular
secondary structure at the same position in the sequence,
while the polarity of amino acid has significant influence
on a-helices and strands at some distance in the sequence.
The diagrams corresponding to polar amino acids are
noticeably asymmetric. The diagrams point out the
exchangeability of residues in the proteins; the amino acids
with similar diagrams have similar local folding
requirements.
Keywords Protein � Amino acid �Protein secondary structure � Statistical correlation
Abbreviations
DSSP Define secondary structure of proteins the
standard method for assigning secondary
structure to the amino acids of a protein
with determined atomic-resolution
coordinates of the protein
PDB Protein data bank a repository for 3-D
structural data of proteins and nucleic
acids
PDBSELECT PDB selection of a representative
set of PDB chains
1 Introduction
Understanding relation of primary and secondary structure
of proteins is very important. There are many methods that
consider protein folding and many of them use some
information about the protein secondary structure [6, 8,
17–19, 30, 34, 35, 37, 38, 47, 56, 60, 61, 66]. Conformational
preferences of amino acids, usually called propensities, are
used to predict secondary and tertiary structures of pro-
teins. Propensities of amino acids were introduced long
time ago and it is known that amino acids have various
propensities for the adoption of helical, strand, and random
Electronic supplementary material The online version of thisarticle (doi:10.1007/s10930-009-9166-3) contains supplementarymaterial, which is available to authorized users.
S. N. Malkov � M. V. Zivkovic
Department of Mathematics, University of Belgrade,
Studentski Trg 16, 11000 Belgrade, Serbia
S. N. Malkov
e-mail: [email protected]
M. V. Zivkovic
e-mail: [email protected]
M. V. Beljanski
Institute of General and Physical Chemistry, Studentski Trg 16,
11000 Belgrade, Serbia
e-mail: [email protected]
S. Ð. Stojanovic
IHTM—Department of Chemistry, University of Belgrade,
Njegoseva 12, 11001 Belgrade, Serbia
e-mail: [email protected]
S. D. Zaric (&)
Department of Chemistry, University of Belgrade, Studentski
Trg 16, 11000 Belgrade, Serbia
e-mail: [email protected]
123
Protein J (2009) 28:74–86
DOI 10.1007/s10930-009-9166-3
coil conformation [9–11, 31, 36, 43, 46, 48]. Levitt
observed that 19 of 20 naturally occurring amino acids
have preferences for only one type of secondary structure,
and deduced a very clear classification of amino acids by
their preferences. It was shown that the preferences and
classification correlate with the chemical structure of
amino acids [36]. Recently, the position dependent amino
acids propensities have been studied [15, 40, 49, 50].
Although a lot is known about secondary and tertiary
protein structure and protein folding, the process of folding
is not understood completely. The molecular mechanism of
protein self-assembly is still an open question [20]. It is
believed that the energetics of side chain interactions
dominate protein folding process. However, it was shown
that secondary structure can determine protein native
conformation, devoid of side chains [21, 26]. Recently,
backbone-based theory of protein folding was proposed,
where the protein folding mechanism is based on backbone
hydrogen bonding [54], while a-helix and b-sheet pro-
pensities are closely connected with the energetics of
peptide hydrogen bonds [3].
Individual amino acids show intrinsic propensities
towards certain secondary structure types [9–11, 31, 36, 40,
43, 46, 48]; however, these preferences are modulated by
the sequence segments within which they reside [12, 44,
71]. Moreover, any amino acid in the protein could have
the influence on secondary structure type at certain posi-
tion. It is estimated that local information contains roughly
65% of the secondary structure information [58]. There are
also approaches that consider non-local interactions in the
sequence [22, 23, 27, 59]. Previous works show that non-
covalent interactions play important role in stabilizing
structures of proteins [33] and that there are many new
types of noncovalent interactions that should be considered
[41, 69, 72–74].
In agreement with the findings that there are many
factors that influence tertiary structure of proteins,
advanced methods for prediction of protein structure are
based on neural networks [42]. The neural networks usage
does not improve the understanding of the relation of
amino acids and their chemical structure to their preference
for secondary structure. This fact indicates that not all
factors influencing protein structure are well understood.
In our previous work, we analyzed the correlations of
primary and secondary structures of proteins at same
position in the sequence using a data from the Protein Data
Bank (PDB) [39]. Although many of our results with this
much larger data set are in accordance with results obtained
in seventies on a very small number of proteins [9–11, 36,
52], we have identified a number of important differences.
Our results show clearly how the chemical structure of
amino acids plays a major role in determining their pref-
erences for specific secondary structures and enabled us to
determine rules for predicting the preference of an amino
acid towards a particular secondary structure type based
only on the chemical structure of its substituents at the Cbor Cc atoms [39]. Based on clear preferences of amino
acids towards certain secondary structures, we classified
amino acids into four groups: a-helix preferrers, strand
preferrers, turn and bend preferrers, and others (the group
containing His and Cys, the amino acids showing no clear
preference for any secondary structure). Our results show
that amino acids in a same group have similar structural
characteristics at their Cb and Cc atoms. All a-helix pre-
ferrers have neither polar heteroatoms on Cb and Cc atoms,
nor branching nor aromatic group on the Cb atom. All
strand preferrers have aromatic groups or branching on the
Cb atom. All turn and bend preferrers have polar hetero-
atom on Cb or Cc atoms or do not have a Cb atom at all.
In present paper we report on the influence of amino
acids on secondary structure along the sequence in terms of
statistical correlation. Similar task was performed before
[53], using information measure instead of correlation, and
with substantially smaller number of proteins. Using the
mathematical method that is very similar to the one used in
our previous work [39], here we consider correlations of
amino acids and particular secondary structures at different
relative positions. That enables us to estimate how far the
dependence of secondary structure on amino acid is dis-
tributed along the chain.
2 Methods
Secondary structure types are denoted using letters: H for
a-helix, B for isolated b-bridge, E for extended strand, G
for 3-helix, I for 5-helix, T for hydrogen bonded turn and
S for bend. All other structural elements that do not
belong to these secondary structure types are considered
coil and denoted by C. Secondary structure types are
often reduced to only three; H, E, and C [32, 57]. Here
we consider all eight secondary structure types, including
coils.
3 Computational Model
Consider a set P of n protein chains. Primary structures of
these protein chains are described by sequences a1,…, an.
Let len(i) denote the length of the sequence ai, and let the
residues of the sequence ai are ai,1,…, ai,len(i), 1 B i B n.
The corresponding assigned secondary structures are
denoted by b1,…, bn, where bi is a sequence bi,1,…, bi,len(i),
1 B i B n.
If A is a logical expression, then the indicator variable
I(A) is defined by:
Correlations of Amino Acids with Particular Secondary Structures 75
123
I Að Þ ¼ 1; A ¼ true
0; A ¼ false
�
Suppose now that a1,…, an and b1,…,bn are the n
random sequences of corresponding lengths. Let
Xij(s) = I(bij = s) and Yij(p) = I(aij = p) denote binary
random variables corresponding to events that the
secondary structure type assigned to residue aij is s, and
that aij is the amino acid p, respectively. Consider the
window in the sequence i, centered at the position j. Let
Zijðs; p; sÞ ¼ XijðsÞYi;jþsðpÞ ð1Þ
denote the random variable corresponding to the joint event
that the secondary structure type assigned to aij (amino acid
at the center of the window) is s and that ai,j?s (amino acid
at the offset s from the window center) is p.
The offset s range is determined by the size of the
window. The definition of Zijðs; p; sÞ is valid only if both j
and j ? s are between 1 and len(i). Let S(s) denote the set
of valid pairs (i, j) for given offset s:
SðsÞ ¼ ði; jÞj1� j; jþ s� lenðiÞf g;
and let T(s) denote the size of S(s).Consider now the random variables. NPS(s,p,s)—the
number of times the amino acid p occurs at distance s from
the position j, where the secondary structure type is s:
NPSðs; p; sÞ ¼XSðsÞ
Zijðs; p; sÞ;
NP(p,s)—the number of occurrences of the amino acid p
at positions j ? s, such that the position j is inside the same
chain, for all secondary structure types s:
NPðp; sÞ ¼X
s
NPSðs; p; sÞ;
NS(s,s)—the number of times the secondary structure
type s is assigned at the position j, such that the position
j ? s is inside the same chain:
NSðs; sÞ ¼X
p
NPSðp; s; sÞ:
The total count of valid sample pairs at distance s is
TðsÞ ¼Xp;s
NPSðs; p; sÞ: ð2Þ
The correlation coefficient of random variables X and Y
is defined by
qðX; YÞ ¼ CovðX; YÞffiffiffiffiffiffiffiffiffiffiffiffiffiffiffiffiffiffiffiffiffiffiffiffiffiffiffiffiVarðXÞVarðYÞ
p ;
(the reader is referred to book [62], for example). If both
variables are binary, then
qðX; YÞ ¼ XY � X YffiffiffiffiffiffiffiffiffiffiffiffiffiffiffiffiffiffiffiffiffiffiffiffiffiffiffiffiffiffiffiffiffiffiffiffiffiXð1� XÞYð1� YÞ
p :
The correlation coefficient is always in the range [-1,
1]. It is 0 if X and Y are independent. The correlation
coefficient is 1 or -1 if and only if the random variables
are linearly dependent.
Consider the correlation of random variables Xij and Yik,
qðXijðsÞ; YikðpÞÞ ¼Zijðs; p; sÞ � XijðsÞ YikðpÞffiffiffiffiffiffiffiffiffiffiffiffiffiffiffiffiffiffiffiffiffiffiffiffiffiffiffiffiffiffiffiffiffiffiffiffiffiffiffiffiffiffiffiffiffiffiffiffiffiffiffiffiffiffiffiffiffiffiffiffiffiffiffiffiffiffiffiffiffi
XijðsÞð1� XijðsÞÞYikðpÞð1� YikðpÞÞq ;
where k = j?s and Zijðs; p; sÞ is defined by Eq. 1.
Assuming that distributions of Xij and Yik depend only on
p, s and s (i.e., they are independent on the sequence choice
and the absolute position inside the sequence), the
correlation coefficients at offset s is estimated by
qðs; p; sÞ ¼ Zðs; p; sÞ � Xðs; sÞ Yðp; sÞffiffiffiffiffiffiffiffiffiffiffiffiffiffiffiffiffiffiffiffiffiffiffiffiffiffiffiffiffiffiffiffiffiffiffiffiffiffiffiffiffiffiffiffiffiffiffiffiffiffiffiffiffiffiffiffiffiffiffiffiffiffiffiffiffiffiffiffiffiffiffiffiffiffiffiffiffiXðs; sÞð1� Xðs; sÞÞYðp; sÞð1� Yðp; sÞÞ
q :
The estimates of means of X, Y and Z are
Xðs; sÞ ¼ NSðs; sÞ=TðsÞ;
Yðp; sÞ ¼ NPðp; sÞ=TðsÞ;
Zðs; p; sÞ ¼ NPSðs; p; sÞ=TðsÞ:
Hence the correlation coefficient estimate is
qðs; p; sÞ ¼NPSðs; p; sÞTðsÞ � NPðp; sÞNSðs; sÞffiffiffiffiffiffiffiffiffiffiffiffiffiffiffiffiffiffiffiffiffiffiffiffiffiffiffiffiffiffiffiffiffiffiffiffiffiffiffiffiffiffiffiffiffiffiffiffiffiffiffiffiffiffiffiffiffiffiffiffiffiffiffiffiffiffiffiffiffiffiffiffiffiffiffiffiffiffiffiffiffiffiffiffiffiffiffiffiffiffiffiffiffiffiffiffiffiffiffiffiffi
NPðp; sÞðTðsÞ � NPðp; sÞÞNSðs; sÞðTðsÞ � NSðs; sÞÞp :
ð3Þ
The value of q(s, p,s) is positive (respectively, negative
and zero) if the pair (p, s) occurs more (respectively, less
and equally) frequently at the distance s than it would
occur if p and s were independent at the distance s.
In order to estimate the significance of the correlation
coefficient, we evaluate the statistics ts
ts ¼ q
ffiffiffiffiffiffiffiffiffiffiffiffiffin� 2
1� q2
s;
where n = T(s). Under the assumption that the correlation
coefficient is 0, the distribution of the statistics ts is
t-distribution with n-2 degrees of freedom (see [62] for
example).
If the sample size n is large, then t-distribution is
approximated by the normal distribution N(0,1). Let the
null hypothesis be that X and Y are independent, i.e., that
there is no dependence of the secondary structure type s on
76 S. N. Malkov et al.
123
amino acid p at distance s. The null hypothesis is consid-
ered false if it implies that the probability to obtain
correlation coefficient estimate with absolute value greater
than calculated is less than 0.001. If the null hypothesis is
true, using the normal distribution approximation we obtain
that the probability of the event ‘‘|ts| is greater than tlim’’ is
0.05 for tlim = 1.96. Hence, the correlation coefficient is
significant, and we consider that X and Y are dependent if
|ts| C 1.96. If we denote the corresponding value of the
correlation coefficient by qlim, then the correlation coeffi-
cient is significant if
qj j � qlim ¼tlimffiffiffiffiffiffiffiffiffiffiffiffiffiffiffiffiffiffiffiffiffiffiffi
t2lim þ n� 2
p ¼ 1:96ffiffiffiffiffiffiffiffiffiffiffiffiffiffiffiffiffi1:84þ np : ð4Þ
We now compare the correlation coefficient with the other
dependency measures—propensity [9–11] and information
measure [53]. Let a = P(bij = s), b = P(aij = p) denote the
probabilities of secondary structure s, and the amino acid p,
respectively. Furthermore, let x = P(bij = s | ai,j?s = p)
denote the conditional probability of secondary structure s at
position i after knowing that the amino acid p is at the
position j ? s.
The ratio x/a is a propensity (generalized, because the
primary and secondary structure are not considered at the
same position). The correlation coefficient
qðs; p; sÞ ¼ ðx� aÞffiffiffiffiffiffiffiffiffiffiffiffiffiffiffiffiffiffiffiffiffiffiffiffiffiffiffiffiffiffiffiffi
b
að1� aÞð1� bÞ
s
is a linear function of x, and the information measure
Iðbij ¼ s : �s; ai;jþs ¼ pÞ ¼ ln1
ð1=xÞ � 1� ln
a
1� a
is a nonlinear, but increasing function of x. We conclude
that for fixed a, b the correlation coefficient is an increasing
function of the information measure (and vice versa). The
advantage of using correlation coefficient instead of
information measure is a consequence of the possibility to
determine the threshold value, below which the correlation
of primary and secondary structures is not significant.
4 Data Sets
As a source of protein data we used Protein Data Bank (PDB),
release #103 from January 2003, containing 18482 proteins
[5]. To assign secondary structures we used the program
DSSP [29]. Some families of proteins are overrepresented in
PDB. Therefore we used PDBSELECT selection of sequen-
ces with threshold of 25% to eliminate redundant data from
the full PDB protein sequences set. PDBSELECT is designed
both to reduce internal homologies and to preserve the
selection representativeness [28]. It contains sequences with
best overall quality, considering sequence source and tech-
nique, resolution, completeness and length. The resulting set
contains 1737 sequences with 282,329 amino acid residues.
The sample size ranges from 244,329 (for |s| = 25) to
282,329 (for s = 0). The corresponding values of qlim are
0.0040 (for |s| = 25), and 0.0037 (for s = 0).
Remark: The correlations are calculated for some other
thresholds, also, and similar results are obtained. While
specific correlation values differ, the trends and the con-
clusions are the same. The method shows a significant
stability. The threshold of 25% is subjectively estimated as
a good measure because smaller thresholds raise redun-
dancy and larger thresholds reduce the sample size.
5 Results and Discussion
The values of correlation of amino acids with secondary
structure types are computed for the PDBSELECT subset
of protein sequences using Eq. 3. The 8160 correlation
values are calculated (8 types of secondary structures, 20
amino acids and 51 different offsets).
Based on preferences of amino acids to participate in
particular secondary structures, determined by their corre-
lation values at offset s = 0, in our previous work we
classified amino acids into four groups: a-helix preferrers
(Ala, Leu, Glu, Gln, Arg, Met, Lys), strand preferrers (Val,
Ile, Tyr, Phe, Thr, Trp), turn and bend preferrers (Gly, Asn,
Pro, Asp, Ser), and the fourth group consisting of amino
acids that do not show clear preference for any particular
secondary structure type (Cys, His) [39]. Amino acids in
each group are ordered according to decreasing correlation
values.
The computed correlation values are represented in
Figs. 1–3. We organize the data according to the classifi-
cation of amino acids based on their preferences towards
certain secondary structures [39] in four groups: a-helix
preferrers, strand preferrers, turn and bend preferrers, and
His and Cys, the amino acids showing no clear preference
for any secondary structure. Since His and Cys do not show
significant correlation values for any of the secondary
structure types the data for these two amino acids are not
presented.
Each figure contains diagrams for one group of amino
acids, with separate diagrams for each amino acid. Each
diagram consists of eight graphs, representing the corre-
lation of particular amino acid and eight secondary
structure types. The diagrams are in full concordance with
previous analysis of correlations of amino acid residues
and secondary structure types at the same position [39].
Moreover, similar shapes of the diagrams of the amino
acids in the same group (Figs. 1–3) are additional support
for our classification of the amino acids.
Correlations of Amino Acids with Particular Secondary Structures 77
123
(a)
-0.06
-0.04
-0.02
0
0.02
0.04
0.06
0.08
0.1
-25
-24
-23
-22
-21
-20
-19
-18
-17
-16
-15
-14
-13
-12
-11
-10 -9 -8 -7 -6 -5 -4 -3 -2 -1 0 1 2 3 4 5 6 7 8 9 10 11 12 13 14 15 16 17 18 19 20 21 22 23 24 25
Ala - H
Ala - E
Ala - T
Ala - B
Ala - G
Ala - I
Ala - S
Ala - C
(b)
-0.06
-0.04
-0.02
0
0.02
0.04
0.06
0.08
0.1
-25
-24
-23
-22
-21
-20
-19
-18
-17
-16
-15
-14
-13
-12
-11
-10 -9 -8 -7 -6 -5 -4 -3 -2 -1 0 1 2 3 4 5 6 7 8 9 10 11 12 13 14 15 16 17 18 19 20 21 22 23 24 25
Leu - H
Leu - E
Leu - T
Leu - B
Leu - G
Leu - I
Leu - S
Leu - C
(c)
-0.06
-0.04
-0.02
0
0.02
0.04
0.06
0.08
-25
-24
-23
-22
-21
-20
-19
-18
-17
-16
-15
-14
-13
-12
-11
-10 -9 -8 -7 -6 -5 -4 -3 -2 -1 0 1 2 3 4 5 6 7 8 9 10 11 12 13 14 15 16 17 18 19 20 21 22 23 24 25
Glu - H
Glu - E
Glu - T
Glu - B
Glu - G
Glu - I
Glu - S
Glu - C
(d)
-0.04
-0.03
-0.02
-0.01
0
0.01
0.02
0.03
0.04
0.05
-25
-24
-23
-22
-21
-20
-19
-18
-17
-16
-15
-14
-13
-12
-11
-10 -9 -8 -7 -6 -5 -4 -3 -2 -1 0 1 2 3 4 5 6 7 8 9 10 11 12 13 14 15 16 17 18 19 20 21 22 23 24 25
Gln - H
Gln - E
Gln - T
Gln - B
Gln - G
Gln - I
Gln - S
Gln - C
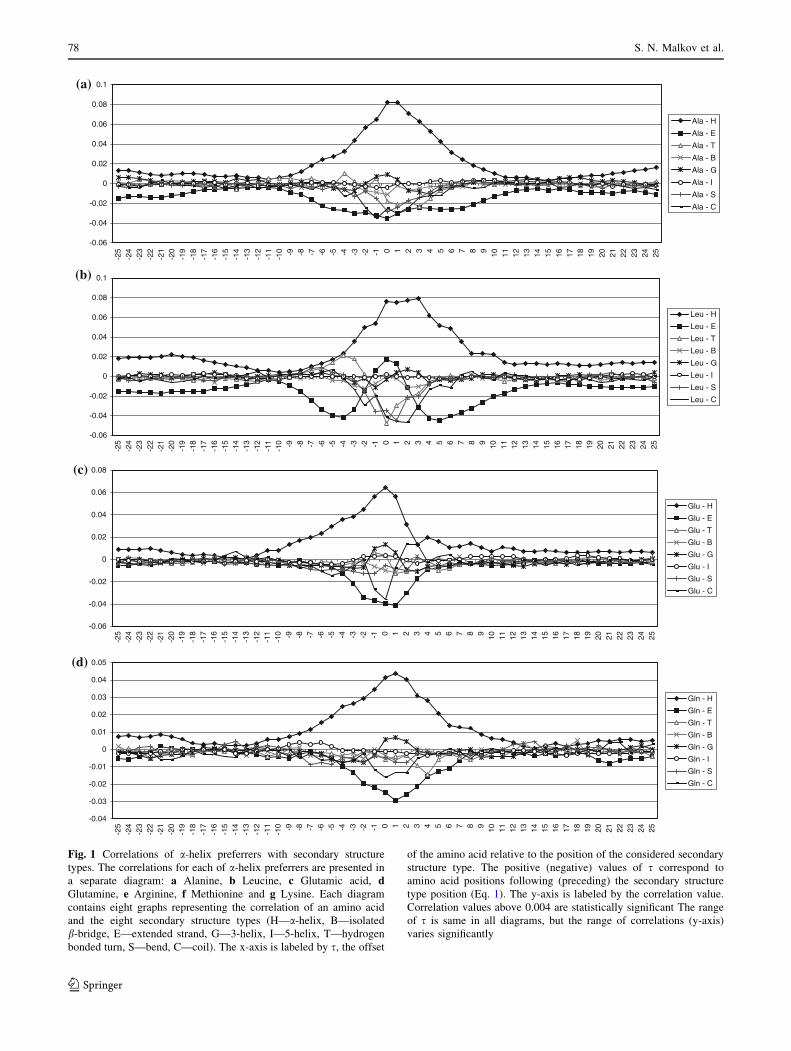
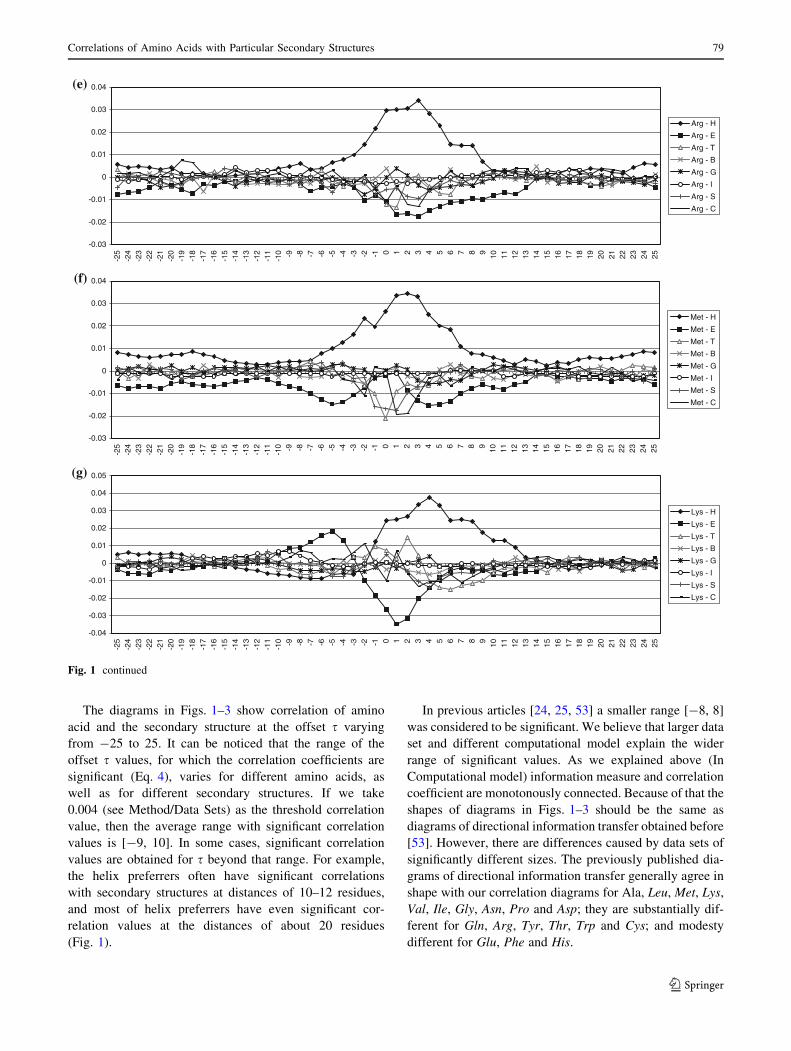
Fig. 1 Correlations of a-helix preferrers with secondary structure
types. The correlations for each of a-helix preferrers are presented in
a separate diagram: a Alanine, b Leucine, c Glutamic acid, dGlutamine, e Arginine, f Methionine and g Lysine. Each diagram
contains eight graphs representing the correlation of an amino acid
and the eight secondary structure types (H—a-helix, B—isolated
b-bridge, E—extended strand, G—3-helix, I—5-helix, T—hydrogen
bonded turn, S—bend, C—coil). The x-axis is labeled by s, the offset
of the amino acid relative to the position of the considered secondary
structure type. The positive (negative) values of s correspond to
amino acid positions following (preceding) the secondary structure
type position (Eq. 1). The y-axis is labeled by the correlation value.
Correlation values above 0.004 are statistically significant The range
of s is same in all diagrams, but the range of correlations (y-axis)
varies significantly
78 S. N. Malkov et al.
123
The diagrams in Figs. 1–3 show correlation of amino
acid and the secondary structure at the offset s varying
from -25 to 25. It can be noticed that the range of the
offset s values, for which the correlation coefficients are
significant (Eq. 4), varies for different amino acids, as
well as for different secondary structures. If we take
0.004 (see Method/Data Sets) as the threshold correlation
value, then the average range with significant correlation
values is [-9, 10]. In some cases, significant correlation
values are obtained for s beyond that range. For example,
the helix preferrers often have significant correlations
with secondary structures at distances of 10–12 residues,
and most of helix preferrers have even significant cor-
relation values at the distances of about 20 residues
(Fig. 1).
In previous articles [24, 25, 53] a smaller range [-8, 8]
was considered to be significant. We believe that larger data
set and different computational model explain the wider
range of significant values. As we explained above (In
Computational model) information measure and correlation
coefficient are monotonously connected. Because of that the
shapes of diagrams in Figs. 1–3 should be the same as
diagrams of directional information transfer obtained before
[53]. However, there are differences caused by data sets of
significantly different sizes. The previously published dia-
grams of directional information transfer generally agree in
shape with our correlation diagrams for Ala, Leu, Met, Lys,
Val, Ile, Gly, Asn, Pro and Asp; they are substantially dif-
ferent for Gln, Arg, Tyr, Thr, Trp and Cys; and modesty
different for Glu, Phe and His.
(e)
-0.03
-0.02
-0.01
0
0.01
0.02
0.03
0.04
-25
-24
-23
-22
-21
-20
-19
-18
-17
-16
-15
-14
-13
-12
-11
-10 -9 -8 -7 -6 -5 -4 -3 -2 -1 0 1 2 3 4 5 6 7 8 9 10 11 12 13 14 15 16 17 18 19 20 21 22 23 24 25
Arg - H
Arg - E
Arg - T
Arg - B
Arg - G
Arg - I
Arg - S
Arg - C
(f)
-0.03
-0.02
-0.01
0
0.01
0.02
0.03
0.04
-25
-24
-23
-22
-21
-20
-19
-18
-17
-16
-15
-14
-13
-12
-11
-10 -9 -8 -7 -6 -5 -4 -3 -2 -1 0 1 2 3 4 5 6 7 8 9 10 11 12 13 14 15 16 17 18 19 20 21 22 23 24 25
Met - H
Met - E
Met - T
Met - B
Met - G
Met - I
Met - S
Met - C
(g)
-0.04
-0.03
-0.02
-0.01
0
0.01
0.02
0.03
0.04
0.05
-25
-24
-23
-22
-21
-20
-19
-18
-17
-16
-15
-14
-13
-12
-11
-10 -9 -8 -7 -6 -5 -4 -3 -2 -1 0 1 2 3 4 5 6 7 8 9 10 11 12 13 14 15 16 17 18 19 20 21 22 23 24 25
Lys - H
Lys - E
Lys - T
Lys - B
Lys - G
Lys - I
Lys - S
Lys - C
Fig. 1 continued
Correlations of Amino Acids with Particular Secondary Structures 79
123
Amino acids belonging to a same group generally tend
to express similar behavior with respect to certain sec-
ondary structure types, not only to the one they prefer, but
also to the others.
Some of the diagrams are roughly symmetric, while
some of them are asymmetric. Roughly symmetric dia-
grams with the maximum at s = 0 indicate that these amino
acids tend to form specific secondary structure, while
roughly symmetric diagrams with the minimum at s = 0
indicate that amino acids tend to disrupt specific secondary
structure. Amino acids with diagrams with maximum for
positive values of s tend to occur at the C-end of the
specific secondary structure, while amino acids with dia-
grams with maximum for negative values of s tend to occur
at the N-end of the specific secondary structure.
All diagrams have largest correlation values for small
values of s (the positions close to particular amino acid)
indicating that there is the strong influence only on the
secondary structure in the vicinity and that local interac-
tions are important for secondary structure. It was shown
that secondary structure is a consequence of local side-
chain-backbone interactions [67]. Based on semiempirical
model [70] and calculated from the first principle [55] it
was quantitatively established that the local interaction
between the side chains and the backbone is dominant
cause of b-sheet propensities of amino acids. It is consid-
ered that the local interactions are responsible for
secondary structure propensities and that locally formed
secondary structures serve to preorganize the folding pro-
cess [1, 4, 13, 45, 68].
The diagrams in Figs. 1–3 reveal agreement with the
data obtained for the exchangeability of residues in evo-
lutionarily related proteins. By analysing the replacement
pattern between amino acids in structurally similar proteins
four strong clusters were observed: (1) Ile and Val, (2) Leu
and Met, (3) Lys, Arg and Gln, and (4) Tyr and Phe [51]. It
has been also shown that the exchangeability of many
residues cannot be described simply in terms of their
chemical properties, however, these residues are con-
formationally similar [7], enabling similar local folding
requirements. Our data also show large similarities in the
diagrams among amino acids in the same cluster. Cluster
(1) Ile and Val, and (4) Tyr and Phe have similar shapes
and similar values of correlation coefficients of the dia-
grams for all secondary structures. Cluster (2) Leu and Met
have very similar shapes of the diagrams, although, the
correlation coefficients are somewhat different, while
cluster (3) Lys, Arg and Gln, have small differences in the
shape of the diagrams and very similar correlation
coefficients.
This demonstrates that the data in Figs. 1–3 posses
important information about secondary structure and can
help in recognizing which substitutions of the amino acids
will not change the secondary structure.
5.1 a-Helix Preferrers
These amino acids support the appearance of a-helices in
their vicinity, but there are differences in their appearance
at different positions within helices (Fig. 1). That is in
agreement with previous results showing that certain amino
acids have preference to be at the beginning or at the end of
a-helix [7, 9–11, 15, 53].
While Ala induces a-helices in its vicinity almost
equally in both directions, the other amino acids from this
group have asymmetrical distribution of the a-helices
support. The asymmetry of Gln’s correlation is not large.
The correlation distribution for amino acids Leu, Arg, Met
and Lys with a-helices is shifted towards positive values of
s, with the largest shift for Lys. On the contrary, the cor-
relation for Glu is strongly shifted towards negative values
of s. That leads to the conclusion that Ala and Gln are
evenly distributed in helices, Leu, Arg, Met and Lys show
tendency to be closer to helix C-ends, while Glu tends to be
very close to a-helices N-terminal. Tendencies of these
amino acids to be at different positions in a-helices are in
agreement with previously calculated propensities of
amino acid in different regions of a-helices [7, 9–11, 15,
53]. It is also known that Lys and Arg stabilize C-terminal
end of a-helices, while Glu stabilizes the N-terminal end of
a-helices [2, 14].
Diagrams of amino acids that belong to the group of
a-helix preferrers have interesting feature that correlation
with a-helix secondary structure is decreasing up to posi-
tions at the distance of 12, however, at the longer distance
the correlation is again somewhat increased at the distances
of 20 positions. The large correlation at shorter distances is
correlation within the same helix. The correlation at longer
distances is consequence of tertiary contact for two helices
packing against each other.
All a-helix preferrers, except Lys, obstruct the formation
of strands in their neighborhood. Lys obstructs the forma-
tion of strands at its and preceding positions, but strongly
supports their formation in subsequent positions, which is
related to its higher a-helix propensity at the helix end. It is
interesting that Leu has strong negative correlation with
strands at distance 5–6 in both directions, although it tends
to build strands. Met is relatively indifferent to appearance
in strands, but it has negative correlation with strands in its
neighborhood.
Lys supports turns formation in its immediate neigh-
borhood. Met obstructs the formation of coils in the
preceding positions. Glu strongly supports the formation of
coils in the preceding positions.
80 S. N. Malkov et al.
123
5.2 Strand Preferrers
Most of amino acids from the strand preferrers group (Val,
Ile, Tyr, Phe, Thr and Trp) do not have positive correlation
with strands at a distance (Fig. 2). Amino acids Ile, Phe
have negative correlation with strands at distance of 4–8,
while Val and Trp have less pronounced but still negative
correlation at the same distance. Trp has stronger negative
correlation for negative values of s. It is interesting that Val
exhibits positive correlation with strands at distances
longer than 8. Tyr is relatively neutral to strands in its
vicinity. Having positive, but small correlation with strands
for all s values, Thr differs from other members of the
group. In previous classification of Thr as a strand preferrer
it was point out that Thr is unique among strand preferrers,
and indeed among all amino acids, because it has almost
the same correlation value with strands and with coils [39].
This is the consequence of the Thr structure. Namely, Thr
has structural characteristics of strand preferrers (branching
on Cb atom) and turn and bend preferrers (polar hetero-
atom at Cb). Hence, quite unique diagrams for Thr could
be anticipated.
Many of strand preferrers have negative correlation with
distant a-helix structures. Thr and Val have negative cor-
relation with a-helices for positive values of s. Ile shows
small positive correlation for almost all positive values of
s. There is also uniform small negative correlation between
Tyr and a-helices for both positive and negative values of s.
(a)
-0.08
-0.06
-0.04
-0.02
0
0.02
0.04
0.06
0.08
0.1
0.12
0.14
-25
-24
-23
-22
-21
-20
-19
-18
-17
-16
-15
-14
-13
-12
-11
-10 -9 -8 -7 -6 -5 -4 -3 -2 -1 0 1 2 3 4 5 6 7 8 9 10 11 12 13 14 15 16 17 18 19 20 21 22 23 24 25
Val - H
Val - E
Val - T
Val - B
Val - G
Val - I
Val - S
Val - C
(b)
-0.08
-0.06
-0.04
-0.02
0
0.02
0.04
0.06
0.08
0.1
0.12
-25
-24
-23
-22
-21
-20
-19
-18
-17
-16
-15
-14
-13
-12
-11
-10 -9 -8 -7 -6 -5 -4 -3 -2 -1 0 1 2 3 4 5 6 7 8 9 10 11 12 13 14 15 16 17 18 19 20 21 22 23 24 25
Ile - H
Ile - E
Ile - T
Ile - B
Ile - G
Ile - I
Ile - S
Ile - C
(c)
-0.03
-0.02
-0.01
0
0.01
0.02
0.03
0.04
0.05
0.06
-25
-24
-23
-22
-21
-20
-19
-18
-17
-16
-15
-14
-13
-12
-11
-10 -9 -8 -7 -6 -5 -4 -3 -2 -1 0 1 2 3 4 5 6 7 8 9 10 11 12 13 14 15 16 17 18 19 20 21 22 23 24 25
Tyr - H
Tyr - E
Tyr - T
Tyr - B
Tyr - G
Tyr - I
Tyr - S
Tyr - C
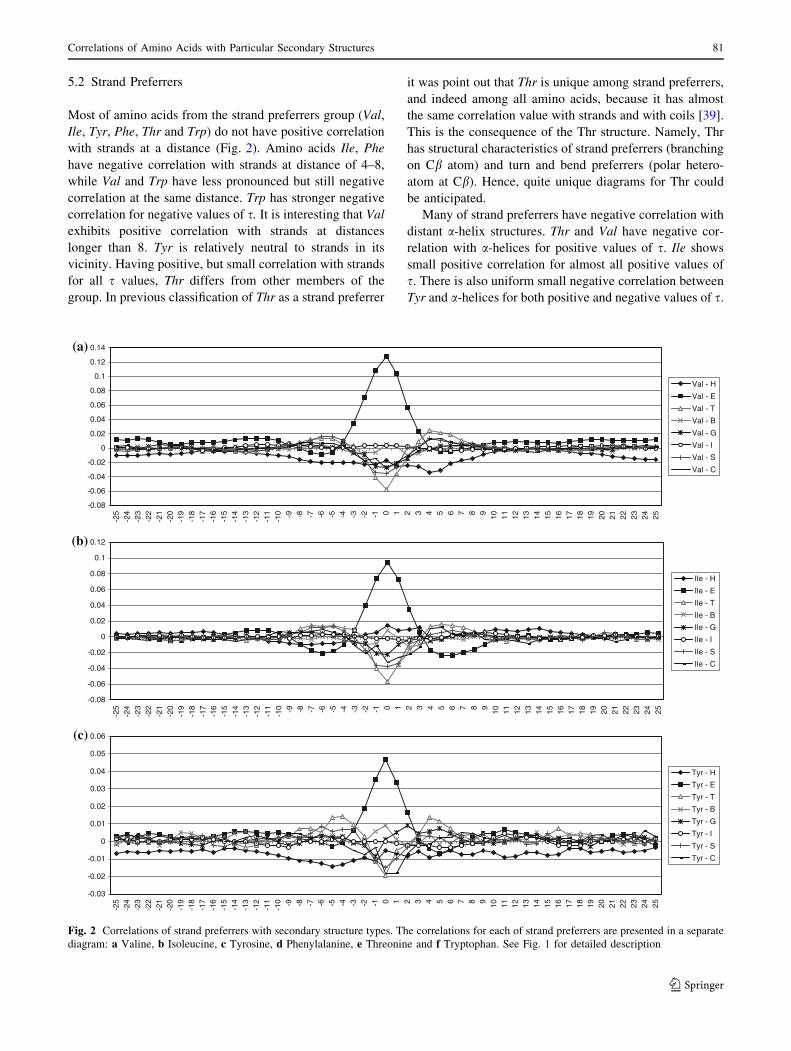
Fig. 2 Correlations of strand preferrers with secondary structure types. The correlations for each of strand preferrers are presented in a separate
diagram: a Valine, b Isoleucine, c Tyrosine, d Phenylalanine, e Threonine and f Tryptophan. See Fig. 1 for detailed description
Correlations of Amino Acids with Particular Secondary Structures 81
123
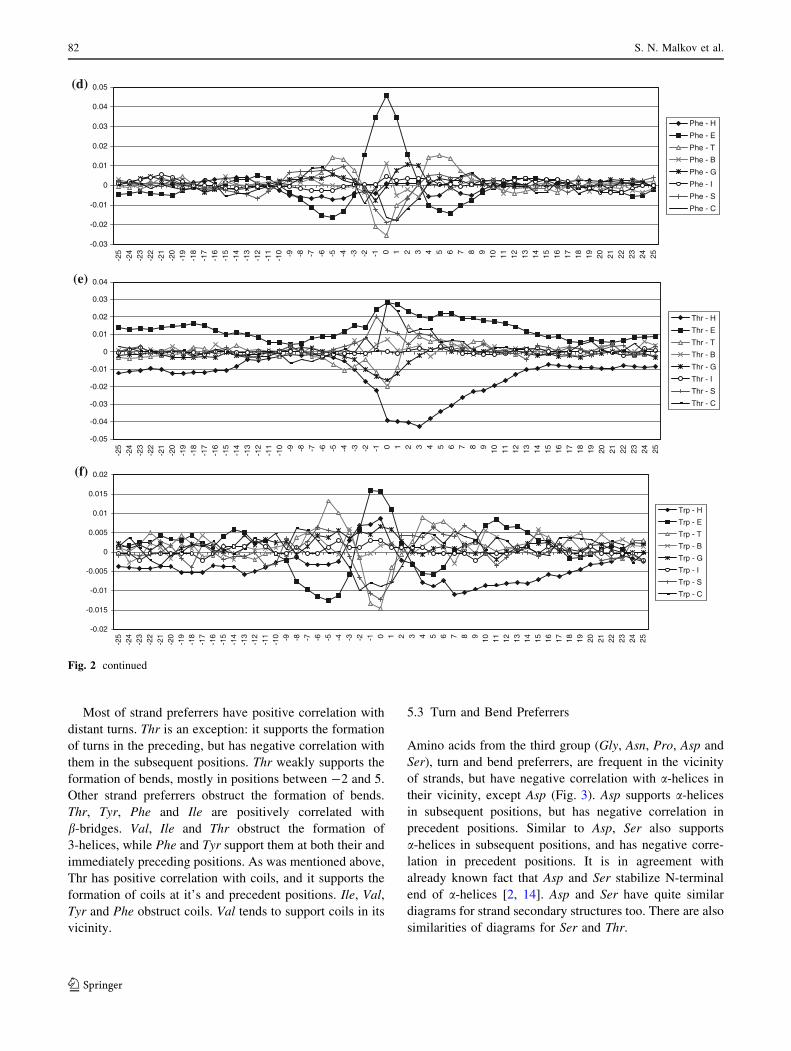
Most of strand preferrers have positive correlation with
distant turns. Thr is an exception: it supports the formation
of turns in the preceding, but has negative correlation with
them in the subsequent positions. Thr weakly supports the
formation of bends, mostly in positions between -2 and 5.
Other strand preferrers obstruct the formation of bends.
Thr, Tyr, Phe and Ile are positively correlated with
b-bridges. Val, Ile and Thr obstruct the formation of
3-helices, while Phe and Tyr support them at both their and
immediately preceding positions. As was mentioned above,
Thr has positive correlation with coils, and it supports the
formation of coils at it’s and precedent positions. Ile, Val,
Tyr and Phe obstruct coils. Val tends to support coils in its
vicinity.
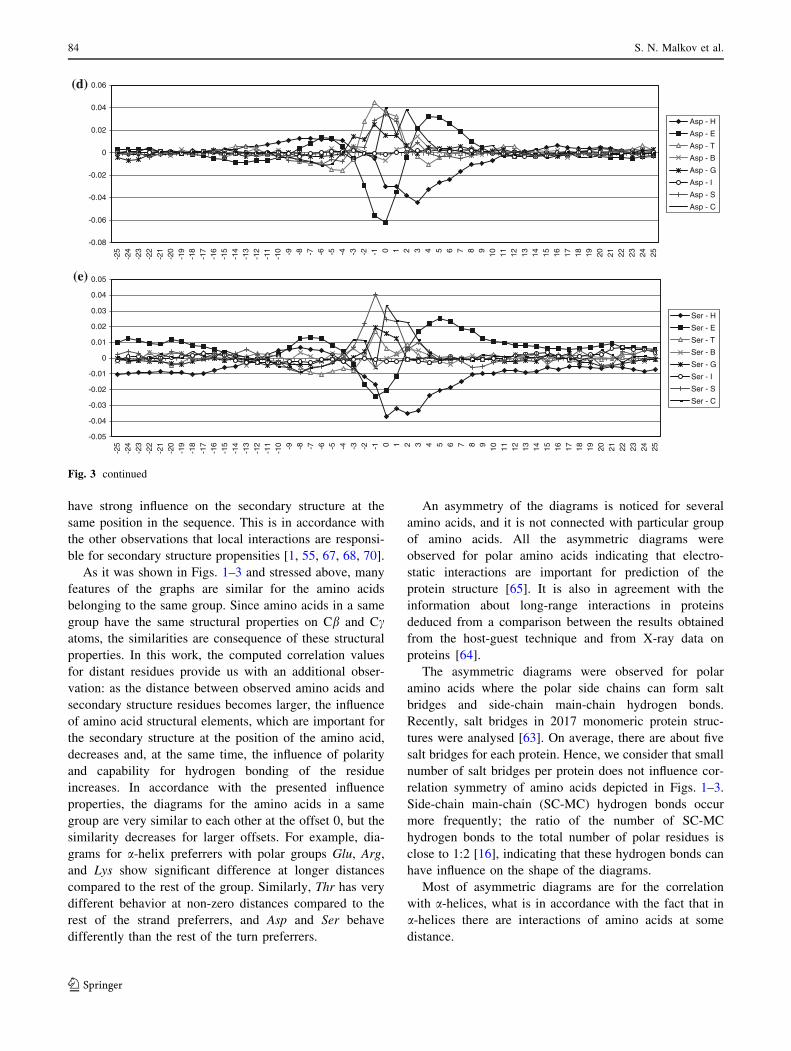
5.3 Turn and Bend Preferrers
Amino acids from the third group (Gly, Asn, Pro, Asp and
Ser), turn and bend preferrers, are frequent in the vicinity
of strands, but have negative correlation with a-helices in
their vicinity, except Asp (Fig. 3). Asp supports a-helices
in subsequent positions, but has negative correlation in
precedent positions. Similar to Asp, Ser also supports
a-helices in subsequent positions, and has negative corre-
lation in precedent positions. It is in agreement with
already known fact that Asp and Ser stabilize N-terminal
end of a-helices [2, 14]. Asp and Ser have quite similar
diagrams for strand secondary structures too. There are also
similarities of diagrams for Ser and Thr.
(d)
-0.03
-0.02
-0.01
0
0.01
0.02
0.03
0.04
0.05
-25
-24
-23
-22
-21
-20
-19
-18
-17
-16
-15
-14
-13
-12
-11
-10 -9 -8 -7 -6 -5 -4 -3 -2 -1 0 1 2 3 4 5 6 7 8 9 10 11 12 13 14 15 16 17 18 19 20 21 22 23 24 25
Phe - H
Phe - E
Phe - T
Phe - B
Phe - G
Phe - I
Phe - S
Phe - C
(e)
-0.05
-0.04
-0.03
-0.02
-0.01
0
0.01
0.02
0.03
0.04
-25
-24
-23
-22
-21
-20
-19
-18
-17
-16
-15
-14
-13
-12
-11
-10 -9 -8 -7 -6 -5 -4 -3 -2 -1 0 1 2 3 4 5 6 7 8 9 10 11 12 13 14 15 16 17 18 19 20 21 22 23 24 25
Thr - H
Thr - E
Thr - T
Thr - B
Thr - G
Thr - I
Thr - S
Thr - C
(f)
-0.02
-0.015
-0.01
-0.005
0
0.005
0.01
0.015
0.02
-25
-24
-23
-22
-21
-20
-19
-18
-17
-16
-15
-14
-13
-12
-11
-10 -9 -8 -7 -6 -5 -4 -3 -2 -1 0 1 2 3 4 5 6 7 8 9 10 11 12 13 14 15 16 17 18 19 20 21 22 23 24 25
Trp - H
Trp - E
Trp - T
Trp - B
Trp - G
Trp - I
Trp - S
Trp - C
Fig. 2 continued
82 S. N. Malkov et al.
123
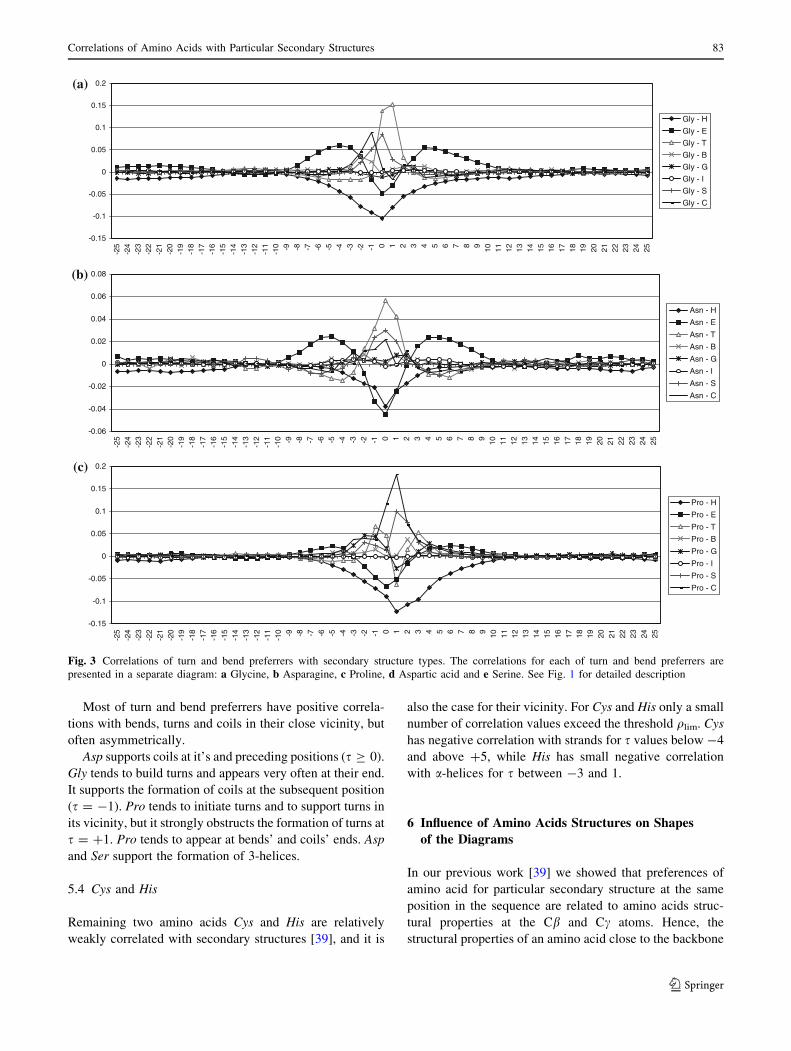
Most of turn and bend preferrers have positive correla-
tions with bends, turns and coils in their close vicinity, but
often asymmetrically.
Asp supports coils at it’s and preceding positions (s C 0).
Gly tends to build turns and appears very often at their end.
It supports the formation of coils at the subsequent position
(s = -1). Pro tends to initiate turns and to support turns in
its vicinity, but it strongly obstructs the formation of turns at
s = ?1. Pro tends to appear at bends’ and coils’ ends. Asp
and Ser support the formation of 3-helices.
5.4 Cys and His
Remaining two amino acids Cys and His are relatively
weakly correlated with secondary structures [39], and it is
also the case for their vicinity. For Cys and His only a small
number of correlation values exceed the threshold qlim. Cys
has negative correlation with strands for s values below -4
and above ?5, while His has small negative correlation
with a-helices for s between -3 and 1.
6 Influence of Amino Acids Structures on Shapes
of the Diagrams
In our previous work [39] we showed that preferences of
amino acid for particular secondary structure at the same
position in the sequence are related to amino acids struc-
tural properties at the Cb and Cc atoms. Hence, the
structural properties of an amino acid close to the backbone
(a)
-0.15
-0.1
-0.05
0
0.05
0.1
0.15
0.2
-25
-24
-23
-22
-21
-20
-19
-18
-17
-16
-15
-14
-13
-12
-11
-10 -9 -8 -7 -6 -5 -4 -3 -2 -1 0 1 2 3 4 5 6 7 8 9 10 11 12 13 14 15 16 17 18 19 20 21 22 23 24 25
Gly - H
Gly - E
Gly - T
Gly - B
Gly - G
Gly - I
Gly - S
Gly - C
(b)
-0.06
-0.04
-0.02
0
0.02
0.04
0.06
0.08
-25
-24
-23
-22
-21
-20
-19
-18
-17
-16
-15
-14
-13
-12
-11
-10 -9 -8 -7 -6 -5 -4 -3 -2 -1 0 1 2 3 4 5 6 7 8 9 10 11 12 13 14 15 16 17 18 19 20 21 22 23 24 25
Asn - H
Asn - E
Asn - T
Asn - B
Asn - G
Asn - I
Asn - S
Asn - C
(c)
-0.15
-0.1
-0.05
0
0.05
0.1
0.15
0.2
-25
-24
-23
-22
-21
-20
-19
-18
-17
-16
-15
-14
-13
-12
-11
-10 -9 -8 -7 -6 -5 -4 -3 -2 -1 0 1 2 3 4 5 6 7 8 9 10 11 12 13 14 15 16 17 18 19 20 21 22 23 24 25
Pro - H
Pro - E
Pro - T
Pro - B
Pro - G
Pro - I
Pro - S
Pro - C
Fig. 3 Correlations of turn and bend preferrers with secondary structure types. The correlations for each of turn and bend preferrers are
presented in a separate diagram: a Glycine, b Asparagine, c Proline, d Aspartic acid and e Serine. See Fig. 1 for detailed description
Correlations of Amino Acids with Particular Secondary Structures 83
123
have strong influence on the secondary structure at the
same position in the sequence. This is in accordance with
the other observations that local interactions are responsi-
ble for secondary structure propensities [1, 55, 67, 68, 70].
As it was shown in Figs. 1–3 and stressed above, many
features of the graphs are similar for the amino acids
belonging to the same group. Since amino acids in a same
group have the same structural properties on Cb and Ccatoms, the similarities are consequence of these structural
properties. In this work, the computed correlation values
for distant residues provide us with an additional obser-
vation: as the distance between observed amino acids and
secondary structure residues becomes larger, the influence
of amino acid structural elements, which are important for
the secondary structure at the position of the amino acid,
decreases and, at the same time, the influence of polarity
and capability for hydrogen bonding of the residue
increases. In accordance with the presented influence
properties, the diagrams for the amino acids in a same
group are very similar to each other at the offset 0, but the
similarity decreases for larger offsets. For example, dia-
grams for a-helix preferrers with polar groups Glu, Arg,
and Lys show significant difference at longer distances
compared to the rest of the group. Similarly, Thr has very
different behavior at non-zero distances compared to the
rest of the strand preferrers, and Asp and Ser behave
differently than the rest of the turn preferrers.
An asymmetry of the diagrams is noticed for several
amino acids, and it is not connected with particular group
of amino acids. All the asymmetric diagrams were
observed for polar amino acids indicating that electro-
static interactions are important for prediction of the
protein structure [65]. It is also in agreement with the
information about long-range interactions in proteins
deduced from a comparison between the results obtained
from the host-guest technique and from X-ray data on
proteins [64].
The asymmetric diagrams were observed for polar
amino acids where the polar side chains can form salt
bridges and side-chain main-chain hydrogen bonds.
Recently, salt bridges in 2017 monomeric protein struc-
tures were analysed [63]. On average, there are about five
salt bridges for each protein. Hence, we consider that small
number of salt bridges per protein does not influence cor-
relation symmetry of amino acids depicted in Figs. 1–3.
Side-chain main-chain (SC-MC) hydrogen bonds occur
more frequently; the ratio of the number of SC-MC
hydrogen bonds to the total number of polar residues is
close to 1:2 [16], indicating that these hydrogen bonds can
have influence on the shape of the diagrams.
Most of asymmetric diagrams are for the correlation
with a-helices, what is in accordance with the fact that in
a-helices there are interactions of amino acids at some
distance.
(d)
-0.08
-0.06
-0.04
-0.02
0
0.02
0.04
0.06
-25
-24
-23
-22
-21
-20
-19
-18
-17
-16
-15
-14
-13
-12
-11
-10 -9 -8 -7 -6 -5 -4 -3 -2 -1 0 1 2 3 4 5 6 7 8 9 10 11 12 13 14 15 16 17 18 19 20 21 22 23 24 25
Asp - H
Asp - E
Asp - T
Asp - B
Asp - G
Asp - I
Asp - S
Asp - C
(e)
-0.05
-0.04
-0.03
-0.02
-0.01
0
0.01
0.02
0.03
0.04
0.05
-25
-24
-23
-22
-21
-20
-19
-18
-17
-16
-15
-14
-13
-12
-11
-10 -9 -8 -7 -6 -5 -4 -3 -2 -1 0 1 2 3 4 5 6 7 8 9 10 11 12 13 14 15 16 17 18 19 20 21 22 23 24 25
Ser - H
Ser - E
Ser - T
Ser - B
Ser - G
Ser - I
Ser - S
Ser - C
Fig. 3 continued
84 S. N. Malkov et al.
123
The large asymmetry for a-helices is observed for Glu
and Asp. It is interesting that both of them have carboxyl
groups. Although Glu has large positive correlation values
with helices, and Asp has large negative values, both have
decreased correlation for positive s values. It is observed
that both of them have significant propensities for N-end of
helix [7]. Glu forms SC-MC i/i-3 hydrogen bonds in
helices, while Asp forms i ? 2/i and i ? 3/i in N-end of
helices [16].
The asymmetry of the diagrams for a-helices is also
pronounced for amino acids with amino groups, Arg and
Lys. These two amino acids have asymmetric diagrams for
strands, too. It is connected with their large propensity to
be located in C-end of the helices [7].), and it is more
pronounced for Lys with larger propensity. Leu and Met
also have propensities, but smaller than Lys and Arg to be
in the C-end of the helices [7]. Leu and Met have less
asymmetric diagrams, but also have maximum correlation
values for positive s. Less asymmetry is connected with the
fact that they are not polar.
The diagrams for a-helix and strands for Asp and Ser are
very similar. They are asymmetric and quite different than
the diagrams for other turn and bend preferrers. This is
related to the similarities in the structures of Asp and Ser—
both of them have polar oxygen atoms, carboxyl and
hydroxyl group, respectively. Similar shape of the diagram
for a-helix has Thr. It could be anticipated since Thr and
Ser form similar SC-MC hydrogen bonds. Namely, both of
them have high propensities for i/i-4 and i/i-3 hydrogen
bonds, and somewhat lower propensities for i ? 2/i and
i ? 3/i bonds; where i ? 2/i propensity for Thr is the
lowest (1.07) [16]. Most of the i/i-4 bonds are inside of
a-helices, while some of them are in C-terminal end. Most
of the i/i-3 hydrogen bonds occur at the C-terminal end,
however, some of them are at the N-terminal end of
a-helices and in b-structures. Majority of i ? 2/i and i ? 3/
i interactions occur in the b-structure at i and the secondary
structure of the following residues are bridge or a-helices
[16].
Considering strand preferrers, the diagrams for Thr and
Trp are quite different from the rest of the diagrams in the
group. The difference is the consequence of heteroatoms in
the structures of Thr and Trp.
7 Conclusions
Calculating correlations of amino acids with particular
secondary structures, we determined amino acids tendency
to influence the secondary structure along the sequence.
The diagrams representing correlations of amino acids
with secondary structures at neighboring positions, for
offset s values from -25 to 25, reveal that correlations are
generally significant at distances in the range between -9
and 10, depending on both the amino acid and the sec-
ondary structure type. The shapes of the diagrams are
related to structural properties of amino acids. The largest
asymmetry is observed for polar amino acids and amino
acids that can form hydrogen bonds.
Our previous results show that the structural elements on
Cb or Cc atoms of amino acid, and not their polarity, play
major role in their preference for a-helices and strands at
the same position in the sequence. However, results pre-
sented here show that polarity of amino acids plays
important role in forming a-helices and strands at some
distance in the sequence.
The amino acids with similar diagrams have similar
local folding requirements, hence, they show which sub-
stitutions of the amino acids will not change the secondary
structure.
The diagrams posses important information about
influence of amino acid on local secondary structure that
could be useful in secondary structure predictions and in
prediction of possible amino acid replacement by others
having similar local folding requirements.
Acknowledgments This work was supported under projects No
144030 and No 142037 by the Ministry of Science of Republic of
Serbia.
References
1. Aurora R, Creamer TP, Srinivasan R, Rose GD (1997) J Mol Biol
272:1413–1416
2. Aurora R, Rose GD (1998) Protein Sci 7:21–38
3. Baldwin RL (2007) J Mol Biol 371:283–301
4. Baldwin RL (2008) Annual Rev Biophys 37:1–21
5. Berman HM, Westbrook J, Feng Z, Gilliland G, Bhat TN,
Weissig H, Shindyalov IN, Bourne PE (2000) Nucleic Acids Res
28(1):235–242
6. Bowie JU, Luthy R, Eisenberg D (1991) Science 253:164–170
7. Chakrabarti P, Pal D (2001) Prog Biophys Mol Biol 76:1–102
8. Chen CC, Singh JP, Altman RB (1999) Bioinformatics 15:53–65
9. Chou PY, Fasman GD (1974) Biochemistry 13:222–245
10. Chou PY, Fasman GD (1974) Biochemistry 13(2):211–222
11. Chou PY, Fasman GD (1978) Adv Enzymol Relat Areas Mol
Biol 47:45–148
12. Dalal S, Balasubramanian S, Regan L (1998) Nat Struct Biol
4:548–552
13. Dill KA, Ozkan SB, Shell MS, Weikl TR (2008) Annu Rev
Biophys 37:289–316
14. Doig AJ, Baldwin RL (1995) Protein Sci 4:1325–1336
15. Engel DE, DeGrado WF (2004) J Mol Biol 337(5):1195–1205
16. Eswar N, Ramakrishnan C (2000) Protein Eng 13:227–238
17. Eyrich VA, Standley DM, Felts AK, Friesner RA (1999) Proteins
35:41–57
18. Eyrich VA, Standley DM, Friesner RA (1999) J Mol Biol
288:725–742
19. Fischer D, Eisenberg D (1996) Protein Sci 5:947–955
20. Fitzkee NC, Fleming PJ, Gong H, Panasik N Jr, Street TO, Rose
GD (2005) Trends Biochem Sci 30:73–80
Correlations of Amino Acids with Particular Secondary Structures 85
123
21. Fleming PJ, Gong HP, Rose GD (2006) Protein Sci 15(8):1829–
1834
22. Frishman D, Argos P (1996) Protein Eng 9:133–142
23. Frishman D, Argos P (1997) Proteins 27:329–335
24. Garnier J, Osguthorpe DJ, Robson B (1978) J Mol Biol 120:97–
120
25. Gibrat JF, Garnier J, Robson B (1987) J Mol Biol 198:425–443
26. Gong H, Fleming PJ, Rose GD (2005) Proc Natl Acad Sci USA
102(45):16227–16232
27. Gromiha MM, Selvaraj S (2004) Prog Biophys Mol Biol
86(2):235–277
28. Hobohm U, Sander C (1994) Protein Sci 3:522–524
29. Kabsch W, Sander C (1983) Biopolymers. 22(12):2577–2637
30. Kelley LA, MacCallum RM, Sternberg MJE (2000) J Mol Biol
299:499–520
31. Kim CA, Berg JM (1990) Nature 362:267–270
32. Kloczkowski A, Ting KL, Jernigan RL, Garnier J (2002) Proteins
49:154–166
33. Koehl P, Levitt M (1999) Proc Natl Acad Sci 96:12524–12529
34. Koretke KK, Luthey-Schulten L, Wolynes PG (1998) Proc Natl
Acad Sci USA 95:2932–2937
35. Levitt M, Warshel A (1975) Nature 253:694–698
36. Levitt M (1978) Biochemistry 17:4277–4285
37. Lomize AL, Pogozheva ID, Mosberg HI (1999) Proteins Suppl
3:199–203
38. Maiorov VN, Crippen GM (1992) J Mol Biol 227:876–888
39. Malkov SN, Zivkovic MV, Beljanski MV, Hall MB, Zaric SD
(2008) J Mol Model 14:769–775
40. Mandel-Gutfreund Y, Gregoret LM (2002) J Mol Biol 323(3):
453–461
41. Medakovic VB, Milcic MK, Bogdanovic GA, Zaric SD (2004)
J Inorg Biochem 98:1867–1873
42. Midic U, Dunker AK, Obradovic Z (2005) Proc IEEE Sym
CIBCB 490–497
43. Minor DL, Kim PS (1994) Nature 367:660–663
44. Minor DL, Kim PS (1994) Nature 371:264–267
45. Nolting B, Salimi N, Guth U (2008) J Theor Biol 251:331–347
46. O’Neil KT, DeGrado WF (1990) Science 250:646–651
47. Ortiz AR, Kolinski A, Rotkiewicz P, Ilkowsky B, Skolnick J
(1999) Proteins suppl3:177–185
48. Padmanabhan S, Marqusee S, Ridgeway T, Laue TM, Baldwin
RL (1990) Nature 344:268–270
49. Penel S, Hughes E, Doig AJ (1999) J Mol Biol 287:127–143
50. Petukhov M, Munoz V, Yumoto N, Yoshikawa S, Serrano L
(1998) J Mol Biol 278:279–289
51. Risler JL, Delorme MO, Delacroix H, Henaut A (1988) J Mol
Biol 204:1019–1029
52. Robson B (1974) Biochem J 141(3):853–867
53. Robson B, Suzuki E (1976) J Mol Biol 107:327–356
54. Rose GD, Fleming PJ, Banavar JR, Maritan A (2006) Proc Natl
Acad Sci USA 103(45):16623–16633
55. Rossmeisl J, Kristensen I, Gregersen M, Jacobsen KW, Nørskov
JK (2003) J Am Chem Soc 125:16383–16386
56. Rost B (1998) In: von Rague-Schleyer P (ed) Encyclopedia of
computational chemistry. John Wiley, Sussex, pp 2242–2255
57. Rost B (2001) J Struct Biol 134:204–218
58. Rost B (2003) In: Bourne PE (ed) Structural bioinformatics.
Wiley-Liss, Hoboken, pp 559–587
59. Salamov AA, Solovyev VV (1997) J Mol Biol 268:31–36
60. Samudrala R, Huang E, Koehl P, Levitt M (2000) Protein Eng
13:453–457
61. Samudrala R, Xia Y, Huang E, Levitt M (1999) Proteins suppl
3:194–198
62. Samuels ML, Witmer JA (2003) Statistics for the life sciences,
3rd edn. Pearson Education, New Jersey
63. Sarakatsannis JN, Duan. Y (2005) Proteins 60:732–739
64. Scheraga HA (1978) Pure Appl Chem 50:315–324
65. Scheraga HA, Liwo A, Odsiej S, Czaplewski C, Pillardy J, Ripoll
DR, Vila JA, Kazmierkiewicz R, Saunders JA, Arnautova YA,
Jagielska A, Chinchio M, Nanias M (2004) Front Biosci 9:3296–
3323
66. Solis AD, Rackovsky S (2004) Polymer 45:525–546
67. Shortle D (2002) Protein Sci 11:18–26
68. Srinivasan R, Rose GD (1999) Proc Natl Acad Sci USA
96:14258–14263
69. Stojanovic SÐ, Medakovic VB, Predovic G, Beljanski M, Zaric
SD (2007) J Biol Inorg Chem 12:1063–1071
70. Street AG, Mayo SL (1999) Proc Natl Acad Sci USA 96:9074–
9076
71. Xiong H, Buckwalter BL, Shieh HM, Hecht MH (1995) Proc Natl
Acad Sci USA 92:6349–6353
72. Zaric SD, Popovic D, Knapp EW (2000) Chem Eur J 6:3935–
3942
73. Zaric SD, Popovic DM, Knapp EW (2001) Biochemistry
40:7914–7928
74. Zaric SD (2003) Eur J Inorg Chem 34:2197–2209
86 S. N. Malkov et al.
123