HPLC METHOD FOR AMINO ACIDS PROFILE IN ... - CiteSeerX
20
Indian Journal of Clinical Biochemistry, 2002 7 HPLC METHOD FOR AMINO ACIDS PROFILE IN BIOLOGICAL FLUIDS AND INBORN METABOLIC DISORDERS OF AMINOACIDOPATHIES S.V. Suresh Babu, M.M.Shareef, A. Pavan Kumar Shetty and K. Taranath Shetty* Clinical Biochemistry Unit, Department of Neurochemistry National Institute of Mental Health and Neurosciences, Bangalore-560029 ABSTRACT Quantification of total and individual amino acids in biological fluids such as plasma, urine and cerebrospinal fluid has an important diagnostic implication in laboratory medicine. The present paper describes protocols for the assay of total amino acids by modified method based on dinitrophenyl and HPLC profile involving pre-column derivatization with o-pthalaldehyde (OPA) derivatization, respectively. The method, based on the alkylation of -SH groups prior to OPA derivatization of amino acids followed by reverse phase high performance liquid chromatography, provide a comprehensive profile of more than twenty amino acids (including -SH group containing) in a single run lasting about 45 minutes. The present study, apart from establishing the normal profile of amino acids in plasma of Indian sub population, also presents HPLC profile for some of the rare amino acidopathies. KEY WORDS O- pthalaldehyde, amino acidopathies, amino acids profile, reverse phase HPLC, Inborn metabolic disorders. opportunity to quantify most of the amino acids they often fail to detect amino acids with –SH groups (4,5). The importance of –SH group containing amino acids, in particular plasma homocysteine and its relation to cardio/cerebro-vascular disorders (4-8), in laboratory medicine has lead to a spurt of interest in the development of methods for the assay of homocysteine in plasma (9-15). However, the methods based on immuno assays (9), enzymatic (10), electrochemical measurement (11) and –SH group specific fluorescent reagents (13-14) have limited use to detect a given amino acid alone or at the maximum –SH group containing amino acids, but not other amino acids. Present paper describes a HPLC method based on alkylation of –SH groups and OPA derivatization, which would provide a comprehensive profile of most of the amino acids (inclusive of -SH groups containing) in biological fluids such as plasma/urine and CSF. To the best of our knowledge, this happens to be the first attempt to establish amino acids profile in plasma of an Indian sub population based on HPLC method. Further, the present report also provides HPLC profile for some of the rare inborn metabolic disorders (IMDs) of amino acids confirmed at our center. INTRODUCTION Assay of total as well as individual amino acids level in biological fluids has become an increasing practice in laboratory medicine (1-3). While the total amino acids content of plasma and urine is expected to reflect the nutritional/metabolic status, the individual amino acids profile of biological fluids are of importance in confirming or other wise to rule out the suspected amino acidopathies. Early detection of inborn metabolic disorders (IMDs) of amino acidopathies often helps in therapeutic intervention, which would prevent the irreversible damage or attenuate the severity of the clinical manifestation. Further, quantification of individual amino acids is of importance in monitoring the therapeutic intervention by way of dietary manipulations and/or vitamin supplement therapy. In view of the diagnostic significance of amino acids profile in biological fluids, a method that would provide a comprehensive profile of most of the amino acids is of immense use in clinical laboratories. In this regard, though the HPLC methods based on OPA derivatization offer an Author for correspondence: Dr. K. Taranath Shetty email: [email protected] Indian Journal of Clinical Biochemistry, 2002, 17 (2) 7-26
-
Upload
khangminh22 -
Category
Documents
-
view
0 -
download
0
Transcript of HPLC METHOD FOR AMINO ACIDS PROFILE IN ... - CiteSeerX

Indian Journal of Clinical Biochemistry, 2002 7
HPLC METHOD FOR AMINO ACIDS PROFILE IN BIOLOGICAL FLUIDS AND INBORNMETABOLIC DISORDERS OF AMINOACIDOPATHIES
S.V. Suresh Babu, M.M.Shareef, A. Pavan Kumar Shetty and K. Taranath Shetty*
Clinical Biochemistry Unit, Department of NeurochemistryNational Institute of Mental Health and Neurosciences, Bangalore-560029
ABSTRACT
Quantification of total and individual amino acids in biological fluids such as plasma, urine andcerebrospinal fluid has an important diagnostic implication in laboratory medicine. The presentpaper describes protocols for the assay of total amino acids by modified method based ondinitrophenyl and HPLC profile involving pre-column derivatization with o-pthalaldehyde (OPA)derivatization, respectively. The method, based on the alkylation of -SH groups prior to OPAderivatization of amino acids followed by reverse phase high performance liquid chromatography,provide a comprehensive profile of more than twenty amino acids (including -SH group containing)in a single run lasting about 45 minutes. The present study, apart from establishing thenormal profile of amino acids in plasma of Indian sub population, also presents HPLC profilefor some of the rare amino acidopathies.
KEY WORDS
O- pthalaldehyde, amino acidopathies, amino acids profile, reverse phase HPLC, Inbornmetabolic disorders.
opportunity to quantify most of the amino acids theyoften fail to detect amino acids with –SH groups(4,5). The importance of –SH group containing aminoacids, in particular plasma homocysteine and itsrelation to cardio/cerebro-vascular disorders (4-8),in laboratory medicine has lead to a spurt of interestin the development of methods for the assay ofhomocysteine in plasma (9-15). However, themethods based on immuno assays (9), enzymatic(10), electrochemical measurement (11) and –SHgroup specific fluorescent reagents (13-14) havelimited use to detect a given amino acid alone or atthe maximum –SH group containing amino acids,but not other amino acids. Present paper describesa HPLC method based on alkylation of –SH groupsand OPA derivatization, which would provide acomprehensive profile of most of the amino acids(inclusive of -SH groups containing) in biologicalfluids such as plasma/urine and CSF. To the bestof our knowledge, this happens to be the firstattempt to establish amino acids profile in plasmaof an Indian sub population based on HPLC method.Further, the present report also provides HPLCprofile for some of the rare inborn metabolic disorders(IMDs) of amino acids confirmed at our center.
INTRODUCTIONAssay of total as well as individual amino acidslevel in biological fluids has become an increasingpractice in laboratory medicine (1-3). While the totalamino acids content of plasma and urine is expectedto reflect the nutritional/metabolic status, theindividual amino acids profile of biological fluids areof importance in confirming or other wise to rule outthe suspected amino acidopathies. Early detectionof inborn metabolic disorders (IMDs) of aminoacidopathies often helps in therapeutic intervention,which would prevent the irreversible damage orattenuate the severity of the clinical manifestation.Further, quantification of individual amino acids isof importance in monitoring the therapeuticintervention by way of dietary manipulations and/orvitamin supplement therapy. In view of the diagnosticsignificance of amino acids profile in biological fluids,a method that would provide a comprehensive profileof most of the amino acids is of immense use inclinical laboratories. In this regard, though the HPLCmethods based on OPA derivatization offer an
Author for correspondence:Dr. K. Taranath Shettyemail: [email protected]
Indian Journal of Clinical Biochemistry, 2002, 17 (2) 7-26

Indian Journal of Clinical Biochemistry, 2002 8
MATERIALS
All the chemicals used were of analytical grade.Sodium borate buffer: 0.5 M , pH 10.5;Dinitrofluorobenzene (DNFB) stock solution: 325µl of DNFB (Sigma Chemical Co, USA) wasdissolved in 25 ml of acetone (stored at 4°C in abrown colored glass bottle); Working DNFB reagent:Prepared by diluting 1 volume of stock DNFB reagentwith 9 volumes of 0.155 M borate buffer just beforeuse; Ortho-pthalaldehyde (OPA) reagent: Prepared,just before use, by dissolving 10 mg of OPA (SigmaChem. Co., USA) in 1 ml of methanol-borate buffer(1:9 v/v) mixture containing 0.01% (v/v) β-mercaptoethanol (Sigma Chem. Co, USA);Alkylating reagent: 0.2 M iodoacetate (Sigma Chem.Co, USA) in 0.5 M borate buffer, pH 10.5. Referencestandards: Stock standards (5 mM) of individualamino acids (Sigma Chem. Co USA) were preparedin methanol : water mixture (8:2 v/v) and stored at4°C. Reference standard for total amino acids (1mMeach of glutamate and glycine solution): Preparedby mixing 1 ml each of 5 mM glutamate and glycineand made up to 5 ml with methanol water mixture(80:20 v/v); Cocktail of standard amino acids (forHPLC profile): Equimolar concentration (0.1 mM ofindividual amino acids) mixture was prepared justbefore use by mixing the stock solutions of individualamino acids. Individual standards for asparagine andglutamine were prepared freshly and incorporatedwith the standard amino acids mixture just beforederivatizing with OPA reagent. Retention time forhistidine was established separately by usingreference standard.
Specimens collection and processing.
Adults (n=34) of 20 - 45 years of age group, withoutany apparent symptoms of illness, constituted thecontrol group for this study. Patient materialscomprised subjects attending NIMHANS clinics fordiagnosis of IMDs with suspected aminoacidopathies and referrals from other centers.Overnight fasting blood samples were collected inheparinized syringe from anti-cubital vein andimmediately (within twenty minutes) centrifuged(3000 rpm /15 minutes) to separate the plasma.
Urine/CSF specimens were centrifuged (3000 rpm/15 minutes) to clear the cells /debris, if any. Analiquot of the supernatant from urine was subjectedfor creatinine assay in an auto analyzer (Hitachi911) as per the analysis protocol of the manufacturerof the reagents (Boehringer and Mannheim).
Reduction of disulphide compounds anddeproteinization of biological fluids:
Plasma/urine/CSF specimens (0.1 ml) were mixedwith (5 µl) β-mercaptoethanol (β-ME) and allowedto stand for 5 minutes at room temperature followedby precipitation with ice-cold methanol (395 µl) whilevortexing. Tubes were allowed to stand for 15minutes in an ice bucket before centrifuging (5000rpm / 15 minutes) and the supernatant wascollected. Efficiency of protein precipitation step wasassessed by Bradford’s dye binding method (16).The protein free supernatants were processedimmediately for assaying total amino acids andHPLC analysis or stored at -70° C until furtheranalysis.
Assay of total amino acids:
Total amino acids content of protein freesupernatants were estimated by modifieddinitrophenyl (DNP) derivatization method (17). Inbrief, the methanol extract (100 µl) of biological fluidor the reference standard (equimolar mixture ofglutamate:glycine) was made up to 250 µl with 80%(v/v) methanol. Equal volume (250 µl) of borate bufferwas added to each of the tubes, followed by 0.5 mlof DNFB reagent. Tubes were incubated at 45°C for30 minutes and allowed to attain room temperature.After adding 1 ml of 0.25 M HCl to each of the tubesand mixing, the absorbancy was measured at 420nm. Apart from reagent blank and referencestandards, some of the samples also carried aknown amount of glutamate:glycine mixture toassess the recovery of total amino acids throughdifferent steps of assay procedure.
Alkylation of –SH compounds and pre-column derivatization with O-pthalaldehyde and reverse phaseseparation:
An equimolar concentration (0.1 mM) of individualor cocktail of amino acids mixture or plasma/urineor CSF extract (≡2000 ±100 picomoles of total aminoacids) of methanol (0.1 ml) were mixed with (50 µl)borate buffer (0.5 M, pH 10.5) containing iodoacetate(0.2 M) followed by OPA reagent (25 µl). Derivatizedsolution was made up to 1 ml by adding 825 µl starteluent (mixture of acetate buffer, 0.05 M, pH6.8:methanol 4:2 v/v). OPA derivatized amino acidswere injected to HPLC system (Shimadzu, Japan)equipped with 20 µl (100 µl for CSF extract) injectionloop and C18 column (25 cm) fitted with a guard
Indian Journal of Clinical Biochemistry, 2002, 17 (2) 7-26
Indian Journal of Clinical Biochemistry, 2002 9
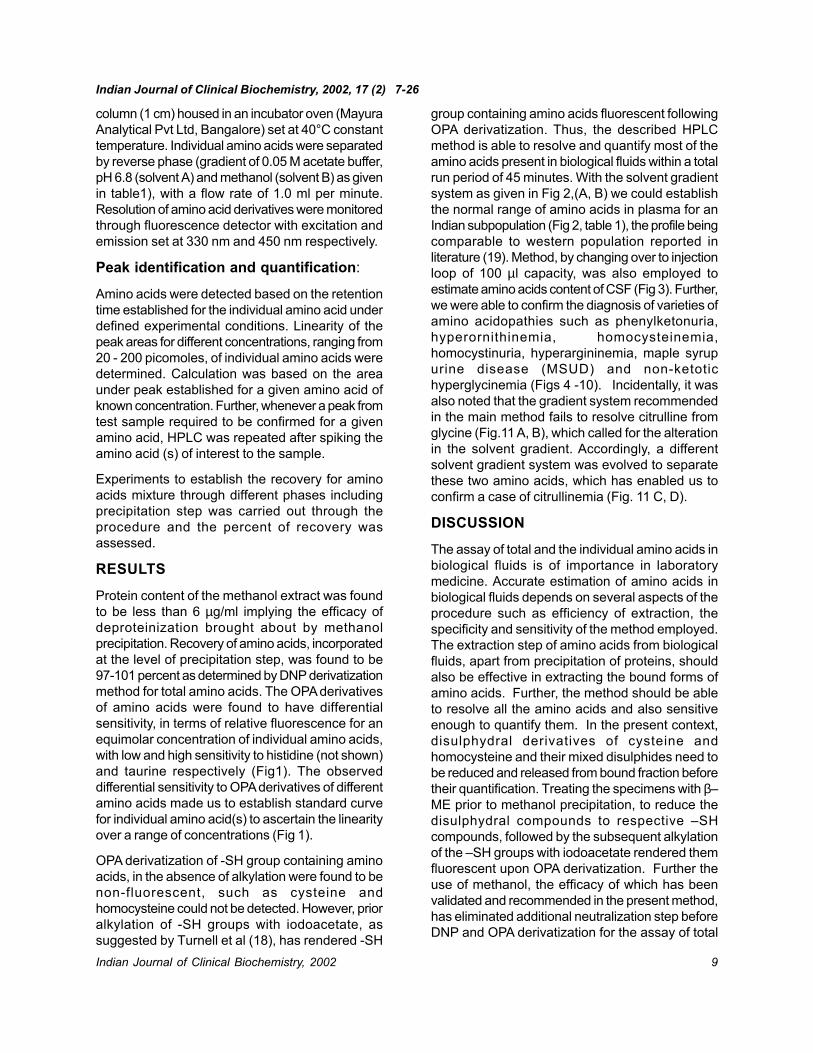
column (1 cm) housed in an incubator oven (MayuraAnalytical Pvt Ltd, Bangalore) set at 40°C constanttemperature. Individual amino acids were separatedby reverse phase (gradient of 0.05 M acetate buffer,pH 6.8 (solvent A) and methanol (solvent B) as givenin table1), with a flow rate of 1.0 ml per minute.Resolution of amino acid derivatives were monitoredthrough fluorescence detector with excitation andemission set at 330 nm and 450 nm respectively.
Peak identification and quantification:
Amino acids were detected based on the retentiontime established for the individual amino acid underdefined experimental conditions. Linearity of thepeak areas for different concentrations, ranging from20 - 200 picomoles, of individual amino acids weredetermined. Calculation was based on the areaunder peak established for a given amino acid ofknown concentration. Further, whenever a peak fromtest sample required to be confirmed for a givenamino acid, HPLC was repeated after spiking theamino acid (s) of interest to the sample.
Experiments to establish the recovery for aminoacids mixture through different phases includingprecipitation step was carried out through theprocedure and the percent of recovery wasassessed.
RESULTS
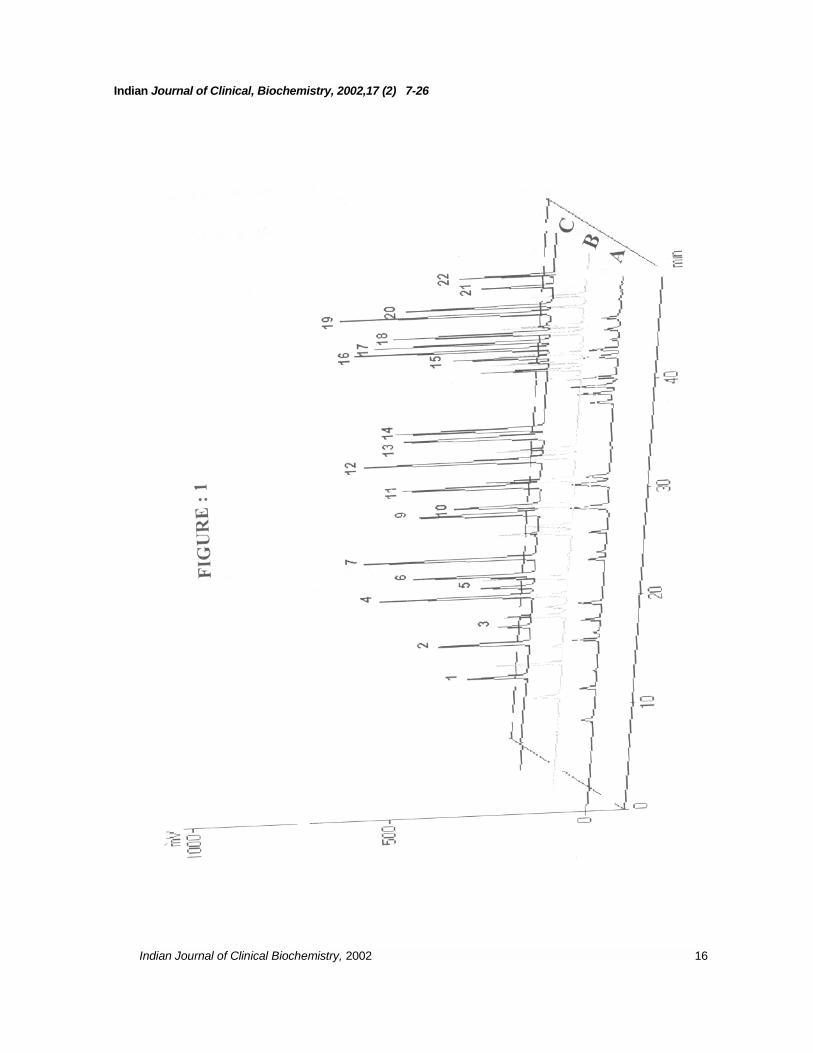
Protein content of the methanol extract was foundto be less than 6 µg/ml implying the efficacy ofdeproteinization brought about by methanolprecipitation. Recovery of amino acids, incorporatedat the level of precipitation step, was found to be97-101 percent as determined by DNP derivatizationmethod for total amino acids. The OPA derivativesof amino acids were found to have differentialsensitivity, in terms of relative fluorescence for anequimolar concentration of individual amino acids,with low and high sensitivity to histidine (not shown)and taurine respectively (Fig1). The observeddifferential sensitivity to OPA derivatives of differentamino acids made us to establish standard curvefor individual amino acid(s) to ascertain the linearityover a range of concentrations (Fig 1).
OPA derivatization of -SH group containing aminoacids, in the absence of alkylation were found to benon-fluorescent, such as cysteine andhomocysteine could not be detected. However, prioralkylation of -SH groups with iodoacetate, assuggested by Turnell et al (18), has rendered -SH
group containing amino acids fluorescent followingOPA derivatization. Thus, the described HPLCmethod is able to resolve and quantify most of theamino acids present in biological fluids within a totalrun period of 45 minutes. With the solvent gradientsystem as given in Fig 2,(A, B) we could establishthe normal range of amino acids in plasma for anIndian subpopulation (Fig 2, table 1), the profile beingcomparable to western population reported inliterature (19). Method, by changing over to injectionloop of 100 µl capacity, was also employed toestimate amino acids content of CSF (Fig 3). Further,we were able to confirm the diagnosis of varieties ofamino acidopathies such as phenylketonuria,hyperornithinemia, homocysteinemia,homocystinuria, hyperargininemia, maple syrupurine disease (MSUD) and non-ketotichyperglycinemia (Figs 4 -10). Incidentally, it wasalso noted that the gradient system recommendedin the main method fails to resolve citrulline fromglycine (Fig.11 A, B), which called for the alterationin the solvent gradient. Accordingly, a differentsolvent gradient system was evolved to separatethese two amino acids, which has enabled us toconfirm a case of citrullinemia (Fig. 11 C, D).
DISCUSSION
The assay of total and the individual amino acids inbiological fluids is of importance in laboratorymedicine. Accurate estimation of amino acids inbiological fluids depends on several aspects of theprocedure such as efficiency of extraction, thespecificity and sensitivity of the method employed.The extraction step of amino acids from biologicalfluids, apart from precipitation of proteins, shouldalso be effective in extracting the bound forms ofamino acids. Further, the method should be ableto resolve all the amino acids and also sensitiveenough to quantify them. In the present context,disulphydral derivatives of cysteine andhomocysteine and their mixed disulphides need tobe reduced and released from bound fraction beforetheir quantification. Treating the specimens with β–ME prior to methanol precipitation, to reduce thedisulphydral compounds to respective –SHcompounds, followed by the subsequent alkylationof the –SH groups with iodoacetate rendered themfluorescent upon OPA derivatization. Further theuse of methanol, the efficacy of which has beenvalidated and recommended in the present method,has eliminated additional neutralization step beforeDNP and OPA derivatization for the assay of total
Indian Journal of Clinical Biochemistry, 2002, 17 (2) 7-26
Indian Journal of Clinical Biochemistry, 2002 10
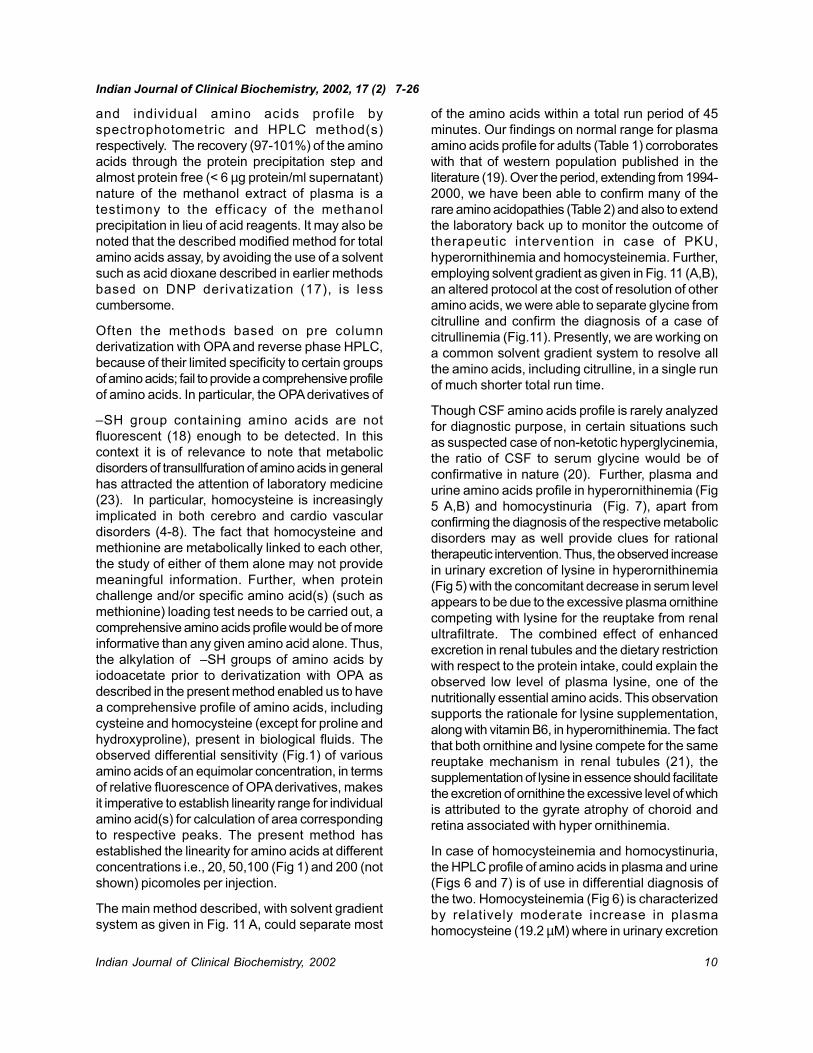
and individual amino acids profile byspectrophotometric and HPLC method(s)respectively. The recovery (97-101%) of the aminoacids through the protein precipitation step andalmost protein free (< 6 µg protein/ml supernatant)nature of the methanol extract of plasma is atestimony to the efficacy of the methanolprecipitation in lieu of acid reagents. It may also benoted that the described modified method for totalamino acids assay, by avoiding the use of a solventsuch as acid dioxane described in earlier methodsbased on DNP derivatization (17), is lesscumbersome.
Often the methods based on pre columnderivatization with OPA and reverse phase HPLC,because of their limited specificity to certain groupsof amino acids; fail to provide a comprehensive profileof amino acids. In particular, the OPA derivatives of
–SH group containing amino acids are notfluorescent (18) enough to be detected. In thiscontext it is of relevance to note that metabolicdisorders of transullfuration of amino acids in generalhas attracted the attention of laboratory medicine(23). In particular, homocysteine is increasinglyimplicated in both cerebro and cardio vasculardisorders (4-8). The fact that homocysteine andmethionine are metabolically linked to each other,the study of either of them alone may not providemeaningful information. Further, when proteinchallenge and/or specific amino acid(s) (such asmethionine) loading test needs to be carried out, acomprehensive amino acids profile would be of moreinformative than any given amino acid alone. Thus,the alkylation of –SH groups of amino acids byiodoacetate prior to derivatization with OPA asdescribed in the present method enabled us to havea comprehensive profile of amino acids, includingcysteine and homocysteine (except for proline andhydroxyproline), present in biological fluids. Theobserved differential sensitivity (Fig.1) of variousamino acids of an equimolar concentration, in termsof relative fluorescence of OPA derivatives, makesit imperative to establish linearity range for individualamino acid(s) for calculation of area correspondingto respective peaks. The present method hasestablished the linearity for amino acids at differentconcentrations i.e., 20, 50,100 (Fig 1) and 200 (notshown) picomoles per injection.
The main method described, with solvent gradientsystem as given in Fig. 11 A, could separate most
of the amino acids within a total run period of 45minutes. Our findings on normal range for plasmaamino acids profile for adults (Table 1) corroborateswith that of western population published in theliterature (19). Over the period, extending from 1994-2000, we have been able to confirm many of therare amino acidopathies (Table 2) and also to extendthe laboratory back up to monitor the outcome oftherapeutic intervention in case of PKU,hyperornithinemia and homocysteinemia. Further,employing solvent gradient as given in Fig. 11 (A,B),an altered protocol at the cost of resolution of otheramino acids, we were able to separate glycine fromcitrulline and confirm the diagnosis of a case ofcitrullinemia (Fig.11). Presently, we are working ona common solvent gradient system to resolve allthe amino acids, including citrulline, in a single runof much shorter total run time.
Though CSF amino acids profile is rarely analyzedfor diagnostic purpose, in certain situations suchas suspected case of non-ketotic hyperglycinemia,the ratio of CSF to serum glycine would be ofconfirmative in nature (20). Further, plasma andurine amino acids profile in hyperornithinemia (Fig5 A,B) and homocystinuria (Fig. 7), apart fromconfirming the diagnosis of the respective metabolicdisorders may as well provide clues for rationaltherapeutic intervention. Thus, the observed increasein urinary excretion of lysine in hyperornithinemia(Fig 5) with the concomitant decrease in serum levelappears to be due to the excessive plasma ornithinecompeting with lysine for the reuptake from renalultrafiltrate. The combined effect of enhancedexcretion in renal tubules and the dietary restrictionwith respect to the protein intake, could explain theobserved low level of plasma lysine, one of thenutritionally essential amino acids. This observationsupports the rationale for lysine supplementation,along with vitamin B6, in hyperornithinemia. The factthat both ornithine and lysine compete for the samereuptake mechanism in renal tubules (21), thesupplementation of lysine in essence should facilitatethe excretion of ornithine the excessive level of whichis attributed to the gyrate atrophy of choroid andretina associated with hyper ornithinemia.
In case of homocysteinemia and homocystinuria,the HPLC profile of amino acids in plasma and urine(Figs 6 and 7) is of use in differential diagnosis ofthe two. Homocysteinemia (Fig 6) is characterizedby relatively moderate increase in plasmahomocysteine (19.2 µM) where in urinary excretion
Indian Journal of Clinical Biochemistry, 2002, 17 (2) 7-26
Indian Journal of Clinical Biochemistry, 2002 11
is within the normal range. In addition to this, plasmacysteine level (290 µM) is found to be within thenormal range. On the other hand homocystinuria(Fig7) is characterized by an elevated level ofhomocysteine in both plasma (192 µM) and urine(1097 µMoles/g creatinine). Further, unlike inhomocysteinemia, a significant depletion of cysteinein plasma (almost undetectable) is also noted inhomocystinuria (Fig 7). The relative amount ofcysteine to that of homocysteine would suggestseverity of the metabolic block in the conversion ofhomocysteine to cystathionine and/or reconversionto methionine.
It is to be noted that in spite of better resolution,sensitivity and reproducibility of retention time for agiven amino acids under defined conditions, it isnot unusual to find some other compound of knownor unknown co-eluting with one or the other aminoacids. Hence the diagnosis of IMDs of amino acidsbased on HPLC profile needs to be substantiatedwith other laboratory findings such as plasmaammonia, acid base parameters as well as clinicalhistory including the medications, if any. One suchexperience of ours relates to a case of citrullinemiawhich would have been reported as hypergycinemia,but for the high plasma ammonia which suggestedthe possibility of urea cycle disorder. As it turnedout, citrulline was found to have same retention timeas that of glycine under the solvent gradient applied(Fig. 11 A) and co-eluted with the latter. However,an elevated plasma ammonia made us to look out
for intermediate metabolites of urea cycle, where incitrulline was found to be elevated (Fig 11). Thatexperience made us to develop a different solventgradient system (Fig. 11 B) to resolve citrulline andglycine from each other. Apart from confirming thecase as citrullinemia, the plasma glycine contentwas in fact found to be depleted as a result of patienthaving administered with sodium benzoate prior torefer the specimen for investigation.
To summarize, the present study, by alkylating the–SH groups with iodoacetate prior to derivatizationwith OPA reagent made it possible to quantifycysteine and homocysteine in addition to most ofthe other amino acids. Our experience makes usto believe that by adding the HPLC method to thearmamentarium of diagnostic facilities would leadto the diagnosis of more cases of IMDs pertainingto amino acidopathies, which in turn could be ofimportance to both therapeutic and preventivemedicine. Availability of such facilities in neonatal/paediatric care centers, by way of an early diagnosisand therapeutic intervention, may help in preventionof irreversible damage and/or attenuation of clinicalseverity of the disorder. In certain instances wheretherapeutic intervention is not feasible, confirmeddiagnosis could as well help in genetic counselingto prevent the recurrence of childbirths with aminoacidopathies and associated medical complicationsas well as emotional/economical burden to theafflicted family.
Indian Journal of Clinical Biochemistry, 2002, 17 (2) 7-26

Indian Journal of Clinical Biochemistry, 2002 12
Table 1: Plasma amino acids profile of a normal adult Indian sub population (n= 34) compared withWestern population.
Amino acids(s) Plasma concentration ( µM) Literature*
Range Mean SD Range (µM)
Glycine 134 – 466 266.0 76.1 121 – 401Alanine 134 – 597 339.0 113.3 203 – 518Valine 112 – 242 168.9 31.0 168 – 350Leucine 53 – 135 77.4 18.2 73 – 172Isoleucine 38 – 94 60.0 14.1 42 – 98Serine 50 – 201 116.4 38.5 67 – 161Threonine 30 – 256 121.5 49.5 74 – 175Aspartate 5 – 43 16.9 10.6 0 – 9Glutamate 8 – 99 40.8 30.9 12 – 98Asparagine 8 – 83 52.7 15.8 36 – 71Histidine 18 – 155 68.5 34.4 48 – 121Arginine 26 – 123 73.5 22.9 50 – 126Lysine 54 – 240 156.5 41.8 107 – 244Ornithine 25 – 153 65.6 31.5 24 – 112Phenylalanine 27 – 115 63.2 21.6 40 – 81Tyrosine 7 – 127 61.2 26.1 43 – 90Tryptophan 32 – 85 54.7 15.7 24 – 72Cysteine (total) 245 – 332 222.9 60.0 268 – 300Homocysteine (total) 3.8 – 19.0 8.4 4.6 6 – 16Taurine 21 – 212 84.2 49.8 38 – 197Methionine 13 – 38 25.0 6.2 13 – 33
* Teerlink Tom et al (1994) See Ref. # 19
Table 2: Varieties of IMDs of amino acids confirmed during the period 1994 - 2000
Amino acidopathies NoPhenylketonuria 11Maple Syrup Urine Disease 7Neonatal tyrosinemia 4Ketotic hyperglycinemia 8Non-ketotic hyperglycinemia 2Citrullinemia 2Hyperargininemia 2Hyperornithinemia (associated with gyrate 4atrophy of the choroid and retina)Hyperprolinemia, type I 2Homocystinuria 1Homocysteinemia 4Sulfite oxidase defect 1 Total 48
Indian Journal of Clinical Biochemistry, 2002, 17 (2) 7-26

Indian Journal of Clinical Biochemistry, 2002 13
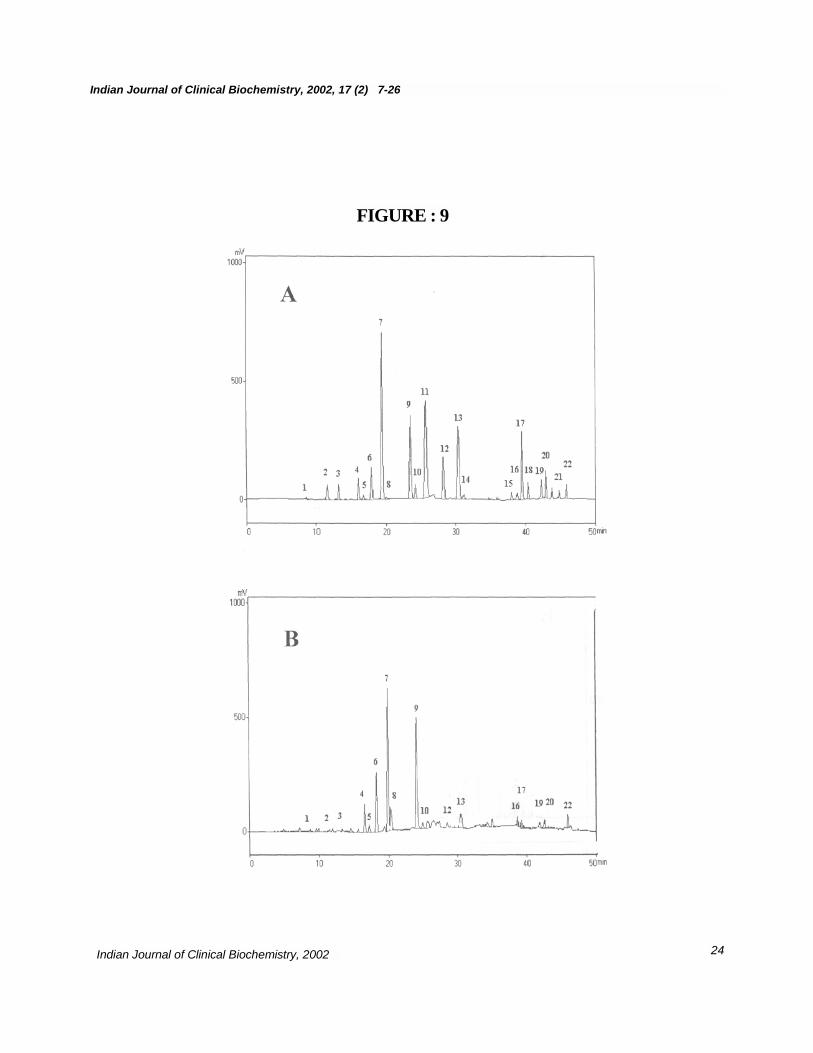
Figure 6: Amino acids profile of plasma (A) andurine (B) of a homocysteinemia (24 yrs) case. Notethe relatively large peak (#5) for homocysteine inplasma (19.2 µM) of homocysteinemia case (insetD) compared to a normal (inset C). Note the normallevel of plasma cysteine (287 µM) and Met (24 µM)content. Also note the almost undetectablehomocysteine in urine (B).Figure 7: Amino acids profile of plasma (A) andurine (B) of homocystinuria case. Note the elevatedlevel of homocysteine (peak #5) in both plasma (192µM) and urine (1097 µMoles/g creatinine). Also notethe low content of cysteine (peak# 3), almostundetectable, in both plasma and urine.Figure 8: Amino acids profile of plasma (A) andurine (B) of maple syrup urine disease (6 days oldchild) characterized by elevated levels of branchedchain amino acids in plasma and urine andketonuria . Note the elevated level of branched chainamino acids in both plasma (Val, 386 µM; Ile, 463µM; and Leu, 813 µM) and urine (Val:415; Ile:463and Leu:1559 µMoles/g creatinine)Figure 9: Amino acids profile of plasma (panel A)and urine (panel B) of a argininemia case, due toarginase deficiency (confirmed by assaying RBCarginase activity). Note an elevated arginine (peak# 11) content in plasma (550 µM) but normal levelin urine (22 µMoles/g creatinine).Figure 10: Plasma (panel A) and urinary (panel B)amino acids profile of non-ketotic hyperglycinemia,apparently due to deficiency of glycine cleavagesystem. An elevated level of Gly (peak # 9) in bothplasma (2579 µM) and urine (5731 µMoles/gcreatinine) is discernible, which was brought downby administering sodium benzoate (results notshown).Figure 11: Co-elution of glycine and citrulline asper the main method (panels A and C) of plasmaand urine respectively, and their resolution by alteringthe gradient of the solvent system (Panels B andD). Panels A and C represent plasma and urinaryamino acids profile(s) of a citrullinemia case as perthe main method with solvent gradient as given inpanel A. Note the peak # 9 representing Gly, withno extra peak for citrulline, the amino acids profileappear to be normal because of co-elution ofcitrulline with glycine. Separation of citrulline (Peak# 23) from glycine (peak # 9), in plasma (B) andurine (D) of the same case with different retentiontime, by altering solvent gradient as given in panelB. Also note the unusual low level of plasma Gly(102 µM) peak (# 9) as a result of sodium benzoatetreatment prior to referring the sample for diagnosis.
LEGENDS FOR FIGURESFigure1: HPLC profile(s) of a mixture of an equimolarconcentration of various amino acids ranging from20 – 100 picomoles (A: 20 picomoles; B: 50picomoles; C: 100 picomoles), with solvent gradientsystem as indicated in table 1. Note the differencein the total area under peak for an equimolarconcentration of different amino acids. Peaks 1-24represent different amino acids of 100 picomoleseach (1: Asp; 2: Glu; 3: Cys; 4:Asn; 5: Hcy; 6: Ser;7: Gln; 8: His (not shown); 9: Gly; 10: Thr; 11: Arg;12: Tau; 13: Ala; 14: Tyr; 15: Trp; 16: Met; 17: Val;18: Phe; 19: Ile; 20: Leu; 21: Orn; 22: Lys.), elutedat different retention time in minutes.
Figure 2: HPLC profile of amino acids of a normaladult plasma (A) and urine (B). Panels C and Drepresent plasma and urine amino acids profile of aneonate (9 days old). Note a small (due toinsensitivity of His-OPA derivative) peak (#8)representing His, with the retention time of 19.9 ±0.04 minutes is also seen in both adult and neonateplasma. Also note, the high content of taurine inplasma and urine of child as compared to adult.
Figure 3: Amino acids profile of normal (with noneurological complications/symptoms) adult CSF:Peaks 1: Asp (2.0); 2: Glu (12.1); 4: Asn (11.0); 6:Ser (21.0); 7: Gln (235.0); 9: Gly (38.0); 10: Thr(7.0); 11: Arg (13.0); 12: Tau (3.0); 13: Ala (52.0);16: Met (1.2); 17: Val ( 33.0); 18: Phe (8.2); 19: Ile(10.8); 20: Leu (13.5); 21: Orn (2.5 ); 22: Lys (17.0).Numbers in parenthesis indicate respective aminoacids concentration in µMoles/L.
Figure 4: Plasma (A) and urine (B) amino acidsprofile of a phenylketonuria (PKU,hyperphenyalaninemia with ketonuria) case. Notean elevated peak (# 18) of phenylalanine in plasma(650 µM) and urine (2656 µMoles/g creatinine). Alsonote undetectable peak (# 14) for Tyr in both plasmaand urine.
Figure 5: HPLC profile of amino acids in plasma(A) and urine (B) in hyper-ornithinemia. Note theelevated level of ornithine both in plasma (2290 µM)and urine (1415 µMoles/g creatinine). Also note theincrease in the urinary excretion of lysine (Panel B,peak # 22, 272 µMoles/g creatinine) with aconcomitant depletion of lysine in plasma (panelA, peak # 22). Note the significant decrease inboth ornithine and lysine content of plasma (C) andurine (D) following protein restricted diet and vitaminB6 supplementation.
Indian Journal of Clinical Biochemistry, 2002, 17 (2) 7-26

Indian Journal of Clinical Biochemistry, 2002 14
REFERENCES
1. Walker,V and Mills,G.A, (1995) Quantitative methods for amino acid analysis in biological fluids. Ann.Clin. Biochem. 32, 28–57
2. Andersson, A. Isaksson, A., Bratstrom, L and Bjorn, H. (1993) Homocysteine and other thiols in plasmaand thiol specific postcolumn derivatization. Clin. Chem. 39, 1590-1597.
3. Deyl, Z., Hyanek. J and Horakova, M. (1986) Profiling of amino acids in body fluids and tissues bymeans of liquid chromatography. J. Chromatogr. 379, 177-250.
4. Jacobsen, D.W. (1998) Homocysteine and vitamins in cardiovascular disease. Clin. Chem. 44, 1833-1843
5. Hankey, G.J and Eikelboom, J.W. (1999) Homocysteine and vascular disease. The Lancet 354, 407-413
6. Welch, G.N and Loscalzo, J (1998) Homocysteine and atherothrombosis. New Engl. J. Med. 338, 1042-1050
7. Boushey, C. J., Beresford, S. A. A., Omen, G. S., and Motulsky, A.G.(1995). A quantitative assessmentof plasma homocysteine as a risk factor in vascular disease. JAMA. 274, 1049 - 1057
8. Graham, I. M., Daly, L. E, Refsum, H. M., Robinson, K., Brattstrom, L.E., Ueland, Per M., Palma-Reis,R.J., Boers, G. H., Sheahan, R. G., Israelsson, Bo., Uiterwaal., C. S., Meleady, R., McMaster, D.,Verhoef, P., Witterman, J., Rubba, P., Bellet, H., Wutreccht, J.C., deWalk, H. W., Luis, C. S., Parrot-Rouland, F. M., Tan, K.S., Higgins, I., Garcon, D., Medrano, M.J., Candito, M., Evans, A. E. and Andria,G. (1997) Plasma homocysteine as a risk factor for vascular disease: European concerted actionproject. JAMA, 277, 1775 - 1781
9. Frantzen, F., Faaren, A. L., Alfheim, I and Nordhei, A. K. (1998) Enzyme conversion immuno assay fordetermining total homocysteine in plasma or serum. Clin. Chem.44, 311-316
10. Refsum, H., Ueland, P. M., and Svardal, A. M. (1989) Fully automated fluorescence assay for determiningtotal homocysteine in plasma. Clin. Chem. 35, 1921 -1927
11. Robenstein, D. L., and Yamaahita, G. T (1989) Determination of homocysteine, penicillamine and theirsymmetrical and mixed disulfides by liquid chromatography with electrochemical detection. Anal.Biochem. 80, 259-263
12. Thomson, S. B and Tucker, D. J (1985) Determination of homocysteine in urine. J. Chromatogr. 338, 201-208
13. Pastore, A., Massoud, R., Motti, C., Russo, A. Lo., Fucci, G., Cortese, C and Federici, G. (1998) Fullyautomated assay for total homocysteine, cysteine, cysteinylglycine, glutathione, cysteamine and 2-mercaptopropionylglycine in plasma and urine. Cin. Chem.44, 825-832
14. Mansoor, M. A., Svardal, A M and Ueland, P.M (1992) Determination of the in vivo redox status ofcysteine, cysteinylglycine, homocysteine and glutathione in human plasma. Anal. Biochem. 200, 218-229
15. Hyland, K. and Bottiglieri, T. (1992) Measurement of total plasma and cerebrospinal fluid homocysteineby fluorescence following high performance liquid chromatography and pre column derivatization with o-pthalaldehyde . J. Chromatogr. 579, 55-62.
16. Bradford, M. (1976) A rapid and sensitive method for the quantification of micrograms quantities ofprotein utilizing the principle of protein dye binding. Anal. Biochem. 76, 248-254.
Indian Journal of Clinical Biochemistry, 2002, 17 (2) 7-26
Indian Journal of Clinical Biochemistry, 2002 15
17. Varley, H., Gowenlock, A. H. and Bell, M.(1980). Practical Clinical Biochemistry. Vol I, Fifth edn (1980).William Heinemann Medical Books Lts, London. p 491-494.
18. Turnell, D. C and Cooper, J.D.H. (1982) Rapid assay for amino acids in serum or urine by precolumnderivatization and reversed phase liquid chromatography. Clin. Chem. 28, 527-531.
19. Tom Teerlink, Paul, A.M., Van Leeuwen and Alexander, H. (1994) Plasma amino acids determined byliquid chromatography within 17 minutes. Clin. Chem. 40, 245-249.
20. Hamesh, A and Jhonson, M.W (2001) Nonketotic hyperglycinemia In: The Metabolic & Molecular Basesof inherited Diseases. Eight edition Vol II. Eds. Scriver, C.R., Beaudet, A.l., Sly, W.S and Valle, D.McGraw Hill Med Publication Division, New York. p. 2065-2078
21. Valle, D and Simell, O. (2001). The hyperornithinemias. In: The Metabolic & Molecular Bases of inheritedDiseases. Eighth edition Vol II Eds. Scriver, C.R., Beaudet, A.l., Sly, W.S and Valle, D. McGraw Hill MedPublication Division, New York. p. 1857-1895
22. Chung, D.T. and Shih, V.E., (2001). Maple syrup urine disease (Branched chain ketoaciduria). In: TheMetabolic & Molecular Bases of inherited Diseases eight edition Vol II Edis. Scriver, C.R., Beaudet, A.l.,Sly, W.S and Valle, D. McGraw Hill Med Publication Division, New York. p.1971-2005
23. Mudd, S.H., Levy, H.L. and Kraus, J.P (2001). Disorders of transulfuration. In: The Metabolic & MolecularBases of inherited Diseases eight edition Vol II Eds. Scriver, C.R., Beaudet, A.l., Sly, W.S and Valle, D.Mcgraw Hill Med Publication Division, New York. p.2007-2056
Indian Journal of Clinical Biochemistry, 2002, 17 (2) 7-26
Indian Journal of Clinical, Biochemistry, 2002,17 (2) 7-26
Indian Journal of Clinical Biochemistry, 2002 16

Indian Journal of Clinical Biochemistry, 2002, 17 (2) 7-26
Indian Journal of Clinical Biochemistry, 2002 17

Indian Journal of Clinical Biochemistry, 2002,17 (2) 7-26
FIGURE : 3
Indian Journal of Clinical Biochemistry, 2002 18

Indian Journal of Clinical Biochemistry, 2002, 17 (2) 7-26
Indian Journal of Clinical Biochemistry, 2002
FIGURE : 4
19

Indian Journal of Clinical Biochemistry, 2002, 17 (2) 7-26
Indian Journal of Clinical Biochemistry, 2002 20

Indian Journal of Clinical Biochemistry, 2002,17 (2) 7-26
Indian Journal of Clinical Biochemistry, 2002
FIGURE : 6
21

Indian Journal of Clinical Biochemistry, 2002, 17 (2) 7-26
Indian Journal of Clinical Biochemistry, 2002
FIGURE : 7
22

Indian Journal of Clinical Biochemistry, 2002, 17 (2) 7-26
Indian Journal of Clinical Biochemistry, 2002
FIGURE : 8
23
Indian Journal of Clinical Biochemistry, 2002, 17 (2) 7-26
Indian Journal of Clinical Biochemistry, 2002
FIGURE : 9
24

Indian Journal of Clinical Biochemistry, 2002, 17 (2) 7-26
Indian Journal of Clinical Biochemistry, 2002
FIGURE : 10
25

Indian Journal of Clinical Biochemistry. 2002, 17 (2) 7-26
Indian Journal of Clinical Biochemistry, 2002
26