Proteins and its function • Amino acids: building blocks ... - Nptel
Upload
khangminh22Category
view
1download
0
Molecular composition: amino acids and hexosamines
89
CHAPTER V
Amino acids and hexosamines as indicators oforganic matter degradation state in North Sea
sediments
B. Dauwe and J.J. Middelburg
Introduction
Coastal marine environments are sites of intensive organic carbon production,turnover and burial. A substantial fraction of the organic material produced inthe euphotic zone reaches the sediment where it forms the major food input forthe benthos. During passage through the water column and burial into thesediment, organic matter is degraded with the result that the more labilecomponents are preferentially lost. The amount and degradability of organicmaterial finally arriving at the sediment has been found to be one of the majorstructuring factors in the trophic composition of benthic communities (e.g.Pearson & Rosenberg 1978; Tenore & Rice 1980).A variety of biomarkers that undergo either selective preservation or loss duringdiagenesis have been used as source and maturity indicators of organic matter insuspended material and in sediments. Compounds such as lignin (preferentialpreservation) and pigments (preferential loss) were usually used as maturityindicators (e.g. Cowie et al. 1992, Hedges & Prahl 1993, Boon & Duineveld 1996).However, degradation state indicators based on specific trace compounds areproblematic to use in cross-system comparison studies because of the non-uniform initial distribution and compound-specific degradation pathways.Furthermore, the sources of organic matter input are often multiple and mayvary strongly between stations. Therefore it is often difficult to distinguishbetween preferential breakdown of a certain compound and a variable input.Moreover, biomarkers occur in trace quantities and consequently are notimportant as energy or nitrogen sources for heterotroph organisms.The limitations of biomarkers can be avoided by the use of ubiquitousbiopolymers such as proteins, hexosamines and carbohydrates that account for a
Chapter V
90
BF
GB
Denmark
FF
SK
BG
tides
tides
12 °8 °4 °0 °4 °
60°
58°
56 °
54 °
52 °
50°
production area
deposition area
residual currents
Netherlands
United Kingdom
Norway
Germany
Belgium
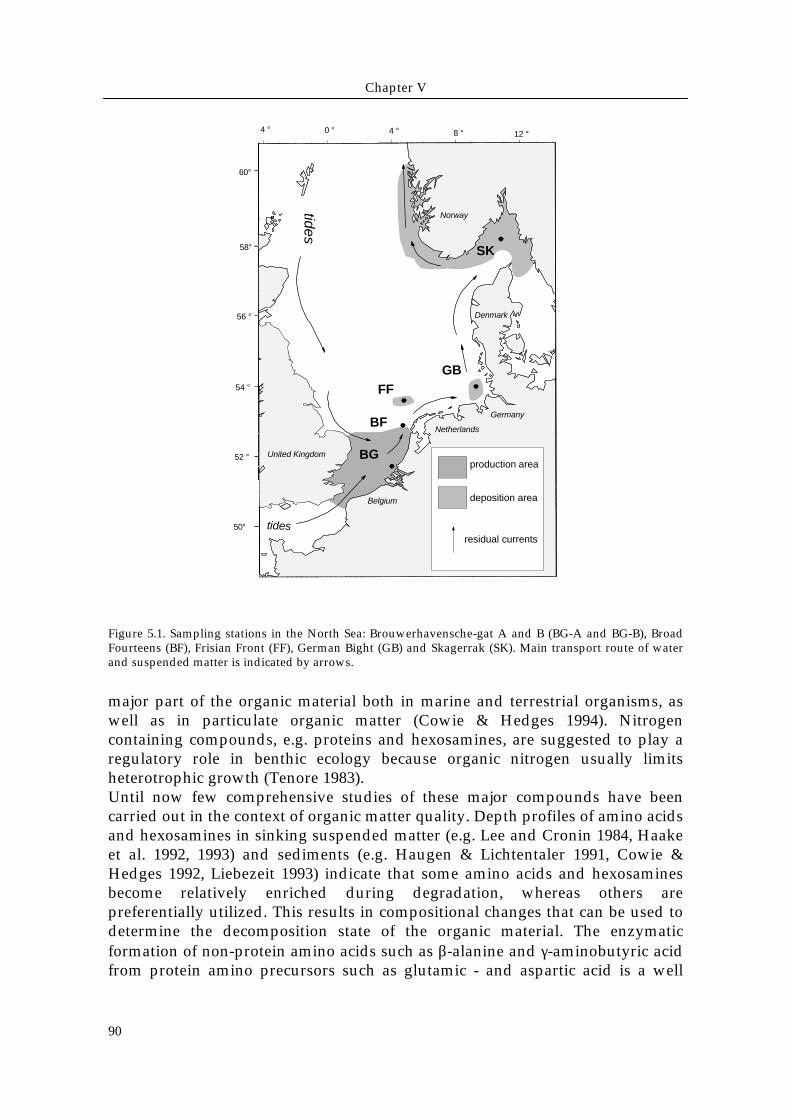
Figure 5.1. Sampling stations in the North Sea: Brouwerhavensche-gat A and B (BG-A and BG-B), BroadFourteens (BF), Frisian Front (FF), German Bight (GB) and Skagerrak (SK). Main transport route of waterand suspended matter is indicated by arrows.
major part of the organic material both in marine and terrestrial organisms, aswell as in particulate organic matter (Cowie & Hedges 1994). Nitrogencontaining compounds, e.g. proteins and hexosamines, are suggested to play aregulatory role in benthic ecology because organic nitrogen usually limitsheterotrophic growth (Tenore 1983).Until now few comprehensive studies of these major compounds have beencarried out in the context of organic matter quality. Depth profiles of amino acidsand hexosamines in sinking suspended matter (e.g. Lee and Cronin 1984, Haakeet al. 1992, 1993) and sediments (e.g. Haugen & Lichtentaler 1991, Cowie &Hedges 1992, Liebezeit 1993) indicate that some amino acids and hexosaminesbecome relatively enriched during degradation, whereas others arepreferentially utilized. This results in compositional changes that can be used todetermine the decomposition state of the organic material. The enzymaticformation of non-protein amino acids such as β-alanine and γ-aminobutyric acidfrom protein amino precursors such as glutamic - and aspartic acid is a well
Molecular composition: amino acids and hexosamines
91
known criterion of organic matter quality (e.g. Whelan 1977, Lee & Cronin 1982,Ittekkot et al. 1984a, Cowie & Hedges 1994). The ratios of the precursors to theirrespective degradation products can be interpreted as a measure of thedecompositional state of sedimentary organic matter.In coastal areas where the upper layer of the sediments (< 20 to 30 cm) isinhabited and extensively bioturbated by macrofauna, vertical concentrationprofiles can not be used to study the time evolution of organic matter (Boudreau1994). As an alternative, degradation states can be assessed on a horizontal planeby comparing sedimentary inventories between stations. In this study, wecompare six stations in the North Sea that differ in organic matter degradationstate as suggested by macrofaunal characteristics and physical setting along themajor current pattern of the North Sea. However, plankton is the ultimate originof organic matter at all stations.For these six stations we report complementary data on bulk and molecularparameters such as total organic carbon, total nitrogen, amino acids (14 proteinand 2 non-protein), hexosamines (glucosamine and galactosamine) and totalcarbohydrates. These data allow a comparison of the degradation state and thepotential food value to deposit feeders. We integrated our data with thosepublished by Cowie & Hedges (1994), who have conducted a cross-system studywith material varying from coastal trap material to highly decomposed deep-seasediments.
Materials and Methods
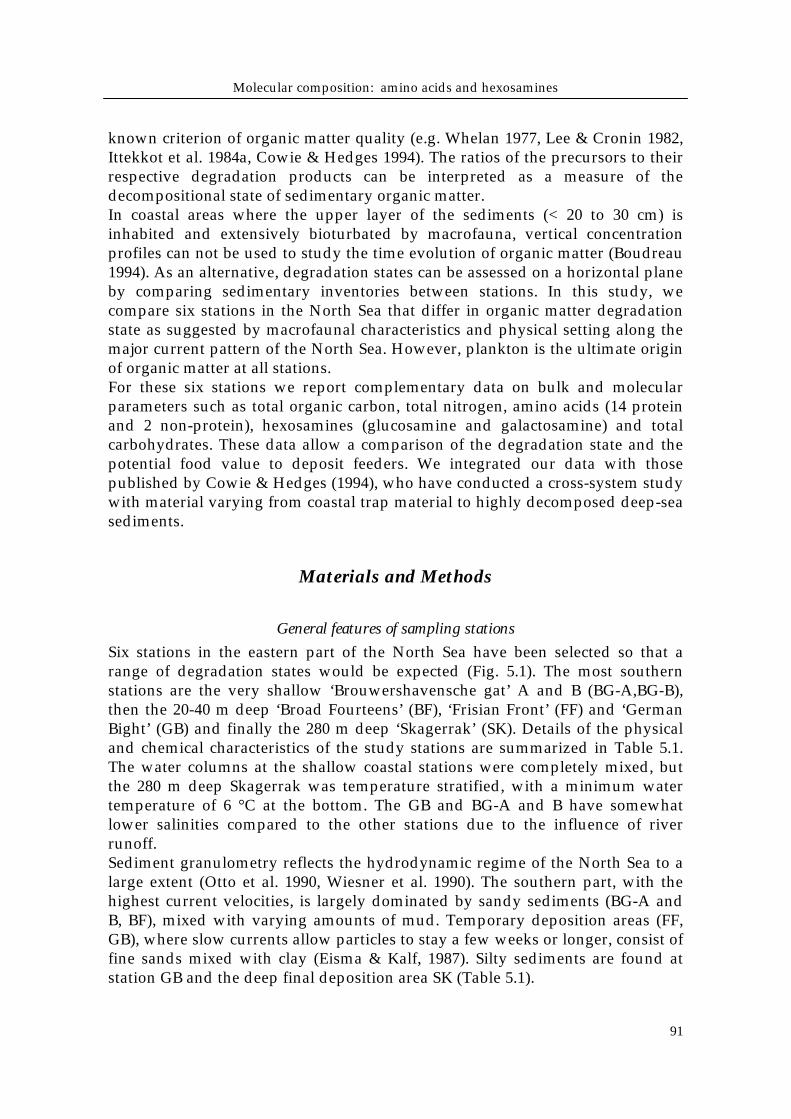
General features of sampling stationsSix stations in the eastern part of the North Sea have been selected so that arange of degradation states would be expected (Fig. 5.1). The most southernstations are the very shallow ‘Brouwershavensche gat’ A and B (BG-A,BG-B),then the 20-40 m deep ‘Broad Fourteens’ (BF), ‘Frisian Front’ (FF) and ‘GermanBight’ (GB) and finally the 280 m deep ‘Skagerrak’ (SK). Details of the physicaland chemical characteristics of the study stations are summarized in Table 5.1.The water columns at the shallow coastal stations were completely mixed, butthe 280 m deep Skagerrak was temperature stratified, with a minimum watertemperature of 6 °C at the bottom. The GB and BG-A and B have somewhatlower salinities compared to the other stations due to the influence of riverrunoff.Sediment granulometry reflects the hydrodynamic regime of the North Sea to alarge extent (Otto et al. 1990, Wiesner et al. 1990). The southern part, with thehighest current velocities, is largely dominated by sandy sediments (BG-A andB, BF), mixed with varying amounts of mud. Temporary deposition areas (FF,GB), where slow currents allow particles to stay a few weeks or longer, consist offine sands mixed with clay (Eisma & Kalf, 1987). Silty sediments are found atstation GB and the deep final deposition area SK (Table 5.1).
Bhgat-B Broad Fourteens Frisian Front Bhgat-A German Bight Skagerrak source depth
latitude 51° 46’ N 53° 00’ N 53° 42’ N 51° 45’ N 54° 05’ N 58° 12’ Nlongitude 3° 46’ E 3° 52’ E 4° 30’ E 3° 48’ E 8° 09’ E 10°15’ Ewater depth m 2.7 28 39 4.9 20 270temperature bottom water ° C 11.6 17.7 17 11.2 18.8 6.5salinity 31.6 34.6 34.3 31.5 31.2 35.1near surface flow velocity cm / s -- 30-40 10-35 -- 15-40 ? 1sedimentation rate cm / 100 y -- 0 10 -- 25-60 (30) 35 2median grain size µm 285 233 77 143 38 12 0-15 cmpercentage silt+clay (particles < 50 µm) % 0.4 1 48 33 64 98 0-15 cmporosity v/v 0.39 0.37 0.53 0.45 0.68 0.85 0-15 cmchlorophyll a ug /g -- 0.05 0.5 -- 10.7 b, 2.4 c 1.4 0-1 cmδ 13 C ‰ - 21.5 - 21.9 - 21.7 - 21.5 - 22.2 - 22.2 0-0.5 cmmacrofauna biomass g ADW / m2 1.0 1.9 13.5 201 a 38.1 11.4 0-15 cmbacterial biomass g C / m2 -- 2.7 5.0 -- 11.4 4.6 3 0-6.2 cmbacterial production g C/ m2 / d -- 2.44 1.48 -- 2.41 0.38 3 0-6.2 cmbacterial turnover P / B -- 0.9 0.3 -- 0.2 0.08 3 0-6.2 cm
GB-1 GB-2TOC mg/g 0.23 0.45 5.1 1.57 23.4 10.3 24.95 0-15 cmTN mg/g 0.06 0.09 0.44 0.23 2.62 0.77 2.48 0-15 cmTHAA mg/g 0.11 0.26 1.12 1.06 8.9 2.72 6.11 0-15 cmCarbohydrates mg/g 0.13 0.11 1.15 1.04 7.74 3.14 7.17 0-15 cmHexosamines mg/g 0.01 0.02 0.14 0.09 0.84 0.41 1.17 0-15 cmC/N molar ratio 4.6 5.7 13.5 7.9 10.4 15.6 11.7 0-15 cmTHAA/ Hexosamines molar ratio 13 4 2 245 * 32 8 16 0-15 cmAsp / β-Ala molar ratio 37 71 11 16 40 7 5 0-15 cmGlu / γ-Aba molar ratio 44 448* 13 16 21 12 8 0-15 cm
Table 5.1. Characteristics of the sediment at all sites. Sources: 1* Boon and Duineveld (1996), 2 * de Haas and van Weering (1997) and pers. comm.,3* van Duyl and Kop (1994) the same stations were visited during a cruise in August 1992. a high biomass at BG-A because of some large animals.
b surface layer (0 to 1cm), c deep layer (1 to15 cm). * Exceptionally high ratios due to low values of the denominator.
Molecular composition: amino acids and hexosamines
93
0 10 20 30 40
0
5
10
15
20
25
0 10 20 30 40
0
5
10
15
20
250 10 20 30 40
0
5
10
15
20
25
0 10 20 30 40
0
5
10
15
20
250 10 20 30 40
0
5
10
15
20
25
0 10 20 30 40
0
5
10
15
20
25FF
GBSK BG-A
BG-BBF
Dep
th [c
m]
mg TOC g -1
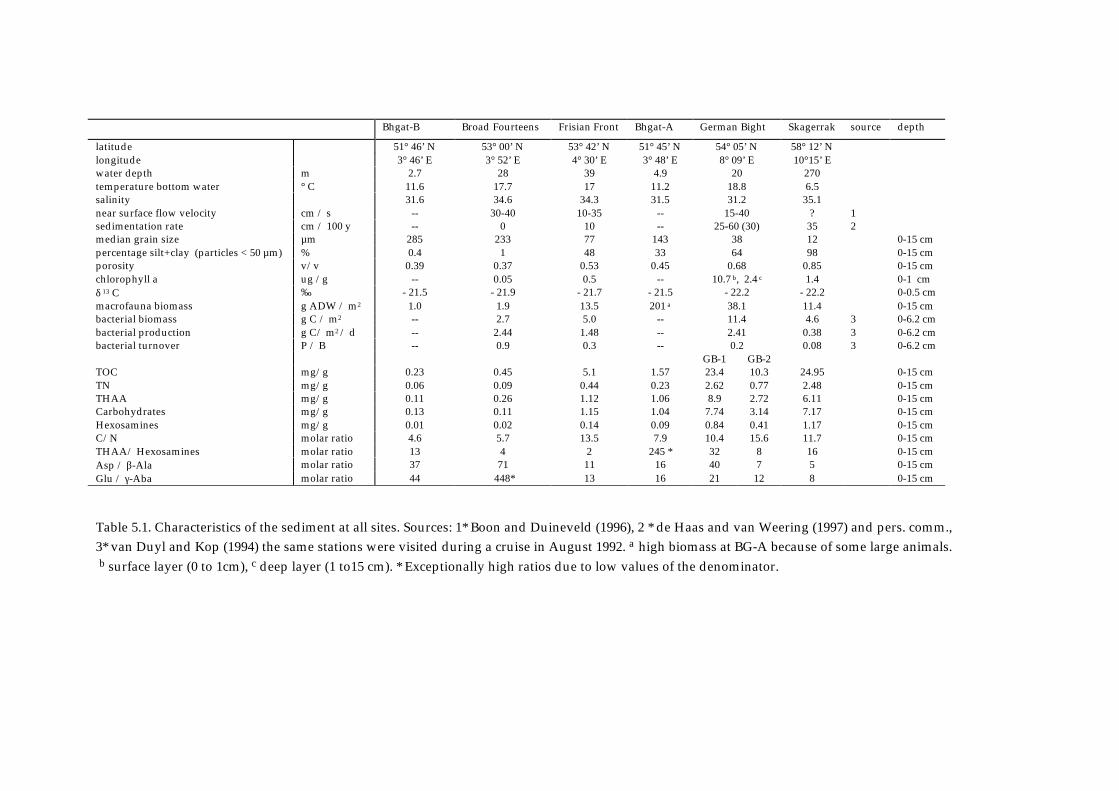
Figure 5.2. Vertical profiles of total organic carbon (TOC) within the sediment at all stations. Stations arepresented in the order proposed by the principal component analysis (see discussion).
The major source of organic material in the North Sea is local primaryproduction as indicated by the stable carbon isotope composition (δ13C) of about-21‰ to -22‰ at all stations (Table 5.1), matching the value typically found inNorth Sea marine plankton (e.g. Dauby et al. 1994). Most of the primaryproduction takes place in the shallow, unstratified southern part of the North Sea(BG-A, BG-B, BF, FF). After the spring bloom, the fresh material sinks to thebottom, ages and is transported by bed-load transport successively to the north,with SK as the final deposition area (Eisma & Kalf 1987a,b, van Weering et al.1993, Lohse et al. 1995).Factors such as primary productivity, water depth, sediment accumulation rate,macrofaunal and microbial biomass are responsible for the amount andnutritional quality of organic matter in sediments. The quality of sedimentaryorganic matter as revealed by bacterial turnover rates is highest at station BF thatreceives fresh material and lowest at stations with more refractory organicmatter (e.g. SK, FF). Macrofauna biomass is lowest at the sandy stations (BG-Band BF) (Table 5.1). The stations have been chosen on the basis of thesecontrasting features to make sure that a broad quality range would be covered.
Sampling procedureStations Broad Fourteens (BF), Frisian Front (FF), German Bight (GB) andSkagerrak (SK) were visited with the RV ’Pelagia’ in August 1994, and the mostsouthern stations Brouwerhavensche-gat A and B (BG-A and BG-B) with the RV‘Luctor’ in May 1996 (Fig. 5.1). At each station four box cores were recovered andeach was subsampled immediately with plastic liners having a diameter of 3.3
Chapter V
94
SK GB-2 GB-1 BG-A FF BF BG-B0
5
10
15
20
25
30
TOCTN
conc
entr
atio
n(
mg
g -1
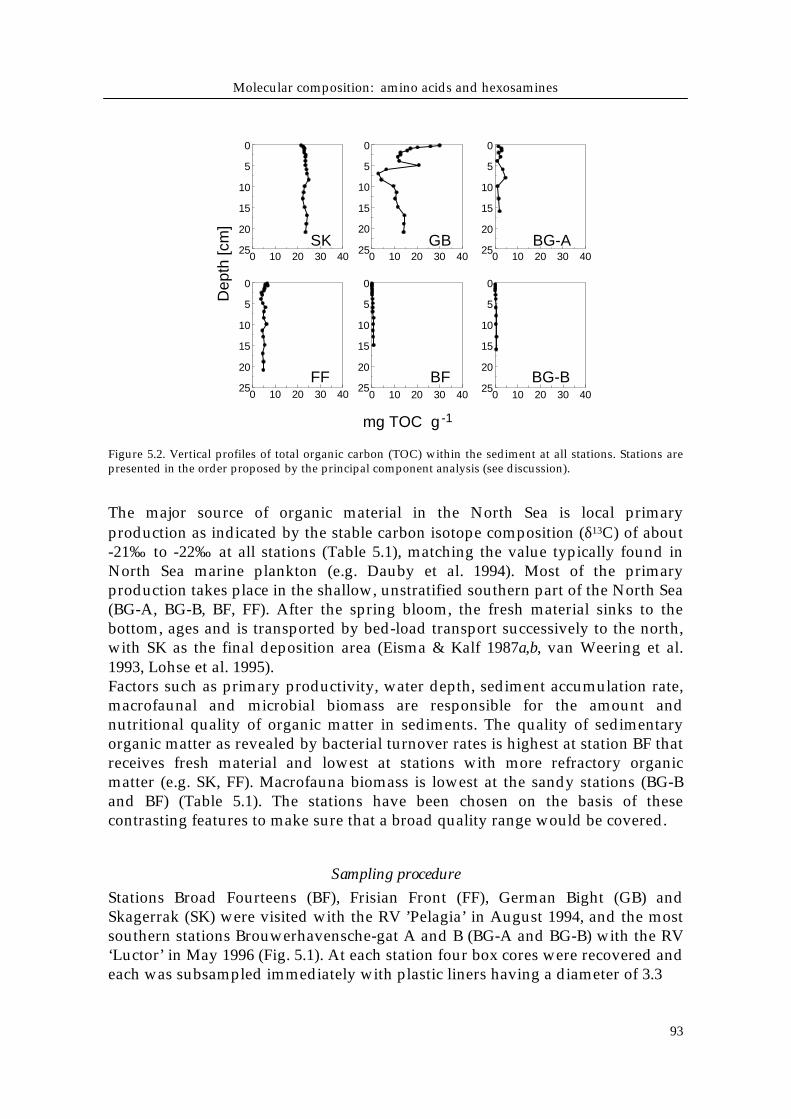
) Figure 5.3. Depth averaged:total organic carbon (TOC) andtotal nitrogen (TN). GB-1 (0 to 1cm), GB-2 (1 to 15cm), SK, FF,BG-A, BG-B, BF (0 to 15 cm).
cm and a length of 50 cm. These subcores were successively sliced in verticalhorizons and samples from each horizon were pooled after sectioning. The coreswere sliced at 0.25 cm resolution in the top cm, at 0.5 cm resolution down to 3cm, at 1 cm resolution down to 7 cm and 1.5 cm thick slices down to 15 cmdepth. The sediment was immediately frozen on board and then freeze-dried.
Chemical analysisTotal organic carbon (TOC) and total nitrogen (TN) were determined on freeze-dried samples that had been finely powdered and homogenized. A 20-50 mgsplit was combusted at 1010 °C in a Carlo Erba Elemental Analyser NA-1500after removal of carbonate by in situ acidification with 25 % HCl within silversample cups (Nieuwenhuize et al. 1994). Reproducibility is about 2 % for bothTOC and TN.Total hydrolyzable amino acids (THAA) and hexosamines were quantified byreverse-phase HPLC of their fluorescent derivatives (Roth 1971, Benson & Hare1975) and comparison with known amounts of authentic standards (Sigma)following a modified procedure after Hill et al. (1979) and Lindroth & Mopper(1979) with precolumn o-phthaldaldehyde (OPA) derivatization. The OPAsolution was prepared by dissolving 134 mg of OPA (Pierce) in 5 ml of methanol(gradient grade) and adding 100 µl of 2-mercaptoethanol (Merck). This solutionwas brought to 25 ml volume with borate buffer. The borate buffer was preparedby adjusting 0.4 M boric acid to pH 9.5 with 6N NaOH. The OPA-solution wasprepared the day before use, stored refrigerated and protected from light.About 0.1- 0.25 g homogenized, freeze dried samples were weighed intoampoules, hydrolysed under nitrogen in 5 ml 6 N HCL at 100 °C for 24 hours,centrifuged and the supernatant was stored frozen at - 40 °C until analysis. A 250µl aliquot of the hydrolyzate was neutralized with 1 N NaOH and brought tovolume with ultrapure, destilled Milli-Q water resulting in 25 to 100 timesdilution depending on expected concentrations.Fluorescent OPA derivatives were formed on line exactly 2 minutes prior toinjection by adding 10 µl OPA solution to 100 µl of the neutralized sample. Anautoinjector (WISP 717 plus) was used to standardize the derivatization time.
Molecular composition: amino acids and hexosamines
95
SK GB-2 GB-1 BG-A FF BF BG-B0
20
40
60
80
100
A hexosaminescarbohydratesamino acids
% -
TO
C
SK GB-2 GB-1 BG-A FF BF BG-B0
20
40
60
80
100
B
% -
TN
hexosaminesamino acids
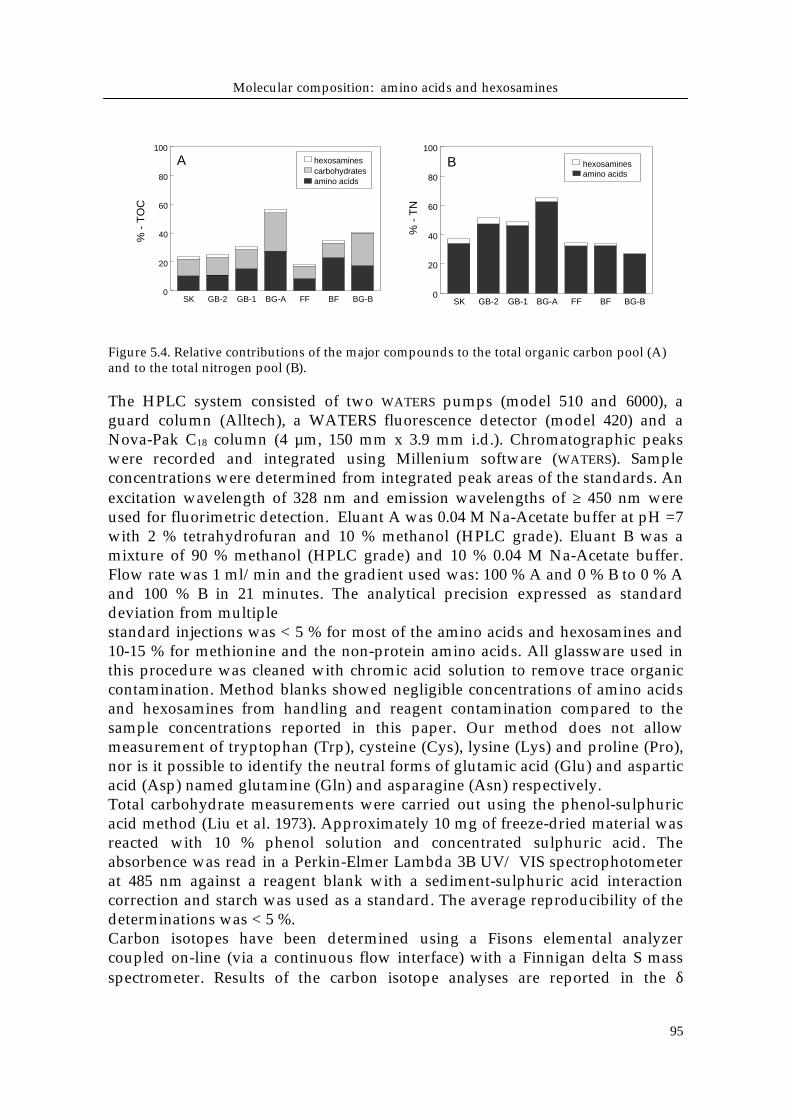
Figure 5.4. Relative contributions of the major compounds to the total organic carbon pool (A)and to the total nitrogen pool (B).
The HPLC system consisted of two WATERS pumps (model 510 and 6000), aguard column (Alltech), a WATERS fluorescence detector (model 420) and aNova-Pak C18 column (4 µm, 150 mm x 3.9 mm i.d.). Chromatographic peakswere recorded and integrated using Millenium software (WATERS). Sampleconcentrations were determined from integrated peak areas of the standards. Anexcitation wavelength of 328 nm and emission wavelengths of ≥ 450 nm wereused for fluorimetric detection. Eluant A was 0.04 M Na-Acetate buffer at pH =7with 2 % tetrahydrofuran and 10 % methanol (HPLC grade). Eluant B was amixture of 90 % methanol (HPLC grade) and 10 % 0.04 M Na-Acetate buffer.Flow rate was 1 ml/min and the gradient used was: 100 % A and 0 % B to 0 % Aand 100 % B in 21 minutes. The analytical precision expressed as standarddeviation from multiplestandard injections was < 5 % for most of the amino acids and hexosamines and10-15 % for methionine and the non-protein amino acids. All glassware used inthis procedure was cleaned with chromic acid solution to remove trace organiccontamination. Method blanks showed negligible concentrations of amino acidsand hexosamines from handling and reagent contamination compared to thesample concentrations reported in this paper. Our method does not allowmeasurement of tryptophan (Trp), cysteine (Cys), lysine (Lys) and proline (Pro),nor is it possible to identify the neutral forms of glutamic acid (Glu) and asparticacid (Asp) named glutamine (Gln) and asparagine (Asn) respectively.Total carbohydrate measurements were carried out using the phenol-sulphuricacid method (Liu et al. 1973). Approximately 10 mg of freeze-dried material wasreacted with 10 % phenol solution and concentrated sulphuric acid. Theabsorbence was read in a Perkin-Elmer Lambda 3B UV/ VIS spectrophotometerat 485 nm against a reagent blank with a sediment-sulphuric acid interactioncorrection and starch was used as a standard. The average reproducibility of thedeterminations was < 5 %.Carbon isotopes have been determined using a Fisons elemental analyzercoupled on-line (via a continuous flow interface) with a Finnigan delta S massspectrometer. Results of the carbon isotope analyses are reported in the δ
Chapter V
96
notation relative to Vienna-PDB. Reproducibility based on replicatemeasurements was better than 0.1 ‰. Chloroyphyll-a was determined usingreverse phase HPLC according to Mantoura & Llewellyn (1983) after extractionin 90% acetone. Macrofauna biomass was determined from 3 box cores of 50 cmdiameter and > 15 cm penetration depth at each station. Whole cores were sievedon 0.5 mm mesh width, stored in 4 % buffered formaldehyde, stained with RoseBengal and sorted under a stereo microscope. Ash free dry weight (AFDW) wasmeasured by weight loss after combustion at 500°C. Grain size spectra weremeasured with a Malvern Particle Sizer 3600 EC.
Results
Concentration of major organic componentsOrganic carbon concentrations showed little variation with depth in thesediment (Fig. 5.2), except at station GB where the surface layer is enriched inorganic carbon compared to the deeper layers. The organic matter in the surfacelayer was also of higher quality compared to the deeper stratum as indicated bythe higher chlorophyll-a content (Table 5.1). These results suggest that this layerwas recently deposited and was not yet completely mixed by bioturbation, as atthe other much more homogenous stations.The other major components (total nitrogen, carbohydrates, amino acids andhexosamines) neatly followed the trends observed in the total organic carbon
G ly A s p Ala G lu Ser Val L e u Thr Arg I le P h e Tyr M e t H is0
5
10
15
20
25
S KGB-2
FFBG-AGB-1
BG-BB F
mol
e %
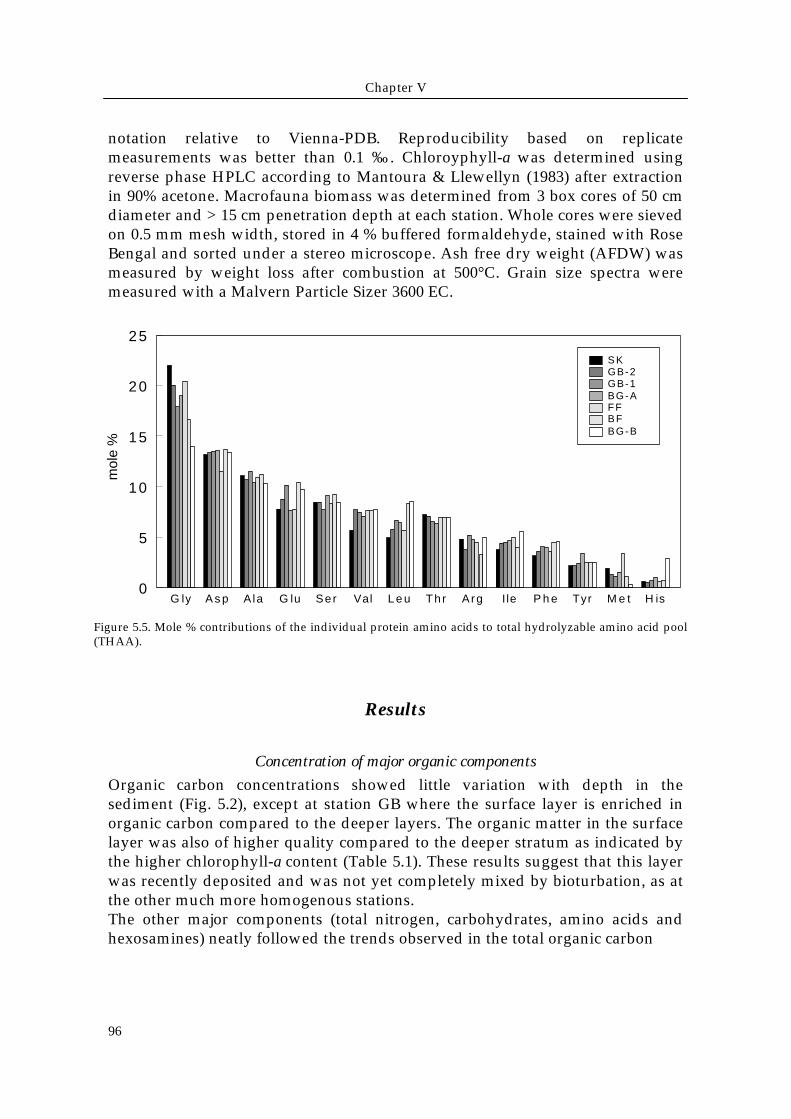
Figure 5.5. Mole % contributions of the individual protein amino acids to total hydrolyzable amino acid pool(THAA).
Molecular composition: amino acids and hexosamines
97
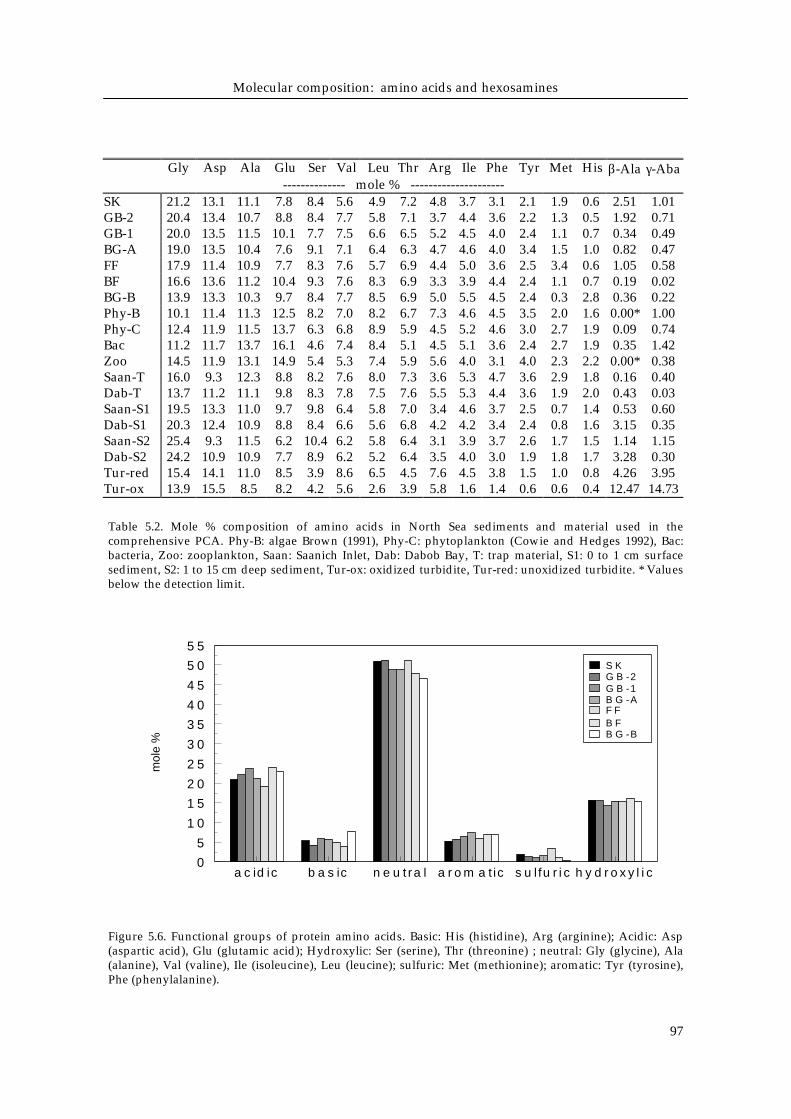
Table 5.2. Mole % composition of amino acids in North Sea sediments and material used in thecomprehensive PCA. Phy-B: algae Brown (1991), Phy-C: phytoplankton (Cowie and Hedges 1992), Bac:bacteria, Zoo: zooplankton, Saan: Saanich Inlet, Dab: Dabob Bay, T: trap material, S1: 0 to 1 cm surfacesediment, S2: 1 to 15 cm deep sediment, Tur-ox: oxidized turbidite, Tur-red: unoxidized turbidite. * Valuesbelow the detection limit.
Figure 5.6. Functional groups of protein amino acids. Basic: His (histidine), Arg (arginine); Acidic: Asp(aspartic acid), Glu (glutamic acid); Hydroxylic: Ser (serine), Thr (threonine) ; neutral: Gly (glycine), Ala(alanine), Val (valine), Ile (isoleucine), Leu (leucine); sulfuric: Met (methionine); aromatic: Tyr (tyrosine),Phe (phenylalanine).
a c id ic b a s ic n e u t ra l a r o m a t ic s u l fu r i c h y d r o x y l i c0
5
1 0
1 5
2 0
2 5
3 0
3 5
4 0
4 5
5 0
5 5
S KG B -2
F FB G -AG B -1
B G -BB F
mol
e %
Gly Asp Ala Glu Ser Val Leu Thr Arg Ile Phe Tyr Met His β-Ala γ-Aba
-------------- mole % ---------------------SK 21.2 13.1 11.1 7.8 8.4 5.6 4.9 7.2 4.8 3.7 3.1 2.1 1.9 0.6 2.51 1.01GB-2 20.4 13.4 10.7 8.8 8.4 7.7 5.8 7.1 3.7 4.4 3.6 2.2 1.3 0.5 1.92 0.71GB-1 20.0 13.5 11.5 10.1 7.7 7.5 6.6 6.5 5.2 4.5 4.0 2.4 1.1 0.7 0.34 0.49BG-A 19.0 13.5 10.4 7.6 9.1 7.1 6.4 6.3 4.7 4.6 4.0 3.4 1.5 1.0 0.82 0.47FF 17.9 11.4 10.9 7.7 8.3 7.6 5.7 6.9 4.4 5.0 3.6 2.5 3.4 0.6 1.05 0.58BF 16.6 13.6 11.2 10.4 9.3 7.6 8.3 6.9 3.3 3.9 4.4 2.4 1.1 0.7 0.19 0.02BG-B 13.9 13.3 10.3 9.7 8.4 7.7 8.5 6.9 5.0 5.5 4.5 2.4 0.3 2.8 0.36 0.22Phy-B 10.1 11.4 11.3 12.5 8.2 7.0 8.2 6.7 7.3 4.6 4.5 3.5 2.0 1.6 0.00* 1.00Phy-C 12.4 11.9 11.5 13.7 6.3 6.8 8.9 5.9 4.5 5.2 4.6 3.0 2.7 1.9 0.09 0.74Bac 11.2 11.7 13.7 16.1 4.6 7.4 8.4 5.1 4.5 5.1 3.6 2.4 2.7 1.9 0.35 1.42Zoo 14.5 11.9 13.1 14.9 5.4 5.3 7.4 5.9 5.6 4.0 3.1 4.0 2.3 2.2 0.00* 0.38Saan-T 16.0 9.3 12.3 8.8 8.2 7.6 8.0 7.3 3.6 5.3 4.7 3.6 2.9 1.8 0.16 0.40Dab-T 13.7 11.2 11.1 9.8 8.3 7.8 7.5 7.6 5.5 5.3 4.4 3.6 1.9 2.0 0.43 0.03Saan-S1 19.5 13.3 11.0 9.7 9.8 6.4 5.8 7.0 3.4 4.6 3.7 2.5 0.7 1.4 0.53 0.60Dab-S1 20.3 12.4 10.9 8.8 8.4 6.6 5.6 6.8 4.2 4.2 3.4 2.4 0.8 1.6 3.15 0.35Saan-S2 25.4 9.3 11.5 6.2 10.4 6.2 5.8 6.4 3.1 3.9 3.7 2.6 1.7 1.5 1.14 1.15Dab-S2 24.2 10.9 10.9 7.7 8.9 6.2 5.2 6.4 3.5 4.0 3.0 1.9 1.8 1.7 3.28 0.30Tur-red 15.4 14.1 11.0 8.5 3.9 8.6 6.5 4.5 7.6 4.5 3.8 1.5 1.0 0.8 4.26 3.95Tur-ox 13.9 15.5 8.5 8.2 4.2 5.6 2.6 3.9 5.8 1.6 1.4 0.6 0.6 0.4 12.47 14.73
Chapter V
98
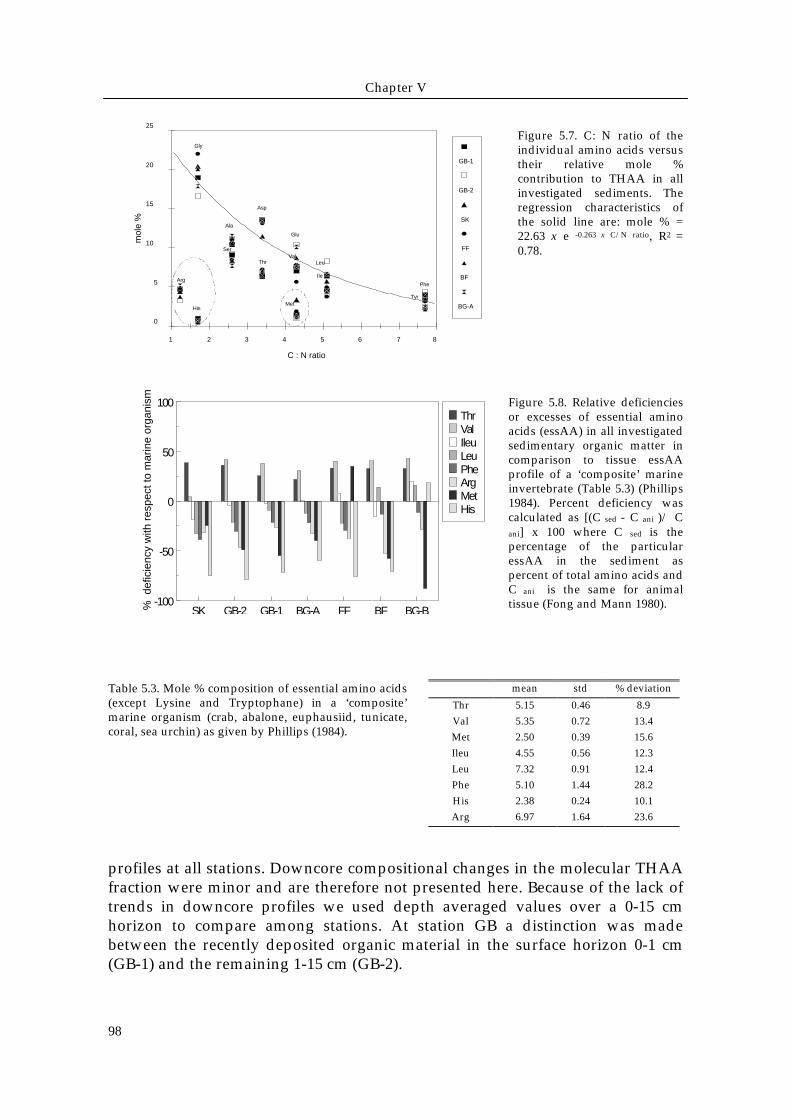
Figure 5.7. C: N ratio of theindividual amino acids versustheir relative mole %contribution to THAA in allinvestigated sediments. Theregression characteristics ofthe solid line are: mole % =22.63 x e -0.263 x C/N ratio, R2 =0.78.
Figure 5.8. Relative deficienciesor excesses of essential aminoacids (essAA) in all investigatedsedimentary organic matter incomparison to tissue essAAprofile of a ‘composite’ marineinvertebrate (Table 5.3) (Phillips1984). Percent deficiency wascalculated as [(C sed - C ani )/ Cani] x 100 where C sed is thepercentage of the particularessAA in the sediment aspercent of total amino acids andC ani is the same for animaltissue (Fong and Mann 1980).
Table 5.3. Mole % composition of essential amino acids(except Lysine and Tryptophane) in a ‘composite’marine organism (crab, abalone, euphausiid, tunicate,coral, sea urchin) as given by Phillips (1984).
profiles at all stations. Downcore compositional changes in the molecular THAAfraction were minor and are therefore not presented here. Because of the lack oftrends in downcore profiles we used depth averaged values over a 0-15 cmhorizon to compare among stations. At station GB a distinction was madebetween the recently deposited organic material in the surface horizon 0-1 cm(GB-1) and the remaining 1-15 cm (GB-2).
SK GB-2 GB-1 BG-A FF BF BG-B-100
-50
0
50
100ThrValIleuLeuPheArgMetHis
% d
efic
ienc
y w
ith r
espe
ct to
mar
ine
orga
nism
s
C : N ratio
0
5
10
15
20
25
mol
e %
Gly
Asp
Ala
Glu
SerVal
LeuThr
ArgIle
Phe
TyrMet
His
GB-1
GB-2
SK
FF
BF
BG-A
1 2 3 4 5 6 7 8
mean std % deviation
Thr 5.15 0.46 8.9
Val 5.35 0.72 13.4
Met 2.50 0.39 15.6
Ileu 4.55 0.56 12.3
Leu 7.32 0.91 12.4
Phe 5.10 1.44 28.2
His 2.38 0.24 10.1
Arg 6.97 1.64 23.6
Molecular composition: amino acids and hexosamines
99
Depth-averaged organic carbon contents (Fig. 5.3) varied from less than 0.5 mgTOC/ g in sandy sediments (BF and BG-B) stations to up to 24 mg TOC/g in thesilty to muddy sediments (SK and GB-1). Sediments at stations GB-2, FF and BG-A showed intermediate organic carbon contents of ± 2 -11 mg TOC/g. The totalamounts of the other components followed the same general trend as has beenobserved for TOC with TN ranging from about 0.06 to 2.6 mg g-1, THAAbetween ~0.1 and 9 mg g-1, carbohydrates between ~0.1 and 8 mg g-1 andhexosamines between ~0.01 and 1.2 mg g-1 dry weight (Table 5.1). The molarC/N ratios of bulk organic matter varied between 5 and 16 (Table 5.1).
Relative contribution of major compound groupsAt most stations, between ~20 and 60 % of the TOC was identified as carbonderived from amino acids, carbohydrates and hexosamines (Fig. 5.4 a) and themajor fraction of the total organic carbon remained unidentified. Amino acidsand carbohydrates each composed between 8 and 28 % of the TOC andhexosamines accounted for a small fraction, with a only about 2 % TOC in mostsediments. Compared to TOC, organic nitrogen could be identified to a largerextent (up to 66 % of TN), with total hydrolyzable amino acid and hexosaminescontributing between 25 and 60 % and 0 to 4 % of the total nitrogen in thesediment samples, respectively (Fig. 5.4 b).The identified fraction of TOC generally increased from the silty to muddy SKand GB sediments to the coarse grained BF and BG-B, suggesting a decreasingcontribution of humified organic matter or other resistant biopolymers. The sizeof the identified TN fraction does not follow a clear trend.
Relative contribution of molecular compounds
Amino acids
These coastal sediments appeared to be rather similar in terms of relativeconcentrations of the individual amino acids (Fig. 5.5, Table 5.2). At all stationsglycine dominated with a contribution up to 22 mole %, followed by asparticacid and alanine that contributed 10 to15 mole %. Glutamic acid, serine, valine,leucine and threonine accounted for 5 to10 mole %, and a minor group ofarginine, isoleucine, phenylalanine, tyrosine, methionine and histidinecontributed less than 5 mole %. The molar C/N ratio of the THAA pool wasabout 3.5 at all stations.Despite overall similarity between stations, some amino acids showed distinctmole concentration patterns (Fig. 5.5). Mole % of glycine and methionineincreased from stations BF and BG-B to SK and GB-2, whereas mole % of leucine,isoleucine and phenylalanine decreased. The contribution of the remaining
Chapter V
100
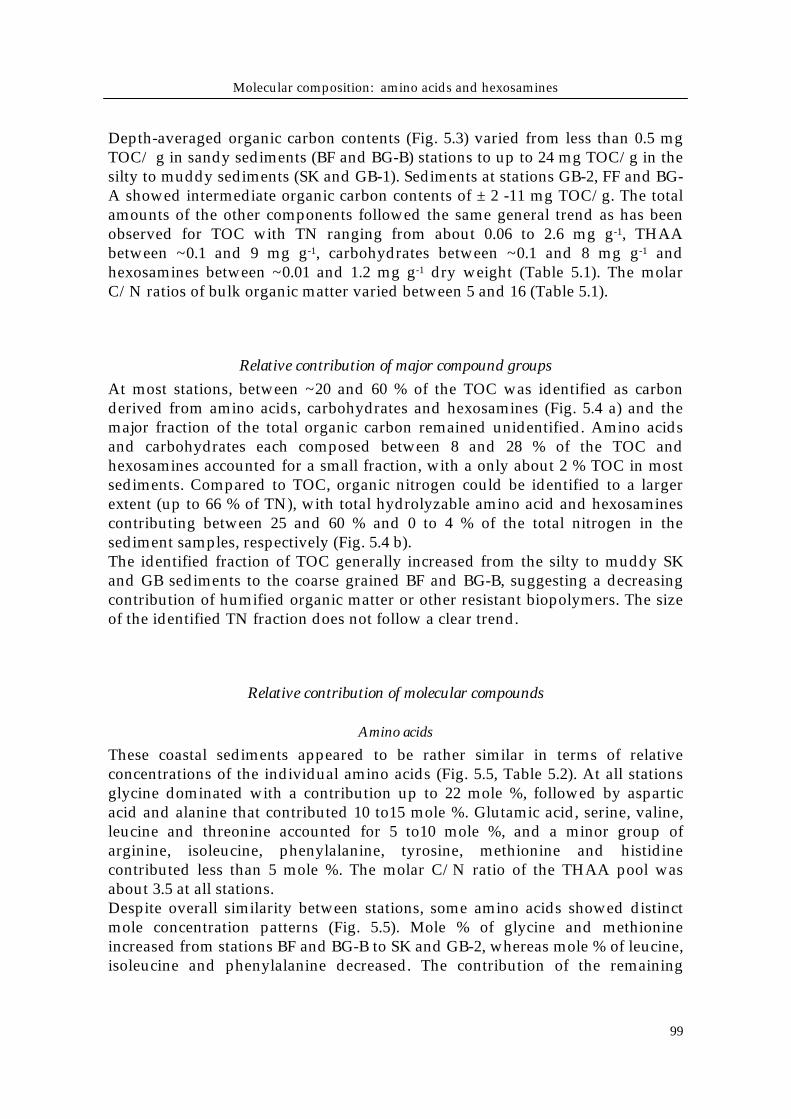
protein amino acids varied less consistently between the stations.The division of the protein amino acids into charge classes (Fig. 5.6) showed thatthe neutral amino acids (glycine + alanine + valine + leucine+ isoleucine)dominate (45 to 50 mole %) and that acidic (glutamic - and aspartic acid),hydroxylic (serine + threonine), aromatic (tyrosine + phenylalanine), basic(arginine + histidine) and sulfuric (methionine) amino acids account for 24, 15,<7, <7 and <3 mole % respectively. This lumping of amino acids in terms offunctional groups generally masked the differences between the sedimentscompared to the trends observed in the individual amino acids. Only neutralamino acids decreased when going from SK and GB-2 (about 51 mole %) to BG-Band BF (about 46 mole %). The other charge classes often contain amino acidswith little or contrasting individual concentration patterns, resulting in smalland irregular variation among the sediments.The C/N ratio of individual amino acids correlates with the relative contributionof these compounds to the total protein pool in the sediment organic matter (Fig.5.7). Short chained, nitrogen-rich amino acids, such as glycine, occur in higherconcentrations in sediment material than nitrogen-poor amino acids such as thearomatic phenylalanine and tyrosine. The basic amino acids arginine andhistidine, and the sulfur containing methionine are present in lowerconcentrations than would be expected by the general increase of mole % withdecreasing C/N ratio.The mole % contributions of essential amino acid in the North Sea sedimentswere compared to a ‘composite’ marine organism tissue (Table 5.3) to investigateif some of these essential compounds were deficient and consequently belimiting in deposit feeder diets (Fig. 5.8). The sulfur containing methionine andthe basic histidine and arginine appeared to be the most deficient essentialamino acids in sedimentary organic matter relative to heterotroph organismtissue, with depletions ≤ - 90 % for methionine, ≤ - 80 % for histidine and ≤ - 50 %for arginine.
0
1
2
3
γ-Aba β -Ala
SK
GB-2
FFBG-A
GB-1
BG-B
BF
mol
e %
Figure 5.9. Mole % contributions of the non protein amino acidsβ-alanine and γ-aminobutyric acid.
Molecular composition: amino acids and hexosamines
101
Non-protein amino acids
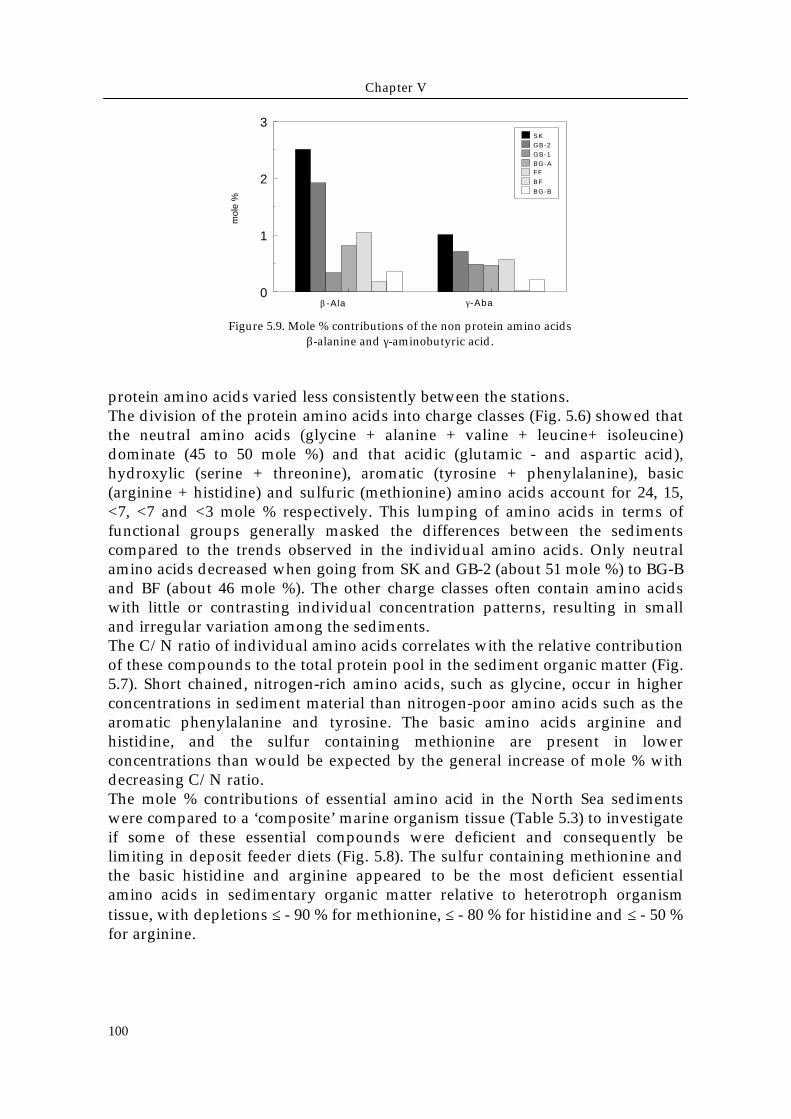
Non-protein amino acids occurred in minor concentrations in the sediments withβ-alanine (up to 2.5 mole %) being more abundant than γ-aminobutyric acid (lessthan 1 mole %). These molecular compounds increased in relative abundancewhen going from BF and BG-B to SK (Fig. 5.9). Moreover, Glu/ γ-Aba andAsp/β-Ala ratios decreased when going from station BF and BG-B to GB-2 andSK (Table 5.1), indicating that degradation products accumulated along thisarray of stations. An exceptionally high Glu/ γ-Aba ratio was found at BF, sinceonly traces of degradation products were detected. Decreasing Glu/ γ-Aba andAsp/ β-Ala ratios were also found with depth in sediment at station GB, but notat the other stations which are rather homogenous with depth (Fig. 5.10).
Figure 5.10. Profiles within the sediment of the ratios of the protein amino acids aspartic acid and glutamicacid to their non protein derivates β-alanine and γ-aminobutyric acid, respectively. Solid squares: stationGB and open circles: station SK.
Hexosamines
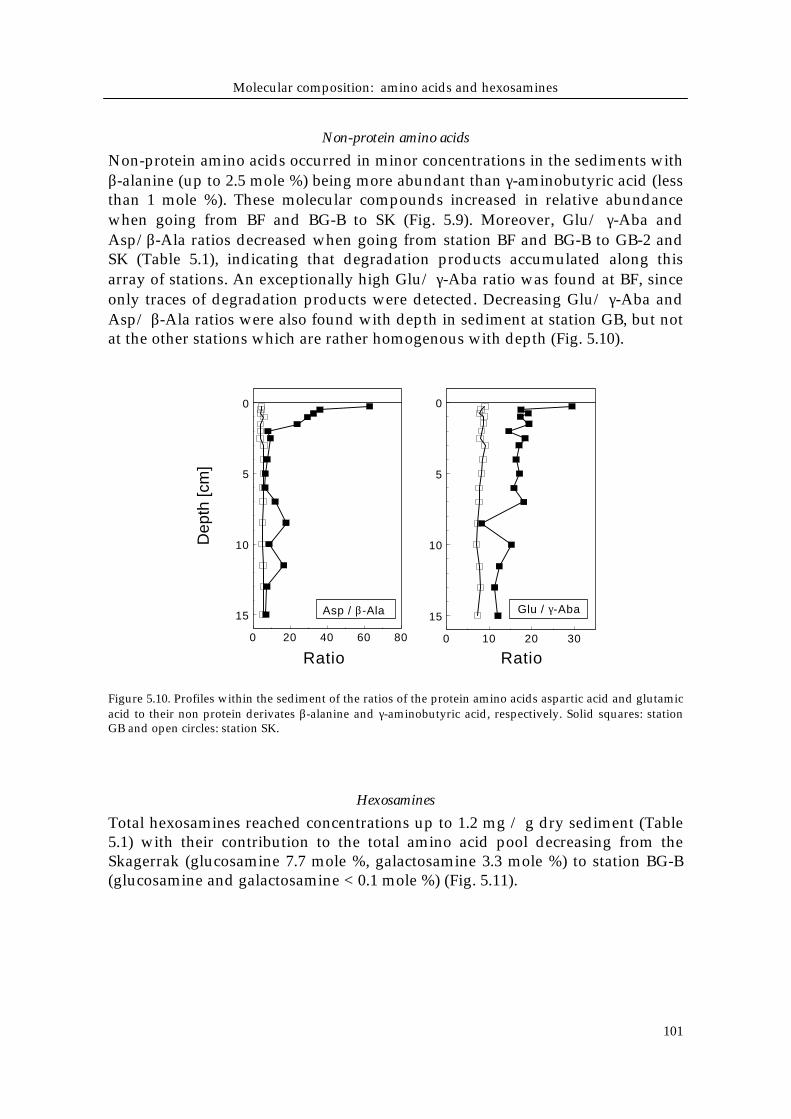
Total hexosamines reached concentrations up to 1.2 mg / g dry sediment (Table5.1) with their contribution to the total amino acid pool decreasing from theSkagerrak (glucosamine 7.7 mole %, galactosamine 3.3 mole %) to station BG-B(glucosamine and galactosamine < 0.1 mole %) (Fig. 5.11).
0 10 20 30
0
5
10
15
0 20 40 60 80
0
5
10
15 Asp / β-Ala Glu / γ-Aba
Dep
th [c
m]
RatioRatio
Chapter V
102
Figure 5.11. Relative contributions of glucosamine and galactosamine to the sum of THAA and
hexosamine.
Discussion
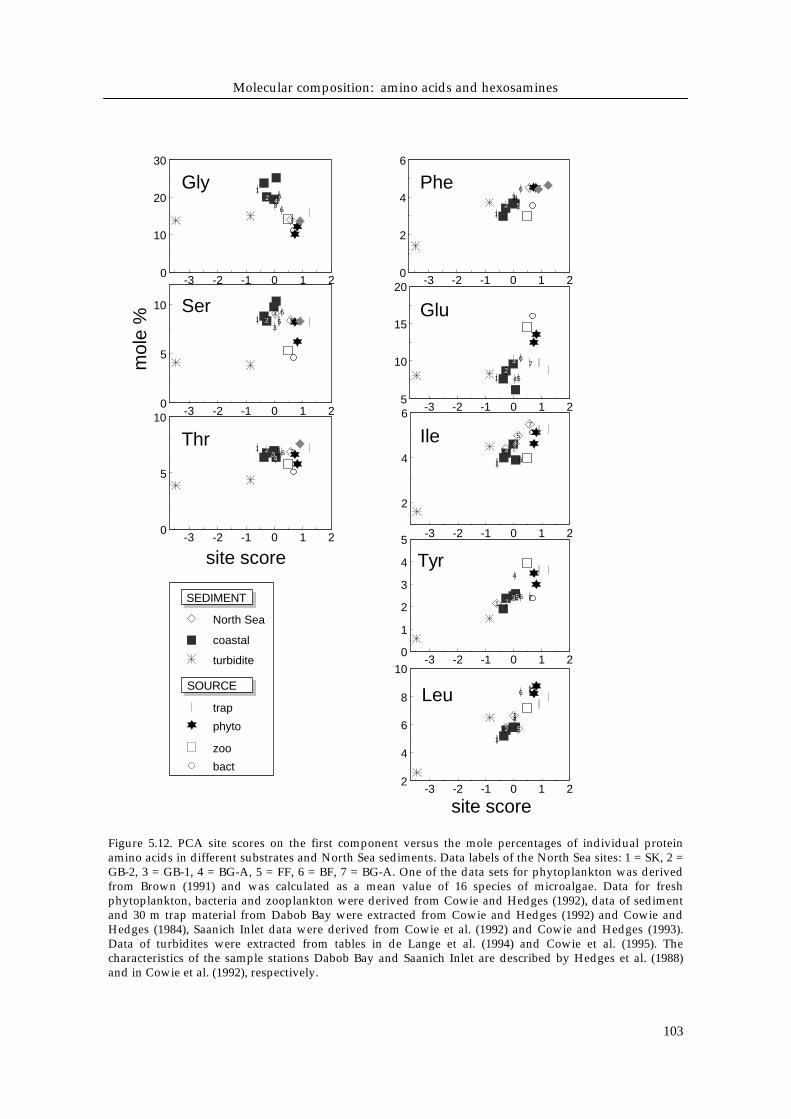
Mole concentrations of amino acids usually appear to be rather constant withdepth in the bioturbated zone, but may change over large depth scales (in termsof meters), hence longer time scales (Henrichs & Farrington 1987, Cowie &Hedges 1992). These vertical changes have been attributed to differences in thereactivity of the individual amino acids (e.g. Haugen & Lichtentaler 1991, Cowieet al. 1992) depending on their nitrogen content, chain length and functionalgroups. Our results support these observations, since amino acids are distributedrather homogeneously with depth in the bioturbated zones (Fig. 5.2, 5.10), butthere are systematic differences of mole concentrations of THAA between NorthSea stations on a horizontal scale (Fig. 5.5).To test whether the intersite trends observed in mole % contribution of theamino acids can be used to order the stations in terms of organic matter quality,a Principal Component Analysis (PCA) was carried out. The North Seasediments were analyzed together with literature data including end-memberssuch as labile organic matter present in source organisms (bacteria,phytoplankton, zooplankton), sediment trap material and more degradedorganic matter present in coastal sediments and refractory deep sea deposits(Fig. 5.12). Hexosamines were not integrated into the PCA analysis because thereis no comprehensive literature data set available.
glucosamine galactosamine0
2
4
6
8
10
SK
GB-2
FFBG-AGB-1
BFBG-B
mol
e %
Molecular composition: amino acids and hexosamines
103
-3 -2 -1 0 1 20
2
4
6
Phe
-3 -2 -1 0 1 25
10
15
20
Glu
-3 -2 -1 0 1 2
2
4
6
-3 -2 -1 0 1 20
1
2
3
4
5
Leu
-3 -2 -1 0 1 22
4
6
8
10
Ile
-3 -2 -1 0 1 20
10
20
30
Gly
-3 -2 -1 0 1 20
5
10 Ser
-3 -2 -1 0 1 20
5
10
Thr
site score
site score
mol
e %
coastal
North Sea
phyto
zoo
trap
turbidite
bact
SOURCE
SEDIMENT
12
345
6
7
1
1
2
2
3
3
4
4
5
5
6
6
7
7
1
234
5
6 7
1
1
2
2
21
1
2
3
3
3
3
4
4
4
5
54
5
5
6
6
6
7
7
6
7
7
1
1
1
Tyr
1
3
1
Figure 5.12. PCA site scores on the first component versus the mole percentages of individual proteinamino acids in different substrates and North Sea sediments. Data labels of the North Sea sites: 1 = SK, 2 =GB-2, 3 = GB-1, 4 = BG-A, 5 = FF, 6 = BF, 7 = BG-A. One of the data sets for phytoplankton was derivedfrom Brown (1991) and was calculated as a mean value of 16 species of microalgae. Data for freshphytoplankton, bacteria and zooplankton were derived from Cowie and Hedges (1992), data of sedimentand 30 m trap material from Dabob Bay were extracted from Cowie and Hedges (1992) and Cowie andHedges (1984), Saanich Inlet data were derived from Cowie et al. (1992) and Cowie and Hedges (1993).Data of turbidites were extracted from tables in de Lange et al. (1994) and Cowie et al. (1995). Thecharacteristics of the sample stations Dabob Bay and Saanich Inlet are described by Hedges et al. (1988)and in Cowie et al. (1992), respectively.
Chapter V
104
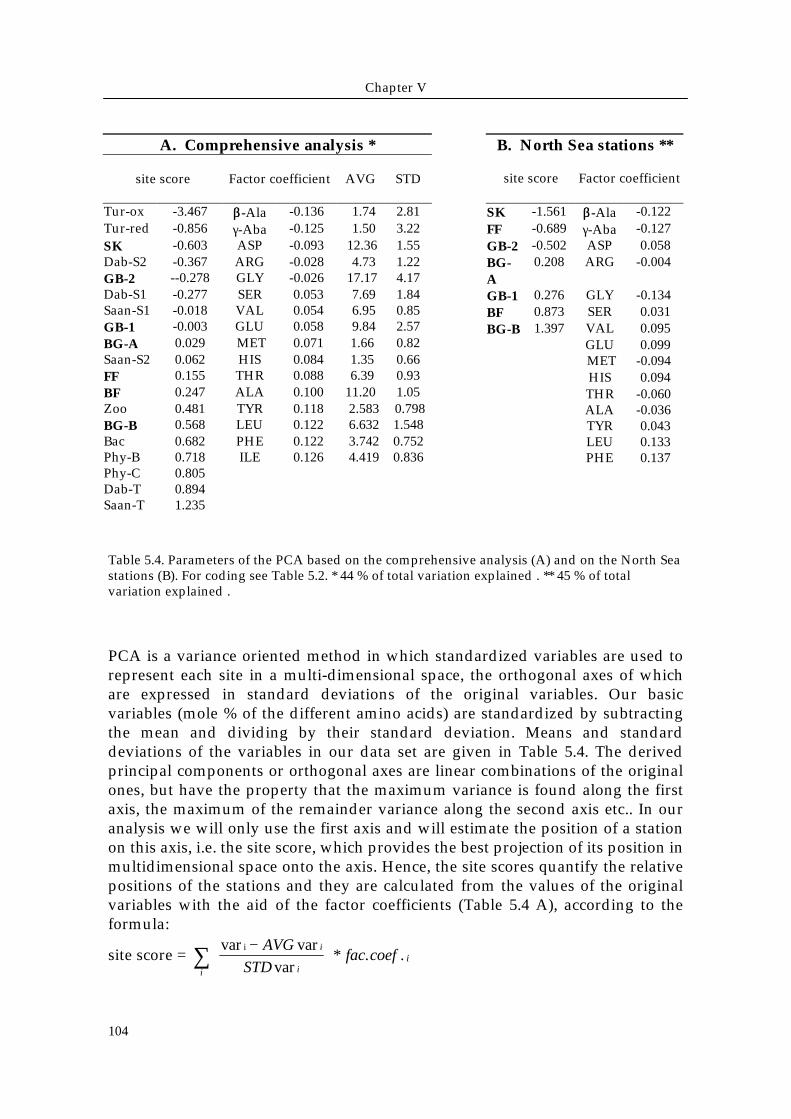
Table 5.4. Parameters of the PCA based on the comprehensive analysis (A) and on the North Seastations (B). For coding see Table 5.2. * 44 % of total variation explained . ** 45 % of totalvariation explained .
PCA is a variance oriented method in which standardized variables are used torepresent each site in a multi-dimensional space, the orthogonal axes of whichare expressed in standard deviations of the original variables. Our basicvariables (mole % of the different amino acids) are standardized by subtractingthe mean and dividing by their standard deviation. Means and standarddeviations of the variables in our data set are given in Table 5.4. The derivedprincipal components or orthogonal axes are linear combinations of the originalones, but have the property that the maximum variance is found along the firstaxis, the maximum of the remainder variance along the second axis etc.. In ouranalysis we will only use the first axis and will estimate the position of a stationon this axis, i.e. the site score, which provides the best projection of its position inmultidimensional space onto the axis. Hence, the site scores quantify the relativepositions of the stations and they are calculated from the values of the originalvariables with the aid of the factor coefficients (Table 5.4 A), according to theformula:
site score = var var
var* . .
i −
∑ AVG
STDfac coef
i
ii
i
A. Comprehensive analysis *
site score Factor coefficient AVG STD
Tur-ox -3.467 ββ-Ala -0.136 1.74 2.81Tur-red -0.856 γ-Aba -0.125 1.50 3.22SK -0.603 ASP -0.093 12.36 1.55Dab-S2 -0.367 ARG -0.028 4.73 1.22GB-2 --0.278 GLY -0.026 17.17 4.17Dab-S1 -0.277 SER 0.053 7.69 1.84Saan-S1 -0.018 VAL 0.054 6.95 0.85GB-1 -0.003 GLU 0.058 9.84 2.57BG-A 0.029 MET 0.071 1.66 0.82Saan-S2 0.062 HIS 0.084 1.35 0.66FF 0.155 THR 0.088 6.39 0.93BF 0.247 ALA 0.100 11.20 1.05Zoo 0.481 TYR 0.118 2.583 0.798BG-B 0.568 LEU 0.122 6.632 1.548Bac 0.682 PHE 0.122 3.742 0.752Phy-B 0.718 ILE 0.126 4.419 0.836Phy-C 0.805Dab-T 0.894Saan-T 1.235
B. North Sea stations **
site score Factor coefficient
SK -1.561 ββ-Ala -0.122FF -0.689 γ-Aba -0.127GB-2 -0.502 ASP 0.058BG-A
0.208 ARG -0.004
GB-1 0.276 GLY -0.134BF 0.873 SER 0.031BG-B 1.397 VAL 0.095
GLU 0.099 MET -0.094HIS 0.094THR -0.060ALA -0.036TYR 0.043LEU 0.133PHE 0.137ILE 0.070
Molecular composition: amino acids and hexosamines
105
where vari is the original (non standardized) mole % of amino acid i, AVG vari
and STD vari are its mean and standard deviation in our data set, and fac.coef. i
the factor coefficient for amino acid i (Table 5.4 A). The part of the formulabetween square brackets performs the standardization. This equation allows forinclusion of data external to the data set used here and other sediments can becompared with our sediments by calculating their scores on the first axisdescribed here.The first component of the comprehensive analysis of North Sea and literaturesites explains 44 % of the variance (Table 5.4 A). The first axis in a PCA based onprotein and non-protein amino acids of only the North Sea stations explains 45 %of the variance (Table 5.4 B). These two PCA analysis basically reveal the samesequence for the North Sea stations, with exception that FF and GB-1 wereswapped in position. This indicates that amino acid composition provides arobust, yet powerful, measure to reveal differences between sedimentary organicmatter having a variable quality and degradation history. In the followingdiscussion the amino-acid-based station scores from the comprehensive analysisof North sea and literature data will be used to order the organic matter (Table5.4 A).The highest scores on the first axis were found in the sandy sediments of thesouthern Bight (BG-B and BF) with station scores of 0.568 and 0.247 respectively,resembling those of the labile source materials phytoplankton, bacteria and trapmaterial (> 0.6). The lowest score in the North Sea (-0.603) was found in the deepSkagerrak, where organic matter finally becomes buried. The refractory organicmatter in the deep sea turbidites has even lower scores, namely -0.856 for theinitial and -3.467 for the oxidized turbidite. Also, the deeper layers of thedeposition area GB-2 score relatively low (- 0.278) compared to the surface layer(- 0.003).The comprehensive PCA analysis reveals that the quality range of organic matterin North Sea sediments is relatively wide, varying between source-like materialand material resembling deep-sea deposits. Scores on the first axis of the PCAcan therefore be interpreted as an index of organic matter degradation. Thisdegradation state index is supported by independent quality parameters such asthe ratio of precursors to non-protein amino acids and hexosamine concentration(see discussion below). The quality of organic matter in North Sea sedimentsappears to be SK<GB-2<GB-1≈BG-A≈FF<BF< BG-B.The degradation state of the organic matter at the intermediate sites is lessconclusive than those of the end-members. Firstly, the intermediate stations (FFand GB-1) swapped position in the PCA based only on the North Sea sites.Secondly, parameters such as ratio of precursors to non-protein amino acids (Fig.5.10) and glucosamine content (Fig. 5.11) indicate that GB-1 contains mainlylabile organic matter, whereas the comprehensive PCA suggest that it resemblesthe deeper sediment (GB-2) at this site.These differences in degradation state are not only the result of in situdegradation, but also of the degradation history before deposition. Degradation

Chapter V
106
in situ occurs at all stations, but is difficult to trace because bioturbation hasresulted in extensive mixing of the sediments with as a result that compositionalchanges with depth are nearly absent except for the German Bight. At thisstation there is clear evidence of in situ degradation (Fig. 5.2 and 5.10).In marine sediments more than 95 % of the organic matter is sorbed to thesediment surface and there is a rather constant relationship between organiccarbon content, sediment surface area and grain size (Mayer 1994, Keil et al.1998). The organic matter on the surface is probably in some kind of dynamicequilibrium with the local environment (Keil et al. 1997).In the North Sea, particles are sorted according to hydrodynamic conditions. Themore sandy material is deposited in the southern North Sea, whereas the siltymaterial is transported by the residual currents to the final depositional area inthe Skagerrak (Fig. 5.1) (e.g. Anton et al. 1993, van Weering et al. 1993, Lohse etal. 1995). During this transport from the southern North Sea to the Skagerrakthese silty particles are involved in a number of deposition-resuspension cyclesand there is extensive time for degradation. This interplay between grain-sizesorting due to hydrodynamic conditions and organic-matter surface area (grain-size) relationships determines the pre-depositional degradation history.Skagerrak sediments are silty and are consequently relatively rich in organicmatter but of low average quality, because it has been degraded extensivelybefore deposition. Sediments in the southern North Sea (BF, BG-B) are sandy,hence relatively poor in organic matter, but the organic matter is rather freshbecause little decomposition has occurred before deposition.This interplay between organic-matter grain-size relationships and pre-depositional history related to grain size may account for the degradation historyof bulk organic matter, but local inputs may modify this picture. The organiccarbon rich surface layer at station GB is clearly related to the recent depositionof labile organic matter. Chlorophyll-a concentrations and benthic biomass dataindicate that there is perhaps more labile organic matter at stations FF, GB, BG-Aand SK than at the sandy stations BG-B and BF (Table 5.1). At each site there is adistribution of organic matter quality classes (Middelburg 1989) and Boudreau &Ruddick (1991) have shown that the overall lability of organic matter isdominated by the preponderance of refractory organic matter. Similarly, ourdegradation index based on amino acid composition provides a measure for thebulk organic matter quality and is not very sensitive to minute amounts of verylabile organic matter that are reflected in chlorophyll-a and benthic biomassdata.
Protein amino acidsThe overall amino acid spectra in North Sea sediments with high abundances ofglycine, followed by aspartic acid, alanine and glutamic acid (Fig. 5.5) resemblethose found in coastal sediments dominated by planktonic inputs: e.g. the Gulfof Maine (Mayer et al. 1988), Oslo Fjord (Haugen & Lichtentaler 1991), SaanichInlet (Cowie et al. 1992) and Potomac estuary (Sigleo & Shultz 1993). However, it
Molecular composition: amino acids and hexosamines
107
is also clear that the neutral leucine and isoleucine, the aromatic phenylalanineand tyrosine and the acidic glutamic acid increase in mole % contribution withincreasing lability of the organic material. The neutral amino acid glycine andthe hydroxylic serine and threonine tend to decrease with increasing lability(Fig. 5.5, 5.12).Some authors divided the amino acids into functional groupings (e.g. Sigleo etal. 1983, Sigleo & Shultz 1993) and found a decrease for acidic amino acids andan increase in basic and neutral amino acids during degradation over large timescales in continental slope sediments (Steinberg et al. 1987) and in anoxic fjordsediments (Brown et al. 1972). In North Sea sediments there is a systematic trendwithin the neutral group, but there is little variation within the acidic (19 to 23mole % acidic amino acids) or the basic groups (5 to 8 mole % basic amino acids).There are two problems regarding biochemical groupings. Firstly, they mayobscure the behavior of individual amino acids with contrasting accumulationpatterns, such as glutamic and aspartic acids, and consequently give aninconsistent picture. Secondly, abundant amino acids, such as glycine, determinethe overall trend of the neutral group, while less abundant amino acids are oflittle influence.Variation of individual amino acid mole percentages depends on theirassociation with cell wall and cytoplasma, their embedding into structuralmatrices, such as silicate tests of diatoms or calcite tests of coccolithophorids(Cowie & Hedges 1996), and sorption to mineral surfaces (Henrichs & Sugai1993) that may physically limit microbial degradation (Mayer 1994), rather thanon individual differences in lability based on functional groups or molecule size.Cowie et al. (1992) calculated relative reactivities of individual amino acids bytheir ratios of average annual fluxes to corresponding accumulation rates in thesurface sediment in the 50 m deep Saanich Inlet. They found intracellular aminoacids (glycine and serine) in diatoms having higher relative reactivities than cell-wall associated amino acids (tyrosine and methionine), suggesting selectivepreservation of cell-wall protein relative to intracellular protein. This concept hasbeen supported by kinetic studies that revealed amino acids associated withthese structural cell wall elements to be less susceptible to enzymaticdegradation than those in cell plasma (Laursen et al. 1996). This has also beenfound for intracellular sugars which are digested by zooplankton with higherefficiencies than diatom cell wall sugars (Cowie & Hedges 1996). Glycine, andthe hydroxyl amino acids serine and threonine are enriched in diatom cell walls(Hecky et al. 1973) and are preferentially accumulated in diatomaceous materialduring sinking and decomposition in the water column (e.g. Siezen & Mague1978, Lee & Cronin 1984, Müller et al. 1986). In North Sea sediments glycineincreases from 14 mole % in the most labile compared to 22 mole % in the mostrefractory organic matter (Fig. 5.5, 5.12). The indicative value of glycine for therefractory nature of organic matter has been pointed out earlier for particulatematerial in the Potomac estuary by Sigleo & Shultz (1993) and for sedimentsunderlying a sewer outlet by Compiano & Romano (1988). Moreover, glycineoften increases with sediment depth (Haugen & Lichtentaler 1991, Cowie et al.
Chapter V
108
1992). Sediment trap data also suggest an accumulation of glycine as degradationprogresses (Lee & Cronin 1984). This relatively conservative behavior of glycinemay not only be related to its presence in the structural matrices of diatoms andbacteria, but possibly also to its comparatively minor food value to micro- andmacroconsumers because of its short chain length and because it can besynthesized from many other amino acids in heterotrophic metabolism.Glutamic acid and the aromatic species tyrosine and phenylalanine are generallyconcentrated in cell plasma (Hecky et al. 1973) and show strong depletion withincreasing state of decomposition over the entire range, as well as in the morerestricted range in the North Sea (Fig. 5.12). The mole % of leucine, isoleucineand phenylalanine correlate well with the degradation index, suggesting thatthese components are good indicators for the lability of organic matter. Glutamicacid and tyrosine exhibit less linear trends in the North Sea system, increasingonly about 25 %, and therefore are less valuable indicators. Strongly decreasingvertical profiles of glutamic acid in sediment cores with increasing depth(Haugen & Lichtentaler 1991) and depletion relative to phytoplankton (e.g.Cowie & Hedges 1992) also indicate that it is easily degraded. Moreover,sediment trap data show that tyrosine, phenylalanine and glutamic acid are themost labile species (Cowie & Hedges 1992, Cowie et al. 1992).The essential amino acids arginine, histidine and methionine do not follow thegeneral trend of increasing mole % concentration with increasing nitrogencontent of amino acids in the bioturbated North Sea sediments (Fig. 5.7).Moreover, these very same amino acids are also the most deficient in sedimentorganic matter relative to marine organism tissue (Fig. 5.8), which means thatthey have to be preferentially taken up in order to fulfil the animal nutritionalneeds and therefore may be limiting to animal growth (Phillips, 1984). Since thedeficiencies generally increase from the more labile organic matter at BF and BG-A to the refractory organic matter at SK (Fig.5.8), we propose that sedimentingesting animals may be more nitrogen limited in sediment containing highlydegraded organic matter. Phillips (1984) also found deficiencies for arginine andmethionine in particulate organic matter, although to a smaller extent (< -15 %)than found in the North Sea sediments, indicating that the deficiency trends maybe inherited from the source and become even stronger in the sediments.However, it is difficult to clearly demonstrate the effects of essential amino aciddeficiencies in marine invertebrates, since also gut microbes could partiallysupply some of the essential amino acids lacking in food (Fong & Mann 1980).Moreover, the amino acid distribution in the bio-available fraction of thesedimentary may vary from the total hydrolyzable fraction measured in thisstudy (Mayer et al. 1995), since animals use an array of enzymes to solubilizeamino acids from food rather than strong acids.
Non-protein amino acidsNon-protein amino acids are generally much less reactive than protein aminoacids (Cowie et al. 1992) and not incorporated into biota, resulting in net
Molecular composition: amino acids and hexosamines
109
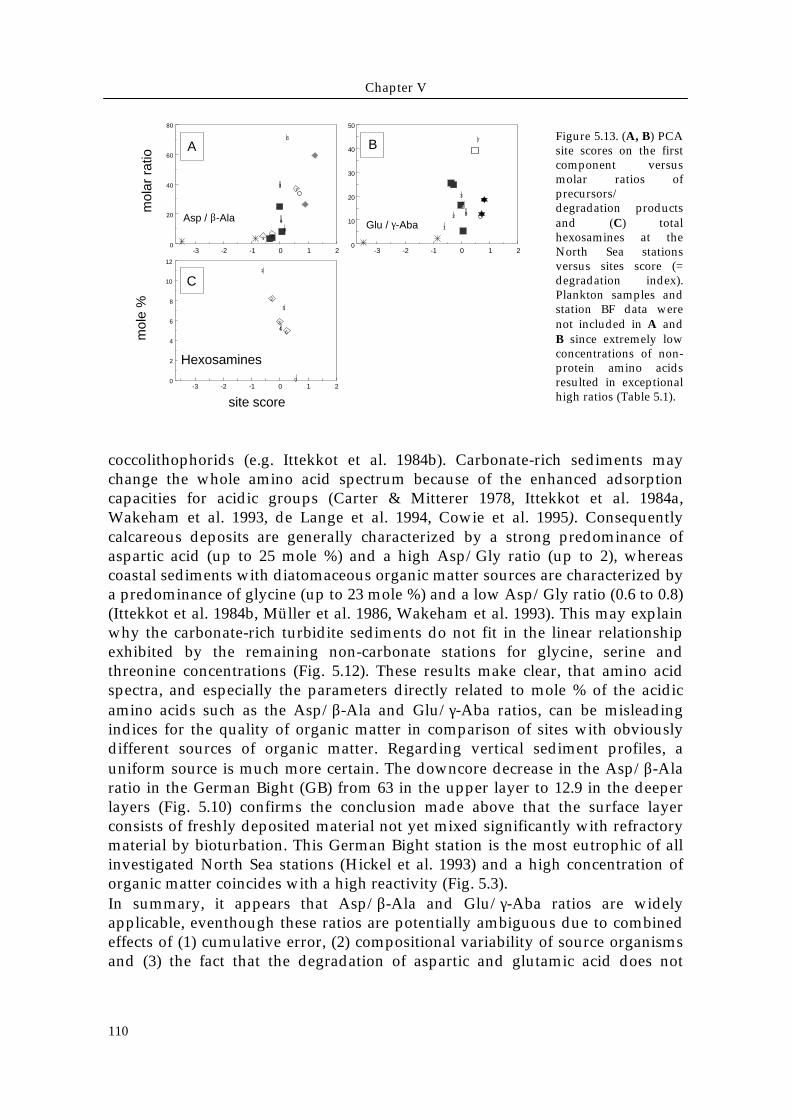
accumulation during mineralization. Increasing mole-percentages of non-proteinamino acids point to bacterial breakdown of particulate organic matter, withvalues > 10 mole % indicating substantially degraded material, typicallyencountered in deep sea sediments (Wakeham et al. 1993, de Lange et al. 1994).In abyssal environments the sum of β-alanine and γ-aminobutyric acid canexceed that of all protein amino acids with values up to 70 % in highly degradedpelagic clays (Whelan 1977).The sum of β-alanine + γ-aminobutyric acid in the North Sea sediments (0.2 to3.5 mole %) fits well into the range generally encountered in coastal sedimentsand source organisms (Cowie & Hedges 1994). Concentrations in the most labileNorth Sea sediments BG-B and BF (Fig. 5.9) are as low as found in the deepesttrap of the Scotia Sea (Müller et al. 1986) with values up to 0.36 mole % β-alanineand 0.19 mole % γ-aminobutyric acid. This is consistent with the high qualityscore derived from the amino acid spectra and also with the high bacterialturnover rates measured at BF (Table 5.1). Non-protein amino acids are mostabundant in the most refractory North Sea sediments (SK). The mole % range ofβ-alanine and γ-aminobutyric acid increases systematically in the stationsequence based on the amino acid spectra (Fig. 5.9).The diagenetic origin of non-protein amino acid has been demonstrated by theirreverse downcore behavior in absolute amounts with respect to the parent aminoacids (e.g. Cowie & Hedges 1994). Consequently, the ratios of the precursors(aspartic acid, glutamic acid) to their decompositional products (β-alanine and γ-aminobutyric acid) have been widely used to verify variations in the intensity oforganic matter decomposition in the water column (Lee & Cronin 1982, Ittekkotet al. 1984a, Haake et al. 1993) and to a smaller extent in sediment profiles(Whelan 1977, Cowie & Hedges 1994). Our results show that Asp/ β-Ala andGlu/ γ-Aba ratios correlate strongly with the degradation state of organic matterbased on protein amino acids (Fig. 5.13 A and B). The most refractory North Seasediment (SK) reaches ratios nearly as low as the turbidites and anoxic DabobBay sediments (~5 for Asp/β-Ala and ~8 for Glu/γ-Aba). On the contrary, themost labile organic matter in BG-B has ratios ~37 for Asp/β-Ala and ~44 forGlu/γ-Aba which are comparable with labile source compounds as bacteria,phytoplankton, zooplankton and suspended matter. The oxidized turbidites donot fit into the nearly linear relation displayed by the other sediments due to a 3to 5 times elevation of their non-protein amino acid mole concentrations (11 to 12mole % β-alanine and 12 to 15 mole % γ-aminobutyric acid) compared to thecoastal sediments and the reduced turbidites. This increase in non-protein aminoacids compared to reducing turbidites has been attributed to in situ oxidationand subsequent association with non-carbonate phases (like aluminosilicates)(Cowie et al. 1995).Another problem with the inclusion of turbidite and deep sea samples into thecomparison with coastal stations is the difference in input source and adsorptiveproperties. In contrast to the siliceous diatom dominated temperate coastal sites,open ocean areas may be dominated by input from calcareous organisms such as
Chapter V
110
Figure 5.13. (A, B) PCAsite scores on the firstcomponent versusmolar ratios ofprecursors/degradation productsand (C) totalhexosamines at theNorth Sea stationsversus sites score (=degradation index).Plankton samples andstation BF data werenot included in A andB since extremely lowconcentrations of non-protein amino acidsresulted in exceptionalhigh ratios (Table 5.1).
coccolithophorids (e.g. Ittekkot et al. 1984b). Carbonate-rich sediments maychange the whole amino acid spectrum because of the enhanced adsorptioncapacities for acidic groups (Carter & Mitterer 1978, Ittekkot et al. 1984a,Wakeham et al. 1993, de Lange et al. 1994, Cowie et al. 1995). Consequentlycalcareous deposits are generally characterized by a strong predominance ofaspartic acid (up to 25 mole %) and a high Asp/Gly ratio (up to 2), whereascoastal sediments with diatomaceous organic matter sources are characterized bya predominance of glycine (up to 23 mole %) and a low Asp/Gly ratio (0.6 to 0.8)(Ittekkot et al. 1984b, Müller et al. 1986, Wakeham et al. 1993). This may explainwhy the carbonate-rich turbidite sediments do not fit in the linear relationshipexhibited by the remaining non-carbonate stations for glycine, serine andthreonine concentrations (Fig. 5.12). These results make clear, that amino acidspectra, and especially the parameters directly related to mole % of the acidicamino acids such as the Asp/β-Ala and Glu/γ-Aba ratios, can be misleadingindices for the quality of organic matter in comparison of sites with obviouslydifferent sources of organic matter. Regarding vertical sediment profiles, auniform source is much more certain. The downcore decrease in the Asp/β-Alaratio in the German Bight (GB) from 63 in the upper layer to 12.9 in the deeperlayers (Fig. 5.10) confirms the conclusion made above that the surface layerconsists of freshly deposited material not yet mixed significantly with refractorymaterial by bioturbation. This German Bight station is the most eutrophic of allinvestigated North Sea stations (Hickel et al. 1993) and a high concentration oforganic matter coincides with a high reactivity (Fig. 5.3).In summary, it appears that Asp/β-Ala and Glu/γ-Aba ratios are widelyapplicable, eventhough these ratios are potentially ambiguous due to combinedeffects of (1) cumulative error, (2) compositional variability of source organismsand (3) the fact that the degradation of aspartic and glutamic acid does not
site score
Hexosamines
mol
e %
-3 -2 -1 0 1 20
2
4
6
8
10
12
C
7
5
643
2
1
Glu / γ-Aba
B
-3 -2 -1 0 1 20
10
20
30
40
50
1
2
4
5
7
3
-3 -2 -1 0 1 20
20
40
60
80
Asp / β-Ala
mol
ar r
atio
A
1
3
4
2
6
7
5
Molecular composition: amino acids and hexosamines
111
always result in the production of β-alanine and γ-aminobutyric acid (Cowie &Hedges 1994).
HexosaminesThe hexosamines glucosamine and galactosamine can be used to trace the originof the organic material as well as its degradation state (eg. Ittekkot et al. 1984b,Liebezeit 1993). Although in marine sediments hexosamines are present in minorquantities compared to amino acids, they contribute considerably to sedimentarynitrogen in the more degraded North Sea sediments (Fig. 5.4) which makes themvaluable as food source for heterotroph organisms as well. Due to their generalincorporation into structural biopolymer matrices, such as bacterial cell wallsand chitinous material (e.g. Ternay 1976), hexosamines are relatively resistant todecomposition and can therefore be used as an independent parameter to verifythe order of the stations proposed by the amino acid spectra. Both hexosaminesare well correlated with the amino acid based degradation index and becomemore concentrated in refractory sediments (Fig. 5.11, 5.13 C). This is consistentwith an increase of hexosamines relative to THAA during decomposition in thewater column (Ittekkot et al. 1984b, Müller et al. 1986, Haake et al. 1992).Hexosamine concentrations in the more labile North Sea sediments (<1 mole %)are consistent with sedimenting (Haake et al. 1993) and suspended matter(Müller et al. 1986) and recent sediments (Mayer et al. 1985). Moreover, the highTHAA / hexosamine ratios (Table 5.1) resemble those measured in sedimenttrap samples in the deep Arabian Sea of 8 to 22 (Haake et al. 1992). Extremelyhigh values up to > 80 have been reported for phytoplankton since hexosaminesare present only in trace amounts. The ratio we found for most refractory organiccarbon in SK sediments in this study is higher than the lowest value reported forthe deepest trap (3800 m) in the Arabian Sea (about 3 to 5), but is still reflectingthat SK sediments contain the most degraded organic matter in the North Sea.
Major biochemical groupsThe order based on the protein amino acid spectra is consistent with the resultsof more established independent parameters, such as ratio of precursors to non-protein amino acids and hexosamine concentrations (Fig. 5.13), and also thegeneral expectations based on the physical setting of the investigated stations.Amino acid composition therefore gives a good indication of organic matterdegradation state. The contributions of total carbohydrate and total hydrolyzableamino acids to TOC have been used as a measure of organic matter quality(Ittekkot 1988, Cowie & Hedges 1994). The relative contribution of THAA toTOC confirms the array of the sites based on the PCA (Fig. 5.14 A), with the lessdegraded material having the highest THAA/TOC ratio. However, thecontribution of carbohydrate to TOC reveals a rather scattered picture (Fig. 5.14B), indicating either a non-selective behavior during decomposition becausemembers of this group are part of structural elements, humic substances and cell
Chapter V
112
B
% (
Car
bohy
drat
e-C
)-T
OC
-3 -2 -1 0 1 20
5
10
15
20
25
30
12
3
4
5
67
site score
A
-3 -2 -1 0 1 20
10
20
30
40
50
60
70
% (
TH
AA
-C)-
TO
C
1 2
3
4
5
6
7
1
site score
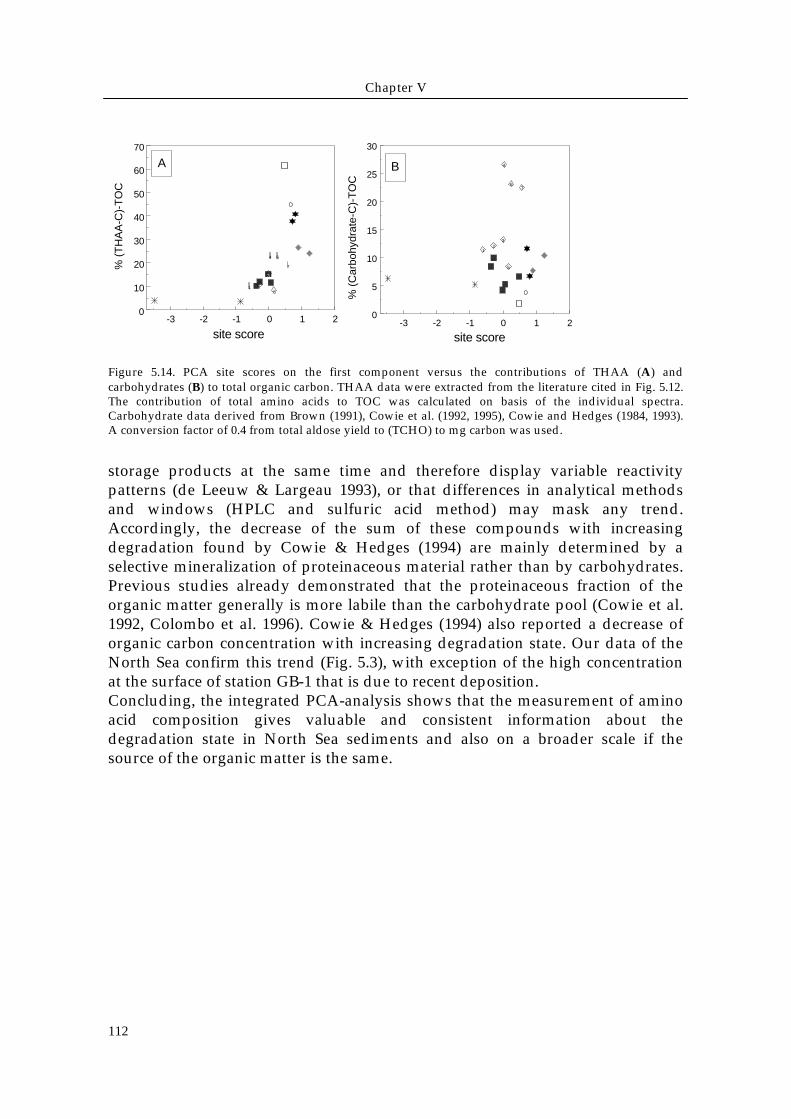
Figure 5.14. PCA site scores on the first component versus the contributions of THAA (A) andcarbohydrates (B) to total organic carbon. THAA data were extracted from the literature cited in Fig. 5.12.The contribution of total amino acids to TOC was calculated on basis of the individual spectra.Carbohydrate data derived from Brown (1991), Cowie et al. (1992, 1995), Cowie and Hedges (1984, 1993).A conversion factor of 0.4 from total aldose yield to (TCHO) to mg carbon was used.
storage products at the same time and therefore display variable reactivitypatterns (de Leeuw & Largeau 1993), or that differences in analytical methodsand windows (HPLC and sulfuric acid method) may mask any trend.Accordingly, the decrease of the sum of these compounds with increasingdegradation found by Cowie & Hedges (1994) are mainly determined by aselective mineralization of proteinaceous material rather than by carbohydrates.Previous studies already demonstrated that the proteinaceous fraction of theorganic matter generally is more labile than the carbohydrate pool (Cowie et al.1992, Colombo et al. 1996). Cowie & Hedges (1994) also reported a decrease oforganic carbon concentration with increasing degradation state. Our data of theNorth Sea confirm this trend (Fig. 5.3), with exception of the high concentrationat the surface of station GB-1 that is due to recent deposition.Concluding, the integrated PCA-analysis shows that the measurement of aminoacid composition gives valuable and consistent information about thedegradation state in North Sea sediments and also on a broader scale if thesource of the organic matter is the same.
Copyright © 2022 FDOKUMEN