Archaeal uptake of enantiomeric amino acids in the meso- and bathypelagic waters of the North...
10
60 Limnol. Oceanogr., 51(1), 2006, 60–69 q 2006, by the American Society of Limnology and Oceanography, Inc. Archaeal uptake of enantiomeric amino acids in the meso- and bathypelagic waters of the North Atlantic Eva Teira 1 Department of Biological Oceanography, Royal Netherlands Institute for Sea Research (NIOZ), P.O. Box 59, 1790AB Den Burg, Texel, The Netherlands Hendrik van Aken and Cornelis Veth Department of Physical Oceanography, Royal Netherlands Institute for Sea Research (NIOZ), P.O. Box 59, 1790AB Den Burg, Texel, The Netherlands Gerhard J. Herndl Department of Biological Oceanography, Royal Netherlands Institute for Sea Research (NIOZ), P.O. Box 59, 1790AB Den Burg, Texel, The Netherlands Abstract We determined the contribution of the three major prokaryotic groups (Bacteria, Crenarchaeota, and Euryar- chaeota) on the uptake of D- and L-aspartic acid (Asp) in the major water masses of the North Atlantic (from 100- to 4,000-m depth) with the use of microautoradiography combined with catalyzed reporter deposition fluorescence in situ hybridization (MICRO-CARD-FISH). The percentage of prokaryotic cells that assimilated D- and L-Asp ranged from ,5% to 25%. In the meso- and bathypelagic waters of the North Atlantic, Archaea are more abundant (42% 6 2% of 49,69-diamino-2-phenylindole [DAPI]–stained cells) than Bacteria (30% 6 1% of DAPI-stained cells), and more archaeal than bacterial cells are actively incorporating D-Asp (62% 6 2% vs. 38% 6 2% of total D-Asp active cells). In contrast, Bacteria and Archaea almost equally contribute to L-Asp use in the deep waters of the North Atlantic (47% 6 2% vs. 53% 6 2% of total L-Asp active cells). The increase in the D-Asp : L-Asp uptake ratio in the prokaryotic community with depth appears to be driven by the efficient uptake of D-Asp by, especially, the Crenarchaeota in the deep waters. Because Archaea, and particularly Crenarchaeota, commonly dominate the prokaryotic communities in the ocean’s interior, we suggest that they represent a previously unrecognized sink of D–amino acids in the deep ocean. The formation of the North Atlantic Deep Water (NADW) is the major driving force of the oceanic conveyor belt sys- tem that, in turn, influences the global climate (Broecker 1997). The turnover time of this oceanic conveyor belt sys- tem is about 2,000 yr, whereas that of the dissolved organic carbon (DOC) in the oceanic deep water is about 6,000– 8,000 yr (Williams 2000). Hansell and Carlson (1998) showed that the deep water DOC concentrations decline from the deep North Atlantic (;45 mmol L 21 ) to the oppo- site end of the conveyor belt circulation, the deep Pacific (;37 mmol L 21 ), indicating net removal of DOC. Despite recent advances in the phylogenetic characteriza- tion of deep-water prokaryotic communities, little is known about the metabolically active fraction of the prokaryotic community that drives the biogeochemical cycles in the 1 To whom correspondence should be addressed. Present address: Departamento de Ecologı ´a y Biologı ´a Animal, Universidad de Vigo, 36200, Vigo, Spain ([email protected]). Acknowledgments We thank the captain and crew of the R/V Pelagia for their help during work at sea. This research was supported by a European Community Marie Curie Fellowship (HPMF-CT-2002-01738) to E.T., by a grant of the Earth and Life Science division of the Dutch Science Foundation (NWO-ALW; project 811.33.004) to G.J.H., and by the 5th Framework Program of the Commission of the Eu- ropean Union (BASICS project). ocean’s interior. Only recently, our knowledge on the rich- ness of marine prokaryotic communities increased consid- erably by applying molecular tools such as fingerprinting techniques, cloning, and sequencing (see review by Giov- annoni and Rappe ´ 2000). These molecular techniques re- vealed that Archaea are widespread among marine prokary- otic plankton (DeLong et al. 1994; Massana et al. 1998; Crump and Baross 2000). Quantitative studies with fluores- cence in situ hybridization (FISH) have shown the domi- nance of Group I Archaea (members of the Crenarchaeota) in meso- and bathypelagic waters, whereas Group II Archaea (members of the Euryarchaeota) comprise ,5–8% of total picoplankton cells in deep waters of the Pacific and in the Antarctic waters (Karner et al. 2001; Church et al. 2003). Use of the recently developed catalyzed reported deposition FISH (CARD-FISH), in combination with the proteinase-K permeabilization of the archaeal cell wall, allowed higher detection rates of Euryarchaeota in deep waters of the North Atlantic Ocean (Teira et al. 2004). In contrast to advances in the phylogenetic characteriza- tion of deep-water prokaryotic communities, information on their activity is rather scarce (Dufour and Torre ´ton 1996; Nagata et al. 2000; Tanaka and Rassoulzadegan 2004). Most of these studies focused on the regulation and timescale of bacterial dynamics and on the relation between bacterio- plankton abundance or production and particulate organic carbon flux (Nagata et al. 2000; Hansell and Ducklow 2003).
-
Upload
independent -
Category
Documents
-
view
1 -
download
0
Transcript of Archaeal uptake of enantiomeric amino acids in the meso- and bathypelagic waters of the North...
60
Limnol. Oceanogr., 51(1), 2006, 60–69q 2006, by the American Society of Limnology and Oceanography, Inc.
Archaeal uptake of enantiomeric amino acids in the meso- and bathypelagic watersof the North Atlantic
Eva Teira1
Department of Biological Oceanography, Royal Netherlands Institute for Sea Research (NIOZ), P.O. Box 59,1790AB Den Burg, Texel, The Netherlands
Hendrik van Aken and Cornelis VethDepartment of Physical Oceanography, Royal Netherlands Institute for Sea Research (NIOZ), P.O. Box 59,1790AB Den Burg, Texel, The Netherlands
Gerhard J. HerndlDepartment of Biological Oceanography, Royal Netherlands Institute for Sea Research (NIOZ), P.O. Box 59,1790AB Den Burg, Texel, The Netherlands
Abstract
We determined the contribution of the three major prokaryotic groups (Bacteria, Crenarchaeota, and Euryar-chaeota) on the uptake of D- and L-aspartic acid (Asp) in the major water masses of the North Atlantic (from 100-to 4,000-m depth) with the use of microautoradiography combined with catalyzed reporter deposition fluorescencein situ hybridization (MICRO-CARD-FISH). The percentage of prokaryotic cells that assimilated D- and L-Aspranged from ,5% to 25%. In the meso- and bathypelagic waters of the North Atlantic, Archaea are more abundant(42% 6 2% of 49,69-diamino-2-phenylindole [DAPI]–stained cells) than Bacteria (30% 6 1% of DAPI-stainedcells), and more archaeal than bacterial cells are actively incorporating D-Asp (62% 6 2% vs. 38% 6 2% of totalD-Asp active cells). In contrast, Bacteria and Archaea almost equally contribute to L-Asp use in the deep waters ofthe North Atlantic (47% 6 2% vs. 53% 6 2% of total L-Asp active cells). The increase in the D-Asp : L-Asp uptakeratio in the prokaryotic community with depth appears to be driven by the efficient uptake of D-Asp by, especially,the Crenarchaeota in the deep waters. Because Archaea, and particularly Crenarchaeota, commonly dominate theprokaryotic communities in the ocean’s interior, we suggest that they represent a previously unrecognized sink ofD–amino acids in the deep ocean.
The formation of the North Atlantic Deep Water (NADW)is the major driving force of the oceanic conveyor belt sys-tem that, in turn, influences the global climate (Broecker1997). The turnover time of this oceanic conveyor belt sys-tem is about 2,000 yr, whereas that of the dissolved organiccarbon (DOC) in the oceanic deep water is about 6,000–8,000 yr (Williams 2000). Hansell and Carlson (1998)showed that the deep water DOC concentrations declinefrom the deep North Atlantic (;45 mmol L21) to the oppo-site end of the conveyor belt circulation, the deep Pacific(;37 mmol L21), indicating net removal of DOC.
Despite recent advances in the phylogenetic characteriza-tion of deep-water prokaryotic communities, little is knownabout the metabolically active fraction of the prokaryoticcommunity that drives the biogeochemical cycles in the
1 To whom correspondence should be addressed. Present address:Departamento de Ecologıa y Biologıa Animal, Universidad de Vigo,36200, Vigo, Spain ([email protected]).
AcknowledgmentsWe thank the captain and crew of the R/V Pelagia for their help
during work at sea. This research was supported by a EuropeanCommunity Marie Curie Fellowship (HPMF-CT-2002-01738) toE.T., by a grant of the Earth and Life Science division of the DutchScience Foundation (NWO-ALW; project 811.33.004) to G.J.H.,and by the 5th Framework Program of the Commission of the Eu-ropean Union (BASICS project).
ocean’s interior. Only recently, our knowledge on the rich-ness of marine prokaryotic communities increased consid-erably by applying molecular tools such as fingerprintingtechniques, cloning, and sequencing (see review by Giov-annoni and Rappe 2000). These molecular techniques re-vealed that Archaea are widespread among marine prokary-otic plankton (DeLong et al. 1994; Massana et al. 1998;Crump and Baross 2000). Quantitative studies with fluores-cence in situ hybridization (FISH) have shown the domi-nance of Group I Archaea (members of the Crenarchaeota)in meso- and bathypelagic waters, whereas Group II Archaea(members of the Euryarchaeota) comprise ,5–8% of totalpicoplankton cells in deep waters of the Pacific and in theAntarctic waters (Karner et al. 2001; Church et al. 2003).Use of the recently developed catalyzed reported depositionFISH (CARD-FISH), in combination with the proteinase-Kpermeabilization of the archaeal cell wall, allowed higherdetection rates of Euryarchaeota in deep waters of the NorthAtlantic Ocean (Teira et al. 2004).
In contrast to advances in the phylogenetic characteriza-tion of deep-water prokaryotic communities, information ontheir activity is rather scarce (Dufour and Torreton 1996;Nagata et al. 2000; Tanaka and Rassoulzadegan 2004). Mostof these studies focused on the regulation and timescale ofbacterial dynamics and on the relation between bacterio-plankton abundance or production and particulate organiccarbon flux (Nagata et al. 2000; Hansell and Ducklow 2003).
61Amino acid utilization in the Atlantic
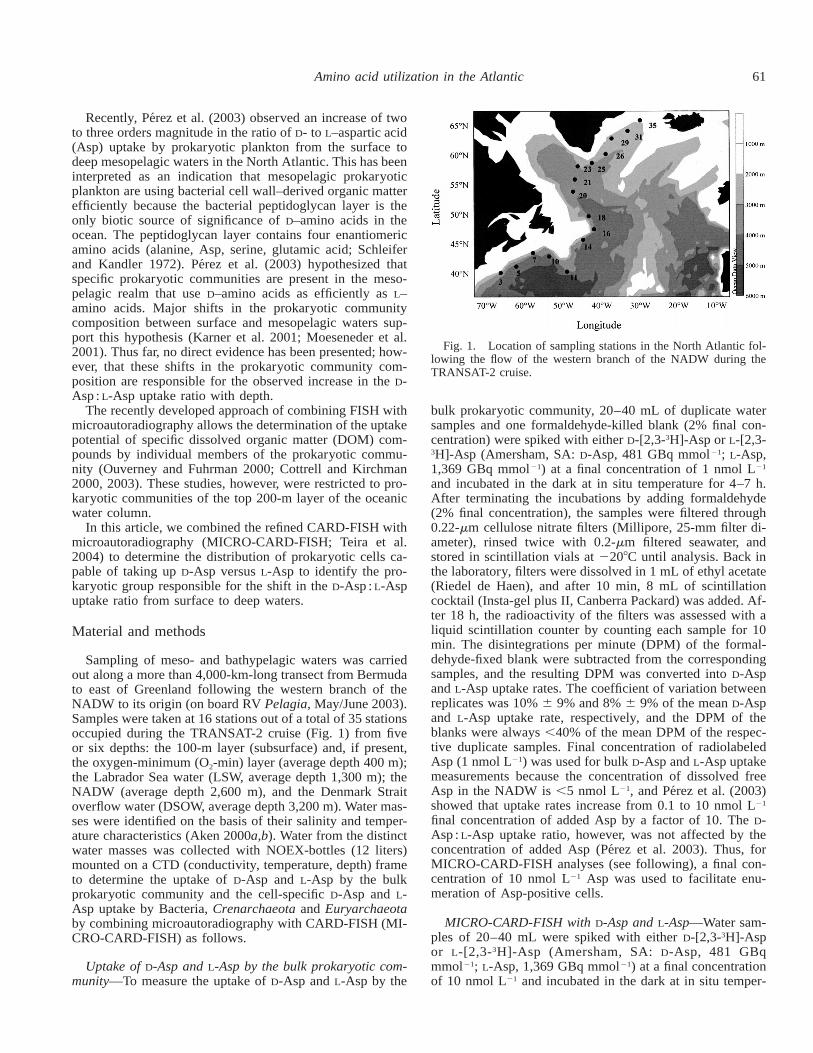
Fig. 1. Location of sampling stations in the North Atlantic fol-lowing the flow of the western branch of the NADW during theTRANSAT-2 cruise.
Recently, Perez et al. (2003) observed an increase of twoto three orders magnitude in the ratio of D- to L–aspartic acid(Asp) uptake by prokaryotic plankton from the surface todeep mesopelagic waters in the North Atlantic. This has beeninterpreted as an indication that mesopelagic prokaryoticplankton are using bacterial cell wall–derived organic matterefficiently because the bacterial peptidoglycan layer is theonly biotic source of significance of D–amino acids in theocean. The peptidoglycan layer contains four enantiomericamino acids (alanine, Asp, serine, glutamic acid; Schleiferand Kandler 1972). Perez et al. (2003) hypothesized thatspecific prokaryotic communities are present in the meso-pelagic realm that use D–amino acids as efficiently as L–amino acids. Major shifts in the prokaryotic communitycomposition between surface and mesopelagic waters sup-port this hypothesis (Karner et al. 2001; Moeseneder et al.2001). Thus far, no direct evidence has been presented; how-ever, that these shifts in the prokaryotic community com-position are responsible for the observed increase in the D-Asp : L-Asp uptake ratio with depth.
The recently developed approach of combining FISH withmicroautoradiography allows the determination of the uptakepotential of specific dissolved organic matter (DOM) com-pounds by individual members of the prokaryotic commu-nity (Ouverney and Fuhrman 2000; Cottrell and Kirchman2000, 2003). These studies, however, were restricted to pro-karyotic communities of the top 200-m layer of the oceanicwater column.
In this article, we combined the refined CARD-FISH withmicroautoradiography (MICRO-CARD-FISH; Teira et al.2004) to determine the distribution of prokaryotic cells ca-pable of taking up D-Asp versus L-Asp to identify the pro-karyotic group responsible for the shift in the D-Asp : L-Aspuptake ratio from surface to deep waters.
Material and methods
Sampling of meso- and bathypelagic waters was carriedout along a more than 4,000-km-long transect from Bermudato east of Greenland following the western branch of theNADW to its origin (on board RV Pelagia, May/June 2003).Samples were taken at 16 stations out of a total of 35 stationsoccupied during the TRANSAT-2 cruise (Fig. 1) from fiveor six depths: the 100-m layer (subsurface) and, if present,the oxygen-minimum (O2-min) layer (average depth 400 m);the Labrador Sea water (LSW, average depth 1,300 m); theNADW (average depth 2,600 m), and the Denmark Straitoverflow water (DSOW, average depth 3,200 m). Water mas-ses were identified on the basis of their salinity and temper-ature characteristics (Aken 2000a,b). Water from the distinctwater masses was collected with NOEX-bottles (12 liters)mounted on a CTD (conductivity, temperature, depth) frameto determine the uptake of D-Asp and L-Asp by the bulkprokaryotic community and the cell-specific D-Asp and L-Asp uptake by Bacteria, Crenarchaeota and Euryarchaeotaby combining microautoradiography with CARD-FISH (MI-CRO-CARD-FISH) as follows.
Uptake of D-Asp and L-Asp by the bulk prokaryotic com-munity—To measure the uptake of D-Asp and L-Asp by the
bulk prokaryotic community, 20–40 mL of duplicate watersamples and one formaldehyde-killed blank (2% final con-centration) were spiked with either D-[2,3-3H]-Asp or L-[2,3-3H]-Asp (Amersham, SA: D-Asp, 481 GBq mmol21; L-Asp,1,369 GBq mmol21) at a final concentration of 1 nmol L21
and incubated in the dark at in situ temperature for 4–7 h.After terminating the incubations by adding formaldehyde(2% final concentration), the samples were filtered through0.22-mm cellulose nitrate filters (Millipore, 25-mm filter di-ameter), rinsed twice with 0.2-mm filtered seawater, andstored in scintillation vials at 2208C until analysis. Back inthe laboratory, filters were dissolved in 1 mL of ethyl acetate(Riedel de Haen), and after 10 min, 8 mL of scintillationcocktail (Insta-gel plus II, Canberra Packard) was added. Af-ter 18 h, the radioactivity of the filters was assessed with aliquid scintillation counter by counting each sample for 10min. The disintegrations per minute (DPM) of the formal-dehyde-fixed blank were subtracted from the correspondingsamples, and the resulting DPM was converted into D-Aspand L-Asp uptake rates. The coefficient of variation betweenreplicates was 10% 6 9% and 8% 6 9% of the mean D-Aspand L-Asp uptake rate, respectively, and the DPM of theblanks were always ,40% of the mean DPM of the respec-tive duplicate samples. Final concentration of radiolabeledAsp (1 nmol L21) was used for bulk D-Asp and L-Asp uptakemeasurements because the concentration of dissolved freeAsp in the NADW is ,5 nmol L21, and Perez et al. (2003)showed that uptake rates increase from 0.1 to 10 nmol L21
final concentration of added Asp by a factor of 10. The D-Asp : L-Asp uptake ratio, however, was not affected by theconcentration of added Asp (Perez et al. 2003). Thus, forMICRO-CARD-FISH analyses (see following), a final con-centration of 10 nmol L21 Asp was used to facilitate enu-meration of Asp-positive cells.
MICRO-CARD-FISH with D-Asp and L-Asp—Water sam-ples of 20–40 mL were spiked with either D-[2,3-3H]-Aspor L-[2,3-3H]-Asp (Amersham, SA: D-Asp, 481 GBqmmol21; L-Asp, 1,369 GBq mmol21) at a final concentrationof 10 nmol L21 and incubated in the dark at in situ temper-
62 Teira et al.
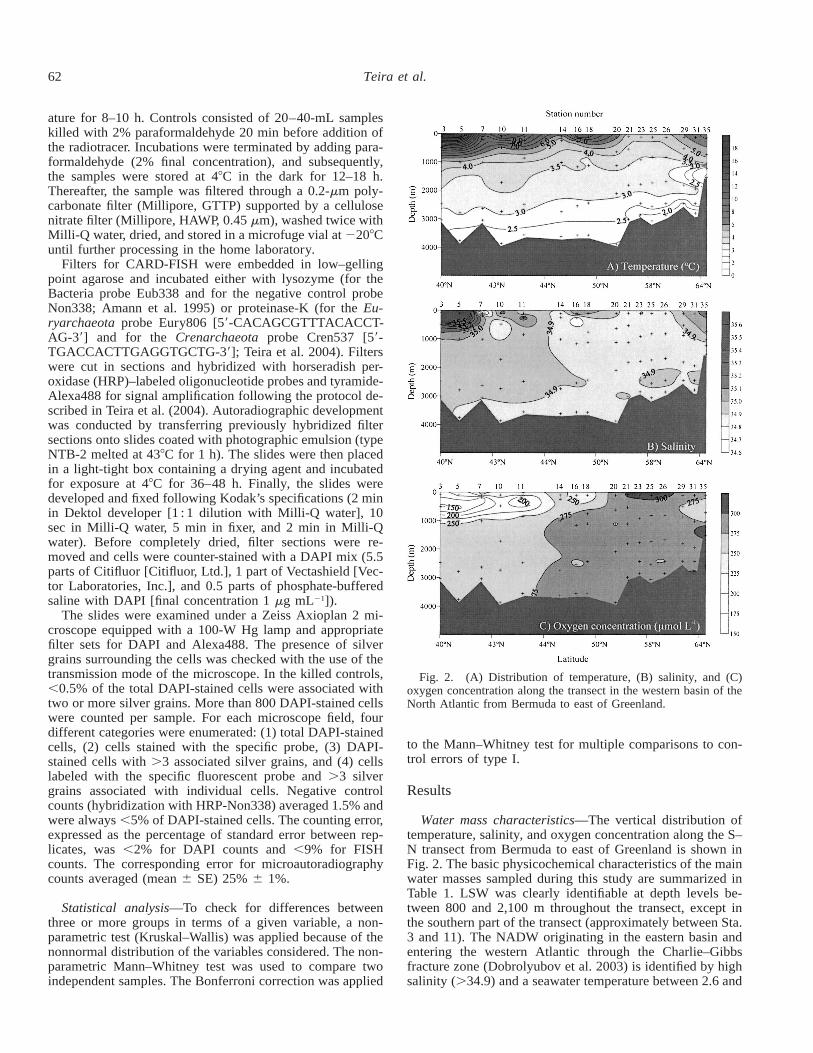
Fig. 2. (A) Distribution of temperature, (B) salinity, and (C)oxygen concentration along the transect in the western basin of theNorth Atlantic from Bermuda to east of Greenland.
ature for 8–10 h. Controls consisted of 20–40-mL sampleskilled with 2% paraformaldehyde 20 min before addition ofthe radiotracer. Incubations were terminated by adding para-formaldehyde (2% final concentration), and subsequently,the samples were stored at 48C in the dark for 12–18 h.Thereafter, the sample was filtered through a 0.2-mm poly-carbonate filter (Millipore, GTTP) supported by a cellulosenitrate filter (Millipore, HAWP, 0.45 mm), washed twice withMilli-Q water, dried, and stored in a microfuge vial at 2208Cuntil further processing in the home laboratory.
Filters for CARD-FISH were embedded in low–gellingpoint agarose and incubated either with lysozyme (for theBacteria probe Eub338 and for the negative control probeNon338; Amann et al. 1995) or proteinase-K (for the Eu-ryarchaeota probe Eury806 [59-CACAGCGTTTACACCT-AG-39] and for the Crenarchaeota probe Cren537 [59-TGACCACTTGAGGTGCTG-39]; Teira et al. 2004). Filterswere cut in sections and hybridized with horseradish per-oxidase (HRP)–labeled oligonucleotide probes and tyramide-Alexa488 for signal amplification following the protocol de-scribed in Teira et al. (2004). Autoradiographic developmentwas conducted by transferring previously hybridized filtersections onto slides coated with photographic emulsion (typeNTB-2 melted at 438C for 1 h). The slides were then placedin a light-tight box containing a drying agent and incubatedfor exposure at 48C for 36–48 h. Finally, the slides weredeveloped and fixed following Kodak’s specifications (2 minin Dektol developer [1 : 1 dilution with Milli-Q water], 10sec in Milli-Q water, 5 min in fixer, and 2 min in Milli-Qwater). Before completely dried, filter sections were re-moved and cells were counter-stained with a DAPI mix (5.5parts of Citifluor [Citifluor, Ltd.], 1 part of Vectashield [Vec-tor Laboratories, Inc.], and 0.5 parts of phosphate-bufferedsaline with DAPI [final concentration 1 mg mL21]).
The slides were examined under a Zeiss Axioplan 2 mi-croscope equipped with a 100-W Hg lamp and appropriatefilter sets for DAPI and Alexa488. The presence of silvergrains surrounding the cells was checked with the use of thetransmission mode of the microscope. In the killed controls,,0.5% of the total DAPI-stained cells were associated withtwo or more silver grains. More than 800 DAPI-stained cellswere counted per sample. For each microscope field, fourdifferent categories were enumerated: (1) total DAPI-stainedcells, (2) cells stained with the specific probe, (3) DAPI-stained cells with .3 associated silver grains, and (4) cellslabeled with the specific fluorescent probe and .3 silvergrains associated with individual cells. Negative controlcounts (hybridization with HRP-Non338) averaged 1.5% andwere always ,5% of DAPI-stained cells. The counting error,expressed as the percentage of standard error between rep-licates, was ,2% for DAPI counts and ,9% for FISHcounts. The corresponding error for microautoradiographycounts averaged (mean 6 SE) 25% 6 1%.
Statistical analysis—To check for differences betweenthree or more groups in terms of a given variable, a non-parametric test (Kruskal–Wallis) was applied because of thenonnormal distribution of the variables considered. The non-parametric Mann–Whitney test was used to compare twoindependent samples. The Bonferroni correction was applied
to the Mann–Whitney test for multiple comparisons to con-trol errors of type I.
Results
Water mass characteristics—The vertical distribution oftemperature, salinity, and oxygen concentration along the S–N transect from Bermuda to east of Greenland is shown inFig. 2. The basic physicochemical characteristics of the mainwater masses sampled during this study are summarized inTable 1. LSW was clearly identifiable at depth levels be-tween 800 and 2,100 m throughout the transect, except inthe southern part of the transect (approximately between Sta.3 and 11). The NADW originating in the eastern basin andentering the western Atlantic through the Charlie–Gibbsfracture zone (Dobrolyubov et al. 2003) is identified by highsalinity (.34.9) and a seawater temperature between 2.6 and
63Amino acid utilization in the Atlantic
Table 1. Basic physical and chemical characterisitics of the main water masses sampled in the North Atlantic. Ranges are given for eachwater mass where samples were collected. LSW, Labrador sea water; NADW, North Atlantic Deep Water; DSOW, Denmark Strait overflowwater.
Water mass Depth (m) Temperature (8C) Salinity Oxygen (mmol kg21)
SubsurfaceO2 minimumLSWNADWDSOW
88–103200–626809–2,060
2,435–2,7901,216*–3,869
4.1–18.84.3–10.13.1–3.72.6–3.20.8–2.4
34.6–36.634.8–35.3
34.87–34.9034.90–34.9534.81–34.90
206–305144–257274–291265–282271–309
* At Sta. 35.
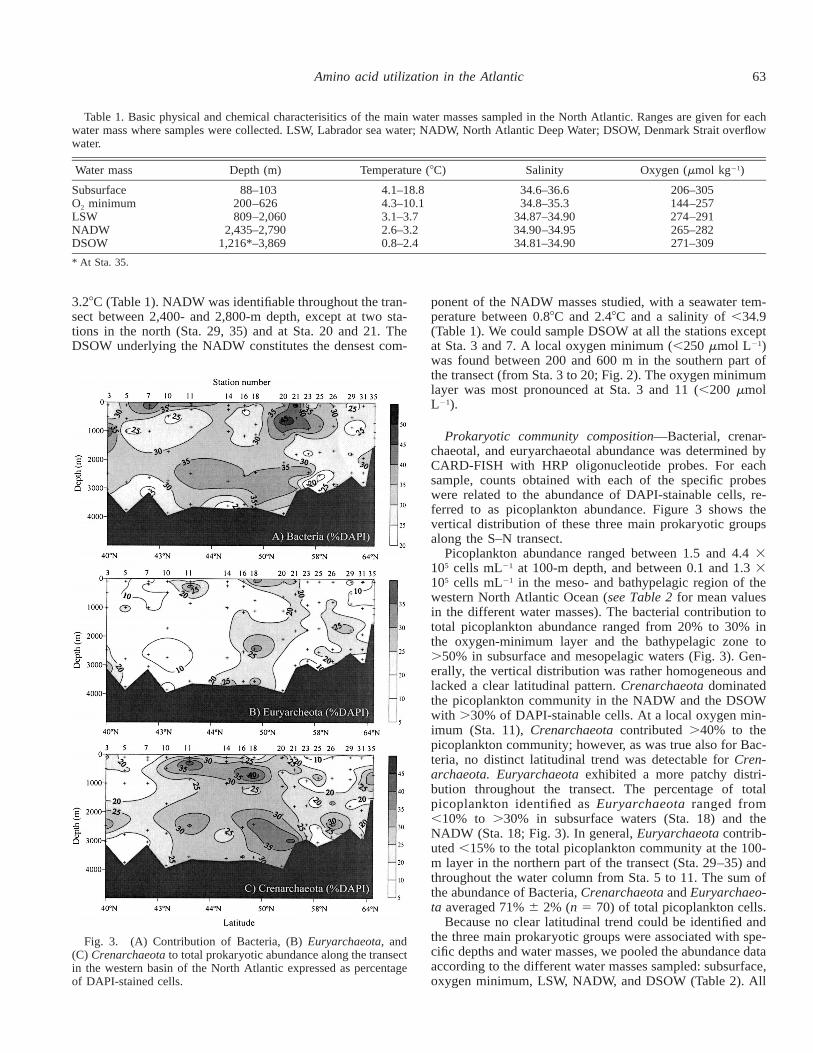
Fig. 3. (A) Contribution of Bacteria, (B) Euryarchaeota, and(C) Crenarchaeota to total prokaryotic abundance along the transectin the western basin of the North Atlantic expressed as percentageof DAPI-stained cells.
3.28C (Table 1). NADW was identifiable throughout the tran-sect between 2,400- and 2,800-m depth, except at two sta-tions in the north (Sta. 29, 35) and at Sta. 20 and 21. TheDSOW underlying the NADW constitutes the densest com-
ponent of the NADW masses studied, with a seawater tem-perature between 0.88C and 2.48C and a salinity of ,34.9(Table 1). We could sample DSOW at all the stations exceptat Sta. 3 and 7. A local oxygen minimum (,250 mmol L21)was found between 200 and 600 m in the southern part ofthe transect (from Sta. 3 to 20; Fig. 2). The oxygen minimumlayer was most pronounced at Sta. 3 and 11 (,200 mmolL21).
Prokaryotic community composition—Bacterial, crenar-chaeotal, and euryarchaeotal abundance was determined byCARD-FISH with HRP oligonucleotide probes. For eachsample, counts obtained with each of the specific probeswere related to the abundance of DAPI-stainable cells, re-ferred to as picoplankton abundance. Figure 3 shows thevertical distribution of these three main prokaryotic groupsalong the S–N transect.
Picoplankton abundance ranged between 1.5 and 4.4 3105 cells mL21 at 100-m depth, and between 0.1 and 1.3 3105 cells mL21 in the meso- and bathypelagic region of thewestern North Atlantic Ocean (see Table 2 for mean valuesin the different water masses). The bacterial contribution tototal picoplankton abundance ranged from 20% to 30% inthe oxygen-minimum layer and the bathypelagic zone to.50% in subsurface and mesopelagic waters (Fig. 3). Gen-erally, the vertical distribution was rather homogeneous andlacked a clear latitudinal pattern. Crenarchaeota dominatedthe picoplankton community in the NADW and the DSOWwith .30% of DAPI-stainable cells. At a local oxygen min-imum (Sta. 11), Crenarchaeota contributed .40% to thepicoplankton community; however, as was true also for Bac-teria, no distinct latitudinal trend was detectable for Cren-archaeota. Euryarchaeota exhibited a more patchy distri-bution throughout the transect. The percentage of totalpicoplankton identified as Euryarchaeota ranged from,10% to .30% in subsurface waters (Sta. 18) and theNADW (Sta. 18; Fig. 3). In general, Euryarchaeota contrib-uted ,15% to the total picoplankton community at the 100-m layer in the northern part of the transect (Sta. 29–35) andthroughout the water column from Sta. 5 to 11. The sum ofthe abundance of Bacteria, Crenarchaeota and Euryarchaeo-ta averaged 71% 6 2% (n 5 70) of total picoplankton cells.
Because no clear latitudinal trend could be identified andthe three main prokaryotic groups were associated with spe-cific depths and water masses, we pooled the abundance dataaccording to the different water masses sampled: subsurface,oxygen minimum, LSW, NADW, and DSOW (Table 2). All
64 Teira et al.
Table 2. Prokaryotic abundance (as obtained by DAPI counts) and the relative contribution of Bacteria, Crenarchaeota, and Euryarchaeotato the total prokaryotic community in the different water masses. Mean 6 SE is given. For water mass abbreviations, see Table 1.
Water massAbundance
(105 cells mL21) Bacteria (% DAPI)Crenarchaeota
(% DAPI)Euryarchaeota
(% DAPI)
Subsurface (n516)O2 minimum (n57)LSW (n520)NADW (n511)DSOW (n511)
2.560.20.8560.120.3760.050.2260.010.2560.04
32623363306232622762
17622663226227622462
17621662176218621762
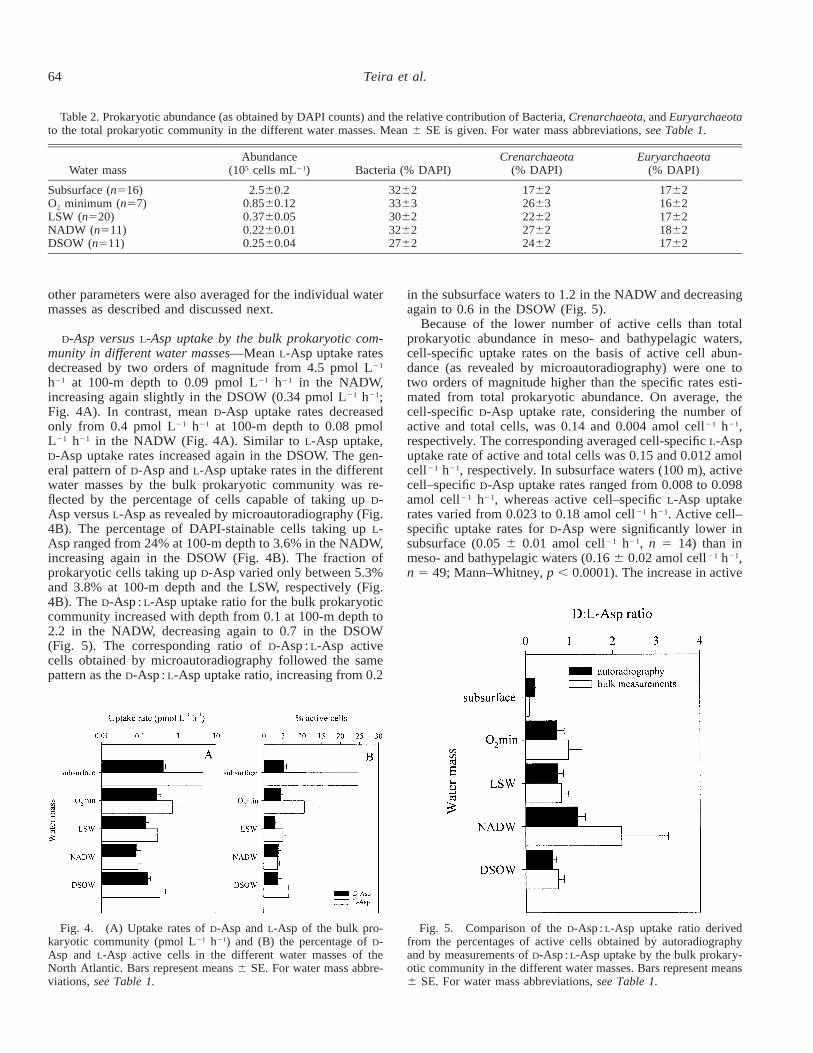
Fig. 4. (A) Uptake rates of D-Asp and L-Asp of the bulk pro-karyotic community (pmol L21 h21) and (B) the percentage of D-Asp and L-Asp active cells in the different water masses of theNorth Atlantic. Bars represent means 6 SE. For water mass abbre-viations, see Table 1.
Fig. 5. Comparison of the D-Asp : L-Asp uptake ratio derivedfrom the percentages of active cells obtained by autoradiographyand by measurements of D-Asp : L-Asp uptake by the bulk prokary-otic community in the different water masses. Bars represent means6 SE. For water mass abbreviations, see Table 1.
other parameters were also averaged for the individual watermasses as described and discussed next.
D-Asp versus L-Asp uptake by the bulk prokaryotic com-munity in different water masses—Mean L-Asp uptake ratesdecreased by two orders of magnitude from 4.5 pmol L21
h21 at 100-m depth to 0.09 pmol L21 h21 in the NADW,increasing again slightly in the DSOW (0.34 pmol L21 h21;Fig. 4A). In contrast, mean D-Asp uptake rates decreasedonly from 0.4 pmol L21 h21 at 100-m depth to 0.08 pmolL21 h21 in the NADW (Fig. 4A). Similar to L-Asp uptake,D-Asp uptake rates increased again in the DSOW. The gen-eral pattern of D-Asp and L-Asp uptake rates in the differentwater masses by the bulk prokaryotic community was re-flected by the percentage of cells capable of taking up D-Asp versus L-Asp as revealed by microautoradiography (Fig.4B). The percentage of DAPI-stainable cells taking up L-Asp ranged from 24% at 100-m depth to 3.6% in the NADW,increasing again in the DSOW (Fig. 4B). The fraction ofprokaryotic cells taking up D-Asp varied only between 5.3%and 3.8% at 100-m depth and the LSW, respectively (Fig.4B). The D-Asp : L-Asp uptake ratio for the bulk prokaryoticcommunity increased with depth from 0.1 at 100-m depth to2.2 in the NADW, decreasing again to 0.7 in the DSOW(Fig. 5). The corresponding ratio of D-Asp : L-Asp activecells obtained by microautoradiography followed the samepattern as the D-Asp : L-Asp uptake ratio, increasing from 0.2
in the subsurface waters to 1.2 in the NADW and decreasingagain to 0.6 in the DSOW (Fig. 5).
Because of the lower number of active cells than totalprokaryotic abundance in meso- and bathypelagic waters,cell-specific uptake rates on the basis of active cell abun-dance (as revealed by microautoradiography) were one totwo orders of magnitude higher than the specific rates esti-mated from total prokaryotic abundance. On average, thecell-specific D-Asp uptake rate, considering the number ofactive and total cells, was 0.14 and 0.004 amol cell21 h21,respectively. The corresponding averaged cell-specific L-Aspuptake rate of active and total cells was 0.15 and 0.012 amolcell21 h21, respectively. In subsurface waters (100 m), activecell–specific D-Asp uptake rates ranged from 0.008 to 0.098amol cell21 h21, whereas active cell–specific L-Asp uptakerates varied from 0.023 to 0.18 amol cell21 h21. Active cell–specific uptake rates for D-Asp were significantly lower insubsurface (0.05 6 0.01 amol cell21 h21, n 5 14) than inmeso- and bathypelagic waters (0.16 6 0.02 amol cell21 h21,n 5 49; Mann–Whitney, p , 0.0001). The increase in active
65Amino acid utilization in the Atlantic
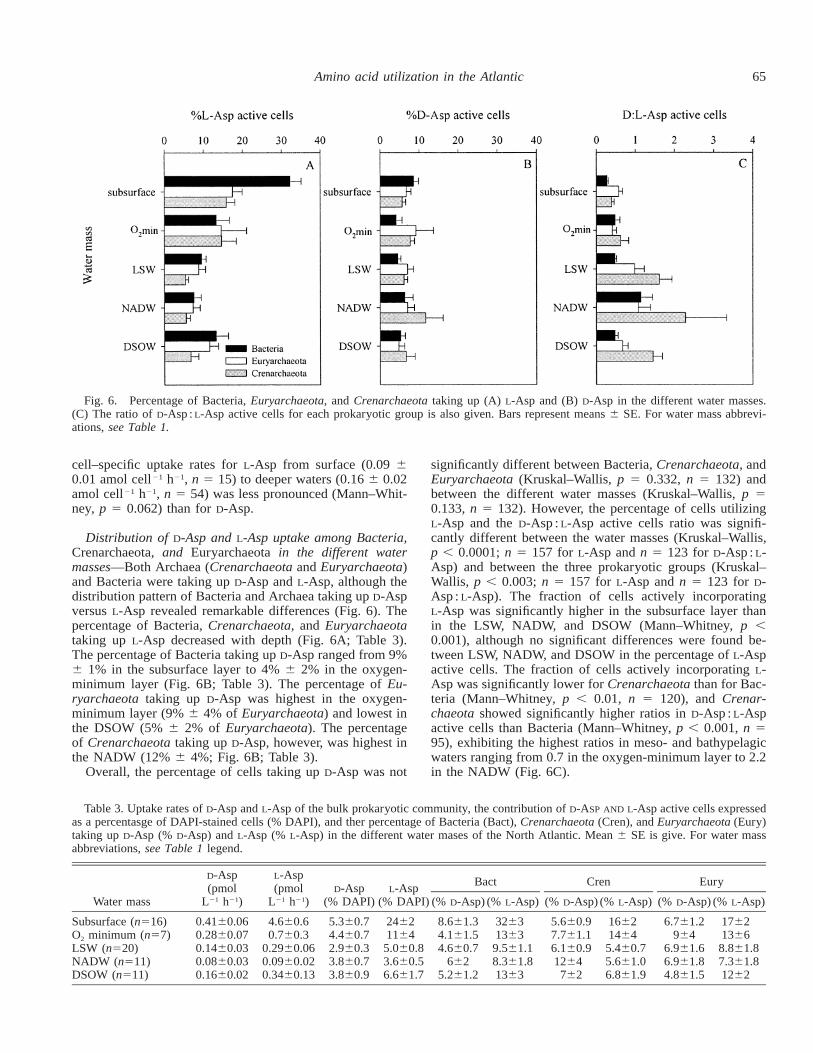
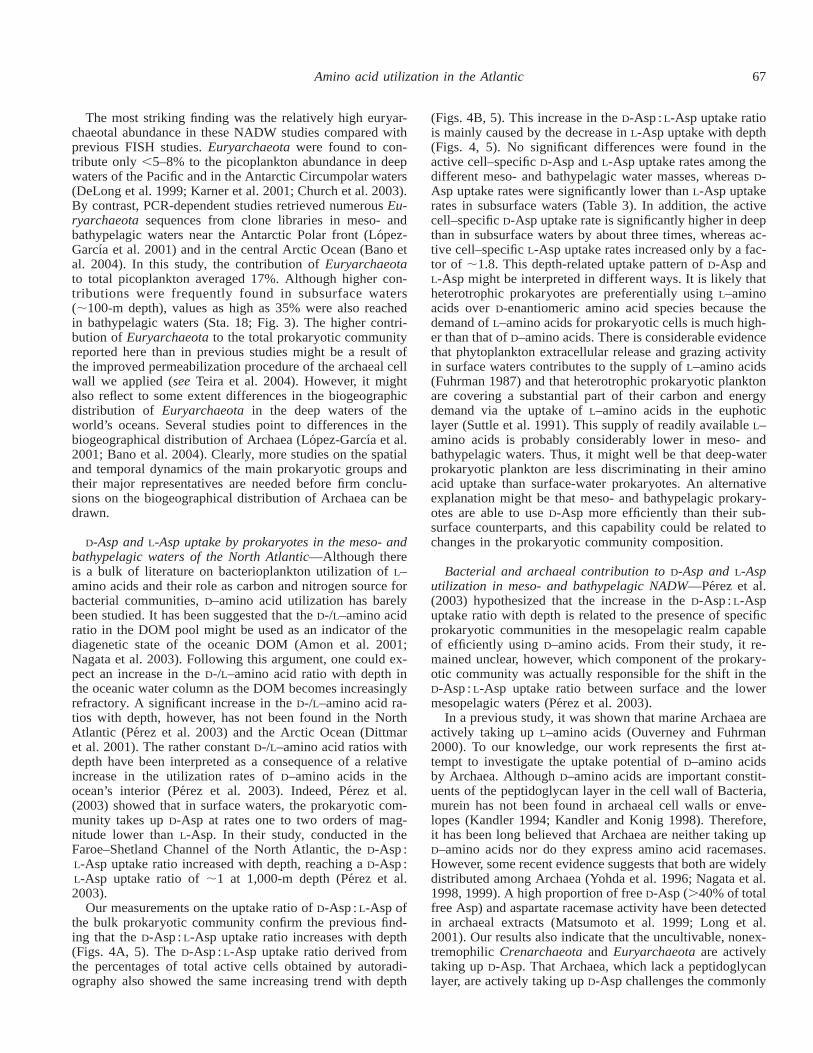
Fig. 6. Percentage of Bacteria, Euryarchaeota, and Crenarchaeota taking up (A) L-Asp and (B) D-Asp in the different water masses.(C) The ratio of D-Asp : L-Asp active cells for each prokaryotic group is also given. Bars represent means 6 SE. For water mass abbrevi-ations, see Table 1.
Table 3. Uptake rates of D-Asp and L-Asp of the bulk prokaryotic community, the contribution of D-ASP AND L-Asp active cells expressedas a percentasge of DAPI-stained cells (% DAPI), and ther percentage of Bacteria (Bact), Crenarchaeota (Cren), and Euryarchaeota (Eury)taking up D-Asp (% D-Asp) and L-Asp (% L-Asp) in the different water mases of the North Atlantic. Mean 6 SE is give. For water massabbreviations, see Table 1 legend.
Water mass
D-Asp(pmol
L21 h21)
L-Asp(pmol
L21 h21)D-Asp
(% DAPI)L-Asp
(% DAPI)
Bact
(% D-Asp) (% L-Asp)
Cren
(% D-Asp) (% L-Asp)
Eury
(% D-Asp) (% L-Asp)
Subsurface (n516)O2 minimum (n57)LSW (n520)NADW (n511)DSOW (n511)
0.4160.060.2860.070.1460.030.0860.030.1660.02
4.660.60.760.3
0.2960.060.0960.020.3460.13
5.360.74.460.72.960.33.860.73.860.9
246211645.060.83.660.56.661.7
8.661.34.161.54.660.7
6625.261.2
326313639.561.18.361.81363
5.660.97.761.16.160.91264
762
166214645.460.75.661.06.861.9
6.761.2964
6.961.66.961.84.861.5
176213668.861.87.361.81262
cell–specific uptake rates for L-Asp from surface (0.09 60.01 amol cell21 h21, n 5 15) to deeper waters (0.16 6 0.02amol cell21 h21, n 5 54) was less pronounced (Mann–Whit-ney, p 5 0.062) than for D-Asp.
Distribution of D-Asp and L-Asp uptake among Bacteria,Crenarchaeota, and Euryarchaeota in the different watermasses—Both Archaea (Crenarchaeota and Euryarchaeota)and Bacteria were taking up D-Asp and L-Asp, although thedistribution pattern of Bacteria and Archaea taking up D-Aspversus L-Asp revealed remarkable differences (Fig. 6). Thepercentage of Bacteria, Crenarchaeota, and Euryarchaeotataking up L-Asp decreased with depth (Fig. 6A; Table 3).The percentage of Bacteria taking up D-Asp ranged from 9%6 1% in the subsurface layer to 4% 6 2% in the oxygen-minimum layer (Fig. 6B; Table 3). The percentage of Eu-ryarchaeota taking up D-Asp was highest in the oxygen-minimum layer (9% 6 4% of Euryarchaeota) and lowest inthe DSOW (5% 6 2% of Euryarchaeota). The percentageof Crenarchaeota taking up D-Asp, however, was highest inthe NADW (12% 6 4%; Fig. 6B; Table 3).
Overall, the percentage of cells taking up D-Asp was not
significantly different between Bacteria, Crenarchaeota, andEuryarchaeota (Kruskal–Wallis, p 5 0.332, n 5 132) andbetween the different water masses (Kruskal–Wallis, p 50.133, n 5 132). However, the percentage of cells utilizingL-Asp and the D-Asp : L-Asp active cells ratio was signifi-cantly different between the water masses (Kruskal–Wallis,p , 0.0001; n 5 157 for L-Asp and n 5 123 for D-Asp : L-Asp) and between the three prokaryotic groups (Kruskal–Wallis, p , 0.003; n 5 157 for L-Asp and n 5 123 for D-Asp : L-Asp). The fraction of cells actively incorporatingL-Asp was significantly higher in the subsurface layer thanin the LSW, NADW, and DSOW (Mann–Whitney, p ,0.001), although no significant differences were found be-tween LSW, NADW, and DSOW in the percentage of L-Aspactive cells. The fraction of cells actively incorporating L-Asp was significantly lower for Crenarchaeota than for Bac-teria (Mann–Whitney, p , 0.01, n 5 120), and Crenar-chaeota showed significantly higher ratios in D-Asp : L-Aspactive cells than Bacteria (Mann–Whitney, p , 0.001, n 595), exhibiting the highest ratios in meso- and bathypelagicwaters ranging from 0.7 in the oxygen-minimum layer to 2.2in the NADW (Fig. 6C).

66 Teira et al.
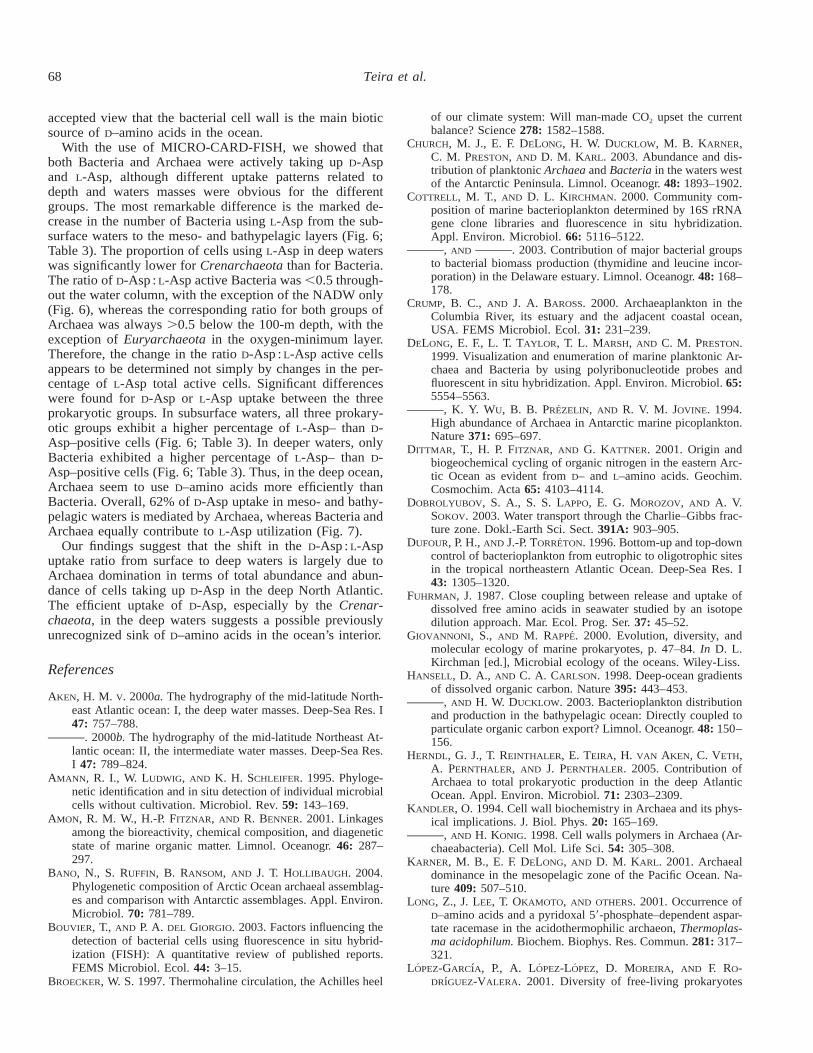
Fig. 7. Contribution of Bacteria (Bact), Euryarchaeota (Eury),and Crenarchaeota (Cren) to D-Asp and L-Asp uptake in subsurfaceand meso- and bathypelagic waters of the North Atlantic expressedas percentage of total active cells as determined by microautora-diography. For further explanations, see text.
The percentage of Bacteria taking up L-Asp was signifi-cantly higher than taking up D-Asp in all the water masses(Mann–Whitney, p , 0.05; n 5 29 for subsurface, n 5 12for the oxygen minimum, n 5 23 for LSW, and n 5 22 forDSOW) except in the NADW (Mann–Whitney, p 5 0.540,n 5 19; Fig. 6; Table 3). The percentage of Crenarchaeotataking up L-Asp was not significantly different from thattaking up D-Asp (Mann–Whitney, p . 0.25) except in sub-surface waters, where Crenarchaeota taking up L-Asp pre-vailed over those taking up D-Asp (Mann–Whitney, p ,0.01) (Fig. 6; Table 3). A significantly higher percentage ofEuryarchaeota took up L-Asp in the subsurface and in theDSOW (Mann–Whitney, p , 0.05), whereas no significantdifference was found in the oxygen minimum, LSW, andNADW (Mann–Whitney, p . 0.15).
The contribution of the different prokaryotic groups to D-Asp and L-Asp utilization can be calculated. We first cal-culated for each prokaryotic group and for D-Asp and L-Aspthe number of active cells as a percentage of DAPI-stainedcells (i.e., the fraction of DAPI-stained cells that were si-multaneously probe- and autoradiography-positive). Then,we normalized the contribution of each group to the numberof total active cells for D-Asp and L-Asp separately. Themean contribution of Bacteria, Crenarchaeota, and Euryar-chaeota to D-Asp and L-Asp utilization showed contrastingpatterns in subsurface versus meso- and bathypelagic waters(Fig. 7). Bacteria and Archaea (Crenarchaeota plus Euryar-chaeota) equally contributed to D-Asp uptake in the subsur-face layer and to L-Asp uptake in the deep waters of theNorth Atlantic Ocean. In contrast, the archaeal contributionto D-Asp uptake was significantly higher than the corre-sponding bacterial contribution in meso- and bathypelagicwaters (Mann–Whitney, p , 0.0001, n 5 76). The bacterialcontribution to L-Asp uptake was significantly higher than
the archaeal contribution in the subsurface layer (Mann–Whitney, p 5 0.004, n 5 28; Fig. 7).
Discussion
Prokaryotic community composition in the meso- andbathypelagic waters of the North Atlantic—Picoplanktonabundance (DAPI-stainable cells) sharply declined from sub-surface to mesopelagic waters. Below 1,000-m depth, pico-plankton abundance varied over the entire transect by lessthan twofold. A similar prokaryotic abundance was reportedfor deep-water picoplankton for the northeast Atlantic (Du-four and Torreton 1996; Patching and Eardly 1997), the Pa-cific (Nagata et al. 2000), and the northwest MediterraneanSea (Tanaka and Rassoulzadegan 2004). The numbers ofDAPI-stained cells before and after MICRO-CARD-FISHprocessing were not significantly different (Teira et al. 2004),indicating that the fraction of cells potentially lost duringprocessing was negligible. Application of the recently re-fined CARD-FISH method and oligonucleotide probes (Teiraet al. 2004) allowed us to recover .70% of the DAPI-stainedcells. This recovery efficiency is only slightly lower thanthat obtained with polynucleotide probes (Karner et al. 2001;Church et al. 2003). Previous attempts with oligonucleotideprobes in oligotrophic surface waters resulted in an estimat-ed archaeal contribution to the total picoplankton communityof ;5% (see review by Bouvier and Del Giorgio 2003).Amplification of the fluorescence signal mediated by theHRP and improved permeabilization procedure for Archaeawith the use of protease-K instead of lysozyme now offersthe opportunity to enumerate specific deep-water prokary-otes because the phylogenetic resolution of oligonucleotideprobes is potentially higher than that of polynucleotideprobes (Pernthaler et al. 2002).
Our results confirm the generally described pattern of thedistribution of Crenarchaeota and Euryarchaeota withdepth. Crenarchaeota appeared to be relatively more abun-dant in meso- and bathypelagic than in subsurface waters(Table 2; Fig. 3). Similar percentages for Crenarchaeotawere reported by Karner et al. (2001) in the Pacific (;10–39% of DAPI counts), who found a sharp increase in cren-archaeotal abundance between 100- and 150-m depth.Church et al. (2003) and Herndl et al. (2005) report only amoderate increase of Crenarchaeota with depth in the Cir-cumpolar Deep Water, and generally, the abundance of thisarchaeal group is lower in these waters than in the Pacificand in the North Atlantic. We observed a steady increase inthe contribution of Crenarchaeota to the total picoplanktonabundance from the subsurface layers down to ;800-mdepth. A crenarchaeotal contribution of .30% of DAPI-stained cells were found from Sta. 11 to 18 (Fig. 3). Thisincreased crenarchaeotal contribution coincided mainly withthe presence of low-salinity and low-oxygen (,250 mmolL21) water masses. Below 900-m depth, a slight decrease increnarchaeotal abundance was observed, with Crenarchaeo-ta contributing between 10% and ,30% to the total pico-plankton (Fig. 3). The contribution of Crenarchaeota in-creased again in the NADW, characterized by higher salinityand higher oxygen concentrations than in the overlying wa-ter masses (Table 1).
67Amino acid utilization in the Atlantic
The most striking finding was the relatively high euryar-chaeotal abundance in these NADW studies compared withprevious FISH studies. Euryarchaeota were found to con-tribute only ,5–8% to the picoplankton abundance in deepwaters of the Pacific and in the Antarctic Circumpolar waters(DeLong et al. 1999; Karner et al. 2001; Church et al. 2003).By contrast, PCR-dependent studies retrieved numerous Eu-ryarchaeota sequences from clone libraries in meso- andbathypelagic waters near the Antarctic Polar front (Lopez-Garcıa et al. 2001) and in the central Arctic Ocean (Bano etal. 2004). In this study, the contribution of Euryarchaeotato total picoplankton averaged 17%. Although higher con-tributions were frequently found in subsurface waters(;100-m depth), values as high as 35% were also reachedin bathypelagic waters (Sta. 18; Fig. 3). The higher contri-bution of Euryarchaeota to the total prokaryotic communityreported here than in previous studies might be a result ofthe improved permeabilization procedure of the archaeal cellwall we applied (see Teira et al. 2004). However, it mightalso reflect to some extent differences in the biogeographicdistribution of Euryarchaeota in the deep waters of theworld’s oceans. Several studies point to differences in thebiogeographical distribution of Archaea (Lopez-Garcıa et al.2001; Bano et al. 2004). Clearly, more studies on the spatialand temporal dynamics of the main prokaryotic groups andtheir major representatives are needed before firm conclu-sions on the biogeographical distribution of Archaea can bedrawn.
D-Asp and L-Asp uptake by prokaryotes in the meso- andbathypelagic waters of the North Atlantic—Although thereis a bulk of literature on bacterioplankton utilization of L–amino acids and their role as carbon and nitrogen source forbacterial communities, D–amino acid utilization has barelybeen studied. It has been suggested that the D-/L–amino acidratio in the DOM pool might be used as an indicator of thediagenetic state of the oceanic DOM (Amon et al. 2001;Nagata et al. 2003). Following this argument, one could ex-pect an increase in the D-/L–amino acid ratio with depth inthe oceanic water column as the DOM becomes increasinglyrefractory. A significant increase in the D-/L–amino acid ra-tios with depth, however, has not been found in the NorthAtlantic (Perez et al. 2003) and the Arctic Ocean (Dittmaret al. 2001). The rather constant D-/L–amino acid ratios withdepth have been interpreted as a consequence of a relativeincrease in the utilization rates of D–amino acids in theocean’s interior (Perez et al. 2003). Indeed, Perez et al.(2003) showed that in surface waters, the prokaryotic com-munity takes up D-Asp at rates one to two orders of mag-nitude lower than L-Asp. In their study, conducted in theFaroe–Shetland Channel of the North Atlantic, the D-Asp :L-Asp uptake ratio increased with depth, reaching a D-Asp :L-Asp uptake ratio of ;1 at 1,000-m depth (Perez et al.2003).
Our measurements on the uptake ratio of D-Asp : L-Asp ofthe bulk prokaryotic community confirm the previous find-ing that the D-Asp : L-Asp uptake ratio increases with depth(Figs. 4A, 5). The D-Asp : L-Asp uptake ratio derived fromthe percentages of total active cells obtained by autoradi-ography also showed the same increasing trend with depth
(Figs. 4B, 5). This increase in the D-Asp : L-Asp uptake ratiois mainly caused by the decrease in L-Asp uptake with depth(Figs. 4, 5). No significant differences were found in theactive cell–specific D-Asp and L-Asp uptake rates among thedifferent meso- and bathypelagic water masses, whereas D-Asp uptake rates were significantly lower than L-Asp uptakerates in subsurface waters (Table 3). In addition, the activecell–specific D-Asp uptake rate is significantly higher in deepthan in subsurface waters by about three times, whereas ac-tive cell–specific L-Asp uptake rates increased only by a fac-tor of ;1.8. This depth-related uptake pattern of D-Asp andL-Asp might be interpreted in different ways. It is likely thatheterotrophic prokaryotes are preferentially using L–aminoacids over D-enantiomeric amino acid species because thedemand of L–amino acids for prokaryotic cells is much high-er than that of D–amino acids. There is considerable evidencethat phytoplankton extracellular release and grazing activityin surface waters contributes to the supply of L–amino acids(Fuhrman 1987) and that heterotrophic prokaryotic planktonare covering a substantial part of their carbon and energydemand via the uptake of L–amino acids in the euphoticlayer (Suttle et al. 1991). This supply of readily available L–amino acids is probably considerably lower in meso- andbathypelagic waters. Thus, it might well be that deep-waterprokaryotic plankton are less discriminating in their aminoacid uptake than surface-water prokaryotes. An alternativeexplanation might be that meso- and bathypelagic prokary-otes are able to use D-Asp more efficiently than their sub-surface counterparts, and this capability could be related tochanges in the prokaryotic community composition.
Bacterial and archaeal contribution to D-Asp and L-Asputilization in meso- and bathypelagic NADW—Perez et al.(2003) hypothesized that the increase in the D-Asp : L-Aspuptake ratio with depth is related to the presence of specificprokaryotic communities in the mesopelagic realm capableof efficiently using D–amino acids. From their study, it re-mained unclear, however, which component of the prokary-otic community was actually responsible for the shift in theD-Asp : L-Asp uptake ratio between surface and the lowermesopelagic waters (Perez et al. 2003).
In a previous study, it was shown that marine Archaea areactively taking up L–amino acids (Ouverney and Fuhrman2000). To our knowledge, our work represents the first at-tempt to investigate the uptake potential of D–amino acidsby Archaea. Although D–amino acids are important constit-uents of the peptidoglycan layer in the cell wall of Bacteria,murein has not been found in archaeal cell walls or enve-lopes (Kandler 1994; Kandler and Konig 1998). Therefore,it has been long believed that Archaea are neither taking upD–amino acids nor do they express amino acid racemases.However, some recent evidence suggests that both are widelydistributed among Archaea (Yohda et al. 1996; Nagata et al.1998, 1999). A high proportion of free D-Asp (.40% of totalfree Asp) and aspartate racemase activity have been detectedin archaeal extracts (Matsumoto et al. 1999; Long et al.2001). Our results also indicate that the uncultivable, nonex-tremophilic Crenarchaeota and Euryarchaeota are activelytaking up D-Asp. That Archaea, which lack a peptidoglycanlayer, are actively taking up D-Asp challenges the commonly
68 Teira et al.
accepted view that the bacterial cell wall is the main bioticsource of D–amino acids in the ocean.
With the use of MICRO-CARD-FISH, we showed thatboth Bacteria and Archaea were actively taking up D-Aspand L-Asp, although different uptake patterns related todepth and waters masses were obvious for the differentgroups. The most remarkable difference is the marked de-crease in the number of Bacteria using L-Asp from the sub-surface waters to the meso- and bathypelagic layers (Fig. 6;Table 3). The proportion of cells using L-Asp in deep waterswas significantly lower for Crenarchaeota than for Bacteria.The ratio of D-Asp : L-Asp active Bacteria was ,0.5 through-out the water column, with the exception of the NADW only(Fig. 6), whereas the corresponding ratio for both groups ofArchaea was always .0.5 below the 100-m depth, with theexception of Euryarchaeota in the oxygen-minimum layer.Therefore, the change in the ratio D-Asp : L-Asp active cellsappears to be determined not simply by changes in the per-centage of L-Asp total active cells. Significant differenceswere found for D-Asp or L-Asp uptake between the threeprokaryotic groups. In subsurface waters, all three prokary-otic groups exhibit a higher percentage of L-Asp– than D-Asp–positive cells (Fig. 6; Table 3). In deeper waters, onlyBacteria exhibited a higher percentage of L-Asp– than D-Asp–positive cells (Fig. 6; Table 3). Thus, in the deep ocean,Archaea seem to use D–amino acids more efficiently thanBacteria. Overall, 62% of D-Asp uptake in meso- and bathy-pelagic waters is mediated by Archaea, whereas Bacteria andArchaea equally contribute to L-Asp utilization (Fig. 7).
Our findings suggest that the shift in the D-Asp : L-Aspuptake ratio from surface to deep waters is largely due toArchaea domination in terms of total abundance and abun-dance of cells taking up D-Asp in the deep North Atlantic.The efficient uptake of D-Asp, especially by the Crenar-chaeota, in the deep waters suggests a possible previouslyunrecognized sink of D–amino acids in the ocean’s interior.
References
AKEN, H. M. V. 2000a. The hydrography of the mid-latitude North-east Atlantic ocean: I, the deep water masses. Deep-Sea Res. I47: 757–788.
. 2000b. The hydrography of the mid-latitude Northeast At-lantic ocean: II, the intermediate water masses. Deep-Sea Res.I 47: 789–824.
AMANN, R. I., W. LUDWIG, AND K. H. SCHLEIFER. 1995. Phyloge-netic identification and in situ detection of individual microbialcells without cultivation. Microbiol. Rev. 59: 143–169.
AMON, R. M. W., H.-P. FITZNAR, AND R. BENNER. 2001. Linkagesamong the bioreactivity, chemical composition, and diageneticstate of marine organic matter. Limnol. Oceanogr. 46: 287–297.
BANO, N., S. RUFFIN, B. RANSOM, AND J. T. HOLLIBAUGH. 2004.Phylogenetic composition of Arctic Ocean archaeal assemblag-es and comparison with Antarctic assemblages. Appl. Environ.Microbiol. 70: 781–789.
BOUVIER, T., AND P. A. DEL GIORGIO. 2003. Factors influencing thedetection of bacterial cells using fluorescence in situ hybrid-ization (FISH): A quantitative review of published reports.FEMS Microbiol. Ecol. 44: 3–15.
BROECKER, W. S. 1997. Thermohaline circulation, the Achilles heel
of our climate system: Will man-made CO2 upset the currentbalance? Science 278: 1582–1588.
CHURCH, M. J., E. F. DELONG, H. W. DUCKLOW, M. B. KARNER,C. M. PRESTON, AND D. M. KARL. 2003. Abundance and dis-tribution of planktonic Archaea and Bacteria in the waters westof the Antarctic Peninsula. Limnol. Oceanogr. 48: 1893–1902.
COTTRELL, M. T., AND D. L. KIRCHMAN. 2000. Community com-position of marine bacterioplankton determined by 16S rRNAgene clone libraries and fluorescence in situ hybridization.Appl. Environ. Microbiol. 66: 5116–5122.
, AND . 2003. Contribution of major bacterial groupsto bacterial biomass production (thymidine and leucine incor-poration) in the Delaware estuary. Limnol. Oceanogr. 48: 168–178.
CRUMP, B. C., AND J. A. BAROSS. 2000. Archaeaplankton in theColumbia River, its estuary and the adjacent coastal ocean,USA. FEMS Microbiol. Ecol. 31: 231–239.
DELONG, E. F., L. T. TAYLOR, T. L. MARSH, AND C. M. PRESTON.1999. Visualization and enumeration of marine planktonic Ar-chaea and Bacteria by using polyribonucleotide probes andfluorescent in situ hybridization. Appl. Environ. Microbiol. 65:5554–5563.
, K. Y. WU, B. B. PREZELIN, AND R. V. M. JOVINE. 1994.High abundance of Archaea in Antarctic marine picoplankton.Nature 371: 695–697.
DITTMAR, T., H. P. FITZNAR, AND G. KATTNER. 2001. Origin andbiogeochemical cycling of organic nitrogen in the eastern Arc-tic Ocean as evident from D– and L–amino acids. Geochim.Cosmochim. Acta 65: 4103–4114.
DOBROLYUBOV, S. A., S. S. LAPPO, E. G. MOROZOV, AND A. V.SOKOV. 2003. Water transport through the Charlie–Gibbs frac-ture zone. Dokl.-Earth Sci. Sect. 391A: 903–905.
DUFOUR, P. H., AND J.-P. TORRETON. 1996. Bottom-up and top-downcontrol of bacterioplankton from eutrophic to oligotrophic sitesin the tropical northeastern Atlantic Ocean. Deep-Sea Res. I43: 1305–1320.
FUHRMAN, J. 1987. Close coupling between release and uptake ofdissolved free amino acids in seawater studied by an isotopedilution approach. Mar. Ecol. Prog. Ser. 37: 45–52.
GIOVANNONI, S., AND M. RAPPE. 2000. Evolution, diversity, andmolecular ecology of marine prokaryotes, p. 47–84. In D. L.Kirchman [ed.], Microbial ecology of the oceans. Wiley-Liss.
HANSELL, D. A., AND C. A. CARLSON. 1998. Deep-ocean gradientsof dissolved organic carbon. Nature 395: 443–453.
, AND H. W. DUCKLOW. 2003. Bacterioplankton distributionand production in the bathypelagic ocean: Directly coupled toparticulate organic carbon export? Limnol. Oceanogr. 48: 150–156.
HERNDL, G. J., T. REINTHALER, E. TEIRA, H. VAN AKEN, C. VETH,A. PERNTHALER, AND J. PERNTHALER. 2005. Contribution ofArchaea to total prokaryotic production in the deep AtlanticOcean. Appl. Environ. Microbiol. 71: 2303–2309.
KANDLER, O. 1994. Cell wall biochemistry in Archaea and its phys-ical implications. J. Biol. Phys. 20: 165–169.
, AND H. KONIG. 1998. Cell walls polymers in Archaea (Ar-chaeabacteria). Cell Mol. Life Sci. 54: 305–308.
KARNER, M. B., E. F. DELONG, AND D. M. KARL. 2001. Archaealdominance in the mesopelagic zone of the Pacific Ocean. Na-ture 409: 507–510.
LONG, Z., J. LEE, T. OKAMOTO, AND OTHERS. 2001. Occurrence ofD–amino acids and a pyridoxal 59-phosphate–dependent aspar-tate racemase in the acidothermophilic archaeon, Thermoplas-ma acidophilum. Biochem. Biophys. Res. Commun. 281: 317–321.
LOPEZ-GARCıA, P., A. LOPEZ-LOPEZ, D. MOREIRA, AND F. RO-DRıGUEZ-VALERA. 2001. Diversity of free-living prokaryotes
69Amino acid utilization in the Atlantic
from a deep-sea site at the Antarctic Polar Front. FEMS Mi-crobiol. Ecol. 36: 193–202.
MASSANA, R., L. T. TAYLOR, A. E. MURRAY, K. Y. WU, W. H.JEFFREY, AND E. F. DELONG. 1998. Vertical distribution andtemporal variation of marine planktonic archaea in the Ger-lache Strait, Anctartica, during early spring. Limnol. Oceanogr.43: 607–617.
MATSUMOTO M., H. HOMMA, Z. LONG, AND OTHERS. 1999. Occur-rence of free amino acids and aspartate racemases in hyper-thermophilic archaea. J. Bacteriol. 181: 6560–6563.
MOESENEDER, M. M., C. WINTER, AND G. J. HERNDL. 2001. Hori-zontal and vertical complexity of attached and free-living bac-teria of the eastern Mediterranean Sea, determined by 16SrDNA and 16S rRNA fingerprints. Limnol. Oceanogr. 46: 95–107.
NAGATA, T., H. FUKUDA, R. FUKUDA, AND I. KOIKE. 2000. Bacter-ioplankton distribution and production in deep Pacific waters:Large-scale geographic variations and possible coupling withsinking particle fluxes. Limnol. Oceanogr. 45: 426–435.
, B. MEON, AND D. L. KIRCHMAN. 2003. Microbial degra-dation of peptidoglycan in seawater. Limnol. Oceanogr. 48:745–754.
NAGATA, Y., T. FUJIWARA, K. KAWAGUCHI-NAGATA, Y. FUKUMORI,AND T. YAMANAKA. 1998. Occurrence of peptidyl D–amino ac-ids in soluble fractions of several eubacteria, archaea and eu-karyotes. Biochim. Biophys. Acta 1379: 76–82.
, K. TANAKA, T. IIDA, AND OTHERS. 1999. Occurrence of D–amino acids in a few archaea and dehydrogenase activities inhyperthermophile Pyrobaculum islandicum. Biochim. Biophys.Acta 1435: 160–166.
OUVERNEY, C. C., AND J. A. FUHRMAN. 2000. Marine planktonicArchaea take up amino acids. Appl. Environ. Microbiol. 66:4829–4833.
PATCHING, J. W., AND D. EARDLY. 1997. Bacterial biomass andactivity in the deep waters of the eastern Atlantic—evidenceof a barophilic community. Deep-Sea Res. I 44: 1655–1670.
PEREZ, M. T., C. PAUSZ, AND G. J. HERNDL. 2003. Major shift inbacterioplankton utilization of enantiomeric amino acids be-tween surface waters and the ocean’s interior. Limnol. Ocean-ogr. 48: 755–763.
PERNTHALER, A., C. M. PRESTON, J. PERNTHALER, E. F. DELONG,AND R. AMANN. 2002. Comparison of fluorescently labeled ol-igonucleotide and polynucleotide probes for the detection ofpelagic marine Bacteria and Archaea. Appl. Environ. Micro-biol. 68:661–667.
SCHLEIFER, K. H., AND O. KANDLER. 1972. Peptidoglycan types ofbacterial cell walls and their taxonomic implications. Bacteriol.Rev. 36: 407–477.
SUTTLE, C. A., A. M. CHAN, AND J. A. FUHRMAN. 1991. Dissolvedfree amino acids in the Sargasso Sea: Uptake and respirationrates, turnover times, and concentration. Mar. Ecol. Prog. Ser.70: 189–199.
TANAKA, T., AND F. RASSOULZADEGAN. 2004. Vertical and seasonalvariations of bacterial abundance and production in the meso-pelagic layer of the NW Mediterranean Sea: Bottom-up andtop-down controls. Deep-Sea Res. I 51: 531–544.
TEIRA, E., T. REINTHALER, A. PERNTHALER, J. PERNTHALER, AND
G. J. HERNDL. 2004. Combining catalyzed reporter deposition-fluorescence in situ hybridization and microautoradiography todetect substrate utilization by Bacteria and Archaea in the deepocean. Appl. Environ. Microbiol. 70: 4411–4414.
WILLIAMS, P. J. LEB. 2000. Heterotrophic bacteria and the dynamicsof dissolved organic material, p. 153–200. In D. L. Kirchman[ed.], Microbial ecology of the oceans. Wiley-Liss.
YOHDA, M., I. ENDO, Y. ABE, T. OHTA, T. IIDA, T. MARUYAMA, AND
Y. KAGAWA. 1996. Gene for aspartate racemase from the sul-fur-dependent hyperthermophilic archaeum, Desulfurococcusstrain SY. J. Biol. Chem. 271: 22,017–22,021.
Received: 11 April 2005Amended: 27 July 2005
Accepted: 16 August 2005