Poly(vinyl chloride) and wood flour press mould composites: New bonding strategies
Upload
independentCategory
view
1download
0
lable at ScienceDirect
Polymer 52 (2011) 510e518
Contents lists avai
Polymer
journal homepage: www.elsevier .com/locate/polymer
Toughening vinyl ester networks with polypropylene meso-fibers: Interfacemodification and composite properties
Y. Liang a, R.E. Jensen b, D.D. Pappas b, G.R. Palmese a,*
aDepartment of Chemical and Biological Engineering, Drexel University, Philadelphia, PA 19104, USAbU.S. Army Research Laboratory, Aberdeen Proving Ground, MD 21005, USA
a r t i c l e i n f o
Article history:Received 9 September 2010Received in revised form29 November 2010Accepted 1 December 2010Available online 9 December 2010
Keywords:TougheningSurface treatmentsMechanical properties
* Corresponding author. Tel.: þ1 215 895 5814; faxE-mail address: [email protected] (G.R. Palm
0032-3861/$ e see front matter � 2010 Elsevier Ltd.doi:10.1016/j.polymer.2010.12.006
a b s t r a c t
Polymerepolymer composites comprised of vinyl ester matrices (VE) and polypropylene (PP) fibermeshes were fabricated and tested in this investigation. Results indicated that PP fibers greatly enhancedfracture toughness; however, strength of the VE was significantly reduced as voids were observed at theinterface of the PP and VE. A two-step surface modification, oxygen plasma treatment followed bygrafting vinyltrimethoxysilane (VTMS), was conducted on PP fibers in an effort to improve interfacialstrength. Interfacial discontinuities of composites were improved after surface modification of PP. Theoxygen plasma treatment added hydrophilic functional groups but caused surface roughness. Surfacetreatment of PP slightly increased fracture toughness of the PP-VE composite by enhancing energyabsorption capacity at the interface. However, mechanical strength and modulus did not significantlyincrease for the composite using VTMS grafted PP fibers due to the weak fiber material. Small PP fiberswith higher strength may attain the expected improvement in mechanical properties after surfacetreatment.
� 2010 Elsevier Ltd. All rights reserved.
1. Introduction
Polymerepolymer nano/meso composites are being investi-gated to develop tough materials with enhanced energy absorbingcapability through the unique combination of distinct polymericphases that possess chemical, structural, and geometric attributestailorable at the nano/meso scales. Vinyl ester resins (VE) are a classof thermoset polymers that possess high chemical and corrosionresistance, good thermal and mechanical properties, and are rela-tively easy to process. However, VE resins are brittle, thus limitingtheir use in high performance composite materials. Liquid rubbermodifiers, such as carboxyl-terminated butadiene nitrile (CTBN),vinyl terminated butadiene-acrylonitrile (VTBN) and epoxy termi-nated butadiene-acrylonitrile (ETBN), have been used to toughenepoxy resins [1e3] and VE resins [4,5]. In these systems a suitableliquid rubber is usually dissolved in the uncured resin to form a onephase system that phase separates upon reaction to form rubberdomains within a continuous hard matrix. Good phase separationobtained by controlling the polymerization reaction can limitplasticization and add energy dissipating mechanisms to improvefracture toughness [2]. However, poor compatibility of liquid
: þ1 215 895 5837.ese).
All rights reserved.
rubbers with the resinmonomers can hinder their application in VEsystems [5]. In contrast, toughening using preformed particles[6e9] and fibers [10] does not require phase separation and hasbeen developed for thermosetting resins.
Compared to common particulate rubber fillers, polymeric fibers,because of their continuous nature, offer potentially distincttoughening mechanisms while providing good physical properties.Unfortunately, the low surface energy of polyoleofinic fibers nor-mally results inpoorwettability andweak bonding at the interface. Itis also known that discontinuities and void formation limit theinterfacial strength and load transfer from the matrix to the tough-ening fibers. This can occur when the fibers are not easily wetted bythe matrix resin. Surface treatments play an important role inimproving interfacial bonding and preventing such discontinuities.
Chemical functional groups have been added to the surface ofpolymeric fibers by techniques such as plasma treatment [11e13],UV/Ozone [14] and the use of coupling agents [15,16]. Such func-tional groups interact with the polymer matrix to enhance inter-facial adhesion and mechanical properties of polymerepolymercomposites. Gas plasma treatment is a commonly used techniquebecause it has a relatively low operation cost, it is a fast process, andit affects the surface properties of the exposed material withoutaltering its bulk. Chemical functional groups and minor surfaceetching are created during plasma treatment. The improvedwettability through chemical bonding and mechanical interlocking

Y. Liang et al. / Polymer 52 (2011) 510e518 511
due to the rough surface are believed to be important in improvinginterfacial adhesion of polyethylene fiber-VE composites, withmechanical interlocking providing a greater contribution toincreased adhesion [11]. Plasma generated functional groups tendto reorganize in order to lower the surface energy during storage[17], which may explain the less pronounced contribution ofchemical bonding in aged samples. However, a rough surfacecreated through oxygen and nitrogen plasma treatment on poly-propylene (PP) was reported to have negative contribution onadhesion of polymer coatings due to the weak bond of the surfacelayer to the bulk [18]. Our previous study also showed that oxygen/helium plasma treated PP fibers failed to improve interfacial andmechanical properties of PP-VE composites [20]. Therefore, stablefunctional groups grafted through coupling agents are preferredwhen an immediate follow-up process is unrealistic.
In this work a commercial vinyl ester resin, Derakane� 411-350(Ashland) was used. PP fiber meshes were encapsulated in VEresins via vacuum assisted resin transfer molding (VARTM). PP isa tough, semi-crystalline thermoplastic with amelting temperatureof 161 �C. In addition to the toughening properties of the PP fibersthe phase transition associated with melting could provide a newenergy absorption mechanism. Surface treatment using silanecoupling agents after applying oxygen plasma to fibrous mats wasperformed to graft siloxane linkages with vinyl groups to PP, whichcould react with VE monomers during curing. Those chemicalbonds were expected to enhance the interfacial interactionbetween the PP fibers and VE resin. Surface treatment on PP fibermeshes was evaluated using X-Ray photoelectron spectroscopy(XPS), contact angle measurements, thermogravimetric analysis(TGA), environmental scanning electron microscopy (ESEM), anddifferential scanning calorimetry (DSC). PP-VE composites wereevaluated using standard thermal and thermomechanical analysistechniques as well as mechanical characterization which includedfracture toughness, tensile and flexural property measurement.
2. Experimental
2.1. Materials
The commercial vinyl ester (VE) resin used in this work wasDerakane� 411-350 Epoxy VE Resin (Ashland Specialty ChemicalCo), which contains approximately 45% styrene as a reactivediluent. Commercial polypropylene (PP) fibers with diameters of1e2 mmwere obtained fromHills Inc. These fibers weremelt-blownusing ExxonMobil PP3746G granular homopolymer with a meltflow index (MFI) of 1500. The fiber mats are composed of randomlyoriented PP fibers with an average aerial density of 26 g/m2. Thefree radical initiator used was Trigonox 239A (Akzo Nobel PolymerChemicals). This initiator contains 45 wt.% cumyl hydroperoxide,45 wt.% carboxylic ester and 10 wt.% cumyl acid, as specified by themanufacturer. Cobalt Napthenate (CoNap) (OMG Americas) con-taining 6 wt.% cobalt was used as an accelerator to enable roomtemperature cure. Vinyltrimethoxysilane (VTMS) (Aldrich) wasused as a silane coupling agent in this study.
2.2. Surface modification of PP fibers
A planar Dielectric Barrier Discharge (DBD) plasma system wasused for the surface treatment with desired gases. The distancebetween the electrodes was 3 mm and the power output duringplasma treatment was approximately 0.1 W/cm2 with a frequencyof 165 Hz. The area of each electrode was approximately 225 cm2.Oxygen (O2) was used as the desired treatment gas to increase thehydrophilicity of the surface [17e19]. A flow rate of 1 L/min pure O2was injected into the space between two electrodes at atmospheric
pressure for more than 2 min before discharge to allow a uniformglow discharge. Treatment time varied from 15 to 180 s and bothsides of PP fiber meshes were exposed to oxygen plasma for thesame period. VTMS, a silane coupling agent with a vinyl functionalgroup, was dissolved in deionized water to make a 0.3 wt.% solu-tion. Its pH was then adjusted to 3.5 by drop-wise addition of aceticacid [21]. The solution was prepared 1 h prior to use to allowcomplete hydrolysis and used within 2 h to limit condensation inthe solution. Within 1 h after oxygen plasma treatment, PP mesheswere soaked in the VTMS solution for 10 min and then dried ina vacuum oven at 60 �C for at least 40 h to allow for condensation ofthe siloxane linkages and subsequent removal of water. The reac-tion mechanism is described by Rahmathullah et al. [22]. Thesuggested VTMS polycondensation temperature of 125 �C wasdecreased to 60 �C because plasma treated PP was found to degradeduring polycondensation of silane coupling agents at 125 �C.Interestingly, PP without plasma treatment exhibited resistance todegradation during silane treatment at 125 �C.
2.3. Fiber characterization
Element compositions and chemical functional groups on thefiber surface were analyzed by X-Ray photoelectron spectroscopy(XPS). XPS spectra were obtained using a Kratos Axis Ultra 165spectrometer equipped with a hemispherical analyzer. The X-raywas generated with an Aluminum Ka (1486.7eV) monochromaticsource energized at 20 kV and 100 W, and irradiated ata 1 mm � 0.5 mm area. The takeoff angle was adjusted to 90� withrespect to the sample surface. The pressure in the analysis chamberwas <10�9 mbar. Surface charge effects were neutralized by usinga flood gun. A value of 285.0 eV for the hydrocarbon C1s core levelwas used as the calibration energy for the binding energy scale.
While XPS functional group analyses provide information froma surface layer about 10 nm in depth, contact angle measurementcan give true surface information [17]. Static contact anglemeasurements using the sessile drop method were performed onamodular CAM200 Optical Contact Angle and Surface TensionMeter(KSV Instruments, Ltd., Finland), by dispensing a drop of deionizedwater with known volume from amicroliter syringe onto the samplesurface at ambient conditions. A monochromatic LED light sourcewas used to image the water drops and the images captured wereused to measure contact angles (q) using YoungeLaplace curvefitting. At least ten measurements were made for each sample.
The amount of VTMS grafted on PP fibers was determined byheating the treated PP fiber mats to 800 �C in N2 flow at a rate of10 �C/min using a TA Instruments TGA Q50 thermogravimetricanalyzer. Since crosslinked siloxanes are stable at temperatures ashigh as 800 �C but PP decomposes at a much lower temperature,the weight remaining at 800 �C was taken as the weight of graftedVTMS. Samples weighing approximately 20 mg were used.
A TA Instruments DSC Q2000 differential scanning calorimeter(DSC) was used to determine the melting temperature (Tm) and heatof melting (DHm) of untreated and treated PP fibers under N2 flow.Sample sizes were about 3 mg. Temperature scans were performedfrom �70 �C to 200 �C at a heating/cooling rate of 10 �C/min.
Fiber surface morphologies were studied using an environ-mental field emission scanning electron microscope (ESEM), ModelXL30 ESE FEG, with an acceleration voltage of 3 keV in high vacuummode. Samples were sputter-coated with platinum for 30 s prior toESEM evaluation.
2.4. Resin and composite fabrication
Neat VE resin test plaques were fabricated in a metal mold. VEmonomer was degassed in a Thinky planetary centrifugal mixer
Y. Liang et al. / Polymer 52 (2011) 510e518512
ARE-250 for 15 min at a speed of 1500 rpm. Trigonox 239A, cobaltNapthenate and VE monomers were mixed at a weight proportionof 1:0.12:100 to control the gel time to 1.5 h. The mixture wasdegassed for another 4 min, poured into a mold, and then sealed.After being precured at ambient temperature for 24 h, themoldwasplaced in an oven and allowed to postcure at 125 �C for 3 h.
PP-VE composites were fabricated via vacuum assisted resintransfer molding (VARTM). PP fiber meshes were cut into150 mm � 150 mm squares and stacked to desired thickness. Afterbeing weighed, the stacked meshes were covered by release clothand a distributing layer and then sealed in a vacuum bag. VE wasmixed with Trigonox 239A and cobalt Napthenate at the sameproportion as used in the preparation of neat VE resin test plaques.Once infiltration was complete, the inlet and outlet were sealed.The composites were precured in the vacuum bag at ambienttemperature for 24 h, and then postcured at 125 �C for 3 h. Theresulting composites contained approximately 20 volume percentPP fibers due to the relatively low aerial density of the PP mats.
Fig. 1. XPS survey spectra of untreated PP, O2-PP and VTMS-PP.
2.5. Composite characterization
Densities of composites were measured based on Archimedes’principle. Weight in air and weight in a heptane bath weremeasured for each sample. Density was calculated fromweights ofthe sample and density of heptane. The equation for the densitycalculation is as follows:
rðsampleÞ ¼ rðheptaneÞ �WðsampleÞin�airWðsampleÞin�air�WðsampleÞin�hep tane
Volume fractions of PP, VE and air were calculated based ondensity and weight of each component in the composite.
Dynamic mechanical analysis was performed on a TA Instru-ments DMA 2980 dynamic mechanical analyzer (DMA) with a dualcantilever clamp frame. Loss and storagemoduli were recorded from30 �C to 180 �C at a heating rate of 2 �C/min and an oscillationfrequency of 1 Hz. The glass transition temperature (Tg) of each VEsystem was taken as the temperature corresponding to the peak ofthe lossmodulus curve. The activation energies of a and b transitionswere calculated frommultiple frequency sweeps (0.1, 0.3,1, 3,10 and30 Hz) at 3 �C isothermal steps from �50 �C to 180 �C. Arrheniusactivation energy is defined by the following equation [23]:
log f ¼ �Ea2:303R
�1T
�
where Ea is Arrhenius activation energy, f is frequency, and T iscorresponding transition temperature at the frequency. The slopein the plot of log f vs. 1/T is used to calculate the activation energy,giving
Ea ¼ �2:303R � slope
All samples were tested at an oscillatory-displacement ampli-tude of 15 mm. Typical sample dimensions in the DMAwere 35 mmin length, 12.75 mm in width, and 3.15 mm in thickness. Tg and Tmof each VE systemwas also determined via DSC using the proceduredescribed above.
Mechanical properties were obtained using an Instron 8872universal testing instrument. Three-point single-edge notch bend(SENB) specimens were used for plane-strain fracture toughnessmeasurements. ASTM 5045-99 [24] specifies sample dimensions of50.84 mm (span) � 12.71 mm (width) � 6.35 mm (thickness) toassure plain strain conditions. An initial crack was made by firstsawing a notch with length half the sample width, and then usinga sharp razor blade to initiate a crack at the base of the notch.
The samples were tested in flexural mode at a crosshead speed of10 mm/min. Three-point bend specimens were used to measureflexural strength and modulus of elasticity in bending. Typicalspecimen dimensions were 50.84 mm (span) � 12.71 mm(width) � 3.17 mm (thickness) specified according to ASTM 790-03[25] standard. The samples were tested in flexural mode ata crosshead speed of 1.3 mm/min. Tests were stopped whensamples were broken. Tensile strength and modulus of elasticityweremeasured according to ASTMD638-03 [26]. Dog-bone shapedspecimens were machined according to dimensions of specimentype V. An extensometer was used to indicate the strain with theinitial gage length set at 12.5 mm. Samples were tested to failure ata crosshead speed of 1 mm/min. All tests were performed atambient conditions. Fracture surfaces of composites were exam-ined with ESEM using an acceleration voltage of 10 keV.
3. Results and discussion
3.1. Surface modification
The surface treatment followed in this study involved a two-step process. Theoretically, plasma treatment with O2 can addfunctional groups such as hydroxyl, ether, carbonyl, and carboxylgroups to the surface [17e19]. Silane coupling agents covalentlygraft to the polymer surface via functional groups such as hydroxylgroups and polymerize by condensation reactions to form a cross-linked network [21,22]. Generally a shorter plasma treatment timeis favored for adding functional groups to the surface. In our study,we used treatment times ranging from 15 s to 180 s in an attempt todetermine the optimal treatment time. Oxygen plasma treated PP(O2-PP) and VTMS grafted PP (VTMS-PP) fibers were analyzed usinguntreated PP fibers as a control.
The XPS survey spectrum of VTMS-PP in the range of 0e1200 eVgiven in Fig. 1 clearly shows peaks corresponding to C at 285 eV, Oat 532.5 eV, and Si at 153.5 and 102.6 eV. Also in Fig. 1, the XPSsurvey spectrum of O2-PP shows two peaks corresponding to C andO while untreated PP only has one peak at 285 eV corresponding toC. Atomic ratios of O:C and Si:C for O2-PP, VTMS-PP and untreatedPP are compared as a function of the treatment time in Fig. 2. It isclear that 30 s and 180 s plasma treatment gave the highest Si:Cratio, while 15 s plasma treatment resulted in the lowest O:C andSi:C ratios. Oxygen concentration of O2-PP increased with longertreatment times, but the plasma-induced hydrophilic functionalgroups reached equilibrium at an O:C ratio of approximately 0.3 asseen from the VTMS-PP samples in Fig. 2, which was also reported
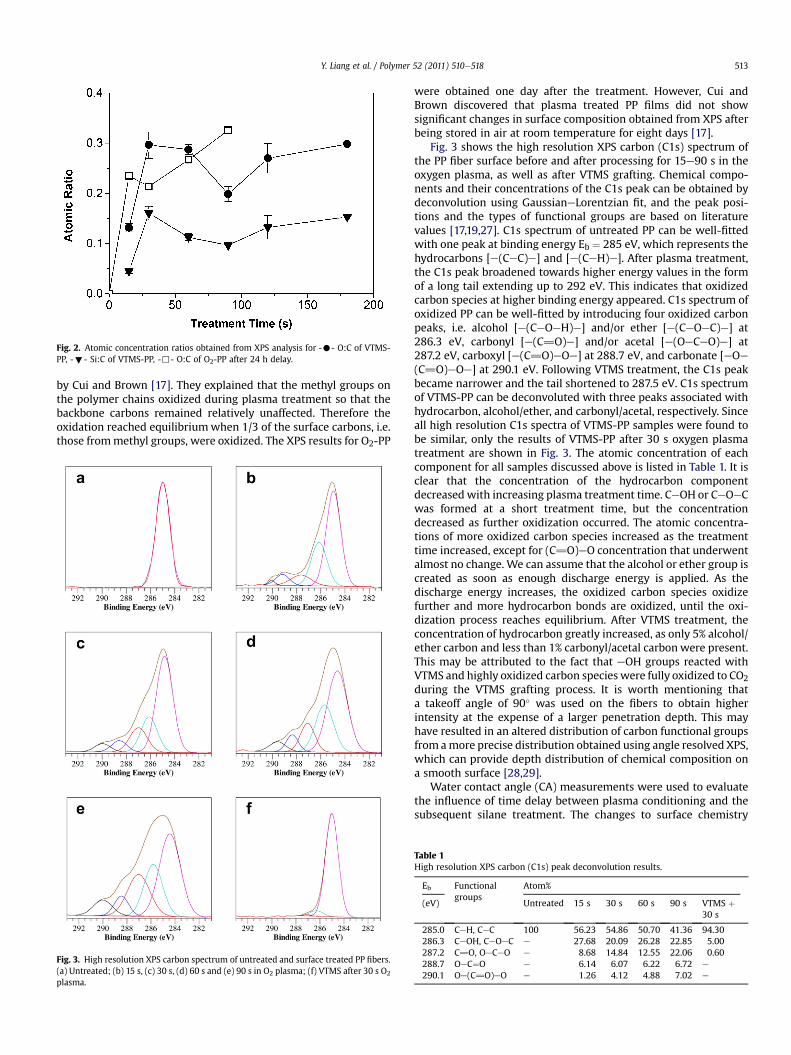
Fig. 2. Atomic concentration ratios obtained from XPS analysis for -C- O:C of VTMS-PP, -;- Si:C of VTMS-PP, -,- O:C of O2-PP after 24 h delay.
Y. Liang et al. / Polymer 52 (2011) 510e518 513
by Cui and Brown [17]. They explained that the methyl groups onthe polymer chains oxidized during plasma treatment so that thebackbone carbons remained relatively unaffected. Therefore theoxidation reached equilibriumwhen 1/3 of the surface carbons, i.e.those frommethyl groups, were oxidized. The XPS results for O2-PP
Fig. 3. High resolution XPS carbon spectrum of untreated and surface treated PP fibers.(a) Untreated; (b) 15 s, (c) 30 s, (d) 60 s and (e) 90 s in O2 plasma; (f) VTMS after 30 s O2
plasma.
were obtained one day after the treatment. However, Cui andBrown discovered that plasma treated PP films did not showsignificant changes in surface composition obtained from XPS afterbeing stored in air at room temperature for eight days [17].
Fig. 3 shows the high resolution XPS carbon (C1s) spectrum ofthe PP fiber surface before and after processing for 15e90 s in theoxygen plasma, as well as after VTMS grafting. Chemical compo-nents and their concentrations of the C1s peak can be obtained bydeconvolution using GaussianeLorentzian fit, and the peak posi-tions and the types of functional groups are based on literaturevalues [17,19,27]. C1s spectrum of untreated PP can be well-fittedwith one peak at binding energy Eb ¼ 285 eV, which represents thehydrocarbons [e(CeC)e] and [e(CeH)e]. After plasma treatment,the C1s peak broadened towards higher energy values in the formof a long tail extending up to 292 eV. This indicates that oxidizedcarbon species at higher binding energy appeared. C1s spectrum ofoxidized PP can be well-fitted by introducing four oxidized carbonpeaks, i.e. alcohol [e(CeOeH)e] and/or ether [e(CeOeC)e] at286.3 eV, carbonyl [e(C]O)e] and/or acetal [e(OeCeO)e] at287.2 eV, carboxyl [e(C]O)eOe] at 288.7 eV, and carbonate [eOe(C]O)eOe] at 290.1 eV. Following VTMS treatment, the C1s peakbecame narrower and the tail shortened to 287.5 eV. C1s spectrumof VTMS-PP can be deconvoluted with three peaks associated withhydrocarbon, alcohol/ether, and carbonyl/acetal, respectively. Sinceall high resolution C1s spectra of VTMS-PP samples were found tobe similar, only the results of VTMS-PP after 30 s oxygen plasmatreatment are shown in Fig. 3. The atomic concentration of eachcomponent for all samples discussed above is listed in Table 1. It isclear that the concentration of the hydrocarbon componentdecreased with increasing plasma treatment time. CeOH or CeOeCwas formed at a short treatment time, but the concentrationdecreased as further oxidization occurred. The atomic concentra-tions of more oxidized carbon species increased as the treatmenttime increased, except for (C]O)eO concentration that underwentalmost no change. We can assume that the alcohol or ether group iscreated as soon as enough discharge energy is applied. As thedischarge energy increases, the oxidized carbon species oxidizefurther and more hydrocarbon bonds are oxidized, until the oxi-dization process reaches equilibrium. After VTMS treatment, theconcentration of hydrocarbon greatly increased, as only 5% alcohol/ether carbon and less than 1% carbonyl/acetal carbonwere present.This may be attributed to the fact that eOH groups reacted withVTMS and highly oxidized carbon species were fully oxidized to CO2during the VTMS grafting process. It is worth mentioning thata takeoff angle of 90� was used on the fibers to obtain higherintensity at the expense of a larger penetration depth. This mayhave resulted in an altered distribution of carbon functional groupsfrom amore precise distribution obtained using angle resolved XPS,which can provide depth distribution of chemical composition ona smooth surface [28,29].
Water contact angle (CA) measurements were used to evaluatethe influence of time delay between plasma conditioning and thesubsequent silane treatment. The changes to surface chemistry
Table 1High resolution XPS carbon (C1s) peak deconvolution results.
Eb Functionalgroups
Atom%
(eV) Untreated 15 s 30 s 60 s 90 s VTMS þ30 s
285.0 CeH, CeC 100 56.23 54.86 50.70 41.36 94.30286.3 CeOH, CeOeC e 27.68 20.09 26.28 22.85 5.00287.2 C]O, OeCeO e 8.68 14.84 12.55 22.06 0.60288.7 OeC¼O e 6.14 6.07 6.22 6.72 e
290.1 Oe(C]O)eO e 1.26 4.12 4.88 7.02 e
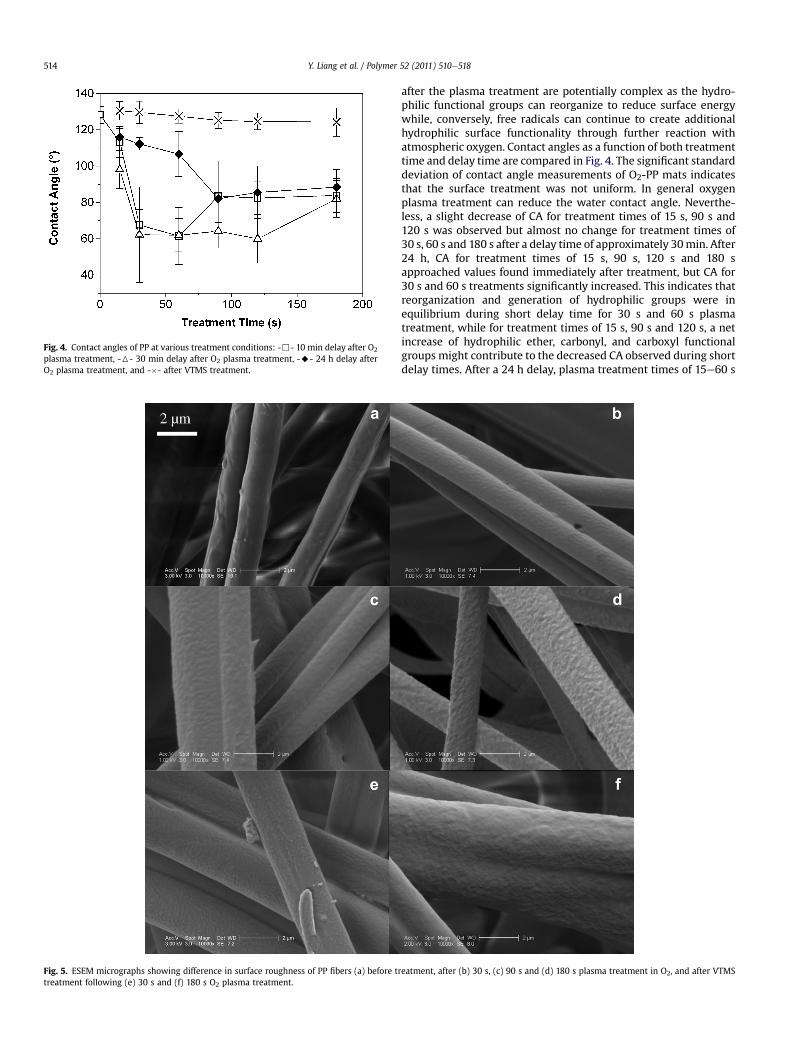
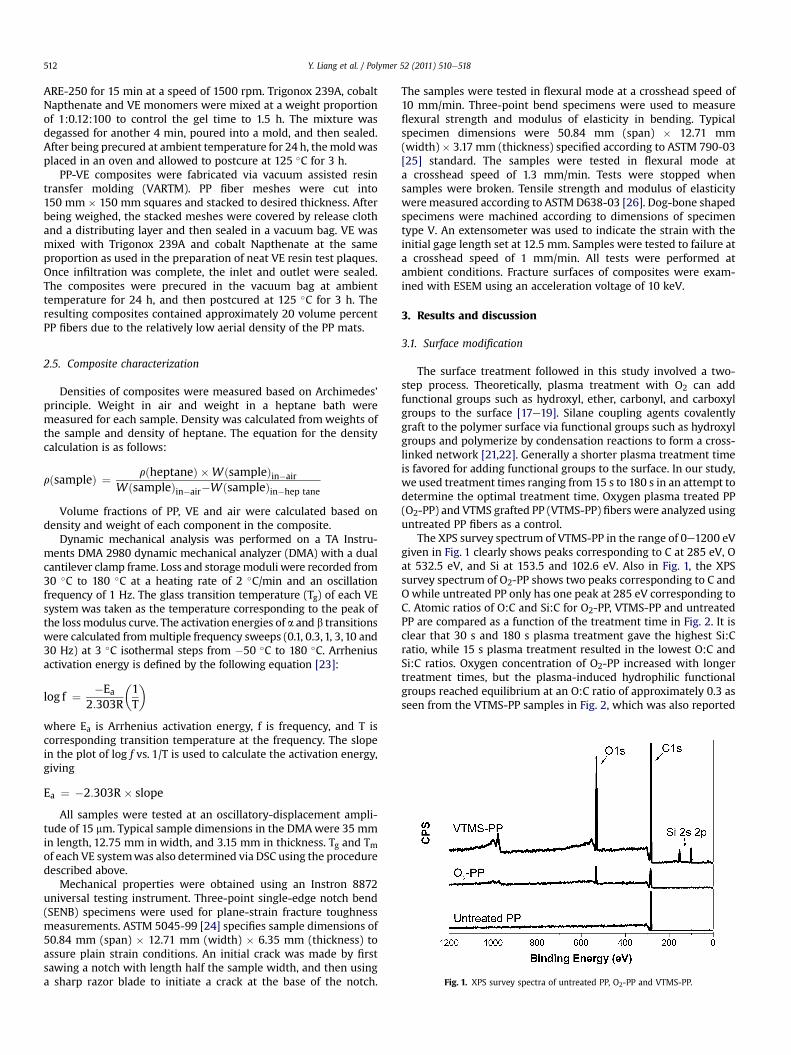
Fig. 5. ESEM micrographs showing difference in surface roughness of PP fibers (a) before ttreatment following (e) 30 s and (f) 180 s O2 plasma treatment.
Fig. 4. Contact angles of PP at various treatment conditions: -,- 10 min delay after O2
plasma treatment, -6- 30 min delay after O2 plasma treatment, -A- 24 h delay afterO2 plasma treatment, and -�- after VTMS treatment.
Y. Liang et al. / Polymer 52 (2011) 510e518514
after the plasma treatment are potentially complex as the hydro-philic functional groups can reorganize to reduce surface energywhile, conversely, free radicals can continue to create additionalhydrophilic surface functionality through further reaction withatmospheric oxygen. Contact angles as a function of both treatmenttime and delay time are compared in Fig. 4. The significant standarddeviation of contact angle measurements of O2-PP mats indicatesthat the surface treatment was not uniform. In general oxygenplasma treatment can reduce the water contact angle. Neverthe-less, a slight decrease of CA for treatment times of 15 s, 90 s and120 s was observed but almost no change for treatment times of30 s, 60 s and 180 s after a delay time of approximately 30min. After24 h, CA for treatment times of 15 s, 90 s, 120 s and 180 sapproached values found immediately after treatment, but CA for30 s and 60 s treatments significantly increased. This indicates thatreorganization and generation of hydrophilic groups were inequilibrium during short delay time for 30 s and 60 s plasmatreatment, while for treatment times of 15 s, 90 s and 120 s, a netincrease of hydrophilic ether, carbonyl, and carboxyl functionalgroups might contribute to the decreased CA observed during shortdelay times. After a 24 h delay, plasma treatment times of 15e60 s
reatment, after (b) 30 s, (c) 90 s and (d) 180 s plasma treatment in O2, and after VTMS
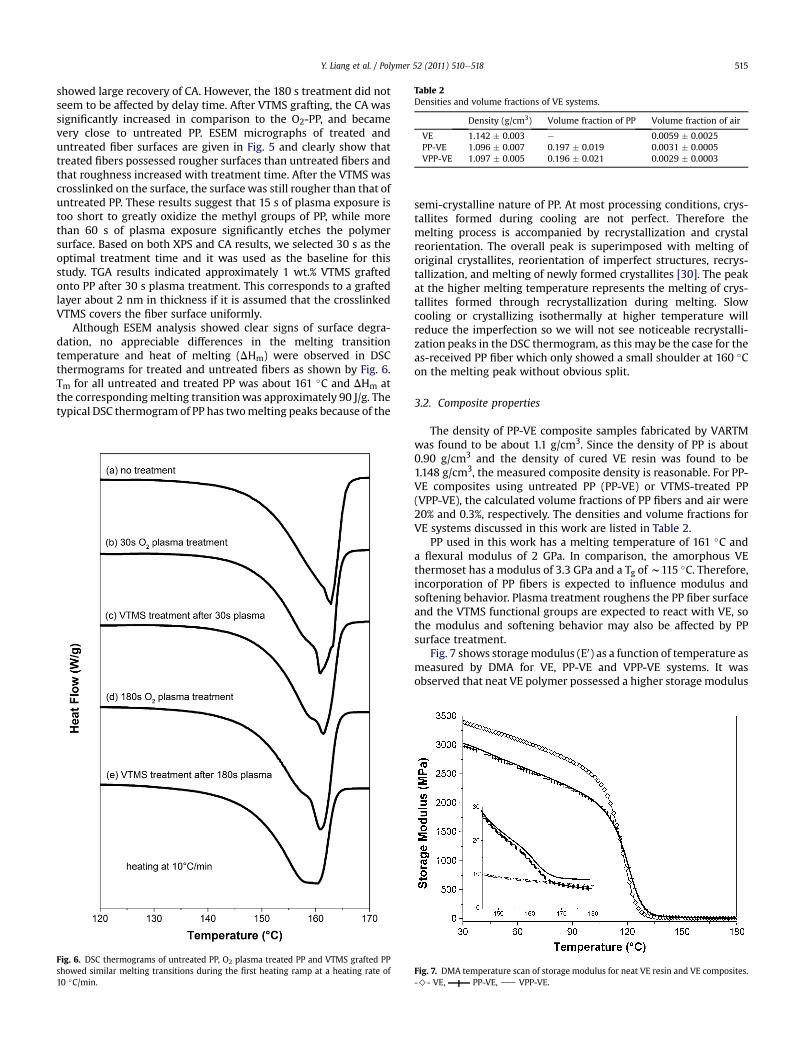
Table 2Densities and volume fractions of VE systems.
Density (g/cm3) Volume fraction of PP Volume fraction of air
VE 1.142 � 0.003 e 0.0059 � 0.0025PP-VE 1.096 � 0.007 0.197 � 0.019 0.0031 � 0.0005VPP-VE 1.097 � 0.005 0.196 � 0.021 0.0029 � 0.0003
Y. Liang et al. / Polymer 52 (2011) 510e518 515
showed large recovery of CA. However, the 180 s treatment did notseem to be affected by delay time. After VTMS grafting, the CA wassignificantly increased in comparison to the O2-PP, and becamevery close to untreated PP. ESEM micrographs of treated anduntreated fiber surfaces are given in Fig. 5 and clearly show thattreated fibers possessed rougher surfaces than untreated fibers andthat roughness increased with treatment time. After the VTMS wascrosslinked on the surface, the surface was still rougher than that ofuntreated PP. These results suggest that 15 s of plasma exposure istoo short to greatly oxidize the methyl groups of PP, while morethan 60 s of plasma exposure significantly etches the polymersurface. Based on both XPS and CA results, we selected 30 s as theoptimal treatment time and it was used as the baseline for thisstudy. TGA results indicated approximately 1 wt.% VTMS graftedonto PP after 30 s plasma treatment. This corresponds to a graftedlayer about 2 nm in thickness if it is assumed that the crosslinkedVTMS covers the fiber surface uniformly.
Although ESEM analysis showed clear signs of surface degra-dation, no appreciable differences in the melting transitiontemperature and heat of melting (DHm) were observed in DSCthermograms for treated and untreated fibers as shown by Fig. 6.Tm for all untreated and treated PP was about 161 �C and DHm atthe correspondingmelting transitionwas approximately 90 J/g. Thetypical DSC thermogram of PP has twomelting peaks because of the
Fig. 6. DSC thermograms of untreated PP, O2 plasma treated PP and VTMS grafted PPshowed similar melting transitions during the first heating ramp at a heating rate of10 �C/min.
semi-crystalline nature of PP. At most processing conditions, crys-tallites formed during cooling are not perfect. Therefore themelting process is accompanied by recrystallization and crystalreorientation. The overall peak is superimposed with melting oforiginal crystallites, reorientation of imperfect structures, recrys-tallization, and melting of newly formed crystallites [30]. The peakat the higher melting temperature represents the melting of crys-tallites formed through recrystallization during melting. Slowcooling or crystallizing isothermally at higher temperature willreduce the imperfection so we will not see noticeable recrystalli-zation peaks in the DSC thermogram, as this may be the case for theas-received PP fiber which only showed a small shoulder at 160 �Con the melting peak without obvious split.
3.2. Composite properties
The density of PP-VE composite samples fabricated by VARTMwas found to be about 1.1 g/cm3. Since the density of PP is about0.90 g/cm3 and the density of cured VE resin was found to be1.148 g/cm3, the measured composite density is reasonable. For PP-VE composites using untreated PP (PP-VE) or VTMS-treated PP(VPP-VE), the calculated volume fractions of PP fibers and air were20% and 0.3%, respectively. The densities and volume fractions forVE systems discussed in this work are listed in Table 2.
PP used in this work has a melting temperature of 161 �C anda flexural modulus of 2 GPa. In comparison, the amorphous VEthermoset has a modulus of 3.3 GPa and a Tg ofw115 �C. Therefore,incorporation of PP fibers is expected to influence modulus andsoftening behavior. Plasma treatment roughens the PP fiber surfaceand the VTMS functional groups are expected to react with VE, sothe modulus and softening behavior may also be affected by PPsurface treatment.
Fig. 7 shows storagemodulus (E0) as a function of temperature asmeasured by DMA for VE, PP-VE and VPP-VE systems. It wasobserved that neat VE polymer possessed a higher storagemodulus
Fig. 7. DMA temperature scan of storage modulus for neat VE resin and VE composites.->- VE, PP-VE, dd VPP-VE.
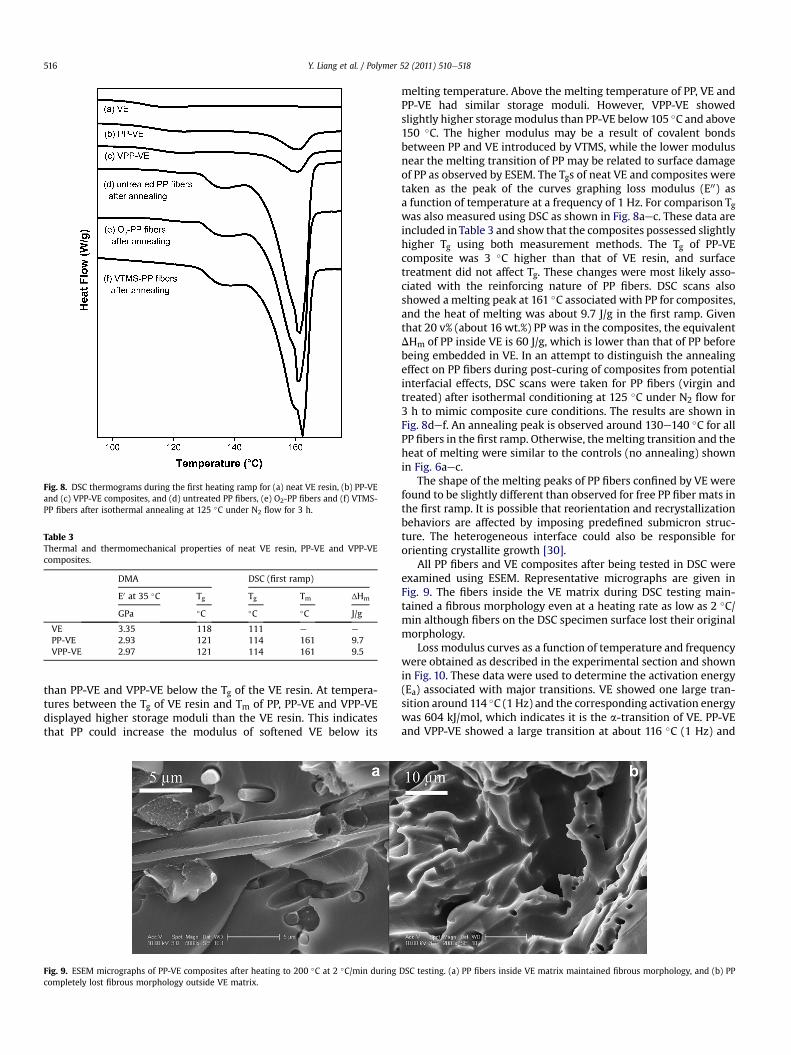
Fig. 8. DSC thermograms during the first heating ramp for (a) neat VE resin, (b) PP-VEand (c) VPP-VE composites, and (d) untreated PP fibers, (e) O2-PP fibers and (f) VTMS-PP fibers after isothermal annealing at 125 �C under N2 flow for 3 h.
Table 3Thermal and thermomechanical properties of neat VE resin, PP-VE and VPP-VEcomposites.
DMA DSC (first ramp)
E0 at 35 �C Tg Tg Tm ΔHm
GPa �C �C �C J/g
VE 3.35 118 111 e e
PP-VE 2.93 121 114 161 9.7VPP-VE 2.97 121 114 161 9.5
Y. Liang et al. / Polymer 52 (2011) 510e518516
than PP-VE and VPP-VE below the Tg of the VE resin. At tempera-tures between the Tg of VE resin and Tm of PP, PP-VE and VPP-VEdisplayed higher storage moduli than the VE resin. This indicatesthat PP could increase the modulus of softened VE below its
Fig. 9. ESEM micrographs of PP-VE composites after heating to 200 �C at 2 �C/min duringcompletely lost fibrous morphology outside VE matrix.
melting temperature. Above the melting temperature of PP, VE andPP-VE had similar storage moduli. However, VPP-VE showedslightly higher storagemodulus than PP-VE below 105 �C and above150 �C. The higher modulus may be a result of covalent bondsbetween PP and VE introduced by VTMS, while the lower modulusnear the melting transition of PP may be related to surface damageof PP as observed by ESEM. The Tgs of neat VE and composites weretaken as the peak of the curves graphing loss modulus (E00) asa function of temperature at a frequency of 1 Hz. For comparison Tgwas also measured using DSC as shown in Fig. 8aec. These data areincluded in Table 3 and show that the composites possessed slightlyhigher Tg using both measurement methods. The Tg of PP-VEcomposite was 3 �C higher than that of VE resin, and surfacetreatment did not affect Tg. These changes were most likely asso-ciated with the reinforcing nature of PP fibers. DSC scans alsoshowed a melting peak at 161 �C associated with PP for composites,and the heat of melting was about 9.7 J/g in the first ramp. Giventhat 20 v% (about 16 wt.%) PP was in the composites, the equivalentDHm of PP inside VE is 60 J/g, which is lower than that of PP beforebeing embedded in VE. In an attempt to distinguish the annealingeffect on PP fibers during post-curing of composites from potentialinterfacial effects, DSC scans were taken for PP fibers (virgin andtreated) after isothermal conditioning at 125 �C under N2 flow for3 h to mimic composite cure conditions. The results are shown inFig. 8def. An annealing peak is observed around 130e140 �C for allPP fibers in the first ramp. Otherwise, themelting transition and theheat of melting were similar to the controls (no annealing) shownin Fig. 6aec.
The shape of the melting peaks of PP fibers confined by VE werefound to be slightly different than observed for free PP fiber mats inthe first ramp. It is possible that reorientation and recrystallizationbehaviors are affected by imposing predefined submicron struc-ture. The heterogeneous interface could also be responsible fororienting crystallite growth [30].
All PP fibers and VE composites after being tested in DSC wereexamined using ESEM. Representative micrographs are given inFig. 9. The fibers inside the VE matrix during DSC testing main-tained a fibrous morphology even at a heating rate as low as 2 �C/min although fibers on the DSC specimen surface lost their originalmorphology.
Loss modulus curves as a function of temperature and frequencywere obtained as described in the experimental section and shownin Fig. 10. These data were used to determine the activation energy(Ea) associated with major transitions. VE showed one large tran-sition around 114 �C (1 Hz) and the corresponding activation energywas 604 kJ/mol, which indicates it is the a-transition of VE. PP-VEand VPP-VE showed a large transition at about 116 �C (1 Hz) and
DSC testing. (a) PP fibers inside VE matrix maintained fibrous morphology, and (b) PP

Fig. 11. ESEM micrographs of fracture surf
Fig. 10. Multiple frequency sweep of VE, PP-VE and VPP-VE. For each material, curvesshift from left to right when frequency increases from 0.1 Hz to 30 Hz.
Table 4Mechanical properties of neat VE resin, PP-VE and VPP-VE composites.
fracture Toughness flexural Properties tensile Properties
GIC KIC sfM EB sM E
J/m2 MPa$m1/2 MPa GPa MPa GPa
VE 231 � 41 1.08 � 0.15 130 � 2 3.22 � 0.07 89 � 2 3.44 � 0.13PP-VE 596 � 27 1.77 � 0.06 71 � 4 2.92 � 0.07 47 � 3 3.25 � 0.16VPP-VE 651 � 22 1.81 � 0.12 66 � 4 3.06 � 0.11 48 � 3 3.23 � 0.17
Y. Liang et al. / Polymer 52 (2011) 510e518 517
a small transition near �5 �C (1 Hz). Ea for the major transition was597 kJ/mol and that for the minor transition was 219 kJ/mol for PP-VE. Following VTMS treatment of PP, Ea of the major transitionincreased slightly to 607 kJ/mol and Ea of the minor transition at1 �C (1 Hz) increased to 271 kJ/mol. The major transition for thecomposites is attributed to the Tg of the VE matrix. Ea for the minortransitions observed for the composites are higher than 100 kJ/mol,which means that they are a-transitions of PP instead of b-transi-tions of VE [23]. This is consistent with the Tg of PP reported to be inthe range of �10e0 �C. Surface modified PP-VE composites hadhigher activation energy than untreated PP-VE composites, possiblybecause of interfacial bonding between PP and the VE matrix viathe VTMS.
The fracture toughness, tensile properties and flexural proper-ties of VE resin, PP-VE and VPP-VE composites were obtained.Critical stress intensity factor (KIC), critical strain energy release rate(GIC) at fracture initiation, tensile strength (sM), modulus of elas-ticity (E), flexural strength (sfM), and modulus of elasticity inbending (EB) are given in Table 4. The critical stress intensity factorfor PP-VE composite was about 1.6 times that of VE resin, while thecritical strain energy release rate for PP-VE composite was morethan twice that of VE resin. Thus, fracture toughness is improvedsignificantly by encapsulating PP fibrous mats in VE resin. AfterVTMS grafting on PP surface, a further increase in fracture tough-ness was observed. The difference between PP-VE and VPP-VE maybe attributed to the greater interfacial strength created by covalentbonds between VTMS-modified PP and VE resin. This better inter-face improved stress/energy transfer between fibers and matrix,and added a distinct energy absorption mechanism at the interface.The fracture morphology is discussed in the next section. Neat VEresin had higher flexural strength and modulus of elasticity thanPP-VE composites, with almost double the flexural strength of the
ace of (a, b) PP-VE and (c, d) VPP-VE.
Y. Liang et al. / Polymer 52 (2011) 510e518518
composites (Table 4). The experimentally measured flexuralmodulus of the PP-VE was approximately 2.92 GPa in comparisonto 3.22 GPa for the neat VE matrix, which was very close to a pre-dicted modulus of 2.99 GPa based on the Voigt model (upperbound) [31]. This indicated that the upper bound model of thecombining rule could fit the PP-VE system reasonably well. Theupper bound model could be applied because the moduli of bothcomponents were of similar magnitude, i.e. 3.22 GPa for the VE and2 GPa for the PP, and the stiffer phase occupied over 80 v% in thecomposites [31]. The predicted modulus of 2.99 GPa for VPP-VEusing the same model also closely matched the measured flexuralmodulus of 3.06 GPa. Nevertheless, VPP-VE composites did notshow a significant difference in flexural properties compared to PP-VE composites, possibly because of the weak nature of PP itself ePPfibers broke before the enhanced interfacial strength couldcontribute to the measured flexural strength and modulus. The useof higher strength PP fibers may attain the expected improvementin flexural properties after surface treatment. The tensile testingresults match flexural properties well.
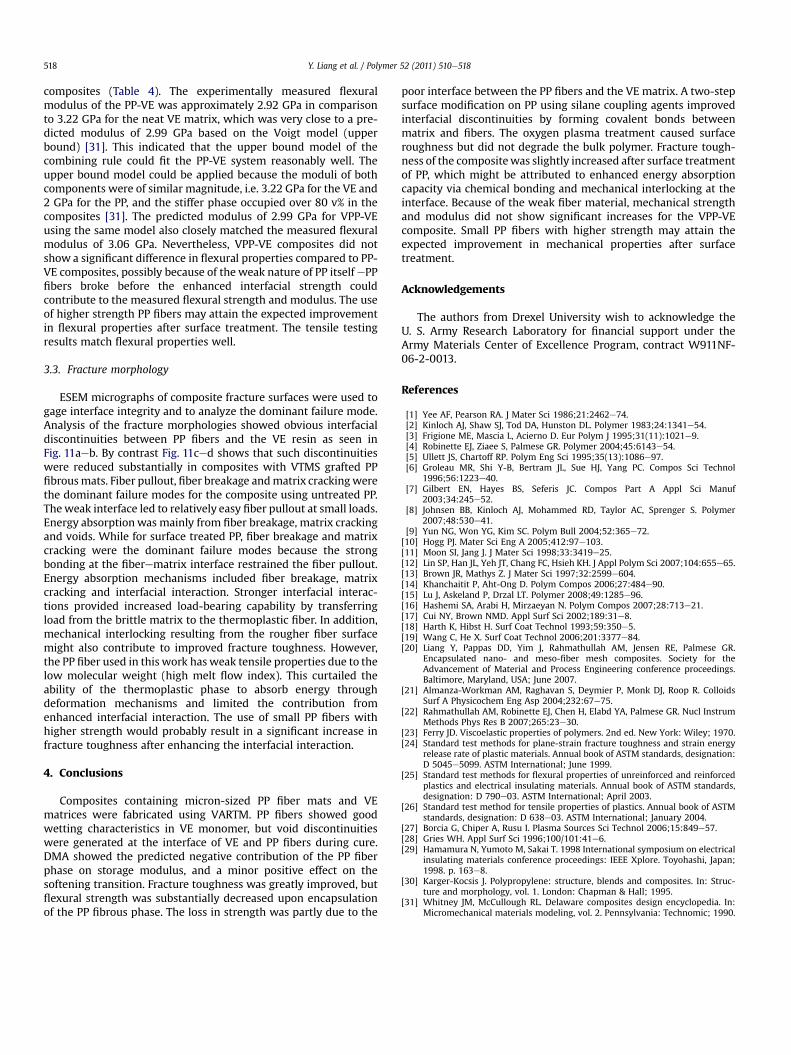
3.3. Fracture morphology
ESEM micrographs of composite fracture surfaces were used togage interface integrity and to analyze the dominant failure mode.Analysis of the fracture morphologies showed obvious interfacialdiscontinuities between PP fibers and the VE resin as seen inFig. 11aeb. By contrast Fig. 11ced shows that such discontinuitieswere reduced substantially in composites with VTMS grafted PPfibrousmats. Fiber pullout, fiber breakage andmatrix crackingwerethe dominant failure modes for the composite using untreated PP.Theweak interface led to relatively easy fiber pullout at small loads.Energy absorptionwas mainly from fiber breakage, matrix crackingand voids. While for surface treated PP, fiber breakage and matrixcracking were the dominant failure modes because the strongbonding at the fiberematrix interface restrained the fiber pullout.Energy absorption mechanisms included fiber breakage, matrixcracking and interfacial interaction. Stronger interfacial interac-tions provided increased load-bearing capability by transferringload from the brittle matrix to the thermoplastic fiber. In addition,mechanical interlocking resulting from the rougher fiber surfacemight also contribute to improved fracture toughness. However,the PP fiber used in this work has weak tensile properties due to thelow molecular weight (high melt flow index). This curtailed theability of the thermoplastic phase to absorb energy throughdeformation mechanisms and limited the contribution fromenhanced interfacial interaction. The use of small PP fibers withhigher strength would probably result in a significant increase infracture toughness after enhancing the interfacial interaction.
4. Conclusions
Composites containing micron-sized PP fiber mats and VEmatrices were fabricated using VARTM. PP fibers showed goodwetting characteristics in VE monomer, but void discontinuitieswere generated at the interface of VE and PP fibers during cure.DMA showed the predicted negative contribution of the PP fiberphase on storage modulus, and a minor positive effect on thesoftening transition. Fracture toughness was greatly improved, butflexural strength was substantially decreased upon encapsulationof the PP fibrous phase. The loss in strength was partly due to the
poor interface between the PP fibers and the VE matrix. A two-stepsurface modification on PP using silane coupling agents improvedinterfacial discontinuities by forming covalent bonds betweenmatrix and fibers. The oxygen plasma treatment caused surfaceroughness but did not degrade the bulk polymer. Fracture tough-ness of the compositewas slightly increased after surface treatmentof PP, which might be attributed to enhanced energy absorptioncapacity via chemical bonding and mechanical interlocking at theinterface. Because of the weak fiber material, mechanical strengthand modulus did not show significant increases for the VPP-VEcomposite. Small PP fibers with higher strength may attain theexpected improvement in mechanical properties after surfacetreatment.
Acknowledgements
The authors from Drexel University wish to acknowledge theU. S. Army Research Laboratory for financial support under theArmy Materials Center of Excellence Program, contract W911NF-06-2-0013.
References
[1] Yee AF, Pearson RA. J Mater Sci 1986;21:2462e74.[2] Kinloch AJ, Shaw SJ, Tod DA, Hunston DL. Polymer 1983;24:1341e54.[3] Frigione ME, Mascia L, Acierno D. Eur Polym J 1995;31(11):1021e9.[4] Robinette EJ, Ziaee S, Palmese GR. Polymer 2004;45:6143e54.[5] Ullett JS, Chartoff RP. Polym Eng Sci 1995;35(13):1086e97.[6] Groleau MR, Shi Y-B, Bertram JL, Sue HJ, Yang PC. Compos Sci Technol
1996;56:1223e40.[7] Gilbert EN, Hayes BS, Seferis JC. Compos Part A Appl Sci Manuf
2003;34:245e52.[8] Johnsen BB, Kinloch AJ, Mohammed RD, Taylor AC, Sprenger S. Polymer
2007;48:530e41.[9] Yun NG, Won YG, Kim SC. Polym Bull 2004;52:365e72.
[10] Hogg PJ. Mater Sci Eng A 2005;412:97e103.[11] Moon SI, Jang J. J Mater Sci 1998;33:3419e25.[12] Lin SP, Han JL, Yeh JT, Chang FC, Hsieh KH. J Appl Polym Sci 2007;104:655e65.[13] Brown JR, Mathys Z. J Mater Sci 1997;32:2599e604.[14] Khanchaitit P, Aht-Ong D. Polym Compos 2006;27:484e90.[15] Lu J, Askeland P, Drzal LT. Polymer 2008;49:1285e96.[16] Hashemi SA, Arabi H, Mirzaeyan N. Polym Compos 2007;28:713e21.[17] Cui NY, Brown NMD. Appl Surf Sci 2002;189:31e8.[18] Harth K, Hibst H. Surf Coat Technol 1993;59:350e5.[19] Wang C, He X. Surf Coat Technol 2006;201:3377e84.[20] Liang Y, Pappas DD, Yim J, Rahmathullah AM, Jensen RE, Palmese GR.
Encapsulated nano- and meso-fiber mesh composites. Society for theAdvancement of Material and Process Engineering conference proceedings.Baltimore, Maryland, USA; June 2007.
[21] Almanza-Workman AM, Raghavan S, Deymier P, Monk DJ, Roop R. ColloidsSurf A Physicochem Eng Asp 2004;232:67e75.
[22] Rahmathullah AM, Robinette EJ, Chen H, Elabd YA, Palmese GR. Nucl InstrumMethods Phys Res B 2007;265:23e30.
[23] Ferry JD. Viscoelastic properties of polymers. 2nd ed. New York: Wiley; 1970.[24] Standard test methods for plane-strain fracture toughness and strain energy
release rate of plastic materials. Annual book of ASTM standards, designation:D 5045e5099. ASTM International; June 1999.
[25] Standard test methods for flexural properties of unreinforced and reinforcedplastics and electrical insulating materials. Annual book of ASTM standards,designation: D 790e03. ASTM International; April 2003.
[26] Standard test method for tensile properties of plastics. Annual book of ASTMstandards, designation: D 638e03. ASTM International; January 2004.
[27] Borcia G, Chiper A, Rusu I. Plasma Sources Sci Technol 2006;15:849e57.[28] Gries WH. Appl Surf Sci 1996;100/101:41e6.[29] Hamamura N, Yumoto M, Sakai T. 1998 International symposium on electrical
insulating materials conference proceedings: IEEE Xplore. Toyohashi, Japan;1998. p. 163e8.
[30] Karger-Kocsis J. Polypropylene: structure, blends and composites. In: Struc-ture and morphology, vol. 1. London: Chapman & Hall; 1995.
[31] Whitney JM, McCullough RL. Delaware composites design encyclopedia. In:Micromechanical materials modeling, vol. 2. Pennsylvania: Technomic; 1990.
Copyright © 2022 FDOKUMEN