Size Effects in Human Visual Inspection for Micro/Meso Scale ...
71
University of Nebraska - Lincoln DigitalCommons@University of Nebraska - Lincoln Mechanical (and Materials) Engineering -- Dissertations, eses, and Student Research Mechanical & Materials Engineering, Department of Spring 1-2015 Size Effects in Human Visual Inspection for Micro/ Meso Scale Parts Sri Harsha Kavuri University of Nebraska-Lincoln, [email protected] Follow this and additional works at: hp://digitalcommons.unl.edu/mechengdiss Part of the Industrial Engineering Commons , Industrial Technology Commons , Manufacturing Commons , and the Materials Science and Engineering Commons is Article is brought to you for free and open access by the Mechanical & Materials Engineering, Department of at DigitalCommons@University of Nebraska - Lincoln. It has been accepted for inclusion in Mechanical (and Materials) Engineering -- Dissertations, eses, and Student Research by an authorized administrator of DigitalCommons@University of Nebraska - Lincoln. Kavuri, Sri Harsha, "Size Effects in Human Visual Inspection for Micro/Meso Scale Parts" (2015). Mechanical (and Materials) Engineering -- Dissertations, eses, and Student Research. 81. hp://digitalcommons.unl.edu/mechengdiss/81
-
Upload
khangminh22 -
Category
Documents
-
view
0 -
download
0
Transcript of Size Effects in Human Visual Inspection for Micro/Meso Scale ...

University of Nebraska - LincolnDigitalCommons@University of Nebraska - LincolnMechanical (and Materials) Engineering --Dissertations, Theses, and Student Research
Mechanical & Materials Engineering, Departmentof
Spring 1-2015
Size Effects in Human Visual Inspection for Micro/Meso Scale PartsSri Harsha KavuriUniversity of Nebraska-Lincoln, [email protected]
Follow this and additional works at: http://digitalcommons.unl.edu/mechengdiss
Part of the Industrial Engineering Commons, Industrial Technology Commons, ManufacturingCommons, and the Materials Science and Engineering Commons
This Article is brought to you for free and open access by the Mechanical & Materials Engineering, Department of at DigitalCommons@University ofNebraska - Lincoln. It has been accepted for inclusion in Mechanical (and Materials) Engineering -- Dissertations, Theses, and Student Research by anauthorized administrator of DigitalCommons@University of Nebraska - Lincoln.
Kavuri, Sri Harsha, "Size Effects in Human Visual Inspection for Micro/Meso Scale Parts" (2015). Mechanical (and Materials)Engineering -- Dissertations, Theses, and Student Research. 81.http://digitalcommons.unl.edu/mechengdiss/81

SIZE EFFECTS IN HUMAN VISUAL INSPECTION FOR MICRO/MESO SCALE
PARTS
By
Sri Harsha Kavuri
A THESIS
Presented to the Faculty of
The Graduate College at the University of Nebraska
In Partial Fulfillment of Requirements
For the Degree of Master of Science
Major: Mechanical Engineering and Applied Mechanics
Under the Supervision of Professor Ram Bishu
Lincoln, Nebraska
January, 2015

SIZE EFFECTS IN HUMAN VISUAL INSPECTION FOR MICRO/MESO SCALE
PARTS
Sri Harsha Kavuri, M.S.
University of Nebraska, 2015
Advisor: Ram Bishu
Visual inspection has been a major method of quality control in conventional
manufacturing processes for the last fifty years. Utilizing trained human inspectors to
perform this visual inspection has been the most effective means of maintaining quality
control. Extensive research has been performed to understand the factors that influence
the human inspection process.
In the recent years, there has been a significant emphasis on manufacturing at the smaller
end of the size-spectrum such as Micro and Meso scale manufacturing. Quality control at
becomes a challenging task due to the extremely small sizes. Several automated visual
inspection techniques have been proposed to increase inspection capability. However, the
implementation of these automated techniques requires a large capital investment which
makes it unviable for small/medium scale manufacturing companies. Human visual
inspection continues to be the major inspection method for these organizations.

Due to the extremely small sizes, some level of magnification is required to facilitate
through visual inspection. Visual aids such as microscopes, borescopes are extensively
used for this purpose. The level of magnification depends on the size and the detail of the
object being inspected. There is no established procedure to choose the level of
magnification required for a certain inspection task.
There have been no studies attempted to model the relationship between inspection time
and the level of magnification being used. Such a model would help better understand the
effective levels of magnification required for a certain inspection task. This study
attempts to model the relationship between inspection time and the level of
magnification.
A visual inspection experiment was developed with a combination of the major factors
that influenced visual inspection accuracy. This was tested on a group of sixty subjects
from two distinctive age groups in a PC based environment. The time taken for
inspection and the accuracy of responses were recorded in real-time through this
experiment.
A MANOVA and ANOVA was performed on the data obtained from the visual
inspection experiment. It was observed that magnification was not a significant factor for
the data considered for this experiment. This indicates that the above mentioned approach
may not be valid to model the relationship between inspection time and magnification.

Dedicated to my dearest Tatagaru
Your life is an inspiration and your memories will be cherished
forever

ACKOWLEDGEMENTS
This work would not have been possible without the support of several wonderful people
whose continued support inspires me to challenge myself and achieve bigger goals in life.
First and foremost, I would like to express my heartfelt gratitude to my advisor and
mentor Dr. Ram Bishu. He took me under his mentorship during a very difficult phase of
my master’s program and helped me find my way back. This work would not have been
possible without his continued guidance, support and vast knowledge of the subject. I am
also very grateful for his patience with me during the course of this work. Besides my
advisor, I would like to thank the members of my thesis committee: Dr. Lotfollah Najjar
and Dr. Solomon To, for their time and critical review of this thesis.
A big thank you to my buddies: Hariharan Arunachalam, Shiva Bhagavatula and
Vedvyas Kamarajugadda for their valuable inputs and help.
This work would be meaningless without mentioning my wonderful family. My mother
Sreedevi, father Ravi, sister Bharathi, and grandmother Annapurna. Your love and
encouragement means the world to me. I owe a special thanks to my wonderful uncles
Sekhar, Bush, Giri and their remarkable families for their continued support during times
of need.
Last but never the least; I would like to thank all my wonderful friends in Lincoln who
shared this journey with me and made my stay in Lincoln the most memorable years of
my life.

i
LIST OF CONTENTS
CHAPTER I ........................................................................................................................ 1
Development of concept ..................................................................................................... 1
1.1 Problem introduction ............................................................................................ 1
1.2 Scope of this research ........................................................................................... 2
1.3 Thesis outline ....................................................................................................... 3
CHAPTER II ....................................................................................................................... 4
Background Information ..................................................................................................... 4
2.1 Introduction to quality control .................................................................................. 4
2.1.1 Product Quality .................................................................................................. 5
2.1.2 Service Quality................................................................................................... 7
2.2 Factors affecting visual inspection in Product Quality ............................................. 8
2.2.1 Effect of age ....................................................................................................... 8
2.2.2 Effect of size ...................................................................................................... 9
2.3 Types of manufacturing .......................................................................................... 16
2.3.1 Macro manufacturing ....................................................................................... 17
2.3.2 Micro manufacturing ....................................................................................... 17
2.3.3 Meso manufacturing ........................................................................................ 18
2.4 Effect of process control in macro manufacturing .................................................. 19
2.4.1 Manual visual inspection ................................................................................. 19
2.4.2 Automated inspection techniques .................................................................... 20
2.5 Effects of process control in micro manufacturing ................................................. 22
2.5.1 Automated inspection techniques .................................................................... 23
2.5.2 Manual inspection techniques .......................................................................... 24
2.6 Summary of literature ............................................................................................. 26
ii
CHAPTER III ................................................................................................................... 27
Research Rationale............................................................................................................ 27
3.1 Concept ................................................................................................................... 27
3.1.1 Effect of magnification in visual inspection .................................................... 28
3.1.2 Development of model ..................................................................................... 29
3.1.3 Objectives ........................................................................................................ 32
3.2 Research methodology ............................................................................................ 32
CHAPTER IV ................................................................................................................... 34
Research method ............................................................................................................... 34
4.1 Creating the visual stimulus .................................................................................... 34
4.1.1 Using ‘type of defect’ as a factor ..................................................................... 34
4.1.2 Using location of defect as a factor .................................................................. 36
4.1.3 Using magnification as a factor ....................................................................... 36
4.1.4 Using density as a factor .................................................................................. 37
4.2 Creating a computer based interface to carry out the visual inspection experiment
....................................................................................................................................... 38
4.3 Compiling the data and importing it into the statistical analysis software ............. 41
CHAPTER V .................................................................................................................... 42
Results ............................................................................................................................... 42
5.1 Main effect plots for inspection time ...................................................................... 45
5.1.1 Effect of type of defect .................................................................................... 46
5.1.2 Effect of age ..................................................................................................... 47
5.2 Two-way Interaction effects for time ..................................................................... 47
5.2.1 Interaction effect between magnification and density ..................................... 48
5.3 Main effect plots for accuracy ................................................................................ 49
5.3.1 Effect of magnification .................................................................................... 50
5.3.2 Effect of Age .................................................................................................... 51
5.4 Two-way Interaction effects for accuracy .............................................................. 52
5.4.1 Interaction effect between Type of defect and Magnification ......................... 52
5.5 Results from regression analysis for magnification ................................................ 53

iii
5.5.1 Regression models for all four levels of magnification ................................... 54
Chapter VI ......................................................................................................................... 56
Conclusions and Scope for future work ............................................................................ 56
6.1 Results from ANOVA............................................................................................. 57
6.2 Results from regression........................................................................................... 58
6.3 General discussion .................................................................................................. 59
Bibliography ..................................................................................................................... 60
LIST OF TABLES
Table 5.1 MANOVA summary for multivariate tests ...................................................... 42
Table 5.2 MANOVA summary for time ........................................................................... 43
Table 5.3 Accuracy scoring system .................................................................................. 43
Table 5.4 MANOVA summary for accuracy .................................................................... 44
Table 5.5 ANOVA summary for time .............................................................................. 44
Table 5.6 ANOVA summary for accuracy ....................................................................... 45
Table 5.7 Summary of various regression models for Magnification .............................. 54
LIST OF FIGURES
Figure 4.1 Character sample with defect circled in red .................................................... 35
Figure 4.2 Real sample with defect circled in red ............................................................ 35
Figure 4.3 Screenshot of the browser based computer interface used for the study ......... 38
Figure 4.4 Screenshot of the visual inspection experiment in progress ............................ 39
Figure 4.5 Screenshot of the results screen ....................................................................... 40
Figure 5.1 Time versus type of defect .............................................................................. 46
Figure 5.2 Time versus Age .............................................................................................. 47
Figure 5.3 Two – way interaction effects between magnification and density ................ 48
Figure 5.4 Magnification versus accuracy plot ................................................................. 50
Figure 5.5 Age versus accuracy plot ................................................................................. 51
Figure 5.6 Two – way interaction effects between Type of defect and Magnification .... 52

1
CHAPTER I
Development of concept
1.1 Problem introduction
In the present day world, quality control has become vital in all walks of life. The
scope of quality control encompasses a broad range of fields. Quality is a fundamental
part of the manufacturing segment. The term ‘Product Quality’ is frequently used to refer
to the fabrication of products that meet the basic requirements desired by a customer.
Quality is also an integral part of the service sector. The term ‘Service Quality’ is
used to define a service that meets the expectations of an end user. Customer satisfaction
is the primary means to measure the quality of service.
Inspection is a very vital part of quality control in the present day macro-
manufacturing processes. Industries employ 100% inspection of their products before
they are delivered to the end customers. Human visual inspection is one of the most
popular methods of visual inspection. It has been the primary method of quality control
for last fifty years.

2
There has been extensive research done to understand the factors that affect
human visual inspection performance. Studies performed by Chan ( 2004) concluded that
linear magnification had a significant effect on target detection capability. The findings
of Gallwey (1986) indicated that an increase in task complexity neagtively affected
inspection performance. The same study also indicated that age did not play a significant
role in effecting inspection performance with an increase in task complexity.
In the last couple of decades there has been a significant emphasis on Micro/Meso
manufacutring processes. The findings of Kornel (2002) suggest that the need for
miniaturization and miniature devices has increased drastically in the last decade. Market
segments such as optics, biotechnology, medicine and avionics are some of the areas
where there is a great demand for these technologies.
The objective of this work is to study the factors that affect visual inspection for
Micro/Meso scale parts.
1.2 Scope of this research
With the increase in demand for Micro/Meso sized products, the emphasis on
quality control for micro parts has gained significant precedence. Visual inspection is one
of the primarily used quality control techniques for inspection of these parts. Many
industries rely on human inspectors for visual inspection. Due to the extremely small
sizes, the use of visual aids to magnify the micro-sized parts becomes a fundamental part
of the human visual inspection processes.

3
The primary focus of this thesis is to study magnification and predict its effect on
inspection of Micro/Meso sized parts. This study would help better understand the
effectiveness of visual aids in human visual inspection. The development of a model that
can quantify the relation between magnification and inspection performance would not
only help understand ideal levels on magnification, it would also help industries decide if
human inspection is an ideal method of visual inspection.
1.3 Thesis outline
The rest of this thesis is presented in four chapters. It begins with Chapter 2 where a
summary of published literature is provided on quality control and the quality control
techniques employed to maintain quality control. Chapter 3 provides the research
rationale, scope of the thesis and research objectives. Chapter 4 presents the research
methodology which includes details of the visual inspection experiment developed for the
sake of the thesis and how the data was obtained. Chapter 5 gives a description of the
study results. Chapter 6 gives a summary of the conclusions observed from this study.

4
CHAPTER II
Background Information
2.1 Introduction to quality control
Quality control is a concept that is difficult to define with precision. It can be
defined as a set of activities intended to ensure that quality requirements are actually
being met. Another more fundamental definition of quality control is making a product
that meets the expectations of the customer.
The emphasis on quality control began in the 13th
century in Europe when
craftsmen formed unions called “guilds” to discuss their craft. A newer model called the
“factory system” with more emphasis on the product inspection came into in 1750 and
grew during the industrial revolution. In the early 20th
century, manufacturers began to
include quality processes in quality practices. History of Quality: ASQ (n.d.)
Gilmore (1974) defined quality as conformation to specifications. Juran (1988)
defined quality as “fitness for use”. Taguchi (1986) defined it as “loss imparted to the
society from the time the product is shipped”. Parasuraman (1985) defined it as “meeting
and/or exceeding the customer expectations”. Cooper (2002) defined quality as “the
degree to which a process, product or service satisfies a specified set of attributes or
requirements”. Feigenbaum (1982) described quality as "the single most important force
leading to the economic growth of companies in international markets". American
Society for Quality (n.d.) defines quality control as “The observation techniques and
activities used to fulfill requirements for quality”

5
Quality can be broadly classified into two major categories:
1. Product Quality
2. Service Quality
2.1.1 Product Quality
The Business Dictionary (n.d.) defines product quality as “The group of features
and characteristics of a saleable good which determine its desirability and which can be
controlled by a manufacturer to meet certain basic requirements"
The critical parameters that define product quality may vary depending on the
type of product. In an automobile manufacturing setting, the performance and safety of a
component are important parameters that determine the quality of the product. For a
company that makes medical devices, safety for the patients and ease of use for the
physicians are the vital parameters. When there is a big deviation between the product
specifications and the predetermined standards it can be said that the product is of inferior
quality.
Product quality can be measured by the degree of conformance to the
predetermined standards and specifications. These measurements can be done by a broad
range of inspection methods. As mentioned in the previous section, visual inspection is
one of the major inspection methods used to measure product quality.

6
Therefore, it is critical to ensure that all manufactured parts conform to the
specifications set according to the customer requirements. To make sure that the parts
are manufactured according to the predetermined specifications, organizations have to
make sure that the manufacturing process is under control. This makes process control a
very important part of product quality control.
2.1.1.1 Process quality control
Statistical process control (SPC) is the application of statistical techniques to
determine if the outputs of a process conform to the target product or service models.
SPC is applied in order to monitor and control a process which ensures that it operates at
its full potential. At its full potential, the process can make as much conforming product
as possible with a minimum (if not an elimination) of waste. An important module in
SPC is using control charts: tools that indicate if an ongoing process is in a state of
statistical control.

7
2.1.2 Service Quality
Service quality can be defined as an assessment of how well a delivered service
conforms to a client’s expectations. Assessment of service quality is important for service
business operators as it is important for them to assess the quality of service being
provided to their customers and to improve their service, to quickly identify problems,
and to better assess client satisfaction.
Freund (1985) stated “the characteristics of a product or service that bear on its
ability to satisfy stated or implied needs”. Parasuraman et al (1988) did a study in which
tried to quantify the major factors which determined service quality. The five major
factors they identified were: tangibles, reliability, responsiveness, assurance and
empathy. Chakrapani (1998) developed a service quality model consisting of three
dimensions: aspects of the product/service, dependability and exceeding expectations.
Service quality can be classified into two categories: Hard and Soft. Hard
measures are objective. They can be laptop downtime or fraction of phone calls
answered. Soft measures are based on subjective and intangible measures. Customer
satisfaction with a particular speed of service is a good example of soft quality measures.
The focus of this study is on product quality and the use of visual inspection as a
means to measure the degree of conformance. In the following sections, background
researches on the factors that affect visual inspection are discussed in detail.
8
2.2 Factors affecting visual inspection in Product Quality
Defects are a common occurrence when manufacturing of various components is
done. Visual inspection is one of the major methods employed to maintain quality
control.
Visual inspection can be a process that is either manual such as inspection of a
product for defects using the human eye, or automated, which includes the use of
machine vision systems or computer based algorithms to identify the defects in a product.
In the following sections, there will be a detailed discussion about factors that affect
manual inspection.
2.2.1 Effect of age
In a study carried out by Gallwey et al (1986), the visual search performance was
tested on an inspection task to understand how increase in complexity impacts the
performance. For this study, two distinct subject categories were considered. One set
included industry quality control personnel and the second set included students. The test
complexity was increased by increasing the number of different fault types. The numbers
of fault types used were varied between two, four or six faults to increase complexity.
The other means of increasing test complexity was by varying where the faults occurred.
Some of the items had faults located only in one sub-area whereas others had faults
distributed all through the test. It was concluded from their study that the increase in
number of faults had a very significant impact on the performance.

9
The inspector performance decreased with an increase in the number of fault
types. It was also concluded that limiting the faults to one sub-area or spreading them
across the entire item did not impact performance. The performance did not vary
significantly between the two categories of subjects considered for the experiment.
2.2.2 Effect of size
Size is an important factor that has a significant effect on visual inspection
performance in manual visual inspection. Increasing/decreasing the size of the object
being inspected affects the time taken and the accuracy of inspection. In the case of visual
inspection where visual aids are used, magnification is used as one of the major methods
to control size. In the following sub-sections, the background literature on effects of
magnification in manual visual inspection is discussed.
2.2.2.1 Magnification effect in manufacturing processes
Nayyar (1963) investigated the effects of magnification on the duration of
elements of a subminiature assembly operation. The task consisted of grasping a metal
dot with tweezers, transporting it to a hole, and dropping it into the hole. A binocular type
industrial microscope was used for performing the task under three levels of
magnification. Precision of the task was varied by changing the diameter of the hole into
which the dot was assembled.

10
Results indicated that no single magnification was optimum for all elements.
There was no evidence that the optimum magnification is dependent upon the precision
requirements of the task.
Wei (1978) examined the effect of lighting and low power magnification on
inspection performance. Ten subjects tried to identify c's (defects) in a matrix of 0's (good
items) with five letter sizes, three magnification levels (none, 2x and 4x) and three
illumination levels (1100, 2200 and 4400 lux). Using time as the criterion, when the
target gap was larger than 2.5 min of arc, no magnification was best; below 2.5, 4x was
best. Using errors as a criterion, no magnification was best for gaps larger than 2.5 min of
arc; below 2.5, 4x was best. Illumination had no effect on errors.
A study performed by Drury (2002) mentions the use of magnifying instruments
such as microscopes and borescopes as an integral part of the visual inspection process.
This paper mentions the distance between the lens and the surface being inspected as a
major factor that affects detection rate. Ideal lens to surface distances reduce field of
vision and increase inspection times.
Chan (2004) studied the effect of four levels of linear magnification (no scaling,
1.3 times scaling, 1.69 times scaling and 2.2 times scaling) on detection of peripheral
visual targets on four axes. Performance was measured by the linear dimensions of the
sensitivity limit on a meridian (in degrees) and by the number of locations at which
targets were correctly detected within the sensitivity limits on each axis.
11
The sensitivity limit was defined as the farthest eccentricity at which 50% correct
target detection was achieved. It was concluded from the experiment that detection
performance with scaled stimuli was better than performance with non-scaled stimuli
which was shown by the increase in sensitivity limits with the increase in scaling.
However, enlarging object size at central locations to the same degree as those in the
periphery yielded little benefit under the conditions of the experiment.
In another study performed by Chan (2006) two experiments on the detection of
peripheral visual targets were conducted. The first experiment was on non-linear and the
second experiment on linear magnification. In the first experiment, two levels of non-
linear scaling were compared with non-scaling. Performance with scaled stimuli was
better than that with non-scaled stimuli, on each of the four axes tested. An unexpected
decline in performance was found at the least eccentric target location for the highest
level of scaling.
The second experiment investigated the effect of four levels of linear
magnification and found that performance with scaled stimuli was better than
performance with non-scaled stimuli. However, linear scaling of objects at central
locations to the same degree as those in the periphery yielded little benefit here.
Both linear and non-linear magnification facilitated peripheral target detection
performance but, perhaps because of the effects of lateral masking, neither linear nor
non-linear magnifications seem to compensate completely for performance decrement
with eccentricity.

12
It was suggested that enlarging both the objects and the inter-object spacing in
practical industrial inspection situations must involve a trade-off between the number of
objects in the viewing area and the scaling level to attain acceptable performance with
least magnification.
Lee (2009) investigated the effectiveness of the novel differential linear and
differential nonlinear magnification methods, and the effects of magnifier shape and
magnification power on visual search performance. With the differential magnification,
objects that were more peripheral were scaled at a level higher than those in the vicinity
of fixation. It was hypothesized that the differential magnification methods would
enhance magnification effectiveness and thereby improves inspection performance. It
was also hypothesized that for the same area of magnified view, an elliptical magnifier
would be more effective than a circular one. The results showed that 4x magnifications
increased the overall inspection time as compared with 3x magnifications, suggesting that
a trade-off might have occurred between magnification and field size.
Nakajima (2013) examined the inspection times that affected defect detection in
visual inspection utilizing peripheral vision. The fixation duration and the distance
between defect and the fixation point are experimental factors in determining the
inspection time. It was observed that the main factor that affected the defect detection
rate in the visual inspection was the size of the defect. This effect was found to reduce in
the order of the distance between the fixation point and the defect, and the fixation
duration.

13
In case of a large sized defect, the detection rate is high regardless of the fixation
duration and the distance between the defect and the fixation point. In case of a small
sized defect, when the fixation duration is longer and the distance between the defect and
the fixation point is closer, the defect detection rate is higher.
2.2.2.2 Magnification effects in health care
Sellors et al (2004) evaluated the use of a hand held magnifying device as an
alternative to naked eye visual inspection with acetic acid. An analysis was carried out to
study the reproducibility and clinical accuracy of the magnification device. Using the
findings, the feasibility of increasing the performance and reducing the cost of a hand-
held scope was examined. It was found the hand-held scope had a slightly higher
sensitivity than naked eye visual inspection with acetic acid (60.7 versus 55.7%, P <
0.05) without loss of specificity. The availability of improved materials for optics and
illumination suggests that a hand-held scope with enhanced performance is feasible.
Perker et al (2009) evaluated the efficiency of operating microscopes compared
with unaided visual examination and intraoral radiography for proximal caries detection.
The study was based on 48 extracted human posterior permanent teeth. The teeth were
examined with unaided visual examination, operating microscope, and conventional and
digital intraoral radiographs. The efficiency of the operating microscope was found to be
statistically equal with unaided visual examination, and lower than radiographic systems
for proximal caries detection.

14
Fabbro (2010) compared endodontic therapy performed using magnifying loupes,
surgical microscopes and endoscopes. Three prospective studies were included, all
dealing with endodontic surgery. From the results of these studies it was observed that
there was no significant difference in outcomes found among patients treated using
magnifying loupes, surgical microscopes or endoscopes. It was concluded that the type of
magnification device can only minimally affect the treatment outcome.
Bernstein (2013) reviewed the quality of cadaveric digital nerve repairs using
either loupe or microscopic magnification. Ninety cadaveric digital nerve repairs were
performed by nine hand surgeons using loupe or microscopic magnification and
evaluated by a visual grading scale. Univariate and multivariate analyses were used to
evaluate repairs. Six publications involving 130 repairs with loupes (4–6x) and 255
repairs with microscopes were examined. The surgeon, level of training, repair time, and
stitches per repair were not significantly related to an excellent repair.
It was concluded from the study that microscope use produces superior quality
digital nerve repair. Approximately half of hand surgeons use loupes in current practice,
mostly at low magnification (2.5–3.5x). In this context, a higher level of magnification
may be positively correlated with better clinical outcomes.

15
Kielbassa (2006) evaluated the cavitation rate of proximal caries using different
magnification aids in vitro. Radiographs of 285 extracted teeth were taken and the
proximal surfaces were graded to the criteria R0 (no radiolucency), R1 (radiolucency
confined to the outer half of enamel), R2 (inner half of enamel) and R3 (outer half of
dentin). Subsequently, the proximal surfaces were checked for the presence of cavitations
with the naked eye (NE), and by using 4.3x magnification eyeglasses (ME), a stereo
microscope (SM, 10x), or a scanning electron microscope (SEM, up to 2000x
magnification).
It was concluded that a simple visual examination of the surface is not considered
appropriate to detect the slightest surface breakdown of caries lesions even under
laboratory conditions. Therefore, in particular with lesion sites which are directly
accessible, magnification aids should be used in clinical observations for the detection of
proximal cavitation.
Studies from the health care industry were reviewed in this section. It can be
observed that magnification in general plays a beneficial role in visual inspection for the
health care industry.

16
2.3 Types of manufacturing
Manufacturing can be defined as the process of converting raw materials,
components or parts into finished goods that meet customer expectations and a required
set of specifications.
Emphasis on manufacturing and manufacturing industries started growing in the
18th
and 19th
centuries with the Industrial Revolution. It began in Britain, replacing labor
intensive textile production with mechanization and use of fossil fuels. Manufacturing
industries can be classified into broad categories depending on the application.
Engineering industries, chemical industries, energy industries, plastics and
telecommunication industries are some of the examples of manufacturing industries.
There are several processes used for manufacturing of parts. Casting, molding,
forming, machining, joining and rapid machining are some of the conventionally used
techniques in manufacturing.
According to a study carried out by Vollertsena et al (2009) on manufacturing of
metallic components, the size of the part plays an important role for the process behavior.
These size effects lead to changes in process behavior for Micro/Meso scale
manufacturing.

17
Manufacturing processes can be classified into three major distinct categories based on
the size.
1. Macro manufacturing
2. Micro manufacturing
3. Meso manufacturing
2.3.1 Macro manufacturing
Traditional manufacturing processes such as casting, molding, machining fall
under this category. Macro manufacturing involves the manufacturing of components that
are visible to the naked eye and that can be touched or handled by humans without the
necessity of any magnification instruments. Examples of products made using macro
manufacturing include various things that we use in our day to day life.
2.3.2 Micro manufacturing
According to Francesco et al (2011), micro manufacturing can be defined as the
process of fabricating miniature structures in the order of micrometers and smaller. The
manufacture of these miniature parts and devices has been a growing field in the recent
past. The increased demand for these parts primarily in the biomedical, microelectronics
and telecommunications sector has brought in a huge influx of micro sized parts into the
industry.

18
For conventional usage, most of the parts that cannot be produced by
conventional means such as milling, drilling, turning, and grinding are in the Micro/Meso
size area. As the size of the manufactured parts further decreases, conventional
manufacturing techniques become obsolete for use and more specialized manufacturing
techniques are needed.
2.3.3 Meso manufacturing
Meso in physics means a scale between the micro and nano levels. The sizes
manufactured under meso may range between 100 nanometers to 1000 nanometers.
Hence meso manufacturing is an extension of micro manufacturing at smaller sizes.
According to a study carried out by Vittorio (2001) the development of
Microelectromechanical systems (MEMS) has played a major role in the increase of the
number of parts that are being manufactured on the Micro/Meso scale.
Microelectromechanical systems (MEMS) are small integrated devices or systems that
combine electrical and mechanical components. They range in size from the sub
micrometer (or sub-micron) level to the millimeter level. MEMS extend the fabrication
techniques developed for the integrated circuit industry to add mechanical elements such
as beams, gears, diaphragms, and springs to devices.

19
The development of machines with suitable motion control and accuracy for the
micro manufacturing processes and lack of efficient process control measures are some of
the challenges that are being faced in the development of Micro/Meso scale products.
From a quality control point of view, the inspection techniques used for meso scale parts
fall under the same spectrum as the micro inspected parts. Hence they are not discussed
separately for this study.
2.4 Effect of process control in macro manufacturing
As mentioned earlier, visual inspection is one of the major quality control
techniques used in process control for manufacturing processes. Visual inspection can be
classified into manual visual inspection and automated visual inspection. The background
research on the various factors that affect manual visual inspection were discussed.
In this section, the various manual and automated visual inspection techniques are
discussed.
2.4.1 Manual visual inspection
Manual visual Inspection, used in maintenance can be defined as inspection of
equipment and structures using either or all of the human senses such as vision, hearing,
touch and smell and/or any non-specialized inspection equipment. It can also be defined
as a routine stage of a finishing operation that involves closely examining a part with the
naked eye immediately following its production to check for defects.

20
In a paper published by Drury (2002), manual visual inspection was defined as the
process of using the unaided eye, alone or in conjunction with visual aids, as the sensing
mechanism from which judgments were made about a unit being inspected. It is the
primary inspection method used in aircraft maintenance. These tests generally cover a
broad area of the aircraft structure. More detailed (small area) tests were conducted using
optically aided visual methods. Such tests included the use of magnifiers and borescopes.
2.4.2 Automated inspection techniques
It has been established that visual inspection is an important quality control
technique used by several industries to accept or reject manufactured product. In the
previous sections, manual visual inspection was discussed as a quality control technique.
The various factors that affect inspection performance were discussed along with some
studies that were aimed at improving the performance of the human inspectors.
Automated visual inspection systems have been explored as alternatives to human visual
inspection.
Automated visual inspection refers to the use of computers and other auxiliary
equipment to accomplish what was previously done using human visual inspection. These
techniques are based on the perceived two-dimensional images of real time three-
dimensional images.

21
The components of a conventional automated visual inspection system include a
light source, optical systems, a CCD camera, an image acquisition device, and an image
processing system. Image processing, precision measurement, pattern recognition and
artificial intelligence are some of the major techniques used for automated visual
inspection.
These techniques have found extensive applications in the electronics industry
particularly in the inspection of printed circuit boards and integrated circuit chips. Some
specialized techniques have also found applications in industries such as automobile,
packaging and textile industries.
A reseach paper published by Resendiz (2013) describes a computer vision
system for automated visual inspection of railroad tracks. This eliminates the laborious
and time consuming process of a human inspector inspecting thousands of miles of
railroad track twice a week.
The system consists of a track cart with a mini computer system, a power source
mounted on the top, and a camera mounted over the side of the truck cart which fetches
images of the lateral view and the over-the-rail views of the track. Using an algorithm
that utilizes the periodic manner in which the track components repeat, an inspection
video is developed. A test run of this automated system showed that it was 87% accurate
in identifying the defects in the track components.

22
2.5 Effects of process control in micro manufacturing
Micro manufacturing processes require special technology and most of the
conventionally used macro manufacturing techniques are usually not very compatible
with the micro manufacturing methods. With the drastic reduction in part sizes, part
handling and monitoring takes on a new significance as well. Most of the conventional
measurement systems used for inspection of macro parts no longer work.
As it is a major part of all kinds of manufacturing processes, quality control is an
important aspect of micro-manufacturing. There have been various quality control
techniques that are being used to make sure that the manufactured parts meet the required
quality standards. As discussed in the case of macro manufacturing techniques, visual
inspection is an important quality control technique used in the manufacture of micro
parts.
Visual inspection in micro manufacturing is done to assess quality in several
ways: to inspect the surface quality of the manufactured components, to check for
alignment and other dimensionally incorrect features, and to make sure any labels or
warning signs are placed according to specifications. This visual inspection can be done
either manually or by using automated inspection techniques. In the following sub-
sections, the automated and manual visual inspection techniques used in micro
manufacturing will be discussed in detail.

23
2.5.1 Automated inspection techniques
Various automated computer based vision systems have been proposed to do
inspection of these parts.
Sun et al (1992) describe image subtraction as one of the earliest methods to
conduct automated inspection of micro components, especially in Printed Circuit Boards
(PCB) inspection. It is simple and straight-forward to understand. The board to be
inspected is scanned and is compared against the image of an ideal part. The subtracted
image can be displayed and analyzed for defects.
Scholz-Reiter et al (2010) proposed an automated visual inspection system for use
in inspection of micro-manufactured components. This technique uses confocal laser
scanning microscopy to obtain high-resolution 3D images of the object being inspected.
These images are processed by an algorithm which is programmed to extract surface
defect information. The surface defects are classified using decision trees. There was no
information on how this method works in a practical inspection situation.
Duan et al (2008) proposed an Automatic Optical Inspection (AOI) system for the
inspection of micro-drill bits used in the manufacture of printed circuit boards. It uses an
image registration technique to align the drill bit blade image automatically, which
ensures the quality of the printed circuit board.

24
Garcia et al (2006) proposed a methodology for automated visual inspection of
micro-manufactured parts, where the features to be inspected are selected automatically
using an automated visual inspection system. A multivariate stepwise discriminant
analysis was used in order to automate the feature selection process.
This type of system allows for the automation of the time-consuming task of
exploring and selecting features for which algorithms need to be developed for automated
visual inspection systems. This feature would be helpful in adapting pre-existing systems
for inspection of new components. There was no information presented about testing this
system in a practical visual inspection situation.
2.5.2 Manual inspection techniques
Manual visual inspection is an integral part of inspection of micro-level parts.
These techniques mostly involve the use of visual aids such as magnifying glasses and
borescopes. Drury (2002) mentioned the use of microscopes for the inspection of small
parts and equipment during aircraft inspection during maintainence.
A study performed by Melchore (2011) indicated that manual visual inspection is
an integral part of pharmaceutical manufacutring. Human inspectors are used extensively
to inspect for proper form and detection in syringes. Magnification is used to aid the
inspection process. It is also used in the inspection of pharmaceutical labels on bottles to
detect mislableling, blemishes and proper closure.

25
Human visual inspection is also a major part of inspection in Printed Circuit
Boards (PCB). Although there are several automated inspection techniques currently
avaliable on the market for PCB inspection, many small industries continue to use
manual visual inspection. A white paper study conducted by JH Technologies (2010)
discussed the major factors that are inspected are as follows:
1. Presence and absence of components: To verify the presence of the actual
components and ensure that the right components are being used
2. Solder joint quality: The major factors of consideration are to verify if there is
enough solder and to verify if the solder joint is good enough for proper
functionality
Magnification is an important component of such manual inspection.
Magnifications typically used for this kind of inspection vary from 2x to 4x. Various
microscopes are used for the inspection depending on size of work area and the actual
size of the PCB being inspected.

26
2.6 Summary of literature
This chapter began with an introduction to the concept of quality control. A brief
history was followed by definitions of quality control from various research papers and
organizations. The major categories of quality control were defined and discussed in
detail.
Following the discussion on quality control, visual inspection was discussed as
one of the major methods of quality control. The back ground literatures on the various
factors that affect visual inspection were discussed. Following this, the different types of
manufacturing based on size of the object were discussed. Next, the process control for
these various manufacturing techniques using visual inspection was discussed.

27
CHAPTER III
Research Rationale
3.1 Concept
Human visual inspection has been a popular method of quality control for the last
fifty years. There has been extensive research performed on the factors that impact
performance of a human inspector during an inspection task. Published literature over the
last few decades has identified several factors that have a significant impact on human
visual inspection for conventional macro-manufactured products. Effects of factors such
as task complexity, size and age have been studied in great detail.
Increased emphasis on Micro/Meso scale manufacturing has significantly shifted
the focus of research to understanding the factors that affect inspection at these extremely
small sizes. A number of automated inspection techniques have been developed for
inspection of these Micro/Meso scale parts. Some of these techniques have been
discussed in the previous chapter.
Although there has been considerable research done in the area of automated
visual inspection methods for micro-sized parts, there are severe limitations for their use
in small and medium scale companies due to high set up costs and inflexibility for use as
suggested in a study by Kommidi (2005).

28
A study conducted by Melchore (2011) indicated that manual inspection is
essential when the use of a fully automated system is not feasible. Manual visual
inspection is implemented as the alternative visual inspection technique when using an
automated system is not feasible. Available literature has a noticeable lack of information
on manual visual inspection for the inspection of micro-manufactured parts. There is a
need to develop models that predict the influence of factors that affect manual visual
inspection in Micro/Meso scale manufacturing.
3.1.1 Effect of magnification in visual inspection
Literature on the effect of magnification in macro manufacturing processes and
the medical industry was reviewed in the previous chapter. An overall review indicated
that increasing magnification in general played a beneficial role in increasing the
performance of the human visual inspector. Studies indicated that some levels of
magnification to be beneficial and others ineffective. It was observed that the effect of
magnification was significantly affected by the type of task being evaluated.
The optimum level of magnification required for a task varies depending on the
object that needs to be inspected. There are no established standards that help
organizations understand the optimum levels of magnification required for different sizes
of the objects. The literature review indicates that using a low level magnification yielded
the same results as using a higher level of magnification.

29
Magnification is an important factor in several studies associated with micro-
manufactured parts. The use of visual aids becomes a vital part of the manual visual
inspection processes used for Micro/Meso scale parts. These visual aids enhance the size
of the part to a size which would facilitate effective visual inspection by the human
inspector.
Microscopes, borescopes and various other hand-held devices have been designed
for these inspection purposes. Understanding the correct levels of magnification for these
objects is an important factor to be considered when using these magnification
instruments. If the magnification levels are too high, it might result in a very large surface
area which might take a longer time to inspect and increase the chance of an inspector
missing a defect. If the magnification levels are too low, it might cause a defect to escape
the inspectors’ attention.
3.1.2 Development of model
Manufacturing can be classified into three distinct levels based on the size of the
object being manufactured. Macro manufacturing in the highest level of size followed by
the lower micro and meso levels of manufacturing. Process control is an important aspect
of the manufacturing processes to enable mass production of consistent products from
continuously operated processes.

30
Visual inspection is one of the major techniques used to maintain process control
in manufacturing. Process control through visual inspection varies from one
manufacturing process to the other. For example, in case of macro manufacturing, the use
of visual aids for inspection is optional whereas in case of Micro/Meso scale
manufacturing it is almost impossible to perform inspection without the use of a visual
aid to enhance the size of the object.
It has already been mentioned that there has been a significant increase in focus
on the Micro/Meso scale manufacturing processes. Manual visual inspection is one of the
major methods of inspection for these Micro/Meso scale parts.
The size of the object being inspected becomes an important factor in the case of
manual visual inspection. Increasing/decreasing the size of the object is a vital part of
understanding the effectiveness and accuracy of visual inspection processes. A review of
literature indicated that the size effect in manual visual inspection for Micro/Meso scale
parts has not been studied in great detail.
Magnification is one of the major means to increase/decrease the size of the
objects to facilitate manual visual inspection for Micro/Meso scale parts. From the
previous sub section it was observed that magnification plays an overall beneficial role in
improving the performance of the human inspector during manual visual inspection. It
can also be stated that a lack of magnification decreases the performance of the human
inspector.

31
Time taken for inspection is another vital parameter during visual inspection in an
industrial setting. The time taken by a visual inspector for inspection is influenced by
several factors such as magnification of the object being inspected and the age of the
inspector performing the inspection task. High production volumes and low cycle times
require the inspectors to be fast and accurate with their inspection processes. Studying the
correlation between the various factors that affect inspection times of the visual inspector
would be vital for an organization to understand inspection costs and accuracy of their
inspectors.
Understanding the correlation between magnification levels and inspection times
is important to determine which levels of magnification facilitate faster inspection times.
It also helps understand if decreasing magnification increases the search time of the
human inspector. Such a correlation becomes vital for industries that employ 100%
human visual inspection of their manufactured Micro/Meso scale products.
This study is an attempt to understand how changing levels of magnification have
a significant impact on inspection times. It can be postulated that a linear model of search
time versus size effect could be used to predict inspection performance in Micro/Meso
scale manufacturing.

32
3.1.3 Objectives
Based on the needs identified during the literature review, a comprehensive visual
inspection was designed with the aim of addressing the following objectives:
1. Develop a linear model for search time and size effect to predict inspection
performance in Micro/Meso manufacturing
2. Evaluate the main factor effects and interaction effects of task complexity,
magnification and age on manual visual inspection accuracy
3.2 Research methodology
In order to develop a correlation between magnification and inspection time, data
from human visual inspectors during a real-life inspection task would be required. Since
such data is hard to obtain from organizations due to various reasons, a real life
inspection task was simulated on a PC-based environment. A visual inspection
experiment was developed with a series of images at varying levels of magnification.
These images would be similar to the images a human inspector would encounter
during a routine visual inspection task. Varying levels of task complexity were
incorporated into these images to make the experiment more realistic.

33
To understand how the various levels of magnification impacted performance,
some images were classified as defective and some were classified as non-defective. The
accuracy and time taken for inspecting the defects were recorded. To make the
experiment more realistic, other major factors which influence human visual inspection in
the review of literature such as task complexity and age were also considered.
The task complexity for this experiment was varied by changing the density of the
images created for the experiment and by using two different types of defects.
Density can be defined as the number of characters within a square unit of area. If
there are more characters in a square unit of area the image can be classified as a high
density sample. An image which has fewer characters in a square unit of area can be
classified as a low density sample. It can be observed that density is similar in concept to
magnification.

34
CHAPTER IV
Research method
As mentioned in the previous section, the method for this study was developed in
order to analyze the effect of magnification on inspection time and accuracy for
inspection of micro-manufactured parts.
A visual inspection experiment was developed with visual material that presented
a combination of all the factors except age. The task complexity for this experiment was
varied by changing types of defect, density and creating various location of defect for
each type of defect. In the following sub-sections, the various steps involved in the
development of the method are described in detail.
4.1 Creating the visual stimulus
The first step in developing the method was to create visual stimulus or samples
that presented a combination of all the four attributes described above.
4.1.1 Using ‘type of defect’ as a factor
The first factor that was considered was the ‘Type of defect’. Based on previous
studies done with human visual inspection, two types of defects were selected. All the
other factors were incorporated into the visual stimulus that was created for the type of
defect.

35
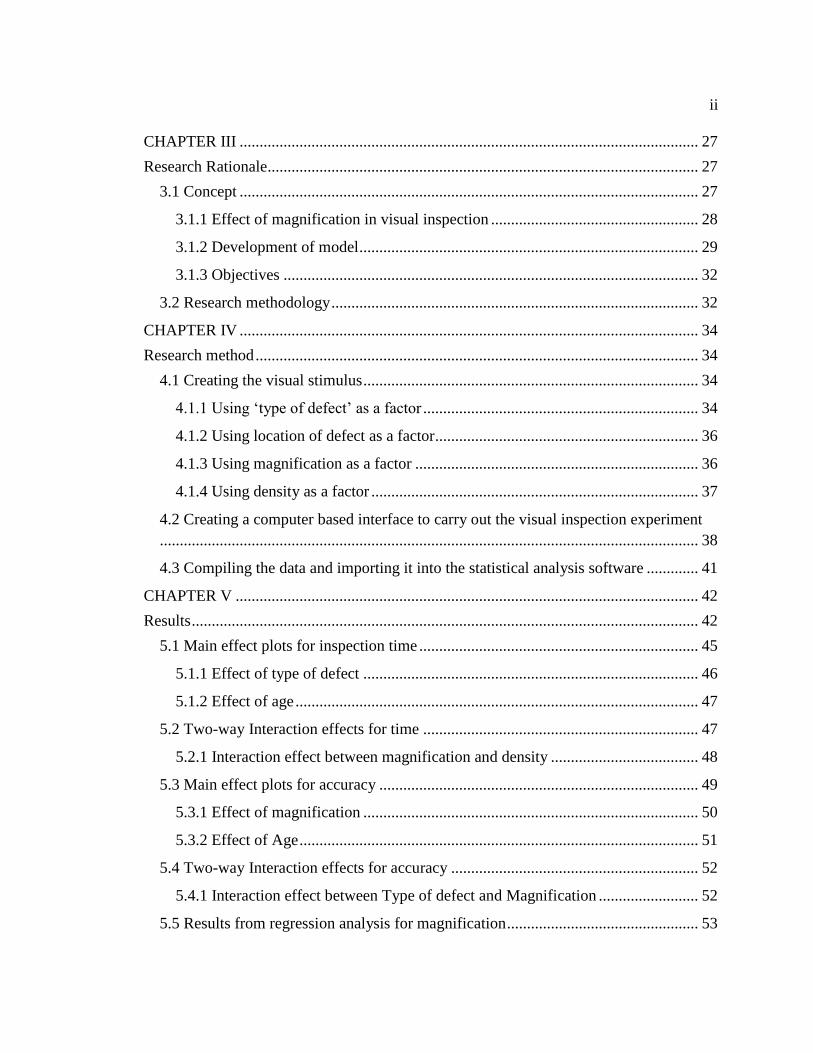
The first type of defect was a character ‘*’ which is unique among an array of
repeating special characters (@, #, $,), (, ^). A sample defective image is shown below
with the unique defective special character circled in red.
Figure 4.1 Character sample with defect circled in red
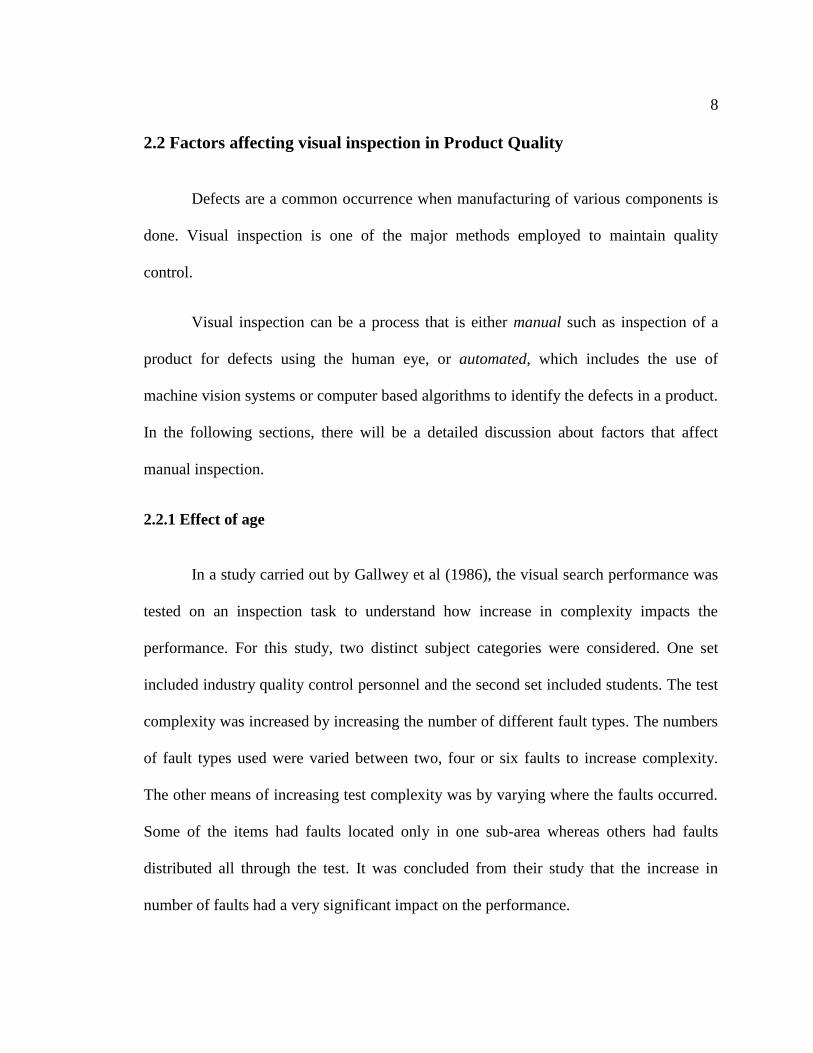
The second type of defect selected was an object seen in routine visual inspection
processes. This was termed as a ‘real sample’ and the design of a Printed Circuit Board
(PCB) was used as a ‘real sample’ for this purpose. A uniquely placed triangle in the
diagram of a printed circuit board was identified as a ‘defective’ sample. An image of a
printed circuit board with the defect circled in red is shown below.
Figure 4.2 Real sample with defect circled in red

36
4.1.2 Using location of defect as a factor
As a next step, defects in four unique locations were created for each of the type
of defects (character defect and real defect) identified in the previous sub-section. The
creation of these unique locations of defects prevents the human subjects from
memorizing the location of the defects during the visual inspection experiment.
For the sake of this experiment, the location of defects was assigned numbers
from one through eight for identification. Location of defects one through four were
identified as ‘character defects’ and location of defects four through eight were identified
as ‘real defects.’
4.1.3 Using magnification as a factor
Four levels of magnification were created for each of the location of defects. The
magnification levels used were scaled up by 100 percent, 75 percent, 50 percent and 35
percent of original size. Using four levels of magnification is expected to present us with
enough variability in the results to understand the effect of magnification for manual
inspection of micro-manufactured parts.
For the sake of this experiment, the levels of magnification were assigned
numbers from one through four for identification. 100% magnification was labeled as
one, 75% magnification was labeled as two, 50% magnification was labeled as three and
35% magnification was labeled as four.

37
4.1.4 Using density as a factor
For the final step, two levels of density were created for each of the levels of
magnification. The density levels used were high density and low density. The use of
these two levels of density will be helpful in evaluating which levels will be the least time
consuming and most efficient.
For the sake of this experiment, the levels of density were assigned numbers one
and two for identification. High density was numbered as one and low density was
numbered as two.
Hence, the 64 samples considered in this experiment can be explained as follows:
Two levels of defects x four levels of location of defects x four levels of magnification x
two levels of density = 64 unique visual samples
A total of 60 subjects were selected to participate for these experiments. Subjects
were classified as either young (20-30 years) or old (30-60). The gender and ethnicity of
the subjects varied from subject to subject and were not considered for the purpose of this
study.

38
4.2 Creating a computer based interface to carry out the visual inspection
experiment
The next step was to create a computer based interface to enable the visual
inspection of the samples created above. A web browser based computer interface was
created. A data base linked to this web browser interface contained all the 64 visual
samples that were created for the purpose of this experiment.
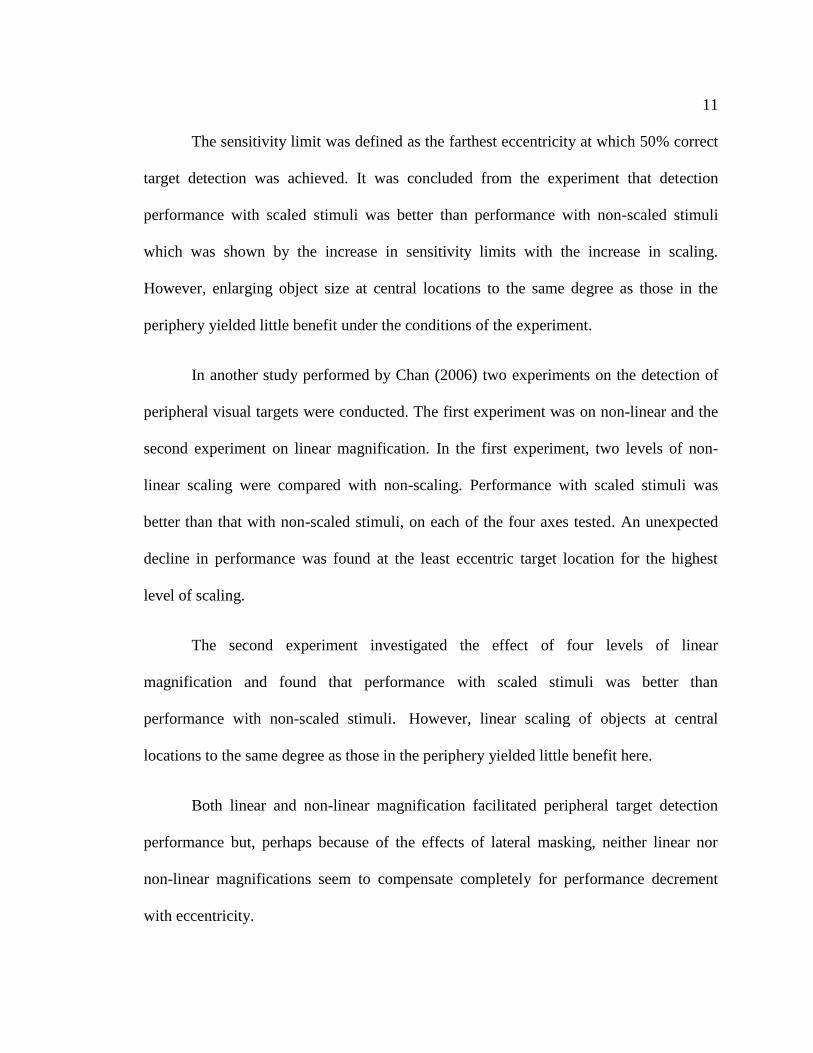
The first screen that appears on the interface has prompts for the subjects to enter
their first name, last name, age, radio buttons to indicate their gender and a check box
that states that they have read and understood the instructions of the test on the left side
of the screen. The right side of the screen contains instructions for taking the test. Shown
below is an image of this interface.
Figure 4.3 Screenshot of the browser based computer interface used for the study

39
Once the subjects have filled in all the required information, the visual samples
created appear in a randomized order. There are two buttons on the bottom of the image
which read ‘Defect’ and ‘No defect’. Once the subject has finished inspecting the sample,
he can indicate if it is a defective sample or a non-defective sample. The computer
interface has a clock running in the background which records the time taken by the
subject to record a response. A screenshot of the experiment in progress is shown below.
Figure 4.4 Screenshot of the visual inspection experiment in progress

40
After the subjects have finished visual inspection of all the 64 visual samples
presented to them, a summary of the results appears in two different tables. The table on
the top left corner of the screen contains the name, age, gender, the start time and end
time of the experiment.
The second table contains a comprehensive summary of the test number in the
order it was presented to the subject, the sample number/location of defect number, the
density number, the magnification number, the correct answer to the question, the answer
given by the subject and the time taken by the subject to inspect that particular sample. A
screenshot of the results for a test run of the experiment is shown below.
Figure 4.5 Screenshot of the results screen

41
4.3 Compiling the data and importing it into the statistical analysis software
The data obtained from the results summary for each subject is copied into an
Excel document. The individual spreadsheets are combined and imported to statistical
analysis software. Minitab was used to perform the statistical analysis for this study.
A MANOVA and a two-way ANOVA was performed on this data to understand
the effects of the main factors such as type of defects, location of defects, magnification,
density and age. The two-way interaction effects between these factors were also studied.
A regression analysis was performed to determine how the magnification of a location of
defect effects the inspection time when the locations of defects are reduced to micro-
dimensions.
The following chapters will have a detailed summary of the results from the
MANOVA, ANOVA and regression analysis mentioned above.

42
CHAPTER V
Results
This chapter presents a summary of the results obtained from the Multivariate
Analysis of Variance (MANOVA) and the Univariate Analysis of Variance (ANOVA).
The results from the multivariate analysis of variance for the various multivariate
tests along with a MANOVA summary for time and accuracy are presented below.
Table 5.1 MANOVA summary for multivariate tests
Description p-value for
Wilks-Lambda
p-value for
Lawley-
Hotelling
p-value for
Pillai's
p-value for
Roy’s
Location of
defect
0.019 0.019 0.019 --
Type of defect 0 0 0 --
Density 0.547 0.547 0.547 --
Magnification 0.001 0.001 0.001 --
Age 0 0 0 --

43
Table 5.2 MANOVA summary for time
p-Value Significance
Location of defects 0.051 NS
Type of defect 0 S
Density 0.535 NS
Magnification 0.060 NS
Age 0 S
S – Significant at α ≤ 0.05 NS – Not significant
Table 5.3 Accuracy scoring system
User answer Correct answer Accuracy
Defect Defect 1
No defect No defect 1
No Defect Defect 0
Defect No Defect 0
The accuracy was calculated as ‘1’if the subject was able to indicate a defect if a
defect was present or indicate that there was no defect if there was no defect in the
sample. It was calculated as ‘0’ if the subject indicated that there was ‘no defect’ in case
of a ‘defect’ or indicated that there was a ‘defect’ when there is ‘no defect’. The
independent factors in this analysis were location of defects, type of defect,
magnification, age and density.

44
Table 5.4 MANOVA summary for accuracy
p-Value Significance
Location of defects 0.053 NS
Type of defect 0.131 NS
Density 0.381 NS
Magnification 0.001 S
Age 0 S
S – Significant at α ≤ 0.05 NS – Not significant
The Univariate analysis of variance was performed for inspection time and accuracy.
The ANOVA summary for time is shown below:
Table 5.5 ANOVA summary for time
p-Value Significance
Location of defects 0.057 NS
Type of defect 0 S
Density 0.542 NS
Magnification 0.067 NS
Age 0 S
Location of defects x type of defect 0.059 NS
Location of defects x density 0 S
Location of defects x magnification 0 S
Location of defects x Age 0.196 NS
Type of defect x Density 0.185 NS
Type of defect x Magnification 0.639 NS
Type of defect x age 0.303 NS
Density x magnification 0 S
Density x age 0.737 NS
Magnification x age 0.829 NS
S – Significant at α ≤ 0.05 NS – Not significant

45
The ANOVA summary for accuracy is show below:
Table 5.6 ANOVA summary for accuracy
p-Value Significance
Location of defects 0.053 NS
Type of defect 0.130 NS
Density 0.381 NS
Magnification 0.001 S
Age 0 S
Location of defects x type of defect 0.014 S
Condition x density 0.502 NS
Location of defects x magnification 0.840 NS
Location of defects x age 0.605 NS
Type of defect x density 0.690 NS
Type of defect x magnification 0.009 S
Type of defect x age 0.094 NS
Density x magnification 0.989 NS
Density x age 0.473 NS
Magnification x age 0.352 NS
S – Significant at α ≤ 0.05 NS – Not significant
5.1 Main effect plots for inspection time
This sub-section describes the main effect plots for inspection time. The main
effects described here are location of defects, type of defect, magnification, age and
density. Based on the results from the ANOVA summary table, only the significant main
and interaction effects are described in the following sections.

46
5.1.1 Effect of type of defect
Figure 5.1 Time versus type of defect
It can be observed from the above plot that the time taken by a human inspector to
identify a Real defect is greater than the time taken to identify a character defect. This
difference is very significant in case of this experiment.
It can be inferred from these trends that the inspection of the real sample is more
complex when compared to inspecting lines of characters for a specific defect. This can
be attributed to the processing power of the human brain. It is easier for the human mind
to process characters in comparison to more complex shapes.
RealCharacter
4.6
4.5
4.4
4.3
4.2
4.1
4.0
3.9
3.8
3.7
Type of defect (character/real)
Tim
e (
se
c)
Effect of type of defect on inspection time

47
5.1.2 Effect of age
Figure 5.2 Time versus Age
It can be inferred from the above plot that there is a significant difference in the
average inspection time for the younger and the older subjects. For the purposes of this
experiment, young subjects belong to the 20 to 30 years age group and the older subjects
belong to the 30 and beyond age group.
This difference in average inspection time between the older and the younger
subjects might be attributed to the fact that the younger subjects have better visual
acumen and reflexes when compared to the older subjects.
5.2 Two-way Interaction effects for time
The following section describes in detail the various two way interaction effects
caused by the five main factors are discussed in detail.
YoungOld
4.75
4.50
4.25
4.00
3.75
3.50
Age (Old/Young)
Tim
e (
se
c)
Effect of age on inspection time

48
5.2.1 Interaction effect between magnification and density
Figure 5.3 Two – way interaction effects between magnification and density
It can be observed from the above plot that for magnification one (100%
magnification) the time taken for inspection of density one (high density) was more than
the time taken for inspection of density two (low density). These observations can be
confirmed by performing a Tukey test.
In case of magnification two (75% magnification) the time taken for inspection of
density two (low density) was more than the time taken for inspection of density one
(high density).
For magnification three (50% magnification) the trend was similar to the trend
observed for magnification one. For magnification four the trend was similar to the trend
observed for magnification two.
21
5.5
5.0
4.5
4.0
3.5
3.0
Density
Tim
e (
se
c)
1
2
3
4
Magnification
Interaction effect of Magnification and Density on inspection time

49
Intuitively, it can be assumed that inspection of lower densities would be less time
consuming as compared to higher densities. The trends observed for magnification two
and magnification four deviate from these assumptions. This might be attributed to the
underlying effects of density and type of defect.
5.3 Main effect plots for accuracy
This sub-section describes the main effect plots for accuracy of inspection. The
main effects described here are Location of defects, Type of defect, Magnification, Age
and Density. Based on the results from the ANOVA summary table, only the significant
main and interaction effects are described in the following sections.

50
5.3.1 Effect of magnification
Figure 5.4 Magnification versus accuracy plot
It can be observed from the above plot that the accuracy for magnification two
(75% magnification) is slightly higher than magnification one (100% magnification) the
accuracy for magnification three (50% magnification) and magnification four (35%
magnification) is lesser than the respective previous magnifications. For the sake of this
study, it can be inferred from the above observations that the 75% magnification is the
most ideal size for visual inspection. A Post-hoc comparison between the different levels
of magnification was performed using Tukey test. The results indicated that all four
levels of magnification are significantly different from one another.
4321
0.97
0.96
0.95
0.94
0.93
Magnification
Accu
racy (
0 t
o 1
)
Effect of Magnification on inspection accuracy

51
5.3.2 Effect of Age
Figure 5.5 Age versus accuracy plot
It can be observed from the above plot that the younger subjects had higher visual
inspection accuracy in comparison to the older subjects. The younger subjects have
quicker reflexes, better eye sight and are motivated to perform in comparison to the older
subjects who are slightly slower and have poorer eye sight.
YoungOld
0.975
0.970
0.965
0.960
0.955
0.950
0.945
0.940
Age
Accu
racy (
0 t
o 1
)
Effect of Age on inspection accuracy

52
5.4 Two-way Interaction effects for accuracy
The following section describes in detail the various two way interaction effects
caused by the five main factors are discussed in detail.
5.4.1 Interaction effect between Type of defect and Magnification
Figure 5.6 Two – way interaction effects between Type of defect and Magnification
It can be observed from the above plot that for magnification one and magnification
two, the inspection accuracy for the character defect is more than the inspection accuracy
for the real defect. For magnification three, the inspection accuracy for the real sample is
more than the inspection accuracy for character sample. For magnification four, the
inspection accuracy for character samples is more than the inspection accuracy for the
real samples. The above mentioned observations can be confirmed by performing a
Tukey test.
4321
0.97
0.96
0.95
0.94
0.93
0.92
0.91
Magnification
Accu
racy (
0 t
o 1
)
Character
Real
Type of defect
Interaction effecy of Type of defect and Magnification on inspection accuracy
53
Intuitively, it can be assumed that the character samples will be easier to inspect at
all magnifications as they are easier to go through and inspect. For magnification three it
can be observed that the accuracy for the real samples was more than the accuracy for the
character samples. This can be due to the influence of other factors such as density and
Location of defect.
5.5 Results from regression analysis for magnification
A regression analysis was performed on the data to understand the relationship
between magnification and time. The regression equations can be used to extrapolate the
study to understand how the magnification would influence the time taken for inspection
for micro-manufactured parts.
For the regression analysis, the mean values for each magnification level were used
instead of the raw data. This was done to reduce the number of degrees of freedom and to
provide a more accurate regression curve. The procedure used for the smoothing of the
data is explained below.
Each subject inspects 16 samples for every one of the four magnifications (1, 2, 3,
and 4) present in this experiment. The mean time taken for the 16 samples is used. This
would result in four data points per subject. For 60 subjects, this would be 240 data
points.
In the following sections, the regression equations obtained for the smoothened
magnification-time data are described in detail.

54
5.5.1 Regression models for all four levels of magnification
Various regressive models were tested in this study using Minitab to find the best
fit model to quantify the relationship between magnification and time. Table 6.1 shows a
summary of all the regression models that were evaluated for the time taken vs.
magnification data obtained from the visual inspection experiment.
Table 5.7 Summary of various regression models for Magnification
Model p-value for Magnification
Y = a + bX Not significant
Y = a + bX + cX2 Not significant
Y = a + bX + cX2
+ dX3 Not significant
Y = a + bX + c(1/X) Not significant
Y = a + b(1/X) Significant
Y denotes Time; X denotes Magnification; p ≤ 0.05 significant
From the above table it can be observed that the linear model for time and
magnification was shown to be not significant. Some other popular regression models
such as cubic models and quadratic regression models were tested and proved to be not
significant for the experimental data used for this study.
55
After the trial and error verification of above mentioned models, the Y = a +
b*(1/X) model yielded a significant relationship between the time and magnification data
considered for this experiment. The actual equation obtained from Minitab was:
Time = 3.52 + (1/Magnification)
This shows that time taken for visual inspection is inversely proportional to the
magnification for the data obtained for this experiment. With an increase in
magnification, there is a decrease in the time taken for visual inspection.

56
Chapter VI
Conclusions and Scope for future work
Human visual inspection is one of the most important means of maintaining
process control in manufacturing processes. There has been extensive research performed
on the factors that affect visual inspection performance for macro manufacturing.
In the recent years, there has been significant emphasis on Micro/Meso scale
manufacturing and the process control for these processes. Visual inspection was
identified as one the major means of process control for Micro/Meso scale
manufacturing.
A lack of literature on manual visual inspection models that considered the effect
of size on manual visual inspection for Micro/Meso scale parts prompted a need for this
study. Since visual inspection is one of the major means of process control for micro
manufacturing, it was postulated that such a study would help predict process control for
Micro/Meso scale manufacturing.
A visual inspection experiment was developed which presented a combination of
the major factors that effected manual visual inspection from the literature published over
the years. The purpose of creating such an experiment was to mimic a real-time
inspection scenario and obtain time and accuracy data that would help understand the size
effects.

57
Efforts were made to develop a linear model for search time and magnification to
help predict how increasing/decreasing magnification effects the search time of the
inspector performing the inspection task.
6.1 Results from ANOVA
A two-way analysis of variance (ANOVA) was carried out in order to analyze the
variations between the factors considered for this experiment. The analysis of variance
was carried out separately for inspection time and accuracy.
The ANOVA results for inspection time indicated that the effects of type of defect
and age were found as significant factors for the data collected from the visual inspection
experiment. The mean inspection time was found to be higher for the more complex
defect types. The young subjects took less time for inspection when compared to the
older subjects.
These observations line up well with the published literature for macro visual
inspection which identified both factors as critical for macro inspection. It can be noted
that a reduction of size does not change the effect of these factors. An analysis of the
significant interaction effect between magnification and density show that there is a
strong effect of underlying factors in case of interaction effects.
The ANOVA results for accuracy indicate that magnification and age were
significant factors in case of accuracy. The results from magnification indicate that too
much magnification may not to be very beneficial for inspection processes.
58
75% magnification was identified as an optimum level of magnification for this
study. Performing such an ANOVA prior to choosing a level of magnification might help
industries to increase the accuracy of their human visual inspectors. In case of age, it was
observed that younger subjects were more accurate than the older subjects.
One of the major objectives of this study was to develop a general linear
relationship between inspection time and magnification to predict process control for
Micro/Meso scale manufacturing. It was postulated that increasing magnification
increased visual inspection performance and reduced search time whereas decreasing
magnification would decrease visual inspection performance and increased search time.
From the results of the analysis of variance for time, it was identified that
magnification was not identified as a significant factor. This indicates that the approach
used for this experiment may not be a valid approach to model the general linear
relationship between size effect and inspection time.
6.2 Results from regression
A regression analysis was performed to estimate the relationship between search
time and magnification. Magnification was independent variable and the search time was
the dependent variable for this regression analysis. Such an analysis would identify the
nature of the relationship between search time and level of magnification for the data
considered for this experiment.
59
Various regression models were tested by trial and error method to find a model
that presented a statistically significant relationship between search time and level of
magnification. It was observed that the relationship between magnification and search
time is not linear for this study. The magnification was seen to be inversely proportional
to the inspection time.
This indicates that with an increase in magnification there is a decrease in the time
taken for inspection. However, since the magnification was not identified as a significant
factor in the analysis of variance, this cannot be generalized for all inspection scenarios.
6.3 General discussion
Magnification was not identified as a significant factor in the analysis of variance
for time. This indicates that this approach might not be valid to model the general
relationship between magnification and inspection time in case of Micro/Meso scale
manufacturing. The results from the regression analysis indicate that magnification is
inversely proportional to search time from the data considered for this experiment. This
indicates that for the data considered for this particular study, magnification played a
beneficial role.
A more extensive study with more subjects and increased defect types may
produce more accurate results to model the relationship between search time for
inspection and the level of magnification for Micro/Meso scale manufacturing.

60
Bibliography
Bernstein, D., Hamilton, K., Foy, C., Petersen, N., & Netscher, D. (2013). Comparison of
magnification in Primary Digital Nerve Repair: Literature review, Survey of
Practice Trends, and Assessment of 90 Cadaveric Repairs. Journal of Hand
Surgery, 2144–2150.
Chakrapani, C. (1998). How to measure Service Quality & Customer satisfaction.
American Marketing Association. Chicago.
Chan, A., & Ma, R. (2004). A comparison of linear and non-linear magnification on
target detection performance in visual inspection. Journal of Engineering
Manufacture, 1373-1386.
Chan, A., & Ma, R. (2006). Effect of linear magnification on target detection
performance in visual inspection. The International Journal of Advanced
Manufacturing Technology, 375-382.
Cooper, J., & Fisher, M. (2002). Software Acquisition Capability Maturity Model.
Software Engineering Institute.
Drury, C., & Watson, J. (2002). Good practices in Visual Inspection. Human factors.
Duan, G., Chen, Y., & Sakekawa, T. (2008). Automatic Optical Inspection of Micro Drill
Bit in Printed Circuit Board Manufacturing Based on Pattern Classification. IEEE
International Instrumentation and Measurement Technology Conference.
Victoria.
Fabbro, M., & Taschieri, S. (2010). Endodontic therapy using magnification devices: A
systematic review. Journal of Dentistry, 269-275.
Feigenbaum, A. (1982). Quality and business growth today. Quality Progress, 22-25.
Freund, R. (1985). Definitions and basic quality concepts. Journal of Quality Technology,
50-56.
Gallwey, T., & Drury, C. (1986). Task Complexity in Visual Inspection. Human Factors,
595-606.
Garcia, H., Villalobos, J., & Runger, G. (2006). An automated feature selection method
for Visual Inspection Systems. Automation Science and Engineering, IEEE
Transactions, 394 - 406.

61
Gilmore, H. (1974). Product Conformance Cost. Quality progress.
History of Quality: ASQ. (n.d.). Retrieved from American Society for Quality:
http://asq.org/learn-about-quality/history-of-quality/overview/overview.html
JH Technologies. (n.d.). Manual Inspection for PCBs. JH Technologies.
Juran, J. (1988). Quality control handbook.
Kielbassa, A., Paris, S., Lussi, A., & Meyer-Lueckel, H. (2006). Evaluation of cavitations
in proximal caries lesions at various magnification levels in vitro. Journal of
Dentistry, 817-822.
Kommidi, S., Gramopadhye, A., & Grimes, L. (2005). Evaluation of Human
Performanace in a Supervisory Inspection Task Monitoring Multiple Hybrid
Inspection Systems. Human Factors, 573-577.
Kornel, R. S. (2002). Mico/Meso-scale Mechanical Manufacturing. JSME/ASME
International Conference, (pp. 6-13). Honolulu, HI.
Lee, F., & Chan, A. (2009). Effects of magnification methods and magnifier shapes on
visual inspection. Applied Ergonomics.
Melchore, J. (2011). Sound Practices for Consistent Human Visual Inspection. AAPS
PharmSciTech, 215-221.
Modica, F., Marrocco, V., Copani, G., & Fassi, I. (2011). Sustainable Micro-
Manufacturing of Micro-Components via Micro Electrical Discharge Machining.
Sustainability, 2456-2469.
Nakajima, R., Shida, K., & Matsumoto, T. (2013). A Study on the Effect of Inspection
Time on Defect Detection in Visual Inspection. IFIP Advances in Information and
Communication Technology, 29-39.
Nayyar, R., & Simon, J. (1963). Effects of magnification on a subminiature assembly
operation. Journal of Applied Psychology, 190-195.
Parasuraman, A., Zeithaml, V., & Berry, L. (1985). A conceptual model of services
quality and its implication for future research. Journal of Marketing, 41-50.
Parasuraman, A., Zeithaml, V., & Berry, L. (1988). Servqual. Journal of retailing, 12-37.

62
Peker, I., Meryem, T., Bala, O., & Altunkaynak, B. (2009). The Efficiency of Operating
Microscope Compared with Unaided Visual Examination, Conventional and
Digital Intraoral Radiography for Proximal Caries Detection. International
Journal of Dentistry.
Product Quality: Business Dictionary. (n.d.). Retrieved from Business Dictionary:
http://www.businessdictionary.com/definition/product-
quality.html#ixzz2nn644Kd6
Quality Assurance vs. Quality Control: ASQ. (n.d.). Retrieved from American Society for
Quality: http://asq.org/learn-about-quality/quality-assurance-quality-
control/overview/overview.html
Resendiz, E., Hart, J., & Ahuja, N. (2013). Automated Visual Inspection of Railroad
Tracks. Intelligent Transportation Systems, IEEE Transactions, 751 - 760.
Scholz-Reiter, B., Lütjen, M., Thamer, H., & Lensing, T. (2010). Towards Automated
Visual Inspection and Classification of Micro-Parts. WSEAS TRANSACTIONS on
APPLIED and THEORETICAL MECHANICS, 112-121.
Sellors, J., Winkler, J., & Kreysar, D. (2004). Illumination, optics, and clinical
performance of a hand-held magnified visual inspection device (AviScope): a
comparison with colposcopy. Journal of Acquired Immue Deficiency Syndrome.
Sun, Y., & Tsai, C. (1992). A new model-based approach for industrial visual inspection.
Pattern Recognition, 1327–1336.
Taguchi, S., & Bryne, D. (1986). The Taguchi Approach to Parameter Design. ASQC
Quality Congress Transactions,, (p. 168). Anaheim, CA.
Vittorio, S. (2001). Micro-Electromechanical Systems (MEMS). Cambridge scientific
abstracts.
Vollertsen, F., Biermann, D., Hansen, H., Jawahir, I., & Kuzman, K. (2009). Size effects
in manufacturing of metallic components. Manufacturing Technology, 566-587.
Wei, W. (1978). The Effect of Lighting and Low Power Magnification on Inspection
Performance . Human Factors, 196-199.