F F Screening and identification of acrylamide degrading ...

R E S EA RCH AR T I C L E
Stability of a biogas-producing bacterial, archaeal and fungalcommunity degrading food residues
Frank R. Bengelsdorf1, Ulrike Gerischer2, Susanne Langer1, Manuel Zak3 & Marian Kazda3
1Institute for Microbiology and Biotechnology, University of Ulm, Ulm, Germany; 2Theoretical and Computational Biophysics Department, Max
Planck Institute for Biophysical Chemistry, G€ottingen, Germany; and 3Institute for Systematic Botany and Ecology, University of Ulm, Ulm,
Germany
Correspondence: Frank Bengelsdorf, Institut
f€ur Mikrobiologie und Biotechnologie, Albert-
Einstein-Allee 11, D-89081 Ulm, Universit€at
Ulm, Germany. Tel.: +49 731 50 22713;
fax: +49 731 50 22719;
e-mail: [email protected]
Received 27 October 2011; revised 7
November 2012; accepted 2 December
2012.
DOI: 10.1111/1574-6941.12055
Editor: Alfons Stams
Keywords
biowaste; biogas plant; 16S/18S rRNA gene;
Saccharomyces; denaturating gradient gel
electrophoresis.
Abstract
The resident microbiota was analyzed in a mesophilic, continuously operating
biogas plant predominantly utilizing food residues, stale bread, and other waste
cosubstrates together with pig manure and maize silage. The dominating bacte-
rial, archaeal, and eukaryotic community members were characterized by two
different 16S/18S rRNA gene culture-independent approaches. Prokaryotic 16S
rRNA gene and eukaryotic 18S rRNA gene clone libraries were constructed and
further analyzed by restriction fragment length polymorphism (RFLP), 16S/18S
rRNA gene sequencing, and phylogenetic tree reconstruction. The most domi-
nant bacteria belonged to the phyla Bacteriodetes, Chloroflexus, and Firmicutes.
On the family level, the bacterial composition confirmed high differences
among biogas plants studied so fare. In contrast, the methanogenic archaeal
community was similar to that of other studied biogas plants. Furthermore, it
was possible to identify fungi at the genus level, namely Saccharomyces and
Mucor. Both genera, which are important for microbial degradation of complex
compounds, were up to now not found in biogas plants. The results revealed
their long-term presence as indicated by denaturating gradient gel electropho-
resis (DGGE). The DGGE method confirmed that the main members of the
microbial community were constantly present over more than one-year period.
Introduction
Organic residues (biowaste) accumulate in large amounts
as leftovers of food processing and households and are
therefore available as a substrate for biogas production
[methane (CH4) and carbon dioxide (CO2)] in anaerobic
reactors (Wiesenthal et al., 2006). Household waste is reg-
ularly collected at public expense, and the amount that is
presently incinerated or landfilled is in principle accessible
for energy recovery (Wiesenthal et al., 2006). Biowaste
has a considerable advantage compared with renewable
primary products (i.e. maize silage, fodder beat, green
rye), as there is no competition between the use of the
substrate for the production of biogas and the use of the
substrate as food.
In general, the fermentation process is characterized by
the three phases: hydrolysis sometimes referred to as pri-
mary fermentation (Schink, 1997), acidogenesis/acetogen-
esis sometimes referred to as secondary fermentation
(Schink, 1997), and methane production (methanation),
which occur simultaneously. The influence of the compo-
sition and diversity of the microbial community on the
stability of the biogas-forming process and on the biogas
yield is of great interest (Weiland, 2010). So far, several
studies focused on the microbial diversity in biogas plants
supplied with renewable primary products and liquid
manure as substrates (Cirne et al., 2007; Schl€uter et al.,
2008; Kr€ober et al., 2009; Liu et al., 2009; Nettmann
et al., 2010). In contrast, this work analyzed the composi-
tion, the diversity as well as the stability of the microbial
community, over the time of operation of a mesophilic,
continuously operated biogas plant. The biogas plant was
predominantly supplied with sanitized food residues and
stale bread. According to availability, substrates such as
pig slurry, maize silage, potato peelings, and grain husk
were supplied in minor and variable proportions.
The microorganisms that break down the organic com-
pounds initiate biogas production by producing the
FEMS Microbiol Ecol && (2012) 1–12 ª 2012 Federation of European Microbiological SocietiesPublished by Blackwell Publishing Ltd. All rights reserved
MIC
ROBI
OLO
GY
EC
OLO
GY

major substrates for the methanogens (Ahring, 2003).
Besides the known fermentative bacteria, microorganisms
from the eukaryotic domain are also important candi-
dates of the primary and secondary fermentation pro-
cesses. For instance, it is well known that obligate
anaerobic protozoa are part of the ruminal microbiota
(Williams & Coleman, 1997). The presence of episymbi-
otic methanogens in ruminal ciliated protozoa was pro-
ven in the early 1980s (Ushida, 2011). Furthermore,
anaerobic fungi are known to form co-cultures with ru-
minal methanogenic archaea as a result of their high
hydrogen production (Orpin & Joblin, 1997). The role of
ruminal fungi in the degradation of plant fibers has been
studied extensively (Akin & Borneman, 1990; Wubah
et al., 1993; Krause et al., 2003; Tripathi et al., 2007). The
fungi attach to the most lignified tissues of plant material
(Akin & Rigsby, 1987) and penetrate the plant tissue in a
way that cellulolytic bacteria can gain access to the inte-
rior. Fungal penetration then leads to faster and more
complete decomposition of fodder that enters the rumen
(Orpin & Joblin, 1997). The same could be true for a
biogas plant, but until recently, not much is known about
the occurrence of fungi and other eukaryotes within a
biogas plant.
Most of the latest studies focused on the methanogenic
archaea present in biogas plants (Nettmann et al., 2010;
Fotidis et al., 2012; Kampmann et al., 2012a). Certainly,
this is due to the fact that methane-generating microor-
ganisms (methanogens) play a key role in the biogas-
forming process (Weiland, 2010). Methanogens are
generally divided into two groups, hydrogenotrophic and
acetoclastic methanogens. Members of the former use
CO2 as a carbon source for their metabolism and H2 or
formate as an electron donor, whereas members of the
latter metabolize primarily C1 compounds and acetate
(Whitman et al., 2006). Recently, it has been shown that
members of the hydrogenotrophic group dominate the
biogas-forming process (Nettmann et al., 2010; Kamp-
mann et al., 2012a). This is in accordance with the results
published by Laukenmann et al. (2010). They used stable
carbon isotope labeling (d13C) to identify the pathway of
methane production. As a result, they found that only a
minor part of the produced methane derives from acetate
(Laukenmann et al., 2010).
The first topic of this work was to analyze the compo-
sition and diversity of the microbial community of the
mentioned mesophilic biogas plant supplied with bio-
waste. The dominating bacterial, archaeal, and eukaryotic
community members were characterized using different
culture-independent approaches. Therefore, clone libraries
were constructed containing either prokaryotic 16S rRNA
gene fragments or eukaryotic 18S rRNA gene fragments.
Furthermore, the enumeration of the microorganisms was
carried out using epifluorescence microscopy. To detect
all groups of microorganisms in the reactor content, dif-
ferent staining dyes were used that intercalate into the
DNA of microorganisms.
The principal objective of this work was to analyze the
stability of the microbial community of the mentioned
biogas plant. So far, very little is known about the stabil-
ity of the microbial communities in full-scale biogas reac-
tors (Weiss et al., 2008), especially under substrate
variation. To investigate the stability, the composition of
the microbial community was monitored and described
as a function of time. The hypothesis was that the micro-
bial community of a full-scale biogas reactor is stable over
time despite variations in the substrate composition. The
stability of the microbial community was analyzed by
denaturating gradient gel electrophoresis (DGGE) that
allows among others a comparison of molecular DNA
fingerprints of microbial communities as a function of
time (Muyzer et al., 1993).
Materials and methods
Sampling and specifications of the biogas plant
A biogas plant located in Southern Germany near Aulen-
dorf in Baden-W€urttemberg utilizing predominantly sani-
tized food residues was chosen to investigate the variation
in microbial community during its operation. The plant
consists of three reactors with 350, 450, and 1200 m3
total volumes and a production capacity of 380 kWh.
Before sampling, operation of the plant was stable in
terms of substrate feeding, biogas production, and engine
performance for at least 1 year. The methane content
accounts for 55–60% (v/v) of the produced biogas. Tem-
perature in the reactor ranged from 37 to 44 °C depend-
ing on the season and average pH of 7.9. Food residues
and stale bread were constantly fed into the plant; all
other substrates such as pig slurry, maize silage, potato
peelings, and grain husk were supplied according to avail-
ability, with a mean hydraulic residence time of 100 days.
Food residues were leftovers from commercial kitchens or
factory canteens. It is mandatory in Germany that food
residues used in the plant were previously pasteurized
(70 °C, 1 h) and homogenized by an accredited waste
management company (Pig Food GmbH, Aulendorf, Ger-
many). The slurry (usually pH of 3.7) was delivered to
the biogas plant.
The 350 m3 biogas reactor that was investigated had an
organic loading rate of 3.5 to 4.0 kg VS m�3 d�1 (VS,
volatile solids). The concentration of volatile fatty acids
in the reactor was approximately 0.8–1.0 g L�1. The main
acid produced was acetate. Extensive description of the
process parameters and analytical methods is given
ª 2012 Federation of European Microbiological Societies FEMS Microbiol Ecol && (2012) 1–12Published by Blackwell Publishing Ltd. All rights reserved
2 F.R. Bengelsdorf et al.
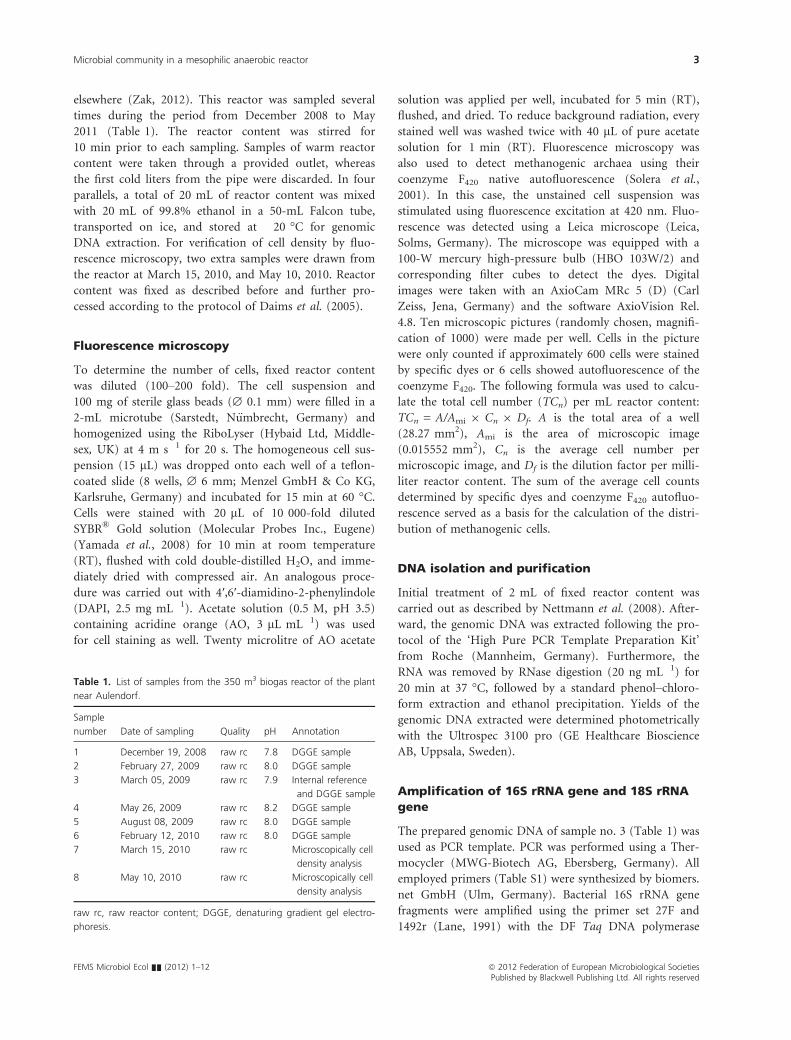
elsewhere (Zak, 2012). This reactor was sampled several
times during the period from December 2008 to May
2011 (Table 1). The reactor content was stirred for
10 min prior to each sampling. Samples of warm reactor
content were taken through a provided outlet, whereas
the first cold liters from the pipe were discarded. In four
parallels, a total of 20 mL of reactor content was mixed
with 20 mL of 99.8% ethanol in a 50-mL Falcon tube,
transported on ice, and stored at �20 °C for genomic
DNA extraction. For verification of cell density by fluo-
rescence microscopy, two extra samples were drawn from
the reactor at March 15, 2010, and May 10, 2010. Reactor
content was fixed as described before and further pro-
cessed according to the protocol of Daims et al. (2005).
Fluorescence microscopy
To determine the number of cells, fixed reactor content
was diluted (100–200 fold). The cell suspension and
100 mg of sterile glass beads (∅ 0.1 mm) were filled in a
2-mL microtube (Sarstedt, N€umbrecht, Germany) and
homogenized using the RiboLyser (Hybaid Ltd, Middle-
sex, UK) at 4 m s�1 for 20 s. The homogeneous cell sus-
pension (15 lL) was dropped onto each well of a teflon-
coated slide (8 wells, ∅ 6 mm; Menzel GmbH & Co KG,
Karlsruhe, Germany) and incubated for 15 min at 60 °C.Cells were stained with 20 lL of 10 000-fold diluted
SYBR® Gold solution (Molecular Probes Inc., Eugene)
(Yamada et al., 2008) for 10 min at room temperature
(RT), flushed with cold double-distilled H2O, and imme-
diately dried with compressed air. An analogous proce-
dure was carried out with 4′,6′-diamidino-2-phenylindole
(DAPI, 2.5 mg mL�1). Acetate solution (0.5 M, pH 3.5)
containing acridine orange (AO, 3 lL mL�1) was used
for cell staining as well. Twenty microlitre of AO acetate
solution was applied per well, incubated for 5 min (RT),
flushed, and dried. To reduce background radiation, every
stained well was washed twice with 40 lL of pure acetate
solution for 1 min (RT). Fluorescence microscopy was
also used to detect methanogenic archaea using their
coenzyme F420 native autofluorescence (Solera et al.,
2001). In this case, the unstained cell suspension was
stimulated using fluorescence excitation at 420 nm. Fluo-
rescence was detected using a Leica microscope (Leica,
Solms, Germany). The microscope was equipped with a
100-W mercury high-pressure bulb (HBO 103W/2) and
corresponding filter cubes to detect the dyes. Digital
images were taken with an AxioCam MRc 5 (D) (Carl
Zeiss, Jena, Germany) and the software AxioVision Rel.
4.8. Ten microscopic pictures (randomly chosen, magnifi-
cation of 1000) were made per well. Cells in the picture
were only counted if approximately 600 cells were stained
by specific dyes or 6 cells showed autofluorescence of the
coenzyme F420. The following formula was used to calcu-
late the total cell number (TCn) per mL reactor content:
TCn = A/Ami 9 Cn 9 Df. A is the total area of a well
(28.27 mm2), Ami is the area of microscopic image
(0.015552 mm2), Cn is the average cell number per
microscopic image, and Df is the dilution factor per milli-
liter reactor content. The sum of the average cell counts
determined by specific dyes and coenzyme F420 autofluo-
rescence served as a basis for the calculation of the distri-
bution of methanogenic cells.
DNA isolation and purification
Initial treatment of 2 mL of fixed reactor content was
carried out as described by Nettmann et al. (2008). After-
ward, the genomic DNA was extracted following the pro-
tocol of the ‘High Pure PCR Template Preparation Kit’
from Roche (Mannheim, Germany). Furthermore, the
RNA was removed by RNase digestion (20 ng mL�1) for
20 min at 37 °C, followed by a standard phenol–chloro-form extraction and ethanol precipitation. Yields of the
genomic DNA extracted were determined photometrically
with the Ultrospec 3100 pro (GE Healthcare Bioscience
AB, Uppsala, Sweden).
Amplification of 16S rRNA gene and 18S rRNA
gene
The prepared genomic DNA of sample no. 3 (Table 1) was
used as PCR template. PCR was performed using a Ther-
mocycler (MWG-Biotech AG, Ebersberg, Germany). All
employed primers (Table S1) were synthesized by biomers.
net GmbH (Ulm, Germany). Bacterial 16S rRNA gene
fragments were amplified using the primer set 27F and
1492r (Lane, 1991) with the DF Taq DNA polymerase
Table 1. List of samples from the 350 m3 biogas reactor of the plant
near Aulendorf.
Sample
number Date of sampling Quality pH Annotation
1 December 19, 2008 raw rc 7.8 DGGE sample
2 February 27, 2009 raw rc 8.0 DGGE sample
3 March 05, 2009 raw rc 7.9 Internal reference
and DGGE sample
4 May 26, 2009 raw rc 8.2 DGGE sample
5 August 08, 2009 raw rc 8.0 DGGE sample
6 February 12, 2010 raw rc 8.0 DGGE sample
7 March 15, 2010 raw rc Microscopically cell
density analysis
8 May 10, 2010 raw rc Microscopically cell
density analysis
raw rc, raw reactor content; DGGE, denaturing gradient gel electro-
phoresis.
FEMS Microbiol Ecol && (2012) 1–12 ª 2012 Federation of European Microbiological SocietiesPublished by Blackwell Publishing Ltd. All rights reserved
Microbial community in a mesophilic anaerobic reactor 3
(5 U lL�1; Genaxxon, Ulm, Germany). Temperature steps
were 95 °C for 5 min, a loop of 35 cycles of 94 °C for
45 s, 55 °C for 1 min, 72 °C for 1.5 min, and a final step
of 72 °C for 7 min. Archaeal 16S rRNA gene was ampli-
fied using the primer set 8aF and 1512uR (Eder et al.,
1999) with the High Fidelity PCR Enzyme Mix (5 U lL�1;
Fermentas, St. Leon-Rot, Germany). Temperature steps
were 96 °C for 5 min, 10 cycles of 96 °C for 45 s, 54 °Cfor 1 min, and 72 °C for 3 min, 25 cycles of 94 °C for
30 s, 59 °C for 1 min, and 72 °C for 3 min, and a final
incubation at 72 °C for 10 min. Eukaryotic 18S rRNA
gene was amplified using the primer set Euk1a and
Euk516r-GC (Scanlan & Marchesi, 2008) with the DF Taq
DNA polymerase. 18S rRNA gene fragments were gener-
ated with the following protocol: initial denaturation at
95 °C for 5 min, 8 cycles of 94 °C for 30 s, 55 °C for 30 s,
and 72 °C for 1 min, 20 cycles of 92 °C for 30 s, 52 °C for
30 s, and 72 °C for 1 min, followed by final extension at
72 °C for 10 min.
Construction and analysis of clone libraries
Different libraries of clones for bacteria, archaea, and
eukaryotes were constructed using the amplified 16S/18S
rRNA gene fragments. Those fragments were cloned into
either the pDrive cloning vector (QIAGEN GmbH, Hil-
den, Germany) or pJET1.2/blunt cloning vector according
to the instructions provided by the manufacturer. Cold
competent Escherichia coli DH5a cells were used for heat-
shock transformation of plasmid DNA (Inoue et al.,
1990). Colony PCR (Woodman, 2005) was carried out to
recover the cloned DNA fragment from the recombinant
plasmid. For restriction fragment length polymorphism
(RFLP) analysis, PCR fragments were combined with an
appropriate restriction enzyme mix and enzyme buffer.
Electrophoresis to separate restriction fragments was car-
ried out using 2% agarose gels. The resulting RFLP band-
ing patterns were compared visually. In case of identical
RFLP banding patterns, one representative DNA fragment
was chosen for sequencing (Eurofins MWG Operon,
Ebersberg, Germany). The resulting DNA sequence and
the corresponding RFLP banding pattern were defined as
an operational taxonomic unit (OTU). Representative
sequences were used for phylogenetic classification of the
corresponding microorganisms.
Phylogenetic analysis
All reference sequences used to analyze the 16S or 18S
rRNA gene sequences were retrieved from GenBank
(NCBI database) and the Ribosomal Database Project
(RDP). Considering the fact that the closest BLAST hit to
a query sequence is usually not the nearest neighbor
(Koski & Golding, 2001), two or three related sequences
with high similarity (97%) were chosen as references for
further analysis. All obtained nucleotide sequences were
checked for chimeric artifacts with the Mallard software
tool (version 1.02) (Ashelford et al., 2006). For each
deduced data set of bacterial, archaeal, or eukaryotic 16S/
18S rRNA gene sequences, three multiple sequence align-
ments (MSAs) were calculated using ClustalW2 (Larkin
et al., 2007), MUSCLE (Edgar, 2004), or MAFFT (Katoh
& Toh, 2008). The resulting MSAs were checked visually.
The reconstruction of phylogenetic trees based on each of
these three MSAs was performed with the program MrBa-
yes 3.1.2 (Ronquist & Huelsenbeck, 2003). The default
settings recommended in the manual for tree reconstruc-
tion were used for all analyses.
DGGE
In the DGGE approach, samples from the biogas reactor
(Table 1) were compared considering the banding pattern
of amplifiable 16S/18S rRNA gene fragments. The primer
set 357F-GC and 518R (Muyzer et al., 1993) was used to
amplify bacterial DGGE PCR products (200 bp) with DF
Taq DNA polymerase and 5% DMSO as an additive. The
corresponding protocol equates to the one described
above for 18S rRNA gene fragments from eukaryotes. Ar-
chaeal DGGE PCR products (180 bp) were generated
using a nested PCR. Nearly full-length archaeal 16S rRNA
gene fragments were used as templates with the primer
set SA1f-GC, SAf2-GC, and PARCH519r and DF Taq
DNA polymerase. The following program was used: initial
denaturation at 95 °C for 5 min, 5 cycles of 94 °C for
30 s, 53.5 °C for 30 s, and 72 °C for 1 min, 30 cycles of
92 °C for 30 s, 53.5 °C for 30 s, and 72 °C for 1 min,
followed by final extension at 72 °C for 10 min. Eukary-
otic DGGE PCR products (500 bp) were generated as
described above.
The DGGE methodology and the protocol were derived
from the protocol of Zwart and Bok (http://omega.rc.
unesp.br/mauricio/curso/bibliografia/25/415/protocolo_
DGGE.pdf) described in Bodelier et al. (2005). DGGE
analysis of 16S/18S rRNA gene fragments was performed
in 8% (w/v) polyacrylamide gels containing denaturing
gradients of 25–50% (bacteria), 35–60% (archaea), and
25–55% (eukaryotic). One-hundred percent denaturing
conditions corresponded to 7 M urea and 40% formam-
ide. Electrophoresis was performed at 40 V and 60 °C for
15.5 h.
Based on sequencing data from the bacterial clone
library, an internal classification standard (ICS) was
developed for DGGE analysis (Nicol et al., 2003; Smalla
et al., 2007). ICS1 consists of five different 16S rRNA
gene fragments mixed in equal concentrations, while ICS2
ª 2012 Federation of European Microbiological Societies FEMS Microbiol Ecol && (2012) 1–12Published by Blackwell Publishing Ltd. All rights reserved
4 F.R. Bengelsdorf et al.

consists of four different 16S rRNA gene fragments. A
DGGE was performed to verify that 16S rRNA gene frag-
ments of the ICS run at identical positions as fragments
amplified from a genomic DNA. Therefore, bands were
excised, re-amplified, and sequenced according to the
protocol of O’Sullivan et al. (2008).
Gel image analysis
Similarity analysis of DGGE banding pattern was carried
out with the Bio-1D software package (version 12.06, Vil-
ber Lourmat). Therefore, the digital DGGE banding pat-
tern image was used for comparison and clustering. Lanes
were defined by hand, and corresponding band positions
were recognized from a corrected intensity chart. The dice
coefficient was calculated to produce a similarity matrix
(Smalla et al., 2007). The corresponding dendrogram was
created using UPGMA (unweighted pairwise grouping
method with mathematical averages) with a tolerance
position value of 2% (Lliros et al., 2010).
Nucleotide sequences accession numbers
All nucleotide sequences obtained in this study were
deposited in the NCBI GenBank database. Bacterial and
archaeal 16S rRNA gene sequences are available under the
accession numbers JF421645 to JF421664 and JF421665 to
JF421673, while fungal 18S rRNA gene sequences are
available under the accession numbers JF421674 to
JF421682.
Results
Microscopical analysis
Micrographs that showed fluorescent cells were used to
determine the number of prokaryotic organisms. Using
87 micrographs (309 DAPI, 279 AO, 309 SYBR® Gold),
the average prokaryotic cells in the reactor were calcu-
lated to be 1.44 (� 0.3) 9 1010 mL�1. Independent of
the dye used, the magnitude of cells counted was in the
same range (1010 cells mL�1). Furthermore, 75 micro-
graphs of autofluorescent methanogenic cells (coenzyme
F420) showed on average, 3.5 (� 0.78) 9 108 archaea
mL�1 were in the reactor, accounting for 2.3% of
the total prokaryotic cells. Additionally, 26 micrographs
of DAPI stained cells showed on average 2.03
(� 1.05) 9 108 cells mL�1 in the reactor of presumably
fungal origin (Fig. 1). In the micrographs, the fungal cells
showed a more intensive fluorescent and were on average
seven times bigger than prokaryotic cells. Fungal cell had
a mean circumference of 7.7 (�1.8) lm with an expanse
of 2.8 (�1.0) lm2.
Molecular and phylogenetic analysis
In total, 120 randomly selected clones of the clone
libraries tested positive for expected DNA fragments: 62
clones contained bacterial 16S rRNA gene fragments
(54% positive clones within the respective library), 38
clones contained archaeal 16S rRNA gene fragments
(39%), and 20 clones contained eukaryotic 18S rRNA
gene fragments (30%).
According to the respective RFLP banding pattern, rep-
resentative whole DNA fragments were sequenced: 43 of
the bacterial and archaeal 16S rRNA gene fragments as
well as 16 of the eukaryotic 18S rRNA gene fragments.
All nonchimeric representative sequences were used for
phylogenetic classification. The sequences were also used
to classify DNA fragments showing identical RFLP band-
ing pattern (OTUs) according the representative 16S
rRNA gene sequence. Thus, OTUs were of the same fam-
ily (Table S2). Bacterial 16S rRNA gene sequences were
classified using the RDP Classifier (95% confidence
threshold) at least to the family level. Clostridiaceae,
Erysipelotrichaceae, Lactobacillaceae, Ruminococcaceae,
Thermoanaerobacteraceae, Caldilineaceae, and Porphyromo-
nadaceae within the phyla Firmicutes, Chloroflexi, and
Bacteroidetes were identified. Comparing the RFLP band-
ing pattern, it was found that Caldilineaceae, Clostridia-
ceae, Erysipelotrichaceae, and Ruminococcaceae were
dominating the bacterial OTUs in the clone library (Table
S2). The RFLP results also showed the archaeal commu-
nity was less diverse than the bacterial community. The
archaeal 16S rRNA gene clone library was dominated by
OTUs assigned to the family Methanomicrobiaceae
especially with the two species Methanoculleus sp. and
Fig. 1. Epifluorescence micrograph showing cells of biogas reactor
content. Cells were stained with DAPI. Cells marked by arrows are
presumable of fungal origin.
FEMS Microbiol Ecol && (2012) 1–12 ª 2012 Federation of European Microbiological SocietiesPublished by Blackwell Publishing Ltd. All rights reserved
Microbial community in a mesophilic anaerobic reactor 5

Methanoculleus bourgensis (Table S2). Only two clones
contained archaeal 16S rRNA gene from the genus Met-
hanosarcina (RDP Classifier, 95% confidence threshold)
belonging to the family Methanosarcinaceae.
For bacterial phylogenetic tree reconstruction, 20 bacte-
rial 16S rRNA gene sequences obtained from the clone
library as well as 40 16S rRNA gene sequences retrieved
from RDP were used. The corresponding phylogenetic
tree (Fig. 2) is based on the MAFFT alignment and is in
accordance with the current taxonomic classification in
terms of a correct arrangement of all sequences. Lactoba-
cillus delbrueckii, Proteiniphilum acetatigenes, Alkaliphilus
oremlandii, and Clostridium isatidis were identified at spe-
cies level with 97% sequence identity. To root the tree,
two archaeal 16S rRNA gene sequences were used as out-
group. The trees based on MUSCLE or ClustalW align-
ments computed with MrBayes 3.1.2 were not correct in
terms of sequence arrangements for this specific 16S
rRNA gene sequence set (data not shown). Nine
sequences obtained from the archaeal clone library and
13 reference sequences chosen from RDP were used to
reconstruct the phylogenetic tree. The resulting tree (Fig.
S1) is also based on a MAFFT alignment. Two bacterial
16S rRNA gene sequences were used as outgroup. Recon-
structed trees based on MUSCLE and ClustalW align-
ments showed an analogous structure (data not shown).
Methanoculleus bourgensis was identified at species level
with 97% sequence identity. Nine 18S rRNA gene
sequences from the eukaryotic clone library and 14 refer-
ence sequences chosen from the NCBI GenBank were
used for reconstruction of the phylogenetic tree. The cor-
responding tree (Fig. 3) was reconstructed based on MA-
FFT alignment showing 18S rRNA gene sequences related
to the genera Mucor, Saccharomyces, and two so far
uncultured fungi. These fungal 18S rRNA gene sequences
were classified into the orders Mucoromycotina, Saccharo-
mycotina, and Pucciniomycotina. Analyses with MUSCLE
and ClustalW revealed analogous results (data not
shown).
DGGE
Six samples were drawn from the biogas reactor over a
period of 1 year (Table 1) to monitor the composition of
the microbial community (bacteria, archaea, and eukary-
otes) by DGGE. The ICS was developed for DGGE analy-
sis based on sequenced 16S rRNA gene fragments of the
bacterial clone library. By sequence alignment and com-
parison, it was confirmed that 16S rRNA gene fragments
from the ICS were homologous to 16S rRNA gene frag-
ments within the banding pattern obtained from genomic
DNA extracts (data not shown). Thus, the ICS was used
to analyze whether those bacterial families were constantly
present in all samples drawn. As shown in Fig. 4, almost
each band of the ICS was found in banding patterns of
the reactor samples (lanes 1 to 6), demonstrating that the
following members of the bacterial community were pres-
ent throughout the whole sampling time (1 year): Erysipe-
lotrichaceae (42 Bac), Porphyromonadaceae (5 and 33
Bac), Ruminococcaceae (7 Bac oFk), and Clostridiaceae (6
Bac and 7 Bac). The bands for Lactobacillaceae (13 Bac)
and Caldilineaceae (1 Bac) were absent in the banding
pattern of lanes 5 and 6 (Fig. 4). Each banding pattern
showed on average 17 (�2) bands that could not be iden-
tified by means of the ICS. Considering this, the diversity
of the bacterial community was at least 2.5 times higher
compared with the seven families described in the bacte-
rial phylogenetic tree (Fig. 2).
To compute similarities between the six analyzed band-
ing patterns, a homology dendrogram (Fig. S2) was
deduced from Fig. 4. On average, 25 independent distinct
bands were detectable in each banding pattern (lanes 3 to
8). Thereof, 16 to 18 independent bands were perma-
nently present in all lanes. The homology dendrogram of
the banding patterns displayed that these lanes were at
least 75–80% similar to each other (Fig. S2). Although an
identical composition of 16S rRNA gene fragments in the
ICS2, the UPGMA method computed an only 80%
homology value. Lanes 1 and 10 represent the ICS 1, and
due to some inconsistent bands such as 20 Bac (Fig. 4),
the value of homology was even lower (70%). Consider-
ing the DGGE banding patterns and the homology den-
drogram, the bacterial community remains similar over
the period of 1 year. The banding patterns of the archaeal
16S rRNA gene fragments from all six reactor samples
were highly similar to each other and were composed of
three bands (Fig. S3). Three archaeal 16S rRNA gene frag-
ments (letters a, b, c in Fig. S3) were excised from the
gel. Sequencing led to the 16S rRNA gene sequences from
Methanosarcina sp., Methanoculleus sp., and M. bourgen-
sis, respectively. The banding patterns of the eukaryotic
18S rRNA gene fragments were very similar for all six
samples (Fig. 5). 18S rRNA gene fragments for DGGE
experiments were amplified with the same primer set
used for the assembly of the clone library (Table S1), and
therefore, the eukaryotic community in the biogas reactor
was dominated by fungi (Fig. 3). The presence of these
fungi did not change over the time period of 1 year
(Fig. 5).
Discussion
The biogas plant located near Aulendorf in Baden-
W€urttemberg was chosen for the investigation of the
microbial community, because of its diverse substrate
supply. The plant is predominantly fed with sanitized
ª 2012 Federation of European Microbiological Societies FEMS Microbiol Ecol && (2012) 1–12Published by Blackwell Publishing Ltd. All rights reserved
6 F.R. Bengelsdorf et al.

Fig. 2. Phylogenetic tree based on bacterial 16S rRNA gene sequences (approximately 1500 bp per sequence) from sample no. 3 of biogas
reactor content. Estimation is based on Bayesian inference and MAFFT alignment.
FEMS Microbiol Ecol && (2012) 1–12 ª 2012 Federation of European Microbiological SocietiesPublished by Blackwell Publishing Ltd. All rights reserved
Microbial community in a mesophilic anaerobic reactor 7

food residues and stale bread. The use of these substrates
is in contrast to most other biogas plants in Germany,
which were predominantly supplied with renewable bio-
mass such as maize silage (Biogas, 2012).
Three different staining dyes that intercalate into DNA
were used to ensure the microscopic detection of all
groups of microorganisms in the biogas reactor. The total
cell number of the microbial community was in the range
of 1010 cells mL�1 reactor content, independent of stain-
ing with either AO, DAPI, or SYBR® GOLD. Using DAPI
staining, Nettmann et al. (2010) reported total cell num-
bers in the range of 108 cells mL�1 for six different biogas
plants, and Krakat et al. (2010) found approximately
1010 cells mL�1 reactor content in a 6-L laboratory-scale
reactor. Concerning the methanogenic archaea, our
results differ also from the mentioned studies. Krakat
et al. (2010) detected 16–20% methanogenic archaea of
total cell number in the laboratory-scale reactor. In con-
trast, Nettmann et al. (2010) detected 3–7% methanogen-
ic archaea of total cell numbers in biogas plants, which is
closer to the corresponding 2.3% found in this study.
Cells of presumably fungal origin differ clearly from
prokaryotic cells (Fig. 1). They are characterized by a
more intensified fluorescence compared with prokaryotic
Fig. 3. Phylogenetic tree based on eukaryotic, particularly fungi 18S
rRNA gene sequences (approximately 530 bp per sequence) from
sample no. 3 of biogas reactor content. Estimation is based on
Bayesian inference and MAFFT alignment.
Fig. 4. DGGE profiles of bacterial 16S rRNA gene fragments (200 bp)
amplified from genomic DNA extracted from samples of the biogas
reactor. Lanes: ICS 1, mix of sequenced 16S rRNA gene fragments
from Firmicutes; ICS 2, mix of sequenced 16S rRNA gene fragments
from Chloroflexi and Bacteroidetes. Lanes: 1 to 6: samples from the
biogas reactor in the order 4, 1, 2, 3, 5, 6 (Table 1).
Fig. 5. DGGE profiles of eukaryotic 18S rRNA gene fragments
(530 bp) amplified from genomic DNA extracted from samples of the
biogas reactor. Lanes: 1 to 6, samples from the biogas reactor in the
order 1, 2, 3, 4, 5, 6 (Table 1).
ª 2012 Federation of European Microbiological Societies FEMS Microbiol Ecol && (2012) 1–12Published by Blackwell Publishing Ltd. All rights reserved
8 F.R. Bengelsdorf et al.

cells, which is certainly due to the higher DNA content in
the nucleus of fungi cells. The mean circumference and
expanse of those fungal-like cells were on average above
the usual size of prokaryotic cells (circumference 7.09,
expanse 2.69). Their estimated abundance was in the
same range as the methanogenic archaea (of
108 cells mL�1), but two magnitudes below the total cell
number. Still, such differences in estimating microbial
abundances using microscopically methods underline the
need to further investigate the cell numbers of bacteria,
archaea, and fungi in biogas reactors.
A further attention of this study was to identify the
dominating community members within the anaerobic
reactor. As in other mesophilic biogas plants, the bacte-
rial community (Fig. 2) was dominated by the phyla
Firmicutes and Bacteroidetes (Schl€uter et al., 2008; Liu
et al., 2009). However, the composition of bacterial fam-
ilies in the investigated biogas reactor clearly differs to
that of previous described reactors (Schl€uter et al., 2008;
Weiss et al., 2008; Goberna et al., 2009; Liu et al., 2009).
Only a few of the bacterial species found in this study
were also reported in the mentioned studies, including
P. acetatigenes, A. oremlandii, and Lactobacillus sp. Only
members belonging to the genus Clostridium seem to be
ubiquitous in all biogas plants. The methanogenic com-
munity of the reactor was dominated by the genus
Methanoculleus (Fig. S2, Table S2). Seven different stud-
ies (Schn€urer et al., 1999; Weiss et al., 2008; Cardinali-
Rezende et al., 2009; Goberna et al., 2009; Kr€ober et al.,
2009; Liu et al., 2009; Nettmann et al., 2010) showed
that the genus Methanoculleus predominates microbial
communities of full-scale biogas reactors. Nettmann
et al. (2010) pointed out that the hydrogenotrophic
genus Methanoculleus was the predominant group of
methanogens in five of six mesophilic biogas reactors
supplied with liquid manure (pig and cattle) and renew-
able raw materials (maize silage). In the analytical proce-
dure when constructing clone libraries, the numbers of
relevant fragments were low (Table S2). This is due to
the fact that cloned DNA fragments showing identical
RFLP banding pattern were described as an OTU. RFLP
analyses were performed from the respective clone
library until no further OTU was found. The OTUs
obtained from each clone library were considered to be
the dominating members of the microbial community.
Furthermore, the cloning and sequencing approach of
DNA fragments does not detect members of the micro-
bial community that appear at low abundance (Sogin
et al., 2006).
This study provides the first qualitative and quantita-
tive assessment of fungi in a full-scale biogas reactor. Ear-
lier studies by Ravella et al. (2010) showed that a
laboratory-scale biogas reactor is an appropriate habitat
for fungi as viable strains of different yeasts could be iso-
lated under aerobic conditions. The origin of the fungal
cells found in the present study remains unclear. It is
possible that they were brought into the biogas reactor by
the substrate stale bread, or alike. Saccharomyces, Mucor,
and fungi from the subphylum Pucciniomycotina were
detected (Fig. 3), and their presence was confirmed over
a time span of 15 months (Fig. 5). The fact that the bio-
gas reactor investigated here is not utilizing any residues
from cattle breeding makes it obvious that fungi are sus-
taining members of the microbial community. The
applied methods used for detection (clone library and
microscopy) of fungi do not prove any enzymatic activity
of the cells. Furthermore, the primers used for amplifica-
tion of 18S rRNA gene amplified a high number of chi-
meric fragments (Table S2). For subsequent analysis of
fungal communities in biogas reactors, it is recommended
to directly amplify the fungal internal transcribed spacer
(ITS) regions.
So far, there is little known about abundance and func-
tion of fungi in microbial communities of biogas reactors.
Fliegerov�a et al. (2010) evaluated the diversity of anaero-
bic fungi within cow manure obtained from input
homogenizing tank of a biogas plant. The authors sug-
gested that fungi possibly contribute to hydrolytic pro-
cesses inside a biogas reactor. In the anaerobic biological
treatment, anaerobic fungi are known to enhance the bio-
gas yield (Proch�azka et al., 2012), and yeasts, to accelerate
the decomposition rate of substrate (Olcay & Kocasoy,
2004) in laboratory-scale reactors. Such a consequence is
already known for probiotic yeasts as feed additive for
cattle in ruminal fermentation, especially cultures of Sac-
charomyces cerevisiae and their extracts (Wallace, 1994;
Tripathi et al., 2008). Lila et al. (2004) showed that living
cells of S. cerevisiae increased the numbers of total viable
bacteria and especially cellulolytic bacteria in the rumen
of cows, but had no effect on the concentration of hydro-
gen and methane in rumen gases. S. cerevisiae in biogas
plants could have similar effects regarding an increase in
cellulolytic bacteria and thereby the decomposition of cel-
lulose-rich substrates. This means the decomposition of
cellulose-rich substrates could be increased in full-scale
biogas reactors using yeasts. Members of the fungal genus
Mucor can be found in soil and environmental samples
worldwide (Ribes et al., 2000). Mucoralean fungi (Santi-
ago & Motta, 2008), especially Mucor sp. (Alves et al.,
2005), are characterized by a high protease activity that
could improve the digestion of organic residues in biogas
plants. The other fungal subphylum Pucciniomycotina
includes more than 8000 described species; thus, all fur-
ther conclusions would be highly speculative. In sum-
mary, it is important to point out that the presence of
fungi in a biogas reactor as reported here could improve
FEMS Microbiol Ecol && (2012) 1–12 ª 2012 Federation of European Microbiological SocietiesPublished by Blackwell Publishing Ltd. All rights reserved
Microbial community in a mesophilic anaerobic reactor 9

and broaden the potential of various substrates for biogas
production.
DGGE experiments monitored the bacterial and
archaeal 16S rRNA gene as well as eukaryotic 18S rRNA
gene composition and showed a homogeneous microbial
community over a 15-month period (Figs 4 and 5, Figs
S2 and S3). Concluding from DGGE results (Figs 4 and
S2), the bacterial community does not show a stable
composition over time. However, the chosen 16S rRNA
gene fragments for the ICS represented the dominating
bacteria in the biogas reactor, and occurrence of the
respective bands within the six different DGGE patterns
were expected. This was true for all bands classified on
family level of the ICS (Fig. 4) and supported by the
corresponding homology dendrogram (Fig. S2). There-
fore, the bacterial community remains similar (75–80%)
over the period of 1 year and was only affected in a
minor degree by variations in the substrate supply. The
archaeal and fungal communities (Fig. 5, Fig. S3) stayed
highly similar within the investigated period. Altogether,
DGGE results propose that the majority of the micro-
bial community was not (archaea and fungi) or just in
a minor degree (bacteria) affected by variations in the
substrate composition. The only available long-term
study that reported similar analysis was performed for a
thermophilic biogas plant (Weiss et al., 2008). Over
more than 2 years of investigation, a stable microbial
composition was observed. Additionally, Kampmann
et al. (2012b) used other noncultural detection systems
(SSCP) and suggested also stability of the bacterial
phyla Bacteroidetes and Firmicutes during the digestion
of defined substrates in 200-liter biogas reactors. DGGE
results were assessed only qualitatively, because the
intensity of single bands in the DGGE pattern is no
reliable measure for quantification (Weiss et al., 2008).
In general, the DGGE method of Muyzer et al. (1993)
has some notable limitations. On one hand, bands in
the same position in different lanes can belong to dif-
ferent microorganisms as shown in Fig. 4 (ICS 1 and 2,
see 1 Bac and 13 Bac as well as 6 Bac and 33 Bac),
and on the other hand, one 16S rRNA gene fragment
can occur in double bands in DGGE profiles (Janse
et al., 2004).
This study revealed that the composition of the micro-
bial community (bacteria, archaea, and fungi) in a full-
scale biogas reactor utilizing various substrates was con-
sistent over more than 1-year period (Figs 4 and 5, Figs
S3). It underlines that due to various interactions between
its members, the anaerobic ecosystem of the reactor has
highly resilient and can withstand changes in substrate
feeding. The role of anaerobic fungi in the complex deg-
radation of cellulose-rich substrates should receive more
attention in future biogas research.
Acknowledgements
The Baden-W€urttemberg Stiftung, Biomass to Energy
program (Project No, Bio 06) funded this study. We are
very thankful to Prof. P. D€urre at the Ulm University for
providing laboratory space. We gratefully acknowledge
Mrs. M. K€oster for her support during epifluorescence
analysis and Mrs. E. Salzer as well as Mr. S. Br€andel for
their excellent technical service. We are very thankful to
Mr. A. Allgayer for providing access to his biogas plant.
The authors are also very grateful to Prof. C. Gliesche
and Mr. M. Barsch for providing computing capacity to
reconstruct the phylogenetic trees. We would like to
thank Dr. M. Othman and Dr. T. Huynh for critical read-
ing of the manuscript.
References
Ahring BK (2003) Perspectives for anaerobic digestion. Adv
Biochem Eng Biotechnol 81: 1–30.Akin DE & Borneman WS (1990) Role of rumen fungi in fiber
degradation. J Dairy Sci 73: 3023–3032.Akin DE & Rigsby LL (1987) Mixed fungal populations and
lignocellulosic tissue degradation in the bovine rumen. Appl
Environ Microbiol 53: 1987–1995.Alves MH, de Campos-Takaki GM, Okada K, Pessoa IHF &
Milanez AI (2005) Detection of extracellular protease in
Mucor species. Rev Iberoam Micol 22: 114–117.Ashelford KE, Chuzhanova NA, Fry JC, Jones AJ &
Weightman AJ (2006) New screening software shows
that most recent large 16S rRNA gene clone libraries
contain chimeras. Appl Environ Microbiol 72:
5734–5741.Biogas (2012) Ausgangsstoffe. pp. 18, Fachagentur
Nachwachsende Rohstoffe e. V. (FNR) (www.FNR.de)
Bestell-Nr. 175: 1-42.
Bodelier PLE, Meima-Franke M, Zwart G & Laanbroek HJ
(2005) New DGGE strategies for the analyses of
methanotrophic microbial communities using different
combinations of existing 16S rRNA-based primers. FEMS
Microbiol Ecol 52: 163–174.Cardinali-Rezende J, Debarry R, Colturato L, Carneiro E,
Chartone-Souza E & Nascimento A (2009) Molecular
identification and dynamics of microbial communities in
reactor treating organic household waste. Appl Microbiol
Biotechnol 84: 777–789.Cirne DG, Lehtom€aki A, Bj€ornsson L & Blackall LL (2007)
Hydrolysis and microbial community analyses in two-stage
anaerobic digestion of energy crops. J Appl Microbiol 103:
516–527.Daims H, Stoecker K & Wagner M (2005) Fluorescence in
situ hybridization for the detection of prokaryotes.
Advanced Methods in Molecular Microbial Ecology (Osborn
AM & Smith CJ, eds), pp. 213–239. Bios-Garland,Abingdon, UK.
ª 2012 Federation of European Microbiological Societies FEMS Microbiol Ecol && (2012) 1–12Published by Blackwell Publishing Ltd. All rights reserved
10 F.R. Bengelsdorf et al.

Eder W, Ludwig W & Huber R (1999) Novel 16S rRNA gene
sequences retrieved from highly saline brine sediments of
Kebrit Deep, Red Sea. Arch Microbiol 172: 213–218.Edgar RC (2004) MUSCLE: multiple sequence alignment with
high accuracy and throughput. Nucleic Acids Res 32:
1792–1797.Fliegerov�a K, Mr�azek J, Hoffmann K, Z�abransk�a J & Voigt K
(2010) Diversity of anaerobic fungi within cow manure
determined by ITS1 analysis. Folia Microbiol 55: 319–325.Fotidis IA, Karakashev D, Kotsopoulos TA, Martzopoulos
GG & Angelidaki I (2012) Effect of ammonium and
acetate on methanogenic pathway and methanogenic
community composition. FEMS Microbiol Ecol 83: 38–48.Goberna M, Insam H & Franke-Whittle IH (2009) Effect of
biowaste sludge maturation on the diversity of thermophilic
bacteria and archaea in an anaerobic reactor. Appl Environ
Microbiol 75: 2566–2572.Inoue H, Nojima H & Okayama H (1990) High efficiency
transformation of Escherichia coli with plasmids. Gene 96:
23–28.Janse I, Bok J & Zwart G (2004) A simple remedy against
artifactual double bands in denaturing gradient gel
electrophoresis. J Microbiol Methods 57: 279–281.Kampmann K, Ratering S, Baumann R, Schmidt M, Zerr W &
Schnell S (2012a) Hydrogenotrophic methanogens dominate
in biogas reactors fed with defined substrates. Syst Appl
Microbiol 35: 404–413.Kampmann K, Ratering S, Kramer I, Schmidt M, Zerr W &
Schnell S (2012b) Unexpected stability of Bacteroidetes and
Firmicutes communities in laboratory biogas reactors fed
with different defined substrates. Appl Environ Microbiol 78:
2106–2119.Katoh K & Toh H (2008) Recent developments in the MAFFT
multiple sequence alignment program. Brief Bioinform 9:
286–298.Koski LB & Golding GB (2001) The closest BLAST hit is often
not the nearest neighbor. J Mol Evol 52: 540–542.Krakat N, Westphal A, Schmidt S & Scherer P (2010)
Anaerobic digestion of renewable biomass: thermophilic
temperature governs population dynamics of methanogens.
Appl Environ Microbiol 76: 1842–1850.Krause DO, Denman SE, Mackie RI, Morrison M, Rae AL,
Attwood GT & McSweeney CS (2003) Opportunities to
improve fiber degradation in the rumen: microbiology,
ecology, and genomics. FEMS Microbiol Rev 27: 663–693.Kr€ober M, Bekel T, Diaz NN et al. (2009) Phylogenetic
characterization of a biogas plant microbial community
integrating clone library 16S-rDNA sequences and
metagenome sequence data obtained by 454-
pyrosequencing. J Biotechnol 142: 38–49.Lane DJ (1991) 16S/23S rRNA sequencing. Nucleic Acid
Techniques in Bacterial Systematics (Stackebrandt E &
Goodfellow M, eds), pp. 115–175. Wiley, New York.
Larkin MA, Blackshields G, Brown NP et al. (2007) Clustal W
and Clustal X version 2.0. Bioinformatics 23: 2947–2948.
Laukenmann S, Polag D, Heuwinkel H, Greule M, Gronauer
A, Lelieveld J & Keppler F (2010) Identification of
methanogenic pathways in anaerobic digesters using stable
carbon isotopes. Eng Life Sci 10: 509–514.Lila ZA, Mohammed N, Yasui T, Kurokawa Y, Kanda S &
Itabashi H (2004) Effects of a twin strain of Saccharomyces
cerevisiae live cells on mixed ruminal microorganism
fermentation in vitro. J Anim Sci 82: 1847–1854.Liu FH, Wang SB, Zhang JS, Zhang J, Yan X, Zhou HK, Zhao
GP & Zhou ZH (2009) The structure of the bacterial and
archaeal community in a biogas digester as revealed by
denaturing gradient gel electrophoresis and 16S rDNA
sequencing analysis. J Appl Microbiol 106: 952–966.Lliros M, Gich F, Plasencia A, Auguet J, Darchambeau F,
Casamayor EO, Descy J & Borrego C (2010) Vertical
distribution of ammonia-oxidizing crenarchaeota and
methanogens in the epipelagic waters of Lake Kivu
(Rwanda-Democratic Republic of the Congo). Appl Environ
Microbiol 76: 6853–6863.Muyzer G, de Waal EC & Uitterlinden AG (1993) Profiling of
complex microbial populations by denaturing gradient gel
electrophoresis analysis of polymerase chain reaction-
amplified genes coding for 16S rRNA. Appl Environ
Microbiol 59: 695–700.Nettmann E, Bergmann I, Mundt K, Linke B & Klocke M
(2008) Archaea diversity within a commercial biogas plant
utilizing herbal biomass determined by 16S rDNA and mcrA
analysis. J Appl Microbiol 105: 1835–1850.Nettmann E, Bergmann I, Pramschufer S, Mundt K, Plogsties
V, Herrmann C & Klocke M (2010) Polyphasic analyses of
methanogenic archaea communities in agricultural biogas
plants. Appl Environ Microbiol 76: 2540–2548.Nicol GW, Glover LA & Prosser JI (2003) The impact of
grassland management on archaeal community structure in
upland pasture rhizosphere soil. Environ Microbiol 5:
152–162.Olcay O & Kocasoy G (2004) Acceleration of the
decomposition rate of anaerobic biological treatment.
J Environ Sci Heal A 39: 1083–1093.Orpin CG & Joblin KN (1997) The rumen anaerobic fungi.
The Rumen Microbial Ecosystem (Hobson PN & Stewart CS,
eds), pp. 145–184. Chapman and Hall, New York.
O’Sullivan LA, Webster G, Fry JC, Parkes RJ & Weightman AJ
(2008) Modified linker-PCR primers facilitate complete
sequencing of DGGE DNA fragments. J Microbiol Methods
75: 579–581.Proch�azka J, Mr�azek J, Strosov�a L, Fliegerov�a K, Z�abransk�a J &
Doh�anyos M (2012) Enhanced biogas yield from energy
crops with rumen anaerobic fungi. Eng Life Sci, 12: 343–351.Ravella SR, James SA, Bond CJ, Roberts IN, Cross K, Reiter A
& Hobbs PJ (2010) Cryptococcus shivaji sp. nov.: a novel
basidiomycetous yeast isolated from biogas reactor. Curr
Microbiol 60: 12–16.Ribes JA, Vanover-Sams CL & Baker DJ (2000) Zygomycetes in
human disease. Clin Microbiol Rev 13: 236–301.
FEMS Microbiol Ecol && (2012) 1–12 ª 2012 Federation of European Microbiological SocietiesPublished by Blackwell Publishing Ltd. All rights reserved
Microbial community in a mesophilic anaerobic reactor 11
Ronquist F & Huelsenbeck JP (2003) MrBayes 3: Bayesian
phylogenetic inference under mixed models. Bioinformatics
19: 1572–1574.Santiago ALCM & Motta CM (2008) Isolation of Mucorales
from processed maize (Zea mays L.) and screening for
protease activity. Braz J Microbiol 39: 698–700.Scanlan PD & Marchesi JR (2008) Micro-eukaryotic diversity
of the human distal gut microbiota: qualitative assessment
using culture-dependent and -independent analysis of faeces.
ISME J 2: 1183–1193.Schink B (1997) Energetics of syntrophic cooperation in
methanogenic degradation. Microbiol Mol Biol Rev 61: 262–280.
Schl€uter A, Bekel T, Diaz NN et al. (2008) The metagenome of
a biogas-producing microbial community of a production-
scale biogas plant fermenter analysed by the 454-
pyrosequencing technology. J Biotechnol 136: 77–90.Schn€urer A, Zellner G & Svensson BH (1999) Mesophilic
syntrophic acetate oxidation during methane formation in
biogas reactor. FEMS Microbiol Ecol 29: 249–261.Smalla K, Oros-Sichler M, Milling A, Heuer H, Baumgarte S,
Becker R, Neuber G, Kropf S, Ulrich A & Tebbe CC (2007)
Bacterial diversity of soils assessed by DGGE, T-RFLP and
SSCP fingerprints of PCR-amplified 16S rRNA gene
fragments: Do the different methods provide similar results?
J Microbiol Methods 69: 470–479.Sogin ML, Morrison HG, Huber JA, Welch DM, Huse SM,
Neal PR, Arrieta JM & Herndl GJ (2006) Microbial diversity
in the deep sea and the underexplored ‘rare biosphere’.
PNAS 103: 12115–12120.Solera R, Romero LI & Sales D (2001) Analysis of the methane
production in thermophilic anaerobic reactors: use of
autofluorescence microscopy. Biotechnol Lett 23: 1889–1892.Tripathi VK, Sehgal JP, Puniya AK & Singh K (2007)
Hydrolytic activities of anaerobic fungi from wild blue bull
(Boselaphus tragocamelus). Anaerobe 13: 36–39.Tripathi MK, Karim SA, Chaturvedi OH & Verma DL
(2008) Effect of different liquid cultures of live yeast
strains on performance, ruminal fermentation and
microbial protein synthesis in lambs. J Anim Physiol Anim
Nutr 92: 631–639.Ushida K (2011) Symbiotic methanogens and rumen ciliates.
(Endo)Symbiotic Methanogenic Archaea, Vol. 19 (Hackstein
JHP, ed), pp. 25–34. Springer, Berlin/Heidelberg.
Wallace RJ (1994) Ruminal microbiology, biotechnology, and
ruminant nutrition: progress and problems. J Anim Sci 72:
2992–3003.Weiland P (2010) Biogas production: current state and
perspectives. Appl Microbiol Biotechnol 85: 849–860.
Weiss A, J�erome V, Freitag R & Mayer H (2008) Diversity of
the resident microbiota in a thermophilic municipal biogas
plant. Appl Microbiol Biotechnol 81: 163–173.Whitman W, Bowen T & Boone D (2006) The Methanogenic
Bacteria. The Prokaryotes, Vol. 3 (Dworkin M, Falkow S,
Rosenberg E, Schleifer K & Stackebrandt E, eds), pp. 165–207. Springer, New York.
Wiesenthal T, Mourelatou A, Petersen J & Taylor P (2006)
How much bioenergy can Europe produce without harming
the environment? Eur Environ Agency 7: 1–70.Williams AG & Coleman GS (1997) The rumen protozoa. The
Rumen Microbial Ecosystem (Hobson PN & Stewart CS,
eds), pp. 73–139. Chapman and Hall, New York.
Woodman ME (2005) Direct PCR of intact bacteria (colony
PCR). Current Protocols in Microbiology, Vol. 9 (Coico R,
Kowalik T, Quarles J, Stevenson B & Taylor R, eds), pp.
A.3D.1–A.3D.6. John Wiley & Sons, Inc., Hoboken (USA).
Wubah DA, Akin DE & Bomeman WS (1993) Biology, fiber-
degradation, and enzymology of anaerobic zoosporic fungi.
Crit Rev Microbiol 2: 99–115.Yamada N, Suzumura M, Tsurushima N & Harada K (2008)
Impact on bacterial activities of ocean sequestration of
carbon dioxide into bathypelagic layers. OCEANS 2008 -
MTS/IEEE Kobe Techno-Ocean 1–3.Zak M (2012) Einfluss pflanzlicher Biofilmtr€ager auf die
Verg€arung von Speiseresten. PhD Thesis, Institute for
Systematic Botany and Ecology, University of Ulm, Ulm,
Germany.
Supporting Information
Additional Supporting Information may be found in the
online version of this article:
Fig. S1. Phylogenetic tree based on archaeal 16S rDNA
sequences (approximately 1500 bp per sequence) from
sample no. 3 of biogas reactor content.
Fig. S2. Homology dendrogram deduced from Fig. 4
computed using Gel Analyser software (biocompare®).
Fig. S3. DGGE profiles of archaeal 16S rDNA fragments
(180 bp) amplified from genomic DNA extracted from
samples of the biogas reactor.
Table S1. Primers used for amplification of 16S/18 rDNA
fragments of bacteria (27F, 1492r), archaea (8aF, 1512uR)
and eukaryotes (Euk1a, Euk516r-GC) to construct clone
libraries.
Table S2. 16S and 18S rDNA sequences from the respec-
tive clone libraries.
ª 2012 Federation of European Microbiological Societies FEMS Microbiol Ecol && (2012) 1–12Published by Blackwell Publishing Ltd. All rights reserved
12 F.R. Bengelsdorf et al.
Copyright © 2022 FDOKUMEN