Linking the Composition of Bacterial and Archaeal ...
20
University of Groningen Linking the composition of bacterial and archaeal communities to characteristics of soil and flora composition in the Atlantic rainforest Lima-Perim, Julia Elidia; Romagnoli, Emiliana Manesco; Dini-Andreote, Francisco; Durrer, Ademir; Dias, Armando Cavalcante Franco; Andreote, Fernando Dini Published in: PLoS ONE DOI: 10.1371/journal.pone.0146566 IMPORTANT NOTE: You are advised to consult the publisher's version (publisher's PDF) if you wish to cite from it. Please check the document version below. Document Version Publisher's PDF, also known as Version of record Publication date: 2016 Link to publication in University of Groningen/UMCG research database Citation for published version (APA): Lima-Perim, J. E., Romagnoli, E. M., Dini-Andreote, F., Durrer, A., Dias, A. C. F., & Andreote, F. D. (2016). Linking the composition of bacterial and archaeal communities to characteristics of soil and flora composition in the Atlantic rainforest. PLoS ONE, 11(1), [e0146566]. https://doi.org/10.1371/journal.pone.0146566 Copyright Other than for strictly personal use, it is not permitted to download or to forward/distribute the text or part of it without the consent of the author(s) and/or copyright holder(s), unless the work is under an open content license (like Creative Commons). The publication may also be distributed here under the terms of Article 25fa of the Dutch Copyright Act, indicated by the “Taverne” license. More information can be found on the University of Groningen website: https://www.rug.nl/library/open-access/self-archiving-pure/taverne- amendment. Take-down policy If you believe that this document breaches copyright please contact us providing details, and we will remove access to the work immediately and investigate your claim. Downloaded from the University of Groningen/UMCG research database (Pure): http://www.rug.nl/research/portal. For technical reasons the number of authors shown on this cover page is limited to 10 maximum.
-
Upload
khangminh22 -
Category
Documents
-
view
1 -
download
0
Transcript of Linking the Composition of Bacterial and Archaeal ...

University of Groningen
Linking the composition of bacterial and archaeal communities to characteristics of soil andflora composition in the Atlantic rainforestLima-Perim, Julia Elidia; Romagnoli, Emiliana Manesco; Dini-Andreote, Francisco; Durrer,Ademir; Dias, Armando Cavalcante Franco; Andreote, Fernando DiniPublished in:PLoS ONE
DOI:10.1371/journal.pone.0146566
IMPORTANT NOTE: You are advised to consult the publisher's version (publisher's PDF) if you wish to cite fromit. Please check the document version below.
Document VersionPublisher's PDF, also known as Version of record
Publication date:2016
Link to publication in University of Groningen/UMCG research database
Citation for published version (APA):Lima-Perim, J. E., Romagnoli, E. M., Dini-Andreote, F., Durrer, A., Dias, A. C. F., & Andreote, F. D. (2016).Linking the composition of bacterial and archaeal communities to characteristics of soil and floracomposition in the Atlantic rainforest. PLoS ONE, 11(1), [e0146566].https://doi.org/10.1371/journal.pone.0146566
CopyrightOther than for strictly personal use, it is not permitted to download or to forward/distribute the text or part of it without the consent of theauthor(s) and/or copyright holder(s), unless the work is under an open content license (like Creative Commons).
The publication may also be distributed here under the terms of Article 25fa of the Dutch Copyright Act, indicated by the “Taverne” license.More information can be found on the University of Groningen website: https://www.rug.nl/library/open-access/self-archiving-pure/taverne-amendment.
Take-down policyIf you believe that this document breaches copyright please contact us providing details, and we will remove access to the work immediatelyand investigate your claim.
Downloaded from the University of Groningen/UMCG research database (Pure): http://www.rug.nl/research/portal. For technical reasons thenumber of authors shown on this cover page is limited to 10 maximum.

RESEARCH ARTICLE
Linking the Composition of Bacterial andArchaeal Communities to Characteristics ofSoil and Flora Composition in the AtlanticRainforestJulia Elidia Lima-Perim1, Emiliana Manesco Romagnoli1, Francisco Dini-Andreote2,Ademir Durrer1, Armando Cavalcante Franco Dias1, Fernando Dini Andreote1*
1 Department of Soil Science, ESALQ/USP, University of São Paulo, Piracicaba, Brazil, 2 Microbial EcologyGroup, Genomic Research in Ecology and Evolution in Nature (GREEN), Groningen Institute for EvolutionaryLife Sciences (GELIFES), University of Groningen, Groningen, The Netherlands
AbstractThe description of microbiomes as intrinsic fractions of any given ecosystem is an impor-
tant issue, for instance, by linking their compositions and functions with other biotic and
abiotic components of natural systems and hosts. Here we describe the archaeal and bac-
terial communities from soils of the Atlantic Rainforest in Brazil. Based on the comparison
of three areas located along an altitudinal gradient—namely, Santa Virginia, Picinguaba
and Restinga—we detected the most abundant groups of Bacteria (Acidobacteria and Pro-teobacteria) and Archaea (Thaumarchaeota, Crenarchaeota and Euryarchaeota). The par-
ticular composition of such communities in each of these areas was first evidenced by
PCR-DGGE patterns [determined for Bacteria, Archaea and ammonia-oxidizing organ-
isms—ammonia-oxidizing archaea (AOA) and bacteria (AOB)]. Moreover, sequence-
based analysis provided a better resolution of communities, which indicated distinct fre-
quencies of archaeal phyla and bacterial OTUs across areas. We found, as indicated by
the Mantel test and multivariate analyses, a potential effect of the flora composition that
outpaces the effect of soil characteristics (either physical and chemical) influencing the
assembly of these microbial communities in soils. Our results indicate a collective role of
the ecosystem underlying observed differences in microbial communities in these soils.
Particularly, we posit that rainforest preservation also needs to take into account the main-
tenance of the soil biodiversity, as this is prompted to influence major processes that affect
ecosystem functioning.
IntroductionThe Brazilian Atlantic Rainforest is a well-known reservoir for biodiversity, hosting approxi-mately 2% of the total species worldwide [1,2]. This biome is characterized as a mosaic of
PLOSONE | DOI:10.1371/journal.pone.0146566 January 11, 2016 1 / 19
OPEN ACCESS
Citation: Lima-Perim JE, Romagnoli EM, Dini-Andreote F, Durrer A, Dias ACF, Andreote FD (2016)Linking the Composition of Bacterial and ArchaealCommunities to Characteristics of Soil and FloraComposition in the Atlantic Rainforest. PLoS ONE 11(1): e0146566. doi:10.1371/journal.pone.0146566
Editor: Christine Moissl-Eichinger, Medical UniversityGraz, AUSTRIA
Received: August 31, 2015
Accepted: December 18, 2015
Published: January 11, 2016
Copyright: © 2016 Lima-Perim et al. This is an openaccess article distributed under the terms of theCreative Commons Attribution License, which permitsunrestricted use, distribution, and reproduction in anymedium, provided the original author and source arecredited.
Data Availability Statement: All sequencing datagenerated in this study have been deposited in theMG-RAST database [54] (accession numbers4570169.3, 4570170.3, 4570171.3, 4570172.3,4570173.3, 4570174.3, 4570175.3, 4570176.3,4570177.3, 4570178.3, 4570179.3 and 4570180.3).
Funding: The authors thank FAPESP (grant 08/50824-1), ACFD (project 2012/14534-4) and CNPq(grant 132094/2010-0) for the financial support.
Competing Interests: The authors have declaredthat no competing interest exist.

ecosystems, with distinct compositions of fauna and flora, driven by the variability of soils,topography and climate conditions along a broad area of occurrence in Brazil [3,4]. The main-tenance of such biome is largely based on the high efficiency of nutritional supply that takesplace at the base of the food web, i.e. in metabolic processes exerted to a large extent by thedwelling soil microbial communities [5–7].
High levels of alpha- and beta-diversities have been reported in microbial communityassessments in rainforest studies [4,8–9]. These communities are known to be highly respon-sive to land-use changes, as, for instance, by the conversion of natural forest areas into agricul-tural fields [3,9,10]. Moreover, microbial communities differ along natural gradients that takeplace within the forest mosaic (e.g. altitudinal gradients [11,12]), diverging in compositionaccording to local fauna and flora compositions [13,14], and even along gradients of naturalforestry recovery [15]. These variations are commonly correlated with changes in soil pH[8,16,17]. In the Atlantic Rainforest, a detailed view of the influence of soil edaphic propertieson the composition of microbial communities has been provided [4], highlighting for pH,organic matter (OM), phosphorus (P) and cation (Ca and Mg) concentrations as the main soilproperties influencing the levels of microbial community composition and diversity in thesesoils.
In a broader view, the variations in soil microbial communities are thought to occur withina normal operating range [18]. However, specific fractions of the soil microbiome are moreresponsive to environmental conditions than others, as for instance, those observed for ammo-nia-oxidizing archaea (AOA) and ammonia-oxidizing bacteria (AOB) [19,20]. Notably, thesefunctional communities have been broadly studied in different soil systems in order to identifycritical environmental parameters affecting their composition and function in natural environ-ments [21,22], and even in the face of anthropogenic impacts [23–25].
In this study, we focused on providing the assessment of the composition, abundance andcharacteristics of two distinct microbial domains (i.e. Bacteria and Archaea) in soils collectedalong a natural altitudinal gradient located in the Brazilian Atlantic Rainforest. We expectedthat the distinct comparison of three micro-climatic areas would allow us to disentangle therelationships among soil characteristics, flora composition and microbial communities. Toachieve that, total bacterial and archaeal communities were profiled, and the specific communi-ties of AOA and AOB, known to be sensitive to environmental shifts, were targeted in thesesoils.
Material and Methods
Ethical StatementThe authorization for sampling the studied areas is regulated by the Brazilian Ministry of Envi-ronment. It issued permission to these sites to the group leader and to the University of SaoPaulo (authorization number 49476–1). We also confirm that this field study did not involveendangered or protected species.
Sampling sites, physical and chemical properties of soilsSoil samples were collected in February 2011, along an altitudinal gradient in the Atlantic Rain-forest located in the North of São Paulo State, Brazil. Soils in this area are mostly classified asYellow-Red Oxisoils, occurring under a dense ombrophylous forest in a region that does nothave dry seasons. At the sampling time, average air temperature was consistent in all threessites, ranging from 18°C to 23°C. All samples were collected under the native forest largelycomposed by high plants (30 to 50 m height).
Soil Microbiome in the Atlantic Rainforest
PLOS ONE | DOI:10.1371/journal.pone.0146566 January 11, 2016 2 / 19

Three distinct areas were selected along a gradient of altitude in the preserved state parkSerra do Mar. The first site, Restinga (23°21' S and 44°51' W), was located at sea level (0 ± 5 m);followed by the site Picinguaba (23°36' S and 44°81' W), at an altitude of 50 to 100 m; and thehighest site, Santa Virginia (23°17’ S and 45°11’W), reaching up to 900 to 1,000 m. In eacharea, four gridded plots were established (10 m x 10 m), approximately 100 m apart from eachother. In each plot, litter materials were removed and ten soil cores (5-cm diameter x 10-cmdepth) were taken using sterile techniques, to represent one composite sample per plot. Thesoil layer sampled (top 10 cm) was chosen since it encompasses the large proportion of the soilbiomass where most of the chemical transformations take place (the ‘active soil layer’). Eachsample was placed in a sterile plastic bag, sealed and transported to the laboratory (<24 h). Allsamples were sieved through a 4.0 mm sieve and stored at -20°C.
For chemical measurements, soil samples were air-dried and sieved through a 100 mesh fordetermination of organic matter (OM), nitrate (N-NO3
-), ammonium (N-NH4+), phosphorous
(P), potassium (K), calcium (Ca), magnesium (Mg), aluminum (Al), boron (B), copper (Cu),iron (Fe), manganese (Mn), zinc (Zn) and pH (Table 1). Physical (sand:silt:clay % content)(Table 1) and chemical analyses were carried out in collaboration with the Laboratory of SoilAnalysis at “Luiz de Queiroz” College of Agriculture (Department of Soil Sciences, ESALQ/USP, Piracicaba, Brazil) according to the method described by [26]. Ammonium and nitrateconcentrations were determined using extraction from 10 g of soil in 50 mL of 2 M KCl,according to the method described by [27].
Additional metadata were added to the soil characterization—i.e. the flora composition persampling site [28]. Information on the abundance of native plants was obtained by descriptiveannual reports submitted to the funding agency (FAPESP—São Paulo Research Foundation)that financed the previous survey [28]. For statistical analyses, the matrix was obtained basedon the description of the number of plant from each species within 1 ha of each sampled area(S1 Table).
DNA extraction from soil samplesDNA was extracted from 0.5 g of initial soil material using the MoBio PowerSoil DNA isolationkit (MoBio Laboratories, Carlsbad, CA, USA), following the manufacturer’s instructions. Thepurity of obtained DNAs was checked on a 1.5% agarose gel run at 90 V for 1 h in 0.5x Tris-acetate-EDTA (TAE) buffer (20 mM Tris, 10 mM acetate, 0.5 mM EDTA, pH 8.0). The gel wasstained with ethidium bromide for 20 min (1.2 mg L-1 ethidium bromide in 0.5x TAE buffer).DNA concentrations were estimated using NanoDrop (Thermo Scientific, USA).
Quantitative real-time PCR (qPCR) of targeted communitiesThe abundances of Bacteria, Archaea, AOA and AOB were quantified by qPCR targeting the16S rRNA and the ammonia monooxygenase (amoA) gene, respectively. For Bacteria, primersP1 and P2 [29] were used, generating fragments of 193 bp. Archaea were quantified using theprimers 340F and 1000R [30], generating fragments of 660 bp. For AOA, primers amo23F [31]and CrenamoA616r48x [32] were used, generating fragments of 624 bp [33]. For AOB, weused a combination of primers, as follows: CTO189fA/CTO189fB, CTO189fC, CTO654r [34]and R1 [35], which generate fragments of 465 bp. Detailed information on cycling conditionsis provided in S2 Table. All quantifications, including positive and negative control reactions(free of DNA from samples), have been done in parallel to monitor potential contamination(s).
Quantifications were carried out twice for each of the soil replicates on the Rotor Gene 6000(Corbett Life Science, Australia). The specificity of amplifications were confirmed by melting-curve analyses, and the expected sizes of the amplified fragments were checked on a 1.5%
Soil Microbiome in the Atlantic Rainforest
PLOS ONE | DOI:10.1371/journal.pone.0146566 January 11, 2016 3 / 19

agarose gel stained with ethidium bromide. Standard curves were obtained using serial dilu-tions (107 to 102 gene copies μL-1) of plasmid containing specific cloned fragments (AOA andAOB), or even environmental PCR products (Archaea and Bacteria), in the case when degener-ated primers were used. The potential inhibitory effects of co-extracted humid compoundswere checked by spiking the samples with a standard concentration of gene copies and amplify-ing the resulting mixes. Consistency in Ct values, and consequently in quantification values,validated our approach. To test for statistically significant differences between gene abundanceswe used the Tukey's test at 5% probability, carried out in the Assistat 7.4 software [36].
Analyses of bacterial and archaeal communities by PCR-DGGETotal bacterial communities were amplified using the primers U968┴CG and R1378, generat-ing fragments of 410 bp [37]. Archaeal communities were amplified as described [38], withprimers Arch21F and Arch958R in the first reaction, followed by a nested amplification withprimers Arch340F┴GC and Arch519R, obtaining fragments of 937 and 179 bp, respectively. Asa molecular marker for AOA and AOB communities, we used a region of the respective 16SrRNA gene specific for the groups of Thaumarchaeota and Beta-proteobacteria, respectively.AOA was assessed using primers crenamoA23f and crenamoA616r [31], which generated frag-ments of 620 bp. AOB were assessed with primers CTO189f and CTO654r (450 bp fragments)[34]. Details on cycling conditions are provided in S2 Table.
DGGE profiles were generated with the Ingeny Phor-U System (Ingeny International,Goes, The Netherlands). The PCR products (~120 ng per lane) were loaded onto 6% (w/v)polyacrylamide gels for Bacteria, AOA and AOB and 8% for Archaea. Denaturing gradients of45–65, 30–55, 15–55 and 35–65% Bacteria, Archaea, AOA and AOB, respectively (where100% denaturant corresponded to 7 M urea and 40% (v/v) deionized formamide). Electropho-resis was performed at a constant voltage of 100 V for 16 h at 60°C. The gels were stained for
Table 1. Soil characteristics at the three sampling sites of the Atlantic Rainforest. Values are mean ± SE; n = 4.
Soil characteristic Santa Virginia Picinguaba Restinga
pH (in CaCl2) 3.6±0.1 3.6±0.1 3.7±0.1
Organic Matter (g.dm-3) 70.3±8.0 63.7±3.9 62.2±4.0
Sand:silt:clay 55.9:12.4:31.7 56.9:11.3:31.8 87.7: 4.6: 7.7
Total P (mg.dm-3) 15.3±1.2 13.0±2.5 5.3±0.3
Total S (mg.dm-3) 9.7±0.9 13.0±0.6 5.3±0.3
K (mmolc*.dm-3) 2.0±0.3 1.7±0.2 0.8±0.1
Ca(mmolc.dm-3) 2.3±0.3 2.3±0.3 1.0±0.0
Mg (mmolc.dm-3) 2.3±0.3 2.0±0.0 1.0±0.0
Al (mmolc.dm-3) 23.3±0.7 20.4±0.6 16.5±1.6
H+Al**(mmolc.dm-3) 146.3±12.9 139.3±3.2 104.7±12.4
Nitrate (μg/g dry soil) 116.6±12.3 125.7±16.4 25.4±4.8
Ammonium (μg/g dry soil) 26.3±4.2 53.7±12.6 36.5±9.7
B (mg.dm-3) 0.42±0.0 0.41±0.0 0.17±0.0
Cu (mg.dm-3) 0.6±0.2 0.4±0.2 0.1±0.0
Fe (mg.dm-3) 303.0±79.3 199.3±6.0 731.5±428.1
Mn(mg.dm-3) 3.3±0.6 3.9±1.0 0.7±0.2
Zn (mg.dm-3) 1.0±0.1 0.9±0.1 0.7±0.1
*mmolc—millimoles of soil charges occupied by the element
**acidic potential of the soil
doi:10.1371/journal.pone.0146566.t001
Soil Microbiome in the Atlantic Rainforest
PLOS ONE | DOI:10.1371/journal.pone.0146566 January 11, 2016 4 / 19

60 min in 0.5 x TAE buffer with SYBR Gold (final concentration of 0.5 μg l-1; Invitrogen, Bra-zil). Images of the gels were obtained by densitometry using a laser densitometer StormTM845 (GE Healthcare, Uppsala, Sweden) and normalized in the GelCompar II software(Applied Maths, Sint-Martens Latem, Belgium), using the unweighted-pair group methodwith arithmetic mean, rolling-disk background subtraction, and no optimization [39,40].DGGE patterns were converted into presence/absence matrices based on band profiles usingthe software Diversity Database (BioRad, Hercules, CA, USA). The matrices were subjected tofurther analyses. Clustering analysis was conducted by non-metric multidimensional scaling(NMDS), carried out in PAST [41], using the similarity of Jaccard. Additionally, the validationof clusters and separations were based on R-values obtained by analysis of similarity (ANO-SIM) run in Primer5 [42].
The correlations between DGGE patterns and environmental parameters were determinedin a multivariate approach where DGGE-based matrices were tested against soil physical andchemical properties and against local plant community composition per area. The first analysisconducted in this context was the Mantel test [43], to determine the congruence of sample sep-aration based on microbiological (DGGE patterns) and contextual (soil physics, soil chemistryand vegetation) parameters. Mantel test was conducted in PAST [41].
Multivariate analysis was performed in CANOCO (Canoco 4.5, Biometris, Wageningen,Netherlands), according to [44]. The linear distribution of data, determined by detrended cor-respondence analysis (DCA), indicated that redundancy analysis (RDA) was the most suitablemodel that applied to our dataset. Along with the RDA, each portion of the microbial commu-nity assessed was compared with the chosen environmental parameter, testing the significanceof each parameter by the Monte Carlo test, based on 499 random permutations. It determinedthe significance of variables (p value) and also generated values of lambda-1, which shows thepercentage of the total variance explained by each environmental factor individually (Table 2).
Multi-tag 454-pyrosequencing of the bacterial and archaeal 16S rRNAgeneAfter the assessment of differences in community patterns based on PCR-DGGE profiles, twosamples (duplicates) per area were selected and submitted to multi-tag 454-pyrosequencing ofthe bacterial and archaeal 16S rRNA genes. For Bacteria, the forward primer 520F and a mix-ture of four reverse primers 802R were used, see [45] for details. A fragment size of 282 bp inlength was obtained, amplifying the V4 region (base position 563 to 802) of the bacterial 16SrRNA gene. For Archaea, the primer set ArcF and ArcR was used [10]. A fragment size of 179bp was obtained, amplifying the V3 region (base position 340 to 519) of the archaeal 16S rRNAgene (S2 Table). All used primers contained specific 8-bp barcode sequences for further demul-tiplexing of data. Amplicons from all samples were pooled in equimolar concentrations andsequenced at the Helixxa facility (Genomics Service Provider, Campinas, SP, Brazil) on aRoche GS-FLX 454 automated pyrosequencer running the Titanium chemistry.
Sequence data processingRaw pyrosequencing data were demultiplexed and processed using the Quantitative InsightsInto Microbial Ecology (QIIME) toolkit [46]. In brief, 16S rRNA partial sequences weretrimmed using the following parameters: quality score>25, sequence length>100 and<400,maximum homopolymer of six, zero maximum ambiguous bases and zero mismatched basesin the primer. The quality reads were then binned into operational taxonomic units (OTUs) at97% sequence similarity using uclust [47] followed by selection of a representative sequence.Chimeric sequences were identified using ChimeraSlayer [48] and removed. The taxonomy
Soil Microbiome in the Atlantic Rainforest
PLOS ONE | DOI:10.1371/journal.pone.0146566 January 11, 2016 5 / 19

was assigned to each representative sequence based on comparisons with sequences in the RDP[45]. For all OTU-based analyses, the original OTU was rarified to a depth of 3,249 and 723sequences per sample for Bacteria and Archaea, respectively (the fewest in a single sample,to minimize effects of sampling effort on the analysis). QIIME was also used to generateweighted/unweighted UniFrac distance matrices [49], a Bray-Curtis distance matrix [50], andalpha-diversity metrics (observed OTUs, Chao1 richness estimator, Shannon diversity, phylo-genetic diversity and Goods coverage). The relation between bacterial and archaeal beta-diver-sities across the different areas was determined by Procrustes analysis, carried out in QIIMEusing either the weighted or unweighted UniFrac distance matrices as input. The significanceof Procrustes transformation was determined by comparing the residual sum of squares aftermatching (M2), which measures the remaining “lack of fit” of one configuration to the other[51] based on a distribution of M2 values empirically determined from 10,000 permutations.
We used the 16S rRNA gene reference sequence from Candidatus Nitrosoarchaeum koreen-sis, Candidatus Nitrosopumilus maritimus and Candidatus Nitrososphaera gargensis to filterand select sequences potentially associated with AOA in our datasets (minimum identity 95%).A similar approach was used for AOB, where we select for sequences closely affiliated to thegenera Nitrospira and Nitrosococcus, as references. The resulting sequences were used to recon-struct a phylogenetic tree, comparing sequences obtained in this study with those close matchespresent in the RDP database. The phylogeny was reconstructed in Mega 5.0 [52], using thekimura-2 parameter and a neighbor-joining clustering method [53]. All sequencing data fromthis study were deposited in the MG-RAST database [54] (accession numbers 4570169.3,
Table 2. Significance index (p) and explanatory percentage (λA) of the selected variables on the patterns of microbial communities—here obtainedby PCR-DGGE patterns—as determined by redundancy analysis (RDA).
Bacterial 16S rRNA Archaeal 16S rRNA amoA
AOA AOB
λA p value λA p value λA p value λA p value
pH - - - - - - - -
Organic matter - - - - - - - -
P - - - - - - 2.1 0.002
S - - - - - - - -
K - - - - - - - -
Ca - - - - - - - -
Mg 1.4 0.004 - - - - - -
Al - - - - 3.2 0.008 - -
H+Al - - - - 0.8 0.032 - -
Nitrate - - - - - -
Ammonia 1.0 0.024 1.5 0.004 2.7 0.002 1.6 0.030
B 1.4 0.004 1.8 0.002 - - - -
Cu 2.3 0.002 - - - - - -
Fe - - - - - -
Mn - - - - 1.0 0.032 - -
Zn - - - - - - - -
Sand - - 1.7 0.002 - - - -
Silt 2.2 0.002 - - - - - -
Clay - - - - 2.2 0.042 2.2 0.002
doi:10.1371/journal.pone.0146566.t002
Soil Microbiome in the Atlantic Rainforest
PLOS ONE | DOI:10.1371/journal.pone.0146566 January 11, 2016 6 / 19

4570170.3, 4570171.3, 4570172.3, 4570173.3, 4570174.3, 4570175.3, 4570176.3, 4570177.3,4570178.3, 4570179.3 and 4570180.3).
Results
Soil properties in the sampled areasSoils in all three sampled areas presented low pH (values ranging from 3.6 to 3.7), high con-tents of organic matter (ranging from 6.2 to 7.1%), and similar chemical characteristics asthose typically presented in low-fertile forest soils. Notably, nitrate contents in forest soils fromSV and PC were significantly higher (p< 0.01) than those of RE, while the ammonium concen-trations were not statistically significant across sites (p = 0.162). The soil physical characteris-tics differed across the sampled areas. In brief, RE soils were sandier, while clayey textures werefound in soils from SV and PC (for a full description see Table 1).
Abundance assessments of targeted communitiesThe applied quantification systems were efficient to properly determine the abundances of thetargeted communities. We found amplification efficiencies of 113%, 90%, 102% and 108%for archaeal and bacterial 16S rRNA genes, AOA and AOB [amoA] genes, respectively, withregression values (R2) of 0.99 for all systems.
For the domain Bacteria, soils from SV revealed slightly higher abundances of the 16SrRNA gene than those from RE and PC (P< 0.05), with values ranging from 1.84 ×10⁹ to 4.25×10⁹ copies of the gene 16S rRNA per gram of soil. For Archaea, lower values were observed,as the abundance of such organisms varied from 1.43×10⁸ to 4.36×10⁸ copies of the 16S rRNAgene per gram of soil, in this case with slightly lower values in soils from RE (P< 0.05). Thequantification of specific groups involved in ammonia oxidation also revealed differencesbetween areas (P<0.05). The abundance of AOA was higher in SV and PC—with valuesbetween 2.80×10⁴ and 4.78×10⁴ copies of the archaeal amoA gene per gram of soil—than inRE, where the value was 8.03×10² copies per gram of soil (Fig 1). A similar trend was observedfor AOB, with higher values for SV and PC, at 5.34×10⁴ and 4.01×10⁴ copies of the specific 16SrRNA gene per gram of soil, respectively, than in RE, at 6.59×10² (Fig 1).
Fingerprinting the archaeal, bacterial, AOA and AOB communities byPCR-DGGEThe groups of Archaea, Bacteria and ammonia oxidizers (AOA/AOB) were evaluated withrespect to their community profile in soil samples from the three areas. Highly reproduciblePCR-DGGE patterns were obtained between triplicate soil samples from all communitiesevaluated in this study. Although the visual separation of samples from distinct areas waspossible, inferences about the clustering were based on the presence and absence matricesobtained based on DGGE profiles, further visualized by NMDS analysis (Fig 2). ANOSIMwas used to test for significant segregation of Archaea and Bacteria community patterns (Fig2, S3 Table). The results for Bacteria and Archaea revealed two distinct groups: one that clus-tered samples from SV and PC, and another with samples collected in RE (Fig 2a and 2b). Inthe analyses of ammonia-oxidizing communities, the three areas had separate AOA profiles(Fig 2c), while for AOB bands were found to occur more erratically, not resulting in a clearcommunity segregation, but still allowing the visualization of three partially superimposedgroups (Fig 2d).
The correlations between microbial patterns and environmental variables, as determined byRDA, identified the soil properties more strongly related to differences in community profiles
Soil Microbiome in the Atlantic Rainforest
PLOS ONE | DOI:10.1371/journal.pone.0146566 January 11, 2016 7 / 19

(Table 2). Taken together, these results revealed the connection between different communitypatterns and shifts in the ammonium contents in the evaluated soils—statistically significantfor all four evaluated communities (p< 0.05). Other soil properties were also related to differ-ences in community patterns, as observed for Mg, B, Cu and silt contents in bacterial commu-nities; B and silt contents in archaeal communities; P and clay contents for AOB communities;and Al, Mn, H+Al and clay contents in AOA communities (Table 2).
Fig 1. Quantification of targeted fractions—Bacteria, Archaea, AOA and AOB—of the soil microbiome in the three Atlantic Rainforest areas. Barsindicate average values from four replicates, while error bars indicate standard deviations. Bars labeled with the same letter in each graph do not differstatistically according to Tukey’s test (p > 0.05).
doi:10.1371/journal.pone.0146566.g001
Fig 2. Comparison of community patterns of Archaea (a), Bacteria (b), AOA (c) and AOB (d) along thealtitudinal gradient in soils of the Atlantic Rainforest by DGGE—as evidenced by NMDS. Stress valuesfor each community are indicated in the plot. The ANOSIM results (shown in numbers at S3 Table) areindicated by circles, being dotted (R>0.5), dashed (0.5<R<0.75) and full lines (R>0.75).
doi:10.1371/journal.pone.0146566.g002
Soil Microbiome in the Atlantic Rainforest
PLOS ONE | DOI:10.1371/journal.pone.0146566 January 11, 2016 8 / 19

Sequence-based analysis of bacterial and archaeal communitiesTwo samples from each area were subjected to sequencing, generating a total of 32,221 classi-fied sequences of the 16S rRNA gene– 25,610 sequences were assigned to Bacteria and 6,611 toArchaea—with percentages of 58.0% and 15.2%, respectively.
The taxonomic composition of bacterial communities encompassed 29 phyla (S4 Table),with most sequences affiliated with the Acidobacteria (average of 55.9%), and Proteobacteria(17.4%, 10.5% and 14% of the sequences in SV, PC and RE, respectively) (Fig 3a). The taxo-nomical approach indicated that these phyla occurred in similar proportions across all areas.A major proportion of archaeal sequences was not affiliated to known archaeal phyla (S4Table). Within the sequences classified into known phyla, we observed the prevalence ofthose affiliated to Thaumarchaeota (51%), Crenarchaeota (30%) and Euryarchaeota (19%)(Fig 3b). There were differences in the frequency of major taxonomical groups across areas,with a prevalence of Thaumarchaeota in PC and SV, while Crenarchaeota and Euryarchaeotawere more frequently found in RE (Fig 3b). The majority of the sequences affiliated to thephylum Thaumarchaeota could not be further classified within known classes—only a fewsequences matched to those belonging to the genera Nitrososphaera or Nitrosopumilus.Sequences affiliated to Euryarchaeota were similar to those from methanogenic archaea, suchas the generaMethanosarcina andMethanocella. All sequences affiliated to the phylum Cre-narchaeota were classified as belonging to the class Thermoprotei, not further affiliated intoknown orders.
These differences were assessed in detail on the basis of a taxonomy-independent approach,where sequences were binned into OTUs (determined at 97% of identity levels), and the result-ing OTU tables were subjected to a beta-diversity analysis using PCoA. This approach revealeda clear distinction among the communities found in the three assessed areas for bacterial com-munities (Fig 3c). For the archaeal communities, all sampling areas clustered apart, except forone sample from SV that segregated close to the PC cluster (Fig 3d). Similar patterns for com-munity differences across the areas were observed for Bacteria and Archaea, as indicated by theProcrustes analysis, with M2 values of 0.068 and 0.066, using weighted and unweighted Uni-Frac distances, respectively (Fig 4).
The sequencing data were also used—based on the OTU table—to generate alpha-diversityestimators, which indicated distinctions that were found across the three areas (Table 3). Forbacterial analysis, lower values of diversity and richness were found in PC, while similar valueswere found in SV and RE. For the archaeal analysis, similar diversity and richness values werefound across all samples. High coverage of the bacterial and archaeal diversity within the ana-lyzed datasets– 90% and 96% for Bacteria and Archaea, respectively—were found (Table 3).
Analyses of AOA- and AOB-related sequencesA total of 335, 21 and 456 sequences—binned into 29 OTUs—related to AOA groups wereretrieved from soil samples from PC, RE and SV, respectively. These sequences were allocatedinto a pool of AOA, either from cultured representatives or several uncultivated archaealsequences, derived from culture-independent analysis of AOA in different environments (Fig5). It is possible to suggest, based on OTU shared patterns, that distinct groups of AOA werepresent at the PC and SV sites (Fig 5). Importantly, our taxonomic assignment did not pro-vide the resolution to deeply infer on the likely differential segregation of specific AOA taxaacross areas. However, we found a trend for separation of sequences from SV and PC areas,distinctly allocated in branches along our phylogenetic inference (Fig 5). In both groups,most of sequences revealed higher identity with those from unclassified or uncultivatedThaumarchaeota.
Soil Microbiome in the Atlantic Rainforest
PLOS ONE | DOI:10.1371/journal.pone.0146566 January 11, 2016 9 / 19

Fig 3. Taxonomic distribution and comparison of bacterial and archaeal communities in soils of threeregions of the Atlantic Rainforest by 454-pyrosequencing of the 16S rRNA gene. Percentage ofclassified sequences affiliated to the phylum level for Bacteria (a) and Archaea (b). Comparison of communitycomposition was conducted by PCoA based on the OTU abundances in each area, and separately forBacteria (c) and Archaea (d). Values on the axes of panels (c) and (d) indicate the percentage of varianceexplained on each axis.
doi:10.1371/journal.pone.0146566.g003
Fig 4. Procrustes analysis based on bacterial and archaeal community assessments on the threeareas of the Atlantic Rainforest. Procrustes were run using on Unifrac weighted (a) and unweighted (b)distance matrices. Values on the axes of figures (a) and (b) indicate the percentage of variance explained oneach axis.
doi:10.1371/journal.pone.0146566.g004
Soil Microbiome in the Atlantic Rainforest
PLOS ONE | DOI:10.1371/journal.pone.0146566 January 11, 2016 10 / 19

Similarly, a total of 98 bacterial sequences were affiliated with known groups of ammonia-oxidizing bacteria– 25, 28 and 45 from PC, RE and SV, respectively. These sequences werebinned into 31 OTUs, related to the genera Nitrosospira and Nitrosococcus, but majorly affili-ated with unclassified on uncultivated bacteria (Fig 5). The high diversity observed, togetherwith the lower number of sequences, precluded a proper inference on the distinctions of themembers within these communities across the sites.
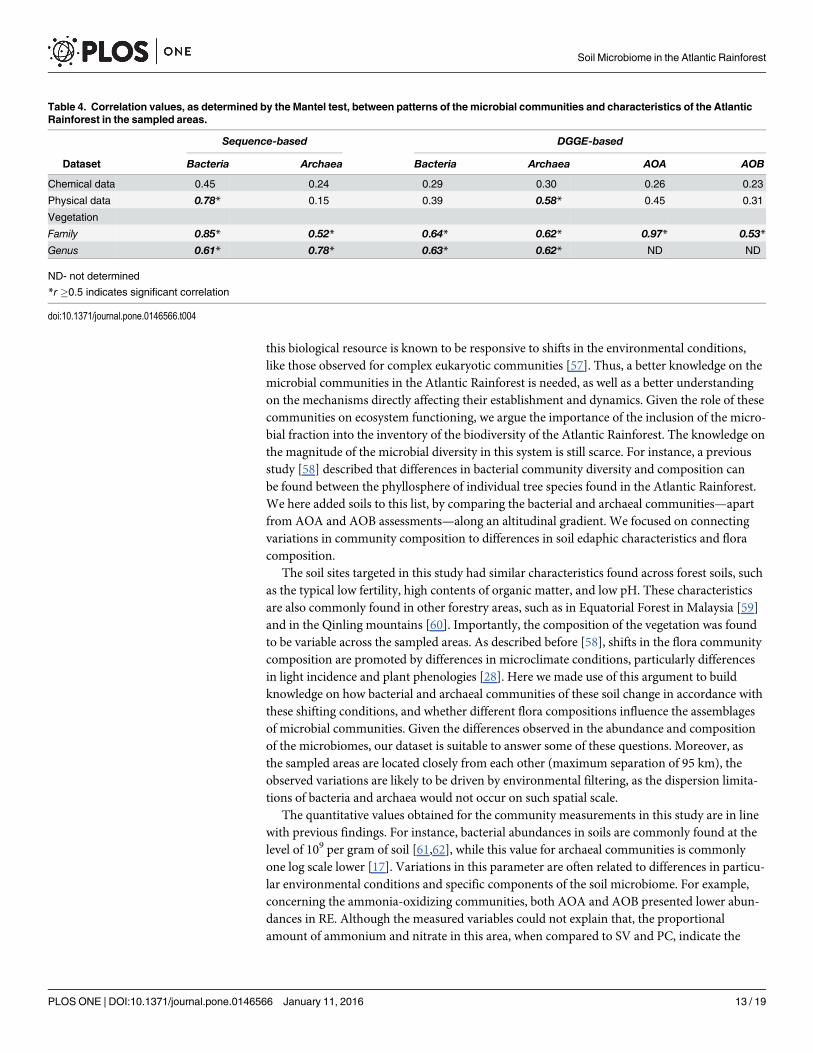
Correlations between microbial communities and prevailingcharacteristics of the sampling sitesThe highest correlation values were found—for all fractions of microbial communities—withthe vegetation composition in each area. The comparisons based on DGGE data resulted in anR-value of 0.62 for Archaea x plants (either family or genus of plants). For Bacteria, this com-parison resulted in values of 0.64 for plant family and 0.63 for plant genus (Table 4). In con-trast, R-values for the relationship between microbial communities and chemical or physicalattributes of soils were 0.29 or 0.39, respectively, for bacteria and ranged from 0.30 to 0.58for Archaea (Table 4). For ammonia oxidizers (AOA and AOB), we found a low correlationbetween chemical and physical attributes and the patterns of both groups, with values between0.23 and 0.45. However, these communities showed a high correlation with families of plantsin the Atlantic Forest, with R-values of 0.97 for AOA and 0.53 for AOB.
The use of sequences in this approach—as represented by OTUs—resulted in similar results,with values of 0.85 (family) and 0.61 (genus) for comparison with bacterial patterns, and R-val-ues of 0.52 and 0.78 for comparisons between archaeal patterns with plant family and genus,respectively (Table 4).
DiscussionThe Atlantic Rainforest is one of the most diverse biome on Earth [55,56], largely attributed tothe high biodiversity of plants and animals. However, the vast majority of the biological diver-sity in this system comes from the ‘hidden’microbiomes that permeate this biome. Moreover,
Table 3. Alpha-diversity metrics as determined by observed species, richness, diversity and coverage values in the three distinct areas of theAtlantic Rainforest. Values are mean ± SD; n = 2.
Picinguaba Santa Virginia Restinga
Observed species
Bacteria 685 ± 32.0 859 ± 1.76 815 ± 16.2
Archaea 144 ± 20.9 143 ± 19.2 129 ± 28.8
Chao1
Bacteria 1,646 ± 46.8 1,947 ± 34.6 1,950 ± 37.6
Archaea 271 ± 2.15 297 ± 13.4 242 ± 9.00
Shannon
Bacteria 7.51 ± 0.19 8.23 ± 0.19 7.72 ± 0.12
Archaea 5.52 ± 0.57 5.62 ± 0.47 5.36 ± 0.88
PD
Bacteria 61.4 ± 0.05 70.0 ± 0.33 72.5 ± 0.54
Archaea 8.80 ± 1.00 7.91 ± 0.09 7.50 ± 0.82
Goods coverage
Bacteria 0.86 ± 0.005 0.84 ± 0.004 0.83 ± 0.004
Archaea 0.89 ± 0.008 0.88 ± 0.011 0.90 ± 0.003
doi:10.1371/journal.pone.0146566.t003
Soil Microbiome in the Atlantic Rainforest
PLOS ONE | DOI:10.1371/journal.pone.0146566 January 11, 2016 11 / 19

Fig 5. Phylogenetic analysis of 16S rRNA genes with similarities to those from known AOA (a) and AOB (b). The trees display one representativesequence per OTU (unique sequences that shares at least 97% of similarity). Side bars next to OTU labels indicate the number of sequences belonging tothe corresponding OTU in each sampled area. Outgroups were made of sequences belonging to AOA for AOB analysis, and vice-versa.
doi:10.1371/journal.pone.0146566.g005
Soil Microbiome in the Atlantic Rainforest
PLOS ONE | DOI:10.1371/journal.pone.0146566 January 11, 2016 12 / 19
this biological resource is known to be responsive to shifts in the environmental conditions,like those observed for complex eukaryotic communities [57]. Thus, a better knowledge on themicrobial communities in the Atlantic Rainforest is needed, as well as a better understandingon the mechanisms directly affecting their establishment and dynamics. Given the role of thesecommunities on ecosystem functioning, we argue the importance of the inclusion of the micro-bial fraction into the inventory of the biodiversity of the Atlantic Rainforest. The knowledge onthe magnitude of the microbial diversity in this system is still scarce. For instance, a previousstudy [58] described that differences in bacterial community diversity and composition canbe found between the phyllosphere of individual tree species found in the Atlantic Rainforest.We here added soils to this list, by comparing the bacterial and archaeal communities—apartfrom AOA and AOB assessments—along an altitudinal gradient. We focused on connectingvariations in community composition to differences in soil edaphic characteristics and floracomposition.
The soil sites targeted in this study had similar characteristics found across forest soils, suchas the typical low fertility, high contents of organic matter, and low pH. These characteristicsare also commonly found in other forestry areas, such as in Equatorial Forest in Malaysia [59]and in the Qinling mountains [60]. Importantly, the composition of the vegetation was foundto be variable across the sampled areas. As described before [58], shifts in the flora communitycomposition are promoted by differences in microclimate conditions, particularly differencesin light incidence and plant phenologies [28]. Here we made use of this argument to buildknowledge on how bacterial and archaeal communities of these soil change in accordance withthese shifting conditions, and whether different flora compositions influence the assemblagesof microbial communities. Given the differences observed in the abundance and compositionof the microbiomes, our dataset is suitable to answer some of these questions. Moreover, asthe sampled areas are located closely from each other (maximum separation of 95 km), theobserved variations are likely to be driven by environmental filtering, as the dispersion limita-tions of bacteria and archaea would not occur on such spatial scale.
The quantitative values obtained for the community measurements in this study are in linewith previous findings. For instance, bacterial abundances in soils are commonly found at thelevel of 109 per gram of soil [61,62], while this value for archaeal communities is commonlyone log scale lower [17]. Variations in this parameter are often related to differences in particu-lar environmental conditions and specific components of the soil microbiome. For example,concerning the ammonia-oxidizing communities, both AOA and AOB presented lower abun-dances in RE. Although the measured variables could not explain that, the proportionalamount of ammonium and nitrate in this area, when compared to SV and PC, indicate the
Table 4. Correlation values, as determined by the Mantel test, between patterns of the microbial communities and characteristics of the AtlanticRainforest in the sampled areas.
Sequence-based DGGE-based
Dataset Bacteria Archaea Bacteria Archaea AOA AOB
Chemical data 0.45 0.24 0.29 0.30 0.26 0.23
Physical data 0.78* 0.15 0.39 0.58* 0.45 0.31
Vegetation
Family 0.85* 0.52* 0.64* 0.62* 0.97* 0.53*
Genus 0.61* 0.78* 0.63* 0.62* ND ND
ND- not determined
*r �0.5 indicates significant correlation
doi:10.1371/journal.pone.0146566.t004
Soil Microbiome in the Atlantic Rainforest
PLOS ONE | DOI:10.1371/journal.pone.0146566 January 11, 2016 13 / 19

potential limitation of nitrification in RE. It is tempting to speculate that in lower altitudes, therun-off of rains occurs at lower intensity, and thus, the belowground water rise to soil surfacemore frequently than it occurs at upland areas. Collectively, these may have led to the loweravailability of oxygen in this site, thus impairing ammonia oxidation–based metabolism.Indeed, the abundance of AOA was higher than AOB in all three areas, which might be linkedto the soil pH, since AOA predominates over AOB under acidic conditions [63–66]. The avail-ability of ammonium is also known to modulate the balance between AOA and AOB[17,19,67], leading to a prevalence of AOA in soils where ammonium is limited [68,69].
Another level of community variations was related to the composition of microbial commu-nities, which in this case tended to be distinct in each analyzed area. Both PCR-DGGE andsequence-based approaches indicated that bacterial, archaeal, and even the ammonia-oxidizingcommunities were arranged in distinct assemblages along the altitudinal gradient. WhilePCR-DGGE was efficient to segregate samples between RE and the other two areas, thesequence-based analysis indicated, on the basis of the OTU level, that community composi-tions were distinct between the three sites. Notably, such spatial variation is commonly foundin natural environments, where beta-diversity is often high [3]. The great extension of theAtlantic Rainforest may demand a broader spatial and temporal survey to prove these findings.However, our results, even obtained through a limited number of samples, do provide indica-tions that bacterial and archaeal communities segregate in its composition across the targetedaltitudinal gradient.
An additional observation allowed by our sequence-based analysis concerns the microbialgroups found in the analyzed areas. The prevalence of Acidobacteria and Proteobacteria phylawas observed for bacterial communities; and Thaumarchaeota, Crenarchaeota and Euryarch-aeota were the named phyla for archaeal communities. Bacterial communities revealed to becomposed of taxonomic groups similar to those described in many other soils [70–72], beingalso similar across all areas. On the other hand, archaeal communities were distinctly assem-bled in each area at high taxonomical levels (at the phyla classification, for example). Archaealcommunities were composed of high proportions of unclassified sequences into any knownarchaeal phyla. Within those sequences affiliated to specific phyla, a major fraction remainedunclassified thereafter, for example, as observed for crenarchaeotal sequences, which were allassigned to unclassified Themoprotei. We tried to improve the affiliation of our sequences bythe phylogenetic inference, but mostly of AOA and AOB sequences were better related withunclassified sequences than to those from named groups. Moreover, despite the literature sug-gests the prevalence of the order Nitrosotaleales as AOA in acidic soils [67], sequences closelyaffiliated to this order were not abundantly found in our samples. It is tempting to speculatethat either these unclassified archaeal sequences may represent new taxa endemic from Atlan-tic Rainforest soils or they may compose a group of sequences still poorly represented in theavailable databases. As such, the proper examination of potential taxonomic differences withingroups across these areas was technically impaired.
Another question focuses on the discussion of what are the main drivers of such differencesfound across the spatial scale. We attempted to answer this question using two approaches—RDA-based on DGGE patterns and Mantel tests—linking the characteristics of the sampledareas to the microbial community patterns found in both culture-independent methods. TheRDA results was consistent to correlate variations in the contents of ammonium with those insoil microbial communities, although such variations were not statistically validated by univar-itate analysis (ANOVA and Tukey test; p = 0.162). It shows the importance of using multivari-ate and correlational analysis to determine major drivers modulating the composition ofmicrobiomes [44]. This result concurs with the findings of the Mantel test, where the composi-tion of the flora had the prevalent correlation with changes in microbial communities. The
Soil Microbiome in the Atlantic Rainforest
PLOS ONE | DOI:10.1371/journal.pone.0146566 January 11, 2016 14 / 19

connection between these results might be based on the systems that plants have to exert selec-tion upon the soil microbes. For instance, the primary rhizosphere effect and the indirect selec-tion made by the litter decomposition—both linked to the release of ammonium in soils [73].We suggest that the aforementioned role of ammonium variations—derived from plant exuda-tion of litter decomposition—constitutes evidence that the plant selection predominates overother environmental variables on mediating the composition of soil microbiomes in the Atlan-tic Rainforest. This is in line with a previous study [4] that used neural models to disentanglethe contents of organic matter and the contents of base cations (Ca and Mg) as determinantfactors influencing microbial diversity in soils. These variables are also tightly linked to plantcomposition, which is remarkably distinct across these areas. In rainforests, the input of plantmaterials (by either lettering or rhizosphere) is constant along the year, as opposing to patternsfound in temperate or deciduous forests. Moreover, it is worth mentioning that our samplingsites present similar pH values, low amplitude of variation in the average temperature and theyare located in a region that has similar rainfall regime. As such, we posit that our inferencesdespite punctual, may likely be similar to those potentially found in a time series study.
In summary, it can be derived from our findings that the flora composition is the majorplayer in this mosaic, with direct influences on the abundance and composition of the bacterialand archaeal communities in Atlantic Rainforest soils. Collectively, our study contributes to abetter understanding of the soil microbiome in this tropical biome, which extends beyond thewell-known role of soil pH in tropical forests [74]. We posit that, since variations in pH acrossall sites did not encompass a large range (i.e. from 3.6 to 3.7), the effect of the plant communitycomposition tended to dominate in the analyzed samples. However, caution is warranted interms of assuming our findings as absolute and potentially extendable to other systems. Weposit that future studies are needed to finely partition the effects of levels of pH and plant diver-sity and endemicity in Atlantic Rainforest microbiomes. Moreover, as the Atlantic Rainforestharbors high levels of plant endemicity—which exerts selection on distinct phyllosphere micro-biomes [58]–the soil microbiomes assembled may also be endemic, either in terms of theircomponents or in their particular assemblages.
Supporting InformationS1 Table. Vegetation composition of the Atlantic Rainforest at the sampling sites [28].(DOCX)
S2 Table. PCR and cycling conditions used to amplify the targeted genes in the presentstudy.(DOCX)
S3 Table. Pairwise comparison of similarity (ANOSIM) among microbial communitiesfrom in each area (PC, SV and RE), as determined by PCR-DGGE profiles.(DOCX)
S4 Table. Percentage of sequences affiliated with bacterial and archaeal phyla in the RDPdatabase.(DOCX)
AcknowledgmentsWe thank FAPESP (grant 08/50824-1), ACFD (project 2012/14534-4) and CNPq (grant132094/2010-0) for the financial support. We also thank Dr. Marcio Lambais for allowing thestudents to join the sampling expedition under his supervision.
Soil Microbiome in the Atlantic Rainforest
PLOS ONE | DOI:10.1371/journal.pone.0146566 January 11, 2016 15 / 19

Author ContributionsConceived and designed the experiments: JEL-P EMR FDA. Performed the experiments: JEL-PEMR AD FDA. Analyzed the data: JEL-P FD-A AD ACFD. Contributed reagents/materials/analysis tools: FDA. Wrote the paper: JEL-P EMR FD-A AD ACFD FDA.
References1. Myers N, Mittermeier RA, Mittermeier CG, Fonseca GAB, Kent J. Biodiversity hotspots for conservation
priorities. Nature. 2000; 403: 853–858. PMID: 10706275
2. Carnaval AC, Hickerson MJ, Haddad CF, Rodrigues MT, Moritz C. Stability predicts genetic diversity inthe Brazilian Atlantic forest hotspot. Science. 2000; 323: 785–789.
3. Rodrigues JL, Pellizari VH, Mueller R, Baek K, Jesus EDC, Paula FS, et al. Conversion of the Amazonrainforest to agriculture results in biotic homogenization of soil bacterial communities. Proc Natl AcadSci U S A. 2013; 110: 988–993. doi: 10.1073/pnas.1220608110 PMID: 23271810
4. Santos EC, Armas ED, Crowley D, Lambais MR. Artificial neural network modeling of microbial commu-nity structures in the Atlantic Forest of Brazil. Soil Biol Biochem. 2014; 69: 101–109.
5. Silva RC, Pereira JM, Araujo QR, Pires AJV, Del Rei AJ. Alterações nas propriedades quiímicas e fiísi-cas de um Chernossolo com diferentes coberturas vegetais. Rev Bras Ciência Solo. 2007; 31: 101–107.
6. Hansel CM, Fendorf S, Jardine PM, Francis CA. Changes in bacterial and archaeal community struc-ture and functional diversity along a geochemically variable soil profile. Appl Environ Microb. 2008; 74:1620–1633.
7. Kaspari M, Garcia MN, Harms KE, Santana M, Wright SJ, Yavitt JB. Multiple nutrients limit litterfall anddecomposition in a tropical forest. Ecol Lett. 2008; 11: 35–43. PMID: 18021246
8. Wang JT, Zheng YM, Hu HW, Zhang LM, Li J, He JZ. Soil pH determines the alpha diversity but notbeta diversity of soil fungal community along altitude in a typical Tibetan forest ecosystem. J SoilsSedim. 2015; 15: 1224–1232.
9. Mendes LW, Tsai SM, Navarrete AA, de Hollander M, van Veen JA, Kuramae EE Soil-borne micro-biome: linking diversity to function. Microbial Ecol. 2015; 70: 255–265.
10. [Jesus EC, Marsh TL, Tiedje JM, Moreira FMS. Changes in land use alter the structure of bacterial com-munities in Western Amazon soils. ISME J. 2009; 3: 1004–1011. doi: 10.1038/ismej.2009.47 PMID:19440233
11. Bryant JA, Lamanna C, Morlon H, Kerkhoff AJ, Enquist BJ, Green JL. Microbes on mountainsides: con-trasting elevational patterns of bacterial and plant diversity. Proc Natl Acad Sci U S A. 2008; 105:11505–11511. doi: 10.1073/pnas.0801920105 PMID: 18695215
12. Cantrell SA, Lodge DJ, Cruz CA, García LM, Pérez-Jiménez JR, Molina M. Differential abundance ofmicrobial functional groups along the elevation gradient from the coast to the Luquillo Mountains. EcolBull. 2013; 54: 87–100.
13. Wagai R, Kitayama K, Satomura T, Fujinuma R, Balser T. Interactive influences of climate and parentmaterial on soil microbial community structure in Bornean tropical forest ecosystems. Ecol Res. 2011;26: 627–636.
14. Sundqvist MK, Giesler R, Wardle DA. Within-and across-species responses of plant traits and litterdecomposition to elevation across contrasting vegetation types in subarctic tundra. PLOSONE. 2011;6: e27056. doi: 10.1371/journal.pone.0027056 PMID: 22046443
15. Vasconcellos RLF, Bonfim JA, Andreote FD, Mendes LW, Baretta D, Cardoso EJBN. Microbiologicalindicators of soil quality in a riparian forest recovery gradient. Ecol Eng. 2013; 53: 313–320.
16. Faoro H, Alves AC, Souza EM, Rigo LU, Cruz LM, Al-Janabi SM, et al. Influence of soil characteristicson the diversity of bacteria in the Southern Brazilian Atlantic Forest. Appl Environ Microb. 2010; 76:4744–4749.
17. Tripathi BM, Kim M, Lai-Hoe A, Shukor NA, Rahim RA, Go R, et al. pH dominates variation in tropicalsoil archaeal diversity and community structure. FEMSMicrobiol Ecol. 2013; 86: 303–311. doi: 10.1111/1574-6941.12163 PMID: 23773164
18. Pereira e Silva MCP, Semenov AV, Schmitt H, van Elsas JD, Salles JF. Microbe-mediated processesas indicators to establish the normal operating range of soil functioning. Soil Biol Biochem. 2013; 57:995–1002.
19. Schleper C. Ammonia oxidation: different niches for bacteria and archaea. ISME J. 2010; 4: 1092–1094. doi: 10.1038/ismej.2010.111 PMID: 20631805
Soil Microbiome in the Atlantic Rainforest
PLOS ONE | DOI:10.1371/journal.pone.0146566 January 11, 2016 16 / 19
20. Zhang X, Liu W, Schloter M, Zhang G, Chen Q, Huang J, et al. Response of the abundance of key soilmicrobial nitrogen-cycling genes to multi-factorial global changes. PLOS ONE. 2013; 8: e76500. doi:10.1371/journal.pone.0076500 PMID: 24124568
21. Jin T, Zhang T, Ye L, Lee OO, Wong YH, Qian PY. Diversity and quantity of ammonia-oxidizingArchaea and Bacteria in sediment of the Pearl River Estuary, China. Appl Environ Biotech. 2011; 90:1137–1145.
22. Szukics U, Hackl E, Zechmeister-Boltenstern S, Sessitsch A. Contrasting response of two forest soilsto nitrogen input: rapidly altered NO and N2O emissions and nirK abundance. Biol Fertil Soils. 2009;45: 855–863.
23. Jia Z, Conrad R. Bacteria rather than Archaea dominate microbial ammonia oxidation in an agriculturalsoil. Environ Microbiol. 2009; 11: 1658–1671. doi: 10.1111/j.1462-2920.2009.01891.x PMID:19236445
24. Ke X, Angel R, Lu Y, Conrad R. Niche differentiation of ammonia oxidizers and nitrite oxidizers in ricepaddy soil. Environ Microbiol. 2013; 15: 2275–2292. doi: 10.1111/1462-2920.12098 PMID: 23437806
25. Tago K, Okubo T, Shimomura Y, Kikuchi Y, Hori T, Nagayama A, Hayatsu M. Environmental factorsshaping the community structure of ammonia-oxidizing bacteria and archaea in sugarcane field soil.Microbes Environ. 2015; 30: 21. doi: 10.1264/jsme2.ME14137 PMID: 25736866
26. van Raij B, Andrade JC, Cantarella H, Quaggio JA. Anaílise quiímica para avaliação da fertilidade desolos tropicais. 4th ed. Campinas: Fundação Cargill; 2001.
27. Keeney DR, Nelson DW. Nitrogen inorganic forms. In: Page L, Miller RH, Keeney DR, editors. Methodsof soil analysis. Madison: Soil Science of America; 1982. pp. 643–698.
28. Oliveira-Filho AT, Fontes MAL. Patterns of Floristic Differentiation among Atlantic Forests in Southeast-ern Brazil and the Influence of Climate. Biotropica. 2000; 32: 793–810.
29. Muyzer G, DeWaal EC, Uitterlinden AG. Profiling of complex microbial population by DGGE analysisof polymerase chain reaction amplified genes encoding for 16S rRNA. Appl Environ Microbiol. 1993;62: 2676–2680.
30. Gantner S, Andersson AF, Alonso-Sáez L, Bertilsson S. Novel primers for 16S rRNA-based archaealcommunity analyses in environmental samples. J Microbiol Meth. 2011; 84: 12–18.
31. Tourna M, Freitag TE, Nicol GW, Prosser JI. Growth, activity and temperature responses of ammonia‐oxidizing archaea and bacteria in soil microcosms. Environ Microbiol. 2008; 10: 1357–1364. doi: 10.1111/j.1462-2920.2007.01563.x PMID: 18325029
32. Nicol GW, Leininger S, Schleper C, Prosser JI. The influence of soil pH on the diversity, abundanceand transcriptional activity of ammonia oxidizing archaea and bacteria. Environ Microbiol. 2008; 10:2966–2978. doi: 10.1111/j.1462-2920.2008.01701.x PMID: 18707610
33. Pereira e Silva MCP, Poly F, Guillaumaud N, van Elsas JD, Salles JF. Fluctuations in ammonia oxidiz-ing communities across agricultural soils are driven by soil structure and pH. Front Microbiol. 2012; 3:1–22.
34. Kowalchuk GA, Stephen JR, De Boer W, Prosser J, Embley TM, Woldendorp JW. Analysis of ammo-nia-oxidizing bacteria of the beta subdivision of the class Proteobacteria in coastal sand dunes by dena-turing gradient gel electrophoresis and sequencing of PCR amplified 16S ribosomal DNA fragments.Appl Environ Microbiol. 1997; 63: 1489–1497. PMID: 9097446
35. Hermansson A, Lindgren PE. Quantification of ammonia-oxidizing bacteria in arable soil by real-timePCR. Appl Environ Microbiol. 2001; 67: 972–976. PMID: 11157271
36. Silva FAS, Azevedo CAV. Assistant computational program version for the windows operating system.Braz J Agro-Industr Prod. 2002; 4: 71–78.
37. Heuer H, Krsek M, Baker P, Smalla K, Wellington EM. Analysis of actinomycete communities by spe-cific amplification of genes encoding 16S rRNA and gel-electrophoretic separation in denaturing gradi-ents. Appl Environ Microbiol. 1997; 63: 3233–3241. PMID: 9251210
38. Ovreås L, Forney L, Daae FL, Torsvik V. Distribution of bacterioplankton in meromictic Lake Saelen-vannet, as determined by denaturing gradient gel electrophoresis of PCR-amplified gene fragmentscoding for 16S rRNA. Appl Environ Microbiol. 1997; 63: 3367–3373. PMID: 9292986
39. Kropf S, Heuer H, Grüning M, Smalla K. Significance test for comparing complex microbial communityfingerprints using pairwise similarity measures. J. Microbiol Meth. 2004; 57: 187–195.
40. Rademaker JL, De Bruijn FJ. Section 7 update: Computer-assisted analysis of molecular fingerprintprofiles and database construction. In: Kowalchuk GA, de Bruijn F, Head IM, Van der Zijpp AJ, vanElsas JD, editors. Molecular microbial ecology manual. Springer Netherlands; 2004. pp. 3299–3347.
41. HammerØ, Harper DAT, Ryan PD. PAST: Paleontological Statistics Software Package for educationand data analysis. Palaeontolia Electronica. 2008; 4: 9.
Soil Microbiome in the Atlantic Rainforest
PLOS ONE | DOI:10.1371/journal.pone.0146566 January 11, 2016 17 / 19
42. Clarke KR, Gorley. PRIMER v5, user manual/tutorial. United Kingdom: Plymouth Marine Laboratory;2001.
43. Mantel N. Biometrics: Ranking procedures for arbitrarily restricted observation. 1st ed. Washington,DC: International Biometric Society; 1967.
44. Andreote FD, Araújo WL, Azevedo JL, van Elsas JD, Rocha UN, van Overbeek LS. Endophytic coloni-zation of potato (Solanum tuberosum L.) by a novel competent bacterial endophyte, Pseudomonasputida strain P9, and its effect on associated bacterial communities. Appl Environ Microbiol. 2009; 75:3396–3406. doi: 10.1128/AEM.00491-09 PMID: 19329656
45. Cole JR, Wang Q, Fish JA, Chai B, McGarrell DM, Sun Y, Brown CT, Porras-Alfaro A, Kuske CR, TiedjeJM.2014. Ribosomal Database Project: data and tools for high throughput rRNA analysis Nucl AcidsRes 2014; 42: D633–D642. doi: 10.1093/nar/gkt1244 PMID: 24288368
46. Caporaso JG, Kuczynski J, Stombaugh J, Bittinger K, Bushman FD, Costello EK et al. QIIME allowsanalysis of high-throughput community sequencing data. Nature Meth. 2010; 7: 335–336.
47. Edgar RC (2010) Search and clustering orders of magnitude faster than BLAST. Bioinformatics. 2010;26: 2460–2461. doi: 10.1093/bioinformatics/btq461 PMID: 20709691
48. Haas BJ, Gevers D, Earl AM, Feldgarden M, Ward DV, Giannoukos G, et al. Chimeric 16S rRNAsequence formation and detection in Sanger and 454-pyrosequenced PCR amplicons. Genome Res.2011; 21: 494–504. doi: 10.1101/gr.112730.110 PMID: 21212162
49. Lozupone C, Knight R. UniFrac: a new phylogenetic method for comparing microbial communities.Appl Environ Microbiol. 2005; 71: 8228–8235. PMID: 16332807
50. Bray JR, Curtis JT. An ordination of the upland forest communities of southernWisconsin. Ecol Monogr.1957; 27: 325–349.
51. Krzanowski WJ. Between-group analysis with heterogeneous covariance matrices: The common prin-cipal component model. J Classif. 1990; 7: 81–98.
52. Tamura K, Dudley J, Nei M, Kumar S. MEGA4: molecular evolutionary genetics analysis (MEGA) soft-ware version 4.0. Mol Biol Evol. 2007; 24: 1596–1599. PMID: 17488738
53. Saitou N, Nei M. The neighbor-joining method: a newmethod for reconstructing phylogenetic trees. MolBiol Evol. 1987; 4: 406–425. PMID: 3447015
54. Meyer F, Paarmann D, D'Souza M, Olson R, Glass EM, Kubal M. Et al. The metagenomics RASTserver—a public resource for the automatic phylogenetic and functional analysis of metagenomes.BMC bioinf. 2008; 9: 386.
55. Ribeiro MC, Metzger JP, Martensen AC, Ponzoni FJ, Hirota MM. The Brazilian Atlantic Forest: Howmuch is left, and how is the remaining forest distributed? Implications for conservation. Biol Conserv.2009; 142: 1141–1153.
56. Bruce T, Martinez IB, Neto OM, Vicente ACP, Kruger RH, Thompson FL. Bacterial community diversityin the Brazilian Atlantic forest soils. Microbial Ecol. 2010; 60: 840–849.
57. Pacchioni RG, Carvalho FM, Thompson CE, Faustino AL, Nicolini F, Pereira TS, et al. Taxonomic andfunctional profiles of soil samples from Atlantic forest and Caatinga biomes in northeastern Brazil.MicrobiologyOpen. 2014; 3: 299–315. doi: 10.1002/mbo3.169 PMID: 24706600
58. Lambais MR, Crowley DE, Cury JC, Büll RC, Rodrigues RR. Bacterial diversity in tree canopies of theAtlantic forest. Science. 2006; 312: 1917–1917. PMID: 16809531
59. Tripathi BM, Kim M, Singh D, Lee-Cruz L, Lai-Hoe A, Ainuddin AN, et al. Tropical soil bacterial commu-nities in Malaysia: pH dominates in the equatorial tropics too. Microbial Ecol. 2012; 64: 474–484.
60. Cheng F, Peng X, Zhao P, Yuan J, Zhong C, Cheng Y, et al. Soil Microbial Biomass, Basal Respirationand Enzyme Activity of Main Forest Types in the Qinling Mountains. PLOS ONE. 2013; 8: e67353. doi:10.1371/journal.pone.0067353 PMID: 23840671
61. DeAngelis KM, Pold G, Topçuoğlu BD, van Diepen LT, Varney RM, Blanchard JL, et al. (2015). Long-term forest soil warming alters microbial communities in temperate forest soils. Front Microbiol. 2015; 6:104. doi: 10.3389/fmicb.2015.00104 PMID: 25762989
62. Vega-Avila AD, Gumiere T, Andrade PAM, Lima-Perim JE, Durrer A, Baigori M, et al. Bacterial commu-nities in the rhizosphere of Vitis vinifera L. cultivated under distinct agricultural practices in Argentina.Anton Leeuw. 2015; 107: 575–588.
63. Lehtovirta LE, Prosser JI, Nicol GW. Soil pH regulates the abundance and diversity of Group 1.1c Cre-narchaeota. FEMSMicrobiol Ecol. 2009; 70: 367–376. doi: 10.1111/j.1574-6941.2009.00748.x PMID:19732147
64. Kemnitz D, Kolb S, Conrad R. High abundance of Crenarchaeota in a temperate acidic forest soil.FEMSMicrobiol Ecol. 2007; 60: 442–448. PMID: 17391330
Soil Microbiome in the Atlantic Rainforest
PLOS ONE | DOI:10.1371/journal.pone.0146566 January 11, 2016 18 / 19

65. Yao H, Gao Y, Nicol GW, Campbell CD, Prosser JI, Zhang L, et al. Links between ammonia oxidizercommunity structure, abundance, and nitrification potential in acidic soils. Appl Environ Microb. 2011;77: 4618–4625.
66. Prosser JI, Nicol GW. Archaeal and bacterial ammonia-oxidisers in soil: the quest for niche specializa-tion and differentiation. Trends Microbiol. 2012; 20: 523–531. doi: 10.1016/j.tim.2012.08.001 PMID:22959489
67. Lehtovirta-Morley LE, Stoecker K, Vilcinskas A, Prosser JI, Nicol GW. Cultivation of an obligate acido-philic ammonia oxidizer from a nitrifying acid soil. Proc Nat Acad Sci USA. 2011; 108: 15892–15897.doi: 10.1073/pnas.1107196108 PMID: 21896746
68. Xia W, Zhang C, Zeng X, Feng Y, Weng J, Lin X, et al. Autotrophic growth of nitrifying community in anagricultural soil. ISME J. 2011; 5: 1226–1236. doi: 10.1038/ismej.2011.5 PMID: 21326337
69. Erguder TH, Boon N, Wittebolle L, Marzorati M, Verstraete W. Environmental factors shaping the eco-logical niches of ammonia-oxidizing archaea. FEMSMicrobiol Rev. 2009; 33: 855–869. doi: 10.1111/j.1574-6976.2009.00179.x PMID: 19453522
70. Eichorst SA, Kuske CR, Schmidt TM. Influence of plant polymers on the distribution and cultivation ofbacteria in the phylum Acidobacteria. Appl Environ Microbiol. 2011; 77: 586–596. doi: 10.1128/AEM.01080-10 PMID: 21097594
71. Janssen PH. Identifying the dominant soil bacterial taxa in libraries of 16S rRNA and 16S rRNA genes.Appl Environ Microbiol. 2006; 72: 1719–1728. PMID: 16517615
72. Bates ST, Clemente JC, Flores GE, Walters WA, Parfrey LW, Knight R, Fierer N. Global biogeographyof highly diverse protistan communities in soil. ISME J. 2013; 7: 652–659. doi: 10.1038/ismej.2012.147PMID: 23235291
73. Garbeva P, Van Veen JA, Van Elsas JD. Microbial diversity in soil: selection of microbial populations byplant and soil type and implications for disease suppressiveness. Annu Rev Phytopathol. 2004; 42:243–270. PMID: 15283667
74. Lauber CL, Hamady M, Knight R, Fierer N. Pyrosequencing-based assessment of soil pH as a predictorof soil bacterial community structure at the continental scale. Appl Environ Microbiol. 2009; 75: 5111–5120. doi: 10.1128/AEM.00335-09 PMID: 19502440
Soil Microbiome in the Atlantic Rainforest
PLOS ONE | DOI:10.1371/journal.pone.0146566 January 11, 2016 19 / 19