Changes in archaeal, bacterial and eukaryal assemblages along a salinity gradient by comparison of...
11
© 2002 Blackwell Science Ltd Changes in archaeal, bacterial and eukaryal assemblages along a salinity gradient by comparison of genetic fingerprinting methods in a multipond solar saltern scaling plots. This exercise allowed fast comparison of microbial assemblages and determined to what extent the picture provided by each laboratory was similar to those of others. Formation of two main, salinity-based groups of samples in prokaryotes (4–15% and 22–37% salinity) was consistent for all the laboratories. When other clusters appeared, this was a result of the particular technique and the protocol used in each case, but more affected by the primers set used. Eukaryotic microorganisms changed more from pond to pond; 4–5% and 8–37% salinity were but the two main groups detected. Archaea showed the lowest number of bands whereas Eukarya showed the highest number of operational taxonomic units (OTUs) in the initial ponds. Artefacts appeared in the DGGE from ponds with extremely low microbial richness. On the other hand, different 16S rDNA frag- ments with the same restriction or internal tran- scribed spacer (ITS) length were the main limitations for T-RFLP and RISA analyses, respectively, in ponds with the highest OTUs richness. However, although the particular taxonomic composition could vary among protocols, the general structure of the micro- bial assemblages was maintained. Introduction The study of microbial diversity (both species richness and species evenness) in natural environments has advanced significantly after the introduction of SSU rDNA- based molecular techniques (for example, see reviews in Amann et al., 1995; Muyzer, 1998). Different molecular methods are available, and the choice of the right method would be dependent on the questions to be answered and on the amount of samples to be processed within a reasonable period of time. To compare microbial assemblages and assess temporal and spatial changes, fingerprinting techniques offer the best compromise. Poly- merase chain reaction (PCR)-fingerprinting methods gen- erate band patterns that, in the best case, relate each band to a single taxon. These methods are widely used in environmental microbiology and several lines of evi- dence indicate that fingerprints reflect the composition of Environmental Microbiology (2002) 4(6), 338–348 Emilio O. Casamayor, 1 * † Ramon Massana, 1 Susana Benlloch, 2 Lise Øvreås, 3 Beatriz Díez, 1 Victoria J. Goddard, 4 Josep M. Gasol, 1 Ian Joint, 4 Francisco Rodríguez-Valera 2 and Carlos Pedrós-Alió 1 1 Departament de Biologia Marina i Oceanografia, Institut de Ciències del Mar, CMIMA-CSIC, E-08003 Barcelona, Spain. 2 División Microbiología, Universidad Miguel Hernández, 03550 Alicante, Spain. 3 Department of Microbiology, University of Bergen, 5020 Bergen, Norway. 4 NERC Plymouth Marine Laboratory, Plymouth PL1 3DH, UK. Summary Microbial communities inhabiting a multipond solar saltern were analysed and compared using SSU rRNA polymerase chain reaction (PCR)-based fingerprint- ings carried out in parallel by four laboratories. A salinity gradient from seawater (3.7%) to NaCl pre- cipitation (37%) was studied for Bacteria, Archaea and Eukarya, and laboratories applied their own tech- niques and protocols on the same set of samples. Members of all three domains were retrieved from all salt concentrations. Three fingerprinting techniques were used: denaturing gradient gel electrophoresis (DGGE), ribosomal internal spacer analysis (RISA), and terminal-restriction fragments length polymor- phism (T-RFLP). In addition, each laboratory used its own biomass collection method and DNA extraction protocols. Prokaryotes were addressed using DGGE and RISA with different ‘domain-specific’ primers sets. Eukaryotes were analysed by one laboratory using DGGE and T-RFLP, but targeting the same 18S rDNA site. Fingerprints were compared through cluster analysis and non-metric multidimensional Received 21 January, 2002; revised 7 March, 2002; accepted 11 March, 2002. *For correspondence. E-mail [email protected]; Tel. (+33) 468 88 73 42; Fax (+33) 468 88 73 98. † Present address: Observatoire Océanologique de Banyuls-CNRS, BP 44, F-66651 Banyuls-sur-Mer, France.
-
Upload
independent -
Category
Documents
-
view
1 -
download
0
Transcript of Changes in archaeal, bacterial and eukaryal assemblages along a salinity gradient by comparison of...
© 2002 Blackwell Science Ltd
Changes in archaeal, bacterial and eukaryalassemblages along a salinity gradient by comparisonof genetic fingerprinting methods in a multipond solar saltern
scaling plots. This exercise allowed fast comparisonof microbial assemblages and determined to whatextent the picture provided by each laboratory wassimilar to those of others. Formation of two main,salinity-based groups of samples in prokaryotes(4–15% and 22–37% salinity) was consistent for all thelaboratories. When other clusters appeared, this wasa result of the particular technique and the protocolused in each case, but more affected by the primersset used. Eukaryotic microorganisms changed morefrom pond to pond; 4–5% and 8–37% salinity were butthe two main groups detected. Archaea showed thelowest number of bands whereas Eukarya showedthe highest number of operational taxonomic units(OTUs) in the initial ponds. Artefacts appeared in theDGGE from ponds with extremely low microbial richness. On the other hand, different 16S rDNA frag-ments with the same restriction or internal tran-scribed spacer (ITS) length were the main limitationsfor T-RFLP and RISA analyses, respectively, in pondswith the highest OTUs richness. However, althoughthe particular taxonomic composition could varyamong protocols, the general structure of the micro-bial assemblages was maintained.
Introduction
The study of microbial diversity (both species richnessand species evenness) in natural environments hasadvanced significantly after the introduction of SSU rDNA-based molecular techniques (for example, see reviews inAmann et al., 1995; Muyzer, 1998). Different molecularmethods are available, and the choice of the right methodwould be dependent on the questions to be answered and on the amount of samples to be processed within a reasonable period of time. To compare microbial assemblages and assess temporal and spatial changes,fingerprinting techniques offer the best compromise. Poly-merase chain reaction (PCR)-fingerprinting methods gen-erate band patterns that, in the best case, relate eachband to a single taxon. These methods are widely usedin environmental microbiology and several lines of evi-dence indicate that fingerprints reflect the composition of
Environmental Microbiology (2002) 4(6), 338–348
Emilio O. Casamayor,1*† Ramon Massana,1
Susana Benlloch,2 Lise Øvreås,3 Beatriz Díez,1
Victoria J. Goddard,4 Josep M. Gasol,1 Ian Joint,4
Francisco Rodríguez-Valera2 and Carlos Pedrós-Alió1
1Departament de Biologia Marina i Oceanografia,Institut de Ciències del Mar, CMIMA-CSIC, E-08003Barcelona, Spain.2División Microbiología, Universidad Miguel Hernández,03550 Alicante, Spain.3Department of Microbiology, University of Bergen, 5020Bergen, Norway.4NERC Plymouth Marine Laboratory, Plymouth PL13DH, UK.
Summary
Microbial communities inhabiting a multipond solarsaltern were analysed and compared using SSU rRNApolymerase chain reaction (PCR)-based fingerprint-ings carried out in parallel by four laboratories. Asalinity gradient from seawater (3.7%) to NaCl pre-cipitation (37%) was studied for Bacteria, Archaeaand Eukarya, and laboratories applied their own tech-niques and protocols on the same set of samples.Members of all three domains were retrieved from allsalt concentrations. Three fingerprinting techniqueswere used: denaturing gradient gel electrophoresis(DGGE), ribosomal internal spacer analysis (RISA),and terminal-restriction fragments length polymor-phism (T-RFLP). In addition, each laboratory used itsown biomass collection method and DNA extractionprotocols. Prokaryotes were addressed using DGGEand RISA with different ‘domain-specific’ primerssets. Eukaryotes were analysed by one laboratoryusing DGGE and T-RFLP, but targeting the same 18SrDNA site. Fingerprints were compared throughcluster analysis and non-metric multidimensional
Received 21 January, 2002; revised 7 March, 2002; accepted 11March, 2002. *For correspondence. E-mail [email protected];Tel. (+33) 468 88 73 42; Fax (+33) 468 88 73 98. †Present address:Observatoire Océanologique de Banyuls-CNRS, BP 44, F-66651Banyuls-sur-Mer, France.
Fingerprinting comparison in a salt gradient 339
© 2002 Blackwell Science Ltd, Environmental Microbiology, 4, 338–348
the predominant PCR-targeted members of the commu-nity (e.g. Felske et al., 1998; Nübel et al., 1999; Riemannet al., 1999; Casamayor et al., 2000a). According to PCRfingerprints, microbial assemblages are generally domi-nated by a few taxons (between three and 35 bands arecommonly observed), although many more are likely tobe present in low abundance (e.g. Casamayor et al.,2000a). It is possible that fingerprints provide a biasedview of microbial assemblages. Most fingerprintingmethods rely on PCR, a technique that may introduce dif-ferent biases and therefore alter the natural abundance ofsequences (for a review, see Wintzingerode et al., 1997).Other problems are the presence of heteroduplexes(Muyzer et al., 1998), different sequences that might stopat the same position in a gradient gel or have the samerestriction length and, finally, different bands belonging todifferent operons of the same organism (Nübel et al.,1996). Furthermore, some 16S rDNA-defined micro-diverse populations can be lumped together or separateddepending on the resolution of the methods (e.g.Casamayor et al., 2002). Another source of problemsarises from nucleic acid extraction procedures, becauseit is not clear whether microbial cells in nature exhibit dif-ferent degrees of resistance to cell breakage and extrac-tion efficiency might be dependent on assemblagecomposition. Next, the influence of the sampling size hasbeen poorly explored for microorganisms. Finally, the socalled ‘universal’ primers used for PCR amplificationmight overlook some of the potentially targeted micro-organisms (Schmalenberger et al., 2001). A good com-parison between the different protocols has rarely beenmade and each research laboratory tends to use its ownprocedure. Thus, different biomass collection steps, DNAextraction methods, different ‘universal’ primers sets forthe PCR, and different fingerprinting techniques arewidely used. To what extent does this methodological variability alter the picture of a natural assemblage is,however, a matter of debate. In the present work, we haveused a solar saltern as a model environment to addressan interlaboratory comparison. Thus, four differentresearch groups met in Bras del Port salterns in SantaPola (Alicante, Spain). Each group applied its own proto-col on the same set of original samples and final resultswere compared. Protocols included different DNA extrac-tion methods and different sets of ‘domain-specific’primers. Solar salterns are semi-artificial systems toharvest NaCl from seawater, and we have selected thisenvironment because it provides a very useful tool formicrobial diversity studies (Pedrós-Alió et al., 2000). Seawater is pumped along a series of ponds, water evaporates and salts concentrate, changing the physico-chemical properties. Sequential precipitation of CaCO3
and CaSO4 occurs during the first stages and, finally,when seawater has evaporated to about one tenth of the
original volume, NaCl precipitates in ponds called crystallizers. Thus, a wide range of environments can besampled within walking distance and completely differentcommunities can be simultaneously studied. Fingerprint-ings should reflect this trend. It is widely accepted thatdiversity decreases with increasing salinity (Rodríguez-Valera et al., 1985; Pedrós-Alió et al., 2000), providing aworking hypothesis about which environments are high orlow in diversity. Mostly, three extreme-halophilic micro-organisms (one archaeon (Benlloch et al., 1995; Antónet al., 1999), one bacterium (Antón et al., 2000) and thealga Dunaliella salina) thrive in crystallizers (35–37%salinity). At lower salinity ponds, on the contrary, a ratherdiverse assemblage of halotolerant and halophilicmicroorganisms is found (Rodríguez-Valera et al., 1985;Benlloch et al., 2002). Again, fingerprints should show thistrend. In the work we present here, different fingerprintsare analysed to check to what extent the picture providedby each laboratory was similar to those of others alongthe gradient. The 16S rDNA sequences obtained from fingerprints and clone libraries are discussed in a sepa-rate paper (Benlloch et al., 2002).
Results
Methodological considerations
The aim of the present work was not to carry out adetailed, step-by-step comparison of methods and proto-cols but to compare the final results obtained by four independent approaches. Thus, each laboratory was freeto use its own protocol on the same set of water samples(Table 1). All four laboratories targeted Bacteria but onlytwo groups targeted Archaea. Eukarya were analysed by one laboratory but using two fingerprinting techniques.In total, four biomass collection procedures, four DNAisolation methods, seven sets of primers and three fingerprinting techniques were utilized. For Bacteria, threedifferent ‘domain-specific’ primers sets were used (Fig. 1).
DNA was extracted and PCR-amplified with all themethods applied. Differences were seen, however, for thelong-term performance of DNA extracts. DNA collectedwith microconcentrators and washed several times (ICMprotocol, see Experimental procedures) yielded PCRamplification products even after several months of beingkept at -70∞C, but that which was DNA-precipitated andwashed once with ethanol did not. On the other hand,Archaea from ponds of up to 8% salinity yielded very littlePCR product with all protocols. Yield improved after anested PCR step (data not shown, see Benlloch et al.,2002). Therefore, the low amplification yield was probablydue to a very low original concentration of archaeal DNA(i.e. very low archaeal abundance).
To determine the extent of the variability introduced
© 2002 Blackwell Science Ltd, Environmental Microbiology, 4, 338–348
340 E. O. Casamayor et. al.
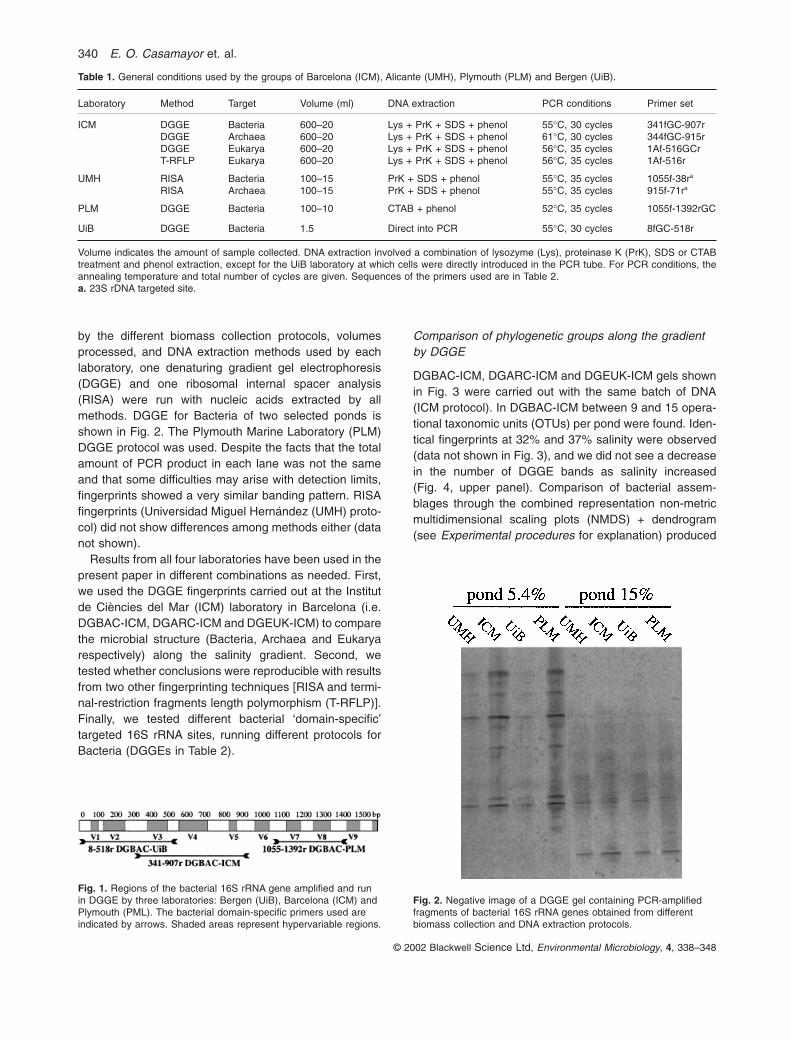
by the different biomass collection protocols, volumesprocessed, and DNA extraction methods used by eachlaboratory, one denaturing gradient gel electrophoresis(DGGE) and one ribosomal internal spacer analysis(RISA) were run with nucleic acids extracted by allmethods. DGGE for Bacteria of two selected ponds isshown in Fig. 2. The Plymouth Marine Laboratory (PLM)DGGE protocol was used. Despite the facts that the totalamount of PCR product in each lane was not the sameand that some difficulties may arise with detection limits,fingerprints showed a very similar banding pattern. RISAfingerprints (Universidad Miguel Hernández (UMH) proto-col) did not show differences among methods either (datanot shown).
Results from all four laboratories have been used in thepresent paper in different combinations as needed. First,we used the DGGE fingerprints carried out at the Institutde Ciències del Mar (ICM) laboratory in Barcelona (i.e.DGBAC-ICM, DGARC-ICM and DGEUK-ICM) to comparethe microbial structure (Bacteria, Archaea and Eukaryarespectively) along the salinity gradient. Second, wetested whether conclusions were reproducible with resultsfrom two other fingerprinting techniques [RISA and termi-nal-restriction fragments length polymorphism (T-RFLP)].Finally, we tested different bacterial ‘domain-specific’targeted 16S rRNA sites, running different protocols for Bacteria (DGGEs in Table 2).
Comparison of phylogenetic groups along the gradientby DGGE
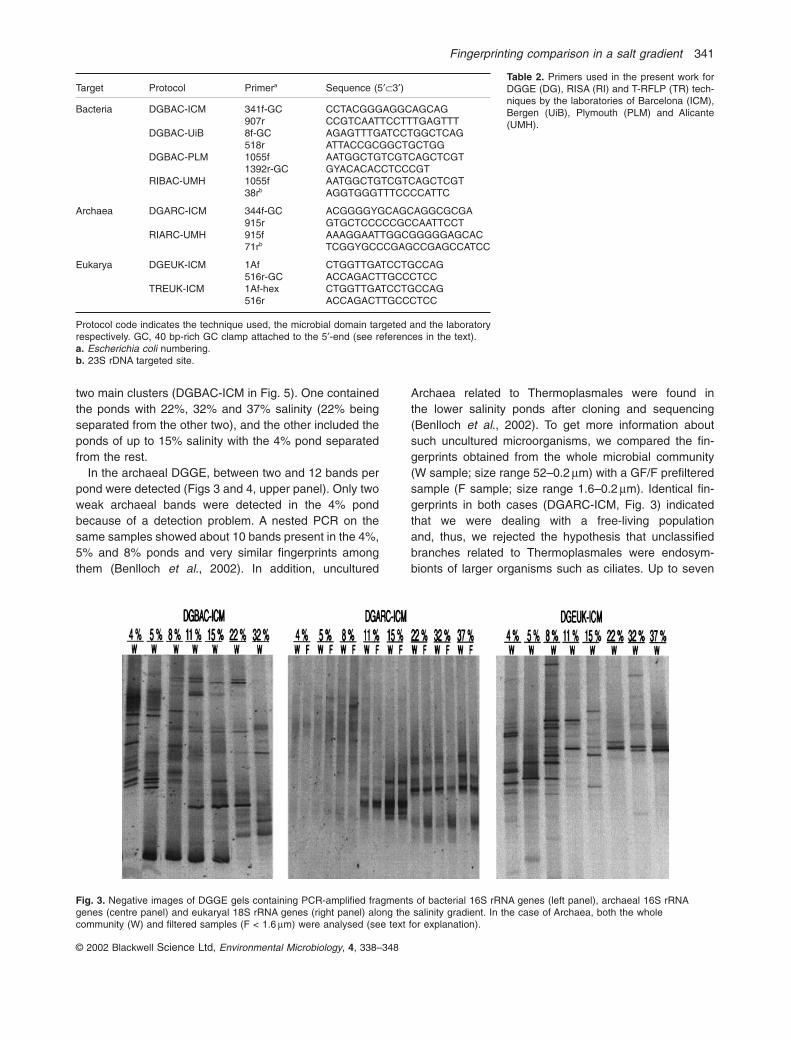
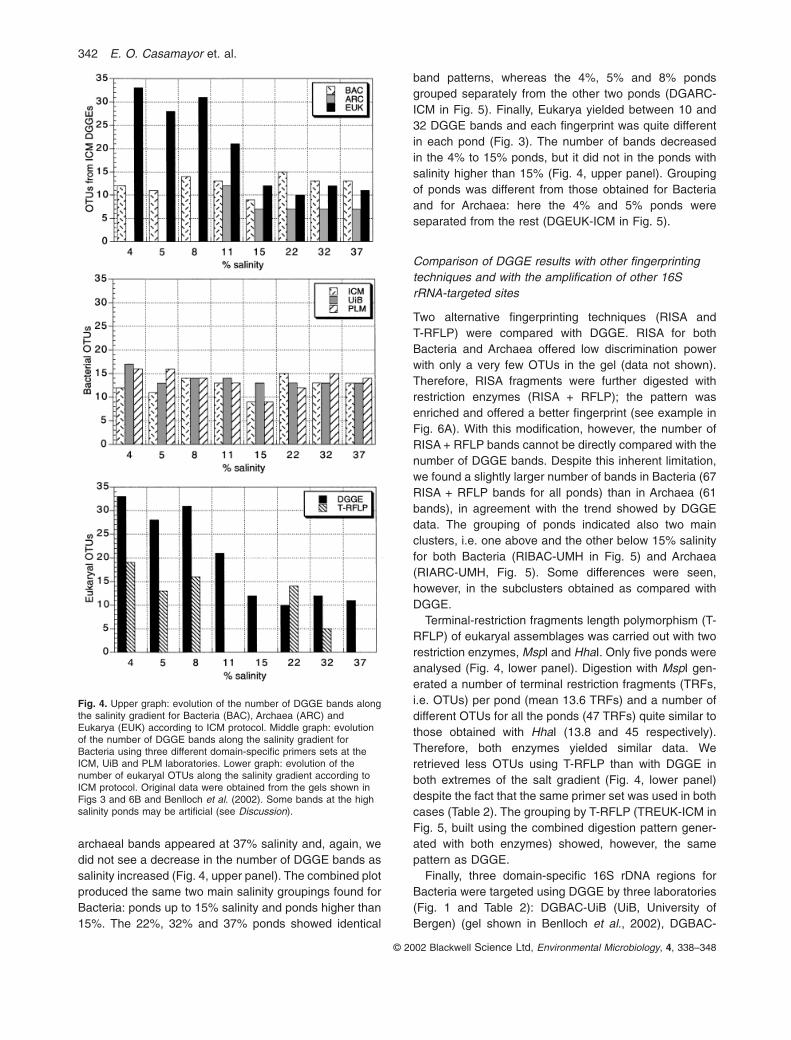
DGBAC-ICM, DGARC-ICM and DGEUK-ICM gels shownin Fig. 3 were carried out with the same batch of DNA(ICM protocol). In DGBAC-ICM between 9 and 15 opera-tional taxonomic units (OTUs) per pond were found. Iden-tical fingerprints at 32% and 37% salinity were observed(data not shown in Fig. 3), and we did not see a decreasein the number of DGGE bands as salinity increased(Fig. 4, upper panel). Comparison of bacterial assem-blages through the combined representation non-metricmultidimensional scaling plots (NMDS) + dendrogram(see Experimental procedures for explanation) produced
Table 1. General conditions used by the groups of Barcelona (ICM), Alicante (UMH), Plymouth (PLM) and Bergen (UiB).
Laboratory Method Target Volume (ml) DNA extraction PCR conditions Primer set
ICM DGGE Bacteria 600–20 Lys + PrK + SDS + phenol 55∞C, 30 cycles 341fGC-907rDGGE Archaea 600–20 Lys + PrK + SDS + phenol 61∞C, 30 cycles 344fGC-915rDGGE Eukarya 600–20 Lys + PrK + SDS + phenol 56∞C, 35 cycles 1Af-516GCrT-RFLP Eukarya 600–20 Lys + PrK + SDS + phenol 56∞C, 35 cycles 1Af-516r
UMH RISA Bacteria 100–15 PrK + SDS + phenol 55∞C, 35 cycles 1055f-38ra
RISA Archaea 100–15 PrK + SDS + phenol 55∞C, 35 cycles 915f-71ra
PLM DGGE Bacteria 100–10 CTAB + phenol 52∞C, 35 cycles 1055f-1392rGC
UiB DGGE Bacteria 1.5 Direct into PCR 55∞C, 30 cycles 8fGC-518r
Volume indicates the amount of sample collected. DNA extraction involved a combination of lysozyme (Lys), proteinase K (PrK), SDS or CTABtreatment and phenol extraction, except for the UiB laboratory at which cells were directly introduced in the PCR tube. For PCR conditions, theannealing temperature and total number of cycles are given. Sequences of the primers used are in Table 2.a. 23S rDNA targeted site.
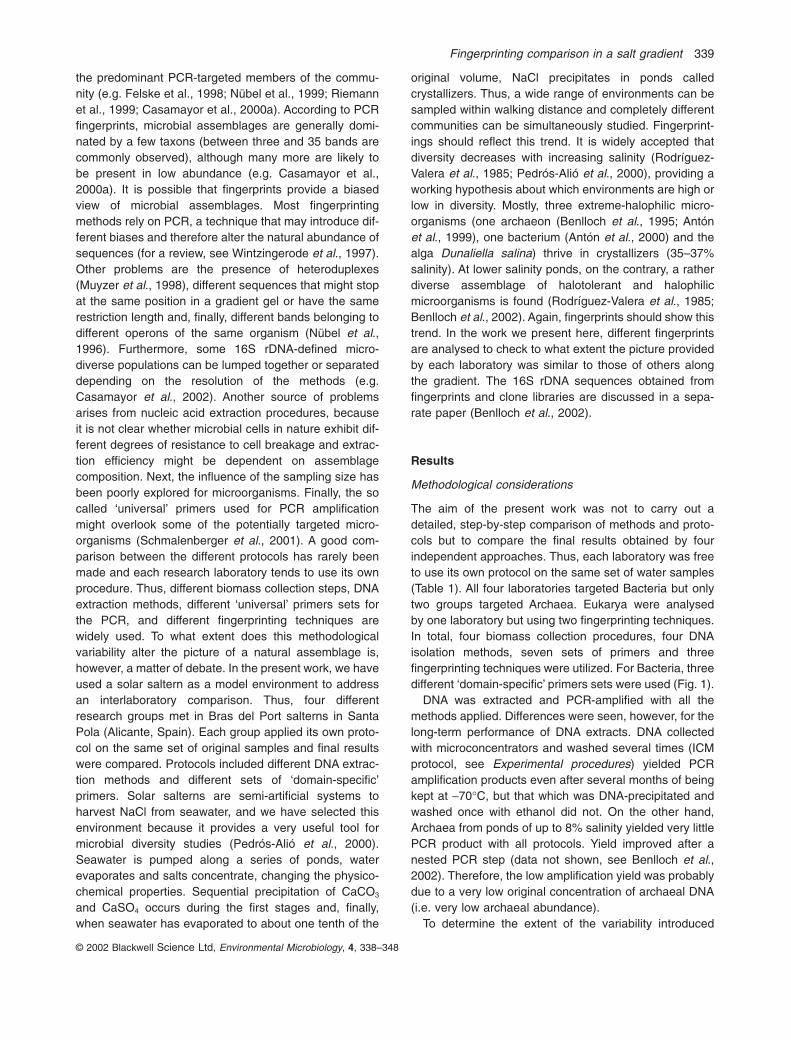
Fig. 1. Regions of the bacterial 16S rRNA gene amplified and runin DGGE by three laboratories: Bergen (UiB), Barcelona (ICM) andPlymouth (PML). The bacterial domain-specific primers used areindicated by arrows. Shaded areas represent hypervariable regions.
Fig. 2. Negative image of a DGGE gel containing PCR-amplifiedfragments of bacterial 16S rRNA genes obtained from differentbiomass collection and DNA extraction protocols.
Fingerprinting comparison in a salt gradient 341
© 2002 Blackwell Science Ltd, Environmental Microbiology, 4, 338–348
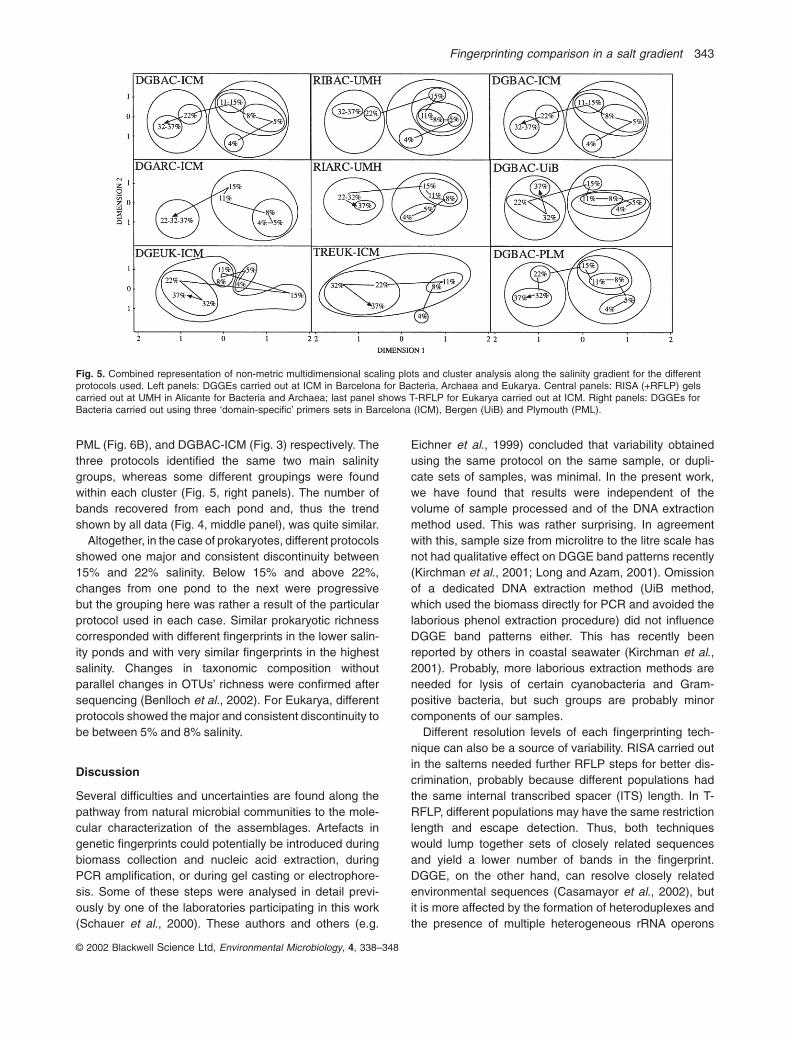
two main clusters (DGBAC-ICM in Fig. 5). One containedthe ponds with 22%, 32% and 37% salinity (22% beingseparated from the other two), and the other included theponds of up to 15% salinity with the 4% pond separatedfrom the rest.
In the archaeal DGGE, between two and 12 bands perpond were detected (Figs 3 and 4, upper panel). Only twoweak archaeal bands were detected in the 4% pondbecause of a detection problem. A nested PCR on thesame samples showed about 10 bands present in the 4%,5% and 8% ponds and very similar fingerprints amongthem (Benlloch et al., 2002). In addition, uncultured
Archaea related to Thermoplasmales were found in the lower salinity ponds after cloning and sequencing(Benlloch et al., 2002). To get more information aboutsuch uncultured microorganisms, we compared the fin-gerprints obtained from the whole microbial community(W sample; size range 52–0.2 mm) with a GF/F prefilteredsample (F sample; size range 1.6–0.2 mm). Identical fin-gerprints in both cases (DGARC-ICM, Fig. 3) indicatedthat we were dealing with a free-living population and, thus, we rejected the hypothesis that unclassifiedbranches related to Thermoplasmales were endosym-bionts of larger organisms such as ciliates. Up to seven
Target Protocol Primera Sequence (5¢Ã3¢)
Bacteria DGBAC-ICM 341f-GC CCTACGGGAGGCAGCAG907r CCGTCAATTCCTTTGAGTTT
DGBAC-UiB 8f-GC AGAGTTTGATCCTGGCTCAG518r ATTACCGCGGCTGCTGG
DGBAC-PLM 1055f AATGGCTGTCGTCAGCTCGT1392r-GC GYACACACCTCCCGT
RIBAC-UMH 1055f AATGGCTGTCGTCAGCTCGT38rb AGGTGGGTTTCCCCATTC
Archaea DGARC-ICM 344f-GC ACGGGGYGCAGCAGGCGCGA915r GTGCTCCCCCGCCAATTCCT
RIARC-UMH 915f AAAGGAATTGGCGGGGGAGCAC71rb TCGGYGCCCGAGCCGAGCCATCC
Eukarya DGEUK-ICM 1Af CTGGTTGATCCTGCCAG516r-GC ACCAGACTTGCCCTCC
TREUK-ICM 1Af-hex CTGGTTGATCCTGCCAG516r ACCAGACTTGCCCTCC
Protocol code indicates the technique used, the microbial domain targeted and the laboratoryrespectively. GC, 40 bp-rich GC clamp attached to the 5¢-end (see references in the text).a. Escherichia coli numbering.b. 23S rDNA targeted site.
Table 2. Primers used in the present work forDGGE (DG), RISA (RI) and T-RFLP (TR) tech-niques by the laboratories of Barcelona (ICM),Bergen (UiB), Plymouth (PLM) and Alicante(UMH).
Fig. 3. Negative images of DGGE gels containing PCR-amplified fragments of bacterial 16S rRNA genes (left panel), archaeal 16S rRNAgenes (centre panel) and eukaryal 18S rRNA genes (right panel) along the salinity gradient. In the case of Archaea, both the wholecommunity (W) and filtered samples (F < 1.6 mm) were analysed (see text for explanation).
© 2002 Blackwell Science Ltd, Environmental Microbiology, 4, 338–348
342 E. O. Casamayor et. al.
archaeal bands appeared at 37% salinity and, again, wedid not see a decrease in the number of DGGE bands assalinity increased (Fig. 4, upper panel). The combined plotproduced the same two main salinity groupings found forBacteria: ponds up to 15% salinity and ponds higher than15%. The 22%, 32% and 37% ponds showed identical
band patterns, whereas the 4%, 5% and 8% pondsgrouped separately from the other two ponds (DGARC-ICM in Fig. 5). Finally, Eukarya yielded between 10 and32 DGGE bands and each fingerprint was quite differentin each pond (Fig. 3). The number of bands decreased in the 4% to 15% ponds, but it did not in the ponds withsalinity higher than 15% (Fig. 4, upper panel). Groupingof ponds was different from those obtained for Bacteriaand for Archaea: here the 4% and 5% ponds were separated from the rest (DGEUK-ICM in Fig. 5).
Comparison of DGGE results with other fingerprintingtechniques and with the amplification of other 16SrRNA-targeted sites
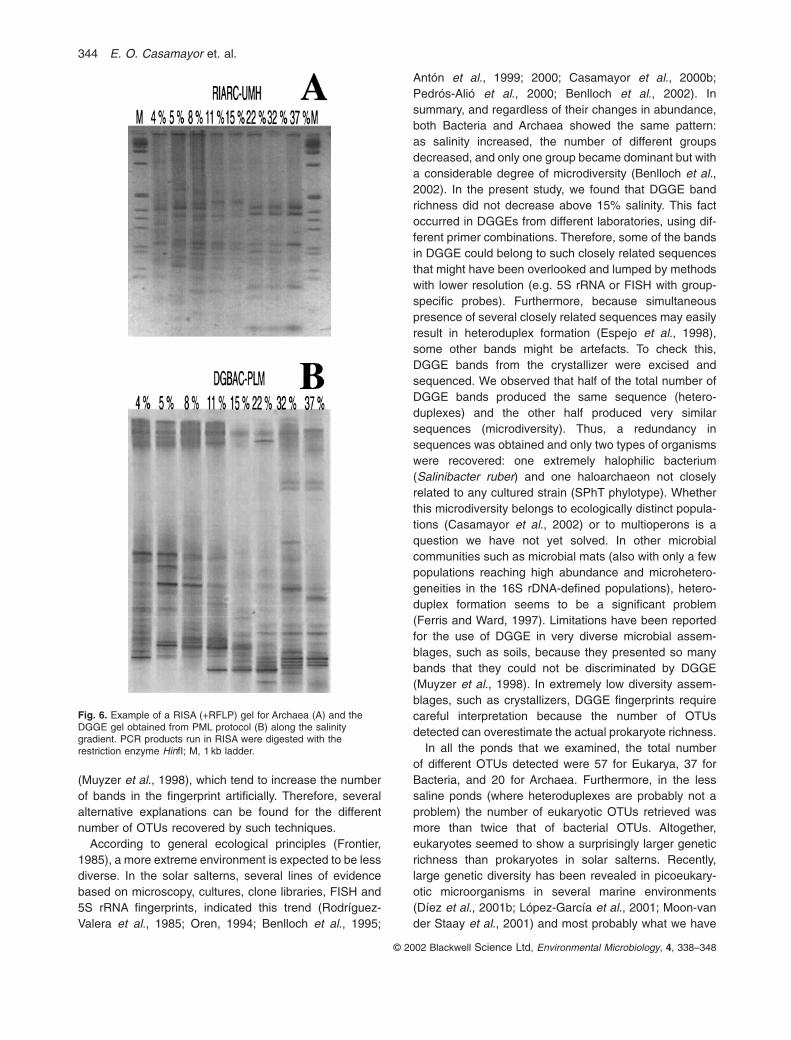
Two alternative fingerprinting techniques (RISA and T-RFLP) were compared with DGGE. RISA for both Bacteria and Archaea offered low discrimination powerwith only a very few OTUs in the gel (data not shown).Therefore, RISA fragments were further digested withrestriction enzymes (RISA + RFLP); the pattern wasenriched and offered a better fingerprint (see example inFig. 6A). With this modification, however, the number ofRISA + RFLP bands cannot be directly compared with thenumber of DGGE bands. Despite this inherent limitation,we found a slightly larger number of bands in Bacteria (67RISA + RFLP bands for all ponds) than in Archaea (61bands), in agreement with the trend showed by DGGEdata. The grouping of ponds indicated also two main clusters, i.e. one above and the other below 15% salinityfor both Bacteria (RIBAC-UMH in Fig. 5) and Archaea(RIARC-UMH, Fig. 5). Some differences were seen,however, in the subclusters obtained as compared withDGGE.
Terminal-restriction fragments length polymorphism (T-RFLP) of eukaryal assemblages was carried out with tworestriction enzymes, MspI and HhaI. Only five ponds wereanalysed (Fig. 4, lower panel). Digestion with MspI gen-erated a number of terminal restriction fragments (TRFs,i.e. OTUs) per pond (mean 13.6 TRFs) and a number ofdifferent OTUs for all the ponds (47 TRFs) quite similar tothose obtained with HhaI (13.8 and 45 respectively).Therefore, both enzymes yielded similar data. Weretrieved less OTUs using T-RFLP than with DGGE inboth extremes of the salt gradient (Fig. 4, lower panel)despite the fact that the same primer set was used in bothcases (Table 2). The grouping by T-RFLP (TREUK-ICM inFig. 5, built using the combined digestion pattern gener-ated with both enzymes) showed, however, the samepattern as DGGE.
Finally, three domain-specific 16S rDNA regions forBacteria were targeted using DGGE by three laboratories(Fig. 1 and Table 2): DGBAC-UiB (UiB, University ofBergen) (gel shown in Benlloch et al., 2002), DGBAC-
Fig. 4. Upper graph: evolution of the number of DGGE bands alongthe salinity gradient for Bacteria (BAC), Archaea (ARC) andEukarya (EUK) according to ICM protocol. Middle graph: evolutionof the number of DGGE bands along the salinity gradient forBacteria using three different domain-specific primers sets at theICM, UiB and PLM laboratories. Lower graph: evolution of thenumber of eukaryal OTUs along the salinity gradient according toICM protocol. Original data were obtained from the gels shown inFigs 3 and 6B and Benlloch et al. (2002). Some bands at the highsalinity ponds may be artificial (see Discussion).
Fingerprinting comparison in a salt gradient 343
© 2002 Blackwell Science Ltd, Environmental Microbiology, 4, 338–348
PML (Fig. 6B), and DGBAC-ICM (Fig. 3) respectively. Thethree protocols identified the same two main salinitygroups, whereas some different groupings were foundwithin each cluster (Fig. 5, right panels). The number ofbands recovered from each pond and, thus the trendshown by all data (Fig. 4, middle panel), was quite similar.
Altogether, in the case of prokaryotes, different protocolsshowed one major and consistent discontinuity between15% and 22% salinity. Below 15% and above 22%,changes from one pond to the next were progressive but the grouping here was rather a result of the particularprotocol used in each case. Similar prokaryotic richnesscorresponded with different fingerprints in the lower salin-ity ponds and with very similar fingerprints in the highestsalinity. Changes in taxonomic composition without parallel changes in OTUs’ richness were confirmed aftersequencing (Benlloch et al., 2002). For Eukarya, differentprotocols showed the major and consistent discontinuity tobe between 5% and 8% salinity.
Discussion
Several difficulties and uncertainties are found along thepathway from natural microbial communities to the mole-cular characterization of the assemblages. Artefacts ingenetic fingerprints could potentially be introduced duringbiomass collection and nucleic acid extraction, duringPCR amplification, or during gel casting or electrophore-sis. Some of these steps were analysed in detail previ-ously by one of the laboratories participating in this work(Schauer et al., 2000). These authors and others (e.g.
Eichner et al., 1999) concluded that variability obtainedusing the same protocol on the same sample, or dupli-cate sets of samples, was minimal. In the present work,we have found that results were independent of thevolume of sample processed and of the DNA extractionmethod used. This was rather surprising. In agreementwith this, sample size from microlitre to the litre scale hasnot had qualitative effect on DGGE band patterns recently(Kirchman et al., 2001; Long and Azam, 2001). Omissionof a dedicated DNA extraction method (UiB method,which used the biomass directly for PCR and avoided the laborious phenol extraction procedure) did not influenceDGGE band patterns either. This has recently beenreported by others in coastal seawater (Kirchman et al.,2001). Probably, more laborious extraction methods areneeded for lysis of certain cyanobacteria and Gram-positive bacteria, but such groups are probably minorcomponents of our samples.
Different resolution levels of each fingerprinting tech-nique can also be a source of variability. RISA carried outin the salterns needed further RFLP steps for better dis-crimination, probably because different populations hadthe same internal transcribed spacer (ITS) length. In T-RFLP, different populations may have the same restrictionlength and escape detection. Thus, both techniqueswould lump together sets of closely related sequencesand yield a lower number of bands in the fingerprint.DGGE, on the other hand, can resolve closely relatedenvironmental sequences (Casamayor et al., 2002), butit is more affected by the formation of heteroduplexes andthe presence of multiple heterogeneous rRNA operons
Fig. 5. Combined representation of non-metric multidimensional scaling plots and cluster analysis along the salinity gradient for the differentprotocols used. Left panels: DGGEs carried out at ICM in Barcelona for Bacteria, Archaea and Eukarya. Central panels: RISA (+RFLP) gelscarried out at UMH in Alicante for Bacteria and Archaea; last panel shows T-RFLP for Eukarya carried out at ICM. Right panels: DGGEs forBacteria carried out using three ‘domain-specific’ primers sets in Barcelona (ICM), Bergen (UiB) and Plymouth (PML).
© 2002 Blackwell Science Ltd, Environmental Microbiology, 4, 338–348
344 E. O. Casamayor et. al.
(Muyzer et al., 1998), which tend to increase the numberof bands in the fingerprint artificially. Therefore, severalalternative explanations can be found for the differentnumber of OTUs recovered by such techniques.
According to general ecological principles (Frontier,1985), a more extreme environment is expected to be lessdiverse. In the solar salterns, several lines of evidencebased on microscopy, cultures, clone libraries, FISH and5S rRNA fingerprints, indicated this trend (Rodríguez-Valera et al., 1985; Oren, 1994; Benlloch et al., 1995;
Antón et al., 1999; 2000; Casamayor et al., 2000b;Pedrós-Alió et al., 2000; Benlloch et al., 2002). Insummary, and regardless of their changes in abundance,both Bacteria and Archaea showed the same pattern: as salinity increased, the number of different groupsdecreased, and only one group became dominant but witha considerable degree of microdiversity (Benlloch et al.,2002). In the present study, we found that DGGE bandrichness did not decrease above 15% salinity. This factoccurred in DGGEs from different laboratories, using dif-ferent primer combinations. Therefore, some of the bandsin DGGE could belong to such closely related sequencesthat might have been overlooked and lumped by methodswith lower resolution (e.g. 5S rRNA or FISH with group-specific probes). Furthermore, because simultaneouspresence of several closely related sequences may easilyresult in heteroduplex formation (Espejo et al., 1998),some other bands might be artefacts. To check this,DGGE bands from the crystallizer were excised andsequenced. We observed that half of the total number ofDGGE bands produced the same sequence (hetero-duplexes) and the other half produced very similarsequences (microdiversity). Thus, a redundancy insequences was obtained and only two types of organismswere recovered: one extremely halophilic bacterium(Salinibacter ruber) and one haloarchaeon not closelyrelated to any cultured strain (SPhT phylotype). Whetherthis microdiversity belongs to ecologically distinct popula-tions (Casamayor et al., 2002) or to multioperons is aquestion we have not yet solved. In other microbial communities such as microbial mats (also with only a fewpopulations reaching high abundance and microhetero-geneities in the 16S rDNA-defined populations), hetero-duplex formation seems to be a significant problem (Ferris and Ward, 1997). Limitations have been reportedfor the use of DGGE in very diverse microbial assem-blages, such as soils, because they presented so manybands that they could not be discriminated by DGGE(Muyzer et al., 1998). In extremely low diversity assem-blages, such as crystallizers, DGGE fingerprints requirecareful interpretation because the number of OTUsdetected can overestimate the actual prokaryote richness.
In all the ponds that we examined, the total number of different OTUs detected were 57 for Eukarya, 37 forBacteria, and 20 for Archaea. Furthermore, in the lesssaline ponds (where heteroduplexes are probably not aproblem) the number of eukaryotic OTUs retrieved wasmore than twice that of bacterial OTUs. Altogether,eukaryotes seemed to show a surprisingly larger geneticrichness than prokaryotes in solar salterns. Recently,large genetic diversity has been revealed in picoeukary-otic microorganisms in several marine environments(Díez et al., 2001b; López-García et al., 2001; Moon-vander Staay et al., 2001) and most probably what we have
Fig. 6. Example of a RISA (+RFLP) gel for Archaea (A) and theDGGE gel obtained from PML protocol (B) along the salinitygradient. PCR products run in RISA were digested with therestriction enzyme HinfI; M, 1 kb ladder.
Fingerprinting comparison in a salt gradient 345
© 2002 Blackwell Science Ltd, Environmental Microbiology, 4, 338–348
found in solar salterns is not an artefact. As an example,halophilic black yeast have recently been reported inhab-iting hypersaline waters (Gunde-Cimerman et al., 2000).Characterization of microbial eukaryotes living in SantaPola salterns through 18S rRNA gene sequencing is nowin process.
Overall, despite the substantial technical differencesamong the different approaches carried out by the fourlaboratories, the final results were reasonably similar.When the same primer set (DGEUK/TREUK) or verysimilar primer sets (DGARC/RIARC and DGBAC-PLM/RIBAC) were used with different fingerprinting tech-niques, the results were quite satisfactory. When differentprimer sets were used with the same fingerprinting tech-nique, variability was higher. Potentially, different targetedSSU rDNA sequences might not be PCR-amplified withequal efficiency by the different primers, and variabilitywithin the amplified region may influence the results(Wintzingerode et al., 1997; Schmalenberger et al., 2001).The estimated coverage of the primers on all thesequences deposited in database varied from 53% byprimer set 8f-518r to more than 84% by primers 341f-907r(Liu et al., 1997). This may also explain differences foundamong primer sets. Despite the inherent limitations, thethree primer sets used for Bacteria recovered a similarnumber of OTUs in all three cases. Thus, whatever thePCR biases, they appeared to be consistent in all thesamples along the gradient. Unfortunately, from the threeband patterns alone, without sequencing of excisedbands, it remains impossible to determine whether thesebands belonged to the same organisms or not. However,although the particular taxonomic composition could varyamong protocols, the general structure of the bacterialassemblages was maintained.
Experimental procedures
Environment and general procedure
The Bras del Port solar salterns constitute a multipond hyper-saline environment located in Santa Pola, Alicante (Spain)(38°12¢N, 0°36¢W). A survey for microbial assemblages alongthe salt gradient was performed during MIDAS workshop II,on 18 May 1999. Sampling was carried out in eight different
ponds with a bucket at the end of a pole, avoiding cornersand dead-ends of ponds, as reported elsewhere (Pedrós-Alióet al., 2000). Ponds were sampled a few centimetres belowwater surface. Because of the long residence time and rela-tively small size, water in such shallow ponds is well mixedby wind. Salinity was measured with a hand refractometer.The waters with the highest salinity were diluted before measurements could be taken. A wide salinity range wascovered (4%, 5%, 8%, 11%, 15%, 22%, 32% and 37% salin-ity) and mean temperatures ranged between 23∞C in the 4%pond and 28∞C in the 37% pond. For DNA analysis, waterwas kept in 25 l plastic carboys for 1–3 h until processing inthe laboratory. Once the samples arrived at the laboratory,each group started its own protocol (Table 1). Different‘domain-specific’ primers sets were used for polymerasechain reaction (PCR) (Table 2) and three fingerprinting tech-niques were carried out: (i) denaturing gradient gel elec-trophoresis (DGGE) was used by three laboratories, andDNA fragments with the same size but different sequencewere resolved using denaturant conditions in a polyacry-lamide gel (Muyzer et al., 1998); (ii) ribosomal internal spaceranalysis (RISA) is based on the amplification of the differentsized ITS (internal transcribed spacer) located between the16S and 23S ribosomal genes (Gürtler and Stanisich, 1996),and was used by one laboratory; and (iii) terminal restrictionfragments length polymorphism (T-RFLP) fluorescentlylabelled, enzymatically digested, PCR products generateddifferent sized bands (Marsh, 1999), and was used by onelaboratory. The fingerprints were compared using statisticalanalysis and by the number of operational taxonomic units(OTUs) detected.
ICM protocol
This protocol was carried out by the group from Institut deCiències del Mar (ICM) of Barcelona and was applied toDGGE for Bacteria (DGBAC-ICM), Archaea (DGARC-ICM)and Eukarya (DGEUK-ICM), and to T-RFLP for Eukarya(TREUK-ICM). Microbial biomass was collected using a peri-staltic pump in 0.2 mm Sterivex filters (Millipore). The Sterivexunits were filled with 1.8 ml of lysis buffer (40 mM EDTA, 50mM Tris-HCl, 0.75 m sucrose) and stored at -70°C. Onlysmall volumes of water could be filtered because of the com-bination of high biomass and high viscosity owing to salinity.Thus, we could only filter about 600 ml from the 4% pond andabout 20 ml from the 37% pond (Table 1). Extracted DNA wasconcentrated by centrifugation on a microconcentrator (Centricon 100, Amicon; 100 000 MW cut-off) and washed
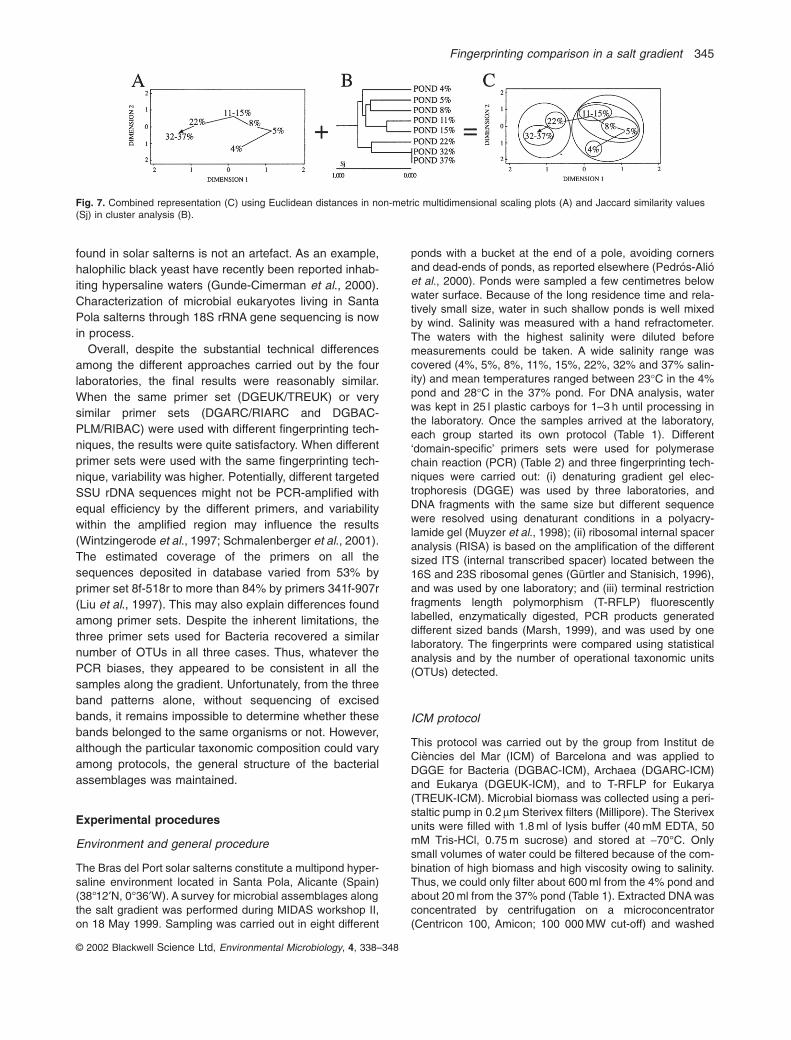
Fig. 7. Combined representation (C) using Euclidean distances in non-metric multidimensional scaling plots (A) and Jaccard similarity values(Sj) in cluster analysis (B).
© 2002 Blackwell Science Ltd, Environmental Microbiology, 4, 338–348
346 E. O. Casamayor et. al.
with MQ water several times. This system allowed severalrinsing steps to eliminate impurities. Nucleic acid extractswere stored at -70∞C. Fingerprinting analyses at the ICMwere carried out as follows:
Bacterial DGGE (DGBAC-ICM) was carried out using theDGGE-2000 system (CBS Scientific Company) in a 6% (w/v)polyacrylamide gel and with a gradient of DNA-denaturantagents from 40% to 80% (100% denaturant is 7 M urea and40% deionized formamide) (Schauer et al., 2000). Then, 600 ng of PCR product was loaded in each lane and the gelwas run at 100 V for 16 h at 60∞C. Archaeal DGGE (DGARC-ICM) was carried out as described previously (Casamayoret al., 2001), with some modifications. DGGE was run at 250 V for 5 h under the same conditions described forDGBAC-ICM. Finally, Eukaryal DGGE (DGEUK-ICM) wascarried out as described previously (Díez et al., 2001a) in adenaturant gradient from 40% to 65%. DGGE gels werestained with a solution of GelStar (1:5000 dilution; FMC BioProducts) and visualized under UV radiation with theFluor-S MultiImager (Bio-Rad) and the MULTI-ANALYST
software (Bio-Rad).For T-RFLP analysis (TREUK-ICM), we used the same
primer set and PCR conditions described for DGEUK-ICM,except for the forward primer that was 5¢-labelled with hexa-chlorofluorescein (HEX, Operon Technologies) and for thereverse primer that lacked GC-clamp. Fluorescently labelledPCR products were purified with Wizard PCR purificationcolumns (Promega) and 6 ml aliquots of purified PCR prod-ucts were separately digested with 20 U of restrictionenzymes HhaI, and MspI (Boehringer Mannheim Biochemi-cals) according to the manufacturer’s instructions. Terminalrestriction fragments (TRFs) were resolved by electrophore-sis at 3000 V for 14 h in a 6% denaturing acrylamide gel (acry-lamide-NN-methylenebisacrylamide, 19:1) in an ABI PRISMmodel 373 Automated Sequencer. TRFs were sized with thesoftware GENESCAN 2.1 up to a one basepair resolution usingthe size standard TAMRA-2500 (ABI).
UMH protocol
This protocol was carried out by the group from the Univer-sidad Miguel Hernández (UMH) of Alicante and was appliedto RISA for both Bacteria (RIBAC-UMH) and Archaea(RIARC-UMH). Microbial biomass was collected by filtrationon 9-cm-diameter, 0.22-mm-pore-size, Durapore filters (Millipore). Water was pumped until filter clogging decreasedflow rate to a few ml per min. Filters were stored at -70∞Cuntil DNA extraction. Filters were cut in small pieces and werevigorously mixed with 2 ml of MQ water using 50 ml conicalbottom polypropylene centrifuge tubes (Benlloch et al.,2001). The supernatant was transferred to a fresh tube, con-taining SDS and proteinase K, incubated at 55°C for 2 h andtransferred to a boiling water-bath for 2 min. Lysates werephenol-extracted and nucleic acids were concentrated byethanol precipitation. For RISA analysis, fragments compris-ing the end of the 16S ribosomal gene, the entire 16S-23Sspacer and some 50 bp of the 5¢-end of the 23S gene wereamplified (Acinas et al., 1999; Benlloch et al., 2001). Then,15 ml of PCR product was digested with 10 U of restrictionenzyme HinfI, to increase discrimination power of thebanding pattern, and were loaded in a 2% Nusieve gel
with a 1 kb ladder (Life Technologies). The gel was stainedwith ethidium bromide, photographed under UV radiation,scanned, and kept as a computer file.
PML protocol
This protocol was carried out by the group from the PlymouthMarine Laboratory and was applied to DGGE for Bacteria(DGBAC-PLM). Microbial biomass was collected by filtrationand filters were digested with a procedure based on the CTABmethod and phenol extraction (Goddard et al., 2001). PCRproduct (500 ng) was loaded in the gel and DGGE ran in a 6% polyacrylamide gel, with a 30–50% denaturant gradient,200 V for 3.5 h at 60∞C (Ferris and Ward, 1997). A Bio-RadDCode system was used. Gels were stained with Sybr Gold(1:10 000 dilution; Molecular Probes) and viewed under UV.
UiB protocol
This protocol was carried out by the group from University ofBergen and was applied to DGGE for Bacteria (DGBAC-UiB).Microbial biomass was collected by direct centrifugation of asmall volume of sample (i.e. 2 ¥ 1.5 ml sample; 14 000 r.p.m.in a microfuge). The cell pellets were washed with 70%ethanol, centrifuged once more, and were then dried andstored at -70∞C. No DNA extraction or purification steps wereperformed, and the pellets were thawed and resuspended in50 ml MQ water. Then, 5 ml of suspension was used directlyas template for PCR. DGBAC-UiB was as described previ-ously (Øvreås et al., 1997). DGGE was performed with aHoefer Scientific SE600 vertical dual-cooler system using alinear gradient of urea and formamide from 20% to 40%denaturant. Then, 400 ng of PCR samples was loaded onto8% (w/v) polyacrylamide gels. The electrophoresis was runat 60∞C, first for 10 min at 20 V and subsequently for 20 h at60 V. After electrophoresis, gels were stained for 45 min withSybr Gold, rinsed in distilled water and photographed with aPolaroid camera. Photographs were scanned, and digitizedimages were kept as computer files.
Processing band patterns and cluster analysis
High-resolution digitized images were processed with Diver-sity Database (Bio-Rad) and NIH Image (National Institute ofHealth, Bethesda, Maryland) software. The software carriedout a density profile through each lane, detected the bands,and calculated the relative contribution of each band to thetotal band signal in the lane after applying a rolling disk asbackground subtraction (rolling ball radius = 50). A band wasdefined as a stain signal whose intensity was more than 0.2%of the total intensity for each lane (Schauer et al., 2000).Several of the weaker bands could not be distinguished inthe figures presented here, and were only detectable on thecomputer screen after zooming the image. Bands occupyingthe same position in different lanes were identified using soft-ware facilities and one matrix with presence or absence datawas built. Binary data set was used to calculate a similaritymatrix using the Jaccard’s coefficient with the softwareSYSTAT 5.2.1 for Macintosh, and a dendrogram was obtainedusing UPGMA (Unweighted Pair-Group Method with Arithmetic
Fingerprinting comparison in a salt gradient 347
© 2002 Blackwell Science Ltd, Environmental Microbiology, 4, 338–348
averages) in cluster analysis (SYSTAT). Non-metric multidi-mensional scaling plots (NMDS) were also constructed fromthe binary matrix. NMDS plots present data in an Euclideanplane (with dimensions of no special significance) in whichsimilar measurements appear close together. Each bandpattern is a point in the plane and, by connecting consecu-tive points (i.e. consecutive ponds of increasing salinity),changes in community structure could be visualized andinterpreted (see van Hannen et al., 1999). Dendrograms andNMDS plots are a robust and widely used way for compari-son of microbial assemblages (e.g. Eichner et al., 1999; ElFantroussi et al., 1999; van Hannen et al., 1999; Schaueret al., 2000; Díez et al., 2001a). For statistical comparison ofdata sets, we combined here the information of NMDS andof similarity dendrograms (see Fig. 7 for an example). Thiscombined representation summarizes in a single plot howconsecutive ponds (connected by lines) were related to eachother according to Euclidean distances and Jaccard’s values.The number of operational taxonomic units (OTUs) in eachsample was defined as the number of DGGE bands or terminal restriction fragments in the T-RFLP gels.
Acknowledgements
This work was funded by project MIDAS (Microbial Diversityin Aquatic Systems, MAS3-CT97-0154) from the EuropeanUnion. We are thankful to Terence Marsh for T-RFLP facili-ties and Mr Miguel Cuervo-Arango for permission to work inSalinas Bras del Port and his enthusiastic support. T-RFLPanalyses were carried out in the Center for Microbial Ecology,East Lansing, Michigan. We thank anonymous reviewers fortheir helpful comments on this manuscript.
References
Acinas, S.G., Antón, J., and Rodríguez-Valera, F. (1999)Diversity of free-living and attached bacteria in offshorewestern Mediterranean waters as depicted by analysis ofgenes encoding 16S rRNA. Appl Environ Microbiol 65:514–522.
Amann, R.I., Ludwig, W., and Schleifer, K.H. (1995) Phylo-genetic identification and in situ detection of individualmicrobial cells without cultivation. Microbiol Rev 59:143–169.
Antón, J., Llobet-Brossa, E., Rodríguez-Valera, F., andAmann, R. (1999) Fluorescence in situ hybridization analy-sis of the prokaryotic community inhabiting crystallizerponds. Environ Microbiol 1: 517–523.
Antón, J., Rosselló-Mora, R., Rodríguez-Valera, F., andAmann, R. (2000) Extremely halophilic Bacteria in crystal-lizer ponds from solar salterns. Appl Environ Microbiol 66:3052–3057.
Benlloch, S., Martínez-Murcia, A.J., and Rodríguez-Valera, F.(1995) Sequencing of bacterial and archaeal 16S rRNAgenes directly amplified from a hypersaline environment.Syst Appl Microbiol 18: 574–581.
Benlloch, S., Acinas, S.G., Antón, J., López-López, A., Luz,S.P., and Rodríguez-Valera, F. (2001) Archaeal biodiversityin crystallizer ponds from a solar saltern: culture versusPCR. Microb Ecol 41: 12–19.
Benlloch, S., López-López, A., Casamayor, E.O., Øvreås, L.,Goddard, V., Daae, F.L., et al. (2002) Prokaryotic geneticcoastal diversity throughout the salinity gradient of acoastal solar saltern. Environ Microbiol 4: 349–360.
Casamayor, E.O., Schäfer, H., Bañeras, L., Pedrós-Alió, C.,and Muyzer, G. (2000a) Identification of and spatio-temporal differences between microbial assemblages from two neighboring sulfurous lakes: comparison bymicroscopy and denaturing gradient gel electrophoresis.Appl Environ Microbiol 66: 499–508.
Casamayor, E.O., Calderón-Paz, J.I., and Pedrós-Alió, C.(2000b) 5S rRNA fingerprints of marine bacteria, halophilicarchaea and natural prokaryotic assemblages along asalinity gradient. FEMS Microbiol Ecol 34: 113–119.
Casamayor, E.O., Muyzer, G., and Pedrós-Alió, C. (2001)Composition and temporal dynamics of planktonicarchaeal assemblages from anaerobic sulfurous environ-ments studied by 16S rDNA denaturing gradient gel electrophoresis and sequencing. Aquat Microb Ecol 25:237–246.
Casamayor, E.O., Pedrós-Alió, C., Muyzer, G., and Amann,R. (2002) Microheterogeneity in 16S rDNA-defined bacte-rial populations from a stratified planktonic environment isrelated to temporal changes and to ecological adaptations.Appl Environ Microbiol 68: 1706–1714.
Díez, B., Pedrós-Alió, C., Marsh, T.L., and Massana, R.(2001a) Application of denaturing gradient gel elec-trophoresis to study the diversity of marine picoeukaryoticassemblages and comparison with other molecular tech-niques. Appl Environ Microbiol 67: 2942–2951.
Díez, B., Pedrós-Alió, C., and Massana, R. (2001b) Study ofgenetic diversity of eukaryotic picoplankton in differentoceanic regions by small-subunit rRNA gene cloning andsequencing. Appl Environ Microbiol 67: 2932–2941.
Eichner, C.A., Erb, R.W., Timmis, K.N., and Wagner-Döbler,I. (1999) Thermal gradient gel electrophoresis analysis ofbioprotection from pollutant shocks in the activated sludgemicrobial community. Appl Environ Microbiol 65: 102–109.
El Fantroussi, S., Verschuere, L., Verstraete, W., and Top,E.M. (1999) Effect of phenylurea herbicides on soil micro-bial communities estimated by analysis of 16S rRNA genefingerprints and community-level physiological profiles.Appl Environ Microbiol 65: 982–988.
Espejo, R.T., Feijoo, C.J., Romero, J., and Vásquez, M.(1998) PAGE separation of the heteroduplex formedbetween PCR amplified 16S ribosomal RNA genes allowsestimation of phylogenetic relatedness between isolatesand assessment of bacterial diversity. Microbiology 144:1611–1617.
Felske, A., Akkermans, A.D.L., and Devos, W.M. (1998)Quantification of 16S rRNAs in complex bacterial commu-nities by multiple competitive reverse transcription PCR intemperature gradient gel electrophoresis fingerprints. ApplEnviron Microbiol 64: 4581–4587.
Ferris, M.J., and Ward, D.M. (1997) Seasonal distributions ofdominant 16S rRNA-defined populations in a hot springmicrobial mat examined by denaturing gradient gel elec-trophoresis. Appl Environ Microbiol 63: 1375–1381.
Frontier, S. (1985) Diversity and structure in aquatic eco-systems. Oceanogr Mar Biol Ann Rev 23: 253–312.
Goddard, V.J., Bailey, M.J., Darrah, P., Lilley, A.K., and
© 2002 Blackwell Science Ltd, Environmental Microbiology, 4, 338–348
348 E. O. Casamayor et. al.
Thompson, I.P. (2001) Monitoring temporal and spatialvariation in rhizosphere bacterial population diversity: acommunity approach for the improved selection of rhizos-phere competent bacteria. Plant Soil 232: 181–193.
Gunde-Cimerman, N., Zalar, P., de Hoog, S., and Plemeni-tas, A. (2000) Hypersaline waters in salterns: natural eco-logical niches for halophilic black yeast. FEMS MicrobiolEcol 32: 235–240.
Gürtler, V., and Stanisich, V.A. (1996) New approaches totyping and identification of bacteria using the 16S–23SrDNA spacer region. Microbiology 142: 3–16.
van Hannen, E.J., Zwart, G., van Agterveld, M.P., Gons, H.J.,Ebert, J., and Laanbroek, H.J. (1999) Changes in bacter-ial and eukaryotic community structure after mass lysis offilamentous cyanobacteria associated with viruses. ApplEnviron Microbiol 65: 795–801.
Kirchman, D.L., Yu, L., Fuchs, B.M., and Amann, R. (2001)Structure of bacterial communities in aquatic systems asrevealed by filter PCR. Aquat Microb Ecol 26: 13–22.
Liu, W., Marsh, T.L., Cheng, H., and Forney, L.J. (1997) Char-acterization of microbial diversity by determining terminalrestriction fragment length polymorphisms of genes encod-ing 16S rRNA. Appl Environ Microbiol 63: 4516–4522.
Long, R.A., and Azam, F. (2001) Microscale patchiness ofbacterioplankton assemblage richness in seawater. AquatMicrob Ecol 26: 103–113.
López-García, P., Rodríguez-Valera, F., Pedrós-Alió, C., andMoreira, D. (2001) Unexpected diversity of small eukary-otes in deep-sea Antarctic plankton. Nature 409: 603–607.
Marsh, T.L. (1999) Terminal restriction fragment length polymorphism (T-RFLP): an emerging method for charac-terizing diversity among homologous populations of amplification products. Curr Opin Microbiol 2: 323–327.
Moon-van der Staay, S.Y., De Wachter, R., and Vaulot, D.(2001) Oceanic 18S rDNA sequences from picoplanktonreveal unsuspected eukaryotic diversity. Nature 409:607–610.
Muyzer, G. (1998) Structure, function and dynamics of micro-bial communities: the molecular biological approach. InAdvances in Molecular Ecology. Carvalho, G.R. (ed.).Amsterdam: IOS Press, pp. 87–117.
Muyzer, G., Brinkhoff, T., Nübel, U., Santegoeds, C., Schäfer,H., and Wawer, C. (1998) Denaturing gradient gel elec-trophoresis (DGGE) in microbial ecology. In MolecularMicrobial Ecology Manual, Vol. 3.4.4. Akkermans, A.D.L.,
van Elsas, J.D., and de Bruijn, F.J. (eds). Dordrecht:Kluwer Academic Publishers, pp. 1–27.
Nübel, U., Engelen, B., Felske, A., Snaidr, J., Weishuber, A.,Amann, R.I., et al. (1996) Sequence heterogeneities ofgenes encoding 16S rRNAs in Paenibacillus polymyxadetected by temperature gradient gel electrophoresis. J Bacteriol 178: 5636–5643.
Nübel, U., Garcia-Pichel, F., Kuhl, M., and Muyzer, G. (1999)Quantifying microbial diversity: morphotypes, 16S rRNAgenes, and carotenoids of oxygenic phototrophs in micro-bial mats. Appl Environ Microbiol 65: 422–430.
Oren, A. (1994) The ecology of the extremely halophilicarchaea. FEMS Microbiol Rev 13: 415–440.
Øvreås, L., Forney, L., Daae, F.L., and Torsvik, V. (1997) Distribution of bacterioplankton in meromictic Lake Saelenvannet, as determined by denaturing gradient gelelectrophoresis of PCR-amplified gene fragments codingfor 16S rRNA. Appl Environ Microbiol 63: 3367–3373.
Pedrós-Alió, C., Calderón-Paz, J.I., MacLean, M.H., Medina,G., Marrasé, C., Gasol, J.M., and Guixa-Boixereu, N.(2000) The microbial food web along salinity gradients.FEMS Microbiol Ecol 32: 143–155.
Riemann, L., Steward, G.F., Fandino, L.B., Campbell, L.,Landry, M.R., and Azam, F. (1999) Bacterial communitycomposition during two consecutive NE Monsoon periodsin the Arabian Sea studied by denaturing gradient gel elec-trophoresis (DGGE) of rRNA genes. Deep Sea Res II (46):1791–1811.
Rodríguez-Valera, F., Ventosa, A., Juez, G., and Imhoff, J.F.(1985) Variation of environmental features and microbialpopulations with salt concentrations in a multi-pond saltern.Microb Ecol 11: 107–115.
Schauer, M., Massana, R., and Pedrós-Alió, C. (2000) Spatialdifferences in bacterioplankton composition along theCatalan coast (NW Mediterranean) assessed by molecu-lar fingerprinting. FEMS Microbiol Ecol 33: 51–59.
Schmalenberger, A., Schwieger, F., and Tebbe, C.C. (2001)Effect of primers hybridizing to different evolutionarily con-served regions of the small-subunit rRNA gene in PCR-based microbial community analyses and genetic profiling.Appl Environ Microbiol 67: 3557–3563.
Wintzingerode, F.V., Goebel, U.B., and Stackebrandt, E.(1997) Determination of microbial diversity in environmen-tal samples: pitfalls of PCR-based rRNA analysis. FEMSMicrobiol Rev 21: 213–229.