Use of novel DNA fingerprinting techniques for the detection ...
133
IAEA-TECDOC-1047 XA9848405 _ Use of novel DNA fingerprinting techniques for the detection and characterization of genetic variation in vegetativeiy propagated crops Proceedings of a final Research Co-ordination Meeting organized by the Joint FAO/IAEA Division of Nuclear Techniques in Food and Agriculture and held in Mumbai, India, 24-28 February 1997 INTERNATIONAL ATOMIC ENERGY AGENCY
-
Upload
khangminh22 -
Category
Documents
-
view
1 -
download
0
Transcript of Use of novel DNA fingerprinting techniques for the detection ...
IAEA-TECDOC-1047 XA9848405 _
Use of novel DNA fingerprintingtechniques for the detection and
characterization of genetic variationin vegetativeiy propagated crops
Proceedings of a final Research Co-ordination Meetingorganized by the
Joint FAO/IAEA Division of Nuclear Techniques in Food and Agricultureand held in Mumbai, India, 24-28 February 1997
INTERNATIONAL ATOMIC ENERGY AGENCY

The originating Section of this publication in the IAEA was:
Plant Breeding and Genetics SectionJoint FAO/IAEA Division
International Atomic Energy AgencyWagramer Strasse 5
P.O. Box 100A-1400 Vienna, Austria
USE OF NOVEL DNA FINGERPRINTING TECHNIQUES FORTHE DETECTION AND CHARACTERIZATION OF GENETIC VARIATION IN
VEGETATIVELY PROPAGATED CROPSIAEA, VIENNA, 1998IAEA-TECDOC-1047
ISSN 1011-4289
©IAEA, 1998
Printed by the IAEA in AustriaOctober 1998

The IAEA does not normally maintain stocks of reports in this series.However, microfiche copies of these reports can be obtained from
IN IS ClearinghouseInternational Atomic Energy AgencyWagramerstrasse 5P.O. Box 100A-1400 Vienna, Austria
Orders should be accompanied by prepayment of Austrian Schillings 100,-in the form of a cheque or in the form of IAEA microfiche service couponswhich may be ordered separately from the INIS Clearinghouse.

FOREWORD
Vegetatively propagated crops, such as banana and plantain, sweet potato, yam,sugarcane and cassava, represent important sources of food in the developing countries.Although some of these crops may produce seeds, they must for practical purposes bepropagated vegetatively. As normal plant breeding strategies based on genetic hybridizationare of limited value or not applicable to such crops, it is necessary to assess the geneticdiversity already existing in these crops and to design breeding strategies accordingly. If theexisting genetic variation is shown to be too narrow for breeding purposes, one promisingpossibility for the introduction of genetic variability is the use of mutations induced byradiation or chemical mutagens.
In 1992, at the outset of this CRP, DNA fingerprinting strategies offered a uniqueopportunity for the measurement of genetic variability, especially in vegetatively-propagatedspecies. These DNA fingerprinting methods, in conjunction with other molecular markermethods, allow: the characterisation of genetic diversity induced by radiation or chemicalmutagenesis, or in vitro culture-derived variants; the evaluation of genetic diversity amongcultivars and wild species in germ plasm banks to allow the identification of suitable breedingstrategies (mutation breeding, conventional plant breeding); and fingerprinting various linesor mutants to exclude misuse.
This CRP focused on: the detection of genetic diversity induced by mutagenic treatmentor in vitro culture; the development of crop-specific markers; and increasing co-operationbetween molecular biologists in advanced laboratories and plant breeders and molecularbiologists in the developing countries.
The success of this CRP is evidenced by the introduction and application of newmolecular methods by laboratories in developing countries, especially for the analysis of localcrop genetic diversity. These exciting preliminary results show the potential for applicationsin crop improvement but much work remains to be done. Many of the vegetatively propagatedspecies are "orphan crops", under-investigated on the international level. The development ofnew uses of transgenesis for the development of edible vaccines should not be overlooked.The challenge that remains is in the application of these new tools for practical end-useroriented improvements in vegetatively propagated crops.
The present publication summarizes the third and final Research Co-ordination Meetingon the Use of Novel DNA Fingerprinting Techniques for the Detection and Characterizationof Genetic Variation in Vegetatively Propagated Crops. The officers responsible for thispublication are E. Week and A. Ashri of the Joint FAO/IAEA Division of Nuclear Techniquesin Food and Agriculture.
Results and conclusions from other IAEA sponsored programmes dealing with mutationtechniques and molecular characterization of genetic variation were summarized recently inIAEA-TECDOC-1010, Application of DNA Based Marker Mutations for Improvement ofCereals and Other Sexually Reproduced Crop Plants, IAEA, Vienna (1998).
EDITORIAL NOTE
In preparing this publication for press, staff of the IAEA have made up the pages from theoriginal manuscripts as submitted by the authors. The views expressed do not necessarily reflectthose of the IAEA, the governments of the nominating Member States or the nominatingorganizations.
Throughout the text names of Member States are retained as they were when the text wascompiled.
The use of particular designations of countries or territories does not imply any judgement bythe publisher, the IAEA, as to the legal status of such countries or territories, of their authorities andinstitutions or of the delimitation of their boundaries.
The mention of names of specific companies or products (whether or not indicated asregistered) does not imply any intention to infringe proprietary rights, nor should it be construed asan endorsement or recommendation on the part of the IAEA.
The authors are responsible for having obtained the necessary permission for the IAEA toreproduce, translate or use material from sources already protected by copyrights.

CONTENTS
Summary 1
Isolation and characterization of repeat elements of the oak genome andtheir application in population analysis 7S. Fluch, K. Burg
Use of arbitrary DN A primers, polyacrylamide gel electrophoresis and silver stainingfor identity testing, gene discovery and analysis of gene expression 13P. Gresshoff
Combined amplification and hybridization techniques for genome scanning invegetatively propagated crops 21G. Kahl, J. Ramser, R. Terauchi, C. Lopez-Peralta, H.N. Asemota, K. Weising
Results of a Musa mapping project 35P.J.L. Lagoda, J.-L. Noyer, F.-C. Baurens, L. Grivet, L.-M. Raboin, C. Amson,G. Aubert, L. Costet, C. Lanaud, D. Dambier, J. Ganry, H. Tezenas-Du-Montcel,J. -P. Horry, F. Bakry, P. Ollitrault, F. Carreel, E. Auboiron, E. Foure, C. Jenny,K. Tomekpe, A. Grapin, A.S. Faure, F. Reschozur, D. Gonzalez-De-Leon
Generation and application of SSR markers in avocado 45D. Sharon, U. Lavi, P.B. Cregan, J. Hillel
DNA fingerprinting of sugarcane for detecting molecular evidence ofsomaclonal variation 59M. Ramos Leal, E. Canales, R. Michel, O. Coto, M. T, Cornide
The examination of Hevea brasiliensis plants produced by in vitroculture and mutagenesis by DNA fingerprinting techniques 63F.C. Low, S. Atan, H. Jaafar
G e n e t i c t r a n s f o r m a t i o n o f d e c i d u o u s f ru i t t r e e s c o n f e r r i n g r e s i s t a n c e a g a i n s t d i s e a s e s . . . 7 5E.L. Mansvelt, T. Glyn-Woods, L. Watts, A. Rabie, M. Appel, D.U. Bellstedt
Application of molecular markers in germplasm enhancement of cassava{Manihot esculenta L. Crantz) and yams {Dioscorea spp.) at IITA 85H.D. Mignouna, R. Asiedu, A.G.O. Dixon, J. Tonukari, N.Q. Ng,G. Thottappilly, M. Knox, T.H.N. Ellis
Molecular phylogeny of mangroves IV. Nature and extent of intra-specificgenetic variation and species diversity in mangroves 95A. Parida, M. Parani, M. Lakshmi, S. Elango, N, Ram, C.S. Anuratha
Improvement of banana through biotechnology and mutation breeding 107P.S. Rao, T.R. Ganapathi, V.A. Bapat, V.M. Kulkarni, P. Suprasanna
The use of PCR techniques to detect genetic variations in cassava{Manihot esculenta L. Crantz): minisatellite and RAPD analysis 119N. Pawlicki, R.S. Sangwan, B. Sangwan-Norreel, N. Koffi Konan
Towards mapping the Dioscorea genome 127R. Terauchi, G. Kahl
Abbreviations 131List of Participants 133

SUMMARY
1. INTRODUCTION
Since mankind has shifted from life as nomad hunters and gatherers to that of sedentaryfarmers, good husbandry has implied selecting appropriate robust and productive individualsfor plant and animal stocks. From this stage onwards, breeding was empirical and based onmorphological aspects and performance of the individuals chosen to carry the population intothe next generation. By these "naked eye polymorphisms" (NEP) the farmers selected themost vigorous plants giving high yield or those having other desirable features. Thesystematic application of empirical knowledge became a selective pressure. The results of thisselective pressure are manifested in the wide array of present day cultivated crops,vegetatively or sexually propagated.
Vegetatively propagated crops contribute significantly to the world food supply.Because of their predominantly vegetative mode of multiplication, additional challenges existfor their genetic analysis and improvement. However, it must be noted that most vegetativelypropagated crops can be reproduced sexually, which, although problematic at times, permitstheir analysis in segregating populations. During the five year duration of this co-ordinatedresearch project (CRP), experience has been gained in building productive collaborationsbetween molecular geneticists and breeders whereby a common language, based onbiotechnology, has been elaborated. This now allows effective communication betweenbreeders and molecular geneticists to develop strategies to resolve problems throughcollaboration. As a spin-off, these scientists have developed capacities to exchange andtransfer knowledge and know-how. The monologues of "Biodiversity Centers" and"Biotechnology Centers" have merged into a profitable dialogue.
An intensive research effort has led to rapid breeding progress in the development ofsexually propagated crops during the past decade. As a consequence, the genomes of many ofthese crops are better known now, molecular marker techniques have been developed,screened, and optimized for the best results, whole sets of allele-specific markers areavailable, and reasonably saturated genetic maps have been established. In comparison withthese achievements, the vegetatively propagated crops as a group are almost totally under-researched.
They represent orphan crops in several respects. Most of them are grown in the tropicalor sub-tropical regions of the world where infrastructure and research capacities areinsufficient. Therefore, even tissue culture has not advanced as yet to the level that is standardfor most sexually propagated crops, not to speak of induced mutation breeding or theapplication of molecular techniques. Most of the vegetatively propagated crops are minor on aglobal scale, some are the crops of small scale farmers and the poor (e.g. yam). Therefore,there is little long term research on the majority of these crops, with banana and potato asexceptions. Efficient breeding strategies have not been developed, or breeding is relativelydifficult when compared with sexually propagated crops.
As already described in the conclusions of the fourth FAO/IAEA Research Co-ordination Meeting (RCM) (Vienna, November 1996) on The Application of DNA BasedMarker Mutations for Improvement of Cereals and Other Sexually Reproduced Crop Species(IAEA-TECDOC-1010), the pressure on modern breeders caused by the urgent demand formore productive and better adapted, disease resistant and high yielding varieties of food crops,

intensifies the need for their continuous improvement. The essence of genetic improvement isthe optimization of gene interactions, which is based on utilizing the available geneticdiversity. The latter can be obtained from natural populations, sexual crosses (viarecombination, segregation and selection), spontaneous mutations (genie and chromosomal),induced mutations (physical and chemical mutagens), and insertional mutagenesis(transposable elements, T-DNA, retroposons).
DNA markers are integrally connected with the success of molecular breeding.Moreover, markers, preferably seedling or juvenile markers, are needed by breeders toidentify new gene sources in the available biodiversity, to select parents in order to increaseheterosis, to decrease the number of backcross generations for gene introgression breedingprogrammes, for marker assisted selection (MAS) and, ultimately, for gene isolation andtransfer via map-based or deletion-based cloning. These have already been extensivelydescribed in IAEA-TECDOC-1010.
Polymerase chain reaction (PCR) technology has boosted the scientific output and yieldof this worldwide co-operative research. Based on the PCR technology, neither a complexlaboratory infrastructure nor highly trained and skilled staff are required to effectivelygenotype entire breeding populations with large numbers of individuals, as proven by markerassisted cattle breeding. PCR analysis is very simple, robust and reliable; a minimal quantityof total genomic DNA, even only partially degraded, suffices as a template for multiplexamplifications. Germplasm assessment and genotyping for identification purposes (breeder'srights, variant authentication, conformity test) can be achieved with polymorphic loci (geneticfingerprinting). The homogeneity of in vitro mass propagated material can easily bemonitored using recurrent checks during the whole process. PCR assays may be readilyautomated with no further human interference between sampling in situ (in the fields) andanalysis "in silico" (on the computer screen), which will allow the transfer of molecularmarkers to the "grass roots".
2. ACHIEVEMENTS
Various molecular marker technologies have been used to measure genetic diversities ofvegetatively propagated crops as shown in the individual papers presented in this RCM. Thebuilding of this research network has permitted the transfer of technology and the enrichmentof knowledge and plant genetic resources available to individual projects where technologiesof DNA profiling [restriction fragment length polymorphism (RFLP); randomly amplifiedpolymorphic DNA (RAPD); simple sequence repeats (SSR); amplified fragment lengthpolymorphism (AFLP); DNA amplification fingerprinting (DAF); and randomly amplifiedmicrosatellite polymorphism (RAMPO)] have been evaluated. Cost, convenience, reliabilityand information content have been recognized as key criteria for selecting an appropriateprofiling technology.
The association of markers and morphological traits led to the generation of maps inseveral species which allow the exploitation of alternative life cycles of vegetativelypropagated plants. For example, in banana one important strategy is the identification of thediploid accessions most closely related to modern cultivars for improvement of desirable traitsin these diploids by MAS, thus recreating polyploid, sterile and parthenocarpic cultivars.Another example is yam, Dioscorea spp., where mapping of the genome of Dioscorea tokoro,a dioecious diploid species closely related to the economically more important yam crops,allowed the tagging of important genes, fostering isolation of these genes for eventual

transformation of yam for genetic improvement. In this fashion, where linkage analysis(detection of linkage disequilibrium) is possible, there are no technological barriers to extendthese strategies to vegetatively propagated crops of interest, and to genetically engineeragronomically important genes.
2.1. Specific achievements of this CRP
The participants in this CRP have investigated various vegetatively propagated specieswith different molecular marker systems. The details of their progress are presented below.
Burg, Austria (7637/CF) - The identification and cloning of minisatellite type repetitiveelements of the oak genome supplies a new marker system for the analysis of the geneticdiversity of oak resources.
Leal, Cuba (8137/RB) - Molecular evidence of somaclonal variation has been found insugarcane. There is possibly a role for several genes involved in the osmotolerance response(ATPase, delta-pyrroline-5-carboxylase reductase, osmotin and heat shock proteins).
Lagoda, France (7422/CF) - A common basis was established in which breederscommunicated their problems to molecular geneticists. Bridging the communication gapclarified the need for a molecular breeding programme on banana and plantain requiring theinput of a mapping and a genetic diversity analysis programme. The development ofadditional markers was a prerequisite for applications outside the laboratory, especially PCRdetection kits. This has been achieved and will be completed in the future by developingsequence tagged microsatellite sites (STMS) markers and sequence characterized amplifiedregions (SCARs) from AFLP.
Sangwan, France (7480/CF) - In cassava, induced genetic variations have been characterizedin vitro, Using PCR-based markers (RAPD and micro satellites). The RAPD analyses werereproducible and showed distinct polymorphic bands.
Kahl, Germany (7227/CF) - For yam, an intense application of various DNA profilingtechniques and sequence comparisons of chloroplast tRNA gene regions revealed geneticdiversity in various Dioscorea species, various accessions of economically important yamsand parents for crosses, e.g. D. tokoro. The same techniques were employed to clarifytaxonomic problems in D. bulbifera, phylogenetic relationships between D. cayensis and D.rotundata (Guinea yam), and between these and their putative progenitors. For the first time, adefined cross of selected parents of D. tokoro permitted profiling progeny. For greaterexploitation of the RAPD polymorphisms, a new hybridization-based method, RAMPO, wasdesigned that expands the information content of a single gel several-fold.
Parida, India (8491/RB) — Molecular markers were used for genetic characterization, speciesidentification, establishing phylogenetic and species relationships in the Indian mangrovespecies. Markers have also been used to select priority areas for conservation andconsolidation of genotypes with the capacity for tolerance to salinity.
Rao, India (7856/RB) - Tissue cultures have been established from thirteen banana genotypesbelonging to different genomic groups including wild diploids. In vitro multiple shoot cultureshave been irradiated and in the early stages of field planting, regenerants have exhibitedchlorophyll variations, earliness, changes in plant height and plant type and further

observations of these will follow. Molecular studies for finger printing have been initiatedwith different banana accessions and variants isolated from irradiation experiments.
Lavi, Israel (7423/CF) - Several kinds of DNA markers (including minisatellites, AFLP andSSRs) were applied to both mango and avocado. Achievements include: identification ofindividuals, study of genetic relationships, identification of linkage between some DNAmarkers and genes coding for agriculturally important traits in avocado, and the generation ofa preliminary genetic map in avocado.
Low, Malaysia (7229/RB) - Somaclonal variations and changes in DNA methylation weredemonstrated for the first time in rubber trees, Hevea brasiliensis, by various DNAfingerprinting techniques. Gamma irradiation resulted in changes in DNA profiles, but thesechanges were complicated by, and indistinguishable from, somaclonal variations.
Mignouna, Nigeria (7228/CF) — Genetic variation among cassava varieties was analysed withRAPD markers. The molecular taxonomy of cultivated and wild yams was established withRAPD and microsatellite markers.
Terauchi, Japan (7228/CF) - High levels of genetic diversity have been found in naturalpopulations of wild yam suggesting the importance of maintaining a small number of largepopulations to protect genetic diversity.
Iqbal, Pakistan (7231/RB) - Local varieties of sugarcane and banana were compared withRAPDs to assess their genetic diversity.
Mansvelt, Republic of South Africa (7638/RB) - RAPD markers were used to generatefingerprints for differentiation of deciduous fruit cultivars. Gene transfer technology wasdeveloped for deciduous fruit trees using Agrobacterium as a vector.
Gresshoff USA (7232/CF) - Arbitrary primer technology using DAF was optimized usingmini-hairpin primers, secondary amplification of DAF products (ASAP), 7M urea-10%PAGE, a 55°C annealing temperature, and maintenance of high primer (3 uM) and lowtemplate (1-2 ng/ 20 uL reaction volume) concentrations. Molecular markers were valuablefor anchoring yeast artificial chromosome (YAC) and bacterial artificial chromosome (BAC)clones on molecular linkage maps facilitating the next step of map-based cloning of genesinduced by mutagenesis.
3. RECOMMENDATIONS
Based on the experience from this CRP and current achievements in plant science, it isrecommended that there be a future focus on the application of molecular tools in solvingimportant problems related to vegetatively propagated crops in developing countries. In sharpcontrast to our ignorance about basic features of vegetatively propagated crops, most of themare nevertheless important staple foods, especially in developing countries. Moreover, thecenters of genetic diversity of most of these crops are located in the developing world. Basedon molecular techniques in the field of DNA markers and induced mutations, the commonlanguage which was established among all participants during this CRP and the highlyvaluable plant material existing in the developing countries, the following recommendationswere made:

3.1. General recommendations
• Research on vegetatively propagated crops should be continued, or even increased, inthe future.
• The loose network established in the present CRP has been effective and valuable, andshould be maintained and strengthened either through organizational (other grantingagencies, national programmes, institutional sources) and/or other means (e-mail, germplasm exchange, collaborative projects, exchange of personnel).
• Establishment of collaborative research groups centered on an individual crop should beencouraged. These teams should carry out collaborative and co-ordinated research inorder to address practical problems specific to each crop and thus contribute to itsimprovement. Molecular tools for increasing the efficiency of crop improvement shouldbe applied in crops which are agriculturally important to developing countries andwhich do not benefit from the investment of major scientific effort. Simultaneously, theapplication of these recommendations will also increase the efficiency of technologytransfer to developing countries.
• Molecular markers have proven their potential for identifying genetic variability invegetatively propagated crops. Use of this successful technology and its transfer shouldbe continued.
• The simplification and optimization of techniques should be a major aim for the future.Obvious examples include the substantial reduction of recommended reaction volumefor AFLP and the use of microsatellite capture or magnetic beads rather than colonyhybridization for STMS primer generation. These improvements should prepare thetransfer of the technologies to laboratories in developing countries.
• The multiplicity of DNA marker technologies should be maintained, and expanded ifrequired by a specific problem, as each technology [RAPD; RFLP; AFLP; DAF;sequence tagged microsatellite sites (STMS), RAMPO] has already provided usefulresults in a range of crops. Despite differences in cost, reliability, and need for priorsequence information, no single technique provides clear-cut experimental advantages.
3.2. Recommendations for crop selection and techniques for mapping
This CRP has prepared the ground for advanced research by developing and applyingtechniques for the characterization of genetic diversity, taxonomic and phylogeneticrelationship, cultivar identification, and in exceptional cases, the preparation of preliminarycore maps, in banana and Dioscorea tokoro, Tokoro yam. The techniques and markers can beused directly to continue research towards mapping and characterization of mutations andagronomically interesting traits in vegetatively propagated crops.
3.2.1. Crop selection criteria for future programmes
The following criteria should be used in selecting appropriate vegetatively propagatedcrops to be included in future collaborative programmes:
It must be a food crop.It should be a crop of developing countries.

• It should be under-researched in terms of induced mutations and/or moleculartechniques.
3.2.2. Suggested list of crops
These crop selection criteria are satisfied so far for the following: banana/plantain, yam,grapes, mango, pineapple, sago palm, strawberry, sugarcane, and sweet potato. Other cropsmay also be found which satisfy these criteria.
3.2.3. Plant material
Improvement of several agronomic traits is of particular relevance: disease and stresstolerance, quality and high yield. For agronomic improvement of such traits, access tosegregating populations is a pre-requisite. Such populations are already available for severalcrops, including banana, yam, sugarcane, mango and strawberry. For other species, however,such populations are either unavailable or at early stages of development. This demands thedevelopment of such segregating populations.
3.2.4. Molecular tools
The use of STMS primers is extremely simple and reproducible, in contrast to theirexpensive, time consuming, and comparably inefficient and laborious generation. Therefore,we propose a strong collaboration between advanced laboratories and institutions in thedeveloping countries; exchange of scientists, collaborative projects such as the generation ofSTMS primers in advanced laboratories, and use of STMS markers in developing laboratories.Due to the high multiplexing capacity, the AFLP technique allows the generation of manymore polymorphic, yet dominant, markers in an experiment than any other technique. Thefollowing recommendations can be made.
• The establishment of core maps for vegetatively propagated crops is stronglyrecommended. This should include both co-dominant and dominant marker systems,that are based on PCR, the STMS and AFLP techniques.
• STMS mapping should aim at establishing a core map (or even a landmark map) andAFLP can then generate markers to saturate the core map and/or to bridge gaps presentin established maps.
• The core map should contain about 100 STMSs or about 300 - 400 AFLPs for mostplant genomes. Again, cooperative projects are encouraged.
• Other marker types, including RFLP and RAPD, may still be exploited for this type ofresearch.

ISOLATION AND CHARACTERIZATION OF REPEAT ELEMENTSOF THE OAK GENOME AND THEIR APPLICATION INPOPULATION ANALYSIS
XA9848406S. FLUCH, K. BURGAustrian Research Centre,Seibersdorf, Austria
Abstract
Four minisatellite sequence elements have been identified and isolated from the genome of the oakspecies Quercus petraea and Quercus robur. Minisatellites 1 and 2 are putative members of repeatfamilies, while minisatellites 3 and 4 show repeat length variation among individuals of test populations.A 590 base pair (bp) long element has also been identified which reveals individual-specificautoradiographic patterns when used as probe in Southern hybridisations of genomic oak DNA.
1. INTRODUCTION
Forest ecosystems are valuable natural resources providing manifold economic,environmental and social functions. As threats to their genetic diversity endanger their stabilityand adaptability there is an urgent need to study genetic diversity of tree populations.Population genetic studies should provide answers to questions that are fundamental tounderstand forest ecosystems and to design programs for the conservation of geneticresources. Regardless of specific goals or applications, empirical population genetics requiresgenetic variation (polymorphism), thus providing "genetic markers". Population geneticistshave traditionally employed unusual phenotypes, proteins (mainly isoenzymes), or secondarycompounds as genetic markers. DNA markers in forest genetics have received only limitedattention, as compared to their extensive use in other organisms. Population genetic studiesusually involve the analysis of large numbers of individuals at many gene loci. Therefore, rapidand economic genetic screening methods are needed.
Several types of variable DNA loci in an organism can be detected with various tools,including: restriction fragment length polymorphisms (RFLP), randomly amplified polymorphicDNA (RAPD), microsatellites, DNA-fingerprinting and minisatellites. In this study we wereinterested in identifying minisatellite type repeat elements of the oak genome. By locating lociof this sort, a multi-allelic system can be built up which is useful both in population studies andin genetic mapping.
In our strategy we intended to isolate repetitive DNA sequence elements of the oakgenome {Quercus robur and Ouercus petraea) in order to search for minisatellite/DNA-fingerprint sequences among them.
2. MATERIALS AND METHODS
Leaf samples were collected from Austrian and Hungarian oak populations and the DNAisolated as described [1]. RAPD amplification of total oak DNA by Operon primers was madeaccording to the manufacturers recommendations. Molecular biological techniques wereessentially done as described by Sambrook et al.[2]. The computer analysis of the DNAsequence was made using the PC/Gene program of IntelliGenetics, PCR primer sequenceswere generated by the Oligo5 software of the National Biosciences Inc. and the gels wereanalysed by RFLPScan of Scanalytics.

3. RESULTS
3.1. Identification and isolation of minisatellite elements
We identified oak nuclear genome repetitive elements in two oak species, Quercus roburand Q. petraea, in two different ways: further analysis of RAPD fragments and screening smallinsert oak DNA libraries.
3.1.1. Identification of repetitive elements from RAPD fragments
We applied the suggestion that PCR fragments generated by the RAPD method mayhave a preference to be generated on repetitive DNA by nesting the primers in an appropriatespacing and orientation for yielding PCR fragment(s). This idea was also successful in isolatingmicrosatellite repeats of Daphnia [3]. Therefore RAPD fragments generated on isolated totaloak DNA were screened for yielding multiband hybridisation patterns by applying them asprobes in Southern hybridisations on total oak DNA. Two out of three fragments testedyielded the expected hybridisation pattern, one showing uniform multibanding, while the otherresulted in an individual specific hybridisation pattern containing more than 30autoradiographic bands ranging from 0.5 to 6 kb on HaeSi digested oak DNA. This latterfragment (OP-D7-2.3) was analysed in detail. It was possible to identify the part of thefragment responsible for the individual-specific banding pattern (fingerprint element), however,the sequence analysis of the fragment revealed the presence of three other repetitive elements(Minisatellite 1, 2 and 3)(Fig. 1).
RAPD fragment OP-D7-2,3Ml F
M3 M2 M2
FIG. 1. Locations of the minisatellite elements 1,2 and 3 (Ml, M2 and M3) and the fingerprintsequence (F) on the 2.3 kb long RAPD fragment generated by the D7 primer ofOperon Tech. Thearrows indicate the orientation of the repeat units.
3.1.1.1. Fingerprint element
An approximately 590 bp long part of the OP-D7-2.3 fragment has been identified whichstill yields the individual specific hybridisation pattern on Southern blots of HaeHL digestedtotal oak DNA, resulting in 20-25 hybridisation bands (Fig.2). Using either the first or secondhalf of this sequence as a probe in Southern hybridisations, the generated autoradiographicpattern remained identical (not shown) suggesting that this sequence may represent a longrepeat element of the genome, since within this 590 bp we could not identify any repeatedsequence elements.
3.1.1.2. Minisatellite 1
The minisatellite 1 sequence shows a tandem repeat motif of 112 bp, with 50 and 62 bprepeat units in it. Both of the repeats contain a 13 bp long sequence of 100% similaritycontaining an MnU. restriction site. Southern hybridising MnH digested oak DNA with therepeat motif as a probe yields a ladder type autoradiographic pattern with an estimated repeatlength of approximately 100 bp, suggesting that the sequence may represent a repeat family

(Fig. 3 A). In some individuals additional bands appeared on the autoradiogram indicatinglength variability of the repeat unit (Fig 3 A, sample 3). PCR amplification of the region byflanking primers shows a low level of length polymorphism, 10% of the individuals alsocontain a PCR fragment approximately 60 bp shorter, possibly indicating the presence of asingle repeat element in that particular fragment.
1 2 3 4 5 6
kb5.1
3.5
2.0
0.8
FIG. 2. Autoradiographic pattern generated by the 590 bp long fingerprint element on Haellldigested total oak DNA of six individuals.A 1 2 3 B 1 2 3
kb
0,22
FIG. 3. Autoradiographic profiles generated by the minisatellite sequences 1 (A) and 2 (B) used ashybridisation probes. A) Oak total DNA was digested by Mnll restriction endonuclease and thefragments separated ona 1% agarose gel. B) Oak total DNA digested by Haelll and separated on 1%agarose.

3.1.1.3. Minisatellite 2
Single representatives of this repeat can be found approximately 300 bp apart flankingthe minisatellite 1. The repeated sequence is about 84 bp long with an identity of 19% whilethe putative "core" is approximately 43 bp long with 92% similarity. In this sequence we couldnot detect any common enzyme site(s), however, on Haelll digested genomic blots a similarladder type hybridisation pattern was observed as with the minisatellitel with a repeat length ofapproximately 150 bp (Fig. 4).
3.1.1.4. Minisatellite 3
The sequence shows a tandem repeat motif of 74 bp with a nearly perfect identity (97%)of the 37 bp long individual repeats. PCR amplification of the region by flanking primers has sofar yielded four different fragments. The length of the generated fragments differ always withthe approximate size of the individual repeat unit. Analysis of 64 individuals revealed that theallele containing two repeat elements is predominant (80%), while alleles with a single elementshare 12%, with three elements 5% and with possibly seven repeat elements 3% respectively.
3.1.2. Identification of repetitive elements from small fragment DNA libraries
By screening oak small fragment DNA libraries for the presence of microsatellitesequences we could identify a 1 kb long clone in which a microsatellite, as well as aminisatellite sequence, could be found close together. The microsatellite region (pOAG17)contains eleven units of an AG repeat which is separated from the minisatellite region byapproximately 100 bp. The minisatellite region (Minisatellite 4) contains three tandemlyarranged 65, 79 and 38 bp long repeats. PCR amplification of this region showed moderatevariability, yielding seven different length variant alleles (Table 1).
The region was amplified with PCR primers flanking the combined microsatellite-minisatellite region.
The PCR primers used for the amplification of the minisatellite sequence were locatedoutside of the microsatellite-minisatellite combined region, because primers nested between thetwo regions in order to amplify exclusively the minisatellite locus in several individuals yieldedno PCR product, suggesting the possible instability of the genome at that location.
TABLE I. ALLELE DISTRIBUTION OF THE MINISATELLITE 4 SEQUENCE IN A TESTPOPULATION OF 39 INDIVIDUALS
Allele size(in bp)
620470450392335320140
Number of alleles
18260313
Fraction of total alleles%
0.0130.1030.0260.7690.0380.0130.038
10
4. DISCUSSION
Using RAPD fragments as well as a fragment containing a microsatellite element as asource we could identify four different minisatellite DNA sequence elements of the oak speciesQuercus robur and Quercus petraea. The size of these repeat elements ranges from 37 bp to70 bp as far as the putative core sequences are concerned. When used as probes in Southernhybridisations, two of the minisatellites (1 and 2) yield a ladder type autoradiographic pattern,suggesting that they may represent a repeat family.
Furthermore, a 590 bp long sequence element has also been identified which if used as ahybridisation probe yields an individual-specific autoradiographic pattern.
Both the RAPD and the DNA library fragments contain more than one repeat element inrelative close proximity. The RAPD fragment contains three different minisatellite (1, 2 and 3)and the fingerprint elements within a 2.3 kb region, while the library fragment contains amicrosatellite sequence near the minisatellite sequence (Minisatellite 4).
Minisatellite regions 3 and 4 show a low level of length variability when PCR amplifiedby flanking primers.
ACKNOWLEDGEMENTS
This work was supported by the research grant P10800-MOB of the FWF(Austrian Research Foundation).
REFERENCES
[1] BURG, K., ZECHMEISTER-MACHART, M., GLOSSL, J, SCHMIDT, J. Oakchloroplast-DNA polymorphisms detected by restriction fragment length polymorphism(RFLP) Annales des Sciences Forestieres 50 (1993) Suppl. 1, 66s-69s.
[2] SAMBROOK, J., FRITSCH, E.F., MANIATIS, T. Molecular Cloning: A LaboratoryManual, Second edition. Cold Spring Harbor Laboratory Press (1989).
[3] ENDER, A., SCHWENK, K., STADLER, T., STREIT, B., SCHIERWATER, B."RAPD identification of microsatellites in Daphnia", Molecular Ecology 5 (1996) 437-441.
11
USE OF ARBITRARY DNA PRIMERS, POLYACRYLAMIDEGEL ELECTROPHORESIS AND SILVER STAINING FORIDENTITY TESTING, GENE DISCOVERY AND ANALYSISOF GENE EXPRESSION
P. GRESSHOFF XA9848407Plant Molecular Genetics and Center for Legume Research,Institute of Agriculture,University of Tennessee,Tennessee, USA
Abstract
To understand chemically-induced genomic differences in soybean mutants differing in theirability to enter the nitrogen-fixing symbiosis involving Bradyrhizobium japonicum, moleculartechniques were developed to aid the map-based, or positional, cloning [1]. DNA marker technologyinvolving single arbitrary primers was used to enrich regional RFLP linkage data. Molecular techniques,including two-dimensional pulse field gel electrophoresis, were developed to ascertain the first physicalmapping in soybean, leading to the conclusion that in the region of marker pA-36 on linkage group H, 1cM equals about 500 cM [2]. High molecular weight DNA was isolated and cloned into yeast orbacterial artificial chromosomes (YACs/ BACs). YACs were used to analyze soybean genomestructure, revealing that over half of the genome contains repetitive DNA. Genetic and molecular toolsare now available to facilitate the isolation of plant genes directly involved in symbiosis. The furthercharacterization of these genes, along with the determination of the mechanisms that lead to themutation, will be of value to other plants and induced mutation research.
1. INTRODUCTION
The precise recognition of molecular differences between organisms of different traits isthought to permit the eventual understanding of underlying structure-function relationships.This has become a major paradigm of the various "genome projects", but may requireadditional information about protein folding and function.
To understand the complexity of eukaryotic genomes, molecular genetic analysis iscoupled with classical genetics. Molecular marker technology has permitted the construction ofrecombination as well as physical maps. The eventual goal is to have available the entiregenome sequence for several major plants and animals, permitting functional comparisons anddetermination of fundamental rules governing gene expression, genome plasticity, andevolution.
To isolate genes defined by mutant phenotypes has become a challenge. In someorganisms such as the crucifer Arabidopsis thaliana [3] or the cereal crop Zea mays,insertional mutagenesis has facilitated this process [4]. In most plants, this is not feasiblebecause of low transformation frequencies. Accordingly, other approaches of gene discoveryneeded to be developed [5]. In some cases, complementation in Escherichia coli or yeastmutants is an alternative; this requires the functional sharing of biochemical steps, as frequentlyfound in metabolic pathways. However, the approach is not available, when the analysis of adevelopmental pathway such as nodulation or flowering is required. In those cases, genediscovery can be achieved through a strategy called positional or map-based cloning [6]. Theessence of the approach is to utilize the co-segregation of a molecular marker and the causative
13
gene for a known phenotype (as defined by mutation) to isolate the relevant genomic region
Map-based cloning for gene discovery involves (i) detection of genetic differences [8],(ii) determination of the mode of inheritance, (iii) association of a molecular marker with thesegregating phenotype [9], (iv) determination of marker order in the relevant genomic region,(v) isolation of anchored high molecular weight clones carrying either one or two of the closelyflanking molecular markers in either yeast or bacterial artificial chromosomes (YACs andBACs; [10,11,12]), (vi) detection of candidate gene sequences on the isolated YAC/BAC, andfinally (vii) verification of the candidate gene sequences through functional complementationusing gene transfer technology [13].
2. RESULTS
2.1. Generation of genetic diversity
Genetics is based on the comparison of heritable differences. At times these exist in apopulation, especially when it is in its natural state. However, many crop plants have beenselected for a long time and genetic bottlenecks have restricted variation. Likewise, naturalrelatives are too distinct to be valuable in a breeding programme, or carry alterations that arebased on multigenic traits, which are difficult to dissect genetically.
In such cases, as with soybean (Gfycine max L. Merrill) and genetic variation fornodulation and nitrogen fixation, induced mutagenesis is a way to generate genetic variation.Both physical and chemical mutagenesis of soybean were used to produce nodulation mutants.Irradiation by gamma-rays was found to be less effective than ethyl methanesulphonate (EMS)mutation [8,14]. Using EMS with soybean cultivar Bragg, several symbiotic mutants wereisolated [1,13,15]. All are single Mendelian recessives. Three major classes were isolated: non-nodulation (equivalent to 'resistance to Bradyrhizobium'), supernodulation (absence ofautoregulation of nodulation leading to nitrate-tolerant nodulation; nts) and absence of nitratereductase (for review see [1]). For these mutants there is no information concerning the natureof the mutation. Reversions have not been observed. Non-nodulation and supernodulationmutants nod49, nodl39 and nts382 are non-allelic and segregate independently [16]. We areattempting to clone each locus by positional cloning.
2.2. Detection of molecular diversity: use of molecular markers
As a first step in this direction, RFLPs were useful but limited and costly. However, theywere mostly co-dominant and robust. The 1990s brought amplification technology eitherdriven by specific or arbitrary primers. The techniques include randomly amplified polymorphicDNA (RAPD), arbitrarily primed PCR (AP-PCR), DNA amplification fingerprinting (DAF),amplified fragment length polymorphism (AFLP), selective amplification of microsatellitepolymorphic loci (SAMPL), cleaved amplified polymorphic sites (CAPS), randomly amplifiedmicrosatellite polymorphism (RAMPO) and simple sequence repeats (SSR).
We developed and optimized the DAF technology, based on single short arbitraryprimers (see [17]; US patent No. 5,413,909). The procedure was improved through the use ofminihairpin primers that gave rich amplification profiles for a wide range of species (turfgrass,soybean, pea, several forest trees and others). Such primers contain a mini-hairpin of 4nucleotides, flanked by a double and opposed G.C stem [18]. The 3' end of the hairpin isextended through the use of three selective nucleotides [19,20]. Each mini-hairpin is thus
14

available as a 64 primer set. We have found that primers with different hairpin sequences, butidentical 3 nucleotide extensions on their 3' end give different amplification markers [21,22].The amplification products are routineLY separated on polyacrylamide gels (thin, 10%,denaturing with 7M urea) and stained with silver (as commercialized through Promega Inc. intheir Silver Sequence kit, and Pharmacia in their Plus One kit). All kits are based on a patentedprocedure (see [19]; US patent Nos. 5,567,585 and 5,492,810).
Molecular approaches were used to determine further details about genome structure insoybean. For example, we discovered a 92 base pair (bp) satellite DNA that exists in about100,000 copies clustered in four centromeric regions [5]. Likewise, we used soybean YACs toamplify their insert DNA with degenerate PCR primers and fluorescent label to detect soybeanmetaphase chromosomes with different distributions of repeated DNA sequences [10].
2.3. DAF improvements
It was recognized that different thermocyclers, characterized by different rampingregimes, give different amplification profiles. However, when we programmed a MJ Researchthermocycler to have the same ramping regime as we used in an Ericomp Twinblockthermocycler, the same profile was obtained.
The ability of DAF to detect molecular differences was increased through mini-hairpinprimers [19] and ASAP, in which DAF products from a first reaction were reamplified witharbitrary primer or primers representing a potential micro satellite sequence [20].
We found that increasing the annealing temperature to 55°C gave strong amplificationprofiles (30 s. at 96°C, 60 s. at 55°C, then 72°C for 30 s., for 35 cycle (Ghassemi andGresshoff, in preparation). We use Stoffel enzyme (Perkin-Elmer) at 4 units per 20 uL (or 2units per 10 uL to save enzyme); primer concentration is usually 3 uM. Primer quality wasdetermined by running 20% polyacrylamide gel electrophoresis (PAGE) gels and silverstaining. Separation of normal DAF products is by 10% PAGE. Such gels are backed byGelBond from FMC and are air-dried to permit permanent storage. DNA bands can be excisedwith the polyacrylamide and silver, still producing good reamplification [23]. Reamplificationmay lead to multiple products, some smaller, some larger than expected. We clone and thenselect a large number of transformants and select the clone with the expected amplificationproduct. At times, multiple products may be cloned, leading to a paradox relating to properfragment assignment. We regularly then test the clone for hybridization to a DAF-blot as wellas a genomic blot. Frequently, a DAF polymorphism is no longer polymorphic on a DAF-blot,suggesting that the difference stems from quantitative differences. It is worthwhile to clone the"null" area as a control allowing, if necessary, the detection of comigrating bands and theiramplification products. The critical feature of a DAF marker is to be able to detect the PCRdifference on a DAF gel by Southern hybridization [24].
High concentration PAGE gels have the problem of drying out. We have available an"anti-cracking solution", combining glycerol, ethanol and water. We have alternative methodsfor semi-automated gel separation, most attractive is capillary electrophoresis [25]. This stillrequires gel separation but it is at high resolution and semi-automatic. We used the Phast-System and find it operationally difficult [26].
15

2.4. Some applications of DAF technology
2.4.1. Turfgrass
We are actively involved in commercial turfgrass DNA analysis [25,27]. This involvesmainly bermudagrass, that is propagated as triploid clones. Several clones are used for differentapplications; genetic diversity occurs for unknown reasons. We have used DAF to sort outthese differences, and concluded for one genotype (Tifway 419) that contamination is themajor cause of genetic instability. DAF data were accepted in a court decision of Boca DelMar Country Club vs. Aetna Insurance (December 1996).
2.4.2. Soybean
We have used DAF in two applications. The first involved a blind comparison of tensoybean genotypes to establish the relatedness [28]. We matched the pedigree as well as thedendrogram established by 53 RFLP clones. This is due to the greater multiplex power ofDAF.
DAF was used in bulked segregant analysis (BSA) for markers close to thesupernodulation (nts-J) gene [29]. A window of homozygosity was created using the RFLPhaplotype of the region. A linked marker was found and converted into a sequencecharacterized amplified region (SCAR). BSA was used with DAF to look for additionalmarkers next to enod2, which maps close to the "/" locus on linkage group 1 (Ghassemi andGresshoff, in preparation). Homozygotes for enod2 were selected and pooled to give alocalized richness of markers. The enod2 gene was identified as enod2b, because the 5' regioncontained a micro satellite that was mapped using specific primers to the same position as theRFLP. Other nodulin genes failed to map in the same region, suggesting that in soybean, genesinvolved in a common developmental process are not clustered.
2.4.3. Pea
As in soybean, BSA was coupled with DAF and found two markers close to the sym31locus governing non-nitrogen fixation in pea. One marker was placed about 3.7 cM, the other16 cM, from sym31 (Men and Gresshoff, unpublished data).
2.4.4. Aphids
In collaboration with Dr. Chuck Niblett (Florida) and Farshid Ghassemi (University ofTennessee), we used DAF to analyze aphids that spread a major citrus virus from SouthAmerica. Individual aphids were profiled. The population analysis suggested that of 3 Brazilianpopulations (which are distinct), one became mobile and infected Costa Rica, then Cuba, andnow southern Florida. Major crop damage is expected as there is no known resistance.
2.4.5. Forest trees
As part of a forensic test, we profiled dried leaf DNA from tulip poplar, white oak andbeech. DNA profiles were compared to fresh leaf samples taken in the vicinity of the putativecrime scene.
16

2.4.6. YAC and BACs
We have constructed BACs and YACs for two legumes, and have demonstrated theirutility. For example, three putative YACs and two BACs homologous to pUTG-132a, closelylinked to the supernodulation gene of soybean (0.7±0.5 cM) were obtained. We are planning toconstruct a contig in this chromosomal region and will use endclones as well as DAF markersgenerated from the YAC/BAC candidates [24]. YACs were also used together with degenerateprimer PCR to obtain high intensity FISH images allowing the determination of chimerism inYACs as well as painting chromosomes with either anchored or random YACs. YACs withhigh hybridization strength value (HSV) to total soybean DNA were found to contain repeatedDNA, while low HSV YACs gave single target spots [10].
2.4.7. Lotus japonicus
We are developing this plant with short life span and high transformation andregeneration potential as a model legume [21,30]. YACs and BACs have been constructed[12]; transformation is possible in four to six months using two Agrobacterium strategies;reporter genes have been expressed as well as some developmentally sensitive cDNA andpromoter regions. We have established the classical and molecular genetics of the plant [21],and constructed a skeletal map based on DAF markers and NEP (naked eye polymorphisms =morphological traits). DAF markers were predominantly dominant, but were detected at highfrequencies between genotypes 'Gifu' and 'Funakura', the parents for the F2 and F6 RILpopulation (available for sharing). Some markers were inherited in an apparently uniparentalfashion, confirming data of Prabhu and GresshofF [31]. Alternatively, the marker may berepeated, giving skewed segregation.
3. DISCUSSION
Although we see different marker systems available, we feel that DAF fulfills manyrequirements for DNA profiling. The increased annealing temperature has even furtherincreased the robustness of the technique. While AFLPs are deemed very useful, we areconcerned about clustering of markers when using EcoKL andMsel. Perhaps the use of PstI orifwdlll as the rare cutter can correct this problem. In a detailed study using 2 genotypes andreplicate restriction /amplification, we found that AFLP still produced an average of 9.1 %irreproducible bands. AFLP (a term actually first coined by my laboratory, but used byKeyGene Inc for an alternative procedure; see [17]) may be convenient for large scale DNAidentity testing, but may be limited for map-based cloning and marker-assisted selection.
Recently we utilized our experience with DAF to look at differential display productsfrom soybean [32]. We propose the use of high annealing temperature as well, along with highprimer concentration (3 yM).
The use of arbitrary primer technology has enriched our tool kit to investigate the natureof genomes. More is to come with the advent of oligonucleotide arrays producedlithographically on silicon wafers (genosensors). Perhaps large scale automation with low costthrough-put will then be possible for application in agricultural and medical screening.
17

REFERENCES
[I] GRESSHOFF, P.M. Molecular genetic analysis of nodulation genes in soybean, PlantBreeding Reviews 11 (1993) 275-318.
[2] FUNKE, R.P., KOLCHINSKY, A. and GRESSHOFF, P.M. Physical mapping of aregion in the soybean (Glycine max) genome containing duplicated sequences, PlantMol. Biol. 22 (1993) 437-446.
[3] FELDMANN, A.K. T-DNA insertion mutagenesis in Arabidopsis: mutational spectrum,Plant! 1(1991)71-82.
[4] BAKER, B., SCHELL, I , LORZ, H. and FEDEROFF, N. Transposition of the maizecontrolling element "Activator" in tobacco, Proc. Nat. Acad. Sci. USA 83 (1986) 4844-4848.
[5] KOLCHINSKY, A.M. and GRESSHOFF, P.M. A major satellite DNA of soybean is 92base pairs tandem repeat, Theor. Applied Genetics 90 (1995) 621-626.
[6] WICKING, C. and WILLIAMSON, B. From linked marker to gene, Trends in Genetics7 (1991) 288-290.
[7] BENT, A.F., KUNKEL, B.N., DAHLBECK, D. BROWN, K.L., SCHMIDT, R.,GIRAUDAT, J., LEUNG, J., and STASKAWICZ, B.J. RPS2 of Arabidopsis thaliana:A leucine-rich repeat class of plant disease resistance genes, Science 265 (1994) 1856-1860.
[8] CARROLL, B.J., MCNEIL, D.L. and GRESSHOFF, P.M. Mutagenesis of soybean(Glycine max (L.) Merr.) and the isolation of non-nodulating mutants, Plant Sci. 47(1986)109-114.
[9] LANDAU-ELLIS, D., ANGERMULLER, S.A., SHOEMAKER, R.C., andGRESSHOFF, P.M. The genetic locus controlling supernodulation co-segregates tightlywith a cloned molecular marker, Mol. Gen. Genetics 228 (1991) 221-226.
[10] ZHU, T., SHI, L., FUNKE, R.P., GRESSHOFF, P.M. and KEM, P. Characterizationand application of soybean YACs to molecular cytogenetics, Mol. Gen. Genetics 252(1996) 483-488.
[II] WOO, S.S., RASTOGI, V.K., ZHANG, H.-B., PATERSON, AH., SCHERTZ, K.F.,and WING, R. A. Isolation of megabase-size DNA from sorghum and applications forphysical mapping and bacterial and yeast artificial chromosome library construction,Plant Molecular Biology Reporter 13 (1995) 82-94.
[12] PILLAI, S., FUNKE, R.P., and GRESSHOFF, P.M. Yeast and bacterial artificialchromosomes (YAC and BAC) clones of the model legume Lotus japonicus, Symbiosis21 (1996) 149-164.
[13] GRESSHOFF, P.M. "The interface between RFLP techniques, DNA amplification andplant breeding", New Diagnostics in Crop Sciences, (SKERRITT, J.H. and APPELS, R.Eds.). CAB International, England (1995) 101-125.
[14] CARROLL, BJ. and GRESSHOFF, P.M. Isolation and initial characterisation ofsoybean mutants with an altered constitutive nitrate reductase mutants NR328 andNR345 of soybean {Glycine max), Plant Physiol. 81 (1986) 572-576.
[15] CARROLL, B.J., MCNEIL, D.L. and GRESSHOFF, P.M. Isolation and properties ofsoybean mutants which nodulate in the presence of high nitrate concentrations, Proc.Nat Acad. Sci. USA 82 (1985) 4162-4166.
[16] MATHEWS, A., CARROLL, B.J. and GRESSHOFF, P.M. The genetic interactionbetween non-nodulation and supernodulation in soybean: an example of developmentalepistasis, Theor. Appl. Genet. 79 (1990) 125-130.
[17] CAETANO-ANOLLES, G., BASSAM, B.J. and GRESSHOFF, P.M. DNAamplification fingerprinting using very short arbitrary oligonucleotide primers, BioTechnology 9 (1991) 553-557.
18

[18] CAETANO-ANOLLES, G. and GRESSHOFF, P.M. Staining nucleic acids with silver:an alternative to radioisotopic and fluorescent labeling, Promega Notes 45 (1994a) 13-18.
[19] CAETANO-ANOLLES, G. and GRESSHOFF, P. M. DNA amplification fingerprintingusing arbitrary mini-hairpin oligonucleotide primers, Bio Technology 12 (1994b) 619-623.
[20] CAETANO-ANOLLES, G. and GRESSHOFF, P.M. Generation of sequence signaturesfrom DNA amplification fingerprints with mini-hairpin and microsatellite primers, BioTechniques 20 (1996) 1044-1056.
[21] JIANG, Q. and GRESSHOFF, P.M. Classical and molecular genetics of the modellegume Lotus japonicus, Mol. Plant-Microbe Interact. 10 (1997) 59-68.
[22] YAZDI-SAMADI, B., QIAN, D , GHASSEMI, F., ALLEN, F., and GRESSHOFF,P.M. Soybean cyst nematode resistance: genetics, biology and molecular biology,Physiology and Molecular Biology of Plants 2 (1996) 25-48.
[23] WEAVER, K., CAETANO-ANOLLES, G, GRESSHOFF, P.M. and CALLAHAN,L.M. Isolation and cloning of DNA amplification products from silver stainedpolyacrylamide gels, Bio Techniques 16 (1994) 226-227.
[24] KOLCHINSKY, A.M., FUNKE, R.P. and GRESSHOFF, P.M. DAF-amplifiedfragments can be used as markers for DNA from pulse field gels, Bio Techniques 14(1993)400-403.
[25] CAETANO-ANOLLES, G, CALLAHAN, L.M, WILLIAMS, P.E., WEAVER, K. andGRESSHOFF, P.M. DNA amplification fingerprinting analysis of bermudagrass(Cynodon): genetic relationships between species and interspecific crosses, Theor. Appl.Genetics 91(1995)228-235.
[26] BAUM, T.J., GRESSHOFF, P.M., LEWIS, S.A. and DEAN, R.A. Characterization andphylogenetic analysis of four root-knot nematode species using DNA amplificationfingerprinting and automated polyacrylamide gel electrophoresis, Mol. Plant-MicrobeInteract. 7 (1994) 39-47.
[27] CAETANO-ANOLLES, G., CALLAHAN, L.M. and GRESSHOFF, P.M. Inferring theorigin of bermudagrass (Cynodori) off-types by DNA amplification fingerprinting inphyto-forensic applications, Crop Science 37 (1997) 81-87.
[28] PRABHU, R.R., JESSEN, H., WEBB, D. LUK, S., SMITH, S. and GRESSHOFF, P.M.Genetic relatedness among soybean (Glycine max L.) lines revealed by DNAAmplification fingerprinting, RFLP and pedigree data, Crop Science 37 (1997) 1590-5.
[29] KOLCHINSKY, A.M., LANDAU-ELLIS, D. and GRESSHOFF, P.M. Map order andlinkage distances of molecular markers close to the supernodulation (nts-J) locus ofsoybean, Mol. Gen. Genet. 254 (1997) 29-36.
[30] STILLER, I , MARTIRANI, L., TUPPALE, S., CHIAN, R.-J., CFflURAZZI, M. andGRESSHOFF, P.M. High frequency transformation and regeneration of transgenic plantsin the model legume Lotus japonicus, J. exp. Bot. 48 (1997) 1357-1365.
[31] PRABHU, R.R. and GRESSHOFF, P.M. Inheritance of polymorphic markers generatedby short single oligonucleotides using DNA amplification fingerprinting in soybean, PlantMol. Biol. 26(1994)105-116.
[32] GRESSHOFF, P.M., SENOO, K., PADILLA, J., LANDAU-ELLIS, D., FILATOV, A.,KOLCHINSKY, A.M. and CAETANO-ANOLLES, G. "Molecular and genetic insightsinto shoot control of nodulation in soybean", Biological Nitrogen Fixation for Ecologyand Sustainable Agriculture, (LEGOCKI, A., Ed.) Springer Verlag, (1997) 271-274.
f^EXT PAGS(S)
19

COMBINED AMPLIFICATION AND HYBRIDIZATION TECHNIQUESFOR GENOME SCANNING IN VEGETATIVELY PROPAGATED CROPS
G. KAHL, J. RAMSER, R. TERAUCHI*Biocentre, University of Frankfurt,Frankfurt am Main, Germany XA9848408
C. LOPEZ-PERALTAIRGP, Colegio de Postgraduados,Montecillo, Edo. de Mexico,Texcoco, Mexico
H.N. ASEMOTABiotechnology Centre,University of the West Indies,Mona, Kingston, Jamaica
K. WEISINGSchool of Biological Sciences,University of Auckland,Auckland, New Zealand
Abstract
A combination of PCR- and hybridization-based genome scanning techniques and sequencecomparisons between non-coding chloroplast DNA flanking tRNA genes has been employed to screenDioscorea species for intra- and interspecific genetic diversity. This methodology detected extensivepolymorphisms within Dioscorea bulbifera L., and revealed taxonomic and phylogenetic relationshipsamong cultivated Guinea yams varieties and their potential wild progenitors. Finally, screening of yamgermplasm grown in Jamaica permitted reliable discrimination between all major cultivars. Genomescanning by microsatellite-primed PCR (MP-PCR) and random amplified polymorphic DNA (RAPD)analysis in combination with the novel random amplified microsatellite polymorphisms (RAMPO)hybridization technique has shown high potential for the genetic analysis of yams, and holds promise forother vegetatively propagated orphan crops.
1. INTRODUCTION
The design of a series of molecular techniques and the development of molecularmarkers during the past decade catalyzed plant genome research dramatically. Even largegenomes can now be scanned rapidly and reproducibly without any sequence information orcloning steps, and this process generates genomic or DNA fingerprints of varying complexity.One of the main goals in genomic fingerprinting was to reduce the enormous complexity of theoriginal genome into simple patterns, that would allow visualization of sequence differencesbetween two or more genomes. Such differences originate from mutations, such as transitions,transversions, inversions, insertions, deletions, or generally small- or large-scale DNArearrangements, that occurred in one, but not the other genome, and may be detected by eitheramplification or hybridization techniques. DNA amplification exploits the polymerase chainreaction (PCR), a technique that allows multiplication of a target sequence exponentially, withthe help of short, flanking oligodeoxynucleotide primers. DNA hybridization in turn is based on
Present address: Kyoto University, Kyoto, Japan.
21

the sequence-specific Watson-Crick interactions between two single-stranded DNAs, thetarget and the probe. In each case, a "fingerprint" is produced, a multi-band pattern detectedby either ethidium bromide staining of the electrophoretically separated amplification productsor autoradiography of hybrids between a radioactively labelled probe and its target sequence.
Both technologies have been applied extensively to diverse problems in plant biology,such as the reliable identification of individuals, clones, breeding lines, cultivars, hybrids,parents and progenies, the estimation of intra- and interspecific relatedness and diversity, theanalysis of phylogenetic relationships, the demonstration of gene flow in populations, thegenetic and physical mapping of agronomically important traits, their marker-assisted selection,and the isolation of candidate genes by map-based cloning (for a review, see Winter and Kahl[1]). The repertoire of fingerprinting techniques also extends into screening of expressed genes(RNA fingerprinting, differential display [2,3,4]).
The amplification fingerprint techniques fall into two broad categories. While randomamplified polymorphic DNA (RAPD) analysis [5], arbitrary-primed PCR (AP-PCR) [6], DNAamplification fingerprinting (DAF) [7] and related methods employ primers of arbitrarysequence to amplify anonymous regions of the template DNA, another class of techniquestargets repetitive DNA: microsatellite-primed PCR, (MP-PCR) [8]; anchored microsatellite-primed PCR, (AMP-PCR) [9]. Both classes of techniques as well as various modifications andcombinations thereof, such as random amplified microsatellite polymorphisms (RAMPO) [10],are now globally used, primarily because they are relatively cheap, do not require any priorDNA sequence information, are easy to handle, and fast. They meet, however, with severalproblems, one of them being the sensitivity to amplification parameters. For example, RAPDpatterns can usually be reproduced by one and the same experimentor only, and are thereforenot robust. Also, the homology of comigrating amplification bands is obscure, unless tested byhybridization. In spite of these and other drawbacks, the amplification fingerprint techniquesfound wide acceptance as opposed to hybridization-based fingerprinting ("DNAfingerprinting"). The latter method is a derivative of RFLP analysis [13]: completely restrictedgenomic DNA is electrophoresed in agarose, the restriction fragments either transferred to amembrane or, alternatively, the gel dried, and the blot or dried gel hybridized to(non)radioactively labelled, mini- or microsatellite-complementary probes. The hybridmolecules between probe and target are detected by chemiluminescence or autoradiographyThis so-called oligonucleotide fingerprinting technique, though experimentally demanding,time-consuming and expensive, is extremely reliable, reproducible and robust, and allowsdetection of polymorphisms in an otherwise monotonous genetic background [11,12].Oligonucleotide or microsatellite fingerprinting was successfully applied to various problems inplant taxonomy, phylogeny, breeding and protection of breeder's rights (e.g., identification ofcultivars or clones [13]).
Recently, we developed a technique that combines amplification and hybridizationprocedures for genome scanning. This novel strategy was derived from the idea that anyRAPD or MP-PCR reaction would generate thousands of different amplification products ofvarying abundance. Only a few (i.e. between 1 and 20) such products can be visualized byethidium bromide staining, whereas most of them remain below detection level. However,these low-abundance amplicons, invisible after ethidium bromide staining of agarose gels, canbe detected if they carry microsatellites (stretches of mono-, di-, tri- or tetranucleotide tandemrepeats such as [A]n, [TA]n, [AAT]n, or [GATA]n). And since microsatellites are ubiquitouscomponents of all eukaryotic genomes, detection of these second-level DNA markers ispossible with (non) radioactively labelled microsatellite motifs, hybridization and lumino- or
22

autoradiography. We have named this novel technique RAMPO (Random AmplifiedMicrosatellite Polymorphism Detection [14]).
The potential of a combined arbitrary primer technology and microsatellite hybridizationdetection approach is here exemplified with the mainly (sub) tropical genus Dioscorea, ofwhich the edible species ("yams") possess substantial cultural, social and economic importancein West Africa, the Caribbean, the Indian Subcontinent, Southeast Asia and Polynesia, and aretypically vegetatively propagated crops.
2. MATERIALS, METHODS AND PROBLEMS
2.1. Materials
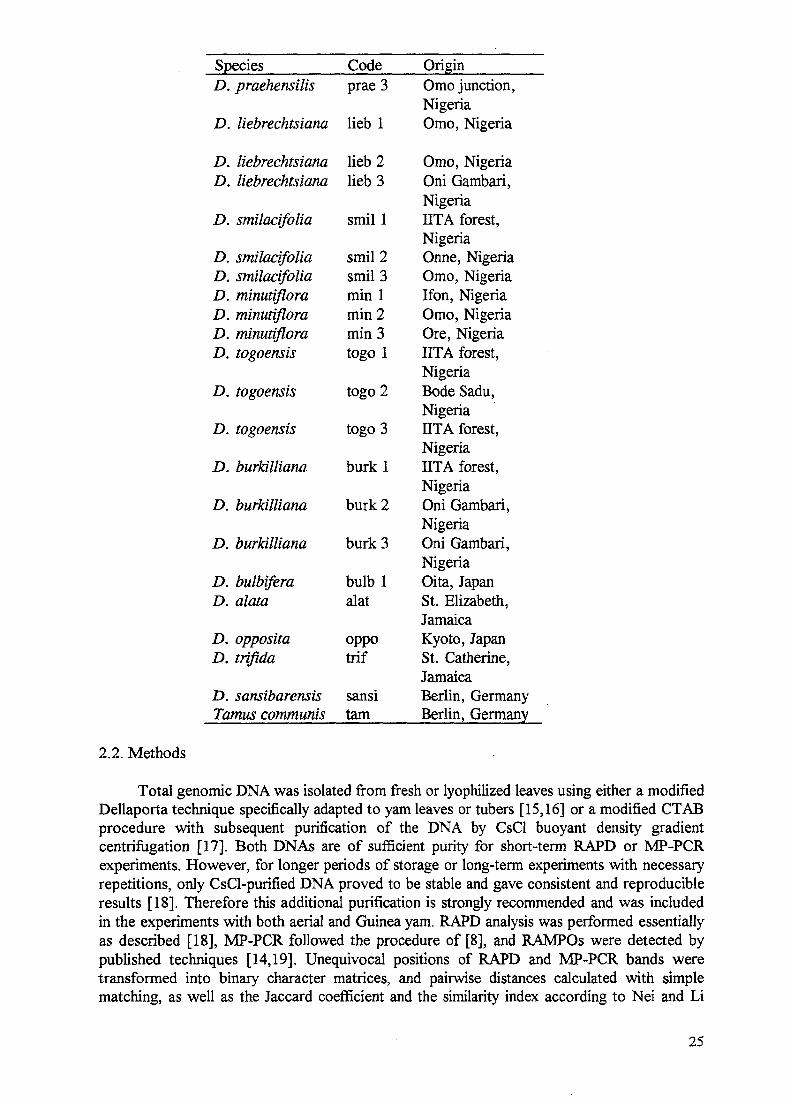
The plant material belongs to three classes. First, 23 accessions of aerial yam (Dioscoreabulbifera), originating from different geographical regions were probed for intraspecificdiversity and relatedness (Table I). Second, 21 accessions of cultivated Guinea yam (D.rotundata and D. cayenensis) were analyzed together with 21 accessions belonging to seven oftheir potential progenitor species in order to re-examine Guinea yam taxonomy and phytogeny(Table II). Third, eleven cultivars belonging to five different yam species grown in Jamaicawere used to establish a cultivar identification system for Jamaican yam germplasm (Table III).
TABLE I. DIOSCOREA BULBIFERA COLLECTION
Accession
DB1
DB3
DB9303
DB9304
DB9307
DB5
DB6
DB7
DB8
DB9
DB10
DB12
DB13
DB16
DB18
DB235
DB247
DB267
Variety
anthropophagorwn (cultivated)
anthropophagorum (cultivated)
anthropophagorum (cultivated)
alveolata (wild)
anthropophagorum (cultivated)
suavior (cultivated)
elongata (wild)
sativa (cultivated)
sativa (cultivated)
sativa (wild)
heterophylla (wild)
suavior (cultivated)
vera (wild)
heterophylla (wild)
heterophylla (wild)
vera (wild)
vera (wild)
vera (wild)
Origin
Antananarivo; Madagascar
Lushoto; Tanzania
Majan I; Ethiopia
Majan II; Ethiopia
Majan III; Ethiopia
Townsville (Qld.); Australia
Nambayufa; Papua New Guinea
Tonga Island
Oahu Island; Hawaii
Hawaii Island; Hawaii
Sandimen; Taiwan
Wushe; Taiwan
Lanyu Island; Taiwan
Cheng Mai; Thailand
Cheng Sen; Thailand
Aki, Oita; Japan
Tosa Ichino, Kochi; Japan
Nakahanda, Oita; Japan
23

Accession Variety Origin
DBNC1BotI
Botll
Bot III
D. burMlliana
unknown (wild)unknown
unknown
unknown
(wild)
Mamie; New CaledoniaBot. Garden Karlsruhe; Germany
Bot. Garden Darmstadt;GermanyBot. Garden Giessen; Germany
Oni Gambari; Nigeria
TABLE II. GUINEA YAMS COMPLEX AND WILD RELATIVES
Species Code OriginD. rotundataD. rotundataD. rotundata
D. rotundataD. rotundataD. rotundataD. rotundataD. rotundataD. rotundataD. rotundataD. rotundata
D. rotundataD. rot. ID. cay.
D. rot. ID. cay.D. cayenensisD. cayenensisD. cayenensisD. cayenensisD. cayenensis
D. cayenensis
D. cayenensis
D. abyssinica
D. abyssinicaD. abyssinicaD. praehensilis
rotlrot 2rot 3
rot 4rot 5rot 6rot 7rot 8rot 9rot 10rot 11
rot 12rot/cay 1
rot/cay 2cay 1cay 2cay 3cay 4cay 5
cay 6
cay 7
aby 1
aby2aby 3prae 1
D. praehensilis prae 2
Delta NigeriaDelta NigeriaYoruba Land,NigeriaIITA, NigeriaNibo; NigeriaMbiri; NigeriaNigeriaTogoNigeriaNigeriaManchester,JamaicaSt. Ann, JamaicaManchester,JamaicaNigeriaNigeriaGhanaIvory CoastIvory CoastManchester,JamaicaManchester,JamaicaSt. Elizabeth,JamaicaBode Sadu,NigeriaMokwa, NigeriaMokwa, NigeriaIITA forest,NigeriaOre, Nigeria
24
SpeciesD. praehensilis
D. liebrechtsiana
D. liebrechtsianaD. liebrechtsiana
D. smilacifolia
D. smilacifoliaD. smilacifoliaD. minutifloraD. minutifloraD. minutifloraD. togoensis
D. togoensis
D. togoensis
D. burkilliana
D. burkilliana
D. burkilliana
D. bulbiferaD. alata
D. oppositaD. trifida
D. sansibarensisTamus communis
2.2. Methods
Codeprae 3
lieb 1
Iieb2lieb 3
smil 1
smil2smil 3min 1min 2min 3togo 1
togo 2
togo 3
burkl
burk2
burk3
bulblalat
oppotrif
sansitarn
OriginOmo junction,NigeriaOmo, Nigeria
Omo, NigeriaOni Gambari,NigeriaIITA forest,NigeriaOnne, NigeriaOmo, NigeriaIfon, NigeriaOmo, NigeriaOre, NigeriaIITA forest,NigeriaBode Sadu,NigeriaIITA forest,NigeriaIITA forest,NigeriaOni Gambari,NigeriaOni Gambari,NigeriaOita, JapanSt. Elizabeth,JamaicaKyoto, JapanSt. Catherine,JamaicaBerlin, GermanyBerlin, Germany
Total genomic DNA was isolated from fresh or lyophilized leaves using either a modifiedDellaporta technique specifically adapted to yam leaves or tubers [15,16] or a modified CTABprocedure with subsequent purification of the DNA by CsCl buoyant density gradientcentrifugation [17]. Both DNAs are of sufficient purity for short-term RAPD or MP-PCRexperiments. However, for longer periods of storage or long-term experiments with necessaryrepetitions, only CsCl-purified DNA proved to be stable and gave consistent and reproducibleresults [18]. Therefore this additional purification is strongly recommended and was includedin the experiments with both aerial and Guinea yam. RAPD analysis was performed essentiallyas described [18], MP-PCR followed the procedure of [8], and RAMPOs were detected bypublished techniques [14,19]. Unequivocal positions of RAPD and MP-PCR bands weretransformed into binary character matrices, and pairwise distances calculated with simplematching, as well as the Jaccard coefficient and the similarity index according to Nei and Li
25

[20]. Additive trees based on distance matrices were generated by the neighbor-joining method[21]. Alternatively, binary character matrices were analyzed by the split decompositionapproach [22].
TABLE III. JAMAICAN YAM SPECIES AND CULTIVARS
Species Cultivar Sampling location
D. alata
D. cayenensis
D.cayenensis/rotundataD. rotundata
D. trifidaD. esculenta
Tamus communis
St. VincentSweet YamWhite YamRoundleafBlackwissTau Yam
Lucea YamNegro YamMozellaYampie YamChinese Yam
A, B, C, H, L, ME, G, H, ME BE,' A, B, C, D, F, H, IE , B , D , H , I , K , ME,F
E,I ,ME, I, F, G, K, M, LE,FE,C,DE, D, K
Botanical Garden,Frankfort; Germany
Abbreviations: Local name,District; A. Stony Hill, St. Andrew; B. Mt. Moreland,St. Catherine;C. Sygoville, St. Catherine; D. Kentts, Clarendon; E. Mandeville, Manchester; F. BrownTown, St. Ann; G. Clarement, St. Ann; H. Faiths Pen, St. Ann; I. Rosehall, St. Elizabeth; K.Dalton, St. Elizabeth; L. Caysham, St. Elizabeth; and M. Cesnock, Hanover.
The amplification and sequencing of three non-coding regions encompassing chloroplasttRNA genes trnTuGu, trnLvAA and trnFGAA as well as evaluation of the sequence data weredescribed [23,40].
2.3. Problems
2.3.1. Dioscorea bulbifera
The monocotyledonous Dioscoreaceae comprise about 600 different species with mainlytropical and subtropical habitats. A subset of these species, collectively referred to as "yam"are grown as economically important tuber crops, especially in Africa ("yam belt"), theCaribbean basin, Asia and Polynesia. One of the cultivated species, D. bulbifera L. (aerial yam)is somewhat exceptional, since it develops edible aerial bulbils from meristems at the base ofthe petioles, is the sole Dioscorea species present both in Africa and Asia in wild forms, andpossesses an extremely high intraspecific morphological polymorphism (e.g. plasticity of bulbilshape and flesh colour). This extreme morphological variation led to several controversialtaxonomical concepts. Either Asian and African forms were regarded as distinct and differentspecies (Asian D. bulbifera, African D. anthropophagorum; both with a series of varieties[24]), or classified as only one species with one African variety, and nine different Asianvarieties [25]. More recently, the African form was also subdivided into several varieties [26].
26

Finally, on the basis of chloroplast RFLP data two primary clusters were prevalent, an Africancluster (three accessions) and an Australasian cluster with twelve accessions [27].
2.3.2. Guinea yam complex
The culturally and economically most important tuber crop of the "yam belt" in WestAfrica is referred to as "Guinea yam". It consists of two forms, distinguishable by the colour ofthe tuber flesh: the "yellow yam" (D. cayenensis), and the "white yam" (D. rotundata). Thearchetypes of both forms are distinct, but many intermediates and about 500 - 2500 cultivarspresent an almost insurmountable task for unequivocal classification. Moreover, an almostexclusive vegetative propagation over many hundreds of years has rendered many cultivarssterile, so that no crossing experiments can be performed. Even in fertile cultivars, crossing byhand pollination is demanding, because the flowers are tiny and the pollen is sticky. Since thenormal fertilization is insect-borne, cross- contamination with pollen from other species is aproblem [28] All these obstacles make a traditional approach to solving the species problemdifficult, if not impossible. Consequently, different views exist as to the taxonomy of Guineayams. Both forms were either thought to represent one single, yet highly evolved species [29],or two clearly separable species. [30], or two well-separated clusters with some intermediateforms [31,32].
Also, the phylogeny of Guinea yam is obscure. Earlier investigations implied more thanten different species of the Enantiophyllum section as progenitors [24]. Ecologicalconsiderations led to the view that D. rotundata evolved from hybridization events betweenthe rainforest species, D. cayenensis, and the savannah species, D. praehensilis [33].Chemotaxonomical data also suggested a polyphyletic origin of the complex [34]. Finally,nuclear and chloroplast RFLP analyses detected a close relationship between D. rotundata onone hand, and D. abyssinica, D. liebrechtsiana and D. praehensilis on the other. D.cayenensis cultivars shared the same chloroplast genotype with these potential progenitors, butalso a nuclear rDNA marker with D. burkilliana, D. minutiflora and D. togoensis. These datawere interpreted to indicate that D. cayenensis was a hybrid and D. rotundata a true species[35].
2.3.3. Cultivar identification
Yam cultivars are generally distinguished by morphological criteria, which, however, aredependent on environmental parameters and therefore quite variable and not reliable.Moreover, unequivocal cultivar identification is hindered by linguistic barriers. For example,most cultivated forms of yams have never been named conclusively. Therefore, each locationhas its own repertoire of names for cultivars, and even cultivars from different species are oftencalled by the same name. We chose the Jamaican yams with eleven local varieties from the fivecultivated species D. rotundata, D. trifida, D. esculenta, D. alata and D. cayenensis as amodel system to identify yam cultivars by DNA profiling.
3. RESULTS AND DISCUSSION
The results of this research have both technical and scientific dimensions.
3.1. The techniques
Since RAPD analysis is based on an enzymatic reaction driven by primers of arbitrarysequence, small changes in the reaction conditions might change the results. Moreover, yam
27
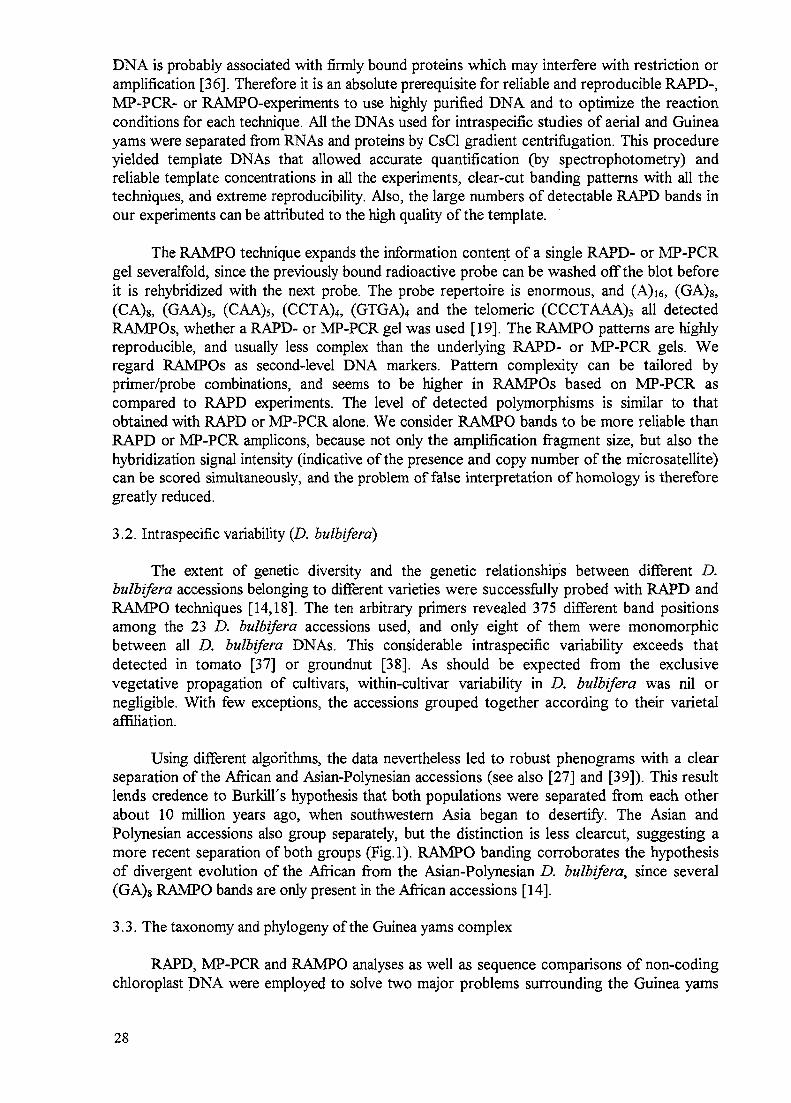
DNA is probably associated with firmly bound proteins which may interfere with restriction oramplification [36]. Therefore it is an absolute prerequisite for reliable and reproducible RAPD-,MP-PCR- or RAMPO-experiments to use highly purified DNA and to optimize the reactionconditions for each technique. All the DNAs used for intraspecific studies of aerial and Guineayams were separated from RNAs and proteins by CsCl gradient centrifligation. This procedureyielded template DNAs that allowed accurate quantification (by spectrophotometry) andreliable template concentrations in all the experiments, clear-cut banding patterns with all thetechniques, and extreme reproducibility. Also, the large numbers of detectable RAPD bands inour experiments can be attributed to the high quality of the template.
The RAMPO technique expands the information content of a single RAPD- or MP-PCRgel severalfold, since the previously bound radioactive probe can be washed off the blot beforeit is rehybridized with the next probe. The probe repertoire is enormous, and (A)i6, (GA)s,(CA)g, (GAA)5, (CAA)5, (CCTA)4, (GTGA)4 and the telomeric (CCCTAAA)3 all detectedRAMPOs, whether a RAPD- or MP-PCR gel was used [19]. The RAMPO patterns are highlyreproducible, and usually less complex than the underlying RAPD- or MP-PCR gels. Weregard RAMPOs as second-level DNA markers. Pattern complexity can be tailored byprimer/probe combinations, and seems to be higher in RAMPOs based on MP-PCR ascompared to RAPD experiments. The level of detected polymorphisms is similar to thatobtained with RAPD or MP-PCR alone. We consider RAMPO bands to be more reliable thanRAPD or MP-PCR amplicons, because not only the amplification fragment size, but also thehybridization signal intensity (indicative of the presence and copy number of the micro satellite)can be scored simultaneously, and the problem of false interpretation of homology is thereforegreatly reduced.
3.2. Intraspecific variability (D. bulbifera)
The extent of genetic diversity and the genetic relationships between different D.bulbifera accessions belonging to different varieties were successfully probed with RAPD andRAMPO techniques [14,18]. The ten arbitrary primers revealed 375 different band positionsamong the 23 D. bulbifera accessions used, and only eight of them were monomorphicbetween all D. bulbifera DNAs. This considerable intraspecific variability exceeds thatdetected in tomato [37] or groundnut [38]. As should be expected from the exclusivevegetative propagation of cultivars, within-cultivar variability in D. bulbifera was nil ornegligible. With few exceptions, the accessions grouped together according to their varietalaffiliation.
Using different algorithms, the data nevertheless led to robust phenograms with a clearseparation of the African and Asian-Polynesian accessions (see also [27] and [39]). This resultlends credence to Burkill's hypothesis that both populations were separated from each otherabout 10 million years ago, when southwestern Asia began to desertify. The Asian andPolynesian accessions also group separately, but the distinction is less clearcut, suggesting amore recent separation of both groups (Fig.l). RAMPO banding corroborates the hypothesisof divergent evolution of the African from the Asian-Polynesian D. bulbifera, since several(GA)g RAMPO bands are only present in the African accessions [14].
3.3. The taxonomy and phylogeny of the Guinea yams complex
RAPD, MP-PCR and RAMPO analyses as well as sequence comparisons of non-codingchloroplast DNA were employed to solve two major problems surrounding the Guinea yams
28

complex: first, are D. rotundata and D. cayenensis to be considered as two distinct species,and second, what are the progenitors of cultivated Guinea yams?
Our RAPD and MP-PCR, but also RAMPO, data strongly support the two speciesconcept [30], because phenograms and split graphs clearly separated the D. rotundata and D.cayenensis accessions, and - equally important - RAMPO bands were detected that werediagnostic for either D. cayenensis or D. rotundata [23], though the different cultivarsoriginated from different locations (here Africa and Jamaica). Two morphologicalintermediates grouped together with D. rotundata (Fig.2). No intraspecific sequence variationwas found in the non-coding chloroplast DNA regions investigated, which could be expectedin view of the relative stability of the chloroplast genome. In yams, this marker type appears tobe useful at the species or genus levels only, but not informative intraspecifically [23]. The onlyproblem we are facing is the relatively small number of accessions that could be involved (21accessions of Guinea yam and 21 accessions belonging to seven putative progenitor species).Two morphological intermediates grouped together with D. rotundata.
Taken together, our data support the hypothesis that D. cayenensis and D. rotundatabelong to two different taxa.
Now, which wild species represent the actual progenitors of cultivated Guinea yams? Itwas already known from chloroplast RFLP analyses, that both forms of cultivated Guinea yamshared the same chloroplast type as D. abyssinica, D. liebrechtsiana and D. praehensilis [35].Our RAPD-, MP-PCR and chloroplast sequence data altogether support this presumptiveprogenitor-successor relationship. Also, the occurrence of shared RAMPO bands points to D.rotundata, D. liebrechtsiana and£>. praehensilis as one related group [23].
On the other hand, D. burkilliana, D. minutiflora, D. smilacifolia and D. togoensis eachpossess a different chloroplast DNA type, but share a common nuclear rDNA fragment with D.cayenensis [35]. These characteristics were interpreted as an indication for the hybrid nature ofD. cayenensis, incorporating features of both precursor groups. The tentative female parentwould then either be D. rotundata, D. abyssinica, D. liebrechtsiana or D. praehensilis, themale parent a member of the other progenitor group [35]. At least some of our RAMPO datasupport the hybrid nature of D. cayenensis; this species shared common RAMPO fragmentswith D. minutiflora, D. burkilliana, and also D. smilacifolia. •
Our data are consistent with the possibility that D. cayenensis is an asymmetric hybrid,whose female donor would have been D. rotundata, D. praehensilis, D. abyssinica or D.liebrechtsiana, donating the mass of nuclear DNA and the chloroplast genome. The smallerpart of the nuclear DNA would then have been contributed by either D. burkilliana, D.minutiflora or D. smilacifolia. And it is this part that can be detected by a subset of RAPD andRAMPO fragments. The D. cayenensis cultivars, as a group, being genetically very similar,would then originate from one and the same hybridization event [23].
3.4. Cultivar identification of Jamaican yams
The yam species grown in Jamaica are representative for the whole Caribbean basin.Historically, these yams have been introduced more recently via the slave trade route fromWest Africa, and belong to five species: Dioscorea alata, D. cayenensis, D. esculenta, D.rotundata, and D. trifida. All these species in turn split into many cultivars, of which thosefrom D. alata and D. cayenensis contribute the bulk of Jamaican (or Caribbean) yam
29

Distance 0.1
991 Bot. Garden, Giessen; Germany/var. ?
9B
83
66
97
99
100
83
66
57
85
100
Bot. Garden. Darmstadt; Germany/var. ?
*— Bot. Garden. Karlsruhe; Germany/var. ?
— DB7: Tonga Island/var. saliva
— DBNC1; New Caiedonia/var. ?
DBS; Australia/var. suavior
DB8; Hawaii/var. sativajooTDB9; Hawaii/var. sativa
DB6; Papua New Guinea/var. elongata
DB18; Thailand/var. heterophylla
DB16; Thailand/var. heterophylla
- DB 12; Taiwan/var. suavior
DB10; Taiwan/var. heterophylla
DB 13; Taiwan/var. vera
DB247; Japan/var. vera100
Tr
100
ygi— DB23S; Japan/var. vera
DB267; Japan/var. vera
DB9304; Ethiopia/var. alveolata
DB9307; Ethiopia/var. anthropophagorum
DB9303; Ethiopia/var. anthropophagorum
DB I; Madagascar/var. anthropophagorum
DB3; Tanzania/var. anthropophagorum
L DB3; Tanzania/var. anthropophagorum
100
D. burkilliana (outgroup)
FIG. 1. Neighbour-joining tree ofD. bulbifera accessions based on RAPD analysis. Presence/absenceof bands at 375 positions revealed by 10 different Operon primers was transformed into a distancematrix using the simple matching coefficient of similarity and analyzed by the neighbor-joining optionof the NTSYS-pc software package. Dioscorea burkilliana was included as an outgroup to root thedendrogram. Numbers at the nodes represent bootstrap values. The relative genetic distance isindicated by the horizontal bar.
30
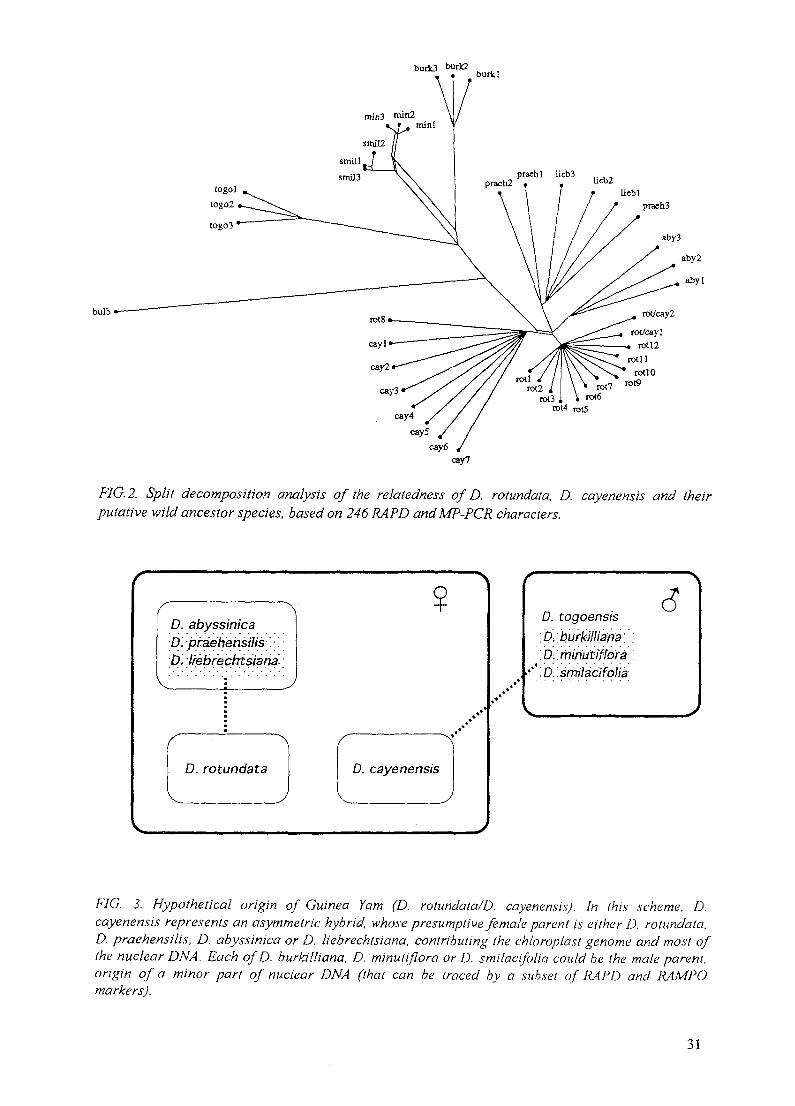
burk3burfcl
togol
togo2
bulb
FIG. 2. Split decomposition analysis of the relatedness of D. rotundata, D. cayenensis and theirputative wild ancestor species, based on 246 RAPD and MP-PCR characters.
D. abyssinicaD'. praehehsilis '.•'.•D. Ifebrechisiaria-
D. rotundata D. cayenensis
D. togoensis
:D\:burki'lli.ana:-'.D-.'.miriu'ti flora-
FIG. 3. Hypothetical origin of Guinea Yam (D. rolundata/D. cayenensis). In this scheme. D.cayenensis represents an asymmetric hybrid, whose presumptive female parent is either D. rotundata.D. praehensilis, D. abyssinica or D. liebrechtsiana, contributing the chloroplast genome and most ofthe nuclear DNA. Each of D. burkilliana, D. minutiflora or D. smilacifolia could be the male parent,origin of a minor part of nuclear DNA (thai can be traced by a subset of liAPD and RAMPOmarkers).
31
production. Over the past decade, increasing exports to the US added to the economic value ofthis crop. In spite of their importance as a food and cash crop, yam cultivars have not yet beenunequivocally classified.
A sound classification can be achieved with RAPDs. After careful adjustment of reactionconditions, clear-cut banding patterns were produced from nine of fifteen arbitrary primers.These RAPD patterns were highly reproducible and somatically stable (i.e., identical patternswere obtained with either leaves, shoots or roots). RAPDs readily discriminated between thedifferent Dioscorea species, and cultivars as well. Cultivar identification is most desirable, bothfor protection of breeders rights and improvement programs, and can be achievedunambiguously with RAPDs [41]. RAPD fingerprints are therefore reliable and mitoticallystable tools to typify yam cultivars. As expected, intracultivar variability was negligible, thoughdifferent plants of the same cultivar were taken from different growing areas in Jamaica [41].This lack of intracultivar variability also holds for other vegetatively propagated crops [42,43,44,45], though exceptions of this rule are known [46].
The combined amplification and hybridization techniques are powerful tools for solvingeven delicate problems of the taxonomy and phylogeny of vegetatively propagated crops, andto protect breeder's rights by unequivocally profiling different cultivars of a taxon, exemplifiedhere with the genus Dioscorea (yam).
ACKNOWLEDGEMENTS
Research of the authors was supported by IAEA (Research Contract 7227/CF), DFG(grants Ka 332/14-1, 14-2 and 14-3), the Alexander von Humboldt-Foundation (R.Terauchi),CONACYT Mexico (C. Lopez-Peralta), EDF (H.N. Asemota), FAZIT-Foundation(K.Weising) and the "Freunde und Forderer der Universitat" Frankfurt am Main. Weappreciate the editorial assistance of Mrs. Sieglinde Kost.
REFERENCES
[1] WINTER, P. and KAHL, G. Molecular marker technologies for plant improvement,World J. Microbiol. Biotechnol. 11 (1995) 438-448.
[2] LIANG, P. and PARDEE, A.B. Differential display of eukaryotic messenger RNA bymeans of the polymerase chain reaction, Science 257 (1992) 967-971.
[3] WELSH, J., CHADA, K., DALAL, S.S., CHENG, R., RALPH, D. andMCCLELLAND, M. Arbitrarily primed PCR fingerprinting of RNA, Nucleic Acids Res.20 (1992) 4965-4970.
[4] LIANG, P. and PARDEE, A.B. Recent advances in differential display, Current Opinionin Immunology 7 (1995) 274-280.
[5] WILLIAMS, J.G.K., KUBELK, A.R., LIVAK, K.J., RAFALSKI, J.A. and TINGEY,S.V. DNA polymorphisms amplified by arbitrary primers are useful as genetic markers,Nucleic Acids Res. 18 (1990) 6531-6535.
[6] WELSH, J. and MCCLELLAND, M. Fingerprinting genomes using PCR with arbitraryprimers, Nucleic Acids Res. 18 (1990) 7213-7218.
[7] CAETANO-ANOLLES, G., B ASSAM, B.J. and GRESSHOFF, P.M. DNAamplification fingerprinting: a strategy for genome analysis, Plant Mol. Biol. Rep. 9(1991) 294-307.
[8] WEISING, K., ATKINSON, R.G. and GARDNER, R.C. Genomic fingerprinting bymicrosatellite-primed PCR: a critical evaluation, PCR Meth. Applications 4 (1995) 249-255.
32
[9] ZIETKDEWICZ, E., RAFALSKI, A. and LABUDA, D. Genome fingerprinting by simplesequence repeat (SSR)- anchored polymerase chain reaction amplification, Genomics 20(1994) 176-183.
[10] WU, K.S., JONES, R., DANNEBERGER, L. and SCOLNIK, P.A. Detection ofmicro satellite polymorphisms without cloning, Nucleic Acids Res. 22 (1994) 3257-3258.
[11] WEISING, K. and KAHL, G. "Hybridization-based microsatellite fingerprinting of plantsand fungi", DNA markers: protocols, applications and overviews (CAETANO-ANOLLES, G., GRESSHOFF, P.M., Eds.), Wiley & Sons, N.Y (1997).
[12] WEISING, K., KAEMMER, D., WEIGAND, F., EPPLEN, J.T. and KAHL, G.Oligonucleotide fingerprinting reveals probe-dependent levels of informativeness inchickpea {Cicer arietinum L.), Genome 35 (1992) 436-442.
[13] WEISING, K., WINTER, P., HUTTEL, B. AND KAHL, G. Microsatellite markers formolecular breeding. J. Crop Prod. 1 (1998) 113 - 143.
[14] RICHARDSON, T., CATO, S., RAMSER, J., KAHL, G. and WEISING, K.Hybridization of microsatellites to RAPD: a new source of polymorphic markers,Nucleic Acids Res. 23 (1995) 3798-3799.
[15] DELLAPORTA, S.L., WOOD, J. and HICKS, J.B. A plant DNA minipreparation:version II, Plant Mol. Biol. Rep. 1 (1983) 19-21.
[16] ASEMOTA, H.N. A fast, simple and efficient miniscale method for the preparation ofDNA from tissues of yam {Dioscorea spp.), Plant Mol. Biol. Rep. 13 (1995) 214-218.
[17] SAGHAI-MAROOF, M.A., SOL1MAN, K.M., JORGENSEN, R.A. and ALLARD, R.Ribosomal DNA spacer-length polymorphisms in barley: Mendelian inheritance,chromosomal location, and population dynamics, Proc. Natl. Acad. Sci. USA 81 (1984)8014-8018.
[18] RAMSER, J., LOPEZ-PERALTA, C, WETZEL, R., WEISING, K. and KAHL, G.Genomic variation and relationships in aerial yam (Dioscorea bulbifera L.) detected byrandom amplified polymorphic DNA, Genome 39 (1996) 17-25.
[19] RAMSER, J., WEISING, K, CFflKALEKE, V. and KAHL, G. RAMPO: IncreasedInformativeness of RAPD Analysis by Detection of Microsatellite Motifs, BioTechniques23(1997)285-290.
[20] NEI, M. and LI, W.H. Mathematical model for studying genetic variation in terms ofrestriction endonucleases, Proc. Natl. Acad. Sci. USA 76 (1979) 5269-5273.
[21] SAITOU, N. and NEI, M. The neighbor-joining method: a new method forreconstructing phylogenetic trees, Mol. Biol. Evol. 4 (1987) 406-425.
[22] BANDELT, H. J. and DRESS, A.W.M. Split decomposition: a new and useful approachto phylogenetic analysis of distance data, Mol. Phylogenet. Evol. 1 (1992) 242-252.
[23] RAMSER, J., WEISING, K., LOPEZ-PERALTA, C, TERHALLE, W., TERAUCHI,R. and KAHL, G. Molecular marker-based taxonomy and phylogeny of Guinea Yam{Dioscorea rotundata- D. cayenensis). Genome (1997)(submitted).
[24] CHEVALIER, A. Contribution a Fetude de quelques especes africaines du genreDioscorea, Bull. Mus. Natl. Hist. Nat. Ser. 2, 8 (1936) 520-525.
[25] PRAIN, D. and BURKILL, I.H. An account of the genus Dioscorea in the East. Part I:The species which twine to the left, Ann. Roy. Bot. Gard. Calcutta 14 (1936) 1-20.
[26] MIEGE, J. "De quelques caracteres discriminatoires entre les taxons intraspecifiques deD. bulbifera L", Yams (Ignames). (MIEGE, J., LYONGA, S.N. Eds., OxfordUniversity Press, Oxford (1982).
[27] TERAUCHI, R., TERACHI, T. and TSUNEWAKI, K. Intraspecific variation ofchloroplast DNA in Dioscorea bulbifera L., Theor. Appl. Genet. 81 (1991) 461-470.
[28] ZOUNDJTHEKPON, J., HAMON, S., TIO-TOURE, B. and HAMON, P. Firstcontrolled progenies checked by isozymic markers in cultivated yams (Dioscoreacayenensis/rotundata), Theor. Appl. Genet. 88 (1994) 1011-1016.
33
[29] MARTIN, F.W. and RHODES, A.M. The relationship of Dioscorea cayenensis and D.rotundata, Trop. Agric. (Trinidad) 55 (1978) 193-206.
[30] ONYELAGHA, J.C. and LOWE, J. Studies on the relationship of Dioscorea cayenensisand Dioscorea rotundata cultivars, Euphytica 35 (1985) 733-739.
[31] HAMON, P. and TOURE, B. Characterization of traditional yam varieties belonging tothe Dioscorea cayenensis-rotundata complex by their isozymic patterns, Euphytica 46(1990) 101-107.
[32] HAMON, P. and TOURE, B. The classification of the cultivated yams {Dioscoreacayenensis-rotundata complex) of West Africa, Euphytica 47 (1990) 179-187.
[33] AYENSU, E.S. and COURSEY, D.G. Guinea yams. The botany, ethnobotany, use andpossible future of yams in West Africa, Econ. Bot. 26 (1-972) 301-318.
[34] MEGE, J. "Etude chimiotaxonomique de dix cultivars de Cote d'lvoire relevant ducomplexe Dioscorea cayenensis-rotundata'", Yams (Ignames) (MIEGE, J., LYONGA,S.N., Eds.), Oxford University Press, Oxford (1982).
[35] TERAUCHI, R, CHDCALEKE, V.A., THOTTAPILLY, G. and HAHN, S.K. Originand phytogeny of Guinea yams as revealed by RFLP analysis of chloroplast DNA andnuclear DNA, Theoret. Appl. Genet. 83 (1992) 743-751.
[36] SCHAFER, W., GORZ, A., and KAHL, G. T-DNA integration and expression in amonocot crop plant after induction of Agrobacterium, Nature 327 (1987) 529-532.
[37] WILLIAMS, C.E. and ST. CLAIR, D.A. Phenetic relationships and levels of variabilitydetected by restriction fragment length polymorphism and random amplified polymorphicDNA analysis of cultivated and wild accessions of Lycopersicon esculentum, Genome 36(1993) 619-630.
[38] HALWARD, T.M., STALKER, H.T., LARUE, E.A. and KOCHERT, G. Geneticvariation detectable with molecular markers among unadapted germplasm resources ofcultivated peanut and related species, Plant Mol. Biol. 18 (1992) 315-325.
[39] BURKILL, I.H. The organography and evolution of Dioscoreaceae, the family of yams,J. Linn. Soc. Lond. Bot. 56 (1960) 319-412.
[40] TABERLET, P., GIELLY, L., PANTOU, G. and BOUVET, J. Universal primers foramplification of three noncoding regions of chloroplast DNA, Plant Mol. Biol. 17 (1991)1105-1109.
[41] ASEMOTA, H.N, RAMSER, J., LOPEZ-PERALTA, C, WEISING, K. and KAHL, G.Genetic variation and cultivar identification of Jamaican yam germplasm by randomamplified polymorphic DNA analysis, Euphytica 92 (1996) 341-351.
[42] KAEMMER, D., AFZA, R., WEISING, K, KAHL, G. and NOVAK, F.J.Oligonucleotide and amplification fingerprinting of wild species and cultivars of banana(Musa spp.), BioTechnology 10 (1992) 1030-1035.
[43] CASTIGLIONE, S., WANG, G., DAMIANI, G, BANDI, S., BISOFFI, S. and SALA,F. RAPD fingerprints for identification and taxonomic studies of elite poplar (Populusspec.) clones, Theor. Appl. Genet. 87 (1993) 54-59.
[44] HOEPFNER, A.S., NYBOM, H., CARLSON, U. and FRANZEN, R. DNAfingerprinting useful for monitoring cell line idendity in micropropagated raspberries,Acta Agric. Scand. Sect. B., Soil Plant Sci. 43 (1993) 53-57.
[45] WOLFF, K., ZIETKIEWICZ, E. and HOFSTRA, H. Identification of chrysanthemumcultivars and stability of DNA fingerprint patterns, Theor. Appl. Genet. 91 (1995) 439-447.
[46] NOVY, R.G., KOBAK, C, GOFFREDA, J. and VORSA, N. RAPDs identify varietalmisclassification and regional divergence in cranberry (Vaccinium macrocarpon (Ait.),Pursh. Theoret. Appl. Genet. 88 (1994) 1004-1010.
34

RESULTS OF A MUSA MAPPING PROJECT XA9848409
P.J.L. LAGODA, J.-L. NOYER, F.-C. BAURENS, L. GRIVET,L.-M. RABOIN, C. AMSON, G. AUBERT, L. COSTET, C. LANAUDCIRAD-GERDAT BIOTROP Laboratory, AGETROP,Montpellier, France
D. DAMBIER, J. GANRY,H. TEZENAS-DU-MONTCEL, J.-P. HORRY,CIRAD-FLHOR, Montpellier, France
F. BAKRY, P. OLLITRAULT, F. CARREELCIRAD-FLHOR, Guadeloupe, France
E. AUBOIRON, E. FOURE, C. JENNY, K. TOMEKPECRBP, Nyombe, Cameroon
A. GRAPINCATIE, Turrialba, Costa Rica
A.S. FAUREGenethon, Paris, France
F. RESCHCEURGenomeExpress SA, Grenoble, France
D. GONZALEZ-DE-LEONCIMMYT, Mexico-City, Mexico
Abstract
A completed map, based on two selfed progenies from two banana cultivars (M53 and SFB5) ispresented (roughly 1200 cM). More than three hundred markers are linked in 11 linkage groupsrepresenting the genome (2n=22) of Musa acuminata. Roughly one third of the markers are co-dominant restriction fragment polymorphisms (RFLPs; one hundred) or microsatellites (thirty). Twothirds of the markers are dominant amplified fragment length polymorphisms (AFLPs; 10% could beconsidered to be co-dominant). The mean linkage distance is 3 cM, but marker density still should beincreased on a couple of linkage groups. Particularities for a mapping job in banana are discussed. Dueto Musa acuminata sub-species specific translocations, up to 36% of all the markers tested showimportant segregation distortions. The need for a cooperative mapping initiative based on a proposed"frame-map" harbouring evenly spaced co-dominant "anchor" markers is proposed. CIRAD haspublished 45 sequence tagged microsatellite sites (STMS) in the EMBL database which are accessibleat: "http://www.ebi.ac.uk/" using the keywords LAGODA and MICROSATELLITE (EMBLaccessions X87258 to X87265, X90740 to X90750 and Z85950 to Z85977).
1. INTRODUCTION
Banana and plantain belong to the Musaceae family and are among the tallestmonocotyledons. They are crops of primary economic importance for many tropical countries,either as a local staple food or for exportation. Unfortunately, they can be considered "orphancrops" because they are seldom included in international genome analysis initiatives. They are,
35
however, an example of higher eukaryotes (reviewed in [1]) whose cytogenetic structure ismade more complex through chromosomal repatterning due to considerable chromosomestructural differentiation within the Musa species (reviewed in [2]). Natural reproductivebarriers exist, therefore, between acuminata wild type diploid subspecies, an obviouscomponent of subspecies divergence, and genetic diversity of the species as a whole. This factis of paramount importance to breeders, seriously limiting options in improvement strategies.Diploid cultivars are essentially inter-(sub)species hybrids, heterozygous for one or severaltranslocations (reviewed in [2]). The tendency towards male-sterile material and genie femalesterility further complicates the use of these materials as female parents. Sterility (both geniefemale (male?) and caused by structural hybridity), parthenocarpy (i.e. autonomous stimulus topulp growths) and subsequent formation of triploids (resulting from the fusion of reduced andnon-reduced gametes following nuclear restitution) are the milestones of domestication whichcreated the present vegetatively propagated, sexually sterile cultivars. Molecular knowledge ofthe complex genome structure of banana and plantain is thus mandatory to better understandMusa genetics. In the late 1980s, CIRAD started to use molecular markers on banana to studythe genetic diversity of the Musaceae and to investigate marker assisted breeding ([3] and [4]and references therein) for resistance to important diseases such as Black Leaf Streak Disease(BLSD). The present report will focus on mapping the banana genome.
2. MATERIALS AND METHODS
2.1. Plant material (mapping populations)
Eighty-nine individuals have been used to build the "M53" map. The parental clone,M53, is a synthetic hybrid:
(Musa acuminata malaccensis 'Kedah' type xMusa acuminata banksii 'Samoa' type)x
(AAc 'Paka' type xMusa acuminata banksii 'Samoa' type)
"M53"
M53 originally stems from the genetic improvement program headed by Dr. K. Shepherdin Jamaica. The progeny was produced at CIRAD, French West Indies (Guadeloupe). Theprogeny of the selfed M53 shows segregation for the resistance to BLSD (Bunchy LeafDisease). More than 750 other progenies of the same cross are being evaluated in the field forBLSD resistance at the CRBP in Cameroon.
Our second mapping population was a selfed progeny of clone SFB5. The parental clone,SFB5, is a hybrid between SF265(AAcv) and Musa acuminata ssp. banksii type 'Banksii'(AAs). Ninety-two individuals have been used to build the "SFB5" map [5].
2.2. Detection of molecular markers and map construction
Amplified fragment length polymorphisms (AFLP) were performed using six primer pairsfrom the kit of GIBCO-Life Technology, with the protocol provided by the supplier. Variablenumber of di-nucleotide repeats (VNDR) were obtained and analysed as previously described[6, 7]. Restriction fragment length polymorphisms (RFLP), randomly amplified polymorphicDNA (RAPD) and isozyme analyses were performed as previously described [4,8]. Maps wereconstructed using the JoinMap 1.4 software [9]. A critical LOD value of 4 was used toestablish linkage groups.
36
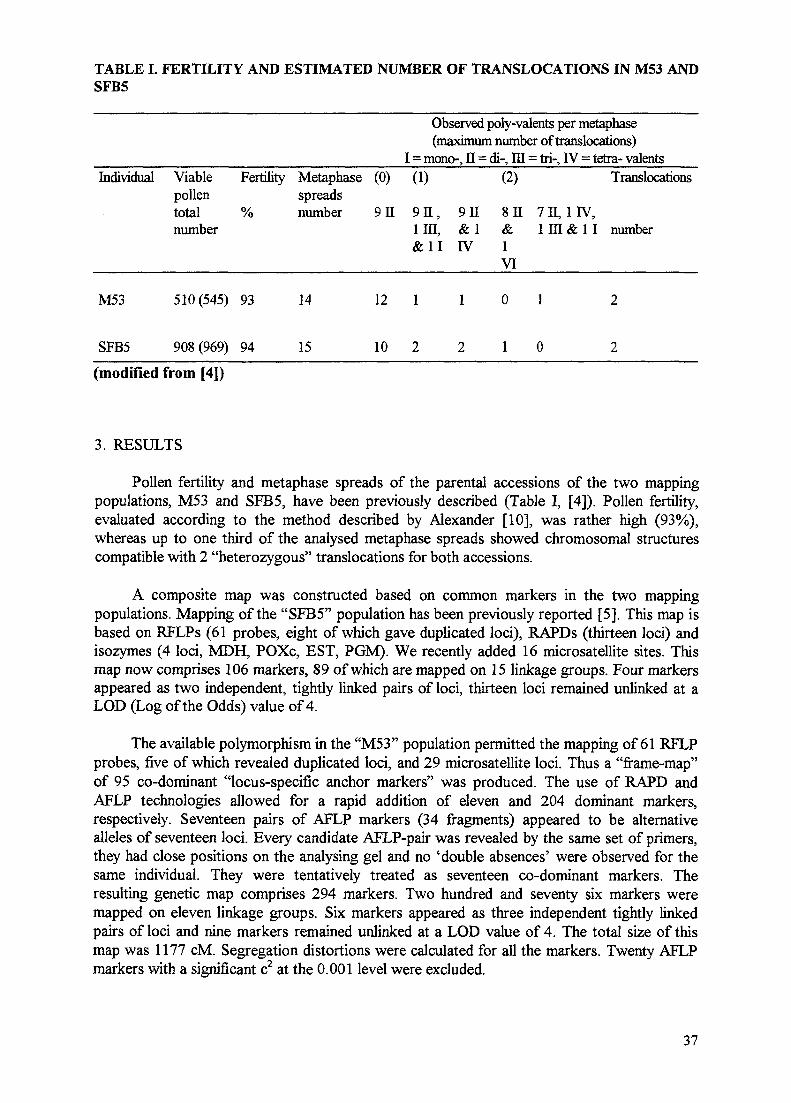
TABLE I. FERTILITY AND ESTIMATED NUMBER OF TRANSLOCATIONS IN M53 ANDSFB5
Individual
M53
SFB5
Viablepollentotalnumber
510(545)
908 (969)
Fertility
%
93
94
Metaphasespreadsnumber
14
15
(0)
911
12
10
Observed poly-valents per metaphase(maximum number of translocations)
I = mono-, II = di-, III = tri-, IV = tetra- valents(1) (2) Translocations
9 n , 9 n 8 ii 7 ii, i rv,1IIL &1 & 1III&1I number&1I IV 1
VI
1 1 0 1 2
2 2 1 0 2
(modified from [4])
3. RESULTS
Pollen fertility and metaphase spreads of the parental accessions of the two mappingpopulations, M53 and SFB5, have been previously described (Table I, [4]). Pollen fertility,evaluated according to the method described by Alexander [10], was rather high (93%),whereas up to one third of the analysed metaphase spreads showed chromosomal structurescompatible with 2 "heterozygous" translocations for both accessions.
A composite map was constructed based on common markers in the two mappingpopulations. Mapping of the "SFB5" population has been previously reported [5]. This map isbased on RFLPs (61 probes, eight of which gave duplicated loci), RAPDs (thirteen loci) andisozymes (4 loci, MDH, POXc, EST, PGM). We recently added 16 microsatellite sites. Thismap now comprises 106 markers, 89 of which are mapped on 15 linkage groups. Four markersappeared as two independent, tightly linked pairs of loci, thirteen loci remained unlinked at aLOD (Log of the Odds) value of 4.
The available polymorphism in the "M53" population permitted the mapping of 61 RFLPprobes, five of which revealed duplicated loci, and 29 microsatellite loci. Thus a "frame-map"of 95 co-dominant "locus-specific anchor markers" was produced. The use of RAPD andAFLP technologies allowed for a rapid addition of eleven and 204 dominant markers,respectively. Seventeen pairs of AFLP markers (34 fragments) appeared to be alternativealleles of seventeen loci. Every candidate AFLP-pair was revealed by the same set of primers,they had close positions on the analysing gel and no 'double absences' were observed for thesame individual. They were tentatively treated as seventeen co-dominant markers. Theresulting genetic map comprises 294 markers. Two hundred and seventy six markers weremapped on eleven linkage groups. Six markers appeared as three independent tightly linkedpairs of loci and nine markers remained unlinked at a LOD value of 4. The total size of thismap was 1177 cM. Segregation distortions were calculated for all the markers. Twenty AFLPmarkers with a significant c2 at the 0.001 level were excluded.
37

The "M53" and "SFB5" maps had 97 locus specific markers in common (81 RFLP andsixteen microsatellites). Co-linearity was observed between linkage groups of the two maps.This allows for the construction of a composite map (1227 cM) at a LOD score of 4.75. Thiscomposite map links 373 isozyme, microsatellite, RFLP, RAPD and AFLP markers in 11linkage groups. One tightly linked AFLP pair (provided by "M53") doesn't associate with anylinkage group and two STMS, four AFLP from "M53" as well as one RFLP and two isozymemarkers from "SFB5" stay unlinked at the chosen LOD score. Mean linkage distance is 3 cM.Up to 36 % of the tested markers showed important segregation distortions. Most of thesemarkers associate in a very large linkage group at LOD £ 3.0, but are dissociated in differentlinkage groups at LOD 3 4.0. Of special interest are three RFLP markers pMaCIRlOOl,pMaCIRllll and pMaCIR257. These RFLP markers are amongst the markers showing themost distorted segregation. They are also the only RFLP markers permutating linkage whencomparing both maps (Fig. 1). More studies are needed to test whether this is indicative of atranslocation breakpoint.
4. DISCUSSION
4.1. Mapping and translocations
The most important problem for mapping the banana genome seems to be the variabilityof chromosome structure. Translocations are a common phenomenon in diploid bananas [2].Banana chromosomes are tiny, which explains the paucity of cytogenetic data (reviewed in[4]). These data are not explicit enough to identify whether the translocation(s) involved: anunbalanced translocation, a segment from one chromosome is transferred on top of another,nonhomologous, chromosome; the insertion of a segment from one chromosome into thechromosomal arm of another non-homologous chromosome; or the exchange of chromosomalends between two non-homologous chromosomes.
According to Burnham [11] the reciprocal translocation (exchange) is the most commonprocess observed in somatic cells or at meiosis. Translocations may occur spontaneously dueto the imbrication of bivalents, entangled chromosomes, homozygosity of special genes (e.g.sticky, stl in corn), growth from aged seeds or be induced by exogenous stimuli like chemicaltreatments or irradiation. At meiosis the homologous regions of the hybrid chromosomesproduced by translocation will associate. Meiosis will proceed normally if both members of thehybrid chromatid couple experienced the same structural modification. The translocation isthen called homozygous. In structural hybrids, when one member of the associatedchromosomes suffered structural modification, the translocation is then called heterozygous.At prophase I, the association of four chromosomes (two pairs), sharing partial homologies,produces a complex chromatid configuration (tetravalent, visible as a structure resembling across). How this complex configuration behaves at meiosis depends on the frequency of thechiasmata and on their relative location in relation to the centromere position and orientation.If two heterozygous translocations co-exist in the same cell, two tetravalents may be observedif both events don't share a common chromosome or one hexavalent, if one chromosome isimplicated in both structural modifications (Table I, Fig. 2).
38

rOPM7.2
pMaCIR181pMaCIR70
rOPM20
pMaCIR245pMaCIR417
"SFB5"(#15)" M 5 3 " pMaCIR160ai v i ^ J F r O P S 1 3 3
rOPM15.2p
pMaCIRlOOt— pMaCIRllllr *pMaCIR257
rOPM15.ipMaCIR385
pMaCIR1156
•H4C14
cMaCIR2041
pMaCIRll l lpMaCIR1066
irOPS20lpMaCIR1042
pMaCIR1156
pMaCIR1019
il33
"SFB5"(#12)"M53"(#C)
FIG. 1. Detail from the comparison of the "SFB5" and "M53" maps. The candidate translocationbreakpoint (to be investigated farther) is indicated as: "M53 " unlinked. The probe type is indicatedby the probe name: pMaClRxxxx, RFLP (genomic); cMaCIRxxxx, RFLP( cDNA); rOPXxx.x, RAPD;ixxx, STMS; andH4C14, RFLP (histone).
There are at least three important genetic consequences of structural hybridity. First,nonhomologous chromosomes involved in a reciprocal translocation will associate duringmeiotic prophase I to form the polyvalents described above, thus creating inter-chromosomallinkage. These complex structures may be considered as a single recombination unit or linkagegroup. This might explain why at a LOD score between 3 and 4 both our maps include ninelinkage groups (basic chromosome number n = 11), one being a very long "mega-linkagegroup" harbouring significantly more markers than the eight other linkage groups. Thus, genesusually segregating independently, because they are normally situated on differentchromosomes in one parent, will show variable degrees of linkage in the progenies of structuralhybrids. Second, the recombination rate is reduced near translocation breakpoints due to steric
39

hindrance of the heterochromatin structure [11] (Fig. 2) and genetic distances between theproximal loci will appear shortened. Third, at meiosis, the disjunction of the multiplechromosome associations at metaphase will result in mostly unbalanced distributions ofinterchanged chromosomal segments. Some gametes will be unviable and their gene marker)combinations will not be represented in the progeny due to the differential gametic viability.
I II III
Q1
BPl-
X
I
1•fA
CO
BP2
LR1
LR2
FIG. 2. Diagrammatic representation of meiotic pairing in a hypothetical structural heterozygote fortwo reciprocal translocations involving 3 pairs of chromosomes (modified from [IJ.The complementsof the parental accessions differ by two reciprocal interchanges involving 3 pairs of chromosomes (I, II,IE). BPl, BP2 = translocation breakpoints. CO - segments of putatively unaffected crossing overpotential. LRI, LR2 = zones with reduced recombination rate. Loci linked in both parents: (I, b, a} and {d,c, sj. CO' = region of variable crossing over potential. Loci linked in parent 1 (I, II, HI) but not in parent2:1&2, S&4 and5&6. Loci linked in parent 2 but not in parent 1:1&3, 2&5 and 4&6. Linkage groups {a -bj and {c-d} are the most likely to be unaffected by translocations. "Hybrid" linkage groups {I, 2, 3} and{4, 5, 6} will appear independent only if the crossing over rate is high at CO' between BPl and BP2. Loci1, 2 and 3 (idem for loci 4, 5 and 6) may appear "linked" more or less tightly depending on crossing overrate between each of them and the proximal breakpoint. Crossing over may be sterically hindereddepending on position relative to the proximal LR and the centromere.
This phenomenon will be observed as a distortion of the expected marker segregation onrearranged chromosomes. This might explain the severe distortion of some of our mappingmarkers and the fact that 36% of the tested markers show varying levels of distortion. Themajority of the markers showing some degree of distortion are found in the "mega-linkagegroup" described above. At a LOD score 3 5.0, both maps break up into 14 ("M53") and 15
40

("SF5") linkage groups (these remain stable up to a LOD score of 10). Depending on therelative position of translocation breakpoints and centromeres (Fig. 2), the crossing overfrequency and the percentage of most homozygous gametes at the translocation breakpoints,the "mega-linkage group" would produce up to 15 fragments behaving as autonomous linkageunits at increasing LOD scores (Fig. 2, computer simulations).
In fact, the mechanism responsible for the resulting segregation has not yet beencompletely understood. Chromosomes having suffered translocation(s) and normalchromosomes will migrate to opposite poles; all resulting gametes will thus inherit a completeset of genes and gametic viability and fertility will be high. Non-homologous, translocated,alleles will migrate towards the same pole. The resulting gametes will inherit one normal andone translocated chromosome, thus their gene sets will harbour duplications of genes andsuffer loss of genes, and differential gametic viability and fertility will depend on the relativeimportance of the duplicated and/or lost genome segments.
In conclusion, both the probability of rinding unwanted linkages and the strength of theselinkages may increase. As a corollary, the precision of QTL localization will be adverselyaffected.
4.2. Molecular markers
Comparing both maps from different sub-species hybrids, it has been noted, as expected,that collinearity of co-dominant markers (RFLP, Microsatellites) is highly conserved. Theefficiencies of the different marker systems, RFLP and microsatellites, in a comparativemapping approach are roughly equivalent [7].
The usefulness of microsatellite derived markers is emphasised by the utilization ofrelatively simple laboratory techniques (polymerase chain reaction(PCR), non radioactivedetection, potential for automated analysis) compared to RFLP markers [6,7]. Detectingmicrosatellite loci is expensive, but using already established markers is cost effective.Nevertheless, development of microsatellite markers is currently limited in plants, in general,by the number of available published sequence data for most species. This is particularly thecase for tropical crops such as banana, but an increasing number of research groups areworking on the molecular characterisation of these and there is no doubt that more DNAsequences will be available in the near future.
RAPD and AFLP techniques have in common the ability to rapidly produce a greatnumber of signals which can be scored. These data can- be introduced into evaluationalgorithms in order to be analysed statistically. These analyses are the bases of identificationsystems, genetic diversity estimations and mapping. These markers are, however,"anonymous", random markers, meaning that the fragments produced in these assays must bescored as dominant (presence vs. absence) markers. To identify the specific loci, and to identifythe homologous alleles of the specific loci, one must invest more effort into sub-cloning andeventually sequencing these fragments, producing cleaved amplified polymorphic sites (CAPS)and sequence characterized amplified regions (SCARs). This is the main reason these markersystems are good identification tools for clonal identification or to assist breeding of near-isogenic lines (NTLs). In a mapping approach they may be used to rapidly saturate a frame mapbased on co-dominant markers, knowing that the information deficiency of dominant markers,as compared to co-dominant markers in a F2 type mapping approach, decreases confidence inQTL map positions and marker order.
41
A complete comprehensive map of Musa spp. will be attainable through the comparisonof several maps based on parents with different karyotypes. This can not be accomplished by asingle research group. Thus, we are selecting a subset of our co-dominant markers, spaced 10-20 cM apart, to construct a "frame map" which could be easily saturated using AFLP, as anexample. Eventually this "anchor marker set" is bound to be distributed to interestedresearchers in a cooperative research effort. Forty-five STMS from CIRAD are published inthe EMBL database and accessible via "http://www.ebi.ac.uk/" using keywords LAGODA andMICROSATELLITE (EMBL accessions X87258 to X87265, X90740 to X90750 and Z85950to Z85977).
The different maps eventually produced could be compared through the relativelocalisation of the same anchor markers. The comparative data resulting from these effortsshould be used to map translocation breakpoints in order to produce a Musa consensus or coremap.
5. CONCLUSION
An almost complete map harbouring eleven linkage groups, ideally corresponding to thebasic number of chromosome (n=ll) has been produced. The total length is about 1200 cM.Significant levels of segregation distortion were observed, particularly for AFLP markers.Those distortions could be related to the two translations observed on meiotic preparationsof M53 and SFB5 [4].
No structural differences could be detected between the 'SFB5' and 'M53' maps. Thisallowed the straightforward construction of a frame-map of the Musa genome. It nowcomprises 119 loci with 94 RFLP, 24 microsatellites and one isozyme. The density of co-dominant markers will have to be improved for a couple of linkage groups.
The development of PCR-based markers is a key objective of our mapping program.AFLP technology also appears to be a fast and powerful tool for saturating the "frame-map".A mean of 33 markers were revealed for each primer pair and about 10% could be consideredto be co-dominant. It is probable that a combination of SCARs from AFLP and microsatelliteswill be used in the future to transfer genotyping "to the field".
The difficulties with breeding improved triploid cultivars are now easy to understand.Classical strategies involve crossing a diploid accession (e.g., wild type), usually a fertile oneshowing some desirable trait, onto a good triploid recipient cultivar having good femalerestitution. Other strategies include breeding improved diploids, both cultivated and wild typeaccessions, in order to reconstruct triploid cultivars by crossing the improved diploid onto atetraploid, artificially induced or not. Insufficient knowledge about the genomic origins andcomposition of diploid and polyploid cultivars complicates the choice of the best diploidmaterials for desirable introgressions. The overall effects of structural hybridity, as shown, willinterfere with the breeders efforts at recombining and transferring desirable traits from wild andcultivated diploids, sometimes forcing them, unwittingly, to attempt bridging crosses tocircumvent these reproductive barriers or to avoid apparent linkage of undesirable traits. Onthe other hand, translocations can also be used to the breeder's advantage for the transfer, orlocalization, of particular gene loci [1].
As far as breeding Musaceae is concerned, molecular markers have proven to beinvaluable tools. Having these tools handy, breeders, the real work is still to be done!
42

REFERENCES
[I] GONZALEZ-DE-LEON, D. and FAURE, S. "Genetic Mapping of the Banana DiploidGenome: toward an integrated approach to the study of the Musa genome and the use ofmolecular marker technologies in Musa breeding", Proceedings of the Workshop on"Biotechnology Applications for Banana and Plantain Improvement", San Jose, Costa Rica,27-31 January 1992 (edited by INJJBAP, Montpellier, France) (1993) 29-51.
[2] SIMMONDS, N.W. The Evolution of the Bananas, Longmans, London, UK (1962).[3] CARREEL, F. Etude de la diversite genetique des bananiers (genre Musa) a l'aide de
marqueurs RFLP, Ph.D. Thesis, INA, Paris-Grignon, France (1994).[4] FAURE, S. Contribution a la cartographie genetique du genome des bananiers diploides
(Musa acuminatd) a l'aide de marqueurs moleculaires, Ph.D. Thesis, Ecole NationaleSuperieure Agronomique de Rennes, N°9310, SerieC, N° de Serie 23. Rennes, France(1993).
[5] FAURE, S., NOYER, J.L., HORRY, J.P., BAKRY, F., LANAUD, C, and GONZALEZDE LEON, D. A molecular marker-based linkage map of diploid bananas (Musa acuminata),Theoretical and Applied Genetics 87 (1993) 517-526.
[6] LAGODA, P.J.L., NOYER, J.L., DAMBJER, D., BAURENS, F.C., and LANAUD, C."Abundance and distribution of simple sequence repeats in the Musaceae family:microsatellite markers to map the banana genome", The Use of Induced Mutations andMolecular Techniques for Crop Improvement (Proc. Symp. Vienna, 1995) IAEA, Vienna,Austria, 287-295.
[7] KAEMMER, D., FISCHER, D., JARRET, R.L., BAURENS, F.C., GRAPIN, A.,DAMBIER, D., NOYER, J.-L, LANAUD, C, KAHL, G., and LAGODA, P.J.L. MolecularBreeding in the Genus Musa: a strong case for STMS marker technology, Euphytica 96(1997)49-63.
[8] HORRY, J.P. Chimiotaxonomie et organisation genetique dans le genre Musa. UniversiteParis XI, Centre d'Orsay, France (1989) 95pp.
[9] STAM, P. Construction of integrated genetic linkage maps by means of a new computerpackage: Joinmap, Plant Journal 3 (5) (1993) 739-744.
[10] ALEXANDER, M.P. Differential staining of aborted and nonaborted pollen, Stain Technol.44(1969)117-122.
II1] BURNHAM, C.R. Chromosomal interchanges in plants, Bot. Rev. 22 (1956) 419-552.
43
GENERATION AND APPLICATION OF SSR MARKERS IN AVOCADO
D. SHARON, U. LAVIInstitute of Horticulture, ARO Volcani Center,Bet-Dagan, Israel
P.B. CREGANUnited States Department of Agriculture, Agricultural Research Service,Beltsville, Maryland, United States of America
J. HILLELFaculty of Agriculture, Hebrew University of Jerusalem,Rehovot, Israel
Abstract
Simple Sequence Repeat (SSR) DNA markers were generated and applied to avocado. An SSRmarker is based on a pair of primers which are synthesized on the basis of DNA sequences flanking amicrosatellite. These markers are PCR based, quite polymorphic and abundant in several species. Theseare the markers of choice in the human genome. The number of SSR markers in the avocado genomewas calculated to be about 45,000, with the A/T microsatellite being the most frequent (1 in 40 kb).SSR markers are quite expensive to generate due to the required multi-step procedure; Screening agenomic library, about 66% of the positive clones turned out after sequencing to be SSR containingclones. In only about 55% of these, was it possible to synthesize primers and, of this group, only about50% of the markers were useful for typing a specific family. Typing of five avocado cultivars using 59SSR markers results in one to eight alleles per locus, mean heterozygosity ranging between 0.51 and0.66 and gene diversity ranging between 0.42 and 0.66. The SSR markers were used to estimate thegenetic relationships between various Persea species. The number of alleles in these species rangedbetween five and twelve with heterozygosity levels between 0.11- 0.78 and gene diversity between 0.69-0.89. A preliminary genetic map, based on these SSR markers together with some DNA fingerprints(DFP) and randomly amplified polymorphic DNA (RAPD) markers, was drawn. The map consists of12 linkage group having two to five markers each. Linkage analysis with several quantitative trait loci(QTLs) was performed by genetic typing and phenotypic assessment of the progeny of a controlledcross. The result of the interval mapping suggests that the gene(s) coding for the existence of fibers inthe flesh, are probably linked to linkage group 3.
1. INTRODUCTION
Avocado (Persea americana Mill.) is a sub-tropical fruit-tree, with 24 chromosomes(2n=24) and haploid genome size of 8.83 x 10⁸ bp. The classical avocado breeding programsare inefficient mainly because of a long juvenile phase, large tree size and limited geneticknowledge. These obstacles may be alleviated by applying marker assisted selection (MAS).
In the last few years, four types of genetic markers have been used in avocado. Degani etal. [1] used isozyme markers mainly to study the level of selfing and out-crossing in 'Fuerte'.Furneir et al. [2] used two restriction fragment polymorphism loci (RFLP) loci to study therelationships between Persea species and between avocado cultivars. DNA fingerprints (DFP),using multilocus minisatellite and microsatellite probes were applied for identification ofcultivars and races [3] and for detection of linkage between a gene affecting fruit skin colorand a specific DFP band [4].
45
Simple sequence repeat (SSR) markers have been shown to be highly polymorphic inhuman [5], animals [6] and plants. Preliminary studies of simple sequence repeat markers infruit-trees were carried out: two SSR markers were isolated from a cross between lemon andorange and found to be polymorphic between citrus and related species [7]. Thomas and Scott[8] isolated five microsatellite loci from grapevine and found that the heterozygosity level ofthese loci ranged between 69% and 88%. Lavi et al, [9] generated 30 dinucleotidemicrosatellite markers and demonstrated the high level of polymorphism of two of them.
In this study, we present the generation of avocado-specific SSR and the application ofthese markers for genetic analyses as well as construction of the first integrated genetic linkagemap of avocado.
2. MATERIALS AND METHODS
2.1. Plant material
Trees were grown at the Akko Experiment Station and the Agricultural ResearchOrganization, Bet Dagan, Israel. Leaves were taken from 50 offspring of the cross'Pinkerton'x'Ettinger' and from the following Persea species: P. brobonia, P. cinerascens, P.floccosa, P. gigantea, P. indica, P. longipes, P. nubigena, P. schiedeana, P. schiedeana 05,P. schiedeana 06, P. steyermarkii Allen.
2.2. DNA isolation
DNA was isolated from very young leaves using the CTAB (cetyltrimethyl ammoniumbromide) method [10], following a few modifications [3].
2.3. DNA fingerprinting
Ten micrograms of DNA were digested with Hinjl restriction endonuclease. Electrophoresisand hybridization are detailed elsewhere [4].
2.4. Randomly amplified polymorphic DNA (RAPD) markers
Reaction mixes for RAPD markers contained 30 ng of genomic DNA, 1.5 mM Mg2+,0.2 mM of primer, 250 mM of each nucleotide, IX Taq buffer (containing 20 mM (NH^SCU,75 mM Tris-HCl, pH 9.0, 0.1% Tween) and 0.5 unit of Taq DNA polymerase in a totalvolume of 25ml. The reaction mixes were overlaid with 40ml of mineral oil. Reactions were
denatured at 94°C for 3 min before cycling which consisted of a 1 min denaturation at 94°C, 1
min annealing at 36°C, and 1 min extension at 72°C for 44 cycles. Cycles were followed by an
extension step for 5 min at 72°C. Amplification products were analyzed by electrophoresis in1.5% agarose gels and detected by staining with ethidium bromide. RAPD primers used arefrom set #7 (numbered 601-700) of the University of British Columbia.
2.5. Genomic library
Genomic DNA of 'Pinkerton' was cut with the restriction enzyme Sau3AL DNAfragments were size selected on agarose gels and fragments (400-600bp) were cloned inpBluescript IIKS+ and transformed into E. coli Inv-a strain. Transformants were grown in LBmedia with 50mg/ml Ampicillin. White colonies were transferred into microtiter plates and
46

stamped onto Hybond N+. Colonies were grown, lysed, denatured and neutralized. Membranes
were hybridized to end-labeled g -^p oligonucleotide probes. Probes were: (A)30, (CT)io,
(GT)io, (CAC)6, (TCC)6, (TCT)6, (GATA)4, (GACA)4 and (GGAT)4-
2.6. SSR definition
Sequences of positive clones were searched for any type of repeated sequences. A repeatwas identified as an SSR if the number of repeats (n)>14 for mononucleotide repeat, (n)>6 fordi-nucleotide repeats, (n)>3 for tri-nucleotide repeats and (n)>2 for tetra-nucleotide (or more)repeats.
2.7. Selection and synthesis of primers
SSR-containing clones were analyzed using the Primer Detective Software or PRIMER
0.5. Primers having melting temperatures of at least 60°C and which would amplify productswith predicted lengths of 75-210bp were synthesized.
2.8. Genotyping
PCR reaction mixes for SSR markers contained 30 ng of genomic DNA, 1.5 mM Mg^+,0.15 mM of 3 ' and 5' end primers, 100 mM of each nucleotide, 200mg/ml BSA, 0.1 ml of
3,000 Ci/mmol a-32P dCTP, IX Taq buffer (containing 50 mM Tris-HCl, pH 9, 0.1% TritonX-100), and one unit of Taq DNA polymerase in a total volume of 10ml. The reaction mixeswere overlaid with 20ml of mineral oil. Reactions were denatured at 94°C for 30 s beforecycling which consisted of a 15 s denaturation at 95°C, 25 s annealing at 45°C or 50°C(depending on the primers), and 25 s extension at 68°C for 32 cycles. This was followed by anextension step for 2 min at 68°C. Ten ml of loading buffer (95% formamide; 0.02 M EDTA,pH 8; 1% bromophenol blue; 1% xylene cyanol; and 10 mM NaOH) were added and 3 ml ofthe reaction were loaded on a DNA sequencing gel containing 6% polyacrylamide, 8 M ureaand lxTBE and electrophoresed at 50 Watt for three to four hours. Gels were dried andexposed over-night to an Fuji X-ray film. The length of the SSR alleles was determined using asequence ladder of Ml 3 as size marker.
2.9. Heterozygosity analysis
Gene Diversity (GD) was calculate according to [11]: GD = 1-Spi^ where pi is thefrequency of the i th pattern. Heterozygosity level was calculated as the proportion ofheterozygote genotypes from all tested genotypes.
2.10. Evolutionary analysis
Phylogenetic trees was performed using the maximum parsimony method with the'PAUP' software.
2.11. Map construction
For map construction, two-point analyses of all possible combinations were performedusing MAPMAKER/EXP 3.0 (12) and JoinMap (13). Linkage was determined when the LODscore was >3.0. Linkage analysis of loci that showed significant deviation from Mendelian
47
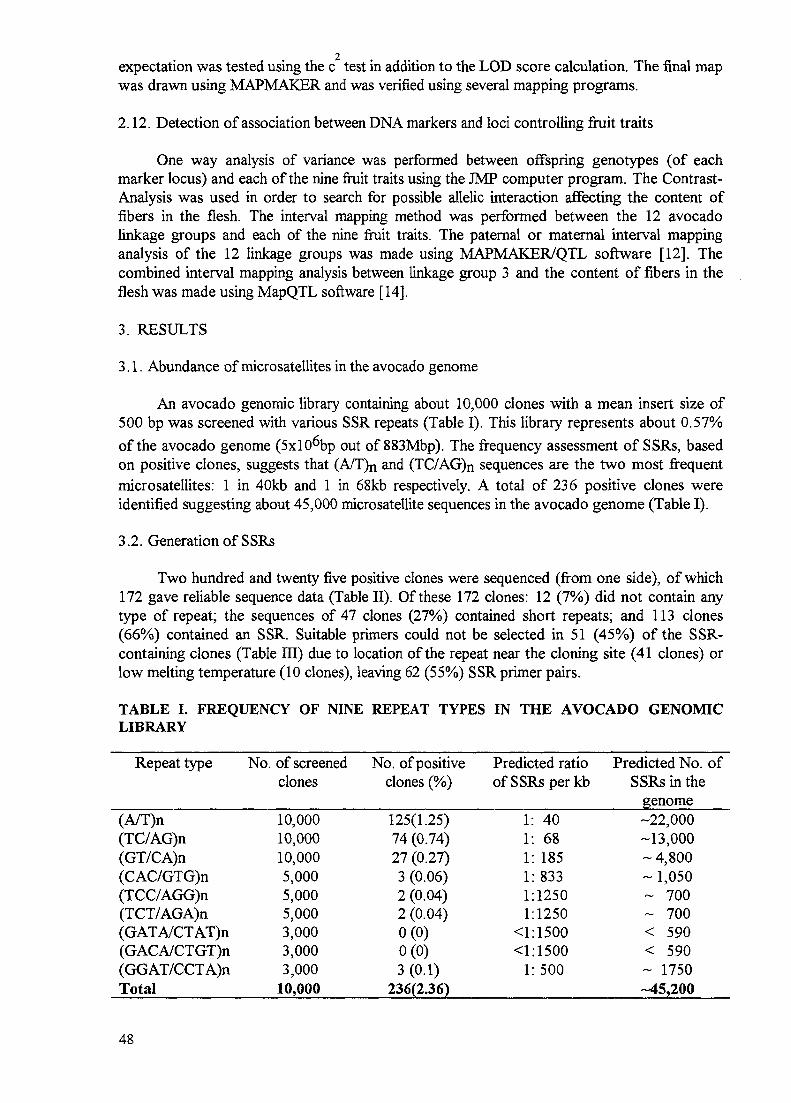
expectation was tested using the c test in addition to the LOD score calculation. The final mapwas drawn using MAPMAKER and was verified using several mapping programs.
2.12. Detection of association between DNA markers and loci controlling fruit traits
One way analysis of variance was performed between offspring genotypes (of eachmarker locus) and each of the nine fruit traits using the JMP computer program. The Contrast-Analysis was used in order to search for possible allelic interaction affecting the content offibers in the flesh. The interval mapping method was performed between the 12 avocadolinkage groups and each of the nine fruit traits. The paternal or maternal interval mappinganalysis of the 12 linkage groups was made using MAPMAKER/QTL software [12]. Thecombined interval mapping analysis between linkage group 3 and the content of fibers in theflesh was made using MapQTL software [14].
3. RESULTS
3.1. Abundance of microsatelHtes in the avocado genome
An avocado genomic library containing about 10,000 clones with a mean insert size of500 bp was screened with various SSR repeats (Table I). This library represents about 0.57%
of the avocado genome (5xl0^bp out of 883Mbp). The frequency assessment of SSRs, basedon positive clones, suggests that (A/T)n and (TC/AG)n sequences are the two most frequentmicro satellites: 1 in 40kb and 1 in 68kb respectively. A total of 236 positive clones wereidentified suggesting about 45,000 microsatellite sequences in the avocado genome (Table I).
3.2. Generation of SSRs
Two hundred and twenty five positive clones were sequenced (from one side), of which172 gave reliable sequence data (Table II). Of these 172 clones: 12 (7%) did not contain anytype of repeat; the sequences of 47 clones (27%) contained short repeats; and 113 clones(66%) contained an SSR. Suitable primers could not be selected in 51 (45%) of the SSR-containing clones (Table III) due to location of the repeat near the cloning site (41 clones) orlow melting temperature (10 clones), leaving 62 (55%) SSR primer pairs.
TABLE I. FREQUENCY OF NINE REPEAT TYPES IN THE AVOCADO GENOMICLIBRARY
Repeat type
(A/T)n(TC/AG)n(GT/CA)n(CAC/GTG)n(TCC/AGG)n(TCT/AGA)n(GATA/CTAT)n(GACA/CTGT)n(GGAT/CCTA)nTotal
No. of screenedclones
10,00010,00010,0005,0005,0005,0003,0003,0003,000
10,000
No. of positiveclones (%)
125(1.25)74 (0.74)27 (0.27)3 (0.06)2 (0.04)2 (0.04)0(0)0(0)3(0.1)
236(2.36)
Predicted ratioof SSRs per kb
1: 401: 681: 1851: 8331:12501:1250
<l:1500<l:1500
1: 500
Predicted No. ofSSRs in the
genome-22,000-13,000- 4,800- 1,050~ 700~ 700< 590< 590- 1750-45,200
48

TABLE II. FROM POSITIVE CLONES TO SSR-CONTAINING CLONES
TC/AG GT/CA Others Compound Percent
No. of positive clonesGood sequenceNo repeatShort repeatSSR-containing clones
66512
1039
2115258
99513
108125
100%7%
27%66%
TABLE III. FROM SSR-CONTAINING SEQUENCES TO PRIMERS
SSR-containingsequencesSSR near thecloning sitePrimers not foundPrimers werefound
A/T51
15
630
TC/AG33
14
217
GT/CA6
2
22
Others9
4
05
Compound14
6
08
Percent100%
36%
9%55%
The 62 SSR markers which were developed in this study, combined with 29 from aprevious avocado library [9], and one from the 5' region of the cellulase gene (GenBank data)were used to analyse the avocado genome.
3.3. Polymorphism and heterozygosity levels in SSR loci
Fifty nine avocado SSR loci were used to analyse the polymorphism and heterozygositylevel of the avocado genome. The dinucleotide repeats (AG)n are the most polymorphic SSR
loci (of those examined) in avocado and thus presented the highest mean number of alleles perlocus and highest Gene Diversity value (Table IV). The mean heterozygosity in the fivecultivars was estimated to be 62%, and varied between 58% and 70%. 'Horshim' was thecultivar with the highest level of heterozygosity (Table V). In summary, the analysis of 59 lociin five cultivars indicated an average of 3.4 alleles per locus and a mean heterozygosity of62%.
TABLE IV. IDENTIFICATION OF SSR MARKERS IN FIVE AVOCADO CULTIVARS
Gene Diversity
0.660.420.560.550.56
Average No. ofalleles (range)
4.1 (1-8)3.0(1-6)2.5 (1-5)2.6 (1-4)
3.4
No. ofmarkers
291974
59
Repeat element
(AG)n
(A)nCompound
OthersSum
49
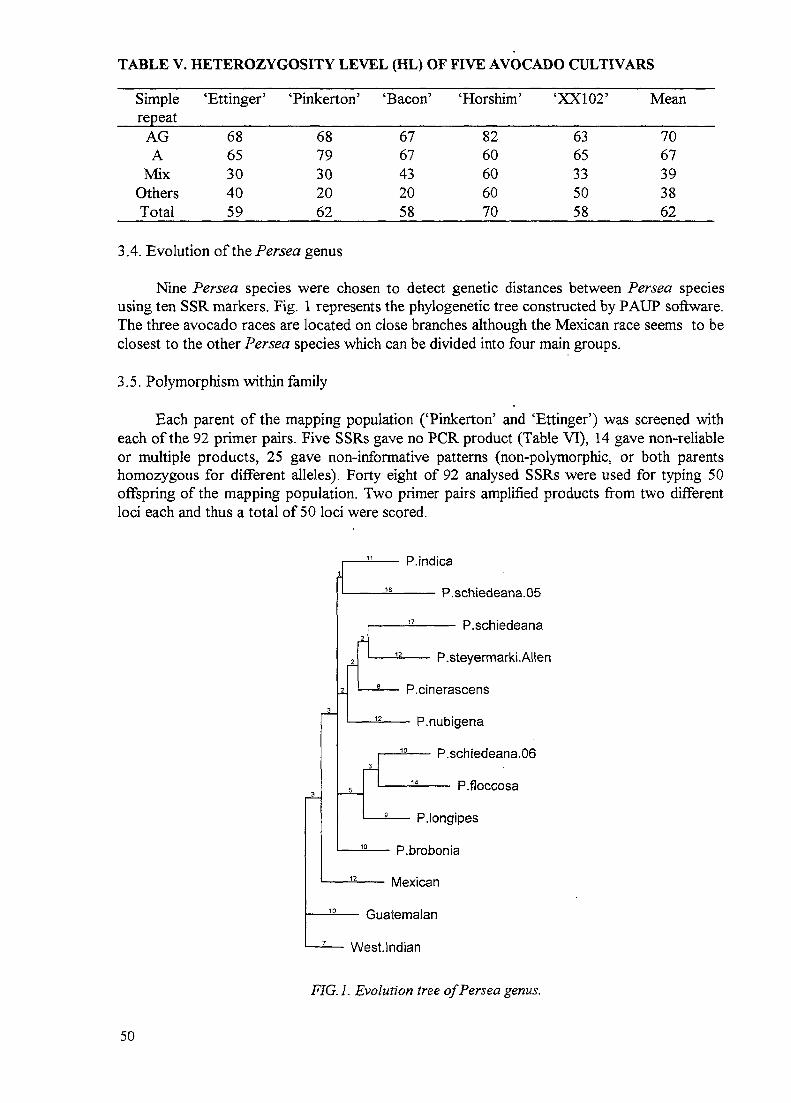
TABLE V. HETEROZYGOSITY LEVEL (HL) OF FIVE AVOCADO CULTIVARS
Simplerepeat
AGA
MixOthersTotal
'Ettinger'
6865304059
'Pinkerton'
6879302062
'Bacon'
6767432058
'Horshim'
8260606070
'XX102'
6365335058
Mean
7067393862
3.4. Evolution of the Persea genus
Nine Persea species were chosen to detect genetic distances between Persea speciesusing ten SSR markers. Fig. 1 represents the phylogenetic tree constructed by PAUP software.The three avocado races are located on close branches although the Mexican race seems to beclosest to the other Persea species which can be divided into four main groups.
3.5. Polymorphism within family
Each parent of the mapping population ('Pinkerton' and 'Ettinger') was screened witheach of the 92 primer pairs. Five SSRs gave no PCR product (Table VI), 14 gave non-reliableor multiple products, 25 gave non-informative patterns (non-polymorphic, or both parentshomozygous for different alleles). Forty eight of 92 analysed SSRs were used for typing 50offspring of the mapping population. Two primer pairs amplified products from two differentloci each and thus a total of 50 loci were scored.
P.indica
P.schiedeana.05
— P.schiedeana
P.steyermarki .Allen
P.cinerascens
- P.nubigena
— P.schiedeana.06
— - P.fioccosa
'• P.longipes
- P.brobonia
Mexican
Guatemalan
West.lndian
FIG.l. Evolution tree of Persea genus.
50
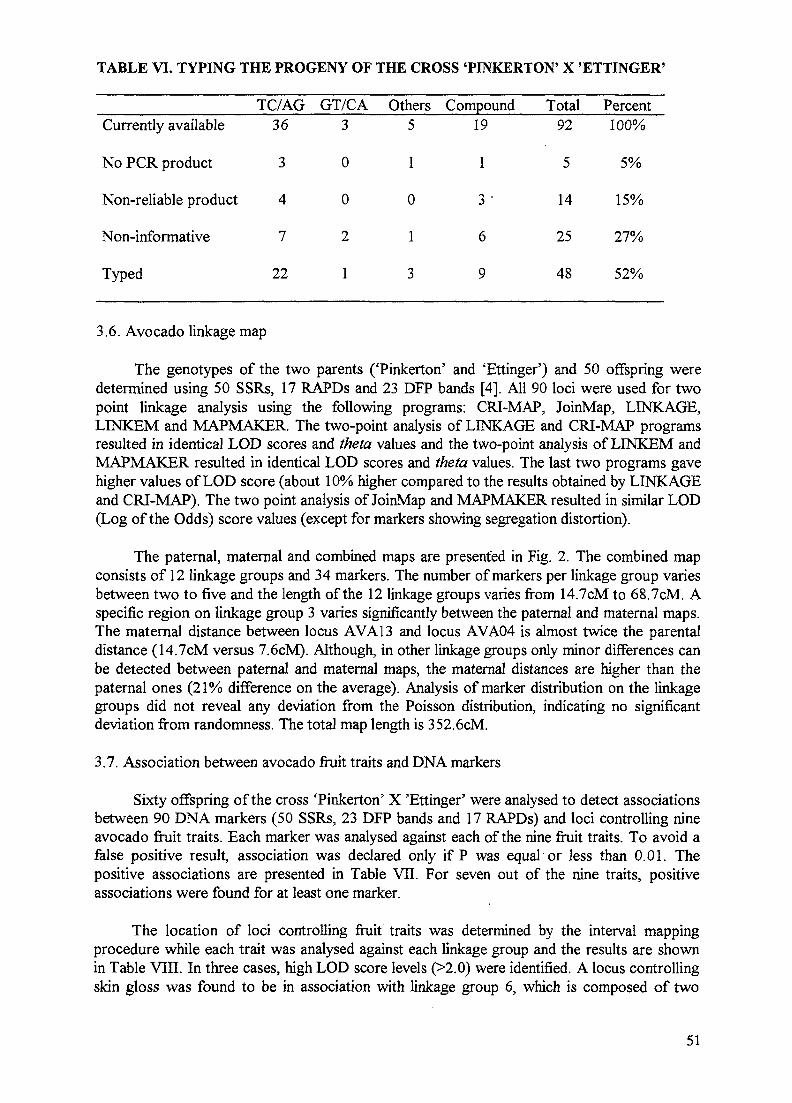
TABLE VI. TYPING THE PROGENY OF THE CROSS 'PINKERTON' X 'ETTINGER'
Currently available
No PCR product
Non-reliable product
Non-informative
Typed
TC/AG36
3
4
7
22
GT/CA3
0
0
2
1
Others5
1
0
1
3
Compound19
1
3 •
6
9
Total92
5
14
25
48
Percent100%
5%
15%
27%
52%
3.6. Avocado linkage map
The genotypes of the two parents ('Pinkerton' and 'Ettinger') and 50 offspring weredetermined using 50 SSRs, 17 RAPDs and 23 DFP bands [4]. All 90 loci were used for twopoint linkage analysis using the following programs: CRI-MAP, JoinMap, LINKAGE,LINKEM and MAPMAKER. The two-point analysis of LINKAGE and CRI-MAP programsresulted in identical LOD scores and theta values and the two-point analysis of LINKEM andMAPMAKER resulted in identical LOD scores and theta values. The last two programs gavehigher values of LOD score (about 10% higher compared to the results obtained by LINKAGEand CRI-MAP). The two point analysis of JoinMap and MAPMAKER resulted in similar LOD(Log of the Odds) score values (except for markers showing segregation distortion).
The paternal, maternal and combined maps are presented in Fig. 2. The combined mapconsists of 12 linkage groups and 34 markers. The number of markers per linkage group variesbetween two to five and the length of the 12 linkage groups varies from 14.7cM to 68.7cM. Aspecific region on linkage group 3 varies significantly between the paternal and maternal maps.The maternal distance between locus AVA13 and locus AVA04 is almost twice the parentaldistance (14.7cM versus 7.6cM). Although, in other linkage groups only minor differences canbe detected between paternal and maternal maps, the maternal distances are higher than thepaternal ones (21% difference on the average). Analysis of marker distribution on the linkagegroups did not reveal any deviation from the Poisson distribution, indicating no significantdeviation from randomness. The total map length is 352.6cM.
3.7. Association between avocado fruit traits and DNA markers
Sixty offspring of the cross 'Pinkerton' X 'Ettinger' were analysed to detect associationsbetween 90 DNA markers (50 SSRs, 23 DFP bands and 17 RAPDs) and loci controlling nineavocado fruit traits. Each marker was analysed against each of the nine fruit traits. To avoid afalse positive result, association was declared only if P was equal or less than 0.01. Thepositive associations are presented in Table VTI. For seven out of the nine traits, positiveassociations were found for at least one marker.
The location of loci controlling fruit traits was determined by the interval mappingprocedure while each trait was analysed against each linkage group and the results are shownin Table VIII. In three cases, high LOD score levels (>2.0) were identified. A locus controllingskin gloss was found to be in association with linkage group 6, which is composed of two
51

1E
DFP02 -
21 .7
D F P 0 8 -
12.5
DFP1 0 -
10.3
DFP0 5 -
24.2
DFP13
2C E
AVAGD6 -8.9
AVGO31 -6.0
AVMIX01 -
33.9
AVAGD9
9.4
AVA0358.1
7.4
5.0
24.9
7.9
3c
14.7
11.6
24.1
AVA13 -
9.6
10.5
,AVAG10 -
18.4
IAVAGD7
38.5
E
7.6
1 1 .1
4p
AVAG15II
20.2
AVAG19
22.9
AVA09
43.0
68.7
5
EAVMIX04
21.8
AVAC22
21.7
6P
DFP0 3-
21.7
PAPD10
21.7
7E
AVAG15I
19.3
RAPD0719.3
8
EAVAG24 -
5.8AVA10 -
13.1
PAPD14-18.9
9
pAVAG20 ~
17.0
AVAG2117.0
10E
AVAG05 -
15.9
AVA02 -
15.9
11E
AVAG18 -
15.1
AVA07 -15.1
12p
AVAG02
14.7
AVA0514.7
FIG. 2. Avocado genetic linkage groups. E- 'Ettinger' map, P- 'Pinkerton' map, C- Combined map.Distances between markers are in CentiMorgan.
52
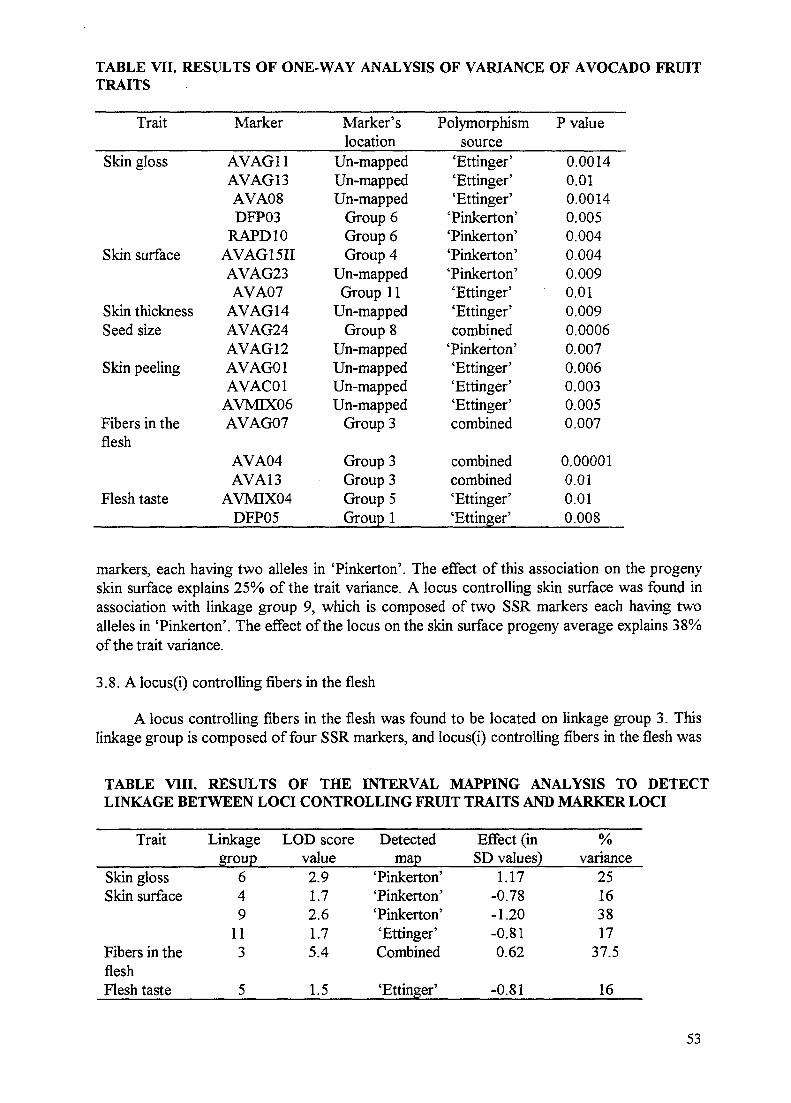
TABLE VII. RESULTS OF ONE-WAY ANALYSIS OF VARIANCE OF AVOCADO FRUITTRAITS
Trait
Skin gloss
Skin surface
Skin thicknessSeed size
Skin peeling
Fibers in theflesh
Flesh taste
Marker
AVAG11AVAG13AVA08DFP03
RAPD10AVAG15IIAVAG23AVA07
AVAG14AVAG24AVAG12AVAG01AVAC01
AVMIX06AVAG07
AVA04AVA13
AVMTX04DFP05
Marker'slocation
Un-mappedUn-mappedUn-mapped
Group 6Group 6Group 4
Un-mappedGroup 11
Un-mappedGroup 8
Un-mappedUn-mappedUn-mappedUn-mapped
Group 3
Group 3Group 3Group 5Group 1
Polymorphismsource
'Ettinger''Ettinger''Ettinger'
'Pinkerton''Pinkerton''Pinkerton''Pinkerton''Ettinger''Ettinger'combined
'Pinkerton''Ettinger''Ettinger''Ettinger'combined
combinedcombined'Ettinger''Ettinger'
P value
0.00140.010.00140.0050.0040.0040.0090.010.0090.00060.0070.0060.0030.0050.007
0.000010.010.010.008
markers, each having two alleles in 'Pinkerton'. The effect of this association on the progenyskin surface explains 25% of the trait variance. A locus controlling skin surface was found inassociation with linkage group 9, which is composed of two SSR markers each having twoalleles in 'Pinkerton'. The effect of the locus on the skin surface progeny average explains 38%of the trait variance.
3.8. A locus® controlling fibers in the flesh
A locus controlling fibers in the flesh was found to be located on linkage group 3. Thislinkage group is composed of four SSR markers, and locus(i) controlling fibers in the flesh was
TABLE VIII. RESULTS OF THE INTERVAL MAPPING ANALYSIS TO DETECTLINKAGE BETWEEN LOCI CONTROLLING FRUIT TRAITS AND MARKER LOCI
Trait
Skin glossSkin surface
Fibers in thefleshFlesh taste
Linkagegroup
649
113
5
LOD scorevalue2.91.72.61.75.4
1.5
Detectedmap
'Pinkerton''Pinkerton''Pinkerton''Ettinger'Combined
'Ettinger'
Effect (inSD values)
1.17-0.78-1.20-0.810.62
-0.81
%variance
25163817
37.5
16
53
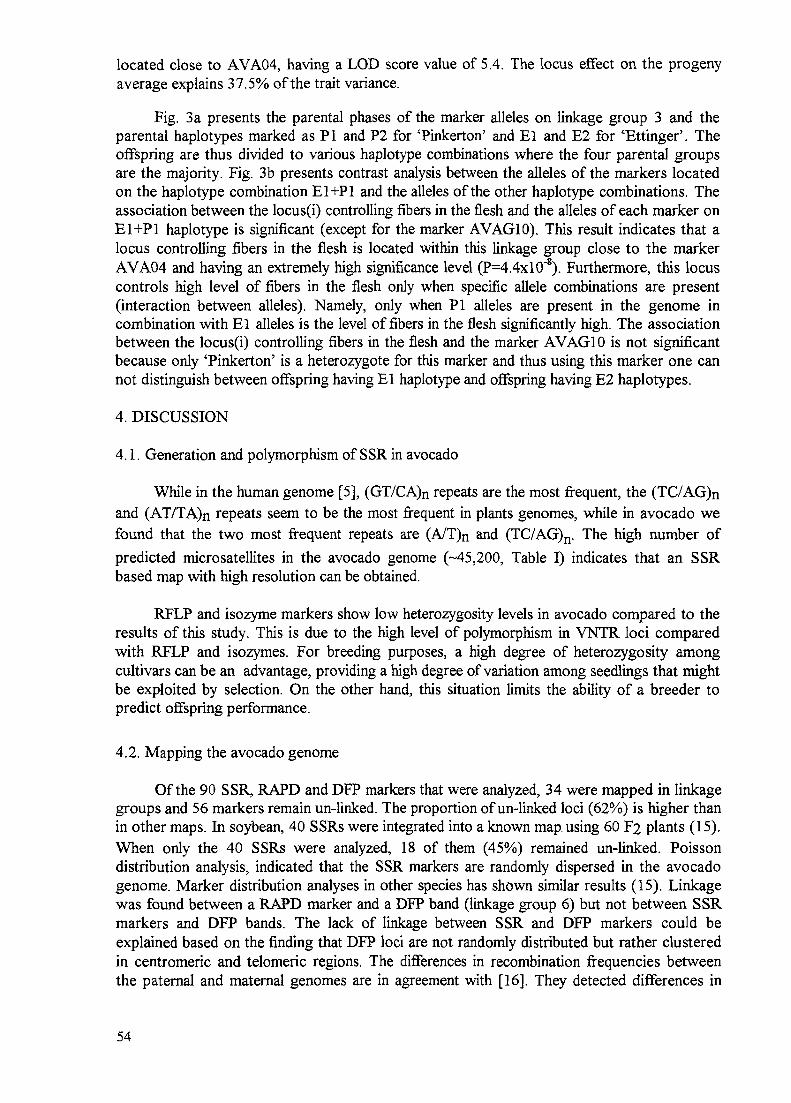
located close to AVA04, having a LOD score value of 5.4. The locus effect on the progenyaverage explains 37.5% of the trait variance.
Fig. 3 a presents the parental phases of the marker alleles on linkage group 3 and theparental haplotypes marked as PI and P2 for 'Pinkerton' and El and E2 for 'Ettinger'. Theoffspring are thus divided to various haplotype combinations where the four parental groupsare the majority. Fig. 3b presents contrast analysis between the alleles of the markers locatedon the haplotype combination El+Pl and the alleles of the other haplotype combinations. Theassociation between the locus(i) controlling fibers in the flesh and the alleles of each marker onEl+Pl haplotype is significant (except for the marker AVAG10). This result indicates that alocus controlling fibers in the flesh is located within this linkage group close to the markerAVA04 and having an extremely high significance level (P=4.4xlO"8). Furthermore, this locuscontrols high level of fibers in the flesh only when specific allele combinations are present(interaction between alleles). Namely, only when PI alleles are present in the genome incombination with El alleles is the level of fibers in the flesh significantly high. The associationbetween the locus(i) controlling fibers in the flesh and the marker AVAG10 is not significantbecause only 'Pinkerton' is a heterozygote for this marker and thus using this marker one cannot distinguish between offspring having El haplotype and offspring having E2 haplotypes.
4. DISCUSSION
4.1. Generation and polymorphism of SSR in avocado
While in the human genome [5], (GT/CA)n repeats are the most frequent, the (TC/AG)nand (AT/TA)n repeats seem to be the most frequent in plants genomes, while in avocado wefound that the two most frequent repeats are (A/T)n and (TC/AG)n. The high number of
predicted micro satellites in the avocado genome (-45,200, Table I) indicates that an SSRbased map with high resolution can be obtained.
RFLP and isozyme markers show low heterozygosity levels in avocado compared to theresults of this study. This is due to the high level of polymorphism in VNTR loci comparedwith RFLP and isozymes. For breeding purposes, a high degree of heterozygosity amongcultivars can be an advantage, providing a high degree of variation among seedlings that mightbe exploited by selection. On the other hand, this situation limits the ability of a breeder topredict offspring performance.
4.2. Mapping the avocado genome
Of the 90 SSR, RAPD and DFP markers that were analyzed, 34 were mapped in linkagegroups and 56 markers remain un-linked. The proportion of un-linked loci (62%) is higher thanin other maps. In soybean, 40 SSRs were integrated into a known map using 60 F2 plants (15).When only the 40 SSRs were analyzed, 18 of them (45%) remained un-linked. Poissondistribution analysis, indicated that the SSR markers are randomly dispersed in the avocadogenome. Marker distribution analyses in other species has shown similar results (15). Linkagewas found between a RAPD marker and a DFP band (linkage group 6) but not between SSRmarkers and DFP bands. The lack of linkage between SSR and DFP markers could beexplained based on the finding that DFP loci are not randomly distributed but rather clusteredin centromeric and telomeric regions. The differences in recombination frequencies betweenthe paternal and maternal genomes are in agreement with [16]. They detected differences in
54
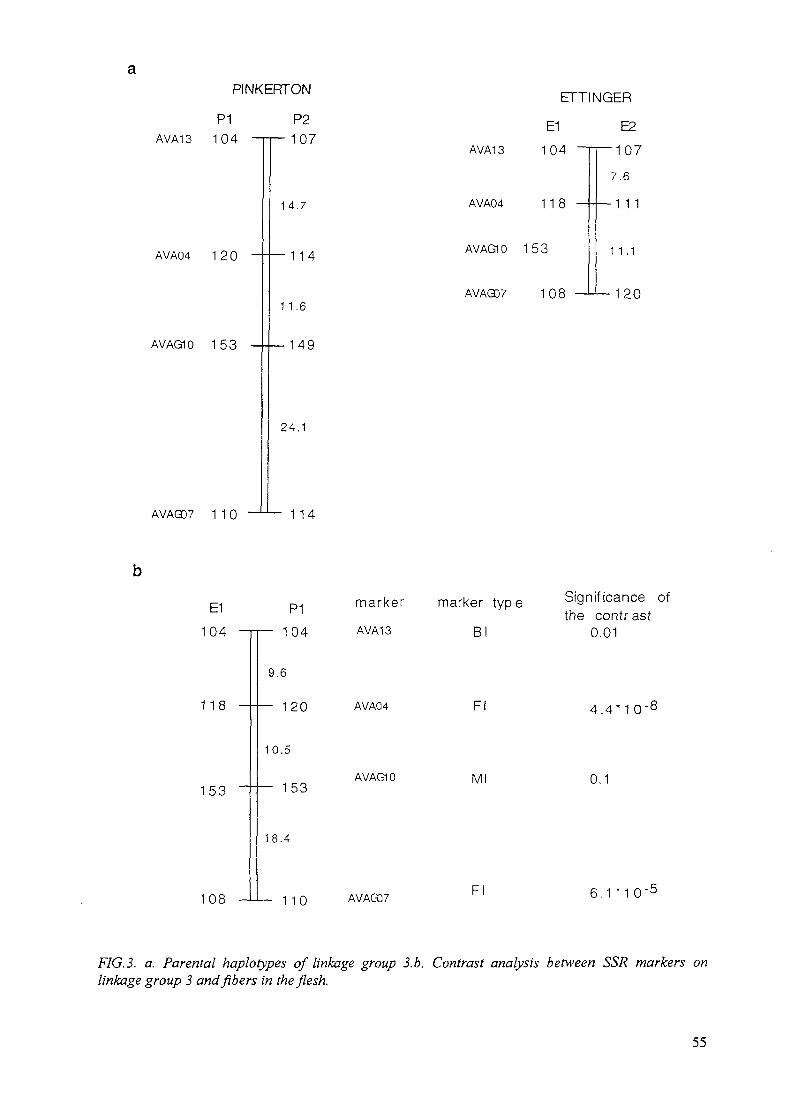
PINKERTON
P1AVA13 1 0 4
AVA04 1 2 0
AVAG10 1 5 3
AVAG07 1 1 0
P2
107
14.7
114
11.6
149
24.1
1 14
ETTINGER
E1 E2
AVA13 104
AVA04 1 1
AVAG10 153
AVAQD7 108
-107
7.6
-1 1 1
1 1 .1
120
b
E1
104
118
153
108
PI
104
9.6
- 120
10.5
153
18.4
marker marker type
AVA13 Bl
AVA04
AVAG10
-) 1 0 AVAQD7
Fl
Ml
Fl
Significance ofthe contr ast
0.01
4.4*1
0.1
6 . 1 * 1 0 -5
FIG. 3. a. Parental haplotypes of linkage group 3.b. Contrast analysis between SSR markers onlinkage group 3 and fibers in the flesh.
55
recombination frequency in tomato using the same cultivar as either the female or the maleparent.
None of the computer mapping programs available to date can efficiently map thegenome of an out-crossing species using polymorphic markers. The mapping approach whichwe used to map the avocado genome consists of transforming the avocado Fl mapping data toBC1 data which meet the MAPMAKER requirements. The result of this analysis was verifiedusing other computer programs and found to be reliable. The loblolly pine genome, which isanother out-crossing species, was mapped using the JoinMap computer [17]. This computerprogram is capable of analysing this data set, except for markers with segregation whichdeviates from Mendelian expectations.
4.3. Avocado fruit traits linked to DNA markers
The detection of association between genetic markers and QTLs is complicated infamilies resulting from a cross between heterozygote parents [18]. The main problems includestype I error in which a QTL is falsely detected as linked to a marker, and type II error inwhich no linkage is detected even though such linkage does exist [19]. Type I error is caused,in most of the cases, by using a high number of loci and a high number of traits and a type IIerror results from the demand of only high LOD score and P values. Thus QTLs which are farfrom the marker or have a small effect on the trait would not be detected. In the present study,90 markers and nine traits (total of 810 pairwise comparisons), were detected. A significantvalue of 6.2x10'5 should be used to avoid type I error. This value should be corrected due tothe existence of 12 linkage group having 34 linked markers (612 pairwise comparisons)resulting in a significant value of 8.2xlO"5. However, this high P value can cause a type II errorand thus association between loci controlling fruit traits and DNA markers having a P value ofP=0.01 or less were presented. The only association in which this P value was less than 8.2x10"5 is the one between linkage group 3 and the locus controlling fibers in the flesh on which wefocused for further studies.
To verify the results, we used two statistical approaches: one-way analysis of varianceand interval mapping. In most cases when association was found in the one-way analysis ofvariance it was also detected by the interval mapping except for two cases: the associationbetween the marker AVAG24 and locus controlling seed size, and between the DFP markerDFP05 and locus controlling flesh taste. In these two cases there were only two alleles of themarkers in the family, and the LOD score values of the interval mapping analysis were between0.5 and 1. In one case, skin surface on linkage group 9, an association was detected by theinterval mapping but could not be detected in the one-way analysis of variance. Although, asignificant P value (PO.05) could be detected, we did not consider this value as an indicationfor association.
It is noteworthy that no association was detected between fruit weight and any of themarker loci using both statistical approaches (P values of 0.02 and 0.03 were detected withtwo markers). On the other hand, there was a significant difference in the mean fruit weightbetween the offspring and the parents. This negative result can be explained by the finding thatthe trait is highly affected by the environment and heritability is quite low (20). Mhameed et al.[4] reported that no linkage was found between DFP bands and fruit weight even for(0.01<P<0.05) in this family. This result is compatible with the results obtained in this workand marked the difficulty in detecting markers which are linked to a locus controlling fruitweight.
56

In the case of the existence of fibers in the flesh, the offspring average is slightly higherthan the parents performance, suggesting that a dominant component is involved in thedetermination of the trait. The Contrast Analysis suggested that three out of the four genotypegroups of the marker AVA04, showed a low level of fibers in the flesh while the fourth group,having haplotypes El and PI, showed a high level of fibers in the flesh. This result can beexplained by a negative dominant factor which is located on the haplotypes E2 and P2 and thusthe fibers level of the offspring having one of those haplotypes is low compared with theoffspring that lack these haplotypes.
The results presented in this study emphasize the importance of using highly polymorphicmarkers especially for map construction and detection of linkage with QTLs. The SSR markerswhich were used in this study, allow better detection of association with QTL compared withRPLP, RAPD or DFP markers.
REFERENCES
[1] DEGANI, C, GOLDRING, A., ADATO, I., EL-BATSRI, R., and GAZIT, S. Pollenparent effect on outcrossing rate, yield, and fruit characteristics of 'Fuerte' avocado,HortScience 25 (1990) 471-473.
[2] FURNTER, G.H., CUMMINGS, M.P., and CLEGG, M.T. Evolution of the avocados asrevealed by DNA restriction site variation, J. Hered. 81 (1990)183-188.
[3] LAVI, IX, HILLEL, J., VATNSTEIN, A., LAHAV, E., and SHARON, D. Application ofDNA fingerprints for identification and analysis of avocado, J. Amer. Soc. Hoit. Sci. 116(1991) 1078-1081.
[4] MHAMEED, S., HILLEL, J., LAHAV, E., SHARON, D., and LAVI, U. Geneticassociation between DNA fingerprint fragments and loci controlling agriculturallyimportant traits in avocado {Persea americana Mill.), Euphytica 81 (1995) 81-87.
[5] HUDSON, T.J., STEIN, L.D., GERETY, S.S., MA, I , CASTLE, A. B., SILVA, I ,SLONIM, D.K., BAPTISTA, R., KRUGLYAK, L., XU, S.H., HU, X, COLBERT,A.M.E., ROSENBERG, C, REEVE-DALY, M.P., ROZEN, S., HUI, L., WU, X.,VESTERGAARD, C , WILSON, K.M., BAE, J.S., MARITA, S., GANIATSAS, S.,EVANS, C.A., DEANGELIS, M.M., INGALLS, K.A., NAHF, R.W., HORTON, L.T.,ANDERSON, M.O., COLLYMORE, A.J., YE, W., KOUYOUMJIAN, V.,ZEMSTEVA, I.S., TAM, J., DEVINE, R., COURTNEY, D.F., RENAUD, M.T.,NGUYEN, H., O'CONNOR, T.J., FIZAMES, C, FAURE, S., GYAPAY, G., DIB, C ,MORISSETTE, J., ORLIN, J.B., BIRREN, B.W., GOODMAN, N., WEISSENBACH,J., HAWKINS, T.L., FOOTE, S., PAGE, D.C., and LANDER, E.S. An STS-based mapof the human genome, Science 270 (1995) 1945-1954.
[6] DIETRICH, W., KATS, H., LINCOLN, S.E, SHIN, H.S., FRIEDMAN, J.,DRACOPOLI, N.C., and LANDER, E.S. A genetic map of the mouse suitable for typingintraspecific crosses, Genetics 131 (1992) 423-447.
[7] KIJAS, J.M.H., FOWLER, J.C.S., and THOMAS, M.R. An evaluation of sequencetagged microsatellite site markers for genetic analysis within Citrus and related species,Genome 38 (1995) 349-355.
[8] THOMAS, M.R. and SCOTT, N.S. Microsatellite repeats in grapevine reveal DNApolymorphisms when analysed as sequence-tagged sites (STSs), Theor. Appl. Genet. 86(1993) 985-990.
[9] LAVI, U., AKKAYA, M., BHAGWAT, A., LAHAV, E., and CREGAN, P.B.Methodology of generation and characteristics of simple sequence repeat DNA markersin avocado {Persea americana M.), Euphytica 80 (1994) 171-177.
57
[10] MURRAY, M.G., and THOMPSON, W.F. Rapid isolation of high molecular weightplant DNA, Nucleic Acids Res. 8 (1980) 4321-4325.
[11] RONGWEN, J., AKKAYA, M.S., BHAGWAT, A.A, LAVI, U., and CREGAN, P.B.The use of microsatellite DNA markers for soybean genotype identification, Theor. Appl.Genet. 90(1995)43-48.
[12] LANDER, E.S., GREEN, P., ABRAHAMSON, J., BARLOW,. A., DALEY, M.,LINCOLN, S., and NEWBURG, L. MAPMAKER: an interactive computer package forconstructing primary genetic linkage maps of experimental and natural populations,Genomics 1 (1987) 174-181.
[13] STAM, P., and VAN OOIJEN, J.W. JoinMap™ version 2.0: Software for thecalculation of genetic linkage maps, CPRO-DLO, Wageningen, (1995).
[14] VAN OOIJEN, J.W., and MOLIEPAARDM, C. MapQTL ™ version 3.0: Software forthe calculation of QTL positions on genetic maps, CPRO-DLO, Wageningen (1996).
[15] AKKAYA, M.S., SHOEMAKER, R.C., SPECHT, J.E., BHAGWAT, A.A., andCREGAN, P.B. Integration of simple sequence repeat DNA markers into a soybeanlinkage map, Crop Sci. 35 (1995) 1439-1445.
[16] DE-VICENTE, M.C., and TANKSLEY, S.D. Genome-wide reduction in recombinationof backcross progeny derived from male versus female gametes in an interspecific crossof tomato, Theor. Appl. Genet. 83 (1991) 173-178.
[17] GROOVER, A., DEVEY, M., FIDDLER, T., LEE, J., MEGRAW, R., MITCHEL-OLDS, T., SHERMAN, B., VUJCIC, S., WILLIAMS, C, and NEALE, D.Identification of quantitative trait loci influencing wood specific gravity in an outbredpedigree of loblolly pine, Genetics 138 (1994)1293-1300.
[18] LEONARDS-SCHIPPERS, C , GIEFFERS, W., SCHAFER-PREGL, R., RITTER, E.,KNAPP, S.J., SALAMINI, F., and GEBHARDT, C. Quantitative resistance toPhytophthora infestans in potato: A case study for QTL mapping in an allogamous plantspecies, Genetics 137 (1994) 67-77.
[19] JANSEN, R.C. Controlling the type I and type II errors in mapping quantitative traitloci, Genetics 138 (1994) 871-881.
[20] LAVL U., LAHAV, E., GENIZI, A., DEGANI, C, GAZIT, S., and HILLEL, J.Quantitative genetic analysis of traits in avocado cultivars, Plant Breeding 106 (1991)149-160.
58

DNA FINGERPRINTING OF SUGARCANE FOR DETECTINGMOLECULAR EVIDENCE OF SOMACLONAL VARIATION
M. RAMOS LEAL, E. CANALES, R. MICHEL, 0. COTO, M.T. CORNIDENational Center for Scientific Research,Havana, Cuba
XA9848411Abstract
Molecular characterisation of eight sugarcane mutants which tolerate 1% NaCl, was performedby means of restriction fragment length polymorphism (RFLP) analysis at the genomic level, using agroup of molecular probes for ribosomal DNAs and two others, A-pyrroline-5-carboxylate reductase(AP5CR) and ATPase, probably related to salinity stress tolerance. Results showed the molecularevidence of genetic changes in comparison to the susceptible donor variety and the possible presence ofmore than one mechanism to tolerate salt stress.
1. INTRODUCTION
Plants vary in their ability to withstand and survive in saline environments. The possibilityof using somaclonal variation for obtaining new tolerant genotypes (via in vitro selection) hasoffered a new approach to focus on this problem. Sugarcane is the most important crop inCuba. At the same time, very important areas are affected by high levels of salinity in soil.
A group of salt tolerant mutants has been obtained, derived from a donor variety highlysusceptible to salt stress [1]. Agromorphological, physiological and biochemical analyses haveconfirmed the results obtained in field trials concerning the high level of salt tolerance of thesenew genotypes. Nevertheless, taking into account the discrepancies about the existence ofsomaclonal variation, during the development of this contract (1995-1997), our first approachwas to evidence molecular changes induced by somaclonal variation. We have detected thepossible role of several genes, probably involved in the resistance response to osmotolerance(for review, see [2]), by means of restriction fragment length polymorphism (RFLP) analysisand established several genetic inferences.
2. MATERIALS AND METHODS
2.1. Plant material
A group of eight salt tolerant mutants (Table I) was obtained and analyzed by RFLPpatterns. The highly susceptible donor plant (C 87-51) was used as standard control.
TABLE I. GENOTYPES EMPLOYED FOR THE MOLECULAR CHARACTERIZATION
Highly susceptible donor variety Salt tolerant mutants
C 87-51 CC 03-84 CC 54-84 CC 59-84 CC 70-84
CC19-84 CC 56-84 CC 07-84 CC 74-84
59
2.2. Genomic DNA analysis
Genomic DNA was isolated using the procedure of Doyle and Doyle [3]. The genomicDNA was digested with the enzymes EcoRl, EcoKV, BamHl and Hindm, ANDelectrophoresed according to Sambrook et al. [4]. The DNAs were transferred to positively-charged nylon membranes (Amersham), according to Southern [5].
2.3. Hybridization
As heterologous probes, we used the maize ribosomal DNA probes (rDNA GL-1 andrDNA GL-26) kindly supplied by G. Beaulieu (Univ. Washington); A-pyrroline-5-carboxylatereductase (AP5CR) and ATPase, kindly supplied by R. Slocum and C. Leaving, respectively.DNA probes were labelled with alpha-32P-dATP by random primer. After hybridization, themembranes were washed and exposed to X-ray film.
Statistical analysis was performed by means of the factor analysis of correspondences(FAC) (STATITCF version 4.0). For each enzyme-probe combination, the observedpolymorphic fragments were transformed into a 1 (present) and 0 (absent) matrix.
3. RESULTS
The autoradiograph of the blotted DNAs exposed to the ribosomal probes visualizedseveral major bands.
3.1. rDNA GL-26
The hybridization of HindlTI and iscoRI-digested DNA detected differences for thesomaclonal mutants studied. Various RFLPs are observed, indicating heterogeneity in the salttolerant mutant population obtained. HindHI-digested DNA showed the absence of the lowerband in four mutants. EcoRl digestion gave three bands, showing the absence of the seconduppermost band in four mutants.
3.2. rDNA GL-1
HindSl digestion of the sugarcane DNA gave five fragments, identical in length for allindividuals, except for genotypes CC 70-84 and CC 74-84. BamHS. digests showed cleardifferences between the susceptible donor variety and the somaclones. The mutants containedseveral extra fragments in the three uppermost bands, absent in the donor variety. EcdECVdigestion also showed differences in the two uppermost bands. EcoRl digestion gave fivefragments and the main difference is signalled by an extra fragment present in almost all newgenotypes, but absent in the donor variety.
3.3. AP5CR
Concerning the autoradiograph of the blotted HindHI-digested DNAs exposed to theAP5CR probe, the lanes 3, 5 and 7 have differences in the second band in comparison to thedonor variety and also the lanes 3 and 7 regarding the band 5. BamHL digestion presented afew differences between the donor susceptible variety and three somaclones. EcdRV digestiongave four fragments. Bands 3 and 4 were absent in the genotypes: CC 07-84, CC 70-84 andCC 74-84. EcdRl digestion gave three fragments identical in length for all nine individuals.
60

3.4. ATPase
Hindlll digestion of the sugarcane DNA gave four fragments identical in length for allindividuals, except for genotype CC 19-84. BaniHl digests showed differences between thedonor variety and the somaclones CC 03-84, CC 19-84, CC 59-84 and CC 70-84, due to theabsence of two bands. EcoRV digestion also showed absence of bands in three mutants. EcoBJdigestion gave three fragments and the main difference is signalled by absence of the lowerfragment.
The factor analysis of correspondences (FAC) provided a location of the mutants inrelation to the susceptible donor variety (Fig. 1). Two groups were observed: one group whichcontains the mutants CC 19-84, CC 56-84, CC 59-84 and CC 07-84, CC 70-84 and CC 74-84.The other group is formed by the donor variety C 87-51 and the mutants CC 03-84 and CC54-84. Moreover, the three axes express around 62% of the total variability.
4. DISCUSSION
The use of rDNA probes evidenced the presence of genetic changes induced viasomaclonal variation, which can be useful for salinity stress tolerance. Proline accumulation isone of the most important osmoprotectants in response to salt stress. Taking into account thatAP5CR is the last enzyme in proline synthesis [2], differences in the AP5CR patterns amongthe mutants and the donor variety confirmed alterations in the proline synthesis response [1].Plasma membrane ATPase activity has shown changes in response to salt stress. The ATPasepatterns could suggest the possible role of the transport-associated function to salinity stress.
Our next step will be to finish with at least three additional specific probes, probablyclosely related to salinity stress (osmotin, heat shock gene and betaine aldehydedehydrogenase) and to establish inferences related to genetic distances among the mutants andthe susceptible donor variety.
A new approach for this contract will be to produce progeny, combining one of the salttolerant mutants with the donor variety. Mutants can be considered as near isogenic lines(NILs), in relation to the donor susceptible variety. In this sense, study can be directed towardthe evaluation via bulked segregation analysis (BSA).
FIG. I.Distribution of sugarcane mutants and the donor variety in planes (1,2) of a FAC using RFLPdata.
61
ACKNOWLEDGEMENTS
This work was supported in part by an IAEA Contract No. 8137/RB to MRL. Theauthors wish to thank Drs. G. Beaulieu, Univ. of Washington; R. Slocum, Univ. ofMassachusetts and C. Leaving at North Carolina State Univ., for kindly supplying themolecular probes used in this work.
REFERENCES
[1] DIAZ, P., MARIBONA, R.H., CORNIDE, M.T., COTO, O., MICHEL, R., andLEONARD, H. Obtainment of salt tolerant somaclones of sugarcane, Preliminary reportto the Acad. Sci. of Cuba (1996).
[2] WINICOV, I. "Gene expression in relation to salt tolerance", Stress-induced geneexpression in plants, Chap. 3 (BASRA, A.S., Ed.), Harwood Acad. Pub., Switzerland(1994) 61-85.
[3] DOYLE and DOYLE, J. A plant DNA mini- preparation, Plant Molec. Biol. Reporter 1(1983) 19-21.
[4] SAMBROOK, J., FRITSCH, E.F. and MANIATIS, T., Molecular Cloning: ALaboratory Manual, Second Edition, Cold Spring Harbor Laboratory, Cold SpringHarbor, NY (1989).
[5] SOUTHERN, E., Detection of specific sequences among DNA fragments separated bygel electrophoresis. I Mol. Biol. 98 (1975) 503-509.
[6] HANSON, A.D., MAY, AM., GRUMET, R., BODE, J., JAMESON, G.C., andRHODES, D., Betaine synthesis in chenopods: localization in chloroplasts, Proc. Natl.Acad. Sci. 82 (1985) 3678-3682.
62

THE EXAMINATION OF HEVEA BRASIHENSIS PLANTS XA98484 2
PRODUCED BY IN VITRO CULTURE AND MUTAGENESISBY DNA FINGERPRINTING TECHNIQUES
F.C. LOW, S. ATAN, H. JAAFARBiotechnology and Strategic Research Division,Rubber Research Institute of Malaysia,Kuala Lumpur, Malaysia
Abstract
Rubber (Hevea brasiliensis) plants derived from anther and ovule culture as well as gamma-irradiated plants were examined by several DNA marker techniques. These include restriction fragmentlength polymorphisms (RFLPs), random amplified polymorphic DNA (RAPD), sequence taggedmicrosatellite sites (STMS), DNA amplification fingerprinting (DAF) and amplified fragment lengthpolymorphisms (AFLPs). Compared to control plants produced by vegetative propagation (cutting andbudding), plants produced by in vitro culture appeared to have a reduction in the number of rDNA loci.Two RAPD protocols were compared and found to be similar in amplification of the major DNA bands.After confirmation that the RAPD method adopted was reproducible, the technique was applied to thepresent studies. Eight out of the 60 primers screened were able to elicit polymorphisms between pooledDNA from in vitro culture plants. Variations in DNA patterns were observed between pooled DNAsamples of anther-derived plants as well as between anther-derived and ovule-derived plants.Comparisons of RAPD patterns obtained between anther-derived plants exposed to increasing dosagesof gamma-irradiation with non irradiated anther-derived plants revealed distinct DNA polymorphisms.The changes in DNA profiles did not appear to be correlated to the dosage of irradiation. Sincesomaclonal variation was detected, it was difficult to identify changes which were specifically caused byirradiation. Application of the STMS technique to tag microsatellite sequences (GA)n, (TA)n and(TTA)n in the hydroxymethylglutaryl coenzyme A reductase-1 (hmgr-1) gene failed to detect differencesbetween plants derived from anther and ovule culture. Although restriction endonuclease digestions withmethylation sensitive enzymes suggested that four in vitro culture plants examined exhibited similardigestion patterns as the controls, a change in cytosine methylation in one anther-derived plant wasdetected. Examination of individual in vitro culture plants by the DAF technique revealed geneticheterogeneity among these plants. Differences in DNA profiles between anther-derived and ovule-derived plants were also detected. In general, more somaclonal variations were detected in anther-derived than ovule-derived plants. When the DAF technique was applied to DNA obtained from leavesof irradiated budded stumps, DNA profiles were shown to be different from non irradiated controls.Whilst DNA patterns of samples irradiated at the same dosage displayed similar DNA patterns, thesevaried with increasing dosage. Examination of in vitro culture plants by AFLPs confirmed earlierresults that somaclonal variations were present in Hevea.
1. INTRODUCTION
Hevea brasiliensis Muell Arg., a member of the Euphorbiaceae family, is an importanteconomic crop of Southeast Asia. H. brasiliensis is traditionally cultivated for the productionof natural rubber, but more recently, it has emerged as a valuable renewable source of timber.Because planting of unselected seedlings yields uneconomic plantations, all commercialcultivation is carried out through vegetative propagation, that is by budding a desirable trunkclone to a seedling root stock. For further enhancement of productivity, a further budding of adesirable crown (canopy) clone to the trunk is often practised, resulting in a three-part tree [1].Budding however, is a skilled and labour intensive exercise. In vitro culture was envisaged asan alternative method for mass propagation to circumvent the requirement for skilled labour aswell as an avenue for Hevea crop improvement. Tissue culture of Hevea was initiated nearlyfour decades ago [2,4]. Although early success was limited [5], plants produced from in vitro
63

culture have been established in field trials in China and Malaysia. As far as we are aware,these in vitro culture plants have not been examined at the DNA level.
The present study was undertaken to determine whether Hevea plants produced by invitro culture were true to type (i.e., genetically identical) via DNA fingerprinting techniques.At the same time, DNA fingerprinting would also be employed as an early selection criterionfor improved characteristics after mutagenesis through gamma-irradiation. Several DNAfingerprinting techniques were utilized. These included a hybridization-based technique namelyrestriction fragment length polymorphisms (RFLPs) [6] and polymerase chain reaction (PCR)-based techniques such as random amplified polymorphic DNA (RAPD) [7-8], sequence taggedmicrosatellite sites (STMS) [9-10], DNA amplification fingerprinting (DAF) [11] andamplification fragment length polymorphism (AFLP) [12].
2. MATERIALS AND METHODS
2.1. Plant materials
A random selection of 59 in vitro culture plants which were derived from both antherand ovule culture of H. brasiliensis clone GL1 were examined. These plants were 36 monthsold at the initiation of this investigation and were already field planted at the Rubber ResearchInstitute of Malaysia Experiment Station at Sungei Buloh. Plants of the same clone, butpropagated vegetatively by cutting and bud-grafting, acted as controls.
2.2. Production of mutagenic plants by gamma-irradiation
Anthers of H. brasiliensis clone RRIM 600 were gamma-irradiated at 1-4 gray at thetherapy unit of the Malaysian Institute for Nuclear Technology (MINT). The irradiated antherswere then cultured in vitro for plantlet production [13]. Leaves from two irradiated (anther-derived) plants at each dosage were sampled and their DNA fingerprints were compared withnon-irradiated in vitro culture plants as controls.
Similarly, budded stumps of if. brasiliensis clone RRIM 905 were gamma-irradiated at5-25 Gy at MINT as described [14].The irradiated budded stumps were then planted out inthe field. Leaves which developed subsequently were harvested and used for DNAfingerprinting studies. DNA profiles from bifoliate leaves obtained from six RRIM 905 gamma-irradiated budded stumps were compared with DNA from bifoliate leaves from two non-irradiated budded stumps of the same clone as well as regular trifoliate leaves from untreatedcontrols.
2.3. DNA and RFLP methods
DNA samples were isolated by the procedure of Low et al [15], with adaptations fromInstitut fur Genbiologische Forschung (IGF), Berlin. Quality of the isolated DNA wasascertained by analysis in agarose gel electrophoresis as well as its susceptibility to digestion by.EcoRI. DNA for RFLP analysis was digested overnight at 37°C with various restrictionenzymes according to the manufacturer's instructions. Restriction enzyme digestion wascarried out at a concentration of 10 units of restriction enzyme per ug of DNA, in the presenceof 5mM spermidine and 100 ug/ml casein. Other RFLP methods were similar to thosedescribed earlier [ 16,17].
64

Simple sequence oligonucleotides were generated by concatemerisation of the basicrepeating unit to sequences of several kilobases by PCR and used as probes for RFLP analysis[18]. The clone pTa71 which contains a 9 kb EcoRl fragment of ribosomal DNA (rDNA) fromwheat, Triticum aestivum [19] was recloned into pUC19 and was a generous gift from Flavelland O'Dell (John Innes Centre, Norwich, UK). This was used as a hybridization probe ondigested DNA of in vitro culture plants.
2.4. PCR-based fingerprinting techniques
All PCR-based marker techniques, except AFLP, were carried out as described [17].Examination of genomic DNA from in vitro culture and control plants by the RAPD techniquewas carried out with two different protocols [7,20]. All amplifications were preceded by "hotstart" and executed with random hexamer primers (Operon Technologies, USA).Amplification products were analyzed after electrophoresis in 2% agarose gels in lxTBEbuffer as well as in 10% denaturing polyacrylamide gels containing 1.6M urea in lxTBEfollowed by silver nitrate staining.
Amplification of microsatellite regions by STS was carried out according to Low et al[21] with primers flanking the regions of interest [17].
The DAF technique was carried out according to the procedure of Caetano-Anolles et al[11] and random hexamer primers, in various combinations of primer-pairs were tested fortheir ability to elicit DNA polymorphism as described [17].
2.5. AFLP analysis
Hevea DNA samples were digested with EcoRl and Msel for AFLP analysis which wascarried out by the radioactive y -33P-ATP procedure [18] using an AFLP Analysis System 1 kit(Gibco BRL, USA).
3. RESULTS
3.1. Production of mutagenic plants from gamma-irradiated anthers
A total of 2281 anthers were irradiated with gamma-rays at between 1-4 Gy. In vitroculture of the irradiated anthers yielded 573 embryoids, representing 47% embryogenesis.Twenty-seven plantlets were produced, with eight plants being planted in the field. DNA wasisolated from leaves of these plants for DNA fingerprinting analysis.
3.2. Polymorphisms between gamma-irradiated and non irradiated budded stumps
Normal Hevea plants have trifoliate leaves. Occasionally, transient emergence of bifoliateleaves could be observed without treatment of the plant. These bifoliate leaves would revert totheir regular trifoliate form after a time, without treatment. The reason for this transientexpression is unclear and remains a topic of interest.
DAF profiles of normal, non-irradiated plants which had trifoliate leaves were shown todiffer from those rarer, non-irradiated plants which had bifoliate leaves (Fig. 1). Similarly,bifoliate leaves derived from gamma-irradiated budded stumps displayed a different DNAfingerprint from those obtained from bifoliate leaves of control, non-irradiated plants. Though
65
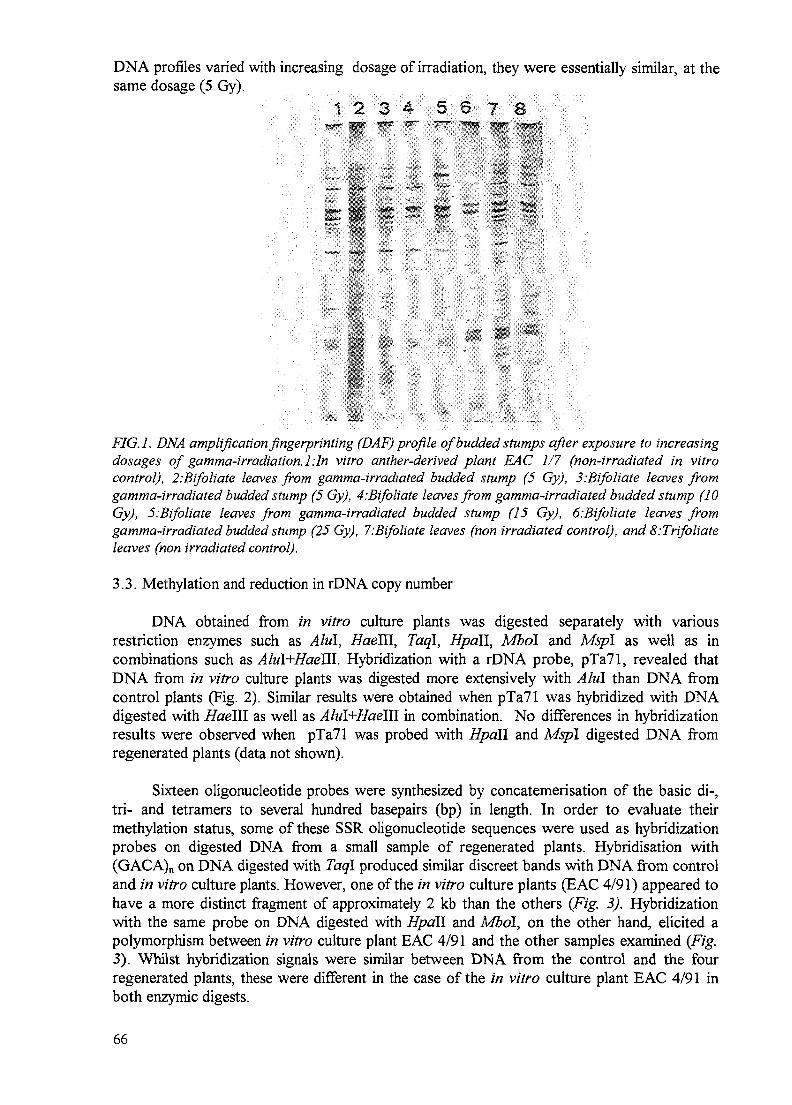
DNA profiles varied with increasing dosage of irradiation, they were essentially similar, at thesame dosage (5 Gy).
12 3 4 5 6 7 8~. fgp
8*
•Xp '-•••
FIG.l. DNA amplification fingerprinting (DAF) profile of budded stumps after exposure to increasingdosages of gamma-irradiation. l:ln vitro anther-derived plant EAC 1/7 (non-irradiated in vitrocontrol), 2:Bifoliate leaves from gamma-irradiated budded stump (5 Gy), 3:Bifoliate leaves fromgamma-irradiated budded stump (5 Gy), 4:Bifoliate leaves from gamma-irradiated budded stump (10Gy), 5-.Bifoliate leaves from gamma-irradiated budded stump (15 Gy), 6-.Bifoliate leaves fromgamma-irradiated budded stump (25 Gy), '/'.Bifoliate leaves (non irradiated control), and 8:Trifoliateleaves (non irradiated control).
3.3. Methylation and reduction in rDNA copy number
DNA obtained from in vitro culture plants was digested separately with variousrestriction enzymes such as Alul, HaeTH, Taql, Hpall, Mbol and Mspl as well as incombinations such as Alul+Haelll. Hybridization with a rDNA probe, pTa71, revealed thatDNA from in vitro culture plants was digested more extensively with Alul than DNA fromcontrol plants (Fig. 2). Similar results were obtained when pTa71 was hybridized with DNAdigested with Haelll as well as Alul+HaelU in combination. No differences in hybridizationresults were observed when pTa71 was probed with Hpall and Mspl digested DNA fromregenerated plants (data not shown).
Sixteen oligonucleotide probes were synthesized by concatemerisation of the basic di-,tri- and tetramers to several hundred basepairs (bp) in length. In order to evaluate theirmethylation status, some of these SSR oligonucleotide sequences were used as hybridizationprobes on digested DNA from a small sample of regenerated plants. Hybridisation with(GACA)n on DNA digested with Taql produced similar discreet bands with DNA from controland in vitro culture plants. However, one of the in vitro culture plants (EAC 4/91) appeared tohave a more distinct fragment of approximately 2 kb than the others (Fig. 3). Hybridizationwith the same probe on DNA digested with Hpall and Mbol, on the other hand, elicited apolymorphism between in vitro culture plant EAC 4/91 and the other samples examined (Fig.3). Whilst hybridization signals were similar between DNA from the control and the fourregenerated plants, these were different in the case of the in vitro culture plant EAC 4/91 inboth enzymic digests.
66

kb
FIG. 2. A reduction in rDNA loci number as revealed bypTa.71, after hybridisation with Alul-digestedDNAfrom (a)five in vitro culture and (b) five control plants.
M 1 2 3 4 5 8 1 2 3 4 5 8 1 2 3 4 5 8
4.3- )•'•• ' •
FIG. 3. Polymorphism as revealed by SSR oligonucleotide probe (GACA)n after hybridisation withDNA digested with (A) TaqI (B) Hpall and © Mbol. 1: Control (cutting); 2: In vitro culture plant IVPI; 3: In vitro culture plant IVP14; 4: In vitro culture plant EAC 4/91; 5: In vitro culture plant EAC18/90; 6: In vitro culture plant EAC 34/90.
67

3.4. RAPD polymorphism in tissue culture plants
With the incorporation of "hot start", RAPD results were more reproducible and the number ofamplified bands was also reduced. Reproducibility of the RAPD technique after the abovemodifications was demonstrated when five sets of duplicate samples of genomic DNAs,obtained from independent extractions were amplified by the RAPD technique and subjected topolyacrylamide gel electrophoresis (PAGE, Fig. 4). Comparison of the two RAPD protocols[7,20] demonstrated that all major bands were similarly amplified. However, because of shortercycling times, the protocol of Roller [20] was adopted in all subsequent RAPD experiments.
Eight out of the 60 random primers screened were able to elicit polymorphism betweenin vitro culture plants. As a quick screen to detect somaclonal variations, the population of invitro culture plants was divided into groups of nine plants. Anther-derived plants were groupedseparately from ovule-derived plants. DNA isolated from these plants was pooled according tothese groups and pooled DNA profiles examined. DNA polymorphisms between pooled DNAfrom anther-derived plants were detected as well as between anther-derived and ovule-derivedplants (data not shown/
B1 2 3 4 C 5 6 7
#5. ' — — . — . „ . J£
« : • •
FIG. 4. RAPD polymorphisms ((A) Primer Op-F07 and (B) Primer Op-F08) between control andanther-derived plants after exposure to increasing dosages of gamma-irradiation (1-4 gray). 1: y -irradiated anther-derived plant (1 gray); 2: y -irradiated anther-derived plant (2 gray); 3: y -irradiated anther-derived plant (3 gray); 4: y-irradiated anther-derived plant (4 gray); 5: y -irradiated anther-derived plant (2 gray); 6: y -irradiated anther-derived plant (3 gray); 7: y -irradiated anther-derived plant (4 gray); C: Control (non-irradiated anther-derived plant); M: Mol.wt. marker, 1 kb ladder.
68
Comparison of RAPD patterns obtained after amplification with primer Op-F07 betweenanther-derived plants exposed to increasing dosages (1-4 gray) of gamma-irradiation with non-irradiated plants from the same source (anthers) revealed distinct DNA polymorphisms (Fig 4).DNA fingerprints between the irradiated materials appeared to vary in number and size ofDNA fragments. With increasing dosage of irradiation, large DNA fragments appeared to bereplaced by several shorter ones.
3.5. DAF polymorphism in tissue culture plants
Twenty hexamer primers in 190 combinations of primer-pairs were tested for their abilityto elicit DNA polymorphisms. Of these, only two were found to be informative. As describedabove (Section 3.4.), samples of pooled DNA were used. With primer-pair (OpA4/OpA19),the DNA profiles between these groups were nearly indistinguishable. On the other hand, DNAprofiles of individual plants were more diverse. Anther-derived plants tended to be morepolymorphic than ovule-derived plants.
3.6. STMS within the HMGR-1 gene
Twenty seven combinations of forward and reverse primers were used to tag themicrosatellite region (GA)g within the hydroxymethylglutaryl coenzyme A reductase (hmgr-1)gene in tissue culture plants. Even though many fragments were amplified within this locus, nopolymorphism was detected. Separate digestion of these amplified products by Alul and Haelilfailed to yield any polymorphic fragment. Similarly, no polymorphism was detected at the(TA)n and (TTA)n loci.
3.7. AFLP between in vitro culture plants
Four EcdBJ primers, namely, £coRI+AAC, £coRI+ACG, iscoRI+ACT, £coRI+AGGand eight Mse I primers were used in combination, resulting in 32 primer-pair combinations todetect somaclonal variations among a random sample often in vitro culture plants. Dependingon the primer pair combination used, polymorphic bands were obtained in all the regeneratedplants, in comparison to the control (data not shown). Polymorphisms were scored as presenceor absence of bands, without consideration for band intensity.
4. DISCUSSION
4.1. Production of mutagenic plants by gamma-irradiation of budded stumps
The differences in DNA profiles between bifoliate and trifoliate normal leaves are notsurprising, since these were phenotypically different. However, the differences in DNA profilesbetween non irradiated and irradiated bifoliate leaves (Fig. 1) are interesting, as these wouldreflect changes as a consequence of gamma-irradiation. The observation that DNA profileswere similar after exposure to the same dosage of gamma-irradiation (5 Gray), suggested thatthe observed changes in DNA pattern were consistent and that the DAF technique wasreproducible. Although variations in DNA profiles with increasing dosage of gamma-irradiation was demonstrated, there was an absence of a distinct trend in these differences,making it difficult to assign specific DNA fragments to dosage.
69

4.2. Methylation and reduction in rDNA copy number
The status of DNA methylation in regenerated plants compared to control plants wasstudied using the high copy number probe pTa71, as well as oligonucleotide probes such as(GACA)n on DNA which was cut by methylation sensitive enzymes. Comparison of pTa71hybridization results (Fig. 2), suggested that there was a reduction in the number of rDNA lociin plants produced from cell culture. The reduction in rDNA loci in Hevea could be a result ofthe minimization of gene redundancy, whilst maintaining the gene product [21] or culture-induced [22]. Though reduction in rDNA loci number had been reported in other plants [21-24], the phenomenon is unknown in Hevea and may not have adverse effects [25].
Since DNA from in vitro culture plant EAC 4/91 was cleaved equally by both Mspl andHpall, in contrast to DNA from the control and other in vitro culture plants, this suggested theabsence of methylation in cytosine in the recognition sequence, as revealed by probe pTa71. Areduction in DNA methylation in regenerated plants is not unusual and had been reported [27-28].
Polymorphism between in vitro culture plant EAC 4/91 and the other samples examined,as revealed by hybridization of (GACA)n on DNA digested with Hpall and Mbdl (Fig. 3) wasunrelated to DNA quality, since all samples could be digested equally by Taql. Results afterMbol and Taql digestion suggested the presence of hydroxymethylated cytosine in plant EAC4/91. Spectroscopic and chemical analysis would however, be needed to confirm the above,but are beyond the scope of the present study. Tissue culture-induced changes in DNAmethylation have been reported and were attributed to the wide range of changes that occurafter propagation of tissue culture plants [21]. Changes in DNA methylation were reported tobe frequent in maize callus, regenerated plants and the progeny of such plants [27]. The extentof DNA methylation could vary with the plant and could also fluctuate with time in the sameplant, as seen in carrot root explants [28]. It remains to be determined whether DNAmethylation changes in Hevea are reversible and would have adverse effects with time.
4.3. RAPD polymorphism in mutagenic and in vitro culture plants
The demonstration that all major bands were amplified similarly by the two RAPDprotocols tested provided confidence in the reproducibiltiy of the RAPD technique (data notshown). This was further confirmed when 5 sets of duplicate DNA samples produced similaramplification results (data not shown).
Since polymorphism in RAPD fingerprints were detected between irradiated and nonirradiated control in vitro plants (Fig. 4), the observed changes were probably caused bygamma-irradiation, rather than the culture method. However, because somaclonal variationshad been demonstrated in the present study, and these could not be differentiated frommutagenesis, it was difficult to ascertain the origin of these changes. With increasing dosage,large DNA fragments appeared to be replaced by shorter ones, indicating possible cleavage oflong DNA by gamma-irradiation.
4.4. DAF polymorphism between in vitro culture plants
The lack of polymorphism when pooled samples of DNA from tissue culture plants werecompared with control, suggested that either somaclonal variation was absent, or was presentat a very low level. However, the diverse DNA profile obtained when DNA profiles of 48 invitro culture plants were compared individually, as well as with control vegetative plants
70
suggested the presence of somaclonal variations. Since DAF profiles from individual anther-derived plants were more polymorphic than individual ovule-derived plants, it appeared thatanthers have a greater propensity for somaclonal variation than ovules. This finding, thoughnew in rubber had been reported in other plants [22-28]. The polymorphic bands detected inHevea appeared to be unusually large in contrast to those reported elsewhere [29-30].Preliminary examination of DAF polymorphic bands in Hevea suggested that the shortfragments (less than 1.0 kb) were less polymorphic than the longer ones.
4.5. STMS within the HMGR-1 gene
The lack of STMS polymorphism within the hmgr-1 gene between control andregenerated plants is not unexpected since only a very minute region of a specific gene wasexamined. Failure to elicit polymorphism after separate digestion by Alul and Haelll of theamplified fragments indicated that neither insertion/deletion nor point mutation [31] werepresent among the tissue culture plants within that gene. Being a latex-enriched [32] keyenzyme of rubber biosynthesis, differences in hmgr-1 gene are expected to be less in leavesthan in latex.
4.6. AFLP between in vitro culture plants
All 10 regenerated plants displayed polymorphism when compared to control, suggestingthat somaclonal variations exist in Hevea (data not shown). This is in confirmation to resultsfrom other fingerprinting techniques discussed above. The frequency of somaclonal variationappeared to be high, as estimated by AFLP (data not shown).
REFERENCES
[1] YOON, P.K. R.R.I.M. Crown budding trials, Planters' Bulletin of the Rubber ResearchInstitute of Malaya 92 (1967) 240-249.
[2] BOUYCHOU, J. G. La culture in vitro des tissues d'Hevea, Proc. Rubb. Conf. Bogor,1952. Arch. Rubb. Cult. Extra 2 (1953) 50-53.
[3] MUZIK. TJ. Studies on the development of the embryo and seed of Hevea brasiliensisin culture, Lloydia. 19 (1956) 86-91.
[4] CHUA, S.E. Studies on tissue culture of Hevea brasiliensis. I. Role of osmoticconcentration, carbohydrates and pH values in induction of callus growth in plumuletissues from Hevea seedlings, J. Rubb. Res. Inst. Malaya 19 (1966) 272-276.
[5] PARANJOTHY, K. and GHANDIMATHI, H. Tissue and organ culture of Hevea. Proc.Int. Rubb. Conf. 1975 Kuala Lumpur 2 (1976) 59-84.
[6] BECKMANN, J.S. and SOLLER, M. Restriction fragment length polymorphisms ingenetic improvement .Methodologies, mapping and costs, Theor. Appl. Genet. 67 (1983)35-43.
[7] WILLIAMS, J.G.K., KUBELK, A.R., LIVAK, K.J., RAFALSKI, J.A. and TINGEY,S.V. DNA polymorphisms amplified by arbitrary primers are useful as genetic markers,Nucleic Acids Res. 18 (1990) 6531-6535.
[8] WELSH, J. and McCLELLAND, M. Fingerprinting genomes using PCR with arbitraryprimers, Nucleic Acids Res. 18 (1990) 7213-7218.
[9] EPPLEN, J.T. On simple GATA/GACA sequences: a critical appraisal, J. Hered 79(1988)409-417.
[10] TAUTZ, D. Hypervariability of simple sequences as a general source for polymorphicDNA markers, Nucleic Acid Res. 17 (1989) 6463-6471.
71
[11] CAETANO-ANOLLES, G., BASSAM, B.J. and GRESSHOFF, P.M. DNAamplification fingerprinting using very short arbitrary oligonucleotide primers,Biotechnology 9 (1991) 553-556.
[12] VOS, P., HOGERS, R., BLEEKER, M., RIJANS, M., Van der LEE, T., HORNES, M.,FRIJTERS, A., POT, J., PELEMAN, J. KUJPER, M. and ZABEAU, M. A newtechnique for DNA fingerprinting, Nucleic Acids Res. 23 (1995) 4407-4414.
[13] HAFSAH JAAFAR, RADZIAH, N.Z, LOW, F.C. and SAFIAH ATAN Mutationbreeding of Hevea brasiliensis: Use of in vitro technology to produce disease-resistantmutants - Preliminary results. Proc. Asia-Pacific Conf. on Plant Physiol. II, KualaLumpur, Aug. 20-22, 1996. (In press)
[14] HAFSAH JAAFAR and RAMLI OTHMAN Mutation breeding of Hevea brasiliensis -1: Radio sensitivity test of different plant materials, Int. Symp. on Contribution of PlantMutation Breeding to Crop Improvement, Vienna. Extended Synopsis. 145-146 (1990).
[15] LOW, F.C., SITI ARIJA MAD ARIF, CHOW, K.S, WAN ABD. RAHAMAN WANYAACOB and GALE, M. Restriction fragment length polymorphisms as probes to plantdiversity. Conservation of Plant Genetic Resources Through In Vitro Methods (ISBN967-99915-2-0), FRIM/MNCPGR, Kuala Lumpur, (1990) 110-117.
[16] LOW, F.C. and GALE, M.D. Development of molecular markers for Hevea, J. nat.Rubb. Res. 6 (1991) 152-157.
[17] LOW, F.C., SAFIAH ATAN, HAFSAH JAAFAR and H. TAN Recent advances in thedevelopment of molecular markers for Hevea studies, J. Nat. Rubb. Res. 11 (1996) 32-44.
[18] SAFIAH ATAN, LOW, F.C. and SALEH, N.M. The construction of a microsatellite-enriched library, J. nat. Rubb. Res. 11 (4) (1997) 247-255.
[19] GERLACH, W.L. and BEDBROOK, J.R. Cloning and characterization of ribosomalRNA genes from wheat and barley, Nucleic Acids Res. 7 (1979) 1869-1885.
[20] KOLLER, B.A., LEHMANN, J.M., McDERMOTT and GESSLER, C. Identification ofapple cultivars using random amplified polymorphic DNA markers, Theor. Appl. Genet.85 (1993) 901-904.
[21] SMULDERS, M.J.M., RUS-KORTEKAAS, W. and VOSMAN, B. Tissue culture-induced DNA methylation polymorphisms in repetitive DNA of tomato calli andregenerated plants, Theor. Appl. Genet. 91 (1995) 1257-1264.
[22] CULLIS, C.A. Quantitative variation of ribosomal RNA gene in flax genotrophs,Heredity 42 (1979) 213-217.
[23] LARKIN, P.J., RYAN, S.A. BERTELL, R.I.S. and SCOWCROFT, W.R. Heritablesomaclonal variation in wheat, Theor. Appl. Genet. 67 (1984) 443-455.
[24] LANDSMANN, J. and UHRIG, H. Somaclonal variation in Solamim tuberosumdetected at the molecular level, Theor. Appl. Genet. 71 (1985) 500-505.
[25] KAEPPLER, S.M. and PHILLIPS, R.I. Tissue culture-induced DNA methylationvariation in maize, Proc. Natl. Acad. Sci. USA 90 (1993) 8773-8776.
[26] BROWN, P.T.H., GLOBEL, E., LORZ, H. RFLP analysis of Zea mays callus culturesand their regenerated plants, Theor. Appl. Genet. 81 (1991) 227-232.
[27] ARNOLDT-SCHMITT, B. Rapid changes in amplification and methylation pattern ofgenomic DNA in cultured carrot explants (Daucus carota L), Theor. Appl. Genet. 85(1993) 793-800.
[28] CAETANO-ANOLLES, G. MAAP: a versatile and universal tool for genome analysis,Plant Mol. Biol. 25 (1994) 1011-1026.
[29] HE, C , PRAKASH, C.S. and JARRET, R.L. Analysis of genetic diversity in a sweetpotato (Ipomea batatas) germplasm collection using DNA amplification fingerprinting,Genome 38 (1995) 938-945.
72
[30] TRAGOORUNG, S., KANAZIN, V. HAYES, P.M. and BLAKE, T.K. Sequence taggedsites facilitate PCR for barley genome mapping, Theor. Appl. Genet. 84 (1992) 10002-1008.
[31] CHYE, MX., TAN, C.T. and CHUA, N.H. Three genes encode 3-hydroxymethylglutaryl coenzyme A reductase in Hevea brasiliensis:hmg-l and hmg-3are difFerentially expressed, Plant Mol. Biol. 19 (1992) 473-484.
73

GENETIC TRANSFORMATION OF DECIDUOUS FRUIT XA9848413TREES CONFERRING RESISTANCE AGAINST DISEASES
E.L. MANSVELT, T. GLYN-WOODS, L. WATTS, A. RABIEAgricultural Research Council, Infruitec
M. APPEL, D.U. BELLSTEDTBiochemistry Department, University of Stellenbosch
Stellenbosch, South Africa
Abstract
Long breeding cycles make cultivar development a lengthy process in deciduous fruit species.Gene transfer is, accordingly, a goal with significant commercial value. In many plant species,especially in woody plants, a prerequisite for genetic engineering is the ability to regenerate plants fromtransformed cells. Development of single cell regeneration is the first step towards exploration of genetransfer techniques. In this investigation media for plum and apple leaf disk regeneration weredeveloped. Transformation experiments were performed. The vector EHA105 containing the gw -̂introngene was found to be effective for gene transfer. Induction of the virG genes with aceto-syringone didnot enhance transformation. Cefotaxime that was supplemented in the plum selection medium tosuppress the Agrobacterium vector seriously inhibited leaf disk regeneration. However, in apples it wasnot detrimental. With further apple transformation experiments, factors such as preculturing, age ofleaves, sucrose and cefotaxime concentrations did not increase the transformation efficiency of themarker gene.
The harpin protein, essential for the pathogenicity of Pseudomonas syringae pv. syringae whichincites bacterial canker of stone fruit, was amplified and cloned into an expression vector. The fusionprotein was purified. This will be used in future studies to elucidate the host-pathogen interaction, andto identify antibacterial genes.
1. INTRODUCTION
Diseases of stone and pome fruit induce losses probably exceeding $ 25 million (U.S.)annually in South Africa. The severity of the damage varies from subtle, almost undetectableeffects to rapid death of many trees in some nurseries and orchards.
Bacterial canker of stone fruit caused by Pseudomonas syringae pv. syringae appears tobe more severe in South Africa than elsewhere in the world. The reason for this is obscure, butwe suspect that a combination of several predisposing components, particularly climatic andsoil factors, favors disease expression. Most researchers regard P. syringae as a weakpathogen that causes disease only when the host is stressed. The organism is an excellentopportunist by virtue of its ability to colonise the foliar surface epiphytically and then to spreadthrough the tree. Systemic invasion is of particular concern when one considers that deciduousfruit trees are propagated by grafting vegetative material onto rootstocks [6].
In the past, programs to control bacterial canker of stone fruit have met with mixedsuccess, as can be expected if the subtle nature of the disease and the excellent ability of thepathogen to survive on the surface and inside the host are considered. Moreover, some of thepredisposing factors can not be remedied, and future control strategies will have to rely on theselection and breeding for disease resistance.
75

Locally, apple growing is the largest deciduous fruit industry. Apple cultivars vary widelyin their susceptibility to scab, powdery mildew, Phytopthora, Rosellinia, and stem cankercausing fungi. Fungal diseases can be prevented by spraying with fungicides up to fifteen timesper year. This means high costs for the grower (usually about 10 % of the non-labour costs)and a serious burden for the environment.
The production of transgenic plants is expected to become an important tool for geneticimprovement of horticultural crops. The transformation of plants depends on two essentialrequirements: the ability to stably introduce a desired gene into the plant genome, and theability to regenerate a fertile plant from the transformed cells.
Our objectives were the following: to develop tissue culture techniques for regeneratingsingle cells from deciduous fruits, to transform (Agrobacterium-mediated) deciduous fruitcultivar tissues with marker genes, and to identify and isolate anti-bacterial gene(s).
2. MATERIALS AND METHODS
2.1. Development of regeneration and transformation techniques
2.1.1. Plant material and growing conditions
Shoots of the cultivars and rootstocks used in this study were collected fromgreenhouse-grown plants. The Prunus rootstocks used were Mariana and F 12/1 (Mazzard),and the apple rootstocks were M. 109, M. I l l and M. 7. The scions used were Prunussalicina cv. Casselman and Mains domestica cvs. Granny Smith and Royal Gala. They weresurface-disinfected with sodium hypochlorite (2% v:v) that contained a drop of Tween 20 perliter, dipped for 30 seconds in 70% ethanol, then thoroughly rinsed with 3 changes of steriledistilled water, and were established on their maintenance medium.
Shoots were subcultured every 4 weeks. Proliferating cultures were maintained underwhite fluorescent lights at 24°C (16-hr photoperiod).
For leaf disk regeneration studies, explants from each of the different plant sources wereexcised and sliced perpendicularly to the mid-vein. They were placed horizontally with theabaxial surface in contact with the medium. Apple explants were incubated for two weeks inthe dark at 24°C, and then transferred to a growth chamber at 24°C with dimmed fluorescentdaylight. Plum leaf disks were transferred directly to white fluorescent light, unless otherwisedescribed.
2.1.2. Maintenance medium
The maintenance medium for Prunus explants consisted of MS salts and vitamins [13]supplemented with 3% sucrose, 0.29 uM gibberillic acid (GA3), 0.49 fjM indole-butyric acid(IBA) and 2.22 JJM 6-benzyladenine (BA). The medium was solidified with 0.7% agar(Merck), and the pH was adjusted to 5.5 before autoclaving. The maintenance medium forapples have been described [7].
76

2.1.3. Regeneration medium
For single cell regeneration, the following medium components were examined: Basalsalts and vitamins of MS and N6 [5] medium; sucrose or sorbitol; EBA or 1-naphthalene-aceticacid (NAA); and thidiazuron (TDZ). The medium was solidified with 7 g/L agar, 2 g/L gelrite,or 50 g/L corn starch. Medium (25 mL) was dispensed into 90 x 15 mm petri dishes. After theexplants were transferred, each petri dish was sealed with a strip of parafilm.
2.1.4. Optimisation of transformation
Four Agrobacterium tumefaciens strains were used: A281 (p35S-intron-GUS), C58(pGV2260), EHA105 (pMTl), and LBA4404 (pAL4404). The C58 and LBA4404 strainswere provided with the binary expression vector pBI121. The binary expression vectors ofA281 and EHA105 were derived from pBIN19. Both contain the NPII gene for plant selectionand the kanamycin gene for bacterial selection, but A281, which contains the 35S-intron-GUS-35S-3', differs from EHA105 which contains 35S-intron-GUS-OCS-3\ Furthermore, EHA105has the pTiBo542 VirG fragment on pMTl.
The Agrobacterium strains, cultured in YEP medium (supplemented with kanamycin),were harvested and adjusted to an OD of 0.3 at 55Onm. Each strain was suspended individuallyin sterile distilled water. Leaf explants were inoculated with the bacterial strains by placingthem in the bacterial suspensions for 20 min at 22°C, and were blotted onto sterile filter paper.They were co-cultivated on their respective co-cultivation media for two to three days beforebeing transferred to their selective media.
The simplified induction medium (SIM) of James and Dandekar [7] was used to inducethe VirG genes of the Agrobacterium strains which were incubated at 24°C for 5 hr before use.In apples, preculture periods of 0, 3, 5, 7, 9 and 12 days of leaf disks on regeneration mediumbefore transformation were performed. The age of leaves (two, three or four weeks), sucrose(2 or 3%) and cefotaxime (250 or 400 ug/mL) were tested to increase tranformationefficiency.
2.1.5. Gus assays
Leaves were assayed for expression of the gws-genes following the histochemical stainingprocedure of Jefferson [8]. Staining was overnight at 37°C. The number of transformed callion selective media were determined 3 weeks after infection by counting the blue calli. Leavesof plants growing on selective medium were tested nine weeks after transformation.
2.1.6. Experimental design, data collection and analyses
A completely randomised block design was used for all experiments with eachexperiment having two replications. A replication consisted of a petri dish containing twelveleaf explants. Leaf disk regeneration is expressed as the percentage of leaves that regeneratedshoots. Data were recorded after 40 days of culture. Percentage data were subjected tostatistical analyses.
77
2.2. Amplification, cloning and expression of the harpin encoding gene of P. syringae pv.syringae NV
2.2.1. Amplification
A polymerase chain reaction (PCR) was performed, using genomic DNA of P. syringaepv. syringae NV as template and primers based on the terminal sequences of the hrpZ2 gene ofP. syringae pv. syringae 61 [1]. Bio-X-Act DNA polymerase (Bioline, contains 3'-5'proofreading activity) was used in this reaction.
2.2.2. Cloning strategy
The P. syringae pv. syringae NV PCR product was purified from a 1% agarose gel runin TAE and cloned into the pMOSBlue vector (Amersham) according to the manufacturer'sinstructions (A/T cloning strategy). The recombinant plasmid (pBNVl) was used to transformcompetent E. coli JM109 cells. The transformation reaction mixture was plated out on LB-agar containing 50 ng/mL ampicillin, 50 mg/mL X-gal and 0.1 MIPTG. Plates were incubatedfor 16 hours at 37°C. Randomly chosen white colonies were picked up, resuspended in distilledwater and lysed by boiling. The crude supernatants obtained after centrifugation weresubjected to a PCR, using the same primers and conditions as for the original amplificationreaction, but using a DNA polymerase without proof reading activity. The PCR products wererun on a 1% agarose gel in TAE.
Plasmid DNA was isolated from an overnight culture (LB +100 ug/mL Amp) of E. coliJM109 (pBNVl). This plasmid, as well as the plasmid pMAL-c2 (New England Biolabs), wasdigested with £eoRl and Pstl in SuRE cut buffer H (Boehringer Mannheim) for 90 min. at37°C. The reaction products were run on a 1% agarose gel in TAE. The linearized plasmidfrom the pMAL-c2 digest and the 1 kilobase (kb) fragment from the pBNVl digest werepurified from the gel. These DNA fragments (molar insert:vector = 9:1) were ligated for 90min. at 37°C, using the Fastlink kit (Epicentre Biotechnologies). The recominant vector(pMNVl) was used to transform competent E. coli TB1 cells. The transformation reactionwas plated out on LB-agar containing 100 u.g/ml ampicillin. Plates were incubated for 16 hoursat 37°C. Randomly selected clones were transplanted to LB-agar plates supplemented with 100Hg/mL Amp, X-gal and IPTG as before and grown for 16 hours at 37°C. The success of thesubcloning experiment was evaluated by plasmid isolation from overnight cultures of randomlyselected white colonies, followed by digestion with EcoR\ and Pstl as described before.
2.2.3. Expression and purification of recombinant harpinNV
E. coli TB1 (pMNVl) was grown in liquid culture (Rich Broth and 100 (ig/mL Amp) at37°C to an OD (600nm) of 0.5. Expression of the recombinant protein was induced byincubation of the cultures for a further 2 hours after the addition of IPTG to a finalconcentration of 0.3 mM. Cells were harvested by centrifugation, resuspended in columnbuffer (20 mM TrisHCl, 0.2 M NaCl, 1 mM EDTA) and incubated overnight at -20°C in thepresence of 2 mM PMSF. Cells were defrosted in cold water, sonicated in pulses of 15 s eachfor 6 min at 4°C. The supernatant obtained after centrifugation of the sonication mixturecontained the soluble proteins of the recombinant bacterium, including the overexpressedmaltose binding protein (MBP)-harpinNV fusion. The fusion protein was separated from theother soluble proteins by affinity chromatography using an amylose column. The fusion proteinwas eluted from the column in column buffer with 10 mM maltose.
78

In order to cleave the recombinant harpinNV from MBP, the column eluate wasincubated with factor Xa (1 ug per ug fusion protein, as determined by the Bradford method)for 60 hours at room temperature. The recombinant harpinNV was precipitated from thecleavage reaction by the addition of saturated ammonium sulphate to a final saturation value of25%. The reaction mixture was incubated at 4°C for 45 min and centrifuged at 13000 x g for30 min at 4°C. The pellet (containing only the recominant harpinNV) was dialysed against 200volumes 10 mM MES (pH 6.3) containing 1 mM PMSF and stored at 4°C. All expression andpurification steps were evaluated on 10% SDS-PAGE, followed by Coomassie staining.
3. RESULTS
3.1. Single cell regeneration from Prunus explants
In a preliminary experiment, leaf explants were tested for shoot regeneration on N6medium containing 5.4 uM NAA and various concentrations of TDZ (Table I). Of the tworootstocks and one cultivar tested, "Mariana" showed regeneration.
Based on the combination of NAA and TDZ from which the highest regeneration wereobtained, IBA was substituted for NAA at equal concentration. Results from this experimentindicated that IBA was superior for induction of plant regeneration in Mariana (data notshown). However, no regeneration was observed for "Mazzard" or "Casselman".
In a subsequent experiment the shoot regeneration capacity of cultured leaf explants of"Mariana" were tested on twelve recipes consisting of 2, 3, or 4% sucrose or sorbitol solidifiedwith gelrite or agar which were tested under three light regimes (Fig. 1). The Shapiro-Wilk testfor non-normality showed no evidence against normality (P=0.33) [14]. Therefore, notransformation was needed.
Significant interaction was found between the recipe and light regime. Shortfall testswere performed to test the best recipe within each light regime [16]. From these data, it wasfound that N6 medium supplemented with 18.16 uM TDZ, 5 uM IBA, 2% sorbitol, andsolidified with gelrite gave the best response if grown in a light of 50 urnol m s, 16 hrphotoperiod at 24°C (Fig. 1).
TABLE I. ADVENTITIOUS SHOOT FORMATION ON LEAF EXPLANTS OF PRUNUSROOTSTOCK MARIANA CULTURED ON N6 MEDIUM SUPPLEMENTED WITH NAAAND VARIOUS CONCENTRATIONS OF TDZ
TDZ(uM)19.822.725.628.4
No. of leafexplants
183213217259
Percentageregeneration
9.293.281.845.41
79

All media described above were used for leaf disk regeneration studies of Mazzardcherry rootstocks and cv. Casselman Japanese plums. Although lots of calli were found, shootculture regeneration from leaf explants only occurred erratically (data not shown).
3.2. Single cell regeneration from apple leaf explants
Initially, published recipes were tested. Higher numbers of plants developed on mediasupplemented with TDZ, and the higher the concentration, the more distorted the plantsappeared. The leaves of plants from the BA-containing medium were larger and fewer.Therefore, in the case of Royal Gala, a MS-based medium supplemented with 3 mg/L TDZwas found to be optimal for leaf disk regeneration (data not shown).
The effect of the gelling agent and the carbohydrate source was investigated to improveleaf disk regeneration. Table II shows the best leaf disk regeneration responses obtained with 2cultivars and 3 rootstocks tested on nine different media. For example, on medium 6 all theRoyal Gala explants regenerated, and the highest numbers of shoots were found. Theregeneration of M.7 was poor and plants developed after 3 months only.
3.3. Transformation
Medium 4 (Fig. 1) was used in co-cultivation and selection studies of Mariana leafexplants. Cefotaxime (400 ug/L) was added to the medium to contain Agrobacterium growth.This seriously inhibited leaf disk regeneration.
aca
(A
>
90 j
80--
70--
60--
50--
40 f
30--
r10 TM
A ^ -
tt Dark• Semi-fight• Fuiilight
6 7Recipes
10 11 12
FIG. 1. Effect of several media (recipes) on the shoot regeneration from leaf disks. The number ofleaves responding are expressed as percentages. Recipes were prepared as follows: supplementedwith sucrose (1-3 and 7-9) or sorbitol (4-6 and 10-12) at 2% (1, 4, 7, and 10), 3% (2, 5, 8 and 11) or4% (3, 6, 9 and 12). Media 1-6 were solidified with gelrite, and 7-12 with agar.
80

TABLE II. LEAF DISK REGENERATION STUDIES OF APPLE CULTIVARS ANDROOTSTOCKS. ONLY THE BEST RESPONSES ARE SHOWN
Plant
Granny SmithM.7M.I 09M.l l lRoyal Gala
Medium*
34476
% Leafregeneration
44337759100
Plants/leafmean1.37
17.852.93
20.58
* Media 1-3, 4-6 and 7-9 were solidified with agar, cornstarch or gelrite respectively, andcontained sucrose (1, 4 and 7), glucose (2, 5 and 8) or sorbitol (3, 6 and 9)
3.3.1. Choice of Agrobacterium vector, and induction of VirGgene
To optimize gene transfer in deciduous fruit crops, we have investigated the effect ofaceto-syringone on strain virulence of four Agrobacterium vectors. Transformation wasinfluenced by the different Agrobacterium strains. Of the range of vectors tested, strain C58gave higher frequency of transformation for most of the host plants, and strain A281 wasunsuitable for transforming the plants studied. The presence of aceto-syringone in SIM beforeinoculating and co-cultivating the Agrobacterium vectors did not enhance the efficiency oftransfer of the GUS genes. Stable expression of GUS was highest in apples.
The vectors showed differences in GUS expression (Fig. 2). Two of the vectors (A281and EHA105) can only be expressed in transformed plants. By quantifying the blue pigments,EHA105 gave the best results.
90 j
80 -
7 0 ••
60 •
50 •
4 0 ••
3 0 ••
2 0 ••
10 •
0
t'K:
f*.\
i ' !
U Apple
El Plum
A281 SimA281
EHA105 SimEHA105
CS8 SimCS8
LB4404 SimLB4404
FIG. 2. Percentages of leaves showing gus expression Assays for stable expression was performed 3weeks after inoculation. Agrobacterial strains labelled with SIM were incubated in the simplifiedinduction medium containing aceto-syringone to induce the virulence genes [7].
81

3.3.2. Optimisation of transformation
Transgenic plants showing gus activity were obtained from 2-, 3- and 4-week old plants at arate of 1 out of 400 leaves which were inoculated with EHA105. This translates to atransformation efficiency of 0.4%.
3.4. Amplification, cloning and expression of the harpin encoding gene of P. syringae. pv.syringae NV
A single PCR product, similar in size (1 kb) to the hrpZl gene, was amplified from thegenome of P. syringae. pv. syringae. This 1 kb band was successfully amplified from selectedE. coli JM109 (pBNVl) clones, indicating that the PCR product was successfully cloned. The1 kb fragment was also obtained with EcoRJJPstl digestion of DNA from selected E. coli TB1(pMNVl) clones, indicating that the subcloning experiment was successful. Using RainbowMolecular Weight Markers (Amersham), the size of the purified recombinant harpinNV wasestimated at 37 kDa. This correlated well with the size of the P. syringae pv. syringae 61harpin (34.7 kDa, as determined by mass spectrometry).
4. DISCUSSION
Long breeding cycles make cultivar development a lengthy process in deciduous fruitspecies. Gene transfer is, accordingly, a goal with significant commercial value. In many plantspecies, especially in woody plants, the ability to regenerate plants from transformed cells isessential for genetic engineering. Development of a regeneration protocol is, therefore, a firststep towards exploration of gene transfer techniques.
In most plants, Agrobacterium-me&dXed transformation of leaf discs followed by directplant regeneration with minimal callus formation is the most common procedure. In Prunusspp. plant regeneration from hypocotyl slices [12], cotyledons [10] and embryos [15] ofPrunus has been reported. These tissues are available only at certain times of the year, andmoreover, the commercial cultivar desirability is lost, seriously limiting their usefulness fortransformation. Only caulogenesis was reported from Prunus leaf disks [4].
We developed a medium which allows 80% shoot regeneration from plum leaf explants.To our knowledge, this is the first report of shoot regeneration from plum leaf disks. Thedominant transportable sugar in Prunus spp. which is sorbitol [3] increased the percentage leafexplant regeneration on medium 4 in full light as illustrated in Fig. 1. However, if the lightintensities were changed, this medium gave poor results. Furthermore, no pattern wasestablished for the type of solidifying agent used, nor percentage of sugar included. Therefore,no generalisations can be made for future experiments.
The antibacterial genes will be used in gene transfer studies. However, additional genesneed to be identified and isolated. Screening plant extracts for antibacterial activity hasidentified many potentially useful compounds, but it has seldom led to identification of theassociated plant genes. Focusing on plant molecular signals during early stages of infection hasbeen more successful; many research groups are targeting host genes involved in pathogenrecognition/signal transduction of inducible defence products, such as phytoalexins,pathogenesis-related proteins, and structural proteins [9]. Several examples exist for applyingthis strategy against fungal pathogens, including Rhizoctonia solani [2]. The harpin proteinwhich is essential for pathogenicity of the bacterial canker pathogen is a prime candidate forsuch studies.
82

Recent advances have led to the identification, and subsequent gene cloning, of severalpeptides with antibacterial properties in arthropods and some mammalian species. Thesepeptides work independently, or in concert, to kill a range of important Gram-positive and -negative bacteria. Their activities vary, but several appear suitable against plant pathogens.
In general, three broad categories of antimicrobial properties exist: insect immuneproteins, animal defence proteins; and lysozymes, followed by examples of natural or syntheticantibacterial genes that have been cloned, modified, and introduced for expression in plants.
The vigour of apple cultivars in vitro was severely decreased due to the presence offirestop, an antibiotic, which was routinely used to eliminate bacterial contamination in themother cultures. Novobiocin was found to be superior as an antibiotic treatment. We alsofound an increase in plant growth as a result of this antibiotic (data not shown). Increase [11]and decrease [18] in plant growth as a result of treatment with antibiotics has been described.The increase in plant growth could be due either to a direct physiological effect of theantibiotic, or to inhibition of contaminants in the plant tissue cultures.
After the quality of the mother material was improved, leaf disk regenerationexperiments were optimised for "Royal Gala" (Table 2). This supports the results obtained inother studies that Royal Gala is highly regenerative [17]. Leaf disk regeneration for apples willhave to be investigated further, because optimal media remain to be developed for each cultivarand rootstock.
In this study, formation of adventitious shoots on leaf disks occurred with or without anintermediate callus stage depending on the genotype. The main factors affectingmorphogenesis were TDZ concentration, the vigour of and presence of bacteria in motherplant material. The regeneration capacity increased substantially after shoot tip cultures wereroutinely grown on medium containing novobiocin. It is critical for leaf disk regenerationstudies that mother plant material should grow vigorously.
The transformation efficiency was influenced by the use of different Agrobacteriumstrains. Of the range of vectors tested, the strain C58 showed higher frequency of gusexpression. These results are misleading, because this vector carries the gus gene only, and itis not possible to distinguish between gus expression by the bacteria or the plant. Strain A281is not suitable for transforming the plants studied. The Agrobacterium vector EHA105 gavethe best results in gene transfer studies. Transgenic plum and apple calli were obtained (Fig. 2).Transgenic Royal Gala plants were found at a rate of 1 plant per 400 leaves treated.
The presence of aceto-syringone in SIM before inoculating and co-cultivatingAgrobacterium vectors with the different leaf explants, preculturing of leaf disks, age of leafexplants, sucrose and cefotaxime concentrations die not did not influence the transfer of gusgenes. The transformation efficiency in all combinations was 0.5%.
We shall continue our investigations to optimize conditions for increasing the single cellregeneration of apple and plum cultivars and rootstocks, and to increase transformationefficiency in these plants.
83
REFERENCES
[I] APPEL, M., MANSVELT, E.L. and BELLSTEDT, D.U. "Production of a harpinelicitor by Pseudomonas syringae pv. syringae isolated from a nectarine tree",Pseudomonas syringae Pathovars and Related Pathogens (Proc. Fifth InternationalConference Berlin, Germany, 1995).
[2] BROGLIE, K., CHET, I., HOLLIDAY, M, CRESSMAN, R., BIDDLE, KNOWLTON,C, MAUVAIS, C.J. and BROGLIE, R. Transgenic plants with enhanced resistance tothe fungal pathogen Rhizoctonia solani, Science 254 (1991) 1194-1197.
[3] COFFIN, R., TAPER, CD. and CHONG, C. Sorbitol and sucrose as carbon sources forcallus culture of some species of the Rosaceae, Can. J. Bot. 54 (1976) 547-550.
[4] DECLERCK, V. and KORBAN, S.S. Influence of growth regulators and carbon sourceson callus induction, growth and morphogenesis from leaf tissues of peach {PrunuspersicaL. Batsch), J. Hort. Sci. 71 (1996) 49-55.
[5] FASOLO, F., ZIMMERMAN, R.H., and FORDHAM, I. Adventitious shoot formationon excised leaves of in vitro grown shoots of apple cultivars, Plant Cell Tissue and Org.Cult. 16 (1989)75-87.
[6] HATTINGH, M.J., ROOS, I.M.M. and MANSVELT, E.L. Infection and systemicinvasion of deciduous fruit trees by Pseudomonas syringae in South Africa, PlantDisease 73 (1989) 784-789.
[7] JAMES, D.J. and DANDEKAR, A.M. Regeneration and transformation of apple (Maluspumila Mill), Plant Tissue Culture Manual B8 (1991) 1-18.
[8] JEFFERSON, R.A. Assaying chimeric genes in plants: The GUS gene fusion system,Plant Mol. Biol. Rep. 5 (1987) 387-405.
[9] LAMB, C.J., RYALS, E.R., WARD, E.R., and DIXON, R.A. Emerging strategies forenhancing crop resistance to microbial pathogens, Bio/Technology 10 (1992) 1436—1445.
[10] LANE, D.W. and COSSIO, F. Adventitious shoots from cotyledons of immature cherryand apricot embryos, Can J. Plant Sci. 66 (1986) 953-959.
[II] LEIFFERT, C, CAMOTTA, H., and WATTES, W.M. Effect of combinations onmicropropagated Clematis, Delphinium, Hosta, Iris, and Photinia, Plant Cell, Tissue andOrgan Culture 29 (1992) 153-160.
[12] MANTE, S., MORGENS, P.H., SCORZA, R., CORDTS, J.M. and CALLAHAN, A.M.Agrobacterium-medizted transformation of plum (Prunus domestica L.) hypocotyl slicesand regeneration of transgenic plants, Bio/Technology 9 (1991) 853-857.
[13] MURASFIIGE, T. and SKOOG, F. A revised medium for rapid growth and bioassayswith tobacco tissue cultures, Physiological Plantarum 15 (1992) 473-479.
[14] SHAPIRO, S.S. and WTLK, M.B. An analysis of variance test for normality (completesamples), Biometrika 52 (1965) 591-611.
[15] SVTRCEV, A.M., BIGGS, A.R. and MILES, N.W. Peach regeneration from callusderived from embryos of selected cultivars, Fruit Var. J. 47 (1993) 13-18.
[16] VAN AARDE, I.M.R. Pivotal quantities for the substitution values of various entries,each in place of its best contender, given the standard analysis of variance model, Biom.J. 36 (1994) 673-687.
[17] YAO, J.-L., COHEN, D., ATKINSON, R., RICHARDSON, K. and MORRIS, B.Regeneration of transgenic plants from the commercial cultivar Royal Gala, Plant CellReports 14 (1995) 407- 412.
[18] YOUNG, P.M., HUTCHTNS, A.S. and CANFIELD, M.L. Use of antibiotics to controlbacteria in shoot cultures of woody plants, Plant Science Letters 34 (1984) 203-209.
84
APPLICATION OF MOLECULAR MARKERS IN XA98484i4GERMPLASM ENHANCEMENT OF CASSAVA(MANIHOT ESCULENTA L. CRANTZ)AND YAMS (DIOSCOREA SPP.) AT IITA
H.D. MIGNOUNA, R. ASIEDU, A.G.O. DIXON,J. TONUKARI, N.Q. NG, G. THOTTAPPILLYInternational Institute of Tropical Agriculture,Ibadan, Nigeria
M. KNOX, T.H.N. ELLISJohn Innes Centre,Norwich, United Kingdom
Abstract
The genetic variation among 28 varieties of cassava (Manihot esculenta L. Crantz), collectedfrom different parts of the Republic of Benin was determined using random amplified polymorphicDNA (RAPD) markers. A set of ten primers out of the one hundred that were screened, detectedpolymorphisms. Thirty-five cassava landraces from three countries of West Africa, along with fiveimproved varieties and one genetic stock (58308), were analysed using both microsatellite markers andnine selected random primers which generated fifty-four polymorphic markers. Based on the unweightedpair group method with arithmetic averages (UPGMA) and Principal Component Analysis (PCA), sixmajor groups of clusters were identified among the forty one genotypes. Clone 58308, the originalsource of resistance to African Cassava Mosaic Disease (ACMD) in ITTA's cassava breeding program,and TMS 30572, an improved cultivar derived from clone 58308, were found in the same cluster group.All 34 of the landraces that are known to be resistant to ACMD were genetically distant from 58308and TMS 30572. A diallel mating programme has been initiated to elucidate the genetics of these newsources of resistance to ACMD and determine their complementarity as well as allellism for resistance.A set of eight random primers for RAPD and two combinations of enzymes and specific primers forAFLP were used to generate DNA fingerprinting of twenty varietal groups among the 32 described forcultivated yams in the region. The results obtained confirm that a given varietal group is a mixture ofdifferent genotypes. The molecular taxonomy of 30 accessions of cultivated yams, D. rotundata and D.cayenensis, and 35 accessions of wild yams from Nigeria was established using RAPD andmicrosatellite markers. The cultivated yams separated into two distinct groups corresponding to the twospecies. D. rotundata genotypes showed relationship to the wild species D. abyssinica and D.praehensilis, whereas D. cayenensis genotypes were related to the wild species D. burkilliana. HTA iscurrently developing molecular markers to tag genes conferring resistance to major diseases and pests ofboth cassava and yams. Molecular markers linked with these genes will then be used for marker assistedselection.
1. INTRODUCTION
Cassava (Manihot esculenta Crantz) and yams (Dioscorea spp) constitute the mainstayfor millions of people world-wide particularly in the tropics. Production in Africa of the majorstaples is constrained by pests and diseases such as African Cassava Mosaic Disease (ACMD),cassava bacterial blight (CBB), cassava anthracnose disease (CAD), cassava greenmite(CGM), yam anthracnose, yam viruses and nematodes.
Improved cassava varieties bred by the International Institute of Tropical Agriculture(IITA) and resistant to the ACMD and CBB have been adopted by many farmers in West andCentral Africa. These varieties have been derived from one source of resistance to ACMD
85
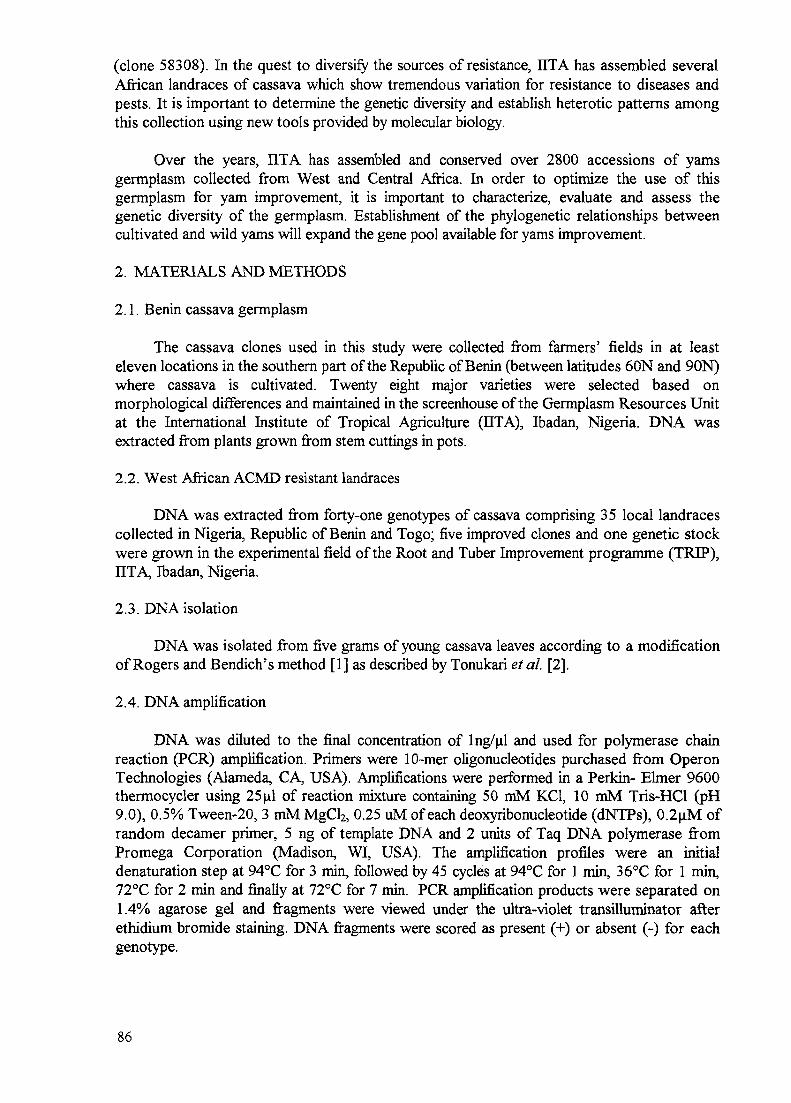
(clone 58308). In the quest to diversify the sources of resistance, IITA has assembled severalAfrican landraces of cassava which show tremendous variation for resistance to diseases andpests. It is important to determine the genetic diversity and establish heterotic patterns amongthis collection using new tools provided by molecular biology.
Over the years, IITA has assembled and conserved over 2800 accessions of yamsgermplasm collected from West and Central Africa. In order to optimize the use of thisgermplasm for yam improvement, it is important to characterize, evaluate and assess thegenetic diversity of the germplasm. Establishment of the phylogenetic relationships betweencultivated and wild yams will expand the gene pool available for yams improvement.
2. MATERIALS AND METHODS
2.1. Benin cassava germplasm
The cassava clones used in this study were collected from farmers' fields in at leasteleven locations in the southern part of the Republic of Benin (between latitudes 60N and 90N)where cassava is cultivated. Twenty eight major varieties were selected based onmorphological differences and maintained in the screenhouse of the Germplasm Resources Unitat the International Institute of Tropical Agriculture (ETA), Ibadan, Nigeria. DNA wasextracted from plants grown from stem cuttings in pots.
2.2. West African ACMD resistant landraces
DNA was extracted from forty-one genotypes of cassava comprising 35 local landracescollected in Nigeria, Republic of Benin and Togo; five improved clones and one genetic stockwere grown in the experimental field of the Root and Tuber Improvement programme (TRIP),IITA, Ibadan, Nigeria.
2.3. DNA isolation
DNA was isolated from five grams of young cassava leaves according to a modificationof Rogers and Bendich's method [1] as described by Tonukari etal. [2].
2.4. DNA amplification
DNA was diluted to the final concentration of lng/^1 and used for polymerase chainreaction (PCR) amplification. Primers were 10-mer oligonucleotides purchased from OperonTechnologies (Alameda, CA, USA). Amplifications were performed in a Perkin- Elmer 9600thermocycler using 25 ul of reaction mixture containing 50 mM KC1, 10 mM Tris-HCl (pH9.0), 0.5% Tween-20, 3 mM MgCl2, 0.25 uM of each deoxyribonucleotide (dNTPs), 0.2uM ofrandom decamer primer, 5 ng of template DNA and 2 units of Taq DNA polymerase fromPromega Corporation (Madison, WL USA). The amplification profiles were an initialdenaturation step at 94°C for 3 min, followed by 45 cycles at 94°C for 1 min, 36°C for 1 min,72°C for 2 min and finally at 72°C for 7 min. PCR amplification products were separated on1.4% agarose gel and fragments were viewed under the ultra-violet transilluminator afterethidium bromide staining. DNA fragments were scored as present (+) or absent (-) for eachgenotype.
86
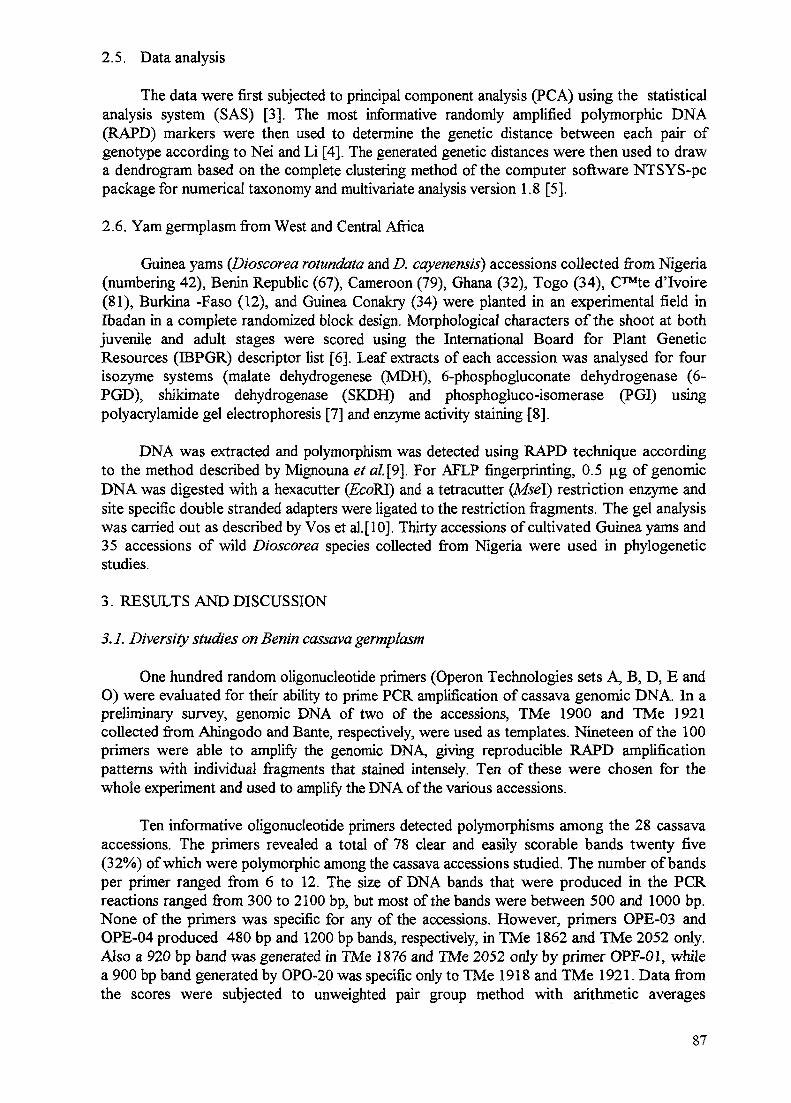
2.5. Data analysis
The data were first subjected to principal component analysis (PCA) using the statisticalanalysis system (SAS) [3]. The most informative randomly amplified polymorphic DNA(RAPD) markers were then used to determine the genetic distance between each pair ofgenotype according to Nei and Li [4]. The generated genetic distances were then used to drawa dendrogram based on the complete clustering method of the computer software NTSYS-pcpackage for numerical taxonomy and multivariate analysis version 1.8 [5].
2.6. Yam germplasm from West and Central Africa
Guinea yams {Dioscorea rotundata and D. cayenensis) accessions collected from Nigeria(numbering 42), Benin Republic (67), Cameroon (79), Ghana (32), Togo (34), C™te d'lvoire(81), Burkina -Faso (12), and Guinea Conakry (34) were planted in an experimental field inIbadan in a complete randomized block design. Morphological characters of the shoot at bothjuvenile and adult stages were scored using the International Board for Plant GeneticResources (IBPGR) descriptor list [6]. Leaf extracts of each accession was analysed for fourisozyme systems (malate dehydrogenese (MDH), 6-phosphogluconate dehydrogenase (6-PGD), shikimate dehydrogenase (SKDH) and phosphogluco-isomerase (PGI) usingpolyacrylamide gel electrophoresis [7] and enzyme activity staining [8].
DNA was extracted and polymorphism was detected using RAPD technique accordingto the method described by Mignouna et al.[9]. For AFLP fingerprinting, 0.5 ug of genomicDNA was digested with a hexacutter (EcdKL) and a tetracutter (MseT) restriction enzyme andsite specific double stranded adapters were ligated to the restriction fragments. The gel analysiswas carried out as described by Vos et al.[10J. Thirty accessions of cultivated Guinea yams and35 accessions of wild Dioscorea species collected from Nigeria were used in phylogeneticstudies.
3. RESULTS AND DISCUSSION
3.1. Diversity studies on Benin cassava germplasm
One hundred random oligonucleotide primers (Operon Technologies sets A, B, D, E andO) were evaluated for their ability to prime PCR amplification of cassava genomic DNA. In apreliminary survey, genomic DNA of two of the accessions, TMe 1900 and TMe 1921collected from Ahingodo and Bante, respectively, were used as templates. Nineteen of the 100primers were able to amplify the genomic DNA, giving reproducible RAPD amplificationpatterns with individual fragments that stained intensely. Ten of these were chosen for thewhole experiment and used to amplify the DNA of the various accessions.
Ten informative oligonucleotide primers detected polymorphisms among the 28 cassavaaccessions. The primers revealed a total of 78 clear and easily scorable bands twenty five(32%) of which were polymorphic among the cassava accessions studied. The number of bandsper primer ranged from 6 to 12. The size of DNA bands that were produced in the PCRreactions ranged from 300 to 2100 bp, but most of the bands were between 500 and 1000 bp.None of the primers was specific for any of the accessions. However, primers OPE-03 andOPE-04 produced 480 bp and 1200 bp bands, respectively, in TMe 1862 and TMe 2052 only.Also a 920 bp band was generated in TMe 1876 and TMe 2052 only by primer OPF-01, whilea 900 bp band generated by OPO-20 was specific only to TMe 1918 and TMe 1921. Data fromthe scores were subjected to unweighted pair group method with arithmetic averages
87

(UPGMA) analysis. Jaccard's similarity coefficient ranged from 100% for the most closelyrelated accessions to approximately 40% for those most distantly related, with a mean of 69%.With the PCR conditions tested, TMe 1876 showed the highest number of polymorphic bandswhile TME 1906 showed the least. None of the primers could provide enough markers todiscriminate between all the cassava populations. Identical RAPD patterns using the tenprimers were observed for four pairs of the accessions; TMe 1900 and TMe 2055, TMe 1918and TMe 1921, TMe 1972 and TMe 2056, and TMe 2059 and TMe 2066, having 100%Jaccard's similarity coefficient in each case. Also, TMe 1937 and TMe 1951, as well as TMe1906 and TMe 1911, showed 95% and 94% similarity respectively. The similarities betweenaccession TMe 2052 and accessions TMe 1906, TMe 1900 and TMe 2001 are 40%, 42% and42% respectively. Based on the average cluster analysis, the overall genetic relationshipsamong the investigated accessions is illustrated in the dendrogram in Fig. 1. The accessions canbe categorised into 6 groups at 70% Jaccard's similarity coefficient level.
0.5 0.6 0.7 0.8 0.9 1.0
1—
r
TMe 2020
I Me 1962TMe 1972TMe 2056TMe 2001TMe 2059
TMe 2066
TMe 1923
TMe 2034
TMe 1900TMe 2055TMe 1956TMe 2038
TMe 1921TMe 1918
TMe 1868
TMe 1911
TMe 1906
TMe 1879
TMe 1885• TMe 1951
L- TMe 1937
- TMe 2060
• TMe 1922
- TMe 1876
- TMe 1862
- TMe 1938
- TMe 2052
Group I
Group II
Group III
Group IV
Group V
Group V
FIG. 1. Average linkage cluster analysis of 28 Republic of Benin cassava accessions constructed froma pair-wise comparison ofRAPDs between accessions by the Jaccard similarity index and UPGMA.

3.2. West African landraces resistant to ACMD
Nine random primers selected from a preliminary survey gave RAPD fragments rangingin size from 300 bp to 2500 bp. The amplified fragment sizes generated in the analysis aresimilar to those previously reported in cassava germplasm [11]. The number of amplifiedfragments of the cassava germplasm varied according to the tested primers, the averagenumber being eight. Among the total of 74 amplified fragments, twenty were monomorphicand were not considered in the statistical analysis. The remaining 54 polymorphic fragmentswere used in principal component analysis and 31 were finally selected to effectivelydiscriminate the cassava genotypes.
The dendrogram constructed by hierarchical cluster analysis based on the geneticdistance is shown in Fig. 2. At the 60% similarity level, six groups of clusters could be easilyidentified. The first group of clusters consisted of three landraces from Togo (Toma 378,Toma 393 and Toma 26) and ten from Nigeria (Bidal, Tokunbo, Oko-Iyawo, Power,Akinarinde, 2nd Agric, Bagi wawa, Abbey-Ife, Atu, and Lapai-1). In comparison to thesusceptible check, Isunikankiyan, with an ACMD severity score of four (l=no symptom, 5=severe damage), the genotypes in this group of clusters were highly resistant to ACMD underheavy infection pressure in the field at Ibadan and Ubiaja.. The second group of clusters,genetically distant from the above group, consisted of seventeen genotypes: four from Togo(Toma 37, Toma 75, Toma 76 and Cameroon); three from Benin (RB 92/0188, Cap 96064 andBen 86052); and ten from Nigeria comprising eight landraces (Ofege, Akano, MS 6, TME 1(Antiota), MS 20, Obasanjo, Olekanga and Alice local). The grouping of the two improvedclones with TME 1 is not surprising as they are derivatives of open-pollinated seeds from thelandrace. The third group of clusters consisted of three genotypes. In this group, the geneticstock, 58308, clustered with improved clones, TMS 30572 and TMS 92/0326. The resistanceto ACMD widely used in IITA's cassava breeding program was derived from 58308 which isalso a parent of TMS 30572. TMS 92/0326 was selected from progenies generated on anisolated hybridization plot which had only TME 1 (Antiota) and TMS 30572. These geneticsimilarities are in agreement with their pedigree relationships. The fourth group comprised fivegenotypes: four from Benin ( RB 89/509, 92/0099, RB 92/0116 and RB 92/0123) and onefrom Togo (Gbazekoute). The fifth group consisted of two genotypes: the landraceIsunikankiyan from Ibadan, which has been used widely in the breeding program over the yearsas an ACMD susceptible check and also a source of low cyanogenic potential and mealiness ofthe boiled storage roots; and TMS 30001, a resistant improved clone. Previous research on thegenetics of ACMD resistance showed polygenic inheritance [12]. Therefore, the lack of a fewgenes or some allelic forms of genes controlling resistance could have given rise to thesusceptible phenotype observed in the local variety Isunikankiyan which, though susceptible,tolerates the disease. The sixth group consisted of a lone landrace from Nigeria which was veryresistant to ACMD.
The present study showed that several landraces are genetically distant from 58308 andTMS 30572. Cassava, being an open-pollinated and heterozygous plant, recombines onfarmers' fields and also outcrosses to related species, resulting in greater genetic variability.Farmers' selection for adaptation to local conditions and utilization has taken place andnumerous varieties have emerged in Africa which are good sources of resistance to diseasesand pests, have good food quality traits, and are adaptable to the farming systems [13]. Thesegenetically distant groups of landraces may carry other sources of genes for resistance toACMD. This information is currently being used in the IITA cassava breeding program forstudying the molecular genetics of ACMD resistance. The new sources of resistance are being
89
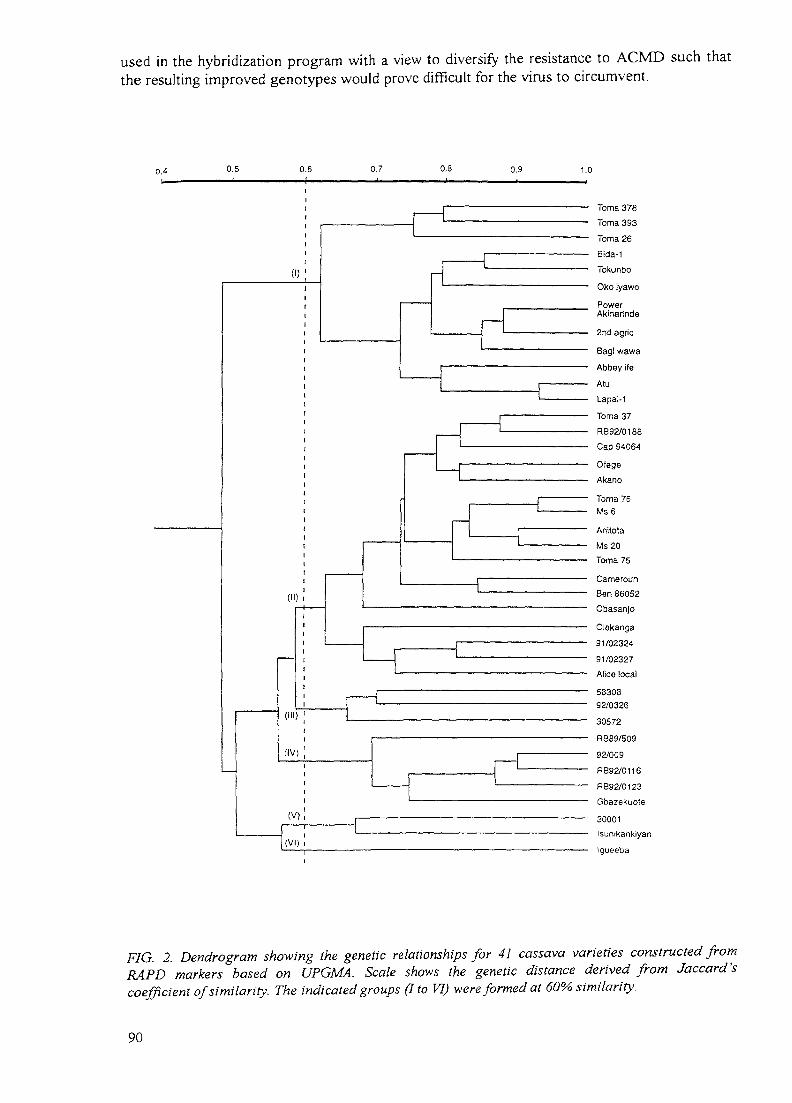
used in the hybridization program with a view to diversify the resistance to ACMD such thatthe resulting improved genotypes would prove difficult for the virus to circumvent.
0.4 0.5 0.6 0.7 0.8 0.9 1.0
(I)
(II)
(III)
(IV)
(V)
(VI)
Toma 378
Toma 393
Toma 26
Bida-1
Tokunbo
Oko iyawo
PowerAklnarfnde
2nd agric
Bagl wawa
Abbey ife
Atu
Lapai-1
Toma 37
RB92/0188
Cap 94064
Ofege
Akano
Toma 76Ms 6
Anitota
Ms 20
Toma 75
Cameroun
Ben 86052
Obasanjo
Olekanga
91/02324
91/02327
Alice local
58308
92/0326
30572
RB89/509
92/009
RB92/0116
RB92/0123
Gbazekuote
30001Isunikankiyan
Igueeba
FIG. 2. Dendrogram showing the genetic relationships for 41 cassava varieties constructed fromRAPD markers based on UPGMA. Scale shows the genetic distance derived from Jaccard'scoefficient of similarity. The indicated groups (I to VI) were formed at 60% similarity.
90

It is also evident from this study that varieties in particular farmers fields may not beunique. This is so because there is a high degree of turnover in cassava genotypes grown byfanners, who are continually introducing new genotypes with desired attributes fromneighboring villages, regions and countries [14]. Hence such genotypes may not be unique tothose particular villages or countries in West Africa where the landraces were collected.
3.3. Genetic diversity in Guinea yams
Based on morphological data, the 446 accessions of cultivated yams used in the presentstudy could be divided into 34 varietal groups. Among these varietal groups, eighteen weredescribed previously from the materials collected in C™te d'lvoire and two from BeninRepublic [14]. Fourteen new varietal groups were identified in the germ plasm.
Although isozyme markers provided good genetic markers for yam varietal groupidentification, the level of intra-varietal polymorphism was low. Moreover the cost of isozymeassays was relatively high. Hence, RAPD markers were used to analyse the thirty-four varietalgroups identified. The RAPD markers showed great variability between the 34 varietal groupsidentified. Some of the markers appeared to be variety-specific which could be used foridentification and classification of Guinea yams in West and Central Africa.
3.4. Phylogenetic relationships between wild and cultivated yams of Nigeria
A similarity matrix based on Jaccard's coefficients was used to establish the level ofrelatedness between the cultivated and wild accessions ofDioscorea species (data not shown).From this matrix the mean genetic distances between species were computed (data not shown).The similarities among some accessions within D. cayenensis, D. rotundata, D. praehensilis,and D. burkilliana were 100 percent which suggest that they are identical genotypes andtherefore might be duplicates. The estimates of similarity ranged from 0.48 between D.rotundata (6) and, D. burkilliana (59) to 100 between some accessions of D. rotundata, D.abyssinica and D. praehensilis. The molecular marker data identified two major groups ofspecies at 0.70 level of similarity on the UPGMA dendrogram (Fig. 3). The first groupcomprises the cultivated accessions of D. rotundata and wild species D. abyssinica, D.praehensilis and D. liebrechtsiana and the phenotypically intermediate types between D.praehensilis and D. liebrechtsiana. The second group comprises the accessions of D.cayenensis and those of the wild species D. burkilliana. In this study the accessions ofcultivated white yam, D. rotundata, displayed fifteen genotypes which were separated intothree groups. The major group, which comprises twelve different genotypes, was closelyrelated to the wild species D. praehensilis. One genotype which showed intermediatemorphological characteristics between D. abyssinica and D. rotundata was closely related tothe wild species D. abyssinica. The third group of D. rotundata genotypes occupied anintermediate position between the two wild species D. abyssinica and D. praehensilis.
In order to identify which wild species shared exchanged genetic information with thethree intermediate genotypes of D. rotundata (12,14,15), the PC A was undertaken. The firsttwo principal components which accounted for 51% of the variation effectively discriminatedthe species. Among the intermediate genotypes, D. rotundata (14), genotype was a hybridbetween D. abyssinica and D. rotundata while the other D. rotundata (12,15) genotypes wereidentified as hybrids between D. rotundata and D. praehensilis.
91
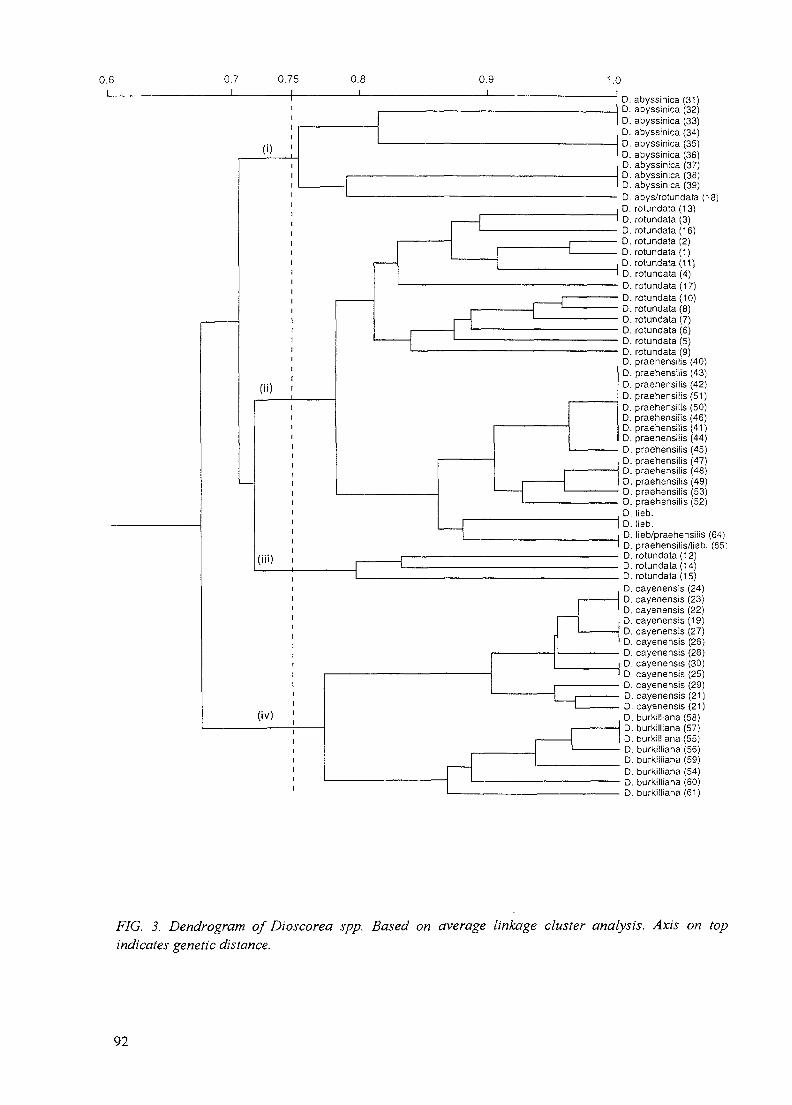
0.6I
0.7 0.75 0.6 0.9i
1.0
(ii)
(iii)
(iv)
D. abyssinica (31)D. abyssinica (32)D. abyssinica (33)D. abyssinica (34)D. abyssinica (35)D. abyssinica (36)D. abyssinica (37)D. abyssinica (38)D. abyssinica (39)D. abys/rotundata (18)D. rotundala (13)D. rotundata (3)D. rotundata (16)D. rotundala (2)D. rotundala (1)D. rotundata (11)D. rotundata (4)D. rotundata (17)D. rotundata (10)D. rotundata (8)D. rotundata (7)D. rotundata (6)D. rotundata (5)D. rotundata (9)D. praehensilis (40)D. praehensilis (43)D. praehensilis (42)D. praehensilis (51)D. praehensilis (50)D. praehensilis (46)D. praehensilis (41)D. praehensilis (44)D. praehensilis (45)D. praehensilis (47)D. praehensilis (48)D. praehensilis (49)D. praehensilis (53)D. praehensilis (52)D. lieb.D. lieb.
D. lieb/praehensiiis (64)D. praehensilis/lieb. (65;D. rotundata (12)D. rotundata (14)D. rotundata (15)D. cayenensis (24)D. cayenensis (23)D. cayenensis (22)D. cayenensis (19)D. cayenensis (27)D. cayenensis (26)D. cayenensis (28)D. cayenensis (30)D. cayenensis (25)D. cayenensis (29)D. cayenensis (21)O. cayenensis (21)D. burkilliana (58)D. burkilliana (57)D. burkilliana (55)D. burkilliana (56)D. burkilliana (59)D. burkilliana (54)D. burkilliana (60)D. burkilliana (61)
FIG. 3. Dendrogram of Dioscorea spp. Based on average linkage cluster analysis. Axis on topindicates genetic distance.
92

To further examine the relationship between the species, the phylogenetic analysis usingthe parsimony method was inferred. The same general pattern of relationships between thegenotypes was obtained whereby all the identified genotypes of the cultivated yams describedas D. cqyenensis were found closer to D. burkilliana, whereas the majority of D. rotundatagenotypes were closer to the wild species D. praehensilis and D. liebrechtsiana. Theserelationships indicate that the genotypes of D. rotundata from Nigeria analyzed in the presentstudy likely resulted from multicrosses between these three species D. abyssinica, D.praehensilis and D. liebrechtsiana whereas the D. cayenensis genotypes could haveexchanged genetic information with D. burkilliana.
4. CONCLUSION
The different groups of cassava landraces highly resistant to ACMD are geneticallydistant from the widely used source of resistance and could possess other genes andmechanisms of resistance to ACMD.
A diallel mating programme is being carried out to elucidate the genetics of these sourcesof resistance to ACMD and determine complementarity of the relevant genes as well asallellism for resistance. Mapping populations are being developed for studies on moleculargenetics of resistance to ACMD and identification of reliable molecular markers for use inmarker-assisted selection. To complement this effort, other important traits related to qualityof the storage roots (e.g. cyanogenic potential, culinary attributes) will soon be subjected tosimilar molecular analysis in the quest for further genetic improvement.
A total of 34 varietal groups were identified in yam germplasm from West and CentralAfrica, fourteen of which had not been described previously. RAPD analysis was very usefulfor the assessment of genetic diversity of yams but AFLP analysis detected more polymorphismthan RAPD and thus could be even more efficient for genetic analysis and gene mapping ofyams. These techniques are being applied to generate a linkage map of yams (D. rotundata andD. alata).
ACKNOWLEDGEMENTS
The work on yams was funded by the Gatsby Charitable Foundation, UK as one of thesix projects jointly carried out by IITA and the John Innes Centre, UK.
REFERENCES
[1] ROGERS, S.O., and BENDICH, AJ. Extraction of DNA from milligram amounts offresh, herbarium and mummified plant tissues. Plant Mol. Bol. 5 (1985) 69-76.
[2] TONUKARI, N.J., THOTTAPPILLY, G., NG, N.Q., and MIGNOUNA, H.D. Geneticpolymorphisms of cassava (Manihot esculenta Crantz) within the Republic of Benindetected with RAPD markers, African Crop Science Journal, (submitted) (1997).
[3] SAS Institute user's guide: statistics version. Release 6.03. SAS Institute, NorthCarolina, U.S.A. (1989) 1028 pp.
[4] NEI, M., and LI, W.H. Mathematical model for studying genetic variation in terms ofrestriction endonucleases, Proc. Natl. Acad. Sci. USA 76 (1979) 5269-5273.
[5] ROHLF, F.L. NTSYS-pc Numerical Taxonomy and Multivariate Analysis System.Exeter Publishing, New York (1989) 213pp.
93
[6] HAMON, P., and TOURE., B. Les ignames cultivees du complexe Dioscoreacayenensis-rotundata de Cote d'lvoire. Inventaire et description des cultivarstraditionnels. Catalogue publie par la faculte des Sciences et Techniques et InternationalBoard for Plant Genetic Resources, Rome, Italy, (1986) 63pp.
[7] HUSSAIN, A., BUSHUK, W., RAMIREZ, H., and ROCA, W. Identification of cassava(Manihot esculenta Crantz) cultivars by electrophoretic patterns of esterases enzymes,Seed Sci. Technol. 15 (1987)19-21.
[8] VALLEJOS, E. "Enzyme activity staining", Isozymes in plant genetics and breeding.Part A, (TANKSLEY, S.O., and ORSTON, Eds.). Elsevier Science Publishers B.V.Amsterdam (1983) 469-515.
[9] MIGNOUNA, H.D., ASIEDU, R., CHIKALEKE, V., HAHN, S.K., andTHOTTAPPILLY, G. "Genetic diversity and phylogenetic relationships in the GenusDioscorea using PCR-RAPD", Proceeding of the International Symposium on "1'Afrique face au defi des biotechnologies vegetales: cas de l'igname, Abidjan du 19 au 23avril. Programme et resumes: N 026 (1993).
[10] VOS, P. HOGERS, R. BLEEKER, M., REIJANS, THEO van de L., HORNES, M.,FRIJTERS A., POT, J., PELEMAN, J, KUIPER M., and ZEBEAU, M. AFLP: a newtechnique for DNA fingerprinting, Nucleic Acids Research 23 (1995) 4407-4414.
[11] MARMEY, P., BEECHING, J.R., HAMON, S., and CHARRIER A. Evaluation ofcassava {Manihot esculenta Crantz) germplasm collections using RAPD markers,Euphytica 74 (1994) 203-209.
[12] HAHN, S.K., TERRY, E.R., and LEUSCHNER K. Breeding cassava for resistance tocassava mosaic disease, Euphytica 29 (1980) 673-683.
[13] MAHUNGU, N.M., DIXON, A.G.O., and MKUMBIRA, J. Breeding cassava formultiple pest resistance in Africa, African Crop Science Journal 2 (1994) 553-562.
[14] NWEKE., F.I, DIXON, A.G.O., ASIEDU, R., and FOLAYAN, S.A. Cassava varietalneeds of farmers and the potential for growth in Africa. Collaborative Study of Cassavain Africa. (COSCA) Working Paper No. 10. Resource and Crop management Division,International Institute of Tropical Agriculture, Ibadan Nigeria. (1994) 239 pp.
[15] HAMON, P., and TOURE, B. Characterization of traditional yam varieties belonging tothe Dioscorea cayenensis-rotundata complex by their isozymic patterns, Euphytica 46(1990)101-107.
94
MOLECULAR PHYLOGENY OF MANGROVES IV. XA98484 5NATURE AND EXTENT OF INTRA-SPECIFIC GENETIC VARIATIONAND SPECIES DIVERSITY IN MANGROVES
A. PARIDA, M. PARANI, M. LAKSHMI, S. ELANGO, N. RAM, C.S. ANURATHAM.S. Swaminathan Research Foundation, Taramani,Madras, India
Abstract
Mangroves occupy estuarine ecosystems in the tropical regions of the world. Despite their highlyproductive nature and the protective roles they play in the coastal region, the ecosystem as a whole isunder severe threat due to various climatic and anthropogenic factors. Therefore, the need forconservation of mangroves is widely emphasised. However, information on existing genetic diversitybased on which a strategy for genetic conservation is to be drawn is not available for mangroves. This isprimarily because conventional genetic analysis is difficult in these species for various reasons.Therefore, as an aid to our on-going conservation programme, efforts were made to assess the natureand extent of diversity in a number of mangrove species of the Indian coast using molecular markers.The nature and extent of intra-population diversity in sixteen mangrove species and detailed analysis ofinter-population genetic polymorphism in four species, Acanthus ilicifolius, Excoecaria agallocha,Avicennia spp and Rhizophora (species and hybrid), is reported in the present communication.
1. INTRODUCTION
1.1. Coastal ecosystem: problems and prospects
The coastal ecosystem, that suffers from the twin problems of low productivity anduncertain yield, is an important part of the natural base of our country. Since these regionsform vital bridges between the terrestrial and aquatic ecosystems, their preservation is essentialto maintain the ecological balance and biodiversity. Despite their ecological and economicsignificance, the effects of current resource use practices evident both in the inland and coastalareas have rendered various forms of stresses on the coastal ecosystem. Increasing soil erosionand water pollution caused by intensive farm practices in the inland areas that gets transportedthrough the river and canal systems are quite adversely affecting the coastal systems.Moreover, the sea water intrusion and the attendant soil and water quality problems caused bythe ground water depletion have already started threatening the very sustainability ofagricultural systems in the Saurashtra region of Gujarat and Tanjavur region of TamilNadu. Atthe same time, it is anticipated that by the year 2000, the human population living within 60 kmof the shoreline will grow by over 50 per cent. Many of the world's poor are crowded in thecoastal area and coastal resources are vital for the security of their livelihood. Above all, theproblem of a rise in sea level, expected to be on the order of 8-29 cms due to global warmingby 2025, makes the need to take concrete steps to ensure the sustainable management of thecoastal ecosystem all the more urgent.
1.2. Mangroves
The coastal ecosystems are characterised with various physical, climatic andanthropogenic pressures. The most productive vegetation in the coastal regions are a group ofspecialised tree species, the mangroves, growing in the inter tidal and estuarine areas and aresubject to high physical stress conditions such as high salinity and water logging. It is one ofthe most productive ecosystems of the world. It supports various micro-organisms and other
95

invertebrate species. They are the primary nursery ground for a number of commercial shrimp,crab and fish species. The total fish catch in the mangrove swamps account for about 68 percent of total world production. They also stabilise shoreline and provide protection from tidalbores, ocean currents and storm surges. In addition, these plant species possess valuablecharacters for potential use in developing novel genetic material for adaptation to the everfluctuating climatic extremes of the coastal zone.
Mangroves are very specialised forest ecosystems of the tropical and subtropical coastalregions of the world bordering the sheltered seacoasts and estuaries. Mangrove forests havevaluable natural resources with high productivity and, hence, are often over-exploited forvarious purposes. The magnitude of the threat to this ecosystem is on the rise as more andmore mangrove forests throughout the world are being used for agriculture, wood resourcesand forest products [1]. The increasing dependency of the local population on the mangrovespecies for various products and usage further threatens the sustainability of the system.Constant environmental and anthropogenic pressures on the ecosystem have led to a rapiddecline of many natural populations of different species. This is evident from the fact that theonce widely prevalent mangrove genus Rhizophora is now at the verge of extinction [2].
India, with a coastline of about 7500 km, represents 8 per cent of the world mangrovearea [3]. However, in terms of species composition, it is represented by 60 species belongingto 42 genera and 29 families which are predominantly distributed along the eastern coast ofIndia and that account for about 82% of Indian mangroves [4]. An alarming rate of depletionin the mangrove areas is being seriously felt in India; it has been reported that there has beenabout a 25% reduction in the mangrove forest cover along the Indian region during the last 25years. This necessitates effective action plans to conserve and restore this valuable ecosystem.
Given the ecological and economic importance of the mangrove vegetation, and theconsiderable threat both in terms of increasing population pressure in the coastal areas and theexposure to anticipated climatic changes in the region, a concerted and well visualised actionplan must be undertaken for the conservation, restoration, exploitation for useful traits and therational use of these unique genetic resources.
1.3. Mangroves: current status and new approach
Despite the economic and ecological significance of the mangroves, experimental studiesin this group of plant species have almost been completely neglected for a long time. Availablereports on mangroves are highly fragmentary and no worthwhile information is available toaccount for species identity, relationship and evolution among the mangrove species. Based onthe available information it is not possible to partition the observed variation intoenvironmental and heritable components. As is well known, the phenotype is the result ofintricate interaction of the genotype and the environment. The highly fluctuating environmentalconditions in the coastal region inhabited by the mangroves influence, to a large extent, thephenotypic variation within and between the species. Hence, species identification anddelimitation, based on quantitative characters and phenotypic markers, have resulted in theconfusing taxonomic status of the mangrove species. It was in this context, that molecularmarker based analyses of genetic material (DNA/RNA) or gene products (proteins/isoenzymes)were considered as the best means for studies related to identification, assessment of diversity,elucidating species relationship and depicting phylogenetic trends within and between themangrove species of Indian region.
96
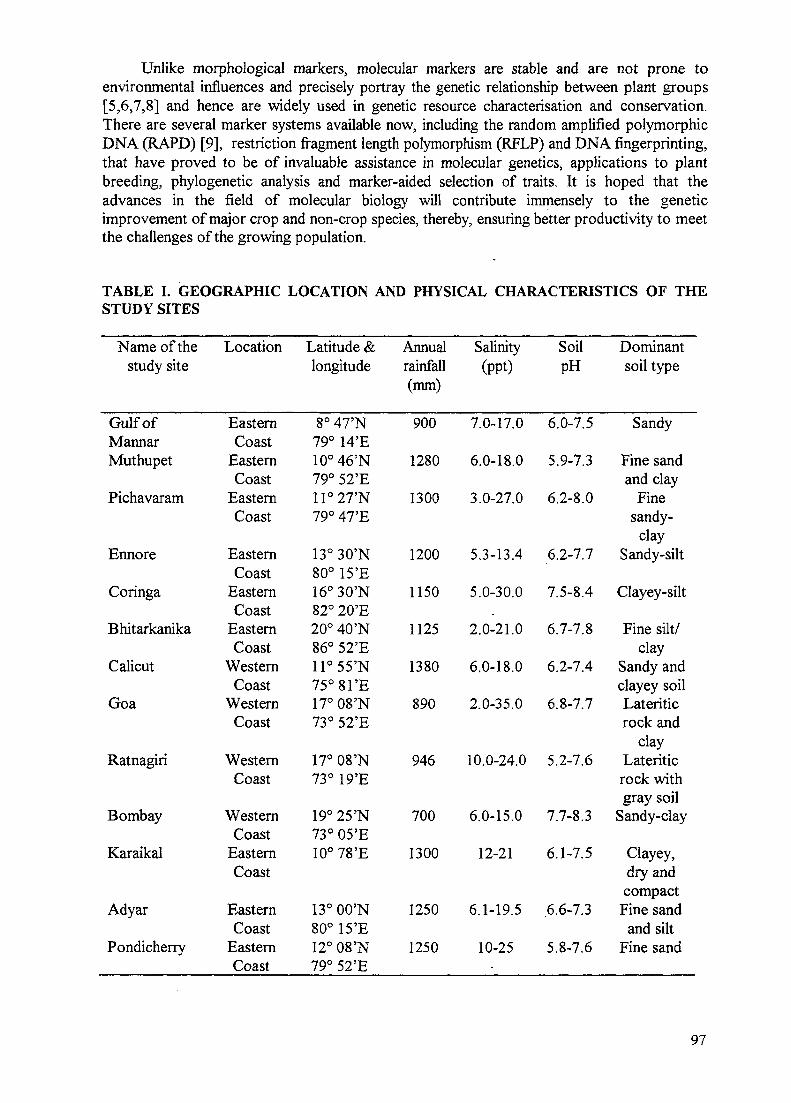
Unlike morphological markers, molecular markers are stable and are not prone toenvironmental influences and precisely portray the genetic relationship between plant groups[5,6,7,8] and hence are widely used in genetic resource characterisation and conservation.There are several marker systems available now, including the random amplified polymorphicDNA (RAPD) [9], restriction fragment length polymorphism (RFLP) and DNA fingerprinting,that have proved to be of invaluable assistance in molecular genetics, applications to plantbreeding, phylogenetic analysis and marker-aided selection of traits. It is hoped that theadvances in the field of molecular biology will contribute immensely to the geneticimprovement of major crop and non-crop species, thereby, ensuring better productivity to meetthe challenges of the growing population.
TABLE I. GEOGRAPHIC LOCATION AND PHYSICAL CHARACTERISTICS OF THESTUDY SITES
Name of thestudy site
Gulf ofMannarMuthupet
Pichavaram
Ennore
Coringa
Bhitarkanika
Calicut
Goa
Ratnagiri
Bombay
Karaikal
Adyar
Pondicherry
Location
EasternCoast
EasternCoast
EasternCoast
EasternCoast
EasternCoast
EasternCoast
WesternCoast
WesternCoast
WesternCoast
WesternCoast
EasternCoast
EasternCoast
EasternCoast
Latitude &longitude
8° 47'N79° 14'E10° 46'N79° 52'E11°27'N79° 47>E
13° 30'N80° 15'E16° 30'N82° 20'E20° 40'N86° 52'E11°55'N75°81'E17° 08'N73° 52'E
17° 08'N73° 19'E
19° 25'N73° 05'E10° 78'E
13° 00'N80°15'E12° 08'N79° 52'E
Annualrainfall(mm)
900
1280
1300
1200
1150
1125
1380
890
946
700
1300
1250
1250
Salinity(PPt)
7.0-17.0
6.0-18.0
3.0-27.0
5.3-13.4
5.0-30.0
2.0-21.0
6.0-18.0
2.0-35.0
10.0-24.0
6.0-15.0
12-21
6.1-19.5
10-25
SoilpH
6.0-7.5
5.9-7.3
6.2-8.0
6.2-7.7
7.5-8.4
6.7-7.8
6.2-7.4
6.8-7.7
5.2-7.6
7.7-8.3
6.1-7.5
6.6-7.3
5.8-7.6
Dominantsoil type
Sandy
Fine sandand clay
Finesandy-
claySandy-silt
Clayey-silt
Fine silt/clay
Sandy andclayey soilLateriticrock and
clayLateriticrock withgray soil
Sandy-clay
Clayey,dry andcompact
Fine sandand silt
Fine sand
97
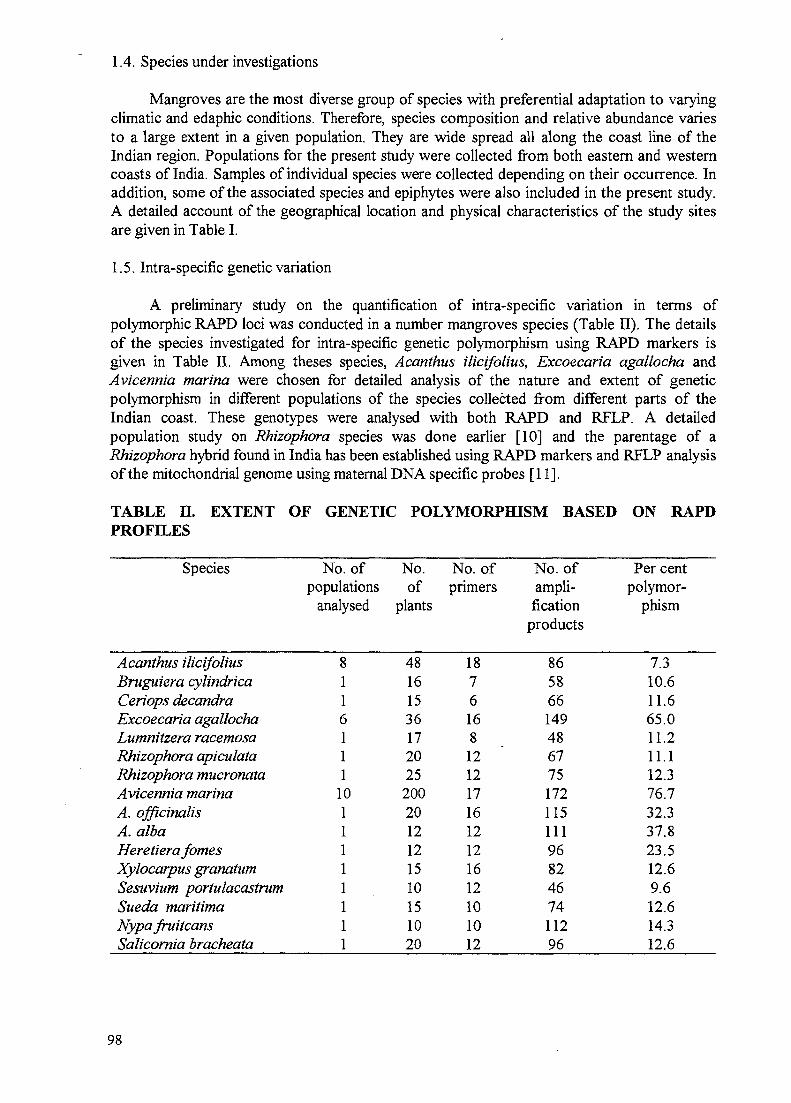
1.4. Species under investigations
Mangroves are the most diverse group of species with preferential adaptation to varyingclimatic and edaphic conditions. Therefore, species composition and relative abundance variesto a large extent in a given population. They are wide spread all along the coast line of theIndian region. Populations for the present study were collected from both eastern and westerncoasts of India. Samples of individual species were collected depending on their occurrence. Inaddition, some of the associated species and epiphytes were also included in the present study.A detailed account of the geographical location and physical characteristics of the study sitesare given in Table I.
1.5. Intra-specific genetic variation
A preliminary study on the quantification of intra-specific variation in terms ofpolymorphic RAPD loci was conducted in a number mangroves species (Table II). The detailsof the species investigated for intra-specific genetic polymorphism using RAPD markers isgiven in Table II. Among theses species, Acanthus ilicifolius, Excoecaria agallocha andAvicennia marina were chosen for detailed analysis of the nature and extent of geneticpolymorphism in different populations of the species collected from different parts of theIndian coast. These genotypes were analysed with both RAPD and RFLP. A detailedpopulation study on Rhizophora species was done earlier [10] and the parentage of aRhizophora hybrid found in India has been established using RAPD markers and RFLP analysisof the mitochondrial genome using maternal DNA specific probes [11].
TABLE H. EXTENT OF GENETIC POLYMORPHISM BASED ON RAPDPROFILES
Species
Acanthus ilicifoliusBruguiera cylindricaCeriops decandraExcoecaria agallochaLumnitzera racemosaRhizophora apiculataRhizophora mucronataAvicennia marinaA. officinalisA. albaHeretiera famesXylocarpus granatumSesuvium portulacastrumSueda maritimaNypafruitcansSalicornia bracheata
No. ofpopulations
analysed
8116111
1011111111
No.of
plants
481615361720252002012121510151020
No. ofprimers
18761681212171612121612101012
No. ofampli-fication
products
8658661494867751721151119682467411296
Per centpolymor-
phism
7.310.611.665.011.211.112.376.732.337.823.512.69.612.614.312.6
98

2. MATERIALS AND METHODS
DNA isolation and PCR amplification for RAPD were carried out according to themethods detailed earlier [12]. DNA extraction for all the investigated species were done usingthe leaf tissues, except for Rhizophora, for which petals were used. Southern transfer andhybridization were done according to the methods in Sambrook et al. [13]. Statisticalinterpretation was carried out using Nei's index [14] and unweighted pair group method witharithmetic averages (UPGMA) analysis [15].
3. RESULTS
3.1. Acanthus ilicifolius
Acanthus is the only genus in the family Acanthaceae that has representatives inmangrove communities. A. ilicifolius is typically a low woody herb that owes its ability forvegetative spread to its reclining stems so that it forms large patches by vegetative means. Theepidermal glands in the leaves secretes salt which enable the plant to thrive in water with abovenormal salt concentration.
Plant samples from eight distinct populations along the eastern (Pichavaram, Karaikal,Pondicherry, Muthupet & Bhitarakanika) and western (Goa, Ratnagiri & Calicut) coasts ofIndia were collected and assayed for RAPD and RFLP markers. Six randomly selectedgenotypes from each population were included in the present study. Geographical location andphysical charactereistics of these populations are given in Table I. The samples were initiallyscreened for intra-population variation using RAPD markers generated by 15-18 primers. Intotal, 69 to 78 RAPD loci were scored in each population. Pair wise comparison within thepopulations using dissimilarity index and clustering by UPGMA was carried out. Based on thispreliminary anlysis using RAPD markers, one representative genotype from each populationwas selected. Thirteen random primers amplified 73 fragments, of which 22 were polymorphicin at least one pair wise comparison. The RAPD profiles of one representative sample fromeach population is given in Fig. 1. Two primers gave monomorphic banding pattern. Otherprimers produced a number of fragments common to all the genotypes. However, populationspecific bands were also observed enabling identification of the genotype from individualpopulations with one or two primers [16].
For RFLP analysis within populations, the same genotypes were digested with threerestriction enzymes, Eco RI, EcdKV and HindiH, and hybridised with two PCR amplifiedfragments and three pUCWPstl genomic DNA library clones of A. ilicifolius as probes.Polymorphism in RFLP within populations ranged narrowly between 3.1 (Pichavaram) and 9.1(Karaikal) per cent. Since the level of intra-population variation was less, five out of the eightpopulations were selected for inter-population study. One genotype from each of the fivepopulations was selected at random and the DNA was digested with the three enzymes usedfor intra-population study and probed with the same probes. A total of 96 RFLP fragmentwere observed and of which 44 were polymorphic. The relationship between the populationswas analysed using the 22 polymorphic RAPDs and 44 RFLPs. The two eastern populationsformed a distinct cluster separated at a dissimilarity coefficient (DC) of 0.28, and the threepopulations from the weatern coast were separated from this cluster at a DC of 0.36, 0.39 and0.42 [16].
99

• > • • „ • • . * .
' . • • • • ' • . * •
1 ' ' ' . • • " . ' . ' • : •
. ; :?v-.V.
, - ; • = • • = • • ' • • ' •
FIG. 1. Interpopulation RAPD profile in Acanthus ilicifolius
3.2. Excoecaria agallocha
Among the 5000 odd species of the family Euphorbiaceae, only Excoecaria agallocha isfound in the mangrove habitats. This species is generally considered as a mangrove associatewith landward habitation where there is low salinity. However, this species was also observedwell inside the mangrove forest along with Avicennia marina which is a widely saline tolerantmangrove species. It is a dioecioous species and thus cross-fertilization is the rule.
Six different populations of this species (Pichavaram, Pondicherry, Bhitarakanika, Adyar,Ratnagiri & Goa) were sampled to assess the extent of genetic polymorphism using RAPDmarkers. The geographical location and physical characteristics of the populations are given inTable I. Six genotypes from each population were selected at random and leaf samples werecollected for the present study. Total genomic DNA was isolated and a single primer assay wasdone with 16 primers. Out of 149 amplified DNA fragments, 97 were polymorphic (65%) in atleast one pair-wise comparison. One genotype from each population was selected at randomand RFLP anlaysis was done in 15 enzyme-probe combinations using the genomic clones fromother mangrove species like Avicennia marina as probes. Seventy-four per cent of the RFLPswas found be polymorphic across the six populations. The high degree of polymorphismencountered in this species could be attributed to its outbreeding nature.
Male and female plants from each population were subjected to RAPD analysis using 20primers to find out whether the polymorphism was dependant on sexual differences. Nodiscrete differences were observed in the amplification products of male and female plantsamplified by as many as sixteen primers. Although differences in the profiles were observed forthe other four primers, in all, about 92% of the amplified fragments were common to both maleand female genotypes.
100
In addition, the usefulness of two primer assay in genetic analysis of mangroves wasexamined in E. agallocha. Six primers were assayed individually, and then in all possiblecombinations of two primers. It was observed that the two primer assay products were thesimple addition of those observed in the two corresponding single primer assays. Neitheradditional bands nor loss of bands were observed in the two primer assay. However, additionalnumbers of primers and combinations have to be done before reaching any firm conclusion.
3.2. Avicennia spp
Avicennia L. is a pantropical, exclusive mangrove genus of eight species, occupyingdiverse mangrove habitats. The genus was initially included in the family Verbenaceae but itsplaement as a separate family, Avicenniaceae, is now generally accepted. We have almost noknowledge of intra-specific variations in any of the Avicennia species based on non-morphological characters like biochemical and molecular markers. Therefore, the nature andextent of intra-specific variation was analysed in three species of Avicennia, A marina, A.officinalis and A. alba, and the inter-specific relationship between them was established usingDNA markers (RAPD and RFLP).
Ten ecogeographically distinct locations, along the eastern (Gulf of Mannar, Muthupet,Pichavaram, Ennore, Coringa & Bhitarkanika) and western coast (Calicut, Goa, Ratnagiri &Bombay) of India were chosen (Table I) and twenty individuals of A. marina from eachlocation, eighteen individuals of A. officinalis from Pichavaram and ten individuals of A. albafrom Coringa were selected at random for molecular analysis. Intra-population analysis in A.marina revealed varying degrees of genetic polymorphism in their RAPD profiles.Polymorphism was highest in the Muthupet population (38.9%) followed by Bhitarkanika,Pichavaram, Goa, Gulf of Mannar and Coringa populations. The Ennore population exhibitedthe lowest polymorphism of 17.8 per cent. This population represents back water mangrovecomprised of patches of A. marina. When clustering was done, all the populations formed twodistinct clusters with varying numbers of individuals.
Therefore, for inter-population study, one genotype from each cluster of individualpopulations (i.e. two individuals from each population and twenty individuals in total) wasselected at random, and subjected to RAPD and RFLP analyses. Variation in RAPDs wasstudied using fifteen primers. For RFLP analysis DNA from the various genotypes wasdigested with EcdRl and Hindlll and probed with twelve genomic clones. The genomic cloneswere obtained from aPM/pUC genomic library of A. marina and A. officinalis. In total 172RAPDs were amplified, out of which 132 were polymorphic (76.7%). RFLP analysis of thesame genotypes showed 66 per cent polymorphism. This indicated higher genetic divergencebetween the populations than within the populations [17]. The cluster diagram for inter-population relationship is shown in Fig. 2. RAPD analysis of 18 genotypes of A. officinalis and11 genotypes of A. alba revealed 32.3 and 37.8 per cent polymorphism respectively. Clusteringbased on dissimilarity coefficient showed two distinct clusters in both the species. The clusterdiagram for A. officinalis is shown in Fig. 2.
For inter-specific study, one individual from the major cluster of A. officinalis(Pichavaram), A. alba (Coringa) and A. marina (Pichavaram) was randomly selected torepresent the respective species. RAPD analysis of the three samples was done using all theprimers used for the inter-population study in A. marina. For RFLP analysis, the samples weredigested with £coRI, Hindill, Taql and Sau3AL and probed with 24 genomic clones. Geneticdistance as measured by similarity percentage in RAPDs and RFLPs showed that the widely
101

distributed A. marina is more closely related to A. alba than to A. officinalis, as shown in Fig.2.
(a) (b)
100-
•5 5 0 -
1 2 *
J_L n.
r1
rrJZL
1
(c)
A.marina
016Aalba A.otficnol!
FIG. 2. a) Intra-population dendrogram constructed based on 31 variable RAPDs of 18 genotypes ofA. officinalis collected from Pichavaram population; b) Inter-population dendrogram constructedbased on 132 RAPDs and 62 RFLPs of A. marina. The populations sampled were from Gulf ofMannar, Gm; Muthupet, M; Pichavaram, Ennore, E; Coringa, Co; Bhitarkanika, B; Calicut, C; Goa,Go; Ratnagiri, R; and Bombay, Bo. © Figure drawn on arbitrary scale based on genetic distanceshowing the inter-specific relationship among A. marina, A officinalis andA.alba.
3.4. Rhizophora
There are six species and three putative hybrids reported in Rhizophora [18]. Rhizophoraxlamarckii Montr, is one of the putative hybrids between R. apiculata and R. stylosa Griff,found in New Caledonia, Papua Guinea and Queensland [18,19,20], Initially, the Rhizophorahybrid found in the Pichavaram Mangrove Forest has been identified as R. xlamarckii [21,22]based on morphological features and co-occurence of the putative parents. However, parent-age of this hybrid was disputed for the reasons that R. stylosa does not occur in thePichavaram Mangrove Forest and morphological features of the R. xlamarckii described byDuke and Bunt [20] differed with that of the hybrid present in this area [23]. In this regard, themolecular markers can establish not only the parentage, but also the maternal parent, which isalmost impossible with morphological markers.
In the present study, RAPD patterns of genomic DNA (using 25 primers) and RFLPs ofmitochondrial DNA (digested with three enzymes) using a mitochondrial genome specificprobe, atp 6 (from maize), were used to identify the parentage of the Rhizophora hybrid. Thecombined RAPD profiles of two species, Rhizophora apiculata and R. mucronata had 96.5 percent similarity with that of the hybrid, indicating that these two species are the probableparents. RFLPs for the mitochondria! genome were readily observed, and the RFLP profile of
102

R. apiculata was exactly similar to that of the hybrid, establishing its maternal status for thehybrid [11].
From the results, it was concluded that the Rhizophora hybrid found in the PichavaramMangrove Forest is a cross between R. apiculata and R. mucronata and that the former wasthe female parent of the hybrid under study. Based on the results, using the RAPD fingerprintsof the Rhizophora species and the hybrid established in the present study as a reference, theDNA isolated from the self-sown seedlings of Rhizophora are being analysed to identify thehybrid genotypes for in situ conservation. RAPD analysis which is simple, fast and easy toperform on large numbers of samples was found to be more useful than other marker systemsfor this purpose.
4. SPECIES DIVERSITY
The origin and distribution of mangrove is well documented. They occupy the latitudinalrange between 32N and 38S, and are found mostly on the eastern boarder of continents. Thisrestricted distribution is due to sensitivity of mangroves to frost and cold temperature [24],The two distinct patterns of geological distribution is said to have been caused by continentalrearrangements and plate tectonics.
Mangroves consist mostly of taxonomicaUy unrelated plant species, nevertheless havesimilar physiognomy, and physiological and structural adaptation to the essential characteristicsof the habitat as a result of convergent evolution [25]. As already mentioned, the eastern coastof India (including the Andaman and Nicobar islands) accounts for about 82% of the mangrovearea in this country. The number of species found in major mangrove formations of the easterncoast also varies to a greater extent. For example, while greater numbers of diverse species arepresent in places like Pichvaram, Bitarkanika and Sunderbans, relatively few species are foundin Coringa, and pure stands ofAvicennia are observed in Muthupet (Tamil Nadu).
Therefore, understanding the intra-specific diversity in individual species (as describedabove for a few species), the physical distribution range of the species, their association withmangroves and mangrove associates, the genetic relatedness among these taxonomicaUyrelated species and the causative genetic and environmental factors limiting the species richnessare essential to design an effective long-term conservation strategy for the mangroveecosystem as a whole. Yet, the study will not be complete without looking into the micro-organisms and the faunal community of the ecosystem. Studies on these aspects will bereported elsewhere.
To start with, a detailed study using molecular marker was taken up to establish thegenetic relatedness among the major mangove genera. Initially 21 different species belongingto fourteen genera were analysed. It was observed that different species of the same genus didnot show much variation, and formed discrete clusters. Therefore, the study was extended toinclude additional genera by utilising only one species in a genus. In total, 22 genera includingthree monocots (two mangrove genera and one non-mangrove genus) two mangroveepiphytes, 4 mangrove associates and Lycopersicon as an out group were analysed. Thegenotypes were analysed for RAPDs using fifteen primers and for RFLPs in 21 probe-enzymecombinations. Details of the species relationships shall be reported at a later date.
103
5. CONCLUSIONS AND FUTURE PERSPECTIVES
The present analyses were carried out as a part of our ongoing anticipatory researchprogramme to consolidate genotypes capable of adapting to the ever-fluctuating climaticconditions in the coastal region. The results have undoubtedly helped us to understand thenature and extent of diversity in the Indian mangrove species both at the intra-population andinter-population levels. This has helped in selecting priority areas and sampling strategies forconservation and improvement. Molecular marker based analysis has also contributedimmensely in elucidating confusing taxonomic status and establishing phylogenetic trends inmangroves. These analyses have opened up new avenues of research in utilising potentialgenetic material for combating present and anticipated problems in the coastal region. Isolationand characterisation of salt tolerant genes and their transfer to economically important speciesof the coastal region is among the utmost priorities.
ACKNOWLEDGEMENT
We are grateful to Prof. M.S. Swaminathan for his valuable suggestions. The financialassistance from Department of Biotechnology, Govt. of India; International Atomic EnergyAgency and International Plant Genetic Resources Institute is gratefully acknowledged.
REFERENCES
[I] SNEDAKER, S.C. Mangroves: their value and perpetuation, Nat. and Res. 14 (1978) 6-13.
[2] BLASCO, F. "Outlines of ecology, botany and forestry of the mangals of the Indiansubcontinent", Ecosystems of the World, vol. 1. Wet Coastal Ecosystems (V.J.CHAPMAN, Ed.) Elsevier Scientific, Amsterdam, (1977) 242-258 pp.
[3] ANONYMOUS. Status Report Mangroves in India, Ministry of Environ, and Forest,Govt. of India (1987).
[4] UNTAWALE, A.G. Mangroves of India: Present status and multiple use practices,UNDP/UNESCO Regional Mangrove Project, (1985) 67 pp.
[5] POWELL, W. "Plant genomes, gene markers and linkage maps", Biotechnology andCrop Improvement in Asia, (MOSS, J.P., Ed.) ICRISAT, India (1992) 297-322 pp.
[6] BROWN, A.H.D. Enzyme polymorphism in plant populations, Theor. Pop. Bio. 15(1979) 1-42.
[7] BECKMANN, J.S., and SOLLER, M. Restriction fragment length polymorphism in plantgenetic improvement of agricultural species, Euphytica 35 (1986) 35-44.
[8] TANKSLEY, S.D., YOUNG, N.D., PATERSON, A.H., and BONIERBALE, M.W.RFLP mapping in plant breeding: New tools for an old science, Bio/Technology 7 (1989)257-264.
[9] WILLIAMS, J.G.K., KUBELIK, A.R., LIVAK. J., RAFALSKI, A.J., and TINGEY,S.V. DNA polymorphism amplified by arbitrary primers are useful as genetic markers,Nucleic Acids Res. 18 (1990) 6531-6535.
[10] SUBRAMANIAN, N. Studies on genetic diversity in some Rhizophora species. Ph.Dthesis, Centre for Advanced Studies in Botany, University of Madras, Madras, India(1993).
[II] PARANI, M., RAO, C.S., MATHAN, N., ANURATHA, C.S., NARAYANAN, K.K.,and PARK) A, A. Molecular Phylogeny of Mangroves HI. Parentage analysis of aRhizophora hybrid using Random Amplified Polymorphic DNA and RestrictionFragment Length Polymorphism Markers, Aquatic Botany (in press) (1997).
104
[12] PARANI, M., and P ARID A, A. Allozyme and RAPD based genetic polymorphismanalysis in Tylophora indica. J, Biochem and Biotech, 7 (1997) 29-33.
[13] SAMBROOK, J., FRITSCH, E.F. and MANIATIS, T. Molecular Cloning, A LaboratoryManual, Cold Spring Harbor Lab Press.U.S. A (1989)
[14] NEI, M. and LI, W. A mathematical model for studying genetic variation in terms ofrestriction endo nucleases, Proc Natl Acad Sci, USA 76 (1979) 765269.
[15] SNEATH, P.H.A., and SOKAL, R. Numerical Taxonomy, Freeman, San Fransisco, CA.(1973).
[16] LAKSHMI, M., RAJALAKSHMI, S., PARANI, M., ANURATHA, C.S., and PARTDA,A. Molecular Phylogeny of Mangroves I. Use of Molecular Markers in Assesing Intra-specific Genetic Variability in the Mangrove Species Acanthus ilicifolius (Acanthaceae).Theor. Appl. Genet. 94 (1997) 1121-1127.
[17] PARANI, M., LAKSHMI, M., ELANGO, S., NTVEDITA, R., ANURATHA, C.S., andPARIDA, A. Molecular Phylogeny of Mangroves II. Intra- and Inter-specific variation inAvicennia revealed by RAPD and RFLP markers, Genome 40 (1997) 487-495.
[18] TOMLINSON, P.B. The Botany of Mangroves, Cambridge University Press. Cambridge,(1986) 317-360 pp.
[19] BANERJEE, L.K. New distributional records of some mangrove species from Orissacoast, J. Bombay Nat. Hist. Soc. 83 (1986) 271-273.
[20] DUKE, N.C., and BUNT, J.S. The genus Rhizophora (Rhizophoraceae) in North easternAustralia, Aust. J. Bot. 27 (1979) 657-658.
[21] LAKSHMANAN, K.K., and RAJESWARI, M. Distribution of organic contents in theleaves of Rhizophora species, Proc. 70th Ind. Sci. Cong. 3, India (1983).
[22] MUNIYANDI, K., and NATARAJAN, R. Incidence of seedling formation in Rhizophoralamarckii Montr, in Pichavaram mangrove, Tamil Nadu, India. J. Bombay Nat. Hist.Soc. 82(1985)441-442.
[23] KATHTRESAN, K. Rhizophora annanmalai: A new species of mangroves. Environmentand Ecology 13 (1995) 240-241.
[24] WALTER, H. Climate. In V.J.Chapman (ed.) Ecosystems of the World: Wet CoastalEcosystems, Vol. I. Elsevier, New York 1977 54-56 pp.
[25] YANNEY EWUSBE, Elements of Tropical Ecology: Heinemann Educ. Books. London.1980.
105
IMPROVEMENT OF BANANA THROUGH BIOTECHNOLOGYAND MUTATION BREEDING
P.S. RAO, T.R. GANAPATHI, V.A. BAP AT, V.M. KULKARNI, P. SUPRASANNANuclear Agriculture and Biotechnology Division,Bhabha Atomic Research Centre,Trombay, Mumbai, India XA9848416
Abstract
Protocols were standardized for in vitro propagation of several elite and diverse bananaaccessions using shoot tip explants. Tissue culture raised plants were field planted at multiple locations.Studies were undertaken for the induction of mutations using multiple shoot cultures of six selectedcultivars, Shreemanti (AAA), Basrai (AAA), Lai Kela (AAA), Rasthali (AAB), Karibale Monthan(ABB) and a wild diploid (BB). These shoot cultures were irradiated at different doses of gamma rays(0-100 Gy) and subcultured thrice (up to M1V3) to separate chimeras, followed by induction of rooting(M1V4). In general, the rate of multiplication had a negative association with the dose of gamma rays.Enhanced multiplication of shoots was noticed at lower doses. The proliferation of shoots was arrestedbeyond 50 Gy and a dose of 70 Gy was completely lethal for all the genotypes studied. The rootedplantlets were hardened in the green house and in the early stages of field growth, a few cholorophylland morphological variants have been noticed. Preliminary studies have been made with DNA samplesof different varieties and variants for DNA quality and restriction digestion. Studies are underway tocharacterize these using PCR based methods.
1. INTRODUCTION
Banana is an economically profitable fruit crop with a large in-country consumption anda considerable export potential. The world production of banana is about 68.5 million tonnesbut only 7 million tonnes are in world export trade. In India, banana is grown on 3.96 millionhectares with a total production of 10.4 million tonnes. Several cultivars of banana arecultivated in the country among which, Dwarf Cavendish and Robusta are predominantlygrown because of higher yields, resistance to strong winds and short cropping duration besidesyielding a good profit margin [1]. The fruit has good nutritive value with high carbohydrates(22.2%), fibre (0.84%) and protein (1.1%) with less fat (0.2%) and water (75.7%). Banana isa long duration crop of about one and a half years. Edible triploid bananas are vegetativelypropagated by suckers as viable seeds are generally not produced. The production of suckersvaries in different genotypes ranging from five to ten plants per year. Crop productivity andmaturity is dependent on the size and age of suckers and uneven maturity extends the durationby three to four months. Suckers may also carry soil nematodes or disease causing organisms,such as bunchy top virus or leaf spot, thereby affecting the production of the cropconsiderably.
In vitro propagation of banana through shoot tip cultures is useful in the rapidmultiplication of desirable disease free clones. In addition, careful selection and updating ofmother plants results in improved crop yield [2]. New and effective means of propagatingbananas would be advantageous over the conventional use of sucker material, for germplasmmaintenance, exchange and transportation [3,4].
Mutation breeding in vitro is a powerful tool for the induction and selection of desirablemutants which can be utilized in banana improvement [5]. Mutagenic treatments on bananaplants have been reported and in vivo sucker material has proved to be less effective and yielded low
107

mutagenized material for further screening [6,7]. On the contrary, in vitro mutagenesis employingmultiple shoot cultures has several advantages: a high shoot multiplication ratio resulting in efficientchimera separation; a drastic reduction in time and space requirements; ease of treatment withmutagens and subsequent leaching off of chemical mutagens; and optional facility for in vitroselection against various stresses.
The genetic system of Musa is complicated owing to the inherent problems of sterility,heterozygosity and polyploidy in most of the clones. Asexual behavior is often an inseparablebarrier in using cross breeding as a tool for genetic improvement. Mutation induction, usingphysical as well as chemical mutagens, is useful for the induction of genetic variability. DNAfingerprinting is a highly sensitive technique, useful for the detection and characterization ofgenetic variability and also for identification of various genotypes, at the molecular level [8].Notably, the polymorphism measured through this technique is free from any environmentalinterference and can be repeated with precision.
At the Bhabha Atomic Research Centre (BARC), cell and tissue cultures of differentcultivars of banana have been established and an in vitro system for propagation via shoot tipculture has been standardized. Technical know-how for the production of banana plantsthrough micropropagation has been transferred to user agencies which have undertakencommercial production of plants for distribution to farmers. Linkages have been establishedwith agricultural research stations and universities for conducting field trials of tissue culturedeveloped plants. Protocols have been optimized for encapsulation of shoot tips for theproduction of synthetic seeds [9] and for low cost methods for in vitro propagation [10]. Theradiosensitivity of in vitro shoot cultures has been documented in different genotypes.Induction and establishment of embryogenic cell and callus cultures and conversion of somaticembryos into plantlets has been achieved. Different plant growth regulators, dessication,encapsulation and stress treatments are being investigated to enhance the percentage of plantconversion.
Efforts have been made for collecting germplasm from different geographical regionsand, to date, the germplasm collection comprises 26 accessions (Ambat Velchi, Ardhapuri,Bheemkel, Basrai, Chakkera Kela, Elakkibale, Grand Naine, Hajari, Hatti, Karpoorvalli,Karibale Monthan, Lai Kela, Lokhandi, Monthan, Mutheli, Nendran, Poovan, Rajeli, Rasthali,Robusta, Safed Velchi, Shreemanti, Trikoni, Williams and two Wild diploids).
In this article, results on in vitro propagation of different cultivars, effects of gammairradiation on in vitro cultures of six selected genotypes and molecular studies for fingerprinting,conducted as a part of the Coordinated Research Project (CRP) of International AtomicEnergy Agency (IAEA), Vienna, on the 'Mutation breeding and related biotechnologies forbanana improvement, are described.
2. MATERIALS AND METHODS
Plant materials for starting tissue cultures were collected from known and reliablesources for the varieties listed in Table I.
2.1. Establishment of shoot tip cultures and plant regeneration
Shoot tips were isolated from suckers by removing the sheathing leaf bases and wereestablished in liquid MS medium [11] supplemented with 5 mg/L benzyl adenine (BA). Afterthree weeks these were transferred to semi-solid medium comprising of 2 mg/L BA and 30
108
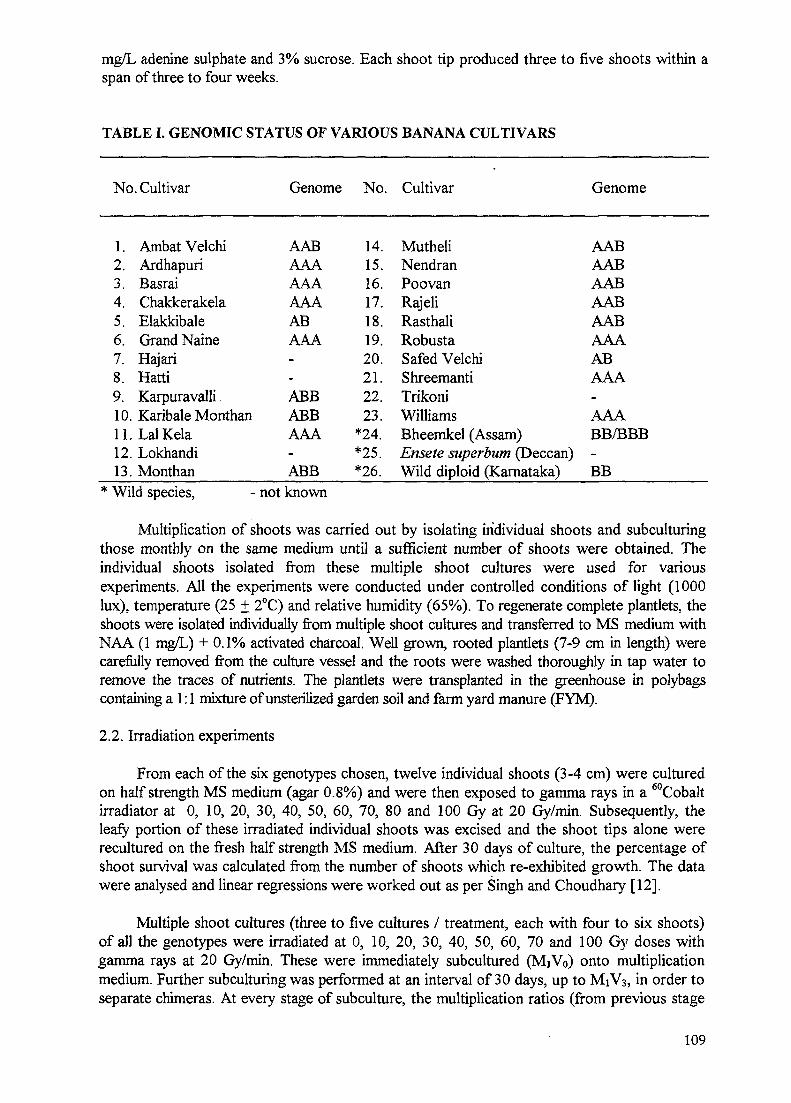
mg/L adenine sulphate and 3% sucrose. Each shoot tip produced three to five shoots within aspan of three to four weeks.
TABLE I. GENOMIC STATUS OF VARIOUS BANANA CULTIVARS
No.Cultivar
1. Ambat Velchi2. Ardhapuri3. Basrai4. Chakkerakela5. Elakkibale6. Grand Naine7. Hajari8. Hatti9. Karpuravalli10. Karibale MonthanILLalKela12. Lokhandi13. Monthan
* Wild species,
Genome
AABAAAAAAAAAABAAA--ABBABBAAA-ABB
not known
No.
14.15.16.17.18.19.20.21.22.23.
*24.*25.*26.
Cultivar
MutheliNendranPoovanRajeliRasthaliRobustaSafed VelchiShreemantiTrikoniWilliamsBheemkel (Assam)Ensete superbum (Deccan)Wild diploid (Karnataka)
Genome
AABAABAABAABAABAAAABAAA-AAABB/BBB-BB
Multiplication of shoots was carried out by isolating individual shoots and subculturingthose monthly on the same medium until a sufficient number of shoots were obtained. Theindividual shoots isolated from these multiple shoot cultures were used for variousexperiments. All the experiments were conducted under controlled conditions of light (1000lux), temperature (25 + 2°C) and relative humidity (65%). To regenerate complete plantlets, theshoots were isolated individually from multiple shoot cultures and transferred to MS medium withNAA (1 mg/L) + 0.1% activated charcoal. Well grown, rooted plantlets (7-9 cm in length) werecarefully removed from the culture vessel and the roots were washed thoroughly in tap water toremove the traces of nutrients. The plantlets were transplanted in the greenhouse in polybagscontaining a 1:1 mixture of unsterilized garden soil and farm yard manure (FYM).
2.2. Irradiation experiments
From each of the six genotypes chosen, twelve individual shoots (3-4 cm) were culturedon half strength MS medium (agar 0.8%) and were then exposed to gamma rays in a 60Cobaltirradiator at 0, 10, 20, 30, 40, 50, 60, 70, 80 and 100 Gy at 20 Gy/min. Subsequently, theleafy portion of these irradiated individual shoots was excised and the shoot tips alone wererecultured on the fresh half strength MS medium. After 30 days of culture, the percentage ofshoot survival was calculated from the number of shoots which re-exhibited growth. The datawere analysed and linear regressions were worked out as per Singh and Choudhary [12].
Multiple shoot cultures (three to five cultures / treatment, each with four to six shoots)of all the genotypes were irradiated at 0, 10, 20, 30, 40, 50, 60, 70 and 100 Gy doses withgamma rays at 20 Gy/min. These were immediately subcultured (MjVo) onto multiplicationmedium. Further subculturing was performed at an interval of 30 days, up to M1V3, in order toseparate chimeras. At every stage of subculture, the multiplication ratios (from previous stage
109

to next stage) were calculated by dividing the 'number of cultures after subculturing' by the'number of cultures before subculturing'.
Individual shoots from M1V3 were isolated and cultured on the rooting medium (MSwith NAA 1 mg/L) to obtain Mi V4 population of rooted plantlets. After 45-50 days, the M1V4plantlets were transferred to perforated polythene bags containing a 1:1 mixture of soil andFYM, and hardened in the green house for 3 months followed by field planting.
3. RESULTS AND DISCUSSION
3.1. Establishment of in vitro regeneration system
3.1.1. Establishment of shoot tip cultures
The fresh shoot tips produced two or three shoots in the span of about three to fourweeks when split longitudinally into two halves and subsequently transferred to semi-solid MSmedium containing BA (2mg/L ) and adenine sulphate (30 mg/L). Upon subculturing theseshoots, each one produced an additional four to six shoots in the subsequent subcultures. Theaverage multiplication ratio was found to be about 5 for varieties such as Basrai, Shreemantiand Lai Kela, whereas Rasthali, Poovan and Karibale Monthan required a little higherconcentration of B A in the multiplication medium to obtain the multiplication ratio of 5 (datanot shown). This indicated genotypic variations in the case of the multiplication ratios in vitroand hence, whenever required, the protocols were modified to optimize in vitro regeneration.
3.1.2. Plantlets' formation and their establishment in the soil
Shoots showed considerable elongation on medium with 1 mg/L NAA and two to fourroots with laterals were noticed within three weeks and the frequency of complete plantletformation was nearly 100%. The plantlets were hardened in the green house for about twomonths and the survival percentage ranged between 95-100%. Subsequently the hardenedplants were planted in the field.
3.1.3. Evaluation of micropropagated plants
To date, more than 20000 plants have been regenerated in test tubes and around 4500plants were planted at multiple locations in the states of Maharashtra and Gujarat for fieldtrials. In almost all the places, the tissue culture raised plants showed vigorous growth, earlymaturity and marginal increase in bunch weight with better quality fruits. In an experimentconducted at the Research and Development farm of Gujarat State Fertilizers Company,Baroda, the data suggested an early maturity by about six weeks and an increase in yield of 33percent, in the tissue cultured plants of cv. Basrai when compared to the control.
3.2. Studies on in vitro mutagenesis
Banana cultivation is seriously hampered by viral and fungal diseases warranting anintensive programme for the diversification of existing clones and breeding superior cultivars.However, problems like parthenocarpy, heterozygosity and difficulties in obtaining viableseeds, have become limiting factors to conventional breeding. In this direction studies wereundertaken for induction of mutations using gamma rays, in six elite cultivars: Shreemanti,Basrai, Lai Kela, Rasthali, Karibale Monthan, and a wild diploid from Kamataka state.
110

3.2.1. Selection of explant material
Use of established in vitro multiple shoots as the initiation material for mutagenictreatment was found to be better than in vivo suckers or freshly cultured shoot tips from fieldgrown plants, since it saved much effort in the establishment of cultures and reduced thechances of contamination and the initial number of shoot tips irradiated.
3.2.2. In vitro multiplication of six selected cultivars for irradiation
In vitro multiple shoot cultures could be easily established from the shoot apices of allthe genotypes used. However, multiplication ratios were influenced by the genomiccomposition. In general, Lai Kela (AAA) and the Wild Diploid (BB) clone exhibited highermultiplication ratios (4.0 and 4.4 respectively) whereas Rasthali (AAB) and Karibale Monthan(ABB) exhibited low multiplication ratios (2.5 and 1.8 respectively) (Table II).
3.2.3. Effect of irradiation on individual shoots
It was observed that the irradiated individual shoots could be scored with precision aslive or dead, only after excision of the leafy portion. The linear regression coefficients of dose(Gy) on the survival percentage of shoots ranged between -0.86 to -0.75 (Fig. 1). The negativevalues of the regression coefficients indicated that shoot survival and irradiation had an inverseassociation. The lethal dose 50% (LD50%) ranged from 30 Gy (Rasthali, AAB) to 52 Gy (LaiKela, AAA), with an average of about 40 Gy (Fig 1). Doses beyond 70 Gy were completelylethal. Hence in further experimentation 0 and 100 Gy doses were included as the standard andlethal controls respectively.
TABLE II. THE GENOTYPES USED FOR bUCO GAMMA IRRADIATION
Name of genotype Genomic background Salient features
BASRAI
SHREEMANTI
LALKELA
RASTHALI
KARIBALE MONTHAN
WILD DIPLOID
AAA
AAA
AAA
AAB
ABB
BB
A clone from Cavendish Dwarf.
A selection from Basrai with increasedheight and yield.
Tall, highly preferred for taste and attractivered fruit skin.
Tall, short fruits with fresh yellow colouredskin and delicious taste.
Tall, keeping quality is the main advantage.
A seeded clone from Karnataka State, iscurrently in cultivation because of tolerancetoBBTV.
I l l

120
100.
SHRIMANTI Cb = 0.86)BASRAI <b = -0.79>LAL KELA tb = -0.76)RASTHALI (b = -0.79)KAR1BALE MONTHAN (b=-0.81)WILD DIPLOID (b---0.75)
< 60 _
CO
40 60 80 100 12020
D O S E ( G y )
FIG. 1. Effect of gamma irradiation on % survival of in vitro individual shoots of banana.
3.2.4. Effect of irradiation on multiple shoot cultures
In general, the shoot multiplication ratio decreased with increasing amount of irradiation;however, the data showed considerable variation (Table III). Furthermore, this variationincreased with advancing subculture cycle (Fig. 2). Interestingly, the multiplication ratios werefound to be enhanced at lower doses (Shrimanti and Rasthali, both at 10 and 20 Gy, and Basraiat 20 Gy) (Table III). The proliferation of the multiple shoots was arrested beyond 50 Gyexcept cv. Shrimanti, 60 Gy) and a dose of more than 70 Gy was lethal for all the genotypesstudied. At higher dose (50 Gy), cv. Lai Kela exhibited numerous clusters of minute shootbuds.
Individual shoots of M1V4 populations could easily be rooted on medium with NAA (1mg/L). Thick and dark coloured roots were noticed in the case of Shrimanti (10 Gy) (Fig. 3a).A shoot culture from cv. Shrimanti exposed to 60 Gy was isolated which neither producedmultiple shoots nor any roots, and where new leaves appeared very slowly (Fig. 3b).
3.2.5. Field evaluation of M1V4
A total of 6300 rooted plantlets were generated from the in vitro irradiation experimentsand hardened in the green house. In the initial growth phase under field conditions, some plantsof Shrimanti (50 Gy) expressed white spots on the first few leaves (Fig. 3d) compared tocontrol (Fig. 3c). Leaf variants were also observed in the case of Karibale Monthan (20 Gy)(Fig. 4b). Plants with a bilateral arrangement of leaves (traveler's palm-like) were noticed incase of Basrai (30 Gy) (Fig. 4c). In cv. Basrai (10 Gy), a single plant has flowered in less than6 months (Fig. 4d). These M1V4 plants are now being observed for their field performance andthe variants will subsequently be re-evaluated for confirmation of the variations noticed.
112

TABLE III. EFFECT OF ^CO GAMMA IRRADIATION ON MULTIPLICATION RATIOSOF IN VITRO CULTURES OF BANANA
Multiplication ratioGenotype
SHREEMANTI(AAA)
BASRA!
(AAA)
LALKELA(AAA)
RASTHALI(AAB)
KARIBALEMONTHAN(ABB)
WILDDIPLOID(BB)
Generation
M,V0->MiV!MiV]->MiV2
M,V2->M]V3M1V3->M,V4
MiV0^>M,Vi
MiV t->MiV2
M,V2^>MiV3
M,V3->MiV4
MiVo^>MiViMiV]->MiV2
MiV2->MiV3
M,V3->M,V4
M,V0->MiViM,Vi ->MiV2
M1V2->M,V3
M!V3->M1V4
M,V0->MiV,MiV]->M,V2
MiV2->M]V3
MiV3->M,V4
MiV0->MiViM,V,->MiV2
M,V2->M,V3
M,V3.>MiV4
0
3.2-4.03.0
-
3.04.83.3
4.0-3.62.6
„
2.22.12.5
1.81.31.01.0
3.52.54.04.4
10
4.82.93.82.7
4.5
4.14.71.5
3.43.53.61.4
4.51.82.02.8
3.71.72.32.9
4.02.83.22.5
20
4.53.25.82.4
5.5
4.65.12.1
2.92.52.72.3
5.72.14.54.5
2.21.51.51.1
3.32.32.73.0
Dose (Gy)30
2.52.23.95.1
1.0
2.84.42.3
3.32.32.73.4
3.31.8-1.30.0
3.22.01.01.0
2.51.93.33.1
40
2.72.35.33.7
1.0
2.34.12.7
1.61.93.45.6
3.21.71.50.0
1.01.00.00.0
1.01.31.06.0
50
2.13.54.62.4
-
•
-
3.82.82.53.0
1.82.66.00.0
1.22.01.00.0
0.00.00.00.0
60
2.32.55.54.0
-
_--
1.00.00.00.0
1.00.00.00.0
1.00.00.00.0
0.01.01.00.0
70
1.01.00.00.0
0.0
0.00.00.0
1.00.00.00.0
0.00.00.00.0
0.00.00.00.0
0.00.00.00.0
100
0.00.00.00.0
0.0
0.00.00.0
0.00.00.00.0
0.00.00.00.0
0.00.00.00.0
0.00.00.00.0
contaminated, 0.0 necrosed.
In the present study, in vitro multiple shoot cultures of six banana cultivars belonging todifferent genomic groups (AAA, AAB, ABB and BB ) were irradiated with gamma rays and itwas observed that cultivars with a hybrid genome (AAB - Rasthali, ABB - Karibale Monthan)were more vulnerable to irradiation when compared to cultivars with a single genome (AAA -Lalkela, BB - Wild diploid).
113
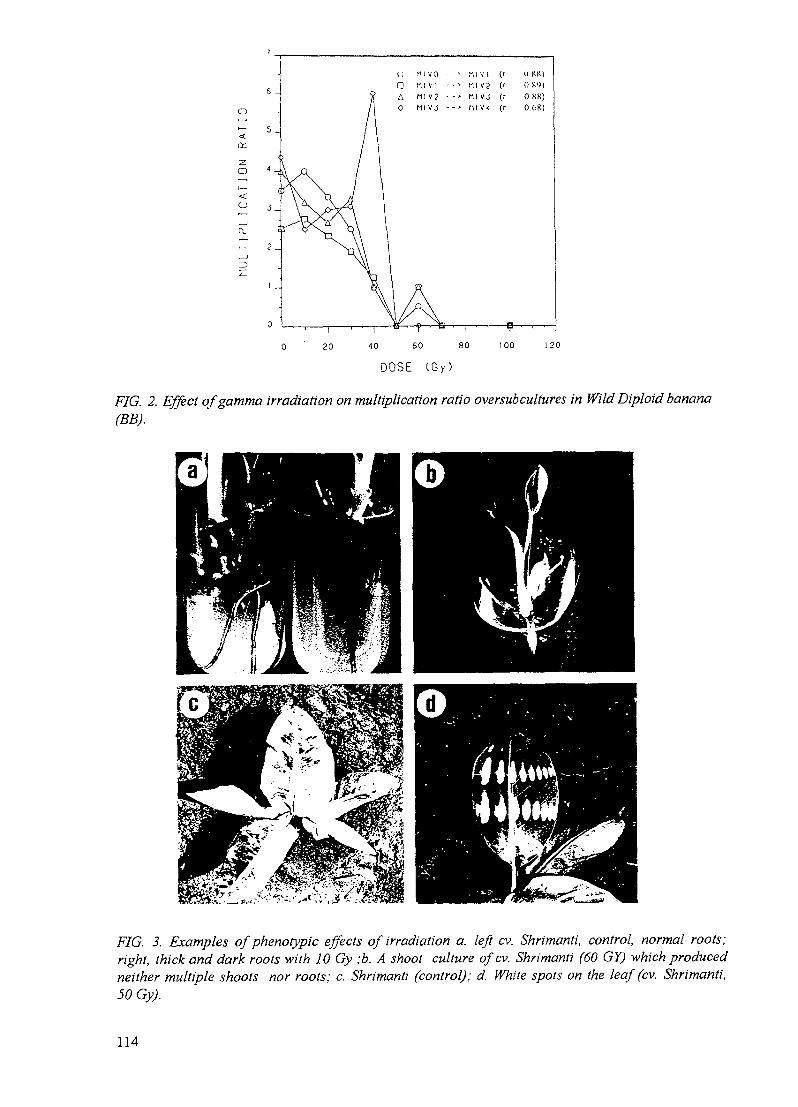
nAo
Ml VO
Ml V !
Ml V?
Ml V3
- • > l-i 1 V 1
• •- Ml V?
-•' M l V 3
- - * MlV4
(r(r
(r(r
1) SK)0 K<>)OKK)0 68)
0 ' 20 40 60 .80 100 120
DOSE ( G y )
FIG. 2. Effect of gamma irradiation on multiplication ratio oversubcultures in Wild Diploid banana(BB).
FIG. 3. Examples of phenotypic effects of irradiation a. left cv. Shrimanti, control, normal roots:right, thick and dark roots with 10 Gy ;b. A shoot culture ofcv. Shrimanti (60 GY) which producedneither multiple shoots nor roots; c. Shrimanti (control); d. White spots on the leaf (cv. Shrimanti,50 Gy).
114

A high multiplication ratio in both AAA and BB genomes and a lower ratio in the hybrid(AAB and ABB) genomes indicated that the genotype had an important role to play in theproliferation of in vitro shoots. Vuylsteke [2] has summarized results of the effect of genotypeon multiplication rates and clearly highlighted differential multiplication rates in differentgenotypes. In our studies, the low multiplication ratios were mainly due to apical dominance ofseveral individual shoots which strongly resisted production of multiples. Certainly, the lowerin vitro multiplication ratios may affect efficient separation of chimeric regions. Therefore, itwas felt that the multiple shoot cultures with at least moderately high multiplication ratios (3.0or more) be established, otherwise subculturing of mutagenized populations would be requiredup to MiV6 or MiV7.
, - • - • . » ; .
FIG. 4.a. The split bunch observed in tissue culture derived plant of cv. Rasthali; b. left. Control;right. Leaf variant in cv. Kahbale Monlhan (20 Gy); c. Bilateral leaf arrangement (Traveler's palmlike) in cv.Basrai (30 Gy); d. Early flowering plant (6 months) in cv. Basrai (10 Gy).
115

It is necessary to understand the lethal effects on individual shoots before irradiatingmultiple shoots. Excision of the leafy portion of the shoots, after irradiation allowed precisescoring of live and dead cultures. This was because of unmasking of dead shoot tips bysurrounding leaves, which if not excised, remained green for a longer period and thus deadshoots could wrongly be scored as live. The lethal effects on individual shoots were inconformity with Broertjes [13] who reported that mutation frequency increased with increasingdose (linearly with X or gamma rays) but survival and regeneration capacity decreased withincreasing dose. In the case of banana, Yang et al. [14] obtained a very high correlationcoefficient (0.97) between dosage and explant death for irradiation of dissected shoot tips, butthe coefficient was only 0.18 when intact shoot tips were used.
In the present study, LD 50% was found to be 40 Gy on an average. Similarobservations have been reported by Yang et al. [14] and Smith et al. [15]. It was observed thatcvs. with hybrid genomes (Rasthali, AAB and Karibale Monthan, ABB) were more vulnerablewhereas cvs. with single genome (Lai Kela, AAA and Wild Diploid, BB) were less sensitive toirradiation. Novak et al. [7] also have reported genotypic differences for the LD50%, 20 Gybeing the least for diploid (AA) clone SH-3142.
The effect of irradiation on multiple shoots was characterized by a drop in multiplicationratios, 70 Gy and more being totally lethal. Yang et al [14] were of a similar opinion butSilayoi et al. [16] have reported only 30 Gy as a lethal dose. Such variation could be due togenotypic differences. Two additional features were: enhancement in multiplication ratio atlower dose (10 and 20 Gy) than was also observed by De Guzaman et al. [17] and Siddiqui etal. [18], and occurrence of a large amount of variation in multiplication ratios (see Fig. 2).Thus the in vitro proliferation of irradiated multiple shoots appears to be complex, affected byone or more of several factors: irradiation dose, unbalanced distribution of chimeric and nonchimeric sectors resulting in differential growth rates, genotype, apical dominance, subculturecycle and its duration, and somaclonal variation.
In our studies, we compared different extraction methods for obtaining pure and highmolecular weight DNA and subsequently, the total genomic DNAs were extracted from ninedifferent genotyes (including a wild diploid and four samples obtained from field grown plantsin the mutation breeding trial) using a modified CTAB (Cetyl trimethyl ammonium bromide)method. The DNA samples could be digested with EcdRl and BaniHL indicating that these areamenable to restriction digestion. A set often oligonucleotide DNA primers has recently beenreceived from the IAEA through Dr. P.M. Gresshoff. These will be tested for their ability toelicit DNA polymorphism.
4. CONCLUSIONS AND PROSPECTS
Our studies have led to the collection of banana germplasm from different geographicalregions and the development of in vitro systems for use in the selection of desirable clonesthrough mutation breeding. Field observations have been made on certain morphologicalvariants and evaluation of these is underway. Molecular studies have been initiated in theaspects of DNA isolation, restriction digestion and RAPD analysis.
The prospects of using biotechnological approaches like protoplast culture and fusion,and genetic transformation with novel, useful genes for banana improvement are promising[19]. Efficient in vitro systems like shoot tip cultures and embryogenic cultures are beingworked out for genetic transformation, selection and regeneration of transformants. With theadvent of particle bombardment using the biolistic system and the Agrobacterium mediated
116
transformation method, it is now possible to develop transgenic plants and studies have alreadyshown success in obtaining transgenic plants of banana [20,21]. Since banana is the commonman's fruit and also a staple food for the developing countries, major efforts should be directedfor its overall improvement, especially for incorporating useful genes for: disease resistance;insect/pest resistance; enhanced fruit quality and shelf life; and pharmaceutically importantproteins and vaccines. In coming years, it is hoped that biotechnological tools will besuccessfully employed in the genetic improvement of banana.
REFERENCES
[I] SINGH, H.P. "Country paper report on banana and plantain - India", Banana andPlantain R & D in Asia and the Pacific, INIBAP (1990), pp. 161-185.
[2] VUYLESTEKE, D.R. Shoot tip culture for the propagation, conservation and exchangeof Musa germplasm, Practical Manual for Handling Crop Germplasm in vitro 2, D3PGR,Rome, Italy (1989).
[3] RAO, P.S., GANAPATHI T.R., SUPRASANNA, P., and BAPAT, V.A. Encapsulatedshoot tips of banana: a new propagation and delivery system, InfoMusa 2 (1993): 4 - 5.
[4] RAO, P.S. Biotechnological approaches for increasing plant productivity. AsiaTech.3(1994)32-36.
[5] NOVAK, F.J., BRUNNER, H , AFZA, R, MORPURGO, R, UPADHYAY, R.K.,VANDURENM., SACCHI, M., HAWZ, J.S., KHATRI, A., KAHL, G, KAEMMER,D., RAMSER, J., and WEISING, K. Improvement of Musa through biotechnology andmutation breeding. In: Biotechnology Applications for Banana and Plantain ImprovementProc. Of the Workshop. INIBAP (1993), pp 143-158.
[6] Personal communication, Banana Research Station (Jalgaon), Mahatma PhuleAgricultural University, Rahuri, Maharashtra, India.
[7] NOVAK, F.J., AFZA, R, VAN DUREN M., and OMAR, M.S. Mutation induction bygamma irradiation of in vitro cultured shoot-tips of banana and plantain (Musa cvs), TropicalAgriculture (Trinidad) 67 (1990) 21-28.
[8] MORELL, M.K., PEAKALL, R, APPELS, R, PRESTON, L.R., and LLOYD, H.L. DNAprofiling techniques for plant variety identification, Australian J. Experimental Agriculture 35(1995) 807-819.
[9] GANAPATHI, T.R., SUPRASANNA, P., BAPAT, V.A., and RAO, P.S. Propagation ofbanana through encapsulated shoot tips, Plant Cell Rep. 11 (1992) 571-575.
[10] GANAPATHI, T.R., MOHAN, J.S.S., SUPRASANNA, P., BAPAT, V.A. and RAO,P.S. A low-cost strategy for in vitro propagation of banana, Current Science 68 (1995)646-649.
[II] MURASHIGE, T., and SKOOG, F. A revised medium for rapid growth and bioassayswith tobacco tissue culture, Physiol. Plant. 15 (1962) 473-497.
[12] SINGH, R.K., and CHAUDHARY, B.D. Biometrical Methods in Quantitaive GeneticAnalysis, Kalyani Publishers, New Delhi. (1985) 318 pp.
[13] BROERTJES, C. "Induced mutation breeding in asexually propagated plants" Manual onMutation Breeding, Ilnd edition, Technical Reports Series No. 119, IAEA, Vienna(1977) 159-166.
[14] YANG, P., LI, C , WEI, F., HUANG, W., ZHENG, J., HUANG, D., HE, R , GUO, I ,HUANG, X., CHEN, B., and LIN, W. "Radiation mutation induction in 'China Tianbao'banana", In vitro Mutation Breeding of Bananas and Plantains, IAEA, Vienna (1995)17-24.
117

[15] SMITH, M.K., HAMHX, S.D., and LANGDON, P.W. "In vitro mutation breeding forthe development of bananas with resistance to Race 4, Fusarium wilt (Fusariumoxysporum f.sp.cubense)", In vitro Mutation Breeding of Bananas and Plantains, IAEA,Vienna (1995) 37-44.
[16] SILAYOI, B., WANICHKUL, K, KEAWSOMPONG, S., and SARADULDHAT, P."Study on mutation breeding of banana, 'Kluai Khai'", In vitro Mutation Breeding of Ba-nanas and Plantains, IAEA, Vienna (1995) 65-77.
[17] DE GUZMAN, E. V., DEL ROSARIO, A.G, and PAGCALIWAGAN, P.C. "Production ofmutants by irradiation of in v//rocultured tissues of coconut and banana and their masspropagation by the tissue culture technique", Induced Mutations in Vegetatively PropagatedPlants H, IAEA, Vienna (1982) 113-138.
[18] SIDDIQUI, S.H., KHATRI, A., KHAN, I.A., NIZAMANI, G., and KHAN, R."Improvement of banana (Musa cvs.) through in vitro culture techniques and inducedmutations", In vitro Mutation Breeding of Bananas and Plantains, IAEA (1995) 25-30.
[19] HUGGAN, R. Are bananas catching up?, Biotech. Develop. Monitor 14 (1993) 14-16.[20] SAGI, L., PANIS, B., REMY, S., SCHOOFS, H., DE SMET, K., SWENNEN, R., and
BRUNO, P.A.C. Genetic transformation of banana and plantain (Musa spp.) via particlebombardent, Bio/Technology 13 (1995) 481-485.
[21] MAY, G.D., AFZA, R , MASON, H.S, WIECKO, A., NOVAK, F.J., and ARNTZEN,C.J. Generation of transgenic banana (Musa acuminata L.) plants via Agrobacteriummediated transformation, Bio/Techn. 13 (1995) 486-492.
118

THE USE OF PCR TECHNIQUES TO DETECT GENETIC VARIATIONSIN CASSAVA (MANIHOT ESCVLENTA L. CRANTZ):MINISATELLITE AND RAPD ANALYSIS
N. PAWLICKI, R.S. SANGWAN, B. SANGWAN-NORREEL XA9848417Universite de Picardie Jules Verne,Amiens, France
N. KOFFI KONANILTAB, Plan Division-MCR7, Scripps Research Institute,La Jolla, California,United States of America
Abstract
Cassava is an important tuber crop grown in the tropical and subtropical regions. Recently, wedeveloped protocols for efficient somatic embryogenesis using zygotic embryos and nodal axillarymeristems in order to reduce the genotype effect. Thereafter flow cytophotometry and randomlyamplified polymorphic DNA (RAPD) markers were used to assess the ploidy level and the geneticfidelity of cassava plants regenerated by somatic embryogenesis. No change in the ploidy level of theregenerated plants was observed in comparison with the control plants. In the same way, monomorphicprofiles of RAPD were obtained for the different cassava plants regenerated by somatic embryogenesis.The genetic analysis of calli showed only a few differences. Using two pairs of heterologousmicrosatellite primers developed in a wild African grass, a monomorphic pattern was also detected.Moreover, cultivars of different origins were also analysed using these PCR techniques. Our data fromRAPD and mircosatellite analyses suggested that these techniques can be efficiently used to detectgenetic variations in cassava.
1. INTRODUTION
Cassava (Manihot esculenta L. Crantz), one of the major sources of food in Africa [1], isgenerally propagated vegetatively, but efficient in vitro regeneration systems have recentlybeen developed in order to improve cultivars of cassava via genetic engineering. Somaticembryogenesis is a routine way to regenerate shoots from various explants [2,3,4], butregeneration is often described as genotype-dependent. Recently, we developed protocols forefficient somatic embryogeneiss using mature cotyledons and organogenesis using zygoticembryos and nodal axillary shoot meristems [5,6], to minimise the genotype dependence.However, because of somaclonal variations induced by in vitro cultures described in otherspecies [7,8], it is important to verify the genetic stability of in vitro regenerated plants incomparison with the mother plant.
Genetic variations can be expressed by variations in the ploidy levels, by structuralchanges in chromosomes, by the loss of one or several chromosomes, or by mutations at thegene level. Alterations in ploidy levels can be detected by karyotypic analyses of metaphasechromosomes [9] or by flow cytometry analysis [10].
However, chromosomal changes and DNA variations do not always reveal alterations inindividual genes. Isoayme analysis can be used as a method to estimate genetic diversity ofmicropropagated plants but within cassava, low polymorphism is detected, and the technique is
119

not yet reproducible [11,12,13]. A precise determination of changes in a particular genesequence resulting from tissue culture can be obtained by restriction fragment lengthpolymorphism (RFLP) analysis [14,15,16]. However, this method is time consuming (five tosix days are necessary to undertake the analysis) and is limited to the gene sequence used asthe probe. The random amplified polymorphic DNA (RAPD) analysis, developed by Williamset al. [17], is a recent method that can be used to verify the genetic integrity of plantsregenerated by in vitro cultures. Advantages of this method are the technical simplicity and thespeed of analysis. Single oligonucleotide primers of arbitrary sequences can be used to detectRAPD sequences by the polymerase chain reaction (PCR).
In cassava, as almost no molecular genetic knowledge existed prior to this study, wewere interested in verifying the ability of the DNA markers to detect and characterise geneticvariation, induced either in vitro or naturally, in this important crop plant. We also studied theploidy level of in vitro regenerated cassava plants and investigated whether DNA moleculardifferences existed within the cassava plants regenerated by somatic embryogenesis, whencompared to the parental lines.
2. MATERIALS AND METHODS
2.1. Plant material
In vitro plants were regenerated by somatic embryogenesis from mature cotyledonsaccording to the method described by Konan et al. [5]. The regenerated plants wereindividually indexed, and micropropagated by culturing nodes on an MS medium [18]supplemented with 3% sucrose. Plants were chosen at random for the ploidy and RAPDanalyses. Callus culture were also initiated from internodes of the regenerated plants on an MSmedium containing 1 mg/L BA, 0.1 mg/1 NAA and 3% sucrose. Cassava plants, obtained fromvegetative propagation of nodes, were kept in the greenhouse and used as controls.
2.2. Flow cytophotometry
For flow cytophotometry, leaves isolated from cassava plants regenerated by somaticembryogenesis and from greenhouse-grown plants, were chopped with petunia leaves (internalreference) using razor blades, following the procedure of Brown et al. [10]. The nuclei wereisolated using 0.5 mL of a citric acid (0.1 M) solution containing 0.5% Tween 20. The sampleswere filtered through a 30 mm nylon gauze, and their volume adjusted to 1 mL. After anincubation at room temperature for 20-30 minutes, nuclei were centrifuged (92500 rpm, 5min.) and resuspended in 0.2 mL of the citric acid / Tween 20 solution to which was added 1mL of 0.4 M Na2HPO4 solution, pH 9.0 containing 5 mL/L DAPI (4',6-diamidino-2-phenylindole) for 15 minutes. Flow cytophotometry was performed using a Partec CAII flowcytometer (Maison-Alfort, France) and 5 x 10³ to 104 nuclei were analysed per experiment.The distribution of nuclei fluorescence is represented as a histogram of DNA content inarbitrary units.
2.3. DNA amplifications and RAPD conditions
Genomic DNA was extracted from leaf explants of the control plants, each of the in vitroregenerated plants, and the calli, according to the method of Roy et al [19] usinghexadecyltrimethyl ammonium bromide (CTAB). The DNA was dissolved in TE buffer (10mM Tris-Cl, 0.1 mM EDTA, pH 8.0) to a concentration of 100 ng/mL measured by a Hitachispectrophotometer at a wavelength of 260 nm.
120

Twenty arbitrary decamer oligonucleotide primers (Kit OPK, Bioprobe, France) wereused for RAPD analysis (Table I). Amplification reactions were carried out in 25 pi volumescontaining: 75 mM Tris-Cl, pH 9.0; 20 mM (NH^SC; 0.01% Tween 20; 1.5 raM MgCl2; 0.2mM dNTPs (Eurogentec, Belgium); 0.5 mM primer; 1 unit Taq polymerase (Eurogentec); and100 ng genomic DNA. The reaction mixture was overlaid with 50 ul mineral oil (Sigma), andthe amplification reactions were perfomed using the Thermojet apparatus (Eurogentec)programmed for 4 min denaturation at 94°C, followed by 45 cycles of 1 min at 94°C, 1 minannealing at 35°C, 2 min extension at 72°C, and a final extension cycle at 72°C for 6 min. Theamplification products were analysed by electrophoresis in 2% agarose gels in TBE buffer at2.5 V/cm, and detected under UV light after staining with ethidium bromide (0.5 mg/ml). Allamplification reactions were repeated at least twice.
In addition to these RAPD primers, two pairs of primers designed for microsatellites of awild African grass ("7" and "10", Gamier et al. [20]) were used under similar conditions, butwith a "touchdown" program, as described by Brown et al. [21]. Such a program allows theamplification of discrete bands under low specificity on heterologous DNA.
3. RESULTS AND DISCUSSION
3.1. DNA content analysis
After somatic embryogeneis, all regenerated cassava plants were phenotypically normal,and the number of chromosomes of the regenerated plants was the same as the control plants(2n=36). Nevertheless, ploidy levels of cassava plants regenerated by somatic embryogenesiswere studied by the analysis of nuclear DNA contents using the flow cytofluorometrytechnique. In the histogram, presented in Fig.l, the peaks 1 and 3, corresponding to cassava,indicate the existence of two populations of nuclei of differentiated cells, giving the positionG0/G1 that is an indication of the 2C DNA content of these cells. In a population of 5000 to10000 nuclei that have been analysed per treatment, 95%of the nuclei were at GO/G1 phase.Moreover, the absence of a shoulder on the peaks indicated a homogenous population of thenuclei in G0/G1, showing an absence of aneuploid cells.
During the analyses, petunia leaves were used as an internal reference (Fig 1., peak 2).The knowledge of the DNA content corresponding to the 2C value of petunia (2CX=2.85 pgof DNA per nucleus) allowed the estimation of the DNA content of the cassava leaf nuclei at1.65 pg for stages G0/G1. This value appears to be similar (1.43 to 1.72 pg/2C for seventeendifferent cassava cultivars) to those reported by Arumuganathan and Earle [22].
TABLE I. SEQUENCE OF THE PRIMERS IN THE STUDY
Primer NumberOPK1OPK2OPK3OPK4OPK5OPK6OPK7OPK8OPK9OPK10
SequenceCATTCGAGCCGTCTCCGCAACCAGCTTAGGCCGCCCAAACTCTGTCGAGGCACCTTTCCCAGCGAGCAAGGAACACTGGGCCCTACCGACGTGCAACGTG
Primer NumberOPK11OPK12OPK13OPK14OPK15OPK16OPK17OPK18OPK19OPK20
SequenceAATGCCCCAGTGGCCCTCACGGTTGTACCCCCCGCTACACCTCCTGCCAAGAGCGTCGAACCCAGCTGTGCCTAGTCGAGCACAGGCGGAGTGTCGCGGAG
121
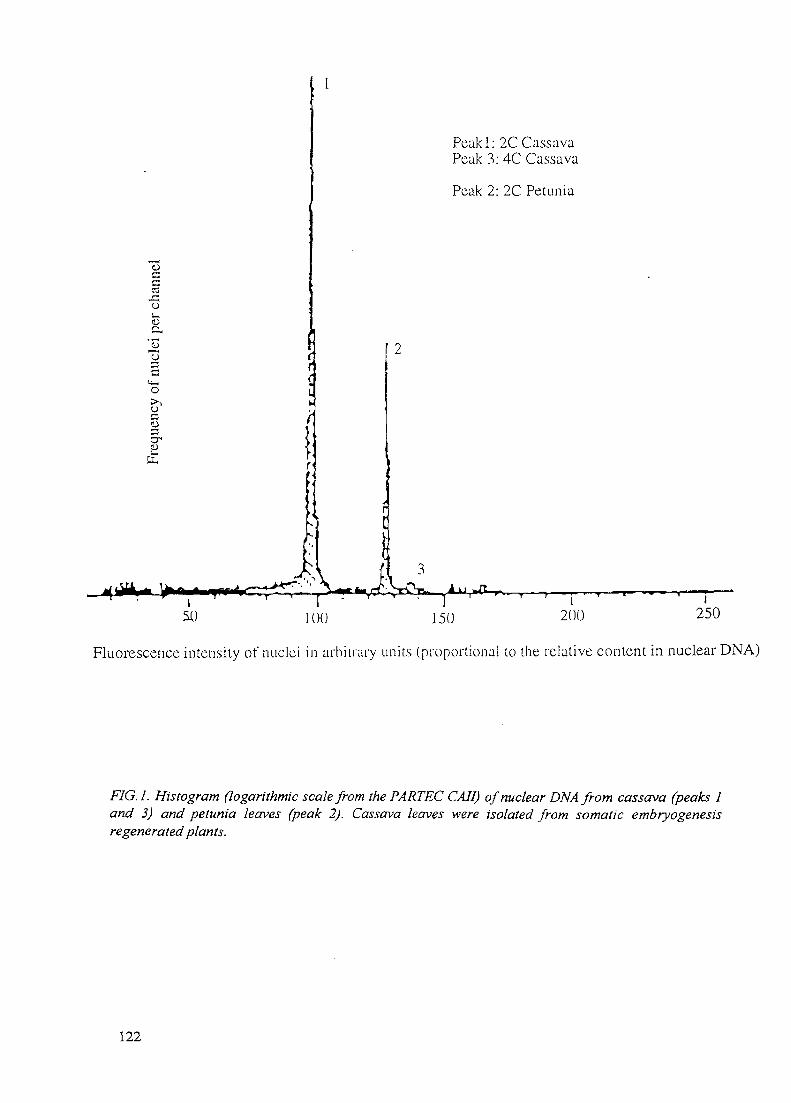
oaa
o«3
oc
ocoa-Si
PL,
Peakl: 2C CassavaPeak 3: 4C Cassava
Peak 2: 2C Petunia
^ f l
1 t1
soT^V L
200I
250100 150
Fluorescence intensity of nuclei in arbitrary units (proportional to the relative content in nuclear DNA)
FIG. I, Histogram (logarithmic scale from the PARTEC CAII) of nuclear DNAfrom cassava (peaks 1and 3) and petunia leaves (peak 2). Cassava leaves were isolated from somatic embryogenesisregenerated plants.
122
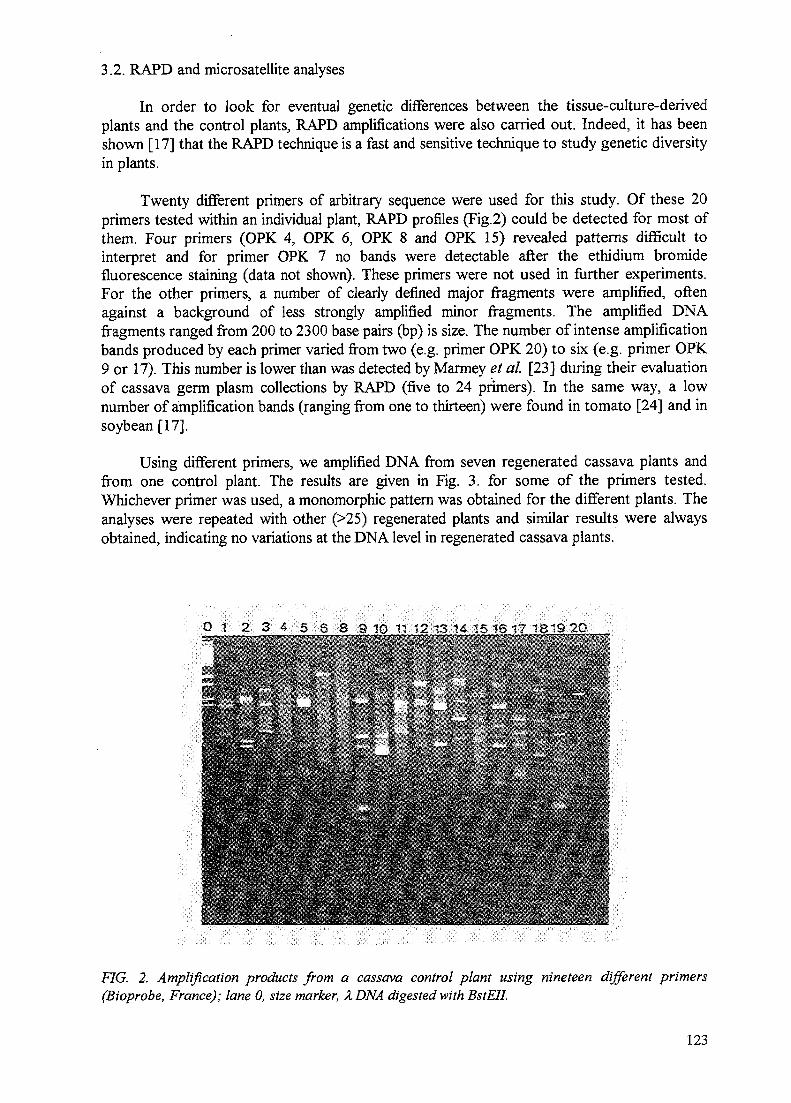
3.2. RAPD and microsatellite analyses
In order to look for eventual genetic differences between the tissue-culture-derivedplants and the control plants, RAPD amplifications were also carried out. Indeed, it has beenshown [17] that the RAPD technique is a fast and sensitive technique to study genetic diversityin plants.
Twenty different primers of arbitrary sequence were used for this study. Of these 20primers tested within an individual plant, RAPD profiles (Fig.2) could be detected for most ofthem. Four primers (OPK 4, OPK 6, OPK 8 and OPK 15) revealed patterns difficult tointerpret and for primer OPK 7 no bands were detectable after the ethidium bromidefluorescence staining (data not shown). These primers were not used in further experiments.For the other primers, a number of clearly defined major fragments were amplified, oftenagainst a background of less strongly amplified minor fragments. The amplified DNAfragments ranged from 200 to 2300 base pairs (bp) is size. The number of intense amplificationbands produced by each primer varied from two (e.g. primer OPK 20) to six (e.g. primer OPK9 or 17). This number is lower than was detected by Marmey et al. [23] during their evaluationof cassava germ plasm collections by RAPD (five to 24 primers). In the same way, a lownumber of amplification bands (ranging from one to thirteen) were found in tomato [24] and insoybean [17].
Using different primers, we amplified DNA from seven regenerated cassava plants andfrom one control plant. The results are given in Fig. 3. for some of the primers tested.Whichever primer was used, a monomorphic pattern was obtained for the different plants. Theanalyses were repeated with other (>25) regenerated plants and similar results were alwaysobtained, indicating no variations at the DNA level in regenerated cassava plants.
mmmmmmmizmm. --r ,>
FIG. 2. Amplification products from a cassava control plant using nineteen different primers(Bioprobe, France); lane 0, size marker, ZDNA digested with BstEII.
123

0 1 2 3 4 5 6 7 8 9 1 Q 1 1 1.2 . . . 1 3BEg^*»''"'!^'T'''waarwsr3P^
i
B1._.2 3 .4 5 6 7 8 9 10 11 12
3 £. ? ft €1 - f l - 5 - d
.F7G. 3. RAPD profiles obtained with different primers: a) 0PK2; lane 0, size marker, XDNA digestedwith BstEII; lanes 1-7, regenerated cassava plants; lane 8, control plant; lanes 9-13, calli. b) 0PK9;lane 0, size marker, X DNA digested with BstEII; lanes 1-7, regenerated cassava plants; lane 8,control plant; lanes 9-12, calli. c) OPK13; lane 0, size marker, XDNA digested with BstEII; lanes 1-6, regenerated cassava plants; lane 7, control plant; lanes 8-11, calli.
124
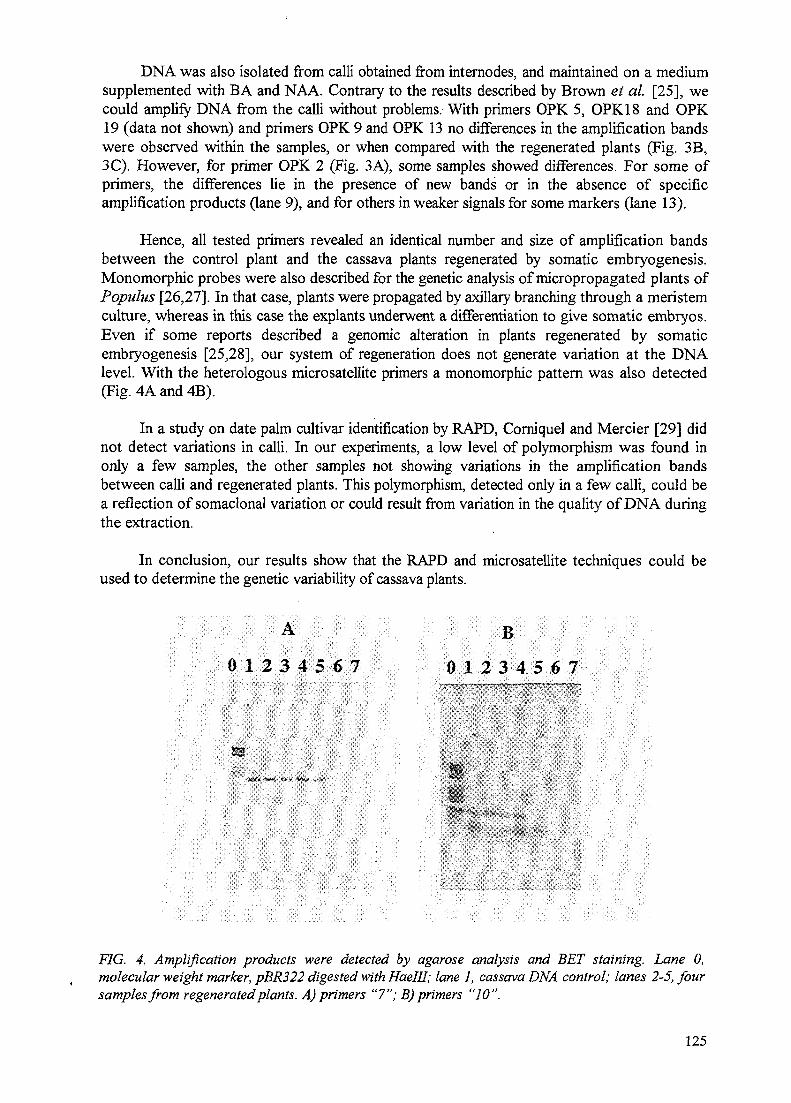
DNA was also isolated from calli obtained from internodes, and maintained on a mediumsupplemented with BA and NAA. Contrary to the results described by Brown et al. [25], wecould amplify DNA from the calli without problems. With primers OPK 5, OPK18 and OPK19 (data not shown) and primers OPK 9 and OPK 13 no differences in the amplification bandswere observed within the samples, or when compared with the regenerated plants (Fig. 3B,3C). However, for primer OPK 2 (Fig. 3A), some samples showed differences. For some ofprimers, the differences lie in the presence of new bands or in the absence of specificamplification products (lane 9), and for others in weaker signals for some markers (lane 13).
Hence, all tested primers revealed an identical number and size of amplification bandsbetween the control plant and the cassava plants regenerated by somatic embryogenesis.Monomorphic probes were also described for the genetic analysis of micropropagated plants ofPopulus [26,27]. In that case, plants were propagated by axillary branching through a meristemculture, whereas in this case the explants underwent a differentiation to give somatic embryos.Even if some reports described a genomic alteration in plants regenerated by somaticembryogenesis [25,28], our system of regeneration does not generate variation at the DNAlevel. With the heterologous microsatellite primers a monomorphic pattern was also detected(Fig. 4A and 4B).
In a study on date palm cultivar identification by RAPD, Corniquel and Mercier [29] didnot detect variations in calli. In our experiments, a low level of polymorphism was found inonly a few samples, the other samples not showing variations in the amplification bandsbetween calli and regenerated plants. This polymorphism, detected only in a few calli, could bea reflection of somaclonal variation or could result from variation in the quality of DNA duringthe extraction.
In conclusion, our results show that the RAPD and microsatellite techniques could beused to determine the genetic variability of cassava plants.
B
silt.i;Hi;?^^ii{;.ryi/!-:i-v ..^
FIG. 4. Amplification products -were detected by agarose analysis and BET staining. Lane 0,molecular weight marker, pBR322 digested with Haelll; lane 1, cassava DNA control; lanes 2-5, foursamples from regenerated plants. A) primers "7"; B) primers "10".
125

REFERENCES
[I] CORK, J.H. Science 218 (1982) 755-762.[2] STAMP, J.A., and HENSHAW, G.G.Z. Pflanzenphysiol 105 (1982) 183-187.[3] STAMP, I A. An. Bot. 59 (1987) 451-459.[4] SZABADOS, L., RODRIGO, H., and ROCA, W. Plant Cell Rep. 6 (1987) 248-51.[5] KONAN, N.K., SANGWAN,R.S., and SANGWAN-NORREEL, B.S. Plant Cell Tis.
and Organ Cult. 37 (1994) 91-102.[6] KONAN, N.K., SANGWAN,R.S., and SANGWAN-NORREEL, B.S. Plant Breeding
113 (1994) 227-236.[7] LARKIN, P.J., and SCOWCRAFT, W.R. Theor. Appl. Genet. 60 (1981) 197-214.[8] DE KLERK, G.J. Acta. Bot. Neerl. 39 (1990) 129-144.[9] KARP, A. Oxf. Surv. Plant Mol. Cell Bid. 7 (1991) 1-18.[10] BROWN, S.C., DEVAUS, P., MARE, D., BERGOUNIOUX, C, and PETIT, P.X.
Biofutur 105 (1991) 2-16.[II] HUSSATN, A., BUSHUK, W., RAMIREZ, H., and ROCA, W. Seed Science and
Technology 15 (1987) 19-21.[12] RAMIREZ, H., HUSSAIN, A., ROCA, W., and BUSHUK, W. Euphytica 36 (1987) 39-
48.[13] LEFEVRE, F., and CHARRIER, A. Euphytica 66 (1993) 73-80.[14] CHOWDHURY, M.K.U., and VASIL, I.K. Theor. Appl. Genet. 86 (1993) 181-188.[15] VALLES, M.P., WANG, Z., MONTAVON, P., POTRYKUS, I., and
SPANGENBERG, G. Plant Cell Rep. 12 (1993) 101-106.[16] CLOUTIER, S., and LANDRY, B.S. In Vitro Cell Dev. Biol. 30 (1994) 32-39.[17] WILLIAMS, J.G.K., KUBELIK, A.R., LIVAK, K.J., RAFALSKI, J.A., and Tingey,
S.V. Nucl. Acids Res. 18 (1990) 6531-6535.[18] MURASfflGE, T., and SKOOG, F. Physiol. Plant. 15 (1962) 473-497.[19] ROY Theor. Appl. Genet. 85(1992)173.[20] GARNTER, L., DURNAD, J., and DAJOZ, I. "Reproductive biology of the genus
Hyparhenia in Lamto savannas : possible consequences on the structure and function ofgrass populations", Lamto, a tropical system (ABBADIE, L. and MENAUT, J.C., Eds.)Springer Verlag, 1996.
[21] BROWN, S.M., HOPKINS, M.S., MITCHELL, S.E., SENIOR, M.L., WANG, T.Y.,DUNCAN, R.R., GONZALEZ-CANDELAS, F., and KRESOVITSCH, S. Theor. Appl.Genet. 93 (1996) 190-198.
[22] ARMUGANATHAN, K., and EARLE, E.D. Plant Mol. Biol. Rep 9 (1991) 208-218.[23] MARMEY, P., BEECtflNG, J.R., HAMON, S., and CHARRIER, A. Euphytica 74
(1994) 203-209.[24] FOOLAD, M.R, JONES, R.A., and RODRIGUEZ, R.L. Plant Cell Rep. 12 (1993) 293-
297.[25] BROWN, P.T.H., LANGE, F.D., KRANZ, E., and LORZ, H. Mol. Gen. Genet. 237
(1993)311-317.[26] CASTIGLIONE, S, WANG, G, DAMIANI, G., BANDI, C , BISSOFI, S., and SALA,
F. Theor. Appl. Genet. 87 (1993) 54-59.[27] RANI, V.R., PARIDA, A. and RAINA, S.N. Plant Cell Rep. 12 (1995) 101-106[28] FLANDRE, F., and SANGWAN, R.S. PLANT CELL REP. (1996) submitted[29] CORNIQUEL, B., and MERCEER, L. Plant Sci. 101 (1994) 163-172.
126

TOWARDS MAPPING THE DIOSCOREA GENOME XA9848418
R. TERAUCHI*, G. KAHLBiocentre, University of Frankfurt,Frankfurt am Main, Germany
Abstract
Yams are important starchy tuber crops in (sub-)tropical countries of the world. Despite theirimportance in the regional economy, no serious attempt has been made toward their improvement. Inorder to obtain basic knowledge of the genetics of yams, we are trying to establish a linkage map of awild yam species, Dioscorea tokoro. So far, six allozyme markers, six STMS markers and twentyAFLP markers have been identified. They will be used for linkage mapping of a population comprising80 progeny obtained from a controlled cross.
1. INTRODUCTION
World yam production is about one-tenth of the total production of cassava and sweetpotato [1], Most of the yam crops are cultivated and consumed locally by subsistence farmersof tropical and subtropical regions around the world. Therefore, improvement of yam isimportant for enhancing sustainable agriculture in those regions where yams are cultivated.Despite its economical importance, so far no yam improvement has been carried out, apartfrom the selection of cultivars/clones currently under cultivation [2]. Breeding trials involvingcrossing experiments are not common [3,4], partly because of the dioecious nature, and partlybecause of the difficulty in crossing small flowers, of Dioscorea. Little information is availableon the genetics of yams [4,5]. To improve our knowledge on yam genetics, we are presentlyconstructing a linkage map of yam using a wild species, Dioscorea tokoro Makino.
2. MATERIALS AND METHODS
A wild yam species, Dioscorea tokoro Makino, belonging to the section Stenophora waschosen, for linkage analysis. This species is widely distributed in East Asia, and has been usedfor population genetic studies [6]. It is a dioecious, diploid (2n = 2x = 20) species. Controlledcrossing of D. tokoro is relatively easy. Under suitable conditions, a plant can grow from aseed to a mature plant within a year. These favorable features made D. tokoro an attractivemodel species for genetic studies on yams.
In 1995, we crossed, by hand pollination, a male (DT7) and female individual (DT5),both collected from the wild. This crossing gave rise to 200 seeds. Among them, 80 individualswere grown, and their sex, a single easily-scored morphological character, was determinedwhen the flowers appeared. The leaves of the progeny were collected and used as sourcematerial for further genotyping. Parents used for the cross, as well as all the progeny, havebeen maintained through the years by vegetative propagation.
For linkage mapping, we have already developed six allozyme markers [6] and six STMSmarkers [7]. Variation in these genetic markers in the natural population of D. tokoro wasstudied. Additionally, we have started applying AFLP [8] markers, considering the highthroughput of the method. Analysis of the segregation will be carried out by the pseudo-testcross strategy [9].
* Present address: Kyoto University, Kyoto, Japan.
127

3. RESULTS
Six allozyme markers (Est, Got-1, Got-2, 6pgdh, Pgi and Skdh) showed high geneticdiversities (mean genetic diversity [10] was 0.38) [6]. Their segregation followed a simplediploid Mendelian fashion, although a segregation distortion was found in a locus Pgi. Asexpected, the STMS markers showed far larger genetic diversities (mean genetic diversity:0.68) than the allozyme markers [7]. The higher genetic diversities imply a higher probability ofthe heterozygous state in D. tokoro genome. This high heterozygosity makes the application ofthe pseudo-test cross scheme [9] relevant for linkage mapping. These two subsets of markersare co-dominant markers, and should be useful for joining different family maps obtained withdominant markers, such as AFLP.
To further increase the number of useful genetic markers, we have started applying theAFLP [8] technique for yam genome mapping. First we have screened different primercombinations to see the levels of polymorphism detectable between the two parents used forcrossing. Two commercially available kits for AFLP (AFLP analysis system I and II,recommended for organisms with genome sizes of 500 to 6000 Mbp/lC and of 100 to 500Mbp/lC, respectively, Gibco BRL) were tested. These two systems are differentiated bywhether the PCR primers have a 6-base selective anchor (system I), or 5-base selective anchor(system II) at their 3' ends. After applying 8 primer combinations for each kit, we havedetected a total of 203 (52 polymorphic) fragments for kit I, and total of 432 fragments (81polymorphic) fragments for kit II. Optimal results were obtained by kit II. This may reflect therelatively small genome size of yam species (555 Mbp/lC reported for D. alata [11]). Thenumber of polymorphisms detected between the two parents is satisfactory, considering thepossible number of primer combinations available.
Using two selected primer combinations (EcoBA-AC x Msel-CAC and £coRI-AA xMsel-CTC), we studied the segregation of AFLP among progeny obtained by the controlledcross. A total of 26 polymorphic fragments were detected between the two parents (Table I).They could be grouped into five different categories in terms of presence or absence of thefragments in either parent and the segregation among progeny. Only the polymorphismsgrouped in the categories 1 and 2 are useful for linkage mapping with the pseudo-test crossscheme [9]. Thus, 18 AFLP fragments remain for further linkage analysis. Considering the factthat two linkage maps are constructed, each corresponding to one parent, we should divide thisnumber by two to represent the number of useful polymorphic fragments per linkage map.Therefore, we have 4.5 useful AFLP fragments for mapping per primer combination perparent, if the results obtained for the two experiments can be regarded as representative. Thismeans only 25 AFLP experiments are needed to obtain 100 useful markers for linkagemapping, confirming a high throughput of the AFLP technique, and its applicability toobligately outcrossing species such as yams.
4. DISCUSSION
The co-linear arrangement of genomes (so-called synteny) has been reported inGramineae and Fabaceae plants. There is a high probability that this is also the case amongDioscorea species. Therefore, the linkage map obtained for D. tokoro in this current study willbe helpful to make linkage maps in other economically important yam species. To furtherfacilitate the transfer of linkage information from D. tokoro to other species, selectedpolymorphic AFLP fragments would have to be cloned and sequenced. Development of
128

various new genetic markers have now made it possible to embark on the molecular-marker-based breeding in yams, a long neglected crop.TABLE I. OCCURRENCES OF FIVE CATEGORIES OF AFLP'S OBSERVED AMONGPARENTS AND PROGENY OF DIOSCOREA TOKORO
Category
12345
Female parent Male parent(DT5) (DTI)
++
+ ++
+Total No. of polymorphic fragments
Segregationamong progeny
YesYesYesNoNo
No. ofoccurrences
108521
26(+: fragment present, -: fragment absent) ; The results for the two AFLP reactions (EcdSl-AC
xMsel-CAC and EcoRI-AAxMsel-CTC) are pooled.
ACKNOWLEDGEMENTS
This research was supported by fellowship No. IV-1-7121-1028559 to RT from theAlexander-von-Humboldt Foundation, Germany, for which we express our cordial gratitude.
REFERENCES
[I] FOOD AND AGRICULTURE ORGANIZATION OF THE UNITED NATIONS,Production Year Book, FAO, Rome (1987).
[2] HAHN, S.K., OSIRU, S.O., AKORODA, M.O., and OTOO, J.A. Yam production andits future prospects, Outlook on Agriculture 16 (1987) 105-110.
[3] SADIK, S., and OKEREKE, O.U. A new approach to improvement of yam, Dioscorearotundata, Nature (London) 254 (1975) 134-135.
[4] ZOUNDJIHEKPON, J. First controlled progenies checked by isozyme markers incultivated yams Dioscorea cayenensis-rotundata, Theor. Appl. Genet. 88 (1994) 1011-1016.
[5] MARTIN, F.W. Sex ratio and sex detemination in Dioscorea, Journal of Heredity 57(1966) 95-99.
[6] TERAUCFfl, R. Genetic diversity and population structure of Dioscorea tokoroMakino, a dioecious climber, Plant Species Biol. 5 (1990) 243-253.
[7] TERAUCHI, R., and KONUMA, A. Microsatellite polymorphism in Dioscorea tokoro, awild yam species, Genome 37 (1994) 794-801.
[8] VOS, P., HODGERS, R., BLEEKER, M., REUANS, M., VAN DE LEE, T., HORNES,M., FRITTERS, A., POT, J., PELEMAN, J., KUIPER, M., and ZABEAU, M. AFLP: anew technique for DNA fingerprinting, Nucl. Acids. Res. 23 (1995) 4407-4414.
[9] GRATTAPAGLIA, D., and SEDEROFF, R. Genetic linkage maps of Eucalyptusgrandis and Eucalyptus urophylla using a pseudo-testcross: Mapping strategy andRAPD markers, Genetics 137 (1994) 794-801.
[10] NEI, M. Analysis of gene diversity in subdivided populations, Proc. Natl. Acad. Sci.,USA. 70 (1973) 3321-3323.
II1] ARUMUGANATHAN, K., and EARLE, E. D. Nuclear DNA content of some importantplant species, PI. Mol. Biol. Rep. 9 (1991) 208-218.
129

ABBREVIATIONS
AFLP amplified fragment length polymorphismASAP arbitrary signatures from amplification profilesBAC bacterial artificial chromosomeDAF DNA amplification fingerprintingDNA deoxyribonucleic acidLOD log of the oddsMAS marker assisted selectionPAGE polyacrylamide electrophoresisPCR polymerase chain reactionRAMPO random amplified microsatellite polymorphismsRAPD randomly amplified polymorphic DNARCM research co-ordination meetingRFLP restriction fragment length polymorphismSCAR sequence characterized amplified regionSSR simple sequence repeatSTMS sequence tagged microsatellite siteVNTR variable number of tandem repeatsYAC yeast artificial chromosome
131

LIST OF PARTICIPANTS
Burg, K.
Gresshoff, P.
Kahl, G.
Lagoda, P.
Lavi, U.
Leal, M.
Low, F.C.
Mansvelt, L.
Parida, A.
Rao, P.S.
Sangwan, R.S.
Osterreichisches ForschungszentrumBiotechnology DepartmentA-2444 Seibersdorf, Austria
University of TennesseePlant Molecular Genetics269 Ellington Plant Sciences BuildingP.O. Box 1071Knoxville, TN 37901-1071, USA
J.W. Goethe University, BiocentreMarie-Curie-Str. 960439 Frankfurt/Main, Germany
CIRAD-BIOTROP Lab. AGETROPB.P.50352477 Av. du Val de Montferrant34032 Montpellier Cedex, France
Volcani CenterInstitute of Horticulture, AROP.O. Box 6, Bet-Dagan, 50250, Israel
National Center for Scientific ResearchAve. 25 y 158, CubanacanApdo. 6880, Habana, Cuba
Rubber Research Institute of Malaysia260 Jalan Ampang50450 Kuala Lumpur, Malaysia
Agricultural Research Council, InfruitecPrivate Bag X5013Stellenbosch 7599, South Africa
M.S. Swaminathan Research FoundationThird Cross Road, Taramani, Institutional Area,Madras 600 113, India
Biotechnology DivisionBhabha Atomic Research CentreGovernment of India, TrombayMumbai-400 085, India
Univ. de Picardie Jules VerneLab. Androgenese et Biotechnol.33 Rue Saint-Leu80029 Amines Cedex, France
133

Terauchl, R. Kyoto University, Faculty of ScienceDepartment of BotanyLaboratory of Plant SystematicsKyoto 606-01, Japan
Week, E. Plant Breeding and Genetics Section(Scientific Secretary) Joint FAO/IAEA Division
International Atomic Energy AgencyWagramerstrasse 5, P.O. Box 100Vienna, A-1400, Austria
3CMO
s
134