Thermal analysis of some a-amino acids with similar structures
17
Thermochimica Acta, 194 (1992) 197-213 Elsevier Science Publishers B.V., Amsterdam 197 Thermal analysis of some a-amino acids with similar structures F. Rodante a, G. Marrosu a and G. Catalani b a Dipartimento di Ingegneria Chimica, dei Materiali, delle Materie Prime e Metallurgia. Universitci di Roma “La Sapienza”, via de1 Castro Laurenziano 7, 00161 Roma (Italy) b Istituto Regina Elena, viale Regina Elena 293, Roma (Italy) (Received 12 April 1991) Abstract The thermal analysis of some a-amino acids using simultaneous TG-DSC measurements and kinetic calculations by the dynamic TG technique have been carried out. With this technique, compounds with similar structures can be grouped by their thermo- grams which have the same shape, although this does not give enough information on their thermal structural variation. The thermodynamic and kinetic data are of different significance, except in the case of series where the rings of the side chains influence the thermal decomposition of the compounds. INTRODUCTION The thermal analysis of organic compounds is usually combined with other analyses (UV, NMR, GC, GCMS) to identify the products of thermal decomposition [ 1 - 131. It is interesting to ascertain if thermal analysis used alone, could provide sufficient information on compounds with similar structures. This could be demonstrated with some “standard” a-amino acids, which have been studied in this laboratory in liquid [14-201 and solid [21] phases. The melting point, which is the simplest physical property most com- monly used to characterise an organic compound, is unlikely to be applied to the a-amino acids. Indeed, during thermal reactions, these compounds form a range of products (CO, NH,, linear and cyclic compounds); thus, quantitative measurements are difficult because of the wide temperature span over which the thermal processes take place. Moreover, the TG curves are subject to change with heating rate, so that different initial decomposition temperatures (Ti) for the same a-amino acids can be found in the literature [22-291. In differential scanning calorimetry, the temperature of the lowest minimum inflection point of the decomposition curve (T’) could provide valuable information in the analytical study of a-amino acids. Ideally, T, is 0040-6031/92/$05.00 0 1992 - Elsevier Science Publishers B.V. All rights reserved
Transcript of Thermal analysis of some a-amino acids with similar structures
Thermochimica Acta, 194 (1992) 197-213 Elsevier Science Publishers B.V., Amsterdam
197
Thermal analysis of some a-amino acids with similar structures
F. Rodante a, G. Marrosu a and G. Catalani b
a Dipartimento di Ingegneria Chimica, dei Materiali, delle Materie Prime e Metallurgia. Universitci di Roma “La Sapienza”, via de1 Castro Laurenziano 7, 00161 Roma (Italy) b Istituto Regina Elena, viale Regina Elena 293, Roma (Italy)
(Received 12 April 1991)
Abstract
The thermal analysis of some a-amino acids using simultaneous TG-DSC measurements and kinetic calculations by the dynamic TG technique have been carried out.
With this technique, compounds with similar structures can be grouped by their thermo- grams which have the same shape, although this does not give enough information on their thermal structural variation.
The thermodynamic and kinetic data are of different significance, except in the case of series where the rings of the side chains influence the thermal decomposition of the compounds.
INTRODUCTION
The thermal analysis of organic compounds is usually combined with other analyses (UV, NMR, GC, GCMS) to identify the products of thermal decomposition [ 1 - 131.
It is interesting to ascertain if thermal analysis used alone, could provide sufficient information on compounds with similar structures. This could be demonstrated with some “standard” a-amino acids, which have been studied in this laboratory in liquid [14-201 and solid [21] phases.
The melting point, which is the simplest physical property most com- monly used to characterise an organic compound, is unlikely to be applied to the a-amino acids. Indeed, during thermal reactions, these compounds form a range of products (CO, NH,, linear and cyclic compounds); thus, quantitative measurements are difficult because of the wide temperature span over which the thermal processes take place. Moreover, the TG curves are subject to change with heating rate, so that different initial decomposition temperatures (Ti) for the same a-amino acids can be found in the literature [22-291.
In differential scanning calorimetry, the temperature of the lowest minimum inflection point of the decomposition curve (T’) could provide valuable information in the analytical study of a-amino acids. Ideally, T, is
0040-6031/92/$05.00 0 1992 - Elsevier Science Publishers B.V. All rights reserved

198
the temperature at which the decomposition reaction occurs most rapidly, but it is also the temperature at which the maximum rate of heat change between the sample and the environment takes place. Some a-amino acids can be identified on the basis of T, alone because these values are distinct and do not overlap with those of adjacent a-amino acids on the decomposi- tion scale [22-291.
A kinetic study of the decomposition processes of these compounds can supply further information on their thermal behaviour.
The aim of this work is to determine if it is possible to group a-amino acids with similar structures according to the shape and number of peaks of their thermograms, and to characterise their features by means of thermo- dynamic and kinetic quantities. The a-amino acids studied in this work were L( - )cr-alanine (Ala), L( -)methionine (Met), L( -)tryptophan (Trp), L( - )leucine (Ieu), L( - hsoleucine (Ile), D( - )valine (Val), all belonging to a class with apolar hydrophobic chains; L( -)glycine (Gly), L( -)threonine (Thr), L( - hyrosine (Tyr), L( - )glutamine (Glu) and L( - laspargine (asp), all belonging to a class with uncharged polar chains; and L( + )aspartic acid (Asp) and L( + > g u amic (Glu) acid, which belong to a class with polar 1 t chains having a negative charge.
EXPERIMENTAL. AND PROCEDURE
The experimental measurements were carried out on a Stanton-Recroft 625 simultaneous TG-DSC connected to an Olivetti 250 computer. Instru-
lM-
- 2
- 0
- -2
- -4
x
--ST
2 - -e E
- -10
- -12
- -14
- -16
I I I I I I I u I 100 150 200 250 300 350 400 450 500
isag c
Fig. 1. DSC and TG curves of L( -)leucine.

199
ment calibration was performed with standard indium and tin samples of known fusion temperatures and enthalpies of fusion. For decomposition studies under dynamic conditions, the TG-DSC apparatus was set up as follows.
Samples (15-16 mg) were weighed into aluminium pans placed in a nitrogen-filled dry-box. In order to avoid oxidative decomposition of the samples, the TG-DSC system was flushed with nitrogen gas both below the open pan (at a flow rate of 50 ml min-‘) and above it (at a flow rate of 30 ml min-‘). In this way, the gases evolved during the thermal decomposition experiment were continuously removed. The heating rate was always 10 o C min-‘, and at least two runs were made for each compound. All the thermodynamic quantities were calculated using the Stanton-Redcroft aquisition system trace, version 4.
A dynamic (non-isothermal) TG technique was used in the kinetic study of the decomposition reaction.
The compounds (Carlo Erba RP) were used without further purification.
RESULTS AND DISCUSSION
Trends of thermal behaviour in the compounds examined are shown in Figs. 1-14. The values of the thermodynamic and kinetic quantities relating to the TG and DSC measurements are reported in Tables 1-5.
110 10
100 -
90 - -
30 -
k - 70 -
c,
f 80- :: 2
so-
40 -
30 -
20 - -\r- 5
0
D L
- -5 3
E
- -10
-15
10 - o- L - -20
0 I 1 50 I 100 I 150 200 I I 250 300 350 1 I 400 450
nag c
Fig. 2. DSC and TG curves of L( - Jisoleucine.

I I I I 1 I I I 0 50 100 150 200 250 300 350 d Dog c
Fig. 3. DSC and TG curves of DC--)valine.
4
2
0
-2
D
:: -4 #j
E
-6
-8
-10
-12
,
The simultaneous TG-DSC system is a very useful tool for investigating organic compounds as it combines, in a single run, weight loss and heat change processes, so that transformations that occur even with small weight
4J
f
e n”
110
100
90
90
70
60
50
40
30
700
5
0
-5
-20
-25
-30
Fig. 4. DSC and TG curves of L( - )glycine.

201
120
100
r
Fig. 5. DSC and TG curves of L( -)a-alanine.
changes (chemical reactions, decomposition, vaporisation, cesses) can be distinguished from those occurring without (melting, crystallisation, polymorphic changes).
oxidation pro- weight change
110 2
100 -
90-
60 -
70 -
60-
50-
46-
30 -
20 -
10 -
0 -I
- 0
- -2
- -4
- -6
- -6
- -10
- -12
- -14
- -16
I- -16
lb0 lk.0 2bo 250 3bO 3!m 4h 450 dlo Dog c
Fig. 6. DSC and TG curves of L(-_)threonine.

202
I
QO -
7oc
5
0
-5
-20
-25
-30
-35
I
Fig. 7. DSC and TG curves of L( - )methionine.
The thermal behaviour of L( - jglycine, L( - )a-alanine, L( - jleucine, L( - )isoleucine, D( - jvaline, L( - )threonine and L( - jmethionine is charac- terised by a single decomposition process (during which melting also occurs) characterised by TG-DSC curves of the same shape.
(19.2) ’ ’ . . . ’ . . ’ ’ q , . __ 6.00 112.00
-.” 4. 00 96.00
..Y 0. 00
^o
I
-; -4.00
:!
-- -6.00
5
IL
-_ -12.00
*d
--N :
-- -16. 00
(0.00) -_ -20. 00 0.00 , . . . . : : ; : : : : :
10 70 130 190 250 310 - 370 430 490 550 610 670
Temp (Oag C)
Fig. 8. DSC and TG curves of L( - )phenylalanine.

203
110
100
90
60
c,
: 70
e
’ 60
r
I-
Fig. 9. DSC and TG curves of L(-jtyrosine.
I 5
0
-5
1 -10
I -25
-30
-35
-40
The quantities that were used to characterise the compounds were the initial temperature of decomposition, Ti, the total enthalpy of decomposi- tion, AH, and the kinetic energy of activation, E,.
110
60
0
Fig. 10. DSC and TG curves of L(-bryptophan.
lb0 2bO 3bO 400 5im 6bn Dog c
700
5
0
-15
-M
-25

204
120
110
100
90
c,
: 90
tl
lf 70
50
50
40
30
7 0 1
7oc
2
0
-2
-4
-6 0 m
L -9 #j
E
-10
-12
-14
-16
-16
I I I I I I I 100 200 300 400 500 600
Deg c
Fig. 11. DSC and TG curves of L( +)aspartic acid.
L( -)cu-alanine, which has the shortest side chain, was chosen as the reference compound for this series. The scale of thermal stability, referring to the initial temperature of decomposition can be written Met > Thr > Gly > Ala > Leu > Ile > Val.
- 2
- 0
- -2
- -4
- -6
- -6
- -10
- -12
- -14
- -16
- -18
- -20
b lb0 200 1 300 1 400 I sbo 600 1 700 I
Dog c
Fig. 12. DSC and TG curves of L(-jaspargine.

50
40
30
20 i I I 1 I I
0 100 200 300 400 Deg c
Fig. 13. DSC and TG curves of ~(+)glutamic acid.
I I 500 600
20.5
5
0
-5
-10
s
1 -15 (y
E
-20
-25
-30
-35
I
The compounds with side chains containing heteroatoms are more stable than L( - )cu-alanine, while for the other compounds the reverse is true.
The temperature range that includes the thermal decomposition (with nearly total loss of weight) and melting point of the compounds is approxi-
110
100
90
+I 80
5
f t 70
60
50
40
30
r 0
- 2
- 0
- -2
- -4
-8 0
I - -8 >
s - -LO E
- -12
- -14
- -16
- -18
7 -20
1 I 100
I 200
I I I I 300 400 500 600 700
Dog c
Fig. 14. DSC and TG curves of L( -)glutamine.

206
TABLE 1
Thermodynamic parameters for thermal decomposition of some a-amino acids with aliphatic chains from TG-DSC measurements
Compound T("C) W(%> T(“C) AH Peak ( ’ C) (cal g-l)
L( - Ileucine 207-342 99.30 232-328 220.9 305.8 L( - )isoleucine 201-331 98.74 201-322 286.99 300.73 D( - Ivaline 161-323 98.22 224-321 135.54 295.73 L( - )glycine 226-573 65.00 226-318 251.86 255.4 L( - Icy-alanine 217-358 100.00 210-328 335.43 301.40 L( - Ithreonine 228-327 92.32 226-310 171.7 267.00 L( - jmethionine 236-367 96.61 248-324 207.6 295.00
TABLE 2
Thermodynamic parameters for thermal decomposition of some a-amino acids with five- and six-membered rings in their side chains from TG-DSC measurements
Compound Decomp. TG DSC stage T(“f-3 WC%) T(“C) AH Peak
(cal gg’) (O C)
L( - )phenylalanine I 237-263 5.52 253-263 3.9 257.6 II 263-296 41.42 263-296 52.3 276 III 296-300 0.60 296-304 1.49 297 IV 300-401 45.65 312-393 27.24 377
L( - jtyrosine I 293-323 43 281-355 148.04 318 II 323-339 0.61 III 339-577 30.76
Tryptophan I 270-317 17.45 277-317 90.09 297 II 317-503 59.4 349-474 29.58 408.62
TABLE 3
Thermodynamic parameters for thermal decomposition of aspartic and glutamic acids and their amides from TG-DSC measurements
Compound Decomp. TG stage T (“Cl
DSC
W (%o) T(“C) AH Peak (cal g-l) (“0
L( + Iaspartic I 212-317 29.11 215-308 235.27 240,264 acid II 317-521 36.3 376-451 42.11 397
L( - jaspargine I 77-181 12.1 82-133 80.16 92.16 II 181-293 24.19 194-295 203 247 III 293-521 28.13 347-404 11.23 364
L( + Iglutamic I 186-236 13.3 195-240 130.2 197 acid II 236-481 54.83 240-321 37.39 283.69
L( - jglutamine I 173-246 13.01 183-246 158.77 188.43 II 246-481 51.54 246-382 63.88 304
207
TABLE 4
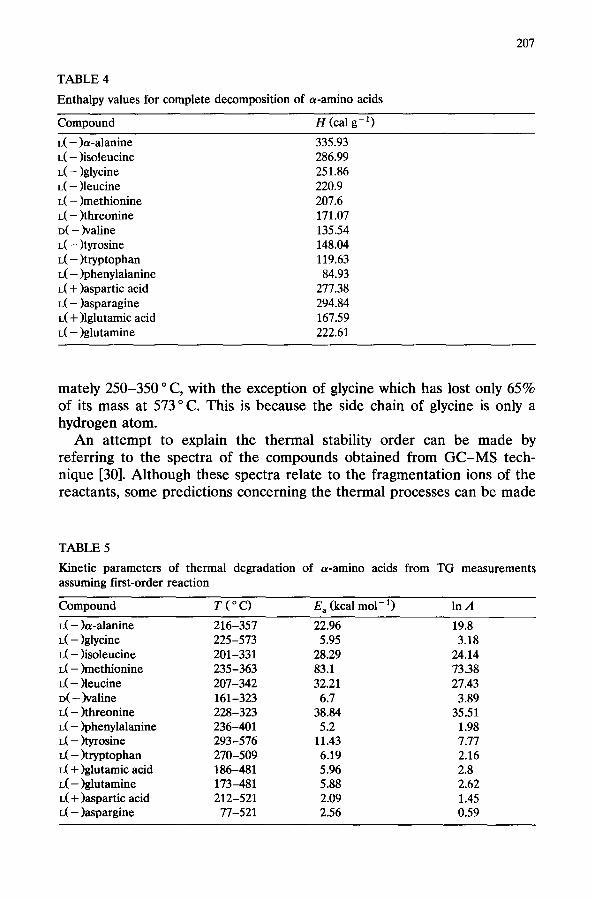
Enthalpy values for complete decomposition of a-amino acids
Compound H @al g-l)
L( - )cu-alanine 335.93 L( - )isoleucine 286.99 L( - )glycine 251.86 L( - )leucine 220.9 L( - jmethionine 207.6 L( - jthreonine 171.07 D( - XIaline 135.54 L( - jtyrosine 148.04 L( - jtryptophan 119.63 L( - bhenylalanine 84.93 L( + )aspartic acid 277.38 L( - jasparagine 294.84 L( + jlglutamic acid 167.59 L( - jglutamine 222.61
mately 250-350 ‘C, with the exception of glycine which has lost only 65% of its mass at 573’ C. This is because the side chain of glycine is only a hydrogen atom.
An attempt to explain the thermal stability order can be made by referring to the spectra of the compounds obtained from GC-MS tech- nique [30]. Although these spectra relate to the fragmentation ions of the reactants, some predictions concerning the thermal processes can be made
TABLE 5
Kinetic parameters of thermal degradation of a-amino acids from TG measurements assuming first-order reaction
Compound T("C) E, (kcal mol-‘) In A
L( - balanine 216-357 22.96 19.8 L( - jglycine 225-573 5.95 3.18 L( - )isoleucine 201-331 28.29 24.14 L( - knethionine 235-363 83.1 73.38 L( - Heucine 207-342 32.21 27.43 D( - Xraline 161-323 6.7 3.89 L( - )threonine 228-323 38.84 35.51 L( - )phenylalanine 236-401 5.2 1.98 L( - hyrosine 293-576 11.43 7.77 L( - bryptophan 270-509 6.19 2.16 L( + )glutamic acid 186-481 5.96 2.8 L( - Iglutamine 173-481 5.88 2.62 L( + jaspartic acid 212-521 2.09 1.45 L( - jaspargine 77-521 2.56 0.59

208
from them. For example, the peaks obtained from GC-MS of the ethyl esters of the a-amino acids are due to fragmentation of the molecule by preferred cleavage of those bonds that result in energically more favoured ions i.e. the best stabilised positive ions. The fragmentation of a generic ethyl ester of a-amino acid
~-----cH2--~--p--~--cooc2H5 C
b NHza
can be caused by cleavage of bonds a, b and c. Cleavage of bond a gives rise to the loss of the carboxyl group and to formation of a resonance-stabilised ion I (amine fragment) obtained by retention of the positive charge on the nitrogen R_____CH+ F R_____CH
I NH2 AH+ 2
I
The ion II resulting from the cleavage of bond b (ester fragment) is also stabilised by the retention of the positive charge on the nitrogen atom: this ion has a relatively low abundance with respect to that of the amine fragment
+CH-----COOC,H, = CH-----COOC,H,
NH2 +!JH 2
II The introduction of a heteroatom or aromatic system into the R side-
chain increases the tendency for cleavage of other bonds (c), either in the molecular ion or in the “amine fragment”, both factors leading to a lower abundance of the latter.
From literature data [30], the following information can be obtained for the fragmentation processes.
(a) Glycine loses the carboxyl group. (b) The main process of fragmentation for valine, leucine and isoleucine
is the loss of the carboxyl group, followed by loss of the aminic group and a further fragmentation of the “amine fragment”.
(c) Threonine fragments giving rise to a stabilised ion obtained by water loss and a cyclisation process.
(d) The main ion fragment obtained from methionine is represented by the side chain CH,-S-CH; (100%). Other fragments are CH,=CH-CH+ (52%), obtained by the loss of CH,SH, and the “amine
NH fragment” with ‘1 oss of the carboxyl group.

From this experimental evidence, the higher initial temperature of decomposition of threonine and methionine with respect to that of (Y- alanine can be related to their greater difficulty in losing the carboxyl group (easier process) due, in turn, to the presence of a heteroatom which favours the breakage of the side chain.
The longer chains of the other compounds decrease the initial tempera- ture of decomposition Ti, this probably being due to the fact that the R--CH’ product obtained by loss of the carboxyl group undergoes a
NH* further decomposition.
Therefore, the thermal stability order above is determined by the fact that the bonds break at different positions in the molecules depending on the side-chain.
Let us now consider another quantity that can help to characterise the structures of the compounds. If the enthalpy values relating to different ranges of temperature are added, an overall enthalpy, i.e. the heat that the compound has exchanged with the external system at constant pressure up to its complete decomposition, can be derived. The enthalpy data are given in Table 4.
The “heat” scale shows the order Ala > Ile > Gly > Leu > Met > Thr > Val. In this scale, the a-alanine requires the largest energy to be com- pletely decomposed. The last positions of threonine and methionine in this scale can be explained by the formation of stable decomposition products, i.e. cyclic compounds.
Further contribution to the characterisation of these compounds can be supplied by the activation energies, E,, calculated from the TG curves. The scale of E, is Met > Thr > Leu > Ile > Ala > Val > Gly. This order can be related to the dissociation mechanism hypothesised in the literature. For example the mechanism of the a-alanine dissociation is hypothesised as shown in Scheme 1 [23] whereas for threonine the mechanism could be as shown in Scheme 2 [23].
From Scheme 2, it can be observed that the process related to the loss of the carboxyl group is absent, with a consequent increase in the activation energy.
CH 3 ----- YH ----- COO - ._?!!, CH 3 _____ CH + _____ COO -
NH; -co* I
CH; ---CH,----COO-
L CH3-----CH,-----NH, 1 -co2
CH,=CH,
Scheme 1. Mechanism of cu-alanine dissociation.

210
CH, _____ (-‘H _____ (-‘H_____COO- ._:_??P,
I I
CH,=CH___________CH_____COO-
I OH NH;
I
-NH, NH;
CH2=CH_____CH+ _____COO-
I CH; - CH = CH ----- COO -
I CH=CH I I
CH, C=O
\/ 0
Scheme 2. Mechanism of threonine dissociation.
The three scales differ from one another because the side chains are sufficiently similar to give rise to similar TG and DSC curves but not so much as to impose the same order on the thermodynamic and kinetic quantities of the various decomposition processes.
Even the compounds with rings with five of six members in their side chains (phenylalanine, tyrosine and tryptophan) show similar thermal be- haviour from their TG and DSC curves. The scale of thermal stability referring to the initial temperature of decomposition is Tyr > Trp > Phe. The “heat” and activation energy, E,, scales show the same sequence as the scale of thermal stability.
The activation energies for this group, calculated from the TG curves of the overall weight losses, can be considered as the average activation energies of the various decomposition steps. The decomposition scheme of phenylalanine can be written as shown in Scheme 3 [231.
The larger values of activation energy for tyrosine and tryptophan with respect to phenylalanine can be ascribed to destabilisation of the resonance
@ _____ CH 2_____ CH _____ COO - __:_:H$ <p _____ CH 2 _____ CH + _____ COO -
1
I -COz NH;
I
@-cH2-7H(-)
I
@ _____ (-‘H + _____ CH, _____ COO -
NH; I -co,
cP-CH,-----CH,---NH, <P----CH=CH,
Scheme 3. Decomposition scheme of phenylalanine.

211
form by the introduction of the hydroxyl group and of the second ring containing five atoms.
From GC-MS spectra [30], it was observed that the presence of rings in the side chains gives rise to breakage between the cu-and P-carbon atoms and to the formation of the ion fragment Ar-CH,+ with the localisation of the positive charge on the P-carbon atom.
Indeed the increase in r-electron density in the aromatic nuclei in the series containing phenylalanine, tyrosine and tryptophan, is expressed in the increased intensity of the peak due to Ar-CH;+ following the se- quence Trp > Tyr > Ph.
The base peak of phenylalanine is that of the “amine fragment” (100%); other peaks are those of “ester fragment” (82%) and of the fragment Ar-CH;+ (24%).
In tyrosine the ion fragment Ar-CH,+ is the base peak (100%) while the peaks of the ester and amine fragments are present with abundances of 52% and 51%, respectively.
Finally, in tryptophan the fragment Ar-CH;+ is also the base peak (100%); the abundances of the amine and ester peaks are 8.5% and 4%.
The decrease of the decarboxylation process that is linked to the amine fragment could account for the larger values of the thermodynamic and kinetic quantities of tryptophan and tyrosine with respect to phenylalanine. Moreover, the presence of five- and six-membered rings in the side chains greatly influences the thermal behaviour so that the same order was found in the scales describing the thermodynamic and kinetic quantities for the decomposition processes.
Glutamic and aspartic acids, glutamine and aspargine from a group of compounds with more marked similarities. Aspartic and glutamic acids differ from one another in only a CH, group, while their thermal be- haviours show some differences: the former has two decomposition steps and three endotherms (the first and second practically overlap), while the latter has two decomposition steps and only one endotherm. The following fragmentation scheme for aspartic acid is found from the GC-MS data [30]
CW3-b I
CW,HS I CH,---CO
CH2 _ FHz -1e - E:: -C2H50H I I or + CH ------. NH
+kH-NH, I
I
+CH-NH, -C2%
CO,H .___ ___. ___, CO,H ..___ _ _____ l
I CH, + (-0,
(332 (32 :H I
+CH-NH, CH=NH; NH;
Scheme 4. Fragmentation of aspartic acid.

212
CW A COOC,H, /
CJ32
I
CH! 72
+CH
- C2H50H >
HCO CH2 \
I NH
CH_? / +CH
Scheme 5. Fragmentation of glutamic acid.
(Scheme 4). The scheme for glutamic acid fragmentation is as shown in Scheme 5. The presence of an additional CH, group in glutamic acid allows for the formation of a stable cyclic compound that forms the base peak. Aspartic acid shows a larger number of fragmentation processes which explains the more complex trend of the TG and DSC curves of aspartic acid and the lower temperature of decomposition and overall enthalpy for glutamic acid, by virtue of the stabilised cyclic compound formed.
Thus, the introduction of only one methyl group into the aliphatic chain makes the thermal decomposition of the two acids substantially different.
The formulae of aspartic acid and aspargine differ in an amidic group, and the compounds are different in the polarisation of the substituent groups.
Aspargine shows three decomposition processes and three DSC peaks. The weight loss (12%) in the first decomposition process can be ascribed to the loss of the second NH, group. Moreover, the presence of this group greatly decreases (by 77°C) the thermal stability of the aspargine with respect to that of aspartic acid, and the overall enthalpy of decomposition is larger than that of the corresponding acid because energy is also required for the loss of the second NH, group.
The activation energies are very close in the two compounds; therefore, the decomposition mechanisms may also be practically equal.
The introduction of a second NH, group into glutamic acid (glutamine) decreases the thermal stability of this compound, and gives rises to a second DSC peak and to an increase in the enthalpy of decomposition; both of these features are due to the loss of this group. The activation energies are equal, but are different from those of the pair aspargine/ aspartic acid.
The activation energies for this series were calculated in the same manner as those of the second series.
CONCLUSIONS
To summarise, the three series containing compounds of similar struc- tures have particular thermal behaviours.

213
Compounds with aliphatic side chains have similar thermal curves but three different scales for their thermodynamic and kinetic data.
Compounds with five- and six-membered rings have the same thermal behaviour, as expressed by the same order of kinetic and thermodynamic values in the three scales.
Finally, the presence of an additional CH, group leads to remarkable differences between the thermal behaviours of aspartic and glutamic acids, which, in turn, have different thermal behaviours from their amides.
In conclusion, thermal analysis allows compounds with similar structures to be grouped by the similar shapes of their thermograms, but does not give enough information on their thermal structural variations. The orders of the Ti, AH and E, scales do not correlate with each other, with the exception of the series in which the rings in the side chains influence the thermal decomposition of the compounds.
REFERENCES
1 M. Tomassetti, L. Campanella, P. Cignini and G. D’Ascenzo, Thermochim. Acta, 84 (1985) 295.
2 M.A. Zayed and F.A. Nom el-Dien, Thermochim. Acta, 113 (1987) 117. 3 J. Lubkowski and J. Blazejowsky, J. Therm. Anal., 132 (1987) 237. 4 C. Rajendran and S.R. Jain, Thermochim. Acta, 82 (1984) 311. 5 M. Tomassetti, G. D’Ascenzo and R. Curini, Thermochim. Acta, 60 (1983) 1. 6 Z. Warnke and J. Blazejowski, Thermochim. Acta, 108 (1986) 265. 7 A. Grunenberg, D. Bougeard and B. Schroder, Thermochim. Acta, 77 (1984) 59. 8 G.W. Hung, Thermochim. Acta, 23 (1978) 233. 9 M.A. Ubeda, E. Martinez-Tamayo and D. Beltran-Porter, Thermochim. Acta, 73 (1984)
141. 10 S.R. Salman and N.F. Mahmoud, Thermochim. Acta, 140 (1989) 1. 11 D.E. Rogers, Thermochim. Acta, 77 (1984) 123. 12 R.A. Bolivar, E. Cutte, C. Perez and C. Rivas, Thermochim. Acta, 45 (1981) 125. 13 H.T. Al-Badri and M.M. Barbooti, Thermochim. Acta, 53 (1982) 45. 14 F. Rodante and M. Tocci, Thermochim. Acta, 86 (1985) 109. 15 F. Rodante and F. Fantauzzi, Thermochim. Acta, 111 (1987) 233. 16 F. Rodante, F. Fantauzzi and P. Di Girolamo, Thermochim. Acta, 142 (1989) 203. 17 F. Rodante and F. Fantauzzi, Thermochim. Acta, 144 (1989) 75. 18 F. Rodante and F. Fantauzzi, Thermochim. Acta, 144 (1989) 275. 19 F. Rodante, F. Fantauzzi and G. Marrosu, Thermochim. Acta, 141 (1989) 297. 20 F. Rodante, Thermochim. Acta, 149 (1989) 157. 21 F. Rodante and G. Marrosu, Thermochim. Acta, 171 (1990) 15. 22 A.M. Bryan and P.G. Olafson, Anal. Lett., 2 (1969) 505. 23 P.G. Olafson and A.M. Bryan, Geochim. Cosmochim. Acta, 35 (1971) 337. 24 P.G. Olafson and A.M. Bryan, Mikrochim. Acta, 5 (1970) 871. 25 W.W. Wendlandt, Thermochim. Acta, 37 (1980) 121. 26 W.W. Wendlandt and S. Contarini, Thermochim. Acta, 65 (1983) 321. 27 S. Contarini and W.W. Wendlandt, Thermochim. Acta, 70 (1983) 283. 28 A. Finch and D.A. Ledward, Thermochim. Acta, 11 (1975) 157. 29 M.L. Rodriguez-Mendez, F.J. Rey, J. Martin-Gil and F.J. Martin-Gil, Thermochim.
Acta, 134 (1988) 73. 30 K. Biemam, J. Seibl and F. Gapp, J. Am. Chem. Sot., 83 (1961) 3795.