Capillary electrophoresis and mass spectrometry for screening of metabolic disorders in newborns
J. Sep. Sci. 2009, 32, 1927 –1933 X. Jiang et al. 1927
Xuemei Jiang1
Zhining Xia2
Weili Wei3
Qian Gou2
1College of Bioengineering,Chongqing University,Chongqing, China
2College of Chemistry andChemical Engineering,Chongqing University,Chongqing, China
3State Key Laboratory ofEnvironmental Chemistry andEcotoxicology, Research Centerfor Eco-Environmental Sciences,Chinese Academy of Sciences,Beijing, China
Original Paper
Direct UV detection of underivatized amino acidsusing capillary electrophoresis with onlinesweeping enrichment
This is an original report proposed a CE method for direct analysis of the underivat-ized amino acids using UV detection with relatively higher sensitivity, which wasbased on coordination interactions between amino acids and Cu (II) ions. In addi-tion, an online sweeping preconcentration technique was easily combined toimprove the detection sensitivity. Satisfying separations of the amino acids wereobtained under optimized conditions: 50 mmol/L CuSO4 –0.05% HAc–H2O (pH 4.5),and the separation voltage of 15 kV. The LODs for the analytes ranged from 0.1 to0.5 lmol/L. The linearity of detection for all analytes was two orders of magnitudewith the correlation coefficients greater than 0.99. The repeatability was displayedwith an RSD less than 3% for migration time and peak height (n = 5). Moreover,some amino acids in real samples of human saliva and green tea were analyzed bythis direct UV detection CE method with acceptable sensitivity.
Keywords: Amino acids / Capillary electrophoresis / Coordination interaction / Direct UV detec-tion / Online sweeping /
Received: January 8, 2009; revised: February 18, 2009; accepted: February 18, 2009
DOI 10.1002/jssc.200900013
1 Introduction
The evolution of methods for amino acids analysis hasclosely paralleled the development of analytical tools forthe life sciences during the past 50 years [1]. The first andmost frequently used methods were the chromato-graphic or electrophoretic techniques [2–5]. Becausemost of amino acids have low or no UV absorbance or nofluorescence (FL), a derivatization step was usuallyincluded to improve the sensitivity [6–10]. Up to now,most of the studies about CE separation of amino acidswere under their derivation. The typical detection meth-ods for detecting derivatized amino acids in CE were UVdetection [11, 12] and FL detection [13–15]. However,derivatization procedures are tedious, complicated, andtime consuming. Besides, chemical operations such asderivatization steps are not beneficial for obtaining reli-able data [16].
Therefore, to determine amino acids without derivati-zation steps in CE is valuable. Indirect or direct UV detec-tion [17, 18], indirect or direct chemiluminescence detec-
tion [19, 20], electrochemical detection [21], refractiveindex detection [22], and mass spectroscopy (MS) detec-tion [23] have been employed for this purpose. Unfortu-nately, these methods have their own limits and thereare only a few related reports. Indirect detection meth-ods using the background reagents in the runningmedium can resolve most of the problems and almost allamino acids can be analyzed, but the backgroundreagents would contaminate the buffer solution, whichwill constrain the separation ability. All the existingdirect detection methods also have some disadvantages.The high sensitivity of electrochemical detection is bene-ficial, but its reliability is compromised due to electrodefouling and only few electrochemical detection systemsfor CE is commercially available yet. In the same way,there is no refractive system for CE commercially avail-able and it should not be very sensitive because of theextremely short optic-length of the capillary. The CEwith MS detection is quite expensive and not widespreadeither. Although the CE with UV detection is commer-cially available, widespread, and inexpensive, the directdetection of the amino acids at short UV wavelengths isplagued by interference and poor sensitivity [24].
The purpose of this work is to develop a simple andeffective CE method for direct UV detection of the under-ivatized amino acids with high sensitivity. We use copperion as a center ion coordinated with amino acids, which
Correspondence: Professor Zhining Xia, College of Chemistryand Chemical Engineering, Chongqing University, Chongqing400030, ChinaE-mail: [email protected]: +86-23-6510-6615
Abbreviations: FL, fluorescence; SZ, sample zone
i 2009 WILEY-VCH Verlag GmbH & Co. KGaA, Weinheim www.jss-journal.com
1928 X. Jiang et al. J. Sep. Sci. 2009, 32, 1927 – 1933
makes it possible to detect the underivatized amino acidsdirectly at 254 nm wavelength with rather high sensitiv-ity. An online-sweeping enrichment technique was com-bined to further improve the sensitivity. The qualitativeand quantitative reliability of the method and the qual-ity of separations were presented. In addition, the linear-ity, LODs, and repeatability were given for each aminoacid. This CE method with simple UV detector using cop-per ions was successfully applied to the direct analysis ofamino acids in human saliva and green tea without fur-ther derivatization.
2 Methods
2.1 Coordination-based separation
It is well known that the electrostatic interactionsbetween analytes and additives can offer separationinducement and alter separation selectivity in nonaqu-eous CE [25, 26]. Similarly, the coordination interactionbetween the Lewis acid and Lewis base can act as separa-tion motivity, as well. Numerous organic compoundscan donate lone pair electrons, which contain the coordi-nation atoms such as O and N. Good separations of sev-eral active oxygen-containing compounds were carriedout by Li and Weber [27] with the dynamic coordinationinteractions of lanthanide ions and the analytes. We sep-arated some arylamides and sulfonamides which containN coordination atom in CE based on the coordinationinteractions between copper ions and analytes [28]. Inthe same way, the dynamic coordination interactionsbetween copper ions and amino acids also can provideselective separation of amino acids. The amino acids actas coordination ligands and coordinate with copperions, which form [Cu(AAs)n]2+ complexes (AAs stands foramino acids) according to the coordination interactions.The different apparent mobilities of amino acids wereobtained owning to different strength of coordinationand various charge-mass ratio of [Cu(AAs)n]2+, whichresults in the separation. It is more important that thecharge transfer transition by the coordination interac-tion between copper ions and amino acids make the com-plex absorption shift to longer wavelength, which alsogreatly improves the detection sensitivity and makes sen-sitive quantitative analysis possible. In this paper, sevenkinds of common amino acids were selected as represen-tative analytes to study the potential for analysis of theamino acids.
2.2 Online preconcentration by coordinationsweeping
Sweeping is one of important online preconcentrationtechniques in CE [29–31], and it was firstly proposed byQuirino and Terabe in 1998 [29]. Micelles formed from
surfactants were most usually used as analyte carrier inthose cases. In this work, it was found that the transitionmetal ion copper can also act as analyte carrier when theanalyte has two or more electron-donate atoms (such asamino acids, peptides, and alkaloids). This sweepingmechanism was confirmed and discussed in the follow-ing part.
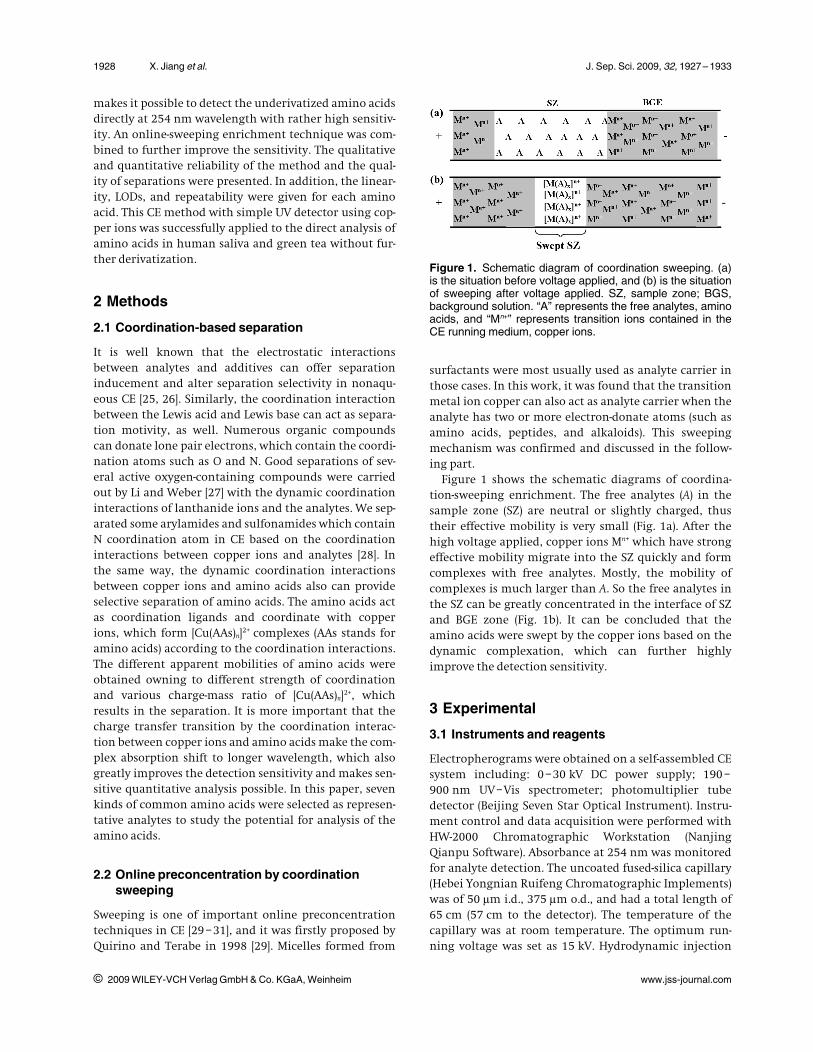
Figure 1 shows the schematic diagrams of coordina-tion-sweeping enrichment. The free analytes (A) in thesample zone (SZ) are neutral or slightly charged, thustheir effective mobility is very small (Fig. 1a). After thehigh voltage applied, copper ions Mn+ which have strongeffective mobility migrate into the SZ quickly and formcomplexes with free analytes. Mostly, the mobility ofcomplexes is much larger than A. So the free analytes inthe SZ can be greatly concentrated in the interface of SZand BGE zone (Fig. 1b). It can be concluded that theamino acids were swept by the copper ions based on thedynamic complexation, which can further highlyimprove the detection sensitivity.
3 Experimental
3.1 Instruments and reagents
Electropherograms were obtained on a self-assembled CEsystem including: 0–30 kV DC power supply; 190–900 nm UV–Vis spectrometer; photomultiplier tubedetector (Beijing Seven Star Optical Instrument). Instru-ment control and data acquisition were performed withHW-2000 Chromatographic Workstation (NanjingQianpu Software). Absorbance at 254 nm was monitoredfor analyte detection. The uncoated fused-silica capillary(Hebei Yongnian Ruifeng Chromatographic Implements)was of 50 lm i.d., 375 lm o.d., and had a total length of65 cm (57 cm to the detector). The temperature of thecapillary was at room temperature. The optimum run-ning voltage was set as 15 kV. Hydrodynamic injection
i 2009 WILEY-VCH Verlag GmbH & Co. KGaA, Weinheim www.jss-journal.com
Figure 1. Schematic diagram of coordination sweeping. (a)is the situation before voltage applied, and (b) is the situationof sweeping after voltage applied. SZ, sample zone; BGS,background solution. “A” represents the free analytes, aminoacids, and “Mn+” represents transition ions contained in theCE running medium, copper ions.
J. Sep. Sci. 2009, 32, 1927 –1933 Electrodriven Separation 1929
was achieved by raising the inlet reservoir 15 cm relativeto the exit reservoir (at this height, the flow rate for thesample injection was 0.022 cm/s) to provide the injectionlength. A conductivity meter (Shanghai Hongyi Instru-mentation, DDS-11A) was used for the measurement ofconductivity of running medium and sample solutions.
L-Lysine (Lys), L-histidine (His), L-serine (Ser), L-leucine(Leu), L-phenylalanine (Phe), L-glutamic (Glu), and L-pro-line (Pro) were purchased from Shanghai Sangon Biologi-cal Engineering & Technology and Service (purity A
99.5%). The copper sulfate (CuSO4, AR), sodium chloride(NaCl, AR), and acetic acid (HAc, AR) were bought fromChongqing Chemical Reagent Factory. Double-distilledwater was used for the preparation of all solutions. Acommon green tea was purchased from the market inChongqing, China.
3.2 Procedures
3.2.1 Preparation of the running solutions
The water solution which consisted of 50 mmol/L coppersulfate and 0.05% acetic acid (HAc v/v) was optimized asCE running medium. The pH value of the runningmedium is 4.5. Stock solutions of 1.0610 – 4 mol/L forevery standard amino acid were prepared by dissolvingproper amount of corresponding amino acids into 20 mLof water. All stock solutions were stored in cool and darkenvironment. All solutions were prepared daily by dilu-tion of the stock solution to the desired concentration.The mixture sample of amino acids was obtained by mix-ing every standard amino acids solution with proper pro-portion.
3.2.2 Preparation of human saliva sample
The samples of human saliva were collected from volun-teers after mouth rinsing and gargling with water for10 min. Prior to analysis, the saliva sample was deprotei-nized by adding 5 lL of sulfosalicylic acid solution (50%in water) to 100 lL of sample. After mixing, the samplewas left to stand on ice for 15 min and then centrifugedat 5006g for 10 min at room temperature. The superna-tant was filtered through a 0.45 lm nylon membranesyringe filter. Finally, the filtrate was diluted by waterfor ten times and then analyzed by CE.
3.2.3 Preparation of green tea extract
An aliquot 0.5 g of green tea leaves was accuratelyweighed and inserted into a flask; 100 mL of boiling dis-tilled water was added, and then infused for 1 h. Theresulting extract solutions were passed through a0.45 lm membrane filter and were diluted to 25 mL forusing.
3.2.4 CE operations
Before the CE running, the capillary was rinsed sequen-tially with 0.1 mol/L NaOH, water, and running mediumfor 10 min to obtain reproducible and uniform innerwalls of fused-silica capillary. During the electrophoreticruns, the solutions in the vials should be replaced withnew running medium, and the capillary was rinsed withrunning medium for 5 min each 2 h. The separation volt-age is optimized at 15 kV. The detection wavelength of254 nm was selected.
4 Results and discussion
4.1 Comparison of UV absorption of amino acidbefore and after coordination with Cu2+ ions
Figure 2 shows the UV absorbance spectra of seven aminoacids before and after coordinating with Cu2+ ions. It canbe seen that the UV absorbance are distinctively differentin two cases. For the amino acids without chromophoregroup (Fig. 2a), the maximum absorbance wavelengthhas shifted to around 233 nm, and the strength alsoincreased up to more than 20-fold after they coordinatedwith copper ions. Although the amino acids have someUV absorbance at the wavelength shorter than 210 nm,the sensitivity would be still very poor, because it isrelated with the light source and photodetector, andmay be plagued by other interferences. The commonlight source and photodetector in CE–UV system are deu-terium lamp and photomultiplier (PMT), respectively.For the amino acids with chromophore group (Fig. 2b),although they have the UV absorbance themselves, thestrength is much higher after coordinating with Cu2+
ions and it also has higher absorbance at around 233 or254 nm, which favored to be detected at longer wave-lengths. In this paper, we selected 254 nm as detectionwavelength regarded the S/N and other factors. The UVabsorbance strength of seven amino acids before andafter coordinating with Cu2+ at 254 nm is listed in Table1. The UV absorbance of amino acids after coordinatingwith Cu2+ ions have much stronger UV absorption accord-ing to the absorption spectra, which also confirmed theamino acids can be detected directly by CE with UV detec-tion at longer UV wavelength with higher sensitivity.
For the cases of other amino acids we did not use here,would be the same as these seven amino acids in theory,because all of them have carboxyl and amino group,which can coordinate with Cu2+. But whether all 20amino acids can be separated from each other or not inCE is also dependent on the CE conditions.
4.2 Optimization of CE running medium
Most transition metal ions are Lewis acids, and they canaccept the lone pair electrons from electron-donating
i 2009 WILEY-VCH Verlag GmbH & Co. KGaA, Weinheim www.jss-journal.com

1930 X. Jiang et al. J. Sep. Sci. 2009, 32, 1927 – 1933
ligands, which can form the coordination interaction.Here, we selected transition metal ion Cu2+ as center ion,because it has stronger coordination ability and hydroly-sis extent than other metal ions, such as Ni2+ and Zn2+,which was studied systematically in our previous work[28]. The results show the resolution of amino acidsincreases greatly with increasing concentrations of Cu2+.At low concentration (lower than 20 mmol/L) of Cu2+, theamino acids could not be separated effectively. When theconcentration is higher than 50 mmol/L, the contribu-tion to the resolutions was small and it may even extendthe analysis time and cause other opposite effects. Thus,Cu2+ concentration of 50 mmol/L was chosen for the fol-lowing experiments.
The acidity of the running medium was also investi-gated, because it will restrain the hydrolysis extent ofCu2+, which can increase the coordination interactionbetween Cu2+ ions and amino acids [28]. So, low acidity ofthe running medium is needed according to this factor.The EOF is very slow because of the high concentration ofCu2+ used here. If the acidity of medium is also low (i.e.,the concentration of acid is high), EOF will even beslower. Taking these two factors into account, a properacidity of the running medium is pH 4.5 (HAc of 0.05%).
The separation voltage of 15 kV was chosen with com-prehensive consideration of the analysis time and resolu-tion, etc. It was observed that analysis time was shortenedand resolution weakly decreased, because of the Jouleheat with increasing separation voltages.
Figure 3 shows the separation of seven amino acidsunder optimized conditions. It can be seen that they arefully separated and do not have any interference witheach other with high column efficiency and selectivity.
i 2009 WILEY-VCH Verlag GmbH & Co. KGaA, Weinheim www.jss-journal.com
Figure 2. UV absorbance spectra of seven amino acidsbefore and after coordinating with Cu2+ ions: (a) five aminoacids without chromophore group, and (b) two amino acidswith chromophore group; the concentration of Leu, Glu, Pro,Ser, Lys, His, and Phe are 0.6, 0.5, 0.7, 0.66, 0.5, 0.12, and0.12 mmol/L, respectively. The concentration of Cu2+ is1 mmol/L. Curves 1–5: only Leu, only Glu, only Pro, onlySer, only Lys; Curves 6–10 are the amino acids in the solu-tion containing in Cu2+ ions: Pro, Ser, Leu, Lys, Glu. Curves11–14: His, Phe in the solution containing in Cu2+ ions, onlyHis and only Phe, respectively.
Table 1. UV absorbance of seven amino acids before andafter coordinating with Cu2+ at 254 nm
Analyte Before coordination After coordination Ratior = A9/A
Curvesin Fig. 2
Absorb-ance (A)
Curvesin Fig. 2
Absorb-ance (A9)
Leu Curve 1 0.009 Curve 8 0.180 20.000Glu Curve 2 0.006 Curve 10 0.120 20.000Pro Curve 3 0.006 Curve 6 0.243 40.500Ser Curve 4 0.005 Curve 7 0.221 44.200Lys Curve 5 0.003 Curve 9 0.169 56.333His Curve 13 0.002 Curve 11 0.133 66.500Phe Curve 14 0.002 Curve 12 0.034 17.000
Figure 3. Electropherograms of standard mixture of sevenamino acids under optimized conditions. The amino acidmixture with the concentration of 1.0610 – 6 mol/L of eachamino acid, and the other conditions in detail are describedin Section 3.2.
J. Sep. Sci. 2009, 32, 1927 –1933 Electrodriven Separation 1931
4.3 Effect of the length of SZ
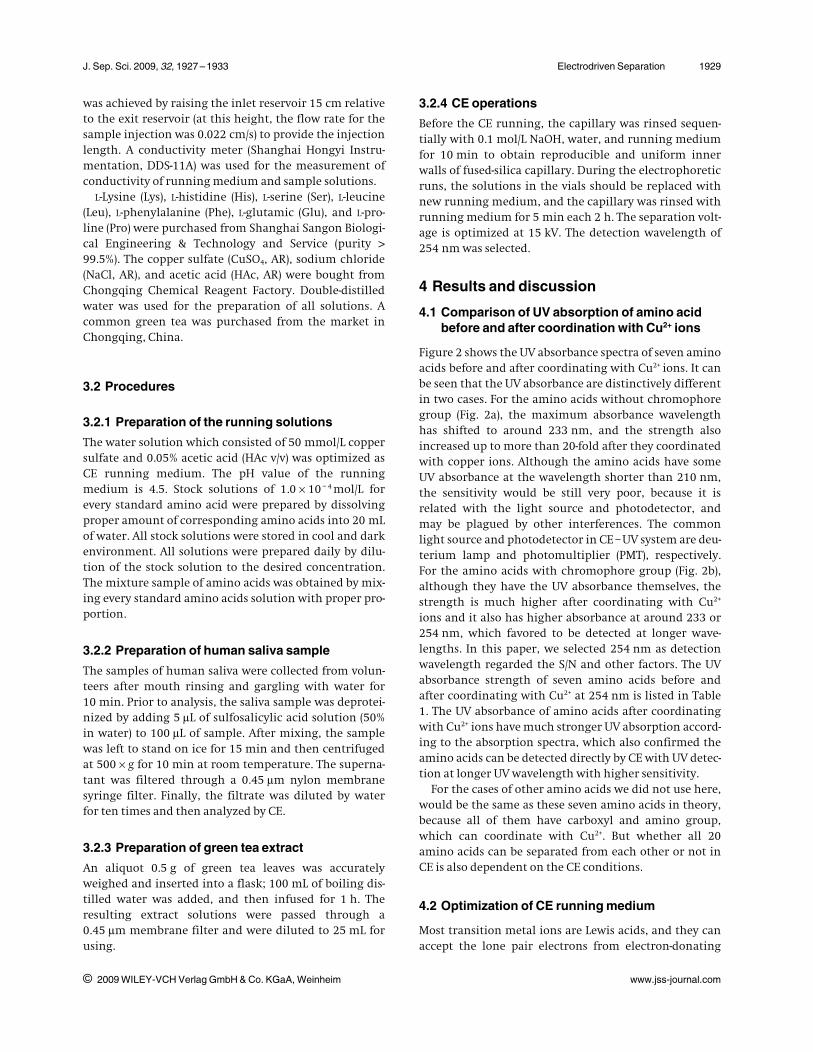
The effect of SZ length on preconcentration of aminoacids was investigated. The Phe was selected as a modelamino acid and the test concentration of Phe was1.5610 – 6 mol/L. Figure 4 shows the electropherogramsof Phe with different SZ length (Fig. 4a–f: 0.5, 2, 8, 12, 16,and 20 cm, respectively). The results show the sensitivityincrease with increasing the length of SZ. However,when SZ length was longer than 16 cm, the peaks broad-ened and the column efficiency would be reduced. So16 cm SZ length (about 30% of the effective length of thecapillary) provided a better detected sensitivity and col-umn efficiency. Thus, the injection length of SZ wasselected as 16 cm in all the following experiments.
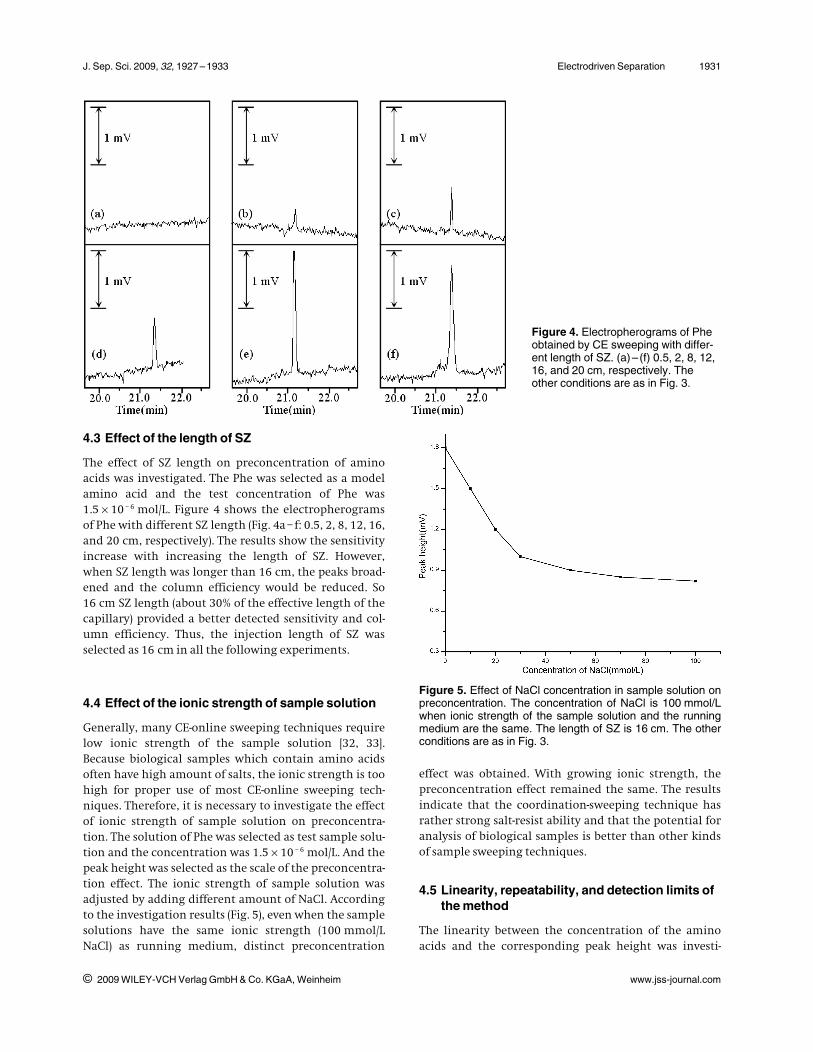
4.4 Effect of the ionic strength of sample solution
Generally, many CE-online sweeping techniques requirelow ionic strength of the sample solution [32, 33].Because biological samples which contain amino acidsoften have high amount of salts, the ionic strength is toohigh for proper use of most CE-online sweeping tech-niques. Therefore, it is necessary to investigate the effectof ionic strength of sample solution on preconcentra-tion. The solution of Phe was selected as test sample solu-tion and the concentration was 1.5610 – 6 mol/L. And thepeak height was selected as the scale of the preconcentra-tion effect. The ionic strength of sample solution wasadjusted by adding different amount of NaCl. Accordingto the investigation results (Fig. 5), even when the samplesolutions have the same ionic strength (100 mmol/LNaCl) as running medium, distinct preconcentration
effect was obtained. With growing ionic strength, thepreconcentration effect remained the same. The resultsindicate that the coordination-sweeping technique hasrather strong salt-resist ability and that the potential foranalysis of biological samples is better than other kindsof sample sweeping techniques.
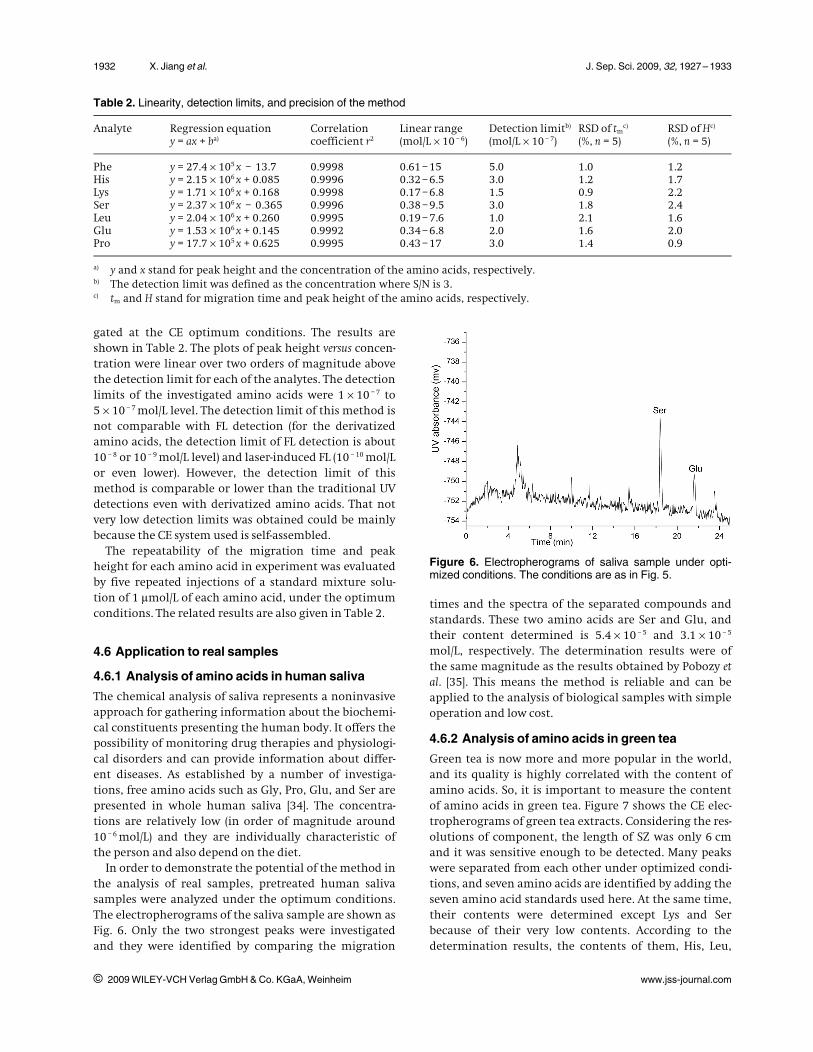
4.5 Linearity, repeatability, and detection limits ofthe method
The linearity between the concentration of the aminoacids and the corresponding peak height was investi-
i 2009 WILEY-VCH Verlag GmbH & Co. KGaA, Weinheim www.jss-journal.com
Figure 4. Electropherograms of Pheobtained by CE sweeping with differ-ent length of SZ. (a)–(f) 0.5, 2, 8, 12,16, and 20 cm, respectively. Theother conditions are as in Fig. 3.
Figure 5. Effect of NaCl concentration in sample solution onpreconcentration. The concentration of NaCl is 100 mmol/Lwhen ionic strength of the sample solution and the runningmedium are the same. The length of SZ is 16 cm. The otherconditions are as in Fig. 3.
1932 X. Jiang et al. J. Sep. Sci. 2009, 32, 1927 – 1933
gated at the CE optimum conditions. The results areshown in Table 2. The plots of peak height versus concen-tration were linear over two orders of magnitude abovethe detection limit for each of the analytes. The detectionlimits of the investigated amino acids were 1610 – 7 to5610 – 7 mol/L level. The detection limit of this method isnot comparable with FL detection (for the derivatizedamino acids, the detection limit of FL detection is about10 – 8 or 10 – 9 mol/L level) and laser-induced FL (10 – 10 mol/Lor even lower). However, the detection limit of thismethod is comparable or lower than the traditional UVdetections even with derivatized amino acids. That notvery low detection limits was obtained could be mainlybecause the CE system used is self-assembled.
The repeatability of the migration time and peakheight for each amino acid in experiment was evaluatedby five repeated injections of a standard mixture solu-tion of 1 lmol/L of each amino acid, under the optimumconditions. The related results are also given in Table 2.
4.6 Application to real samples
4.6.1 Analysis of amino acids in human saliva
The chemical analysis of saliva represents a noninvasiveapproach for gathering information about the biochemi-cal constituents presenting the human body. It offers thepossibility of monitoring drug therapies and physiologi-cal disorders and can provide information about differ-ent diseases. As established by a number of investiga-tions, free amino acids such as Gly, Pro, Glu, and Ser arepresented in whole human saliva [34]. The concentra-tions are relatively low (in order of magnitude around10 – 6 mol/L) and they are individually characteristic ofthe person and also depend on the diet.
In order to demonstrate the potential of the method inthe analysis of real samples, pretreated human salivasamples were analyzed under the optimum conditions.The electropherograms of the saliva sample are shown asFig. 6. Only the two strongest peaks were investigatedand they were identified by comparing the migration
times and the spectra of the separated compounds andstandards. These two amino acids are Ser and Glu, andtheir content determined is 5.4610 – 5 and 3.1610 – 5
mol/L, respectively. The determination results were ofthe same magnitude as the results obtained by Pobozy etal. [35]. This means the method is reliable and can beapplied to the analysis of biological samples with simpleoperation and low cost.
4.6.2 Analysis of amino acids in green tea
Green tea is now more and more popular in the world,and its quality is highly correlated with the content ofamino acids. So, it is important to measure the contentof amino acids in green tea. Figure 7 shows the CE elec-tropherograms of green tea extracts. Considering the res-olutions of component, the length of SZ was only 6 cmand it was sensitive enough to be detected. Many peakswere separated from each other under optimized condi-tions, and seven amino acids are identified by adding theseven amino acid standards used here. At the same time,their contents were determined except Lys and Serbecause of their very low contents. According to thedetermination results, the contents of them, His, Leu,
i 2009 WILEY-VCH Verlag GmbH & Co. KGaA, Weinheim www.jss-journal.com
Table 2. Linearity, detection limits, and precision of the method
Analyte Regression equationy = ax + ba)
Correlationcoefficient r2
Linear range(mol/L610 – 6)
Detection limitb)
(mol/L610 – 7)RSD of tm
c)
(%, n = 5)RSD of Hc)
(%, n = 5)
Phe y = 27.46105 x – 13.7 0.9998 0.61 –15 5.0 1.0 1.2His y = 2.156106 x + 0.085 0.9996 0.32 –6.5 3.0 1.2 1.7Lys y = 1.716106 x + 0.168 0.9998 0.17 –6.8 1.5 0.9 2.2Ser y = 2.376106 x – 0.365 0.9996 0.38 –9.5 3.0 1.8 2.4Leu y = 2.046106 x + 0.260 0.9995 0.19 –7.6 1.0 2.1 1.6Glu y = 1.536106 x + 0.145 0.9992 0.34 –6.8 2.0 1.6 2.0Pro y = 17.76105 x + 0.625 0.9995 0.43 –17 3.0 1.4 0.9
a) y and x stand for peak height and the concentration of the amino acids, respectively.b) The detection limit was defined as the concentration where S/N is 3.c) tm and H stand for migration time and peak height of the amino acids, respectively.
Figure 6. Electropherograms of saliva sample under opti-mized conditions. The conditions are as in Fig. 5.

J. Sep. Sci. 2009, 32, 1927 –1933 Electrodriven Separation 1933
Phe, Glu, and Pro are 0.20, 1.10, 0.23, 0.50, 1.00 mg/g,respectively, which are accordance with the valuesobtained by other instrumental methods [36].
5 Concluding remarks
The direct detection and separation of seven amino acidsby CE–UV was achieved using 50 mmol/L copper sulfatewater solutions with 0.05% HAc as running medium. Thesensitivity was further improved through the coordina-tion-sweeping technique. The analysis of real samples ofhuman saliva and green tea were carried out with satis-factory results. The studies by selecting seven aminoacids at random illustrate the method could be used toanalyze all the amino acids in CE with a simple UV detec-tor under proper CE conditions without further derivati-zation. Similarly, the compounds which can coordinatewith Cu2+ ions also would be analyzed by the method,such as arylamides [28]. However, it cannot be used toanalyze those compounds without ability to coordinatewith Cu2+ ions. Compared with other CE methods, thistechnique is simpler, much lower cost, easier to operate,and no additional chemical operation procedure isrequired for reliable results. It is expected that themethod could be applied to the analysis of amino acidsin food, medicine, industrial products, and some cases ofbiological samples.
The authors wish to thank the support of the National Natural Sci-ence Foundation of China (nos. 20775096 and 20805060) and theInternational Cooperation Project of Ministry of Science and Tech-nology (no. 2006DFA43520).
The authors declared no conflict of interest.
6 References
[1] Shah, A. J., Crespi, F., Heidbreder, C., J. Chromatogr. B 2002, 781,73 – 91.
[2] Oravec, P., Podhradsky, D., J. Biochem. Biophys. Methods 1995, 30,145 – 152.
[3] Fountoulakis, M., Lahm, H.-W., J. Chromatogr. A 1998, 826, 109 –134.
[4] Moln�r-Perl, I., J. Chromatogr. A 2003, 987, 291 – 309.
[5] Naval, M. V., Gomez-Serranillos, M. P., Carretero, M. E., Arce, C.D., J. Chromatogr. A 2006, 1121, 242 – 347.
[6] Kennedy, R. T., Thompson, J. E., Vickroy, T. W., J. Neurosci. Methods2002, 114, 39 – 49.
[7] Lu, M.-J., Chiu, T.-C., Chang, P.-L., Ho, H.-T., Chang, H.-T., Anal.Chim. Acta 2005, 538, 143 – 150.
[8] Li, H., Wang, H., Chen, J.-H., Wang, L.-H., J. Chromatogr. B 2003,788, 93 – 101.
[9] Chan, K. C., Muschik, G. M., Issaq, H., J. Electrophoresis 2000, 21,2062 – 2066.
[10] Wu, J., Chen, Z., Dovichi, N. J., J. Chromatogr. B 2000, 741, 85 – 88.
[11] Han, Y. L., Zou, M., Qi, L., Mao, L., Chen, Y., Electrophoresis 2006, 27,4240 – 4248.
[12] Qu, Q. S., Tang, X. Q., Wang, C. Y., Hu, X. Y., Lu, X., Liu, Y., Li, S. C.,Yan, C., Anal. Chim. Acta 2006, 572, 212 – 218.
[13] Higashijima, T., Fuchigami, T., Imasaka, T., Ishibashi, N., Anal.Chem. 1992, 64, 711 – 714.
[14] Molina, M., Silva, M., Electrophoresis 2002, 23, 2333 – 2340.
[15] Arlt, K., Brandt, S., Kehr, J., J. Chromatogr. A 2001, 926, 319 – 325.
[16] Ivanov, A. R., Nazimov, I. V., Lobazov, A. P., Popkovich, G. B., J.Chromatogr. A 2000, 894, 253 – 257.
[17] Cheistain, W., Buchberger, K. W., Turner, K., Fritz, J. S., J. Chroma-togr. A 1998, 804, 349 – 355.
[18] Soga, T., Ross, G. A., J. Chromatogr. A 1999, 837, 231 – 239.
[19] Yang, W., Zhang, Z., Deng, W., Talanta 2003, 59, 951 – 958.
[20] Liao, S. Y., Whang, C. W., J. Chromatogr. A 1996, 736, 247 – 254.
[21] Tanyanyiwa, J., Schweizer, K., Hauser, P. C., Electrophoresis 2003,24, 2119 – 2124.
[22] Pawliszyn, J., Anal. Chem. 1988, 60, 2796 – 2801.
[23] Schultz, C. L., Moini, M., Anal. Chem. 2003, 75, 1508 – 1513.
[24] Horie, H., Kohata, K., J. Chromatogr. A 1998, 802, 219 – 223.
[25] Kuldvee, R., Vahe, M., Koel, M., Kajurand, M., Electrophoresis 2003,24, 1627 – 1634.
[26] Miller, J. L., Khaledi, M. G., Shea, D., Anal. Chem. 1997, 69, 1223 –1229.
[27] Li, S., Weber, S. G., J. Am. Chem. Soc. 2000, 122, 3787 – 3788.
[28] Wei, W. L., Chen, Z. T., Shi, K. Y., Yuan, L., Jiang, X. M., Xia, Z. N.,Chin. J. Anal. Chem. 2006, 34, 1219 – 1222.
[29] Quirino, J. P., Terabe, S., Science 1998, 282, 465 – 468.
[30] Gong, M., Wehmeyer, K. R., Limbach, P. A., Heineman, W. R.,Anal. Chem. 2006, 78, 6035 – 6042.
[31] Zhu, L. Y., Tu, C. H., Lee, H. K., Anal. Chem. 2002, 74, 5820 – 5825.
[32] Tsai, C.-H., Tsai, C.-C., Liu, J.-T., Lin, C.-H., J. Chromatogr. A 2005,1068, 115 – 121.
[33] Fan, L., Cheng, Y., Li, Y., Chen, H., Chen, X., Hu, Z., Electrophoresis2005, 26, 4345 – 4354.
[34] Battistone, G. C., Burnett, G. W., Arch. Oral. Biol. 1961, 3, 161 – 170.
[35] Pobozy, E., Czarkowska, W., Trojanowicz, M., J. Biochem. Biophys.Methods 2006, 67, 37 – 47.
[36] Ding, Y. S., Yu, H., Mou, S. F., J. Chromatogr. A 2002, 982, 237 – 244.
i 2009 WILEY-VCH Verlag GmbH & Co. KGaA, Weinheim www.jss-journal.com
Figure 7. Electropherograms of green tea extract under opti-mized conditions. The length of SZ is 6 cm, and the otherconditions are as in Fig. 3.
Copyright © 2022 FDOKUMEN