Capillary electrophoresis and mass spectrometry for screening of metabolic disorders in newborns
10
Review Petr S ˇ enk 1 Libor Kozák 2 Frantis ˇ ek Foret 1 1 Institute of Analytical Chemistry 2 Center of Molecular Biology and Gene Therapy, University Hospital Brno, Brno, Czech Republic Capillary electrophoresis and mass spectrometry for screening of metabolic disorders in newborns Clinical analyses always represent a challenge for the sensitivity and selectivity of the analytical techniques. Of the most critical are the techniques required for the quick determination of the disease state and application of the proper treatment in new- borns. This short critical review overviews the present state of the art of the use of mass spectrometry and capillary electrophoresis for screening of metabolic disorders in newborns. Keywords: Capillary electrophoresis / Mass spectrometry / Metabolic disorders in newborns / Review DOI 10.1002/elps.200405853 Contents 1 Introduction ............................. 1447 2 Inborn errors of metabolism and newborn screening ............................... 1447 3 Sample preparation and mass spectrometry analysis ................................ 1449 4 Capillary electrophoresis .................. 1451 5 Conclusion and outlook ................... 1455 6 References ............................. 1455 1 Introduction Analysis of metabolite markers in body fluids represents one of the most common analytical tasks performed daily in clinical biochemical laboratories. Although many of the most common metabolic markers can be routinely determined by some of the well established “classical” methods, development of new techniques and methods is still in high demand. The current revolutionary progress in the biological sciences supported by the rapid devel- opment of new generations of analytical instrumentation is changing the ways metabolic markers are identified, analyzed, screened for, and the resulting analytical data interpreted. In fact, a new specialized field of metabolo- mics is emerging [1, 2]. The original tests, typically devel- oped for determination of only one compound in one sample, can now, in many cases, be substituted by a more comprehensive analysis of a group of substances, better defining the metabolic status of the organism. One important application of these new technologies is ex- pected to be in the metabolite screening for detection of inborn diseases. This short review summarizes some of the recent advances in the use of mass spectrometry (MS) and capillary electrophoresis (CE) in the area of newborn screening, especially in the area of multicom- ponent analysis. 2 Inborn errors of metabolism and newborn screening The term “inborn errors of metabolism” (IEM) was first used by Garrod [3] in the early 1900s for description of hereditary deficit or changes in enzymatic reactions. The first inborn error, alcaptonuria, was described as a defi- ciency of the enzyme homogentisate 1,2-dioxygenase, which has a role in the catabolism of tyrosine and phen- ylalanine. Before finding of the corresponding metabolic development pathways, the errors of metabolism were diagnosed by observation of evident abnormalities, such as dark urine, bodily deformations or mental retar- dation. The heredity of these errors was proven by link- age analysis in families of patients with high recurrence of the disease symptoms. The cause of some of the most frequent diseases and the identity and role of the respective chemical markers has been discovered dur- ing the 20 th century. In the early 1960s, Guthire [4] devel- oped the first method for screening of whole populations for phenylketonuria (PKU). This method was based on Correspondence: Dr. Frantis ˇ ek Foret, Institute of Analytical Chemistry, Vever ˇí 97, CZ-61142 Brno, Czech Republic E-mail: [email protected] Fax: 142-05-4121-2113 Abbreviations: AA, amino acid; Cit, citrulline; IEM, inborn errors of metabolism; MCAD, medium-chain acyl-coenzyme A dehy- drogenase; PKU, phenylketonuria Electrophoresis 2004, 25, 1447–1456 1447 CE and CEC 2004 WILEY-VCH Verlag GmbH & Co. KGaA, Weinheim
-
Upload
independent -
Category
Documents
-
view
0 -
download
0
Transcript of Capillary electrophoresis and mass spectrometry for screening of metabolic disorders in newborns

Review
Petr Senk1
Libor Kozák2
Frantisek Foret1
1Institute of Analytical Chemistry2Center of Molecular Biologyand Gene Therapy, UniversityHospital Brno,Brno, Czech Republic
Capillary electrophoresis and mass spectrometryfor screening of metabolic disorders in newborns
Clinical analyses always represent a challenge for the sensitivity and selectivity of theanalytical techniques. Of the most critical are the techniques required for the quickdetermination of the disease state and application of the proper treatment in new-borns. This short critical review overviews the present state of the art of the use ofmass spectrometry and capillary electrophoresis for screening of metabolic disordersin newborns.
Keywords: Capillary electrophoresis / Mass spectrometry / Metabolic disorders in newborns /Review DOI 10.1002/elps.200405853
Contents
1 Introduction . . . . . . . . . . . . . . . . . . . . . . . . . . . . . 14472 Inborn errors of metabolism and newborn
screening. . . . . . . . . . . . . . . . . . . . . . . . . . . . . . . 14473 Sample preparation and mass spectrometry
analysis . . . . . . . . . . . . . . . . . . . . . . . . . . . . . . . . 14494 Capillary electrophoresis . . . . . . . . . . . . . . . . . . 14515 Conclusion and outlook . . . . . . . . . . . . . . . . . . . 14556 References . . . . . . . . . . . . . . . . . . . . . . . . . . . . . 1455
1 Introduction
Analysis of metabolite markers in body fluids representsone of the most common analytical tasks performeddaily in clinical biochemical laboratories. Although manyof the most common metabolic markers can be routinelydetermined by some of the well established “classical”methods, development of new techniques and methodsis still in high demand. The current revolutionary progressin the biological sciences supported by the rapid devel-opment of new generations of analytical instrumentationis changing the ways metabolic markers are identified,analyzed, screened for, and the resulting analytical datainterpreted. In fact, a new specialized field of metabolo-mics is emerging [1, 2]. The original tests, typically devel-
oped for determination of only one compound in onesample, can now, in many cases, be substituted by amore comprehensive analysis of a group of substances,better defining the metabolic status of the organism. Oneimportant application of these new technologies is ex-pected to be in the metabolite screening for detection ofinborn diseases. This short review summarizes some ofthe recent advances in the use of mass spectrometry(MS) and capillary electrophoresis (CE) in the area ofnewborn screening, especially in the area of multicom-ponent analysis.
2 Inborn errors of metabolism and newbornscreening
The term “inborn errors of metabolism” (IEM) was firstused by Garrod [3] in the early 1900s for description ofhereditary deficit or changes in enzymatic reactions. Thefirst inborn error, alcaptonuria, was described as a defi-ciency of the enzyme homogentisate 1,2-dioxygenase,which has a role in the catabolism of tyrosine and phen-ylalanine. Before finding of the corresponding metabolicdevelopment pathways, the errors of metabolism werediagnosed by observation of evident abnormalities,such as dark urine, bodily deformations or mental retar-dation. The heredity of these errors was proven by link-age analysis in families of patients with high recurrenceof the disease symptoms. The cause of some of themost frequent diseases and the identity and role of therespective chemical markers has been discovered dur-ing the 20th century. In the early 1960s, Guthire [4] devel-oped the first method for screening of whole populationsfor phenylketonuria (PKU). This method was based on
Correspondence: Dr. Frantisek Foret, Institute of AnalyticalChemistry, Veverí 97, CZ-61142 Brno, Czech RepublicE-mail: [email protected]: 142-05-4121-2113
Abbreviations: AA, amino acid; Cit, citrulline; IEM, inborn errorsof metabolism; MCAD, medium-chain acyl-coenzyme A dehy-drogenase; PKU, phenylketonuria
Electrophoresis 2004, 25, 1447–1456 1447
CE
and
CE
C
2004 WILEY-VCH Verlag GmbH & Co. KGaA, Weinheim
1448 P. Senk et al. Electrophoresis 2004, 25, 1447–1456
the measurement of Phe in dried blood spots by bacteri-al inhibition assay [4, 5]. Similar methods have later beendeveloped for additional diseases, such as maple syrupurine disease, isolated hypermethionemia, homocysti-nuria, and galactosemia [6]. In the early 60s, the firstscreening program for PKU has been launched in Mas-sachussets. The early detection of PKU and consequentadministration of a diet with low content of Phe signifi-cantly decreased mortality as well as cost of the diseasetreatment in the later stages.
IEM are relatively common phenomenon in some Afri-can countries, such as Saudi Arabia and in the areasof Near East [7, 8], probably due to considerable kin-ship. In some of the isolated areas, it is estimated, thatthe IEM comprise 20% of all newborn diseases and theincidence of IEM is approximately 1 in 5000 of the new-borns [9, 10]. Although early diagnosis of some of thesediseases can highly increase the success of the treat-ment, newborn screening is still performed only for sev-eral types of the diseases. Some of the most common
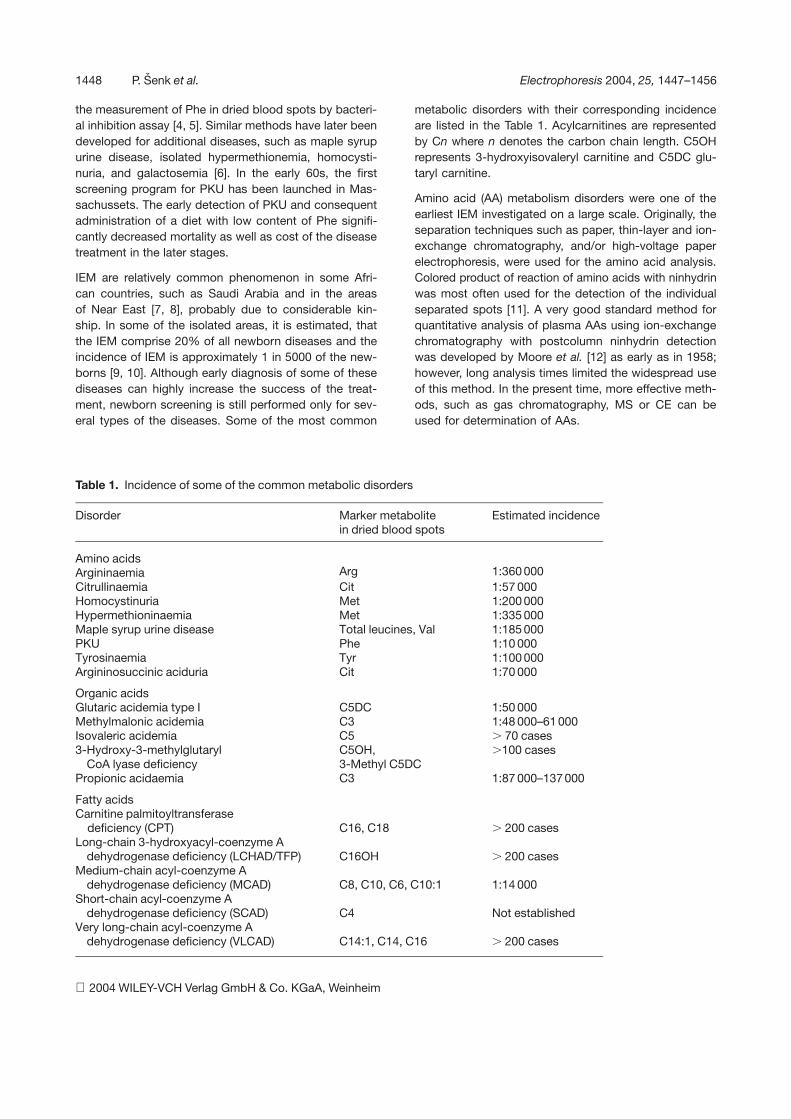
metabolic disorders with their corresponding incidenceare listed in the Table 1. Acylcarnitines are representedby Cn where n denotes the carbon chain length. C5OHrepresents 3-hydroxyisovaleryl carnitine and C5DC glu-taryl carnitine.
Amino acid (AA) metabolism disorders were one of theearliest IEM investigated on a large scale. Originally, theseparation techniques such as paper, thin-layer and ion-exchange chromatography, and/or high-voltage paperelectrophoresis, were used for the amino acid analysis.Colored product of reaction of amino acids with ninhydrinwas most often used for the detection of the individualseparated spots [11]. A very good standard method forquantitative analysis of plasma AAs using ion-exchangechromatography with postcolumn ninhydrin detectionwas developed by Moore et al. [12] as early as in 1958;however, long analysis times limited the widespread useof this method. In the present time, more effective meth-ods, such as gas chromatography, MS or CE can beused for determination of AAs.
Table 1. Incidence of some of the common metabolic disorders
Disorder Marker metabolitein dried blood spots
Estimated incidence
Amino acidsArgininaemia Arg 1:360 000Citrullinaemia Cit 1:57 000Homocystinuria Met 1:200 000Hypermethioninaemia Met 1:335 000Maple syrup urine disease Total leucines, Val 1:185 000PKU Phe 1:10 000Tyrosinaemia Tyr 1:100 000Argininosuccinic aciduria Cit 1:70 000
Organic acidsGlutaric acidemia type I C5DC 1:50 000Methylmalonic acidemia C3 1:48 000–61 000Isovaleric acidemia C5 . 70 cases3-Hydroxy-3-methylglutaryl
CoA lyase deficiencyC5OH,3-Methyl C5DC
.100 cases
Propionic acidaemia C3 1:87 000–137 000
Fatty acidsCarnitine palmitoyltransferase
deficiency (CPT) C16, C18 . 200 casesLong-chain 3-hydroxyacyl-coenzyme A
dehydrogenase deficiency (LCHAD/TFP) C16OH . 200 casesMedium-chain acyl-coenzyme A
dehydrogenase deficiency (MCAD) C8, C10, C6, C10:1 1:14 000Short-chain acyl-coenzyme A
dehydrogenase deficiency (SCAD) C4 Not establishedVery long-chain acyl-coenzyme A
dehydrogenase deficiency (VLCAD) C14:1, C14, C16 . 200 cases
2004 WILEY-VCH Verlag GmbH & Co. KGaA, Weinheim

Electrophoresis 2004, 25, 1447–1456 Metabolic disorders in newborns 1449
The laboratory diagnosis of metabolic disorders ideallyincludes three basic steps. The first is identification ofthe pathological metabolite. When the metabolite isidentified, treatment can often be started. The secondstep is measurement of residual enzyme activity followedby mutation analysis if the mutation is known. In the idealcase, the metabolic disorders should be detected earlyafter the birth before causing disruption of mental orphysical development. Of the several hundreds (, 500)metabolic diseases known today less than , 10% canbe routinely identified in newborn screening programs(Table 1). The following criteria are typically consideredfor inclusion of an inborn error into the screening pro-gram: (i) clinically and biochemically well-defined error,(ii) known and statistically significant presence in popula-tion, (iii) disease related with significant morbidity or mor-tality, (iv) effective, robust, simple, and safe screeningtests available, (v) testing and treatment are cost-effec-tive with positive treatment outcome.
The significant argument for newborn screening is reduc-tion of the cost of the treatment and saving of life [13].The normal development of children can be secure ifthe disease is detected soon enough. The cost benefitof the screening clearly depends not only on the avail-ability of the analytical procedure but also on the socio-economic situation in the particular geographic region.Table 2 summarizes the cost benefit and some key fac-tors for selected diseases based on the geographicaldistribution.
Significant progress in understanding of the processesunderlying the inherited metabolic disorders and findingof the specific enzymatic pathways was achieved in theearly 80s of the last century. The development of new,highly sensitive immunoassay based analytical proce-dures allowed determination of accumulated substrateor unusual product of metabolism related to a blocked orabnormal enzymatic activity. In the same time, theory that
Table 2. Screening benefits
Disease Extent of screening Cost benefit
PKU Widespread Strong
Congenital hypothyreosis Widespread Strong
Cystic fibrosis Australasia, parts ofEurope and USA
Not clear
Galactosemia Australasia, parts ofEurope and USA
Not clear
Congenital adrenalhyperplasia
New Zealand, parts ofEurope and USA
Positive
Aminoacidemias,organic acidemias
Limited but growing(need MS/MS)
Not clear
the deficit of an enzyme is connected with a failure of aspecific gene was suggested [14]. This theory also sup-ports the assumption of the hereditary nature of these dis-eases. The searching of errors of metabolism thus couldbe started by observation of alteration or absence ofgenes causing deficiency of enzymes. The recent finish-ing of the sequencing of the human genome provides asolid background for development of the DNA-basedtests for identification of the mutations leading to inher-ited diseases; however clinical tests based on the analy-sis of the metabolites in the bodily fluids still provide thecost-effective alternative for high-throughput screening ofknown metabolic disorders. The current advances in theanalytical technology often allow simultaneous determi-nation and unequivocal identification of multiple sub-stances in small volumes of samples.
3 Sample preparation and massspectrometry analysis
The analytical procedure starts with the sample collec-tion. Typically, a drop of blood is collected and stored inthe form of dried spots deposited on a special type ofpaper with a defined adsorption of blood per unit area.This simple sample collection procedure allows easytransport and high-volume storage. A well-defined sam-ple aliquot can easily be recovered by extracting thedried material. Alternative, albeit less frequently collectedsamples include urine and saliva. Welldeveloped andreliable analytical procedures include mainly colorimetricreactions, enzymatic assays and gas chromatographycoupled to MS. The improvements in the sensitivity ofanalytical methods allow, in principle, performing severaldifferent tests on dried blood spots. Rapid developmentof liquid-phase separation techniques and MS instrumen-tation, especially in tandem-MS (MS/MS) arrangement,provide new means for simultaneous screening of severalmetabolite markers [1, 2, 15]. While simple mass spectro-metric measurement can provide exact mass values ofthe analyzed compounds, such information is mostlyinsufficient for the compound identification becausemany different small organic molecules can have veryclose or identical masses. Thus, the exact identificationmust be based on the mass measurement of the frag-ments generated inside the mass spectrometer. The frag-mentation is typically induced by collisions with inert gas(argon, nitrogen) inside the collision cell of the mass spec-trometer. The fragmentation pattern reflects the structureof the original molecule and together with the knowledgeof the mass of the intact molecule provides very high cer-tainty in the identification of the given sample component.Typically, monitoring of one or few fragments is sufficientfor positive identification of a substance with a known
2004 WILEY-VCH Verlag GmbH & Co. KGaA, Weinheim

1450 P. Senk et al. Electrophoresis 2004, 25, 1447–1456
fragmentation pattern. Currently, the most common massspectrometers used for quantitative metabolite analysisare based on the triple quadrupole design; however, newion-trap or time-of-flight based instruments [16] may soonbe available for these types of analyses as well. An impor-tant aspect of the mass spectrometric analysis is thesample ionization. For direct analysis of liquid samples,electrospray and chemical ionization interfaces are themost common choice [16]. Both ionization techniquescan also be used for on-line coupling with liquid chroma-tography (LC) or CE. Figure 1 shows the impact of theinstrumentation advances on the use of MS/MS in new-born screening.
An important application of MS/MS is AA analysis in bodyfluids. In this case, the AA are typically esterified duringthe extraction and the subsequent identification is basedon an observation of the respective fragment, e.g., ofbutyl formate (120 Da) during the MS/MS monitoring [18,19]. This transition is highly specific for a-AAs so thatscanning MS1 and MS2 with a constant mass differenceproduces a spectrum of the molecular ions of the majorityof the AAs present in the sample mixture with no interfer-ence from signals of the other compounds. Quantitationof AAs is performed by addition of a stable isotope ofamino acids. Recently, a new method for direct tandemmass spectrometric analysis of AAs in dried blood spotswas tested for neonatal screening without the need forbutylation [20, 21]. The new method was based on multi-ple reaction monitoring (MRM) instead of constant neutralloss scanning. The method was optimized for detection of23 L-AAs in their native form with quantitation based onisotope-labeled internal standards.
Recent large-scale study has assessed the impact ofthe use of mass spectrometric analysis on the rate ofdiagnosis of 31 disorders affecting metabolism of theurea cycle, AAs, and organic acids and fatty acid oxida-tion among 362 000 newborns [22]. The rate of detec-tion was increased specifically for MCAD deficiencyand other disorders of fatty acid oxidation. Overall,more cases of IEM were diagnosed by screening withMS/MS than diagnosed clinically. While more studieswill be necessary for the cost assessment, two recentworks found the MS cost-effective [23, 24]. Moredetailed information about the use of the MS/MS tech-nology can be found in one of the recent review articles[25–27].
While MS is the ultimate analytical method it is also themost expensive and alternative instrumentation will beuseful till the MS instrument prices drop significantly.Additionally, direct infusion analysis of liquid samplesoften suffers from interferences of the sample matrixcomponents such as signal suppression. Thus, LC col-umns are commonly coupled with MS for sample desalt-ing and preseparation. LC is currently the most wide-spread separation technique. Well-established optimizedseparation protocols allow validated determination of anumber of analytes with UV-absorbance, fluorescenceor mass spectrometric detection [28, 29]. Similarly, amuch younger technique of CE may be suitable forhigh-resolution separations of some of the importantmetabolic markers [30]. The following text aims at briefreviewing of some of the recent applications of CE forthe analysis of metabolites and their potential for screen-ing purposes.
Figure 1. Introduction of MS/MS in newborn screening. Re-printed from [17], with permis-sion.
2004 WILEY-VCH Verlag GmbH & Co. KGaA, Weinheim
Electrophoresis 2004, 25, 1447–1456 Metabolic disorders in newborns 1451
4 Capillary electrophoresis
CE is one of the most powerful separation techniquesproviding very high separation efficiency and speed ofanalysis [31]. The separation is performed in a free solu-tion in a fused-silica capillary column. The separated ana-lytes are commonly detected by an on-column UV-ab-sorbance or laser-induced fluorescence (LIF) detectors.Several protocols have been developed for determinationof AAs [32–34] and organic acids [35–40] such as oroticacid [41–43] in urine or blood samples using CE. Directmeasurements can often be performed on samples withminimum initial pretreatment – i.e., centrifugation anddilution, if needed. Separation is typically performed inphosphate or borate buffers (low UV background), some-times with an organic modifier (methanol, cyclodextrins)to improve the resolution.
The commercially available automated CE system withUV detection was applied for measurement of organicacids in urine samples of patients with acidurias [36, 37].Separation, detection and identification were preformedin less than 15 min for more than 20 organic acids. Thefollowing examples shown in the Fig. 2 show the detec-tion of glutaric aciduria (Fig. 2a) and pyroglutamic aciduria(Fig. 2b). In both of the examples the separations wereperformed using a 37 cm long separation capillary with0.75 mm ID and the UV detector set at 220 nm.
In cases when increased sensitivity and selectivity isrequired the UV detector can be substituted by a LIFunit. Such an arrangement is suitable for the analysis ofsubstances with native fluorescence or the ones whichcan be readily derivatized. For example, the free AAs inhuman plasma were analyzed with high sensitivity afterderivatization with 3-(4-carboxybenzoyl)quinoline-2-car-boxylaldehyde (CBQCA) [32]. The derivatization steptakes approximately 40 min with the analysis concentra-tion limit of detection as low as 461028 M. Labeled AAscan be easily excited by the 488 nm line of an Ar-ion laser,or the 442 nm line of He/Cd laser. The total time of theanalysis of 29 AAs (including two internal standards) anal-ysis is about 70 min. The examples of the separationrecords with LIF detection are in Fig. 3 with panel (a)showing the separation of 29 AA standards and the fol-lowing panels depict the analysis of the samples frompatients with PKU (b), and citrullinemia (c).
A simple, rapid and reproducible method has recentlybeen described for CE determination of hypoxanthine,xanthine and uric acid in urine samples of infants by usingan uncoated fused-silica capillary and UV [39]. In 40mmol/l borate buffer at pH 9.4 with 0.1 mol sodium dode-cyl sulfate the calibration curves for hypoxanthine andxanthine were linear to 150 mmol/L and for uric acid to
300 mmol/l. The limits of detection for hypoxanthine,xanthine and uric acid were 0.5, 2.0 and 20 mmol/l,respectively. The method has been successfully appliedfor analysis of the urine samples of 103 infants. Alterna-tive methods for determination of purine and pyrimidinemetabolites have been described using 60 mmol/Lborate-2-amino-2-methyl-1-propanol-80 mmol/L sodiumdodecyl sulfate (pH 9.6) at 357C as the background elec-trolyte [44]. These conditions allowed separation of alldiagnostic metabolites from major urinary constituentsin an analysis time of 3 min and with a separationefficiency of 220 000 theoretical plates/m. The clinicallyimportant metabolites were detectable at concentrationsof 0.85–4.28 mmol/L with linearity range of 5–500 mmol/L(r . 0.99). Characteristic abnormalities were detected inthe electropherograms of urine samples from patientswith purine and pyrimidine enzyme deficiencies. Themethod has been also modified with electroosmotic flowreversed by cationic surfactant. Final separation condi-tions consisted of 45 mM borate, 55 mM N-tris(hydroxy-methyl)methylglycine, 10 mM tartrate, 1 mM cetyltrimethyl-ammonium bromide, and 0.44% tetrabutylammonium hy-droxide-2-amino-2-methyl-1,3-propanediol (pH 8.6). Boththe reproducibility and sensitivity improved under theseconditions and the method was used for determinationof adenine, adenosine, 2-deoxyadenosine, 2-deoxygua-nosine, 2,8-dihydroxyadenine, guanosine, hypoxanthine,orotidine, orotic acid, and creatinine in urine and bloodsamples [45–47]. When higher separation selectivity isrequired the analysis can be performed at a low pH whereonly the cationic species will be detected. These alterna-tive separations were used for monitoring 2,8-dihydrox-yadenine urolithiasis, an inherited disorder caused byadenine phosphoribosyltransferase deficiency. Using aphosphate buffer at pH 3 allowed fast (8 min), simple, sen-sitive and selective capillary zone electrophoretic methodfor diagnosis of 2,8-dihydroxyadenine urolithiasis. Underthe given separation conditions 2,8-dihydroxyadeninewas very well separated from other purine and pyrimidine.The reliability of the method presented for screening ofpatients with adenine phosphoribosyltransferase defi-ciency was also demonstrated on a urine sample of apatient with the defect who was already treated with allo-purinol. No interfering substances were found in 50 urinesamples from healthy infants.
As mentioned previously, the use of LIF provides bothhigher sensitivity and better selectivity of detection. Theincreased interest in the analysis of aminothiols in bodyfluids during the last years resulted in the development ofthe CE protocol for the simultaneous analysis of homo-cysteine, cysteine, glutathione, cysteinylglycine, g-gluta-mylcysteine, and of penicillamine, mercaptopropionylgly-cine, and cysteamine, three compounds used to treat dis-
2004 WILEY-VCH Verlag GmbH & Co. KGaA, Weinheim

1452 P. Senk et al. Electrophoresis 2004, 25, 1447–1456
Figure 2. (a) Electropherogramsof urine from patients withmethylmalonic or glutaric acid-uria compared with healthyurine and standards: 1, oxal-ic; 2, oxalacetic; 3, fumaric;4, 2-ketoglutaric; 5, malic;6, methylmalonic; 7, glutaric;8, citric; 9, phthalic (internalstandard); 10, N-acetyl-L-aspar-tic; 11, glykolic acid. (b) Electro-pherograms of urine from apatient with pyroglutamic acid-uria compared with healthyurine. Standards: 23, pyroglutam-ic; 24, orotic; 25 xanthurenicacid. Reprinted from [36], withpermission.
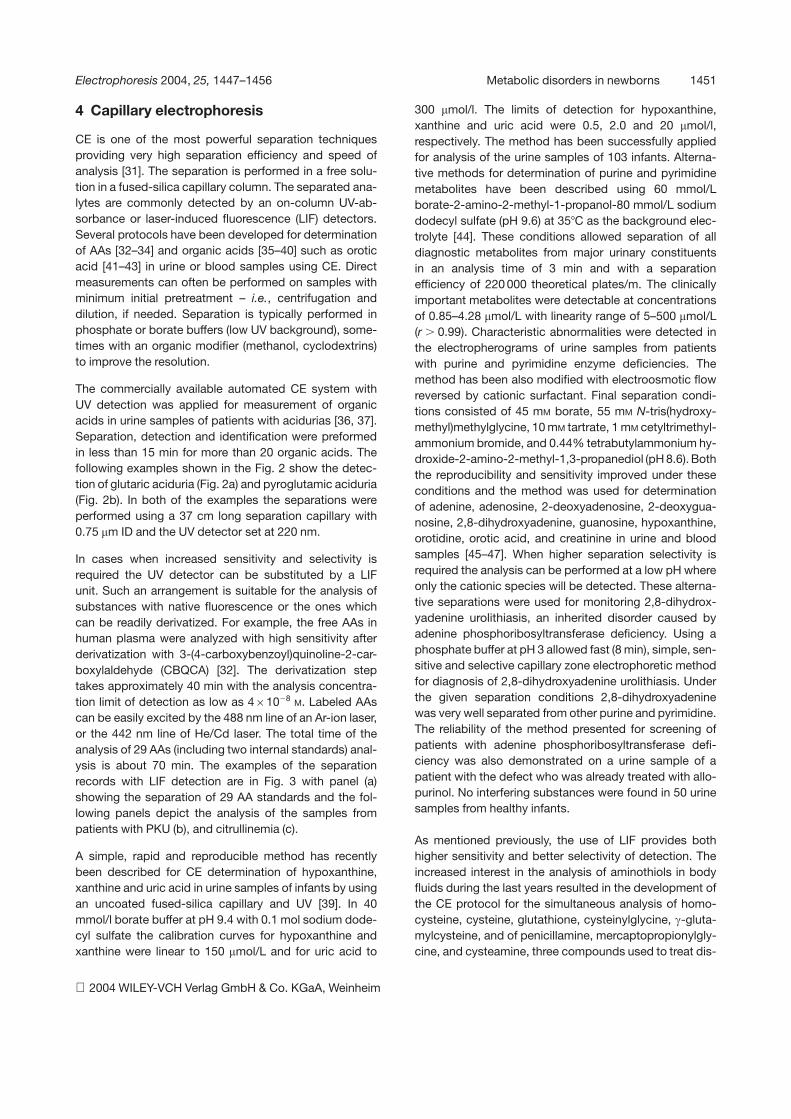
orders of aminothiol metabolism in plasma and urine.Samples were reduced with tris(carboxyethyl)phosphineand labeled with 5-(bromomethyl)fluorescein. CE sep-arations were performed in 60 mmol/L borate – 15mmol/L sodium dodecyl sulfate – 2-amino-2-methyl-1-propanol, pH 10.0, with LIF detection. Analysis timewas less than 2 min. Results agreed well with a standardHPLC method. The diagnostic usefulness of the methodhas been demonstrated on 79 samples of cystinuricpatients and 12 samples of homocystinuric patients. Anexample of the corresponding CE separation records isin Fig. 4.
Due to the lack of a suitable commercial instrumentationthe on-line coupling of CE with MS has not yet reachedthe level of LC-MS; however, the separation efficiency,speed and little or no need for the sample pretreatmentmake such a combination attractive for a number of appli-cations [33–35, 49]. Similarly to HPLC, the CE separationserves mainly as a sample desalting and preseparationtechnique eliminating the interferences of the samplematrix. Urine samples can often be injected without anypretreatment. In the case of determination of aminoacidsand acylcarnitines in dried blood samples, the samplepreparation involved extraction and esterification by
2004 WILEY-VCH Verlag GmbH & Co. KGaA, Weinheim

Electrophoresis 2004, 25, 1447–1456 Metabolic disorders in newborns 1453
Figure 3. CE separation of AAswith LIF detection. (a) Migra-tion of the 29 AAs standards.Peak identification: 1 and 2,Lys; 3, 1-CH3-His; 4, Cit; 5, Gln;6, anserine (Ans*); 7, Asn**;8, 3-CH3-His; 9, Tyr; 10, Orn;11, b-Ala*; 12, carnosine (Car*);13, (Hcy)2; 14, Ser; 15, Gly**;16, Ala; 17, 2-aminobutynicacid (d-Abu); 18, taurine (Tau**);19, 1-Abu; 20, Val; 21, (Hcy)2;22, Met; 23, Thr; 24, N-Val;25, Ile; 26, Phe; 27, Leu;28, 2-aminoadipic acid (Aad);29, N-Leu; 30, Glu***; 31, Arg***;32, Asp***. The concentrationsof the individual AAs in themixture were 100 mM exceptfor * = 30 mM, ** = 60 mM and ***= 200 mM. (b) Electropherogramof plasma from patient withPKU. The levels of Tyr and Pheas measured by ion-exchangechromatography (IEC) were1098 and 47 mmol/L, respec-tively. (c) Electropherogram ofplasma from patient with citrulli-nemia. The levels as measuredby IEC were 3940, 1640, and1750 mmol/L for Cit, Ala, andGlu, respectively. Separationconditions: background elec-trolyte, 160 mM borate, 130 mM
SDS, 7.5 mM g-CD, and 20 mM
NaCl at pH of 9.5; capillary,67 cm length (60 cm to thedetector) and 50 mm ID; 30 kV;separation current, 150 mA. Re-printed from [32], with permis-sion.
2004 WILEY-VCH Verlag GmbH & Co. KGaA, Weinheim
1454 P. Senk et al. Electrophoresis 2004, 25, 1447–1456
Figure 4. (a) Separation of standard mixture in 60 mmol/L borate – 15 mmol/L SDS – 2-amino-2- methyl-1-propanol buffer,pH 10.0. Actual concentration of aminothiols: 25 mmol/L. Peaks: Hcy; Cys; GSH; Cys-Gly; Glu-Cys; CA, cysteamine; PA,penicillamine; MPG, ercaptopropionylglycine; IS, internal standard (mercaptoacetic acid). (b) Electropherogram of plasmafrom (a) healthy person; (b) chronic dialysis patient with increased concentration of Hcy, Cys-Gly, and Cys. Actual concen-tration of aminothiols: (a) 7.2 mmol/L Hcy; 19.1 mmol/L Gys-Gly; 153.3 mmol/L Cys; 11.1 mmol/L, GSH; 5.4 mmol/L Glu-Cys;(b) 36.2 mmol/L Hcy; 41.2 mmol/L Cys-Gly; 489.2 mmol/L Cys; 15.1 mmol/L GSH; 4.4 mmol/L Glu-Cys. The electrophoreticseparations were carried out in an uncoated fused-silica 20 cm long capillary (25 mm ID, 375 mm OD) with LIF detection at488/522 nm. Reprinted from [48], with permission.
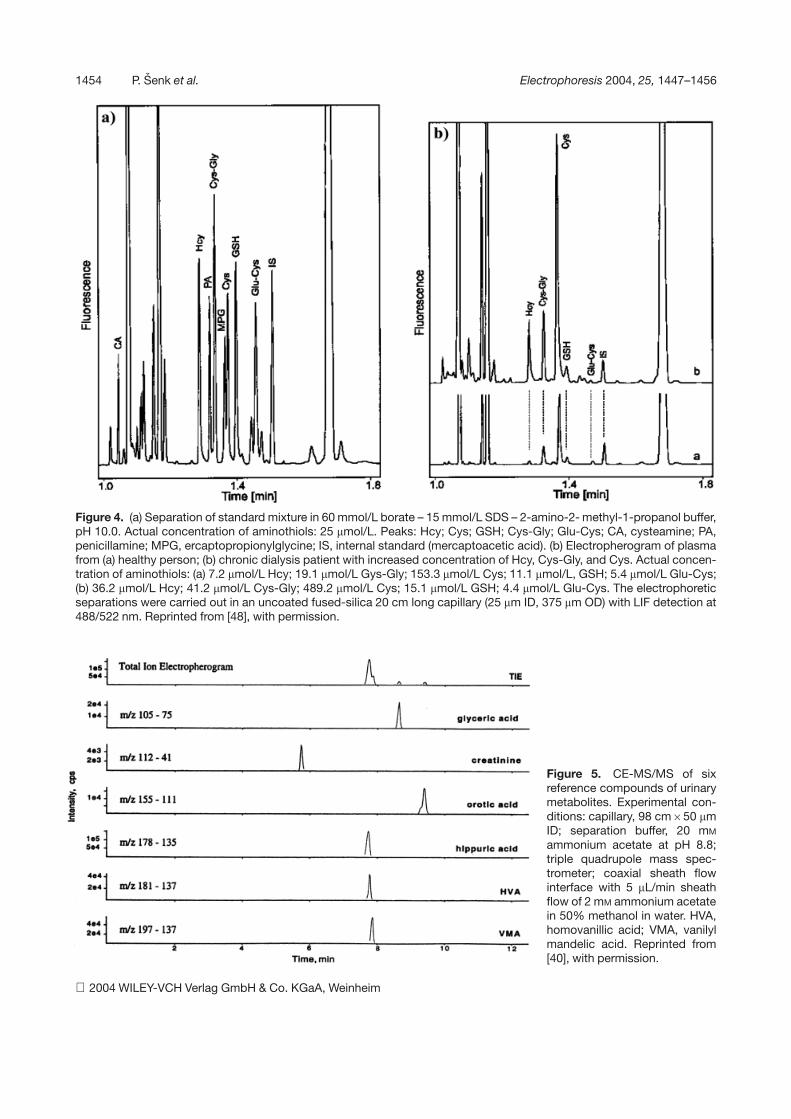
Figure 5. CE-MS/MS of sixreference compounds of urinarymetabolites. Experimental con-ditions: capillary, 98 cm650 mmID; separation buffer, 20 mM
ammonium acetate at pH 8.8;triple quadrupole mass spec-trometer; coaxial sheath flowinterface with 5 mL/min sheathflow of 2 mM ammonium acetatein 50% methanol in water. HVA,homovanillic acid; VMA, vanilylmandelic acid. Reprinted from[40], with permission.
2004 WILEY-VCH Verlag GmbH & Co. KGaA, Weinheim
Electrophoresis 2004, 25, 1447–1456 Metabolic disorders in newborns 1455
butanolic HCl and addition of deuterated internal stand-ard for quantitation [40]. When analyzed by MS, the butylesters produce a common fragment at m/z 85 in the MS/MS mode. An example of the CE-MS/MS analysis of sixreference compounds of urinary metabolites is shown inFig. 5.
5 Conclusion and outlook
The presented text documents some aspects of the useof CE and MS for metabolite profiling and neonatalscreening. It can be expected that the use of mass spec-trometric methods will keep increasing as the adequateinstrumentation proliferates into clinical laboratories. Atthe same time, the separation techniques will play animportant role for on-line sample pretreatment and prese-paration to minimize the interferences and ion suppres-sion due to the sample matrix. While HPLC will continueto play a dominant role in this field, CE may evolve as apotent alternative due to a different separation mechan-ism, speed, high separation efficiency, and extremely lowsample consumption. This potential will only be unlockedwith the introduction of a reliable commercial instrumen-tation for CE-MS coupling.
This work was supported by the grant S4031209 from theGrant agency of the Czech Academy of Sciences and bygrant CEZ MZ/98001/209627 of the Ministry of Healthof the Czech Republic. The authors wish to thank AppliedBiosystems, USA and Gyros, Sweden for the generoussupport.
Received January 9, 2004
6 References
[1] Carpenter, K. H., Wiley, V., Clin. Chim. Acta 2002, 322, 1–10.
[2] Clague, A., Thomas, A., Clin. Chim. Acta 2002, 315, 99–100.
[3] Garrod, A. E., Lancet 1902, 13, 1616–1620.
[4] Guthrie, R., Susi, A., Pediatrics 1963, 32, 338–343.
[5] Guthrie, R., Screening 1992, 1, 5–15.
[6] Seashore, M. R., Semin. Perinatol 1990, 14, 431–438.
[7] Moammar, H., Ratard, R., Cheriyan, G., Mathew, P. J., Inher.Metab. Dis. 1996, 19, 331–334.
[8] Teebi, A., J. Med. Genet. 1994, 31, 224–233.
[9] Arn, P. H., Valle, D. L., Brusilow, S. W., Contemp. Pediatr.1988, 5, 47–63.
[10] Ward, J. C., Pediatr. Rev. 1990, 11, 205–216.
[11] Roe, C. D., Roe, D. S., Mol. Genet. Metab. 1999, 68, 243–257.
[12] Moore, S., Spackman, D. H., Stein, W. H., Anal. Chem. 1958,30, 1185–1190.
[13] Pollitt, R. J., Green, A., McGabe, C. J., Booth, A., Cooper, N.J., Leonard, J. V., Nicholl, J., Nicholson, P., Tunaley, J. R.,Virdi, N. K., Health Technol. Assess. 1997, 1, 1–202.
[14] Sent, G. S., Calendar, R., Molecular Genetics: An Introduc-tion Narrative, 2nd Ed.,Freeman, San Francisco, CA 1978,pp. 131–136.
[15] Jones, P. M., Bennett, M. J., Clin. Chim. Acta 2002, 324,121–128.
[16] Gross, M. L., Caprioli, R., The Encyclopedia of Mass Spec-trometry: Mass Analysis and Associated Instrumentation.,Pergamon Press, Elmsford, NY 2004.
[17] Center for Disease Control and Prevention, MMWR 2001,50, 1–40.
[18] Millington, D. S., Kodo, N., Terada, N., Roe, D., Chace, D. H.,Int. J. Mass Spectrom. Ion Processes 1991, 111, 211–228.
[19] Hardy, D. T., Hall, S. K., Preece, M. A., Green, A., Ann. Clin.Biochem. 2002, 39, 73–75.
[20] Nagy, K., Takats, Z., Pollreisz, F., Szabo, T., Vekey, K., RapidCommun. Mass Spectrom. 2003, 17, 983–990.
[21] Schulze, A., Schmidt, C., Kohlmüller, D., Hoffmann, G. F.,Mayatepek, E., Clin. Chim. Acta 2003, 335, 137–145.
[22] Wilcken, B., Wiley, V., Hammond, J., Carpenter, K., N. Engl.J. Med. 2003, 348, 2304–2312.
[23] Insinga, R. P., Laessig, R. H., Hoffman, G. L., J. Pediatr.2002, 141, 524–531.
[24] Schoen, E. J., Baker, J. C., Colby, C. J., To, T. T., Pediatrics2002, 110, 781–786.
[25] Chace, D. H., Kalas, T. A., Naylor, E. W., Clin. Chem. 2003,49, 1797–1817.
[26] Koeberl, D. D., Young, S. P., Gregersen, N. S., Vockley, J.,Smith, W. E., Benjamin, D. K. Jr., An, Y., Weavil, S. D., Cha-ing, S. H., Bali, D., McDonald, M. T., Kishnani, P. S., Chen,Y. T., Millington, D. S., Pediatr. Res. 2003, 54, 219–223.
[27] Carpenter, K. H., Wiley, V., Clin. Chim. Acta 2002, 322, 1–10.
[28] Accinni, R., Campolo, J., Parolini, M., De Maria, R., Caruso,R., Maiorana, A., Galluzzo, C., Bartesaghi, S., Melotti, D.,Parodi, O., J. Chromatogr. B 2003, 785, 219–226.
[29] la Marca, G., Malvagia, S., Donati, M. A., Morrone, A., Pas-quini, E., Zammarchi, E., Rapid Commun. Mass Spectrom.2003, 17, 2688–2692.
[30] Jenkins, M. A., Guerin, M. D., J. Chromatogr. B 1996, 682,23–34.
[31] Foret, F., Krivankova, L., Bocek, P., Capillary Zone Electro-phoresis, VCH Verlagsgesellschaft, Weinheim 1993.
[32] Boulat, O., McLaren, D. G., Arriaga, E. A., Chem, D. D.,J. Chromatogr. B 2001, 754, 217–228.
[33] Martin-Girardeau, A., Renou-Gonnord, M. F., J. Chromatogr.B 2000, 742, 163–171.
[34] Schultz, C. L., Moini, M., Anal. Chem. 2003, 75, 1508–1513.
[35] Heiking, K., Henion, J., J. Chromatogr. B 1999, 735, 171–188.
[36] Garcia, A., Barbas, C., Aguilar, R., Castro, M., Clin. Chem.1998, 44, 1905–1911.
[37] Barbas, C., Garcia, A., de Miguel, L., Simo, C., J. Chroma-togr. B 2002, 780, 73–82.
2004 WILEY-VCH Verlag GmbH & Co. KGaA, Weinheim

1456 P. Senk et al. Electrophoresis 2004, 25, 1447–1456
[38] Garcia, A., Barbas, C., Clin. Chem. Lab. Med. 2003, 41, 755–761.
[39] Prezelj, M., Neubauer, D., Derganc, M., Clin. Chem. Lab.Med. 2000, 38, 623–628.
[40] Elgstoen, K. B., Zhao, J. Y., Anacleto, J. F., Jellum, E., J.Chromatogr. A 2001, 914, 265–275.
[41] Dankova, M., Strasik, S., Kaniansky, D., J. Chromatogr. A2003, 990, 121–132.
[42] Prochazkova, A., Krivánková, L., Bocek, P., J. Chromatogr. A1999, 838, 213–221.
[43] Sevcik, J., Adam, T., Sazel, V., Clin. Chim. Acta 1997, 259,73–81.
[44] Adam, T., Friedecky, D., Fairbanks, L. D., Sevcik, J., Bartak,P., Clin. Chem. 1999, 45, 2086–2093.
[45] Adam, T., Lochman, P., Friedecky, D., J. Chromatogr. B2002, 767, 333–340.
[46] Friedecky, D., Adam, T., Bartak, P., Electrophoresis 2002,23, 565–571.
[47] Sevcik, J., Adam, T., Mazacova, H., Clin. Chim. Acta 1996,245, 85–92.
[48] Lochman, P., Adam, T., Friedecky, D., Hlídková, E., Kop-ková, Z., Electrophoresis 2003, 24, 1200–1207.
[49] Peter-Katalinic, J., Electrophoresis 2004, 25, in press.
2004 WILEY-VCH Verlag GmbH & Co. KGaA, Weinheim