Partial filling multiple injection affinity capillary electrophoresis (PFMIACE) to estimate binding...
11
This article was originally published in a journal published by Elsevier, and the attached copy is provided by Elsevier for the author’s benefit and for the benefit of the author’s institution, for non-commercial research and educational use including without limitation use in instruction at your institution, sending it to specific colleagues that you know, and providing a copy to your institution’s administrator. All other uses, reproduction and distribution, including without limitation commercial reprints, selling or licensing copies or access, or posting on open internet sites, your personal or institution’s website or repository, are prohibited. For exceptions, permission may be sought for such use through Elsevier’s permissions site at: http://www.elsevier.com/locate/permissionusematerial
-
Upload
independent -
Category
Documents
-
view
1 -
download
0
Transcript of Partial filling multiple injection affinity capillary electrophoresis (PFMIACE) to estimate binding...
This article was originally published in a journal published byElsevier, and the attached copy is provided by Elsevier for the
author’s benefit and for the benefit of the author’s institution, fornon-commercial research and educational use including without
limitation use in instruction at your institution, sending it to specificcolleagues that you know, and providing a copy to your institution’s
administrator.
All other uses, reproduction and distribution, including withoutlimitation commercial reprints, selling or licensing copies or access,
or posting on open internet sites, your personal or institution’swebsite or repository, are prohibited. For exceptions, permission
may be sought for such use through Elsevier’s permissions site at:
http://www.elsevier.com/locate/permissionusematerial

Autho
r's
pers
onal
co
py
Talanta 71 (2007) 192–201
Partial filling multiple injection affinity capillary electrophoresis(PFMIACE) to estimate binding constants
of receptors to ligands
Jose Zavaleta a, Dinora B. Chinchilla a, Alejandra Ramirez a, Amaris Pao a, Karla Martinez a,Sanjay Nilapwar b, John E. Ladbury b, Sanku Mallik c, Frank A. Gomez a,∗
a Department of Chemistry and Biochemistry, California State University, Los Angeles, 5151 State University Drive, Los Angeles, CA 90032-8202, USAb Department of Biochemistry and Molecular Biology, University College London, Gower Street, London WC1E 6BT, United Kingdom
c Department of Biochemistry and Molecular Biology, University of Central Florida, 4000 Central Florida Blvd., Orlando, FL 32816, USA
Received 2 March 2006; received in revised form 22 March 2006; accepted 22 March 2006Available online 15 May 2006
Abstract
Partial filling multiple injection affinity capillary electrophoresis (PFMIACE) is used to determine binding constants between vancomycin(Van) from Streptomyces orientalis, teicoplanin (Teic) from Actinoplanes teicomyceticus and ristocetin (Rist) from Nocardia lurida to d-Ala-d-Ala terminus peptides and carbonic anhydrase B (CAB, E.C.4.2.1.1) to arylsulfonamides. Two variations of PFMIACE are described herein.In the first technique, the capillary is partially filled with ligand at increasing concentrations, a non-interacting standard, three or four sepa-rate plugs of receptor each separated by small plugs of buffer, a plug containing a second non-interacting standard, and then electrophoresedin buffer. Upon continued electrophoresis, equilibrium is established between the ligand and receptors causing a shift in the migration timeof the receptors with respect to the non-interacting standards. This change in migration time is utilized for estimating multiple binding con-stants (Kb) for the same interaction. In the second technique, separate plugs of sample containing non-interacting standards, peptide one, buffer,and peptide two, were injected into the capillary column. The capillary is partially filled with a series of buffers containing an antibiotic atincreasing concentrations and electrophoresed. Peptides migrate through the column at similar electrophoretic mobilities since their charge-to-mass ratios are approximately the same but remain as distinct zones due to the buffer plug between peptides. Upon electrophoresis, the plugof antibiotic flows into the peptide plugs affecting a shift in the migration time of the peptides with respect to the non-interacting standardsoccurs due to formation of the of the antibiotic–peptide complex. The shift in the migration time of the peptides upon binding to the antibioticis used for the Scatchard analysis and measurement of a Kb. The PFMIACE technique expands the functionality and potential of ACE as ananalytical tool to examine receptor–ligand interactions. In PFMIACE, a smaller amount of sample is required in the assay compared to bothconventional ACE and MIACE. Furthermore, a wide array of data is obtained from a single experiment, thus, expediting the assay of biologicalspecies.© 2006 Elsevier B.V. All rights reserved.
Keywords: Partial filling multiple-injection affinity capillary electrophoresis; Vancomycin; Teicoplanin; Ristocetin; Carbonic anhydrase B; Binding constants;Scatchard plot
1. Introduction
Interactions between biological species are key to life andplay a direct role in many of the enzyme-based reactions involvedin cell division, cell death, and cell transformations [1]. It fol-
∗ Corresponding author. Tel.: +1 323 343 2368; fax: +1 323 343 6490.E-mail address: [email protected] (F.A. Gomez).
lows then that biological interactions are important in the initia-tion, progression, and harmful effects of human disease includ-ing Parkinson’s, Alzheimer’s, AIDS-HIV, and cancer. With theadvancement of molecular biological tools has come the discov-ery of a huge array of biological interactions focusing foremoston receptor–ligand interactions. Parallel to this developmenthas been the great strides in combinatorial chemical techniquesthat has allowed for the synthesis of many millions of poten-tial drug targets and precursors. In combination, these two areas
0039-9140/$ – see front matter © 2006 Elsevier B.V. All rights reserved.doi:10.1016/j.talanta.2006.03.039
Autho
r's
pers
onal
co
py
J. Zavaleta et al. / Talanta 71 (2007) 192–201 193
of research have made the development of new analytical tech-niques an important area of research.
At present there are several analytical techniques currentlyavailable to measure affinity parameters of noncovalent inter-actions including radioimmunoassays, fluorescence quenching,ammonium sulfate precipitation, and slab gel electrophoresistechniques [1]. These techniques frequently require the sepa-ration and quantitation of free or complexed molecules in anequilibrium mixture. If the amount of bound and free ligand insolution can be distinguished, these techniques can provide rea-sonable estimates of binding constants (Kb) for the interactionin question.
Since the first papers in 1992 [2–6] documenting the useof affinity capillary electrophoresis (ACE) to measure affin-ity parameters between biological species, its use in probing avariety of receptor–ligand interactions has greatly expanded toinclude protein–drug, protein–DNA, peptide–peptide, peptide–carbohydrate, carbohydrate–drug, and antibody–antigen [7–36].For example, Kaddis et al. has used ACE to estimate binding con-stants for the substrate and activator of Rhodobacter sphaeroidesadenosine 5′-diphosphate-glucose pyrophosphorylase [7]. Li etal. used capillary isoelectric focusing (CIEF) and ACE to deter-mine binding constants between antibodies to the prion protein[8]. Finally, Lewis et al. described the screening of antimicro-bial targets using ACE [9]. In a typical form of ACE a sampleof receptor and non-interacting standard(s) is exposed to anincreasing concentration of ligand in the running buffer caus-ing a change in the migration time of the receptor relative to thestandard(s). It is this change in the migration time that is usedin the Scatchard analysis to obtain a value for Kb.
ACE affords a number of advantages over other techniquesto study biological interactions. One, only small quantities ofreceptor and ligand are required. Two, purification of the sampleis not required as long as CE can distinguish the impurities fromthe analyte of interest. Three, radiolabelling of the moleculesis not necessary. Four, automated CE instrumentation is widelyavailable. Five, data is reproducible and expeditiously obtained.Finally, a wide range of molecular interactions can be charac-terized in free solution.
We recently described the use of multiple injection ACE(MIACE) to examine the binding of receptors to ligands [1].In this technique, multiple samples of receptor (or ligand) areinjected into the capillary column and electrophoresed in anincreasing concentration of ligand (or receptor). Multiple bind-ing constants for the same interaction are subsequently obtained,thereby, shortening the ACE experiment. In earlier work wedescribed the use of partial-filling ACE (PFACE) techniques todetermine binding constants between receptors and ligands thatutilizes less material than in standard ACE techniques [15–18].Here, the capillary is partially filled with ligand (or receptor)and sample plug of receptor (or ligand) is introduced into thecapillary and electrophoresed. During electrophoresis the zonesof samples overlap within the capillary where an equilibrium isestablished prior to the point of detection.
When limited quantities of material are available for use instandard ACE due to expense, synthetic difficulty, and/or timeconstraints, there is a need for either alternative assay techniques
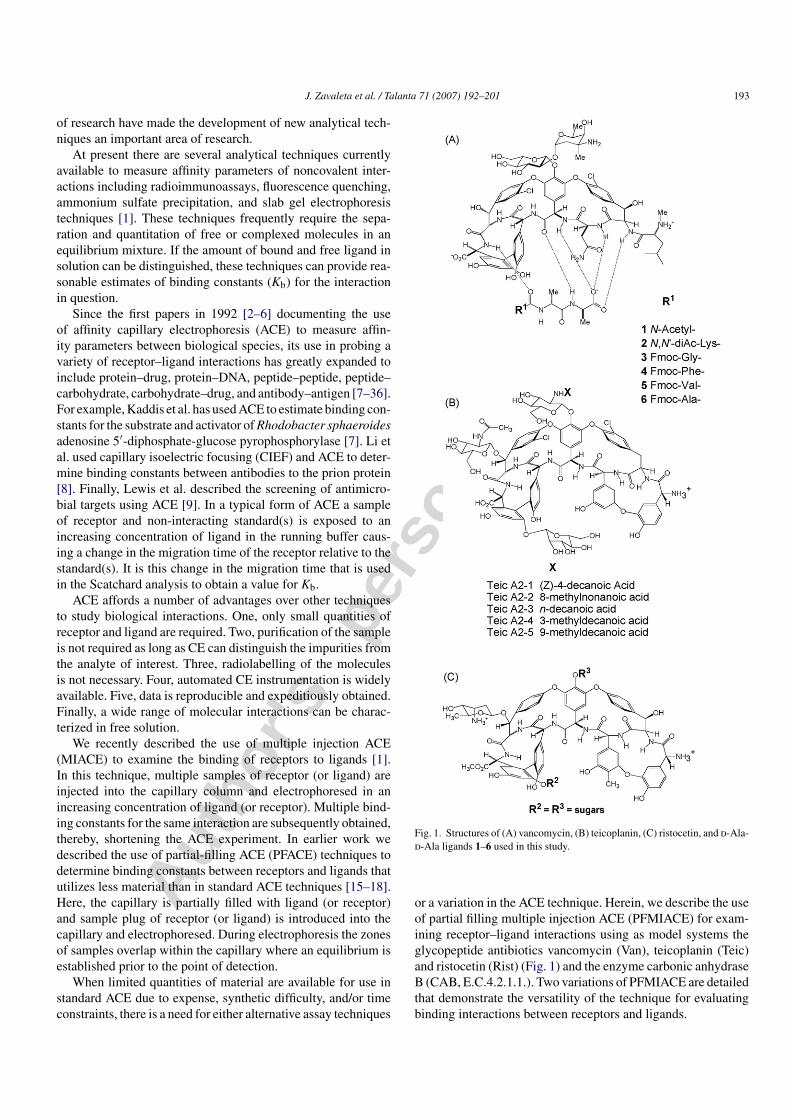
Fig. 1. Structures of (A) vancomycin, (B) teicoplanin, (C) ristocetin, and d-Ala-d-Ala ligands 1–6 used in this study.
or a variation in the ACE technique. Herein, we describe the useof partial filling multiple injection ACE (PFMIACE) for exam-ining receptor–ligand interactions using as model systems theglycopeptide antibiotics vancomycin (Van), teicoplanin (Teic)and ristocetin (Rist) (Fig. 1) and the enzyme carbonic anhydraseB (CAB, E.C.4.2.1.1.). Two variations of PFMIACE are detailedthat demonstrate the versatility of the technique for evaluatingbinding interactions between receptors and ligands.
Autho
r's
pers
onal
co
py
194 J. Zavaleta et al. / Talanta 71 (2007) 192–201
2. Materials and methods
2.1. Chemicals and reagents
All chemicals were analytical grade. Vancomycin, d-Ala-d-Ala, N-acetyl-d-Ala-d-Ala (1), N,N′-diacetyl-Lys-d-Ala-d-Ala(2), carbonic anhydrase B (CAB, E.C.4.2.1.1), horseheartmyoglobin (HHM), nicotinamide adenine dinucleotide (NAD),and nicotinamide adenine dinucleotide, reduced form (NADH)were purchased from Sigma Chemical Company (St. Louis,MO, USA) and were used without further purification.Teicoplanin·HCl was purchased from Advanced SeparationTechnologies Inc. (Whippany, NJ, USA) and was used with-out further purification. Fmoc–Gly–NHS, Fmoc–Ala–NHS,Fmoc–Phe–NHS, and Fmoc–Val–NHS were purchased from
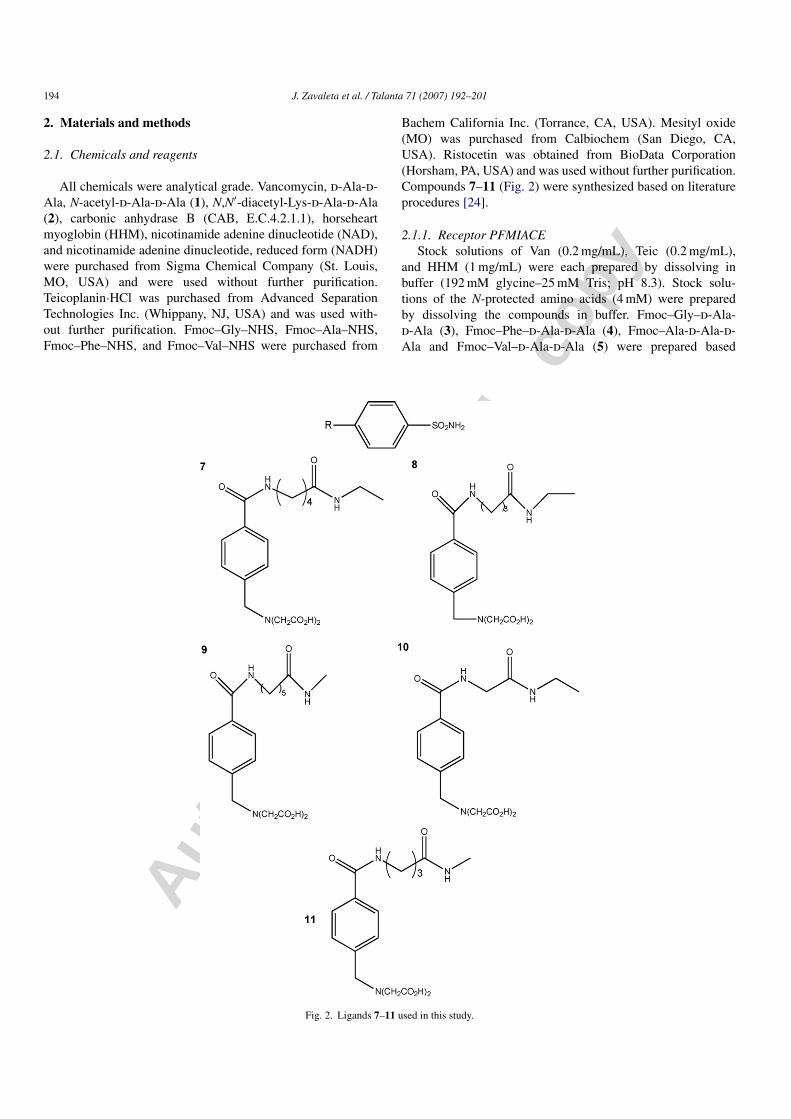
Bachem California Inc. (Torrance, CA, USA). Mesityl oxide(MO) was purchased from Calbiochem (San Diego, CA,USA). Ristocetin was obtained from BioData Corporation(Horsham, PA, USA) and was used without further purification.Compounds 7–11 (Fig. 2) were synthesized based on literatureprocedures [24].
2.1.1. Receptor PFMIACEStock solutions of Van (0.2 mg/mL), Teic (0.2 mg/mL),
and HHM (1 mg/mL) were each prepared by dissolving inbuffer (192 mM glycine–25 mM Tris; pH 8.3). Stock solu-tions of the N-protected amino acids (4 mM) were preparedby dissolving the compounds in buffer. Fmoc–Gly–d-Ala-d-Ala (3), Fmoc–Phe–d-Ala-d-Ala (4), Fmoc–Ala-d-Ala-d-Ala and Fmoc–Val–d-Ala-d-Ala (5) were prepared based
Fig. 2. Ligands 7–11 used in this study.
Autho
r's
pers
onal
co
py
J. Zavaleta et al. / Talanta 71 (2007) 192–201 195
on literature procedures [22]. For CAB, stock solutionsof CAB (1 mg/mL), HHM (2 mg/mL), MO (100/1000 �Lbuffer) were each prepared by dissolving in buffer (192 mMglycine–25 mM Tris; pH 8.3). Stock solutions of ligands 7–11(1 mg/mL) were prepared by dissolving the compounds inbuffer.
2.1.2. Peptide PFMIACEStock solutions of Van (0.2 mg/mL), Teic (1.0 mg/mL), Rist
(1.0 mg/mL), NAD (0.2 mg/mL), and NADH (0.2 mg/mL), wereeach prepared by dissolving in buffer (192 mM glycine–25 mMTris; pH 8.3). Stock solutions of the N-protected aminoacids (4 mM) were prepared by dissolving the compoundsin buffer. Fmoc–Gly–d-Ala-d-Ala (3), Fmoc–Ala-d-Ala-d-Ala(6), Fmoc–Val–d-Ala-d-Ala (5), and Fmoc–Phe–d-Ala-d-Ala(4) were prepared based on literature procedures [22].
2.2. Apparatus
2.2.1. Receptor PFMIACEThe capillary electrophoresis (CE) system used in this study
was a Beckman Model P/ACE 5510 (Fullerton, CA, USA).The capillary tubing (Polymicro Technology, Inc., Phoenix, AZ,USA) used for the experiment was uncoated fused silica withan internal diameter of 50 �m, length from inlet to detector of40.5 cm and a length from detector to outlet of 6.5 cm. Theconditions used in CE were as follows: for Van and Teic, volt-age, 25 kV; current, 6.7 �A for Van, 7.9 �A for Teic; detection,200 nm; temperature, 23.0 ± 0.1 ◦C; for CAB, voltage, 25 kV;current, 8.0 �A; detection, 200 nm; temperature, 23.0 ± 0.1 ◦C.Data were collected and analyzed with Beckman System Goldsoftware.
2.2.2. Peptide PFMIACEThe CE system used in this study was a BeckmanCoulter
MDQ (Fullerton, CA, USA). The capillary tubing (PolymicroTechnology, Inc., Phoenix, AZ, USA) used for the experimentwas uncoated fused silica with an internal diameter of 50 �m,length from inlet to detector of 50.0 cm and a length from detec-tor to outlet of 11 cm. The conditions used in CE were as follows:for Van, Teic, and Rist, voltage, 25 kV; current, 7.8 �A forVan, 7.9 �A for Teic and Rist; detection, 200 nm; temperature,23.0 ± 0.1 ◦C. Data were collected and analyzed with Beckman-Coulter 32 Karat software.
2.3. Procedures
2.3.1. Receptor PFMIACEFor Van, the capillary was first equilibrated with buffer
(192 mM glycine–25 mM Tris; pH 8.3) for 0.5 min. A 0.12 minbuffer plug is then introduced containing a concentration ofpeptide (0–300 �M). Separate plugs of sample solution (5 sinjections each, 6 nL [at 0.5 psi, 1 s injection equals 1.2 nL])containing the marker MO, four plugs of Van, and the secondmarker (HHM) were introduced by pressure injection each sep-arated by a plug of buffer (36 s injection). The electrophoresiswas carried out using Tris–glycine buffer containing no ligand
at 25 kV for 8.0 min to complete the detection of all species. Thesequence was repeated for increasing concentrations of peptide.Experimental conditions for Teic were similar except that threeinjections of Teic were used each separated by a 18 s plug ofbuffer.
2.3.2. Peptide PFMIACEFor analysis of 1 and 2, separate plugs of solution (3.6 nL)
containing the marker (MO), 2, buffer (18.0 nL), and 1 wereintroduced by pressure injection followed by an injection ofantibiotic (96 s at 0.7 psi) and electrophoresed at a concentra-tion of antibiotic (0–60 �M). The electrophoresis was carriedout using Tris–glycine buffer at 25 kV for 7.0 min to com-plete the detection of all species. The sequence was repeatedfor increasing concentrations of antibiotic. For Rist and TeicNADH was used as the non-interacting standard. For CAB, sep-arate plugs of solution of ligand (0.12 min at high pressure),markers (MO and HHM), buffer, CAB, buffer, CAB, buffer,and CAB, were electrophoresed at increasing concentrations ofligand. The electrophoresis was carried out using Tris–glycinebuffer at 25 kV for 8.0 min to complete the detection of allspecies.
2.3.3. Microcalorimetric studiesAll the titration experiments were performed using the VP-
ITC system (MicroCal Inc., MA). In each experiments 20aliquots of 15 �L of 4 (1.30 mM), Fmoc–Val–DADA (1.20 mM)and 4 (1.31 mM) were injected into 1.463 mL of Rist (0.108 mMin 192 mM glycine–25 mM Tris Buffer, pH 8.3) at 25 ◦C. Result-ing data was fitted after subtracting the heats of dilution. Heatsof dilution were determined in separate experiments from addi-tion of 4, 5 and 6 into buffer. Titration data was fitted using anonlinear least-squares curve fitting algorithm with three float-ing variables: stoichiometry, binding constant (Kb = 1/Kd) andchange of enthalpy of interaction (�Ho).
2.4. Forms of analysis
We employed two forms of analysis to estimate Kb. The firstform of analysis (Eq. (1)) used electrophoretic mobilities (μ)as the basis of the analysis; the second (Eq. (2)), termed therelative migration time ratio (RMTR), utilized two markers [14](an extended discussion of these two forms of analysis can befound in this reference). The use of either forms of analysisallowed for the estimation of Kb via a Scatchard plot. We havefound that the use of Eq. (2) best compensates for variations inelectroosmotic flow (EOF) caused by Joule heating and otherchanges in the constitution of the capillary. If minimal changesin EOF exist either equation can be successfully used for ACEanalysis:
�μP,A
[A]= Kb�μmax
P,A − Kb�μP,A (1)
�RMTRP,A
[L]= Kb�RMTRmax
P,A − Kb�RMTRP,A. (2)
Autho
r's
pers
onal
co
py
196 J. Zavaleta et al. / Talanta 71 (2007) 192–201
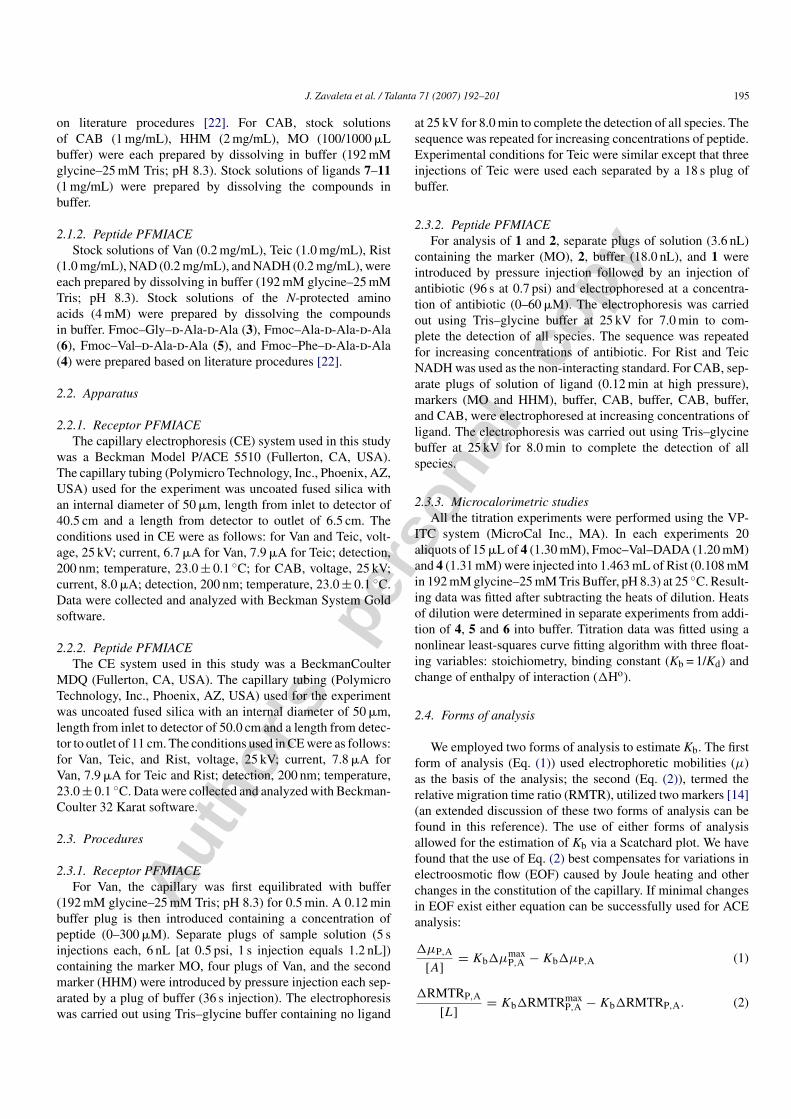
Fig. 3. Schematic of partial-filling multiple injection affinity capillary electrophoresis (PFMIACE) experiments (A) receptor in sample and (B) ligands in sample.
3. Results and discussion
3.1. PFMIACE: receptor as sample
In our first series of experiments we examined the bindingof 3 to Van. Van-group antibiotics kill bacterial cells by inhibit-ing peptidoglycan biosynthesis by binding to the d-Ala d-Alaterminus of the bacterial cell wall precursors [37–42]. Withinthe past two decades there has been an increase in Van resistantenterococci (VRE), thereby, making it increasingly important todevelop new Van-group antibiotics. Using the PFMIACE tech-nique, a buffer plug of 3 was introduced at a given concentrationof ligand (0.5 psi at 7.2 s) followed by a sample plug (0.5 psi at3 s) containing the non-interacting standard MO, ligand plug,and then four plugs (0.5 psi at 3 s) of sample containing Van(Fig. 3). Between each injection of Van was placed a small plug(0.5 psi at 36 s) of buffer to aid in the separation of the Van zonesof solution. Upon application of a voltage the individual plugs ofsample migrate through the capillary and into the zone of 3. Theinjection sequence was then repeated at increasing concentrationof ligand.
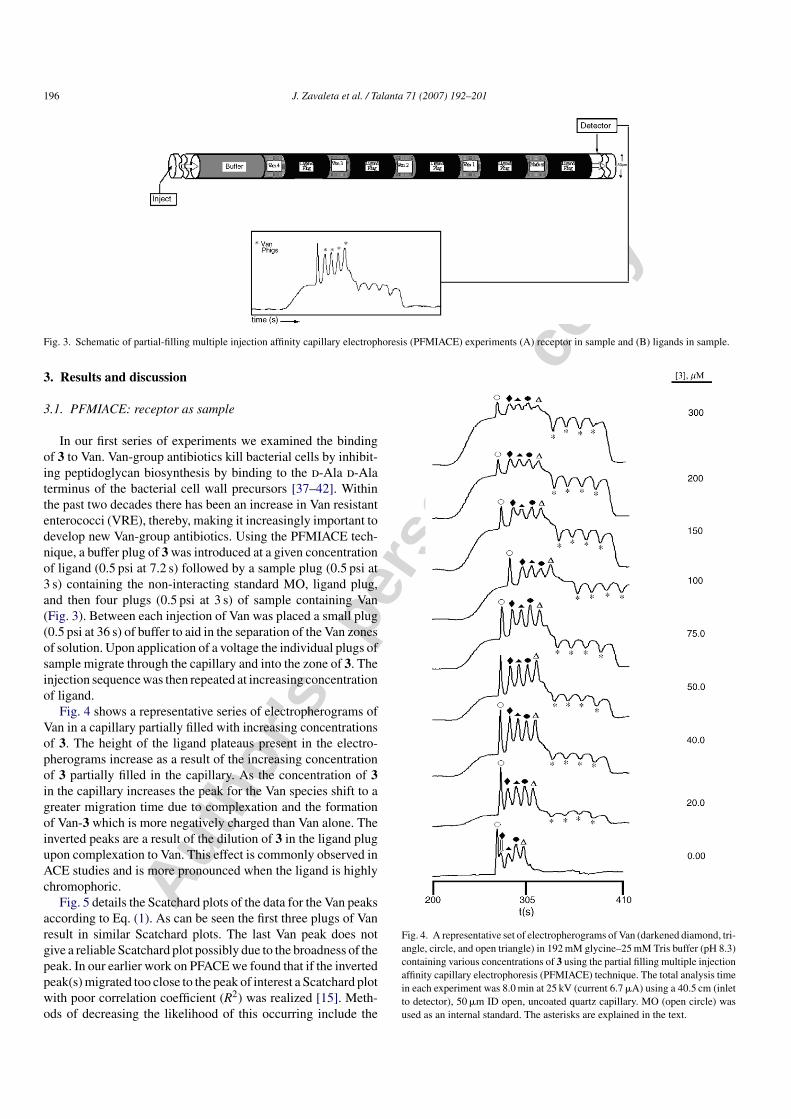
Fig. 4 shows a representative series of electropherograms ofVan in a capillary partially filled with increasing concentrationsof 3. The height of the ligand plateaus present in the electro-pherograms increase as a result of the increasing concentrationof 3 partially filled in the capillary. As the concentration of 3in the capillary increases the peak for the Van species shift to agreater migration time due to complexation and the formationof Van-3 which is more negatively charged than Van alone. Theinverted peaks are a result of the dilution of 3 in the ligand plugupon complexation to Van. This effect is commonly observed inACE studies and is more pronounced when the ligand is highlychromophoric.
Fig. 5 details the Scatchard plots of the data for the Van peaksaccording to Eq. (1). As can be seen the first three plugs of Vanresult in similar Scatchard plots. The last Van peak does notgive a reliable Scatchard plot possibly due to the broadness of thepeak. In our earlier work on PFACE we found that if the invertedpeak(s) migrated too close to the peak of interest a Scatchard plotwith poor correlation coefficient (R2) was realized [15]. Meth-ods of decreasing the likelihood of this occurring include the
Fig. 4. A representative set of electropherograms of Van (darkened diamond, tri-angle, circle, and open triangle) in 192 mM glycine–25 mM Tris buffer (pH 8.3)containing various concentrations of 3 using the partial filling multiple injectionaffinity capillary electrophoresis (PFMIACE) technique. The total analysis timein each experiment was 8.0 min at 25 kV (current 6.7 �A) using a 40.5 cm (inletto detector), 50 �m ID open, uncoated quartz capillary. MO (open circle) wasused as an internal standard. The asterisks are explained in the text.
Autho
r's
pers
onal
co
py
J. Zavaleta et al. / Talanta 71 (2007) 192–201 197
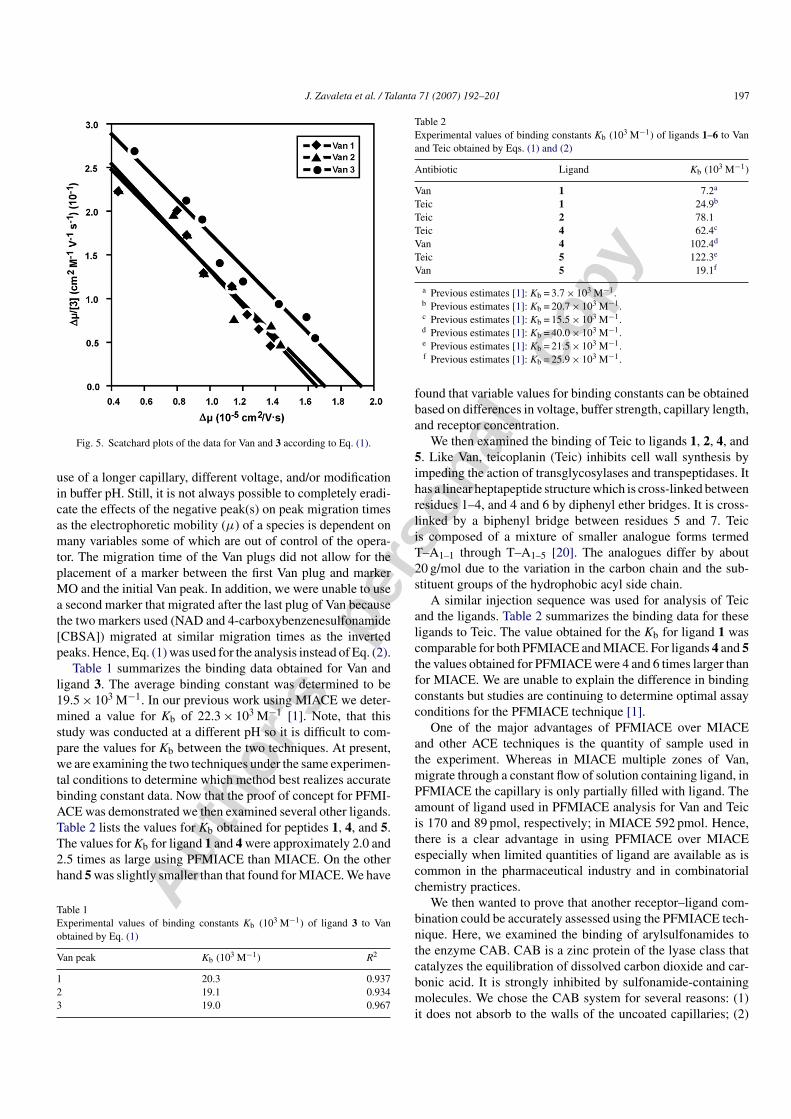
Fig. 5. Scatchard plots of the data for Van and 3 according to Eq. (1).
use of a longer capillary, different voltage, and/or modificationin buffer pH. Still, it is not always possible to completely eradi-cate the effects of the negative peak(s) on peak migration timesas the electrophoretic mobility (μ) of a species is dependent onmany variables some of which are out of control of the opera-tor. The migration time of the Van plugs did not allow for theplacement of a marker between the first Van plug and markerMO and the initial Van peak. In addition, we were unable to usea second marker that migrated after the last plug of Van becausethe two markers used (NAD and 4-carboxybenzenesulfonamide[CBSA]) migrated at similar migration times as the invertedpeaks. Hence, Eq. (1) was used for the analysis instead of Eq. (2).
Table 1 summarizes the binding data obtained for Van andligand 3. The average binding constant was determined to be19.5 × 103 M−1. In our previous work using MIACE we deter-mined a value for Kb of 22.3 × 10³ M−1 [1]. Note, that thisstudy was conducted at a different pH so it is difficult to com-pare the values for Kb between the two techniques. At present,we are examining the two techniques under the same experimen-tal conditions to determine which method best realizes accuratebinding constant data. Now that the proof of concept for PFMI-ACE was demonstrated we then examined several other ligands.Table 2 lists the values for Kb obtained for peptides 1, 4, and 5.The values for Kb for ligand 1 and 4 were approximately 2.0 and2.5 times as large using PFMIACE than MIACE. On the otherhand 5 was slightly smaller than that found for MIACE. We have
Table 1Experimental values of binding constants Kb (103 M−1) of ligand 3 to Vanobtained by Eq. (1)
Van peak Kb (103 M−1) R2
1 20.3 0.9372 19.1 0.9343 19.0 0.967
Table 2Experimental values of binding constants Kb (103 M−1) of ligands 1–6 to Vanand Teic obtained by Eqs. (1) and (2)
Antibiotic Ligand Kb (103 M−1)
Van 1 7.2a
Teic 1 24.9b
Teic 2 78.1Teic 4 62.4c
Van 4 102.4d
Teic 5 122.3e
Van 5 19.1f
a Previous estimates [1]: Kb = 3.7 × 10³ M−1.b Previous estimates [1]: Kb = 20.7 × 10³ M−1.c Previous estimates [1]: Kb = 15.5 × 10³ M−1.d Previous estimates [1]: Kb = 40.0 × 10³ M−1.e Previous estimates [1]: Kb = 21.5 × 10³ M−1.f Previous estimates [1]: Kb = 25.9 × 10³ M−1.
found that variable values for binding constants can be obtainedbased on differences in voltage, buffer strength, capillary length,and receptor concentration.
We then examined the binding of Teic to ligands 1, 2, 4, and5. Like Van, teicoplanin (Teic) inhibits cell wall synthesis byimpeding the action of transglycosylases and transpeptidases. Ithas a linear heptapeptide structure which is cross-linked betweenresidues 1–4, and 4 and 6 by diphenyl ether bridges. It is cross-linked by a biphenyl bridge between residues 5 and 7. Teicis composed of a mixture of smaller analogue forms termedT–A1–1 through T–A1–5 [20]. The analogues differ by about20 g/mol due to the variation in the carbon chain and the sub-stituent groups of the hydrophobic acyl side chain.
A similar injection sequence was used for analysis of Teicand the ligands. Table 2 summarizes the binding data for theseligands to Teic. The value obtained for the Kb for ligand 1 wascomparable for both PFMIACE and MIACE. For ligands 4 and 5the values obtained for PFMIACE were 4 and 6 times larger thanfor MIACE. We are unable to explain the difference in bindingconstants but studies are continuing to determine optimal assayconditions for the PFMIACE technique [1].
One of the major advantages of PFMIACE over MIACEand other ACE techniques is the quantity of sample used inthe experiment. Whereas in MIACE multiple zones of Van,migrate through a constant flow of solution containing ligand, inPFMIACE the capillary is only partially filled with ligand. Theamount of ligand used in PFMIACE analysis for Van and Teicis 170 and 89 pmol, respectively; in MIACE 592 pmol. Hence,there is a clear advantage in using PFMIACE over MIACEespecially when limited quantities of ligand are available as iscommon in the pharmaceutical industry and in combinatorialchemistry practices.
We then wanted to prove that another receptor–ligand com-bination could be accurately assessed using the PFMIACE tech-nique. Here, we examined the binding of arylsulfonamides tothe enzyme CAB. CAB is a zinc protein of the lyase class thatcatalyzes the equilibration of dissolved carbon dioxide and car-bonic acid. It is strongly inhibited by sulfonamide-containingmolecules. We chose the CAB system for several reasons: (1)it does not absorb to the walls of the uncoated capillaries; (2)
Autho
r's
pers
onal
co
py
198 J. Zavaleta et al. / Talanta 71 (2007) 192–201
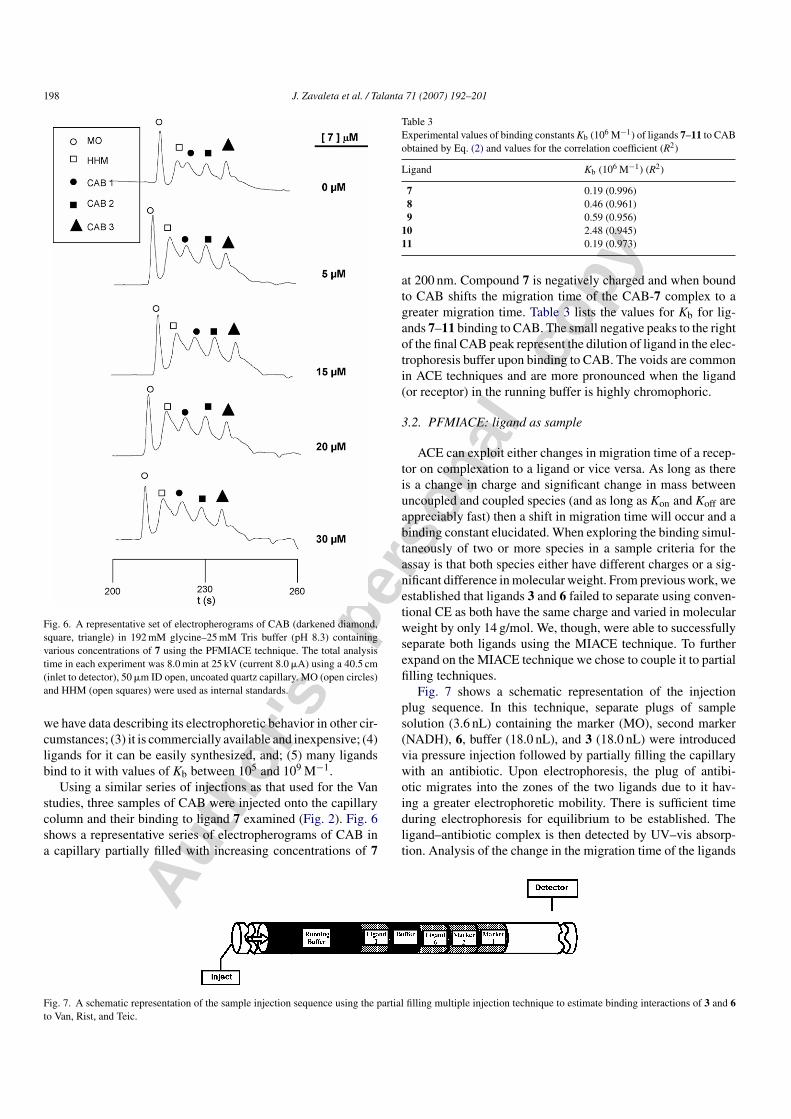
Fig. 6. A representative set of electropherograms of CAB (darkened diamond,square, triangle) in 192 mM glycine–25 mM Tris buffer (pH 8.3) containingvarious concentrations of 7 using the PFMIACE technique. The total analysistime in each experiment was 8.0 min at 25 kV (current 8.0 �A) using a 40.5 cm(inlet to detector), 50 �m ID open, uncoated quartz capillary. MO (open circles)and HHM (open squares) were used as internal standards.
we have data describing its electrophoretic behavior in other cir-cumstances; (3) it is commercially available and inexpensive; (4)ligands for it can be easily synthesized, and; (5) many ligandsbind to it with values of Kb between 105 and 109 M−1.
Using a similar series of injections as that used for the Vanstudies, three samples of CAB were injected onto the capillarycolumn and their binding to ligand 7 examined (Fig. 2). Fig. 6shows a representative series of electropherograms of CAB ina capillary partially filled with increasing concentrations of 7
Table 3Experimental values of binding constants Kb (106 M−1) of ligands 7–11 to CABobtained by Eq. (2) and values for the correlation coefficient (R2)
Ligand Kb (106 M−1) (R2)
7 0.19 (0.996)8 0.46 (0.961)9 0.59 (0.956)
10 2.48 (0.945)11 0.19 (0.973)
at 200 nm. Compound 7 is negatively charged and when boundto CAB shifts the migration time of the CAB-7 complex to agreater migration time. Table 3 lists the values for Kb for lig-ands 7–11 binding to CAB. The small negative peaks to the rightof the final CAB peak represent the dilution of ligand in the elec-trophoresis buffer upon binding to CAB. The voids are commonin ACE techniques and are more pronounced when the ligand(or receptor) in the running buffer is highly chromophoric.
3.2. PFMIACE: ligand as sample
ACE can exploit either changes in migration time of a recep-tor on complexation to a ligand or vice versa. As long as thereis a change in charge and significant change in mass betweenuncoupled and coupled species (and as long as Kon and Koff areappreciably fast) then a shift in migration time will occur and abinding constant elucidated. When exploring the binding simul-taneously of two or more species in a sample criteria for theassay is that both species either have different charges or a sig-nificant difference in molecular weight. From previous work, weestablished that ligands 3 and 6 failed to separate using conven-tional CE as both have the same charge and varied in molecularweight by only 14 g/mol. We, though, were able to successfullyseparate both ligands using the MIACE technique. To furtherexpand on the MIACE technique we chose to couple it to partialfilling techniques.
Fig. 7 shows a schematic representation of the injectionplug sequence. In this technique, separate plugs of samplesolution (3.6 nL) containing the marker (MO), second marker(NADH), 6, buffer (18.0 nL), and 3 (18.0 nL) were introducedvia pressure injection followed by partially filling the capillarywith an antibiotic. Upon electrophoresis, the plug of antibi-otic migrates into the zones of the two ligands due to it hav-ing a greater electrophoretic mobility. There is sufficient timeduring electrophoresis for equilibrium to be established. Theligand–antibiotic complex is then detected by UV–vis absorp-tion. Analysis of the change in the migration time of the ligands
Fig. 7. A schematic representation of the sample injection sequence using the partial filling multiple injection technique to estimate binding interactions of 3 and 6to Van, Rist, and Teic.
Autho
r's
pers
onal
co
py
J. Zavaleta et al. / Talanta 71 (2007) 192–201 199
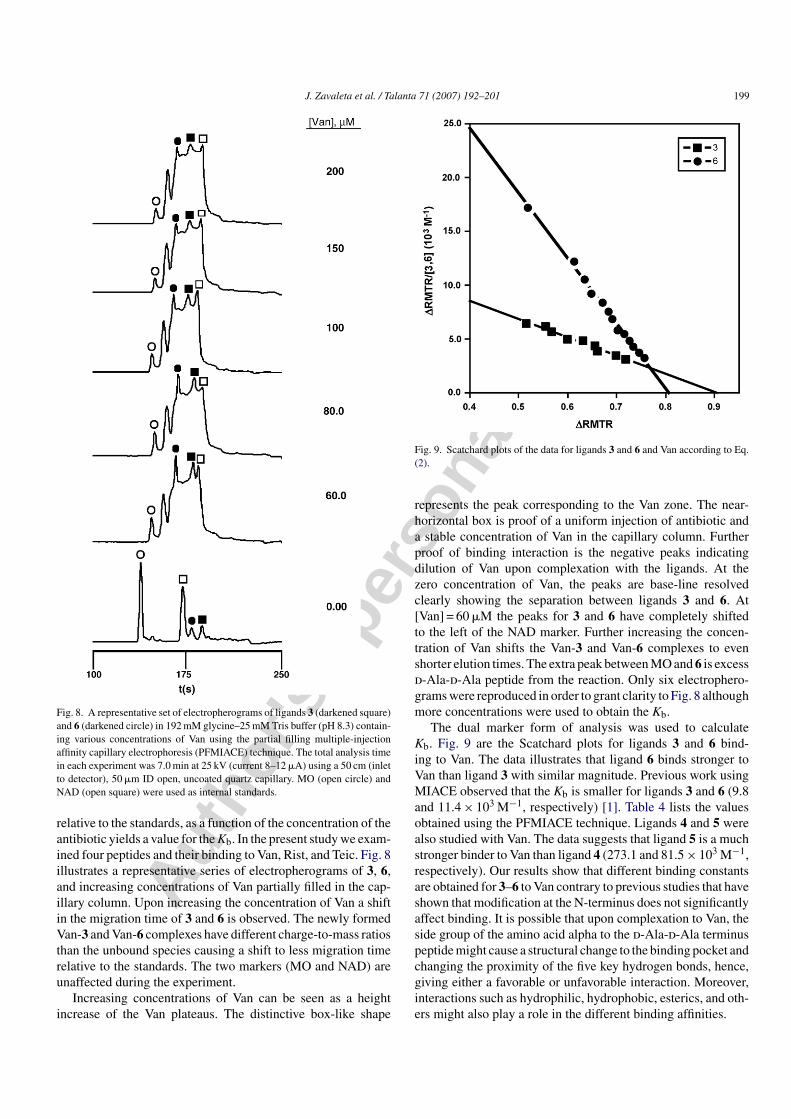
Fig. 8. A representative set of electropherograms of ligands 3 (darkened square)and 6 (darkened circle) in 192 mM glycine–25 mM Tris buffer (pH 8.3) contain-ing various concentrations of Van using the partial filling multiple-injectionaffinity capillary electrophoresis (PFMIACE) technique. The total analysis timein each experiment was 7.0 min at 25 kV (current 8–12 �A) using a 50 cm (inletto detector), 50 �m ID open, uncoated quartz capillary. MO (open circle) andNAD (open square) were used as internal standards.
relative to the standards, as a function of the concentration of theantibiotic yields a value for the Kb. In the present study we exam-ined four peptides and their binding to Van, Rist, and Teic. Fig. 8illustrates a representative series of electropherograms of 3, 6,and increasing concentrations of Van partially filled in the cap-illary column. Upon increasing the concentration of Van a shiftin the migration time of 3 and 6 is observed. The newly formedVan-3 and Van-6 complexes have different charge-to-mass ratiosthan the unbound species causing a shift to less migration timerelative to the standards. The two markers (MO and NAD) areunaffected during the experiment.
Increasing concentrations of Van can be seen as a heightincrease of the Van plateaus. The distinctive box-like shape
Fig. 9. Scatchard plots of the data for ligands 3 and 6 and Van according to Eq.(2).
represents the peak corresponding to the Van zone. The near-horizontal box is proof of a uniform injection of antibiotic anda stable concentration of Van in the capillary column. Furtherproof of binding interaction is the negative peaks indicatingdilution of Van upon complexation with the ligands. At thezero concentration of Van, the peaks are base-line resolvedclearly showing the separation between ligands 3 and 6. At[Van] = 60 �M the peaks for 3 and 6 have completely shiftedto the left of the NAD marker. Further increasing the concen-tration of Van shifts the Van-3 and Van-6 complexes to evenshorter elution times. The extra peak between MO and 6 is excessd-Ala-d-Ala peptide from the reaction. Only six electrophero-grams were reproduced in order to grant clarity to Fig. 8 althoughmore concentrations were used to obtain the Kb.
The dual marker form of analysis was used to calculateKb. Fig. 9 are the Scatchard plots for ligands 3 and 6 bind-ing to Van. The data illustrates that ligand 6 binds stronger toVan than ligand 3 with similar magnitude. Previous work usingMIACE observed that the Kb is smaller for ligands 3 and 6 (9.8and 11.4 × 10³ M−1, respectively) [1]. Table 4 lists the valuesobtained using the PFMIACE technique. Ligands 4 and 5 werealso studied with Van. The data suggests that ligand 5 is a muchstronger binder to Van than ligand 4 (273.1 and 81.5 × 10³ M−1,respectively). Our results show that different binding constantsare obtained for 3–6 to Van contrary to previous studies that haveshown that modification at the N-terminus does not significantlyaffect binding. It is possible that upon complexation to Van, theside group of the amino acid alpha to the d-Ala-d-Ala terminuspeptide might cause a structural change to the binding pocket andchanging the proximity of the five key hydrogen bonds, hence,giving either a favorable or unfavorable interaction. Moreover,interactions such as hydrophilic, hydrophobic, esterics, and oth-ers might also play a role in the different binding affinities.
Autho
r's
pers
onal
co
py
200 J. Zavaleta et al. / Talanta 71 (2007) 192–201
Table 4Experimental values of binding constants Kb (103 M−1) of ligands 3–6 to Van,Rist, and Teic obtained by Eq. (2) and values for the correlation coefficient (R2)
Ligand Kb
Van Rist Teic
3 16.9 (0.977)a 16.6 (0.907)b 68.3 (0.938)c
4 81.5 (0.959) 35.4 (0.972)d 108.8 (0.930)46.9 (ITC)
5 273.1 (0.935) 25.7 (0.920)e 13.5 (0.950)40.0 (ITC)
6 60.5 (0.995)f 16.0 (0.916)g 68.5 (0.887)h
29.3 (ITC)
a Previous estimates [21]: Kb = 41.6 × 10³ M−1 (pH 7.5).b Previous estimates [1,21]: Kb = 41.4 × 10³ M−1 (pH 8.3), Kb = 8.2 ×
103 M−1 (pH 7.5).c Previous estimates [21]: Kb = 21.8 × 10³ M−1 (pH 7.5).d Previous estimates [1]: Kb = 16.4 × 10³ M−1 (pH 8.3).e Previous estimates [1]: Kb = 25.3 × 10³ M−1 (pH 8.3).f Previous estimates [21]: Kb = 174.5 × 10³ M−1 (pH 7.5).g Previous estimates [1,21]: Kb = 9.1 × 10³ M−1 (pH 8.3), Kb = 52.4 ×
103 M−1 (pH 7.5).h Previous estimates [21]: Kb = 185.1 × 10³ M−1 (pH 7.5).
A series of experiments were also conducted with Rist. LikeVan, Rist is a glycopeptide antibiotic which inhibits cell wallpeptidoglycan biosynthesis in susceptible bacteria by bindingto key peptidoglycan intermediates. Table 4 illustrates the dataafforded by the PFMIACE technique.
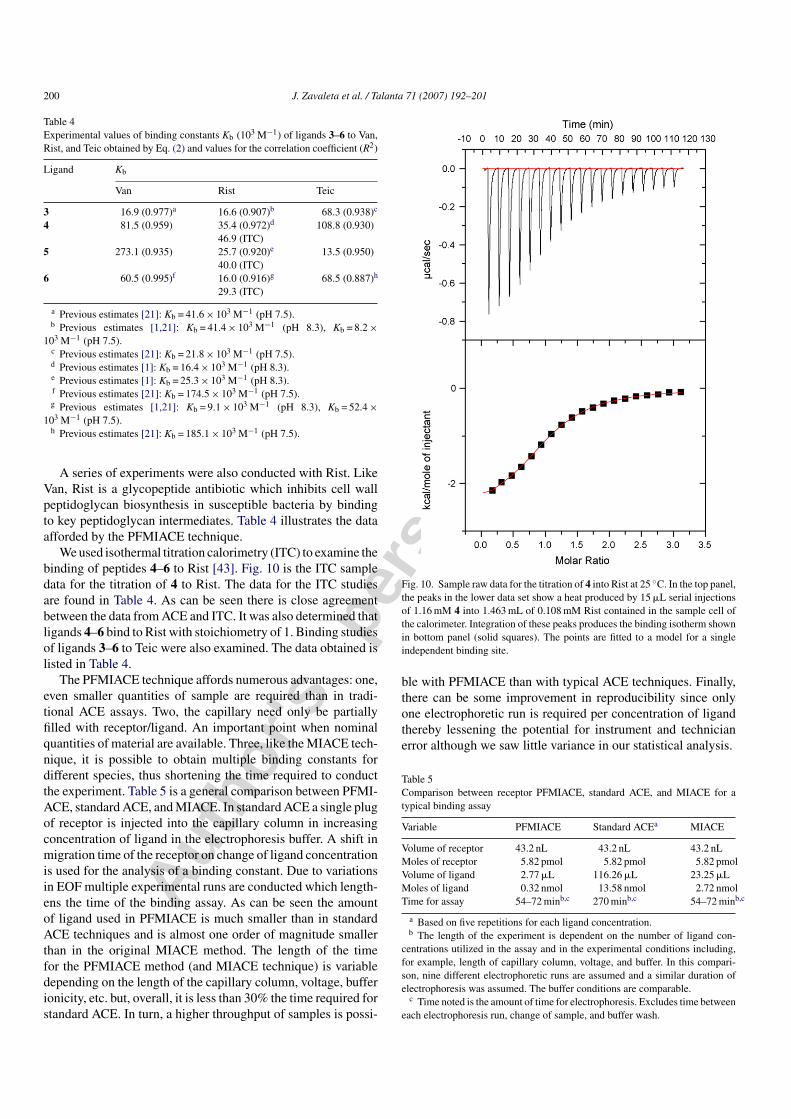
We used isothermal titration calorimetry (ITC) to examine thebinding of peptides 4–6 to Rist [43]. Fig. 10 is the ITC sampledata for the titration of 4 to Rist. The data for the ITC studiesare found in Table 4. As can be seen there is close agreementbetween the data from ACE and ITC. It was also determined thatligands 4–6 bind to Rist with stoichiometry of 1. Binding studiesof ligands 3–6 to Teic were also examined. The data obtained islisted in Table 4.
The PFMIACE technique affords numerous advantages: one,even smaller quantities of sample are required than in tradi-tional ACE assays. Two, the capillary need only be partiallyfilled with receptor/ligand. An important point when nominalquantities of material are available. Three, like the MIACE tech-nique, it is possible to obtain multiple binding constants fordifferent species, thus shortening the time required to conductthe experiment. Table 5 is a general comparison between PFMI-ACE, standard ACE, and MIACE. In standard ACE a single plugof receptor is injected into the capillary column in increasingconcentration of ligand in the electrophoresis buffer. A shift inmigration time of the receptor on change of ligand concentrationis used for the analysis of a binding constant. Due to variationsin EOF multiple experimental runs are conducted which length-ens the time of the binding assay. As can be seen the amountof ligand used in PFMIACE is much smaller than in standardACE techniques and is almost one order of magnitude smallerthan in the original MIACE method. The length of the timefor the PFMIACE method (and MIACE technique) is variabledepending on the length of the capillary column, voltage, bufferionicity, etc. but, overall, it is less than 30% the time required forstandard ACE. In turn, a higher throughput of samples is possi-
Fig. 10. Sample raw data for the titration of 4 into Rist at 25 ◦C. In the top panel,the peaks in the lower data set show a heat produced by 15 �L serial injectionsof 1.16 mM 4 into 1.463 mL of 0.108 mM Rist contained in the sample cell ofthe calorimeter. Integration of these peaks produces the binding isotherm shownin bottom panel (solid squares). The points are fitted to a model for a singleindependent binding site.
ble with PFMIACE than with typical ACE techniques. Finally,there can be some improvement in reproducibility since onlyone electrophoretic run is required per concentration of ligandthereby lessening the potential for instrument and technicianerror although we saw little variance in our statistical analysis.
Table 5Comparison between receptor PFMIACE, standard ACE, and MIACE for atypical binding assay
Variable PFMIACE Standard ACEa MIACE
Volume of receptor 43.2 nL 43.2 nL 43.2 nLMoles of receptor 5.82 pmol 5.82 pmol 5.82 pmolVolume of ligand 2.77 �L 116.26 �L 23.25 �LMoles of ligand 0.32 nmol 13.58 nmol 2.72 nmolTime for assay 54–72 minb,c 270 minb,c 54–72 minb,c
a Based on five repetitions for each ligand concentration.b The length of the experiment is dependent on the number of ligand con-
centrations utilized in the assay and in the experimental conditions including,for example, length of capillary column, voltage, and buffer. In this compari-son, nine different electrophoretic runs are assumed and a similar duration ofelectrophoresis was assumed. The buffer conditions are comparable.
c Time noted is the amount of time for electrophoresis. Excludes time betweeneach electrophoresis run, change of sample, and buffer wash.
Autho
r's
pers
onal
co
py
J. Zavaleta et al. / Talanta 71 (2007) 192–201 201
4. Conclusion
We have demonstrated the development of partial filling mul-tiple injection ACE (PFMIACE) using as model systems theglycopeptide antibiotics vancomycin, teicoplanin and ristocetinand carbonic anhydrase B. In PFMIACE, partial filling andmultiple injection techniques are coupled to each other. Twotechniques are described. In the first, multiple plugs of receptorare injected into the capillary column which migrate with equalelectrophoretic mobility into a zone of ligand where a dynamicequilibrium is established prior to detection. Multiple bindingconstants are subsequently determined for the same biologicalinteraction which are similar in agreement to those obtained viaother ACE techniques. In the second, separate plugs of samplecontaining non-interacting standards, peptides, and buffer areinjected into the capillary column and electrophoresed. Peptidesmigrate through the column at similar electrophoretic mobilitiessince their charge-to-mass ratios are approximately the same butremain as distinct zones due to the buffer plugs between pep-tides. The electrophoresis is then carried out in an increasingconcentration of antibiotic in the running buffer. The shift inthe migration time of the peptides upon binding to the antibi-otic is used for the Scatchard analysis and measurement ofa Kb.
PFMIACE offers a number of advantages over other ACEtechniques. Specifically, a typical binding assay utilizes lessreceptor and ligand than that used in other ACE methods. Addi-tionally, since only electrophoretic run needs to be conductedper concentration of ligand thereby yielding multiple bindingconstants for the same interaction concurrently, the techniqueis faster than other ACE techniques. Finally, a single elec-trophoretic can lessen the propensity of instrument error and/orvariability in peak migration times that can lead to a poor analysisof the data although we did not see any marked improvement inreproducibility when comparing PFMIACE and standard ACE.Future work is focused on expanding the technique to other sys-tems and in further modifying the technique for use with evensmaller sample volumes.
Acknowledgment
The authors gratefully acknowledge financial support for thisresearch by grants from the National Science Foundation (CHE-0136724, CHE-0515363 and DMR-0351848), and the NationalInstitutes of Health (1R15 AI055515-01, 1R15AI65468-01, andGM54939).
References
[1] D. Chinchilla, J. Zavaleta, K.M. Martinez, F.A. Gomez, Anal. Bioanal.Chem. 383 (2005) 625.
[2] J.C. Kraak, S. Busch, H. Poppe, J. Chromatogr. 608 (1992) 257.[3] Y.-H. Chu, G.M. Whitesides, J. Org. Chem. 57 (1992) 3524.[4] Y.-H. Chu, L.Z. Avila, H.A. Biebuyck, G.M. Whitesides, J. Med. Chem.
35 (1992) 2915.[5] N.H.H. Heegaard, F.A. Robey, Anal. Chem. 64 (1992) 2479.[6] Y. Baba, M. Tsuhako, M. Sawa, M. Akashi, E. Yashima, Anal. Chem. 64
(1992) 1920.
[7] J. Kaddis, C. Zurita, J. Moran, M. Borra, N. Polder, C.R. Meyer, F.A.Gomez, Anal. Biochem. 327 (2004) 252.
[8] G. Li, X. Zhou, Y. Wang, A. El-Shafey, N.H. Chiu, I.S. Krull, J. Chromatogr.A 1053 (2004) 253.
[9] L.M. Lewis, L.J. Engle, W.E. Pierceall, D.E. Hughes, K.J. Shaw, J. Biomol.Screen. 9 (2004) 303.
[10] F. Progent, M. Taverna, I. Le Potier, F. Gopee, D. Ferrier, Electrophoresis23 (2002) 938.
[11] A. Varenne, P. Gareil, S. Colliec-Jouault, R. Daniel, Anal. Biochem. 315(2003) 152.
[12] C.F. Silverio, M. Azad, F.A. Gomez, Electrophoresis 24 (2003) 808.[13] M. Azad, L. Hernandez, A. Plazas, M. Rudolph, F.A. Gomez, Chro-
matographia 57 (2003) 339.[14] E. Mito, Y. Zhang, S. Esquivel, F.A. Gomez, Anal. Biochem. 280 (2000)
209.[15] J. Heintz, M. Hernandez, F.A. Gomez, J. Chromatogr. A 840 (1999)
261.[16] M. Azad, C. Silverio, Y. Zhang, V. Villareal, F.A. Gomez, J. Chromatogr.
A 1027 (2004) 193.[17] C. Schou, N.H.H. Heegaard, Electrophoresis 27 (2006) 44.[18] M. Cirri, F. Maestrelli, S. Orlandini, S. Furlanetto, S. Pinzauti, P. Mura, J.
Pharm. Biomed. Anal. 37 (2005) 995.[19] V. Villareal, A. Brown, A. Gomez, C. Silverio, F.A. Gomez, Chro-
matographia 60 (2004) 73.[20] M. Azad, A. Brown, I. Silva, F.A. Gomez, Anal. Bioanal. Chem. 379 (2004)
149.[21] M.A. Azad, J. Kaddis, V. Villareal, L. Hernandez, C. Silverio, F.A.
Gomez, M. Strege, A.L. Lagu (Eds.), Capillary Electrophoresis ofProteins and Peptides, Humana Press, Totowa, NJ, 2004, pp. 153–168.
[22] A.R. Stettler, M.A. Schwarz, J. Chromatogr. A 1063 (2005) 217.[23] K. Sato, A. Inoue, K. Hosokawa, M. Maeda, Electrophoresis 26 (2005)
3076.[24] A. Brown, R. Desharnais, B.C. Roy, S. Malik, F.A. Gomez, Anal. Chim.
Acta 540 (2005) 403.[25] X.-H. Qian, K.B. Tomer, Electrophoresis 19 (1998) 415.[26] J.J. Colton, J.D. Carbeck, J. Rao, G.M. Whitesides, Electrophoresis 19
(1998) 367.[27] K.L. Rundlett, D.W. Armstrong, Electrophoresis 18 (1997) 2194.[28] H. Meisel, C. Olieran, Anal. Chim. Acta 372 (1998) 291.[29] J.K. Abler, K.R. Reddy, C.S. Lee, J. Chromatogr. A 759 (1997) 139.[30] A. Taga, Y. Yamamoto, R. Maruyama, S. Honda, Electrophoresis 25 (2004)
876.[31] S. Kiessig, H. Bang, F. Thunecke, J. Chromatogr. A 853 (1999) 469.[32] C. Karakasyan, M. Taverna, M.-C. Millot, J. Chromatogr. A 1032 (2004)
159.[33] M. Castagnola, D.V. Rossetti, R. Inzitari, A. Lupi, C. Zuppi, T. Cabras, M.B.
Fadda, G. Onnis, R. Petruzzelli, B. Giardina, I. Messana, Electrophoresis25 (2004) 846.
[34] D.D. Buchanan, E.E. Jameson, J. Perlette, A. Malik, R.T. Kennedy, Elec-trophoresis 24 (2004) 1375.
[35] J. Liu, K.J. Volk, M.S. Lee, M. Pucci, S. Handwerger, Anal. Chem. 66(1994) 2412.
[36] Y.-H. Chu, Y.M. Dunayevskiy, D.P. Kirby, P. Vouros, B.L. Karger, J. Am.Chem Soc. 118 (1996) 7827.
[37] A.J.R. Heck, P.J. Bonnici, E. Breukink, D. Morris, M. Wills, Chem. Eur. J.7 (2001) 910.
[38] J.H. Griffin, M.S. Linsell, M.B. Nodwell, Q. Chen, J.L. Pace, K.L. Quast,K.M. Krause, L. Farrington, T.X. Wu, D.L. Higgins, T.E. Jenkins, B.G.Chirstensen, J.K. Judice, J. Am. Chem. Soc. 125 (2003) 6517.
[39] N.E. Allen, D.L. LeTourneau, J.N. Hobbs Jr., Antimicrobial. AgentsChemother. 41 (1997) 66.
[40] G. Chiosis, I.G. Boneca, Science 293 (2001) 1484.[41] H. Arimoto, K. Nishimura, T. Kinumi, I. Hayakawa, D. Uemura, Chem.
Commun. (1999) 1361.[42] R. Kerns, S.D. Dong, S. Fukuzawa, J. Carbeck, J. Kohler, L. Silver, D.
Kahne, J. Am. Chem. Soc. 122 (2000) 12608.[43] J.E. Ladbury, B.Z. Chowdhry, Chem. Biol. 3 (1996) 791.