Hanson Chapter 8. Electrochemical Detection in Capillary Electrophoresis
31
Hanson, Pappas, Holland, West Virginia University Page 1 of 31 Chapter 8. Electrochemical Detection in Capillary Electrophoresis Kim M. Hanson, Theron J. Pappas, Lisa A. Holland* C. Eugene Bennett Department of Chemistry, West Virginia University, Morgantown, WV 26506 *[email protected], 304.293.3060 x6214 (phone) 304.293.4904 (fax)
Transcript of Hanson Chapter 8. Electrochemical Detection in Capillary Electrophoresis

Hanson, Pappas, Holland, West Virginia University Page 1 of 31
Chapter 8. Electrochemical Detection in Capillary
Electrophoresis
Kim M. Hanson, Theron J. Pappas, Lisa A. Holland*
C. Eugene Bennett Department of Chemistry, West Virginia University, Morgantown, WV
26506
*[email protected], 304.293.3060 x6214 (phone) 304.293.4904 (fax)

Hanson, Pappas, Holland, West Virginia University Page 2 of 31
8.1 Introduction
Shortly after literature reports of successful CE separations with on-column LIF detection
accomplished in 75 and 80 micron inner diameter glass tubes [1-3], CE was coupled with
electrochemical detection (EC) [4,5]. Wallingford and Ewing, were the first to report the
efficient coupling of a bare fracture decoupler and off-column amperometric detection [4].
These innovations, now in frequent use, were key to the routine implementation of CE-EC.
The separation efficiency, speed of analysis, and low sampling requirements of CE are
attributes compatible with the wide range of selectivity of EC methods and excellent limits of
detection. Microelectrodes are frequently coupled to CE systems primarily due to the size
compatibility. The ability to reduce electrode dimensions without impairing the signal-to-
noise ratio facilitates this coupling. Microelectrodes can be used in resistive solvents, have
faster time constants, and are not severely effected by uncompensated resistance. Thus, they
provide a means of using two (as opposed to three) electrodes in the EC cell, are better suited
for fast voltammetric scanning, and are compatible with non-aqueous CE. Since the report by
Wallingford and Ewing [4], the many advantages of coupling CE and EC have led to wide
variety of applications and a large volume of original research publications. A number of
reviews on this subject are found in the literature [6-21].
This chapter will cover fundamentals of electrochemistry that are important to capillary
electrophoresis. These include modes of operation, electrode materials, electrode geometry,
CE geometry, and coupling issues. The content in this chapter is limited to free zone
capillary electrophoresis, electrokinetic capillary chromatography, gel electrophoresis, and
affinity electrophoresis in conventional fused silica capillaries. A comprehensive table of
research publications from 2002 through mid-2004 organized by analyte class is included.
Typical CE-EC applications are described in order to emphasize advantages and

Hanson, Pappas, Holland, West Virginia University Page 3 of 31
considerations necessary for successful implementation of the methodology. Topics
excluded from this chapter are capillary electrochromatography coupled with EC, and CE
coupled with electrochemiluminescence. The great increase in chip-based CE warrants a
focused discussion of attributes unique to these systems in Chapter 14 of this book.
8.2 Modes of Electrochemical Detection
Electrochemistry is a well established analytical field that focuses on the effects of shuttling
electrons, ion mobility, and membrane potentials. Modes of operation included in this
discussion are voltammetry at fixed (amperometry) or scanned potential, conductivity, and
potentiometry. Each mode has separate criteria for optimal operation, and often there are
different material, geometry, solvent, statistical parameter, and coupling constraints. By far
amperometry is the most implemented method of EC detection due to its excellent limits of
detection. However, other EC modes have various advantages, which will be described in
this chapter.
8.2.1 Amperometry is the monitoring of a gain (reduction) or loss (oxidation) of electrons in
the presence of fixed potential, by measuring changes in current. It is highly quantitative,
provides excellent limits of detection (see Table 1), good linear range, and reproducibility
under well controlled conditions. Direct amperometric detection is selective for analyte that
can undergo oxidation or reduction within the potential window of the electrode, in other
words, natively electroactive compounds. The selectivity of this method is tunable, since the
applied potential can be changed to discriminate against analyte.
The applicability of amperometry is further increased by employing indirect detection and
through derivatization with an electroactive moiety. Derivatization performed pre-separation

Hanson, Pappas, Holland, West Virginia University Page 4 of 31
requires additional sample handling which necessitates larger working sample volumes, and
often makes the analytical method more laborious. On-column and post-column
derivatization circumvent these drawbacks, but are more sophisticated in design. Examples
of analyte modification resulting in the formation of electroactive products include copper
complexation using biuret chemistry [22-24] and derivatization with naphthalene-2,3-
dicarboxaldehyde (NDA) [25-31] or p-nitrophenol-2,5-dihydroxyphenylacetate bis-
tetrahydropyranyl ether (NDTE) [32]. Amperometric reaction detection is another approach
to increasing applicability of EC detection [33]. In this mode, an electroactive reagent is
generated that has the ability to react with analyte. Depletion of the reagent is detected using
amperometry and the amount of depleted reagent is indicative of analyte concentration.
The geometry of amperometric detectors is reasonably straightforward and categorized
according to the position of the electrode as well as the presence of current decoupling.
Typically amperometric detection is accomplished with a single working electrode.
Electrode configurations are labeled as off-column if they incorporate a physical decoupler
(see Fig. 1). End-column geometries lack a means of decoupling the separation and detection
currents (see Fig. 2). In addition to these single electrode configurations, there are dual
electrode configurations in series or parallel, as well as band electrodes. Dual electrodes have
been used in series for reversible redox reactions and amperometric reaction detection [33-
37]. Parallel configurations for dual electrodes can provide improved qualitative information
or selectivity [38-40]. Dual, multiple band, or multiple ring electrodes have also been
utilized for redox cycling [38,41-44]. The most widely reported electrode material is carbon,
although gold, platinum, copper, and other materials have been used.

Hanson, Pappas, Holland, West Virginia University Page 5 of 31
8.2.2 Voltammetry, at scanned potential in CE-EC has employed square [45], cyclic [26,46],
staircase [47,48], and sinusoidal [49-51] waveforms. Multi-step waveforms that facilitate
detection at a constant applied potential, cleaning and surface activation have also been used
in a pulsed electrochemical mode [52-60]. Voltammetry provides additional qualitative
information about the nature of the detected analyte based on the applied potential necessary
for current production. Thus, voltammetry provides additional selectivity and has been
harnessed to detect co-migrating analytes with different electrochemical characteristics
[46,47]. Electrode geometry is similar to amperometric detection and generally as
straightforward. The detection limits of CE-voltammetry methods can be an issue because
scanning the applied voltage produces significant contributions from non-Faradic current.
Reports of CE-voltammetric detection are limited. Neurotransmitters [45,47], phenolic
compounds [26,48], and metal ions [46] have been determined without derivatization by CE-
voltammetry. Sinusoidal voltammetry in conjunction with redox labels has been applied to
oligonucleotide detection for analysis of DNA mutations [50,51] and shows potential for
“low resolution” sequencing [49]. In one report adsorption-based processes resulting from
modified Osteryoung square-wave voltammetry coupled to CE enabled the detection of
amino acids, antibiotics, and other drugs [61].
8.2.3 Conductivity is a function of ion mobility, charge, and concentration in the presence of
a potential field. Conductimetric detection does not possess the high selectivity of
amperometry or voltammetry. In CE-conductivity responses are measured based on
differences between the conductivity of the background and analyte. The analyte peak is
detectable if it has a significantly higher (or lower) conductivity than the background
electrolyte (BGE) solution. However, CE methods development incorporates a means of
minimizing differences between sample and BGE mobility to prevent peak asymmetry.

Hanson, Pappas, Holland, West Virginia University Page 6 of 31
Thus, a factor critical in CE-conductivity is the selection of a BGE that balances detection
and separation parameters. Early conductivity detectors incorporated dual in-capillary or off-
capillary electrodes, and suffered from poor limit of detection or electrode geometries that
were difficult to fabricate and maintain.
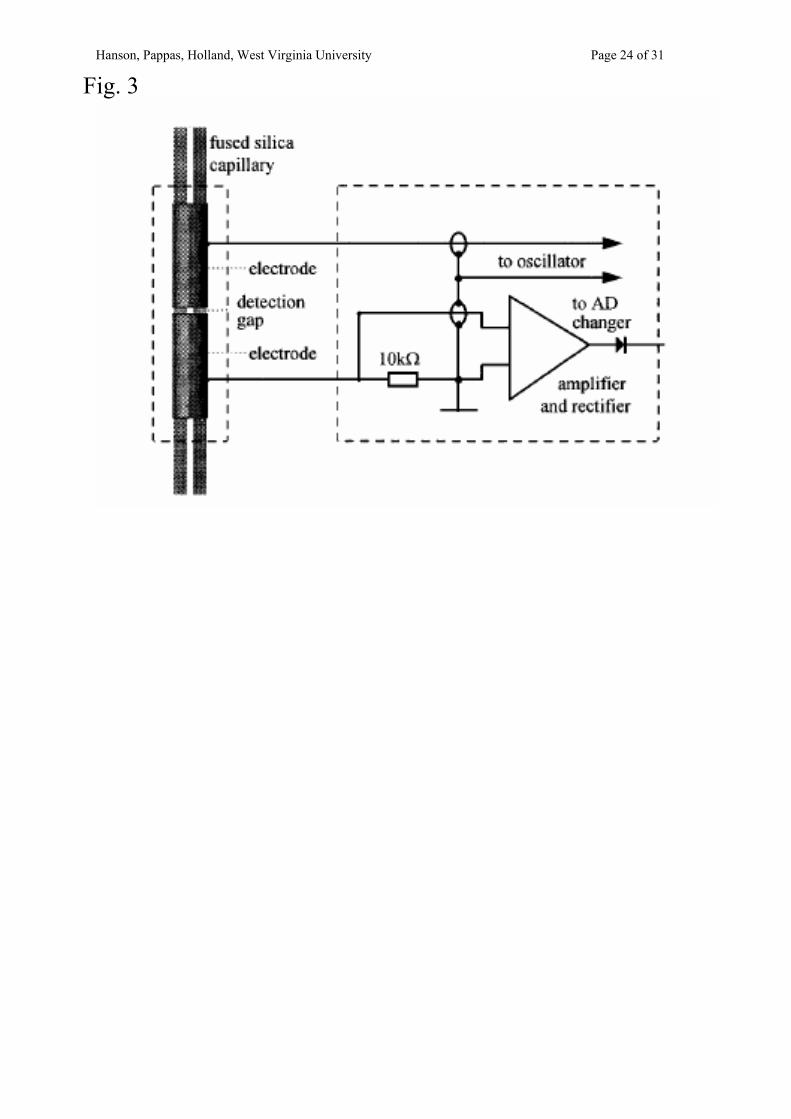
In 1998 the field of CE-conductivity reached a great milestone as two separate research
groups reported the development of capacitively-coupled contactless conductivity detection
(CCD) [62,63]. CCD is based on the transmission and reading of a frequency, which
responds to changes in resistance between two electrodes acting as capacitors. The electrodes
are located on the outside of the capillary, which allows for easier fabrication and eliminates
electrode fouling. Much groundwork has been laid in optimization of the design, separation,
and detection parameters. Typical electrode arrangements are a few mm in length and are
separated by gaps of 1-2 mm (see Fig. 3). The electrode material is not pertinent, but it is key
that the inner diameter of the electrode is well-matched in size to the outer diameter of the
separation capillary. Decoupling is not necessary for this mode. Historically, CE-
conductivity has been used for inorganic ion detection (see Table 1); but with the recent
improvements in performance, design, and BGE selection, conductivity detectors are being
used to detect a wider range of biomolecules: proteins, peptides, amino acids, sugars, and
long chain fatty acids [64-70].
8.2.4 Potentiometric detection is based on the measurement of a membrane potential
induced by a difference in concentration (activity) of a particular analyte. Fundamental to
potentiometry, the response is logarithmic. The limits of detection of potentiometric
methods are typically worse than those obtained using electrolytic methods and in some
cases, the electrodes may not be as durable or easily fabricated. The application has waned

Hanson, Pappas, Holland, West Virginia University Page 7 of 31
since the first report in 1991 [71]. This may be attributable to the lack of commercially
available instrumentation, the recent innovation of CE-conductivity, or the mismatch between
a separation technique with a high peak capacity and detector with an extraordinarily high
selectivity. Nonetheless, a number of applications have been reported [72-84].
Potentiometric electrodes consist of miniaturized glass encased membrane electrodes [71-
74,85], and polymer coated wire microelectrodes [75-84].
8.3 Decoupling the separation current, which can be as high as one 100 microamperes, from
the detection current (nano to picoamperes) is a concern in electrolytic detection. This has
been addressed with physical decoupling, which provides a ground path prior to the detector
cell. The physical decoupler reported by Wallingford and Ewing (Fig. 1) was fabricated by
scoring and fracturing the fused silica capillary near the cathodic reservoir [4]. The fractured
pieces were rejoined inside a porous glass capillary, and this ensemble was affixed to a
microscope slide. Electroosmotic and electrophoretic mobility governed the transport of
analyte to the fracture. Beyond this joint, residual flow from electroosmosis in the separation
capillary carried analyte to the off-column carbon fiber electrode. In this report, the
researchers characterized the effect on separation efficiency for distances of 2-13.5 cm past
the fracture joint. Using an intermediate length from the fracture to electrode (5.7 cm) they
obtained separation efficiencies as high as 180,000 theoretical plates.
Physical decouplers may be placed as far as a few centimeters from the end of the capillary.
Typically, the cathodic reservoir is grounded, and placed at the decoupler. Analyte transport
beyond the decoupler is governed by residual flow generated by electroosmosis and this
transport to the electrode must occur in a reasonable time to prevent degradation of the
resolution and efficiency generated in the separation. This is generally achieved by

Hanson, Pappas, Holland, West Virginia University Page 8 of 31
maintaining a short distance from the fracture to the electrode by judicious selection of the
capillary dimensions. There have been many variations since the first report by Wallingford
and Ewing of a porous glass decoupler [4]. For example, physical decouplers have been
formed from bare fractures [86], etched joints [87], or laser drilled decouplers [88].
Additionally, they may be enhanced with polymeric coatings such as nafion [26] or cellulose
[88] to maintain current flow to ground while suppressing the flow of liquid through the gap.
Palladium decouplers, first reported in 1993, offer an additional means of grounding the
separation current prior to detection [89]. No physical decoupling (bare fracture, etched
porous capillary, etc.) is incorporated in this approach. The current is simply grounded
through a palladium joint in contact with the separation capillary. Application of potential to
the CE cathode by direct contact at a joint would normally generate hydrogen gas, which
disrupts analyte transport or perturbs the detection electrode downstream from the decoupler.
Palladium decouplers absorb hydrogen and thus serve as a palatable mechanism for isolating
separation and detection current.
End-column detection, when implemented appropriately, does not require current decoupling
[90]. Placing the detection electrode a short distance (less than a few hundred microns) from
the end of the capillary allows the separation current to travel to ground without significantly
hindering the electrode function. Analyte is transported from the capillary orifice to the
electrode surface by a combination of residual flow and diffusion. The approach works best
when the separation current is kept low. This may be achieved with appropriate selection of
the background electrolyte, application of lower separation voltages, and/or maintaining a
small inner diameter of the separation capillary. End-column detection has also been
facilitated by making the detection end of the capillary porous through etching [91] or

Hanson, Pappas, Holland, West Virginia University Page 9 of 31
through the use of a cast nafion extension [92]. Furthermore, the detection end of the
capillary orifice has been physically enlarged through chemical etching, enabling placement
of the detection electrode in contact with the capillary without significant interference from
the separation current [93]. An additional benefit to this approach is the ease of alignment of
the detection electrode with the analyte flow path. Systematic evaluation of parameters
relevant to end-column detection has been reported [94-96].
Deviceless decoupling incorporates gold microband electrodes 10 µm wide, 1 mm long, with
10 µm spacing, which are fabricated on a silicon chip [97]. Adjacent bands serve as the
working and quasi-reference electrodes, and the band electrode provides precise control over
the applied voltage necessary to compensate for the shift in detection potential created by the
separation voltage. Another variation of deviceless decoupling has also been facilitated for
CE-EC chip based systems based on the use of a floating potentiostat [98]. This device
incorporates optical communication to connect the amplifier which reads the electrode
current to the analog-to-digital converter. The voltage necessary to compensate potential
shift induced by the separation current is determined experimentally. Although the method
has been reported for a chip-based CE-EC system it is also applicable to conventional CE-EC
systems.
8.4 Applications
CE-EC analyses have been widespread since the inception of the method. A summary of
analyte specific analyses from 2002-2004 is listed in Table 1. Although Table 1 contains 80
references, it has been restricted to reports relevant to this chapter and to those which provide
detailed information about the analytical methodology. Electrode materials, dimensions, and
reported limits of detection are outlined in Table 1. While there is some variation in the

Hanson, Pappas, Holland, West Virginia University Page 10 of 31
detection limits between different electrochemical techniques (conductivity > voltammetry >
amperometry), typical EC methods provide detection limits in the low or sub-micromolar
range. For listings of older CE-EC citations, the reader is referred to reviews in the literature
[6-21].
Insert Table Approximately Here
The applications of CE-EC are diverse. Analyte is determined in a variety of matrices: foods,
plant material, biofluids, cells, tissue, and environmental samples. By far, the most extensive
application of CE-EC is in the field of neurochemistry. Separation based assays comprise
another widespread application of CE-EC. Such assays have been used to determine
biomarkers and toxins. Physiological activity is also a burgeoning area in CE-EC, both in the
determination of enzyme activity, and in the harnessing of enzyme activity for
electrocatalytic detection. Finally, following the recent advances in conductivity detection,
the number of applications in environmental monitoring is steadily growing.
8.4.1 Neurochemistry
A number of diseases, disorders, and physiological conditions are linked to neurotransmitter
dysfunction and there are many unanswered questions about physiological mechanism,
function, and implication of neurochemicals [163-166]. Since the first report of CE-EC, the
method has been adapted and employed to address a host of questions in the field of
neurochemistry. Neurochemical analyses benefit from the applicability of EC detection to
natively electroactive neurotransmitters and the excellent separation efficiency of CE.
Neurochemicals determined by CE-EC include catecholamines (epinephrine, norepinephrine,
dopamine), histamine, serotonin, acetylcholine, γ-aminobutyric acid (GABA), glutamate

Hanson, Pappas, Holland, West Virginia University Page 11 of 31
[4,5,27,35,37,38,41-45,47,84,88,91,92,97,127-136,167-169,171-179, 181-196, 198-200], and
neuropeptides [23]. Synthetic precursors to these molecules, including amino acids:
glutamine, tyrosine, phenylalanine, histidine, and tryptophan, are also quantified by CE-EC to
better understand function and dysfunction [27,28,30,47,56,61,66,172,175,191,201-205].
The intricacy of neurotransmission is reflected in the variety of models under investigation:
single cells, cellular compartments, subcellular fractions, organ specific in-vivo analyses, and
the analysis of homogenized whole organisms. The diversity of these physiological models
has produced a diversity of methodology.
Single cell neurochemical analyses by CE-EC has been applied to intact single snail neuron
cells [5,27,169,176,198-200], pheochromocytoma cells [27,128], chromaffin cells [135],
lymphocytes [173], and mast cells [195]. Analysis may be accomplished by injecting the
entire cell on column with the aid of an optical microscope and then lysing the cell prior to
the separation [27,128,135,176,199]. The electropherogram shown in Fig. 4 was obtained
after injecting an intact single pheochromocytoma cell into the separation capillary.
Following injection, the cell was lysed, derivatized, and the contents separated by CE [27].
Alternatively, cytoplasmic sampling of single cells has enabled determinations of
neurotransmitters in single neurons in the snail Planorbis corneus [5,169,198,200]. Recently,
synaptosomes, which are subcellular fractions containing high levels of chemical synapses,
have been harvested from homogenized rat forebrain for the determination of choline using
chemically modified electrodes containing entrapped enzymes specific for acetylcholine
[133,134,194].
While single and subcellular analyses serve as well controlled systems to elucidate molecular
interaction, neurochemical pathways, or release mechanisms, there is also a need to study

Hanson, Pappas, Holland, West Virginia University Page 12 of 31
neurochemistry in the context of the whole organism. To address this, microdialysis has been
coupled on-line and off-line to CE-EC to provide a means of selective sampling with minimal
perturbation of the physiological system [20,25,206,207]. Microdialysis also reduces the
number of animals necessary to account for population diversity, allows any single animal to
serve as its own control, and enables both temporal and spatial resolution. Microdialysis-CE-
EC has been used to determine neurotransmitters in the brain [25,91,183]. One study
incorporated novel end-column decoupling and a rotatable electrochemical detection cell to
observe the effect of two drugs (nomifensine and γ−butyrolactone) and electrical stimulation
on dopamine release in anesthetized rats. These researchers were able to demonstrate
increased levels of dopamine in response to the nomifensine, a dopamine uptake inhibitor, as
well as electrical stimulation and decreased levels of dopamine in response to
γ−butyrolactone, an inhibitor of dopaminergic neuron activity [91]. A recent twist to
studying neurochemistry in intact organisms is the determination of neurotransmitters in
homogenized fruit flies. These studies, which incorporated micellar electrokinetic
chromatography coupled to electrochemical detection to separate monoamine
neurotransmitters, demonstrated no detectable dopamine in transgenic flies with inactivated
Ddc neurons compared to wild-type flies [208].
8.4.2 Biomarkers
Another application of CE-EC is the determination of biomarkers in clinical or forensic
applications. Molecular markers include amino acids, peptides, catecholamines, sugars,
xenobiotics, and various metabolites. Analyte has been determined in a variety of biological
matrices including urine [34,38,66,67,99,112,143,150,153,201,202,204,209-217], serum
[152,155,156,218-222], plasma [101,106,212,223], airway surface fluid [106,224], saliva
[66], and hair [149,225]. Markers of oxidative stress, in particular glutathione

Hanson, Pappas, Holland, West Virginia University Page 13 of 31
[40,103,106,226], have been determined in biological samples using CE-EC. The analyte, 8-
hydroxy-deoxyguanosine, a marker of oxidative DNA damage has been determined using
CE-EC [153,214]. These reports revealed elevated levels of 8-hydroxy-deoxyguanosine in
individuals who smoke [214] and in cancer patients [153] relative to seemingly healthy
individuals. The modified amino acid homocysteine, a precursor to methionine synthesis, has
been identified as a risk factor of cardiovascular disease. One CE-EC assay incorporated
methodology to determine both free and protein bound forms of homocysteine [101]. This
method, developed for bench top CE-EC, was duplicated using a chip platform [101].
Finally, forensic analysis of cannabinoids in hair was reported using non-aqueous CE-EC
[149]. The approach successfully identified the drug in the hair sample of a known drug user
[149].
8.4.3 Physiological Activity
Enzymes serve as catalysts enabling metabolism, catabolism, signaling, transport, and
mobility. Enzymatic physiological activity is key to investigating mechanisms of
physiological function or dysfunction and their investigation deepens the understanding of
the molecular basis of disease. CE-EC methods have been developed to address a wide array
of topics within this area. Researchers included copper (II) complexation with CE to
facilitate EC detection of peptides based on the biuret reaction. The reaction is applicable to
peptides between three and eighteen amino acid residues in length. The method was used to
monitor the metabolism of Leucine-enkephalin [23]. The potential of employing CE-EC to
monitor the activity of angiotensin-converting enzyme in plasma has also been reported with
limits of detection of 200 nM for angiotensin related peptide fragments [24]. Reaction
kinetics of interesting biological systems have also been addressed. For example, the
lipoxygenase oxidation of linoleic acid and glucose oxidase catalyzed oxidation of glucose

Hanson, Pappas, Holland, West Virginia University Page 14 of 31
were monitored using CE-EC [227]. These methods incorporated a sealed reaction chamber,
multiplexed injections, and analyte quantification at timed intervals. A representative
electropherogram, shown in Fig. 5, demonstrates the depletion of oxygen and formation of
hydrogen peroxide resulting from the activity of glucose oxidase. Finally, catalytic activity
has been harnessed for indirect measurement of enzyme activity with improved detection
sensitivity through catalytic based signal amplification [104,105]. These methods incorporate
enzyme substrates that produce electroactive products in the presence of the targeted enzyme.
This approach was used to estimate the activity of glucose-6-phosphate dehydrogenase within
single erythrocytes [105].
8.4.4 Environmental monitoring
Environmental monitoring by CE-EC has been reported for soil and water samples. The
recent growth of CE-contactless conductivity detection has produced an expansion of
applications in environmental analyses. A majority of the work has focused on inorganic
ions using conductivity detection [114-116,126,228-232], although amperometry [233,234]
and potentiometry [80] have also been employed. Pesticides and herbicides have also been
reported using CE-amperometry [161,162]. CE-EC has been used for the environmental
monitoring of soil [235,236] as well as for the detection of explosive compounds and
degradation products of deadly nerve agents in soil [237,238]. The electropherograms shown
in Fig. 6 demonstrate the detection of trinitrotoluene, dinitrotoluene, and nitrotoluene in soil
and groundwater by CE-amperometry. Water samples have been monitored with CE-EC
collected from mining or industrial effluent [114,115,228], farm runoff [126], river water
[80,229], surface water [115,116,239], rain water [115,116,229,230,232,234], and drinking
water [115,116,229,231,240]. In an extensive study, researchers developed fast CE-
conductivity to analyze wet-deposition samples in the Sao Paulo region for inorganic ions,

Hanson, Pappas, Holland, West Virginia University Page 15 of 31
collected from May 1997 through March 1998 as well as formic acid, and acetic acid
collected from February 2000 through October 2000 [232,241].
8.5 Conclusions and Future Prospects
Some interesting applications of CE-EC, which point to future directions are worthy of
mention. Separation capillaries with inner diameters of several hundred nanometers have
been coupled to amperometry for the analysis of neurotransmitters [193,242]. It is
foreseeable that such an application could be extended to even further refined sub-cellular
sampling in neurochemistry studies. Patch clamp detection, shown in Fig. 7, has been used in
CE-EC for screening of neuroactive compounds and agonists of neuroactive compounds.
This mode of detection takes advantage of the selectivity and sensitivity of cellular response
in single cells [243-245]. The classical use of CE-conductivity to inorganic ion analyses has
been expanded to other exciting applications. CE-CCD has already been exploited for the
analysis of museum pieces, providing insight into paint composition, aging, and conditions of
valuable works of art [70], and the possibility of protein binding studies by CE-CCD points to
another method for screening binding affinity [64].
Continuing into future applications, CE-EC methods will certainly address improvements in
EC detection. New electrode materials, such as boron doped diamond electrodes continue to
appear in the literature [129,132,246]. Selectivity will also be a topic of future CE-EC
reports, either in the area of increased selectivity in complex matrices, or in continued
development of universal application seen in advances of CE-conductivity. The constant
interest in ease of use, applicability, and fieldability points to further expansion in CE-EC.
Clearly CE-EC has been exploited for a host of applications. Continued development of
innovative and novel CE-EC methodology can certainly be anticipated in the future.

Hanson, Pappas, Holland, West Virginia University Page 16 of 31
8.6 Acknowledgements
This material is based upon work supported by the National Science Foundation under Grant
No. 0307245.
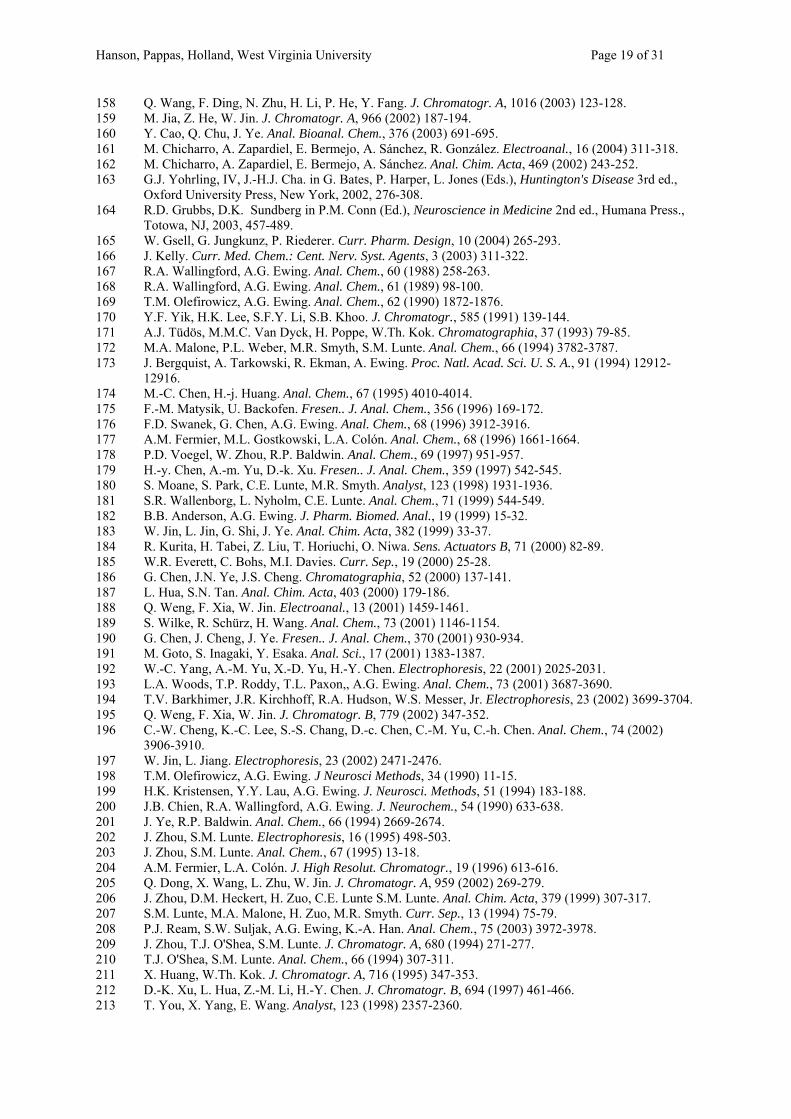
8.7 References
1 J.W. Jorgenson, K.D. Lukacs. Journal of HRC&CC, 4 (1981) 230-231. 2 J.W. Jorgenson, K.D. Lukacs. Anal. Chem., 53 (1981) 1298-1302. 3 J.W. Jorgenson, K.D. Lukacs. J. Chromatogr., 218 (1981) 209-216. 4 R.A. Wallingford, A.G. Ewing. Anal. Chem., 59 (1987) 1762-1766. 5 R.A. Wallingford, A.G. Ewing. Anal. Chem., 60 (1988) 1972-1975. 6 T.J. O'Shea in S.M. Lunte and D.M. Radzik (Eds.), Pharmaceutical and Biomedical Applications of
Capillary Electrophoresis. Elsevier Science Inc., Tarrytown, N.Y., 1996, 277-306. 7 P.D. Voegel, R.P. Baldwin. Electrophoresis, 18 (1997) 2267-2278. 8 C. Haber in J.P. Landers (Eds.), Handbook of Capillary Electrophoresis 2nd ed. CRC Press, Boca
Raton, FL, 1997, 425-447. 9 L.A. Holland, N.P. Chetwyn, M.D. Perkins, S.M. Lunte. Pharm. Res., 14 (1997) 372-387. 10 L.A. Holland, S.M. Lunte. Anal. Commun., 35 (1998) 1H-4H. 11 T. Kappes, P.C. Hauser. J. Chromatogr. A, 834 (1999) 89-101. 12 S. Polesello, S.M. Valsecchi. J. Chromatogr. A, 834 (1999) 103-116. 13 R.P. Baldwin. Electrophoresis, 21 (2000) 4017-4028. 14 F.-M. Matysik. Electroanal., 12 (2000) 1349-1355. 15 T. Kappes, P.C. Hauser. Electroanal., 12 (2000) 165-170. 16 A. Wang, Y. Fang. Electrophoresis, 21 (2000) 1281-1290. 17 A.J. Zemann. Trends Anal. Chem., 20 (2001) 346-354. 18 L.A. Holland, A.M. Leigh. Electrophoresis, 23 (2002) 3649-3658. 19 J. Tanyanyiwa, S. Leuthardt, P.C. Hauser. Electrophoresis, 23 (2002) 3659-3666. 20 S.M. Lunte, R.S. Martin, C.E. Lunte in A. Brajter-Toth and J.Q. Chambers (Eds.), Electroanalytical
Methods for Biological Materials. Marcel Dekker Inc., New York, N.Y., 2002, 461-490. 21 A.J. Zemann. Electrophoresis, 24 (2003) 2125-2137. 22 M. Deacon, T.J. O'Shea, S.M. Lunte, M.R. Smyth. J. Chromatogr. A, 652 (1993) 377-383. 23 A.J. Gawron, S.M. Lunte. Electrophoresis, 21 (2000) 3205-3211. 24 N.A. Lacher, K.E. Garrison, S.M. Lunte. Electrophoresis, 23 (2002) 1577-1584. 25 T.J. O'Shea, P.L. Weber, B.P. Bammel, C.E. Lunte, S.M. Lunte, M.R. Smyth. J. Chromatogr., 608
(1992) 189-195. 26 T.J. O'Shea, R.D. Greenhagen, S.M. Lunte, C.E. Lunte, M.R. Smyth, D.M. Radzik, N. Watanabe. J.
Chromatogr., 593 (1992) 305-312. 27 F.D. Swanek, B.B. Anderson, A.G. Ewing. J. Microcolumn Separations, 10 (1998) 185-192. 28 Q. Weng, W. Jin. Electrophoresis, 22 (2001) 2797-2803. 29 Q. Dong, W. Jin, J. Shan. Electrophoresis, 23 (2002) 559-564. 30 Q. Weng, W. Jin. Anal. Chim. Acta, 478 (2003) 199-207. 31 L.-Y. Zhang, Y.-M. Liu, Z.-L. Wang, J.-K. Cheng. Anal. Chim. Acta, 508 (2004) 141-145. 32 M.J. Rose, S.M. Lunte, R.G. Carlson, J.F. Stobaugh. J. Pharm. Biomed. Anal., 30 (2003) 1851-1859. 33 L.A. Holland, S.M. Lunte. Anal. Chem., 71 (1999) 407-412. 34 B.L. Lin, L.A. Colón, R.N. Zare. J. Chromatogr. A, 680 (1994) 263-270. 35 M. Zhong, J. Zhou, S.M. Lunte, G. Zhao, D.M. Giolando, J.R. Kirchhoff. Anal. Chem., 68 (1996) 203-
207. 36 M. Zhong, S.M. Lunte. Anal. Chem., 71 (1999) 251-255. 37 L.A. Holland, N.M. Harmony, S.M. Lunte. Electroanal., 11 (1999) 327-330. 38 D.-c. Chen, D.-Z. Zhan, C.-W. Cheng, A.-C. Liu, C.-h. Chen. J. Chromatogr. B, 750 (2001) 33-39. 39 Q. Weng, W. Jin. J. Chromatogr. A, 971 (2002) 217-223. 40 W. Jin, X. Li, N. Gao. Anal. Chem., 75 (2003) 3859-3864. 41 D.-c. Chen, S.-S. Chang, C.-h. Chen. Anal. Chem., 71 (1999) 3200-3205. 42 Z. Liu, O. Niwa, R. Kurita, T. Horiuchi. J. Chromatogr. A, 891 (2000) 149-156.

Hanson, Pappas, Holland, West Virginia University Page 17 of 31
43 O. Niwa, R. Kurita, Z. Liu, T. Horiuchi, K. Torimitsu. Anal. Chem., 72 (2000) 949-955. 44 Z. Liu, O. Niwa, R. Kurita, T. Horiuchi. Anal. Chem., 72 (2000) 1315-1321. 45 G.C. Gerhardt, R.M. Cassidy, A.S. Baranski. Anal. Chem., 70 (1998) 2167-2173. 46 J. Wen, A. Baranski, R. Cassidy. Anal. Chem., 70 (1998) 2504-2509. 47 S.S. Ferris, G. Lou, A.G. Ewing. J. Microcolumn Separations, 6 (1994) 263-268. 48 S. Park, M.J. McGrath, M.R. Smyth, D. Diamond, C.E. Lunte. Anal. Chem., 69 (1997) 2994-3001. 49 S.A. Brazill, P.H. Kim, W.G. Kuhr. Anal. Chem., 73 (2001) 4882-4890. 50 S.A. Brazill, W.G. Kuhr. Anal. Chem., 74 (2002) 3421-3428. 51 S.A. Brazill, N.E. Herbert, W.G. Kuhr. Electrophoresis, 24 (2003) 2749-2757. 52 T.J. O'Shea, S.M. Lunte, W.R. LaCourse. Anal. Chem., 65 (1993) 948-951. 53 W. Lu, R.M. Cassidy. Anal. Chem., 65 (1993) 2878-2881. 54 P.L. Weber, S.M. Lunte. Electrophoresis, 17 (1996) 302-309. 55 J. Wen, R.M. Cassidy. Anal. Chem., 68 (1996) 1047-1053. 56 W.R. LaCourse, G.S. Owens. Electrophoresis, 17 (1996) 310-318. 57 G.S. Owens, W.R. LaCourse. J. Chromatogr. B, 695 (1997) 15-25. 58 J. Wen, R.M. Cassidy, A.S. Baranski. J. Chromatogr. A, 811 (1998) 181-192. 59 H.-H. Rüttinger, B. Dräger. J. Chromatogr. A, 925 (2001) 291-296. 60 X. Sun, X. Yang, E. Wang. J. Chromatogr. A, 1005 (2003) 189-195. 61 G.C. Gerhardt, R.M. Cassidy, A.S. Baranski. Anal. Chem., 72 (2000) 908-915. 62 A.J. Zemann, E. Schnell, D. Volgger, G.K. Bonn. Anal. Chem., 70 (1998) 563-567. 63 J.A.F. da Silva, C.L. do Lago. Anal. Chem., 70 (1998) 4339-4343. 64 E.M. Abad-Villar, J. Tanyanyiwa, M.T. Fernández-Abedul, A. Costa-García, P.C. Hauser. Anal.
Chem., 76 (2004) 1282-1288. 65 E. Baltussen, R.M. Guijt, G. van der Steen, F. Laugere, S. Baltussen, G.W.K. van Dedem.
Electrophoresis, 23 (2002) 2888-2893. 66 P. Coufal, J. Zuska, T. van de Goor, V. Smith, B. Gaš. Electrophoresis, 24 (2003) 671-677. 67 J. Tanyanyiwa, K. Schweizer, P.C. Hauser. Electrophoresis, 24 (2003) 2119-2124. 68 I. Kaml, K. Vcelakova, E. Kenndler. J. Sep. Sci., 27 (2004) 161-166. 69 A.Z. Carvalho, J.A.F. da Silva, C.L. do Lago. Electrophoresis, 24 (2003) 2138-2143. 70 I. Surowiec, I. Kaml, E. Kenndler. J. Chromatogr. A, 1024 (2004) 245-254. 71 C. Haber, I. Silvestri, S. Röösli, W. Simon. Chimia, 45 (1991) 117-121. 72 A. Nann, I. Silvestri, W. Simon. Anal. Chem., 65 (1993) 1662-1667. 73 A. Nann, E. Pretsch. J. Chromatogr. A, 676 (1994) 437-442. 74 P.C. Hauser, N.D. Renner, A.P.C. Hong. Anal. Chim. Acta, 295 (1994) 181-186. 75 B.L. De Backer, L.J. Nagels. Biomed. Chromatogr., 9 (1995) 257-258. 76 B.L. De Backer, L.J. Nagels. Anal. Chem., 68 (1996) 4441-4445. 77 T. Kappes, P. Schnierle, P.C. Hauser. Anal. Chim. Acta, 350 (1997) 141-147. 78 T. Kappes, P.C. Hauser. Anal. Chem., 70 (1998) 2487-2492. 79 P. Schnierle, T. Kappes, P.C. Hauser. Anal. Chem., 70 (1998) 3585-3589. 80 T. Kappes, P.C. Hauser. Anal. Commun., 35 (1998) 325-329. 81 I. Poels, L.J. Nagels. Anal. Chim. Acta, 385 (1999) 417-422. 82 I. Poels, L.J. Nagels. Anal. Chim. Acta, 401 (1999) 21-27. 83 T. Kappes, P. Schnierle, P.C. Hauser. Anal. Chim. Acta, 393 (1999) 77-82. 84 T. Kappes, P. Schnierle, P.C. Hauser. Electrophoresis, 21 (2000) 1390-1394. 85 A. Nann, W. Simon. J. Chromatogr., 633 (1993) 207-211. 86 M.C. Linhares, P.T. Kissinger. Anal. Chem., 63 (1991) 2076-2078. 87 S. Hu, Z.-L. Wang, P.-B. Li, J.-K. Cheng. Anal. Chem., 69 (1997) 264-267. 88 D.M. Osbourn, C.E. Lunte. Anal. Chem., 73 (2001) 5961-5964. 89 W.Th. Kok, Y. Sahin. Anal. Chem., 65 (1993) 2497-2501. 90 X. Huang, R.N. Zare, S. Sloss, A.G. Ewing. Anal. Chem., 63 (1991) 189-192. 91 J. Qian, Y. Wu, H. Yang, A.C. Michael. Anal. Chem., 71 (1999) 4486-4492. 92 S. Park, C.E. Lunte. Anal. Chem., 67 (1995) 4366-4370. 93 S. Sloss, A.G. Ewing. Anal. Chem., 65 (1993) 577-581. 94 W. Lu, R.M. Cassidy, A.S. Baranski. J. Chromatogr., 640 (1993) 433-440. 95 W. Lu, R.M. Cassidy. Anal. Chem., 66 (1994) 200-204. 96 F.-M. Matysik. J. Chromatogr. A, 742 (1996) 229-234. 97 O. Klett, I. Nischang, L. Nyholm. Electrophoresis, 23 (2002) 3678-3682. 98 R.S. Martin, K.L. Ratzlaff, B.H. Huynh, S.M. Lunte. Anal. Chem., 74 (2002) 1136-1143. 99 T. Inoue, J.R. Kirchhoff. Anal. Chem., 74 (2002) 1349-1354. 100 Y. Cao, X. Zhang, Q. Chu, Y. Fang, J. Ye. Electroanal., 15 (2003) 898-902.

Hanson, Pappas, Holland, West Virginia University Page 18 of 31
101 S.A. Pasas, N.A. Lacher, M.I. Davies, S.M. Lunte. Electrophoresis, 23 (2002) 759-766. 102 Q. Wang, H. Yu, H. Li, F. Ding, P. He, Y. Fang. Food Chem., 83 (2003) 311-317. 103 W. Wang, H. Xin, H. Shao, W. Jin. J. Chromatogr. B, 789 (2003) 425-429. 104 Z. He, H. Wang, X. Sun, W. Jin. Electroanal., 14 (2002) 1674-1678. 105 X. Sun, W. Jin. Anal. Chem., 75 (2003) 6050-6055. 106 K. Govindaraju, V. Govindaraju, D.H. Eidelman. J. Chromatogr. B, 788 (2003) 369-376. 107 Q. Wang, H. Yu, J. Zong, P. He, Y. Fang. J. Pharm. Biomed. Anal., 31 (2003) 473-480. 108 Q. Hu, T. Zhou, G. Hu, Y. Fang. J. Pharm. Biomed. Anal., 30 (2002) 1047-1053. 109 Q. Wang, F. Ding, N. Zhu, P. He, Y. Fang. Biomed. Chromatogr., 17 (2003) 483-488. 110 Y. Cao, Y. Wang, X. Chen, J. Ye. Food Chem., 86 (2004) 131-136 111 G. Chen, X. Han, L. Zhang, J. Ye. J. Chromatogr. A, 954 (2002) 267-276. 112 G. Chen, Q. Chu, L. Zhang, J. Ye. Anal. Chim. Acta, 457 (2002) 225-233. 113 J. Tanyanyiwa, S. Leuthardt, P.C. Hauser. J. Chromatogr. A, 978 (2002) 205-211. 114 P. Kubáň, P. Kubáň, V. Kubáň. Electrophoresis, 24 (2003) 1397-1403. 115 P. Kubáň, P. Kubáň, V. Kubáň. Electrophoresis, 23 (2002) 3725-3734. 116 P. Kubáň, P. Kubáň, V. Kubáň. Electrophoresis, 24 (2003) 1935-1943. 117 M. Macka, J. Hutchinson, A. Zemann, Z. Shusheng, P.R. Haddad. Electrophoresis, 24 (2003) 2144-
2149. 118 P. Tůma, F. Opekar, K. Štulík. Electrophoresis, 23 (2002) 3718-3724. 119 J. Tanyanyiwa, P.C. Hauser. Electrophoresis, 23 (2002) 3781-3786. 120 P. Kubáň, P. Kubáň, P.C. Hauser, V. Kubáň. Electrophoresis, 25 (2004) 35-42. 121 V. Unterholzner, M. Macka, P.R. Haddad, A. Zemann. Analyst, 127 (2002) 715-718. 122 J. Tanyanyiwa, B. Galliker, M.A. Schwarz, P.C. Hauser. Analyst, 127 (2002) 214-218. 123 P.S. Vuorinen, M. Jussila, H. Sirén, S. Palonen, M.-L. Riekkola. J. Chromatogr. A, 990 (2003) 45-52. 124 J.A.F. da Silva, N. Guzman, C.L. da Lago. J. Chromatogr. A, 942 (2002) 249-258. 125 P. Praus. Talanta, 62 (2004) 977-982. 126 P. Kubáň, M. Reinhardt, B. Müller, P.C. Hauser. J. Environ. Monit., 6 (2004) 169-174. 127 K.B. Male, J.H.T. Luong. J. Chromatogr. A, 1003 (2003) 167-178. 128 L. Zhang, S. Qv, Z. Wang, J. Cheng. J. Chromatogr. B, 792 (2003) 381-385. 129 D. Shin, B.V. Sarada, D.A. Tryk, A. Fujishima, J. Wang, Anal. Chem., 75 (2003) 530-534. 130 X. Sun, X. Yang, E. Wang. J. Chromatogr. A, 991 (2003) 109-116. 131 F.-M. Matysik, D. Marggraf, P. Gläser, J.A.C. Broekaert. Electrophoresis, 23 (2002) 3711-3717. 132 J. Cvačka, V. Quaiserová, J. Park, Y. Show, A. Muck , Jr., G.M. Swain. Anal. Chem., 75 (2003) 2678-
2687. 133 T. Inoue, J.R. Kirchhoff, R.A. Hudson. Anal. Chem., 74 (2002) 5321-5326. 134 D.D. Wise, T.V. Barkhimer, P.-A. Brault, J.R. Kirchhoff, W.S. Messer, Jr., R.A. Hudson. J.
Chromatogr. B, 775 (2002) 49-56. 135 S.W. Suljak, F.D. Swanek, P.F. Gavin, A.G. Ewing. J. Sep. Sci., 26 (2003) 61-68. 136 L. Zhang, W. Huang, Z. Wang, J. Cheng. Anal. Sci., 18 (2002) 1117-1120. 137 Y. Peng, Q. Chu, F. Liu, J. Ye. J. Agric. Food Chem., 52 (2004) 153-156. 138 Q. Wang, F. Ding, H. Li, P. He, Y. Fang. Electrophoresis, 24 (2003) 1687-1692. 139 Q. Wang, F. Ding, H. Li, P. He, Y. Fang. J. Pharm. Biomed. Anal., 30 (2003) 1507-1514. 140 Y. Cao, C. Lou, Y. Fang, J. Ye. J. Chromatogr. A, 943 (2002) 153-157. 141 X. Sun, C. Gao, W. Cao, X. Yang, E. Wang. J. Chromatogr. A, 962 (2002) 117-125. 142 G. Chen, J. Ye, H. Bao, P. Yang. J. Pharm. Biomed. Anal., 29 (2002) 843-850. 143 X. Li, W. Jin, Q. Weng. Anal. Chim. Acta, 461 (2002) 123-130. 144 Y. Cao, Q. Chu, Y. Fang, J. Ye. Anal. Bioanal. Chem., 374 (2002) 294-299. 145 G. Chen, L. Zhang, J. Zhao, J. Ye. Anal. Bioanal. Chem., 373 (2002) 169-173. 146 L. Gao, Q. Chu, J. Ye. Food Chem., 78 (2002) 255-260. 147 D. Liu, W. Jin. J. Chromatogr. B, 789 (2003) 411-415. 148 D. Liu, W. Jin. J. Chromatogr. B, 783 (2003) 509-515. 149 U. Backofen, F.-M. Matysik, C.E. Lunte. J. Chromatogr. A, 942 (2002) 259-269. 150 T. Zhou, H. Yu, Q. Hu, Y. Fang. J. Pharm. Biomed. Anal., 30 (2002) 13-19. 151 W. Jin, L. Jiang. Anal. Chim. Acta, 461 (2002) 117-121. 152 J.L. Boughton, B.W. Robinson, T.G. Strein. Electrophoresis, 23 (2002) 3705-3710. 153 S.-R. Mei, Q.-H. Yao, L.-s. Cai, J. Xing, G.-W. Xu, C.-y. Wu. Electrophoresis, 24 (2003) 1411-1415. 154 Q. Dong, R. Dong, M. Jin, W. Jin. J. Chromatogr. B, 774 (2002) 121-126. 155 Z. He, N. Gao, W. Jin. Anal. Chim. Acta, 497 (2003) 75-81. 156 Z. He, N. Gao, W. Jin. J. Chromatogr. B, 784 (2003) 343-350. 157 X. Sun, X. Yang, E. Wang. J. Chromatogr. A, 1005 (2003) 189-195.
Hanson, Pappas, Holland, West Virginia University Page 19 of 31
158 Q. Wang, F. Ding, N. Zhu, H. Li, P. He, Y. Fang. J. Chromatogr. A, 1016 (2003) 123-128. 159 M. Jia, Z. He, W. Jin. J. Chromatogr. A, 966 (2002) 187-194. 160 Y. Cao, Q. Chu, J. Ye. Anal. Bioanal. Chem., 376 (2003) 691-695. 161 M. Chicharro, A. Zapardiel, E. Bermejo, A. Sánchez, R. González. Electroanal., 16 (2004) 311-318. 162 M. Chicharro, A. Zapardiel, E. Bermejo, A. Sánchez. Anal. Chim. Acta, 469 (2002) 243-252. 163 G.J. Yohrling, IV, J.-H.J. Cha. in G. Bates, P. Harper, L. Jones (Eds.), Huntington's Disease 3rd ed.,
Oxford University Press, New York, 2002, 276-308. 164 R.D. Grubbs, D.K. Sundberg in P.M. Conn (Ed.), Neuroscience in Medicine 2nd ed., Humana Press.,
Totowa, NJ, 2003, 457-489. 165 W. Gsell, G. Jungkunz, P. Riederer. Curr. Pharm. Design, 10 (2004) 265-293. 166 J. Kelly. Curr. Med. Chem.: Cent. Nerv. Syst. Agents, 3 (2003) 311-322. 167 R.A. Wallingford, A.G. Ewing. Anal. Chem., 60 (1988) 258-263. 168 R.A. Wallingford, A.G. Ewing. Anal. Chem., 61 (1989) 98-100. 169 T.M. Olefirowicz, A.G. Ewing. Anal. Chem., 62 (1990) 1872-1876. 170 Y.F. Yik, H.K. Lee, S.F.Y. Li, S.B. Khoo. J. Chromatogr., 585 (1991) 139-144. 171 A.J. Tüdös, M.M.C. Van Dyck, H. Poppe, W.Th. Kok. Chromatographia, 37 (1993) 79-85. 172 M.A. Malone, P.L. Weber, M.R. Smyth, S.M. Lunte. Anal. Chem., 66 (1994) 3782-3787. 173 J. Bergquist, A. Tarkowski, R. Ekman, A. Ewing. Proc. Natl. Acad. Sci. U. S. A., 91 (1994) 12912-
12916. 174 M.-C. Chen, H.-j. Huang. Anal. Chem., 67 (1995) 4010-4014. 175 F.-M. Matysik, U. Backofen. Fresen.. J. Anal. Chem., 356 (1996) 169-172. 176 F.D. Swanek, G. Chen, A.G. Ewing. Anal. Chem., 68 (1996) 3912-3916. 177 A.M. Fermier, M.L. Gostkowski, L.A. Colón. Anal. Chem., 68 (1996) 1661-1664. 178 P.D. Voegel, W. Zhou, R.P. Baldwin. Anal. Chem., 69 (1997) 951-957. 179 H.-y. Chen, A.-m. Yu, D.-k. Xu. Fresen.. J. Anal. Chem., 359 (1997) 542-545. 180 S. Moane, S. Park, C.E. Lunte, M.R. Smyth. Analyst, 123 (1998) 1931-1936. 181 S.R. Wallenborg, L. Nyholm, C.E. Lunte. Anal. Chem., 71 (1999) 544-549. 182 B.B. Anderson, A.G. Ewing. J. Pharm. Biomed. Anal., 19 (1999) 15-32. 183 W. Jin, L. Jin, G. Shi, J. Ye. Anal. Chim. Acta, 382 (1999) 33-37. 184 R. Kurita, H. Tabei, Z. Liu, T. Horiuchi, O. Niwa. Sens. Actuators B, 71 (2000) 82-89. 185 W.R. Everett, C. Bohs, M.I. Davies. Curr. Sep., 19 (2000) 25-28. 186 G. Chen, J.N. Ye, J.S. Cheng. Chromatographia, 52 (2000) 137-141. 187 L. Hua, S.N. Tan. Anal. Chim. Acta, 403 (2000) 179-186. 188 Q. Weng, F. Xia, W. Jin. Electroanal., 13 (2001) 1459-1461. 189 S. Wilke, R. Schürz, H. Wang. Anal. Chem., 73 (2001) 1146-1154. 190 G. Chen, J. Cheng, J. Ye. Fresen.. J. Anal. Chem., 370 (2001) 930-934. 191 M. Goto, S. Inagaki, Y. Esaka. Anal. Sci., 17 (2001) 1383-1387. 192 W.-C. Yang, A.-M. Yu, X.-D. Yu, H.-Y. Chen. Electrophoresis, 22 (2001) 2025-2031. 193 L.A. Woods, T.P. Roddy, T.L. Paxon,, A.G. Ewing. Anal. Chem., 73 (2001) 3687-3690. 194 T.V. Barkhimer, J.R. Kirchhoff, R.A. Hudson, W.S. Messer, Jr. Electrophoresis, 23 (2002) 3699-3704. 195 Q. Weng, F. Xia, W. Jin. J. Chromatogr. B, 779 (2002) 347-352. 196 C.-W. Cheng, K.-C. Lee, S.-S. Chang, D.-c. Chen, C.-M. Yu, C.-h. Chen. Anal. Chem., 74 (2002)
3906-3910. 197 W. Jin, L. Jiang. Electrophoresis, 23 (2002) 2471-2476. 198 T.M. Olefirowicz, A.G. Ewing. J Neurosci Methods, 34 (1990) 11-15. 199 H.K. Kristensen, Y.Y. Lau, A.G. Ewing. J. Neurosci. Methods, 51 (1994) 183-188. 200 J.B. Chien, R.A. Wallingford, A.G. Ewing. J. Neurochem., 54 (1990) 633-638. 201 J. Ye, R.P. Baldwin. Anal. Chem., 66 (1994) 2669-2674. 202 J. Zhou, S.M. Lunte. Electrophoresis, 16 (1995) 498-503. 203 J. Zhou, S.M. Lunte. Anal. Chem., 67 (1995) 13-18. 204 A.M. Fermier, L.A. Colón. J. High Resolut. Chromatogr., 19 (1996) 613-616. 205 Q. Dong, X. Wang, L. Zhu, W. Jin. J. Chromatogr. A, 959 (2002) 269-279. 206 J. Zhou, D.M. Heckert, H. Zuo, C.E. Lunte S.M. Lunte. Anal. Chim. Acta, 379 (1999) 307-317. 207 S.M. Lunte, M.A. Malone, H. Zuo, M.R. Smyth. Curr. Sep., 13 (1994) 75-79. 208 P.J. Ream, S.W. Suljak, A.G. Ewing, K.-A. Han. Anal. Chem., 75 (2003) 3972-3978. 209 J. Zhou, T.J. O'Shea, S.M. Lunte. J. Chromatogr. A, 680 (1994) 271-277. 210 T.J. O'Shea, S.M. Lunte. Anal. Chem., 66 (1994) 307-311. 211 X. Huang, W.Th. Kok. J. Chromatogr. A, 716 (1995) 347-353. 212 D.-K. Xu, L. Hua, Z.-M. Li, H.-Y. Chen. J. Chromatogr. B, 694 (1997) 461-466. 213 T. You, X. Yang, E. Wang. Analyst, 123 (1998) 2357-2360.

Hanson, Pappas, Holland, West Virginia University Page 20 of 31
214 D.J. Weiss, C.E. Lunte. Electrophoresis, 21 (2000) 2080-2085. 215 S. Zhang, Z. Yuan, H. Liu, H. Zou, H. Xiong, Y. Wu. Electrophoresis, 21 (2000) 2995-2998. 216 W. Jin, Q. Dong, D. Yu, X. Ye. Electrophoresis, 21 (2000) 1535-1539. 217 S.S. Zhang, H.X. Liu, Y.J. Wu, C.L. Yu. Analyst, 126 (2001) 441-445. 218 X. Huang, T.-K.J. Pang, M.J. Gordon, R.N. Zare. Anal. Chem., 59 (1987) 2747-2749. 219 M. Zhong, S.M. Lunte. Anal. Commun., 35. (1998) 209-212. 220 A. Wang, L. Zhang, S. Zhang, Y. Fang. J. Pharm. Biomed. Anal., 23 (2000) 429-436. 221 Q. Dong, D. Yu, X. Ye, W. Jin. Electrophoresis, 22 (2001) 128-133. 222 J.A.F. da Silva, N.L. Ricelli, A.Z. Carvalho, C.L. do Lago. J. Braz. Chem. Soc., 14 (2003) 265-268. 223 D.-K. Xu, L. Hua, H.-Y. Chen. Anal. Chim. Acta, 335 (1996) 95-101. 224 K. Govindaraju, E.A. Cowley, D.H. Eidelman, D.K. Lloyd. Anal. Chem., 69 (1997) 2793-2797. 225 J. Mo, W. Liu, S. Mo. Anal. Commun., 35 (1998) 365-367. 226 T.J. O'Shea, S.M. Lunte. Anal. Chem., 65 (1993) 247-250. 227 A. Radschuweit, H.-H. Rüttinger, P. Nuhn. J. Chromatogr. A, 937 (2001) 127-134. 228 D. Schlegel, J. Mattusch, R. Wennrich. Fresen.. J. Anal. Chem., 354 (1996) 535-539. 229 D. Kaniansky, V. Zelenská, D. Baluchová. Electrophoresis, 17 (1996) 1890-1897. 230 S. Valsecchi, G. Tartari, S. Polesello. J. Chromatogr. A, 760 (1997) 326-332. 231 R. Bodor, D. Kaniansky, M. Masár. J. Chromatogr. A, 916 (2001) 31-40. 232 F.R. Rocha, J.A.F. da Silva, C.L. Lago, A. Fornaro, I.G.R. Gutz. Atmos. Environ., 37 (2003) 105-115. 233 E.P.C. Lai, W. Zhang, X. Trier, A. Georgi, S. Kowalski, S. Kennedy, T. MdMuslim, E. Dabek-
Zlotorzynska. Anal. Chim. Acta, 364 (1998) 63-74. 234 B. Tenberken, P. Ebert, M. Hartmann, M. Kibler, A. Mainka, T. Prokop, A. Röder, K. Bächmann. J.
Chromatogr. A, 745 (1996) 209-215. 235 A. Hilmi, J.H.T. Luong, A.-L. Nguyen. Environ. Sci. Technol., 31 (1997) 1794-1800. 236 A. Hilmi, J.H.T. Luong. Anal. Chem., 73 (2001) 2536-2540. 237 A.-E.F. Nassar, S.V. Lucas, W.R. Jones, L.D. Hoffland. Anal. Chem., 70 (1998) 1085-1091. 238 A. Hilmi, J.H.T. Luong, A.-L. Nguyen. Anal. Chem., 71 (1999) 873-878. 239 F. Hissner, J. Mattusch, K. Heinig. J. Chromatogr. A, 848 (1999) 503-513. 240 S.R. Wallenborg, S.M. Dorholt, A. Faibushevich, C.E. Lunte. Electroanal., 11 (1999) 362-366. 241 A. Fornaro, I.G.R. Gutz. Atmos. Environ., 37 (2003) 117-128. 242 L.A. Woods, A.G. Ewing. ChemPhysChem, 4 (2003) 207-211. 243 K. Jardemark, O. Orwar, I. Jacobson, A. Moscho, R.N. Zare. Anal. Chem., 69 (1997) 3427-3434. 244 O. Orwar, K. Jardemark, I. Jacobson, A. Moscho, H.A. Fishman, R.H. Scheller, R.N. Zare. Science,
272 (1996) 1779-1782. 245 C. Farre, A. Sjöberg, K. Jardemark, I. Jacobson, O. Orwar. Anal. Chem., 73 (2001) 1228-1233. 246 D. Shin, B.V. Sarada, D.A. Tryk, A. Fujishima. Chemical Sensors, 18 (2002) 124-126. Figure Legends: Fig. 1. Schematic of the off-column CE-amperometric system first reported by Wallingford and Ewing. The porous glass decoupler is shown in 1A and the arrangement of the EC cell in relation to the CE-capillary connection is shown in 1B. Components are labeled as follows: a, microscope slide; b, fused silica capillary; c, porous glass capillary; d, joint; e, epoxy; f, polymer coating; g, eluent drop; h stainless steel plate serving as the auxiliary electrode (AE). The working and reference electrodes are labeled WE and RE, respectively. Figure reprinted with permission from [4] R.A. Wallingford, A.G. Ewing. Anal. Chem., 59 (1987) 1762-1766. Copyright 1987 American Chemical Society. Fig. 2. Various capillary and electrode configurations for CE-end-column electrochemical detection. A. cylindrical electrode, B. cylindrical electrode inserted inside a conically etched capillary, C-E different disk electrode arrangements, F on-capillary wire electrode, G on-capillary sputtered electrode. Figure reproduced from [14] F.M. Matysik. Electroanal., 12 (2000) 1349-1355. Copyright 2000 Wiley-VCH Verlag GmbH. Reprinted by permission of John Wiley & Sons, Inc.
Hanson, Pappas, Holland, West Virginia University Page 21 of 31
Fig. 3. The schematic for the CE-CCD detector reported by Zemann et. al. Figure reprinted with permission from [62] A.J. Zemann, E. Schnell, D. Volgger, G.K. Bonn. Anal. Chem., 70 (1998) 563-567. Copyright 1998 American Chemical Society. Fig. 4. Electropherogram of the contents of a single pheochromocytoma cell. The large peak labeled DA is the response for dopamine. Figure reproduced from [27] F.D. Swanek, B.B. Anderson, A.G. Ewing. J. Microcolumn Separations, 10 (1998) 185-192. Copyright 1998 John Wiley & Sons, Inc. Reprinted by permission of John Wiley & Sons, Inc. Fig. 5. Electropherogram resulting from the CE-amperometric monitoring of the activity of glucose oxidase (GOD). The reaction consumes oxygen and produces hydrogen peroxide. Injections are multiplexed. During the time course of the experiment, the amount of hydrogen peroxide introduced in each injection cycle increase, while the amount of oxygen decreases. Figure reprinted with permission from [227] A. Radschuweit, H.-H. Rüttinger, P. Nuhn. J. Chromatogr. A, 937 (2001) 127-134. Copyright 2001, with permission from Elsevier. Fig. 6. Electropherogram of trinitrotoluene (TNT), 2,4-dinitrotoluene (2,4-DNT), 2,6-dinitrotoluene (2,6-DNT), 2,3-dinitrotoluene (2,3-DNT), and 2-nitrotoluene (2-NT) in A, an aqueous soil extract, and B, a groundwater sample. Figure reprinted with permission from [238] A. Hilmi, J.H.T. Luong, A.-Z. Nguyen. Anal. Chem., 71 (1999) 873-878. Copyright 1999 American Chemical Society. Fig. 7. A schematic of a patch clamp electrode coupled with a CE capillary. Figure reprinted with permission from [244] O. Orwar, K. Jardemark, I. Jacobson, A. Moscho, H.A. Fishman, R.H. Scheller, R.N. Zare. Science, 272 (1996) 1779-1782. Copyright 1996 AAAS.

Hanson, Pappas, Holland, West Virginia University Page 22 of 31
Fig. 1
aA.
B.
bc
d e ff e
a
g
h
f
RE
A. ff e d e
bc
B. g
h
f
RE
WE Potentiostat
AE

Hanson, Pappas, Holland, West Virginia University Page 23 of 31
Fig. 2
10 µm
25 µm
10 µm
25 µm
< 25 µm
2-10 µm
50-75 µm
≤ 75 µm
< 25 µm
A.
B.
C.
D.
E.
F.
G.
10 µm10 µm
25 µm
10 µm10 µm
25 µm
< 25 µm
2-10 µm
50-75 µm
≤ 75 µm
< 25 µm
< 25 µm< 25 µm
2-10 µm2-10 µm
50-75 µm50-75 µm
≤ 75 µm≤ 75 µm
< 25 µm< 25 µm
A.
B.
C.
D.
E.
F.
G.
A.
B.
C.
D.
E.
F.
G.
Hanson, Pappas, Holland, West Virginia University Page 24 of 31
Fig. 3

Hanson, Pappas, Holland, West Virginia University Page 25 of 31
Fig. 4

Hanson, Pappas, Holland, West Virginia University Page 26 of 31
Fig. 5

Hanson, Pappas, Holland, West Virginia University Page 27 of 31
Fig. 6
TNT
2,4-
DN
T
2,6-
DN
T2-
NT
2,3-
DN
T
TNT
2,4-
DN
T2,
6-D
NT
2-N
T2,
3-D
NT
TNT
2,4-
DN
T
2,6-
DN
T2-
NT
2,3-
DN
T
TNT
2,4-
DN
T2,
6-D
NT
2-N
T2,
3-D
NT

Hanson, Pappas, Holland, West Virginia University Page 28 of 31
Fig. 7

Hanson, Pappas, Holland, West Virginia University Page 29 of 31
Table 1. Capillary Electrophoresis-Electrochemical Detection Listed by Analyte Class (2002-2004) Electrode Material Electrode Geometry LOD Ref Amino Acids PQQa entrapped in PPYb matrix on carbon 245 µm disk 23 nM [99] Carbon 300 µm disk 0.1 µM [100] Carbon fibers @ 6 µm 250 µm toroid 4.5 µM [39] Au-Hg 100 µm disk 0.88 µM [39] Carbon Fibers @ 6 µm ~250 µm disk array 0.3-2 µM [30] Steel tubes 2 @ 4mm cylinder, 2mm gap 0.2-10 µM [67] Silver Paint 2 @ 2mm cylinder, 1mm gap 9.1-29 µM [66] Au-Hg amalgam 3 mm disk 0.5 µM [101] Carbon fibers @ 6 µm 1.1x10⁻³ mm2 area diskc 0.17-1.8 µM [29] Carbon 300 µm disk 0.15, 0.21 µM [102] Carbon fibers @ 6 µm 250 µm disk embedded with 0.3 µM [40] 100 µm Au-Hg disk Peptides and Proteins Au-Hg amalgam 100 µm OD disk 1.7 µM [103] PQQa entrapped in PPYb matrix on carbon 245 µm disk 0.134 µM [99] Au-Hg 100 µm disk 5 µM [39] Carbon fibers @ 6 µm ~250 µm disk array 4.8 pM [104] Carbon fibers @ 6 µm ~250 µm disk array 0.02 nM [105] Commercial Commercial 8, 11 µM [106] Carbon fiber 33µm OD 6 µMd [32] Commercial Commercial 0.5-2 µM [65] Au-Hg 100 µm disk embedded in 2.3 µM [40] electrode array Carbohydrates Silver Paint 2 @ 2mm cylinder, 1mm gap 13-31 µM [69] Copper 120 µm disk 0.65-1.8 µM [107] Copper 140 µm disk 1.0-4.0 µM [108] Copper 100 µm disk 0.62-1.4 µM [109] Copper 140 µm disk 0.003-0.007 µM [110] Oligonucleotides, Purine/Pyrimidine Bases Carbon fiber 32 µm cylinder 3,~5 nM [49-51] Carbon 300 µm disk 1.28-5.02 µM [111] Carbon 300 µm disk 0.157-0.767 µM [112] Inorganic Ions Steel tubes 2 @ 4mm cylinder, 2mm gap 18-160 nM [113] Silver Paint 2 @ 2 cm, varying gap 0.19-6.6 µMf [114-116] Steel tubes 2 @ 8mm cylinder N.R. [117] Aluminum foil 2 @ 2mm cylinder, varying gap N.R. [118] Aluminum foil 2 @ 10mm cylinder, varying gap N.R. [118] Steel tubes 2 @ 4mm, 1mm gap 31-125 nM [119] Steel tubes 2 @ 4mm, 1mm gap 55-175 nMf [120] Steel tubes 2 @ 10mm, 1mm gap 1.97-10.08 µMg [121] Steel tubes 2 @ 4mm, 1mm gap 0.89-2.7 µM [122]

Hanson, Pappas, Holland, West Virginia University Page 30 of 31
Silver paint 2 @ 7mm cylinder, 0.4 mm gap 0.156-7.41 µMf [123] Steel tubes 2 @ 2mm cylinder, 0.7 mm gap 1-2 µM [124] Commercial Commercial 0.339-0.480 µM [125] Commercial Commercial 0.3 µM [65] Steel tubes 2 @ 4mm, 1 mm gap 20-200 µg/Lh [126] Neurotransmitters Platinum 10 µm bands, 10 µm spacing 5 µM [127] Carbon Fiber 8 µm cylinder N.R. [128] Boron-doped diamond film 50 µm x (~. 3-.5) mm band 0.019-0.023 µM [129] Carbon Composite 75µm 0.03 µM [130] Platinum microdisk 25 µm disk 0.46 µM d [131] Gold 10µm bands, 10 µm spacing 13 µM [97] Boron doped diamond conical 9.8x10⁻⁴cm2 active SA 78 nM [132] AchE/ChO modifiede 200 µm disk 2 µM [133] AchE/ChO modifiede 25 µm cylinder 2 µM [133,134] Carbon fiber 5 µm cylinder N.R. [135] Carbon fiber 8 µm cylinder 0.4 µM [136] Phenolic Compounds Carbon 300 µm disk 0.9, 2 µMf [137] Carbon 350 µm disk N.R. [138] Carbon 300 µm disk 0.2 µM [139] Carbon 300 µm disk 0.9-3.0 µM [140] Carbon fiber 33 µm disk 0.03 µM [141] Carbon 300 µm disk 1.1, 1.7 µM [142] Carbon fibers @ 6 µm ~250 µm disk array 0.79, 1.3 µM [143] Carbon 300 µm disk 0.14-0.5 µM [144] Carbon 300 µm disk 0.49, 0.65 µM [145] Carbon 300 µm disk 0.059 µM [146] Drugs Carbon 300 µm disk 1.7 µM [142] Carbon fibers @ 6 µm ~250 µm disk array 0.05 µM [147] Carbon fibers @ 6 µm ~250 µm disk array 0.5 µM [148] Platinum 25 µm disk 0.1 µMf,h [149] Carbon 300 µm disk 0.2, 0.07 µM [150] Carbon fibers @ 6 µm ~250 µm disk array 0.5 µM [151] Biomarkers Carbon fibers @ 6 µm 250 µm toroid 2.4 µM [39] Au-Hg 100 µm disk 0.88, 5 µM [39] PQQa entrapped in PPYb matrix on carbon 245 µm disk 23 nM [99] Carbon fiber 11 µm cylinder 25 nM [152] Carbon fiber 7 µm cylinder 20 nM [153] Carbon fibers @ 6 µm ~200 µm disk array 0.76 µM [154] Carbon fibers @ 6 µm ~250 µm disk array 0.29 U/mLh [155] Carbon fibers @ 6 µm ~250 µm disk array 0.024 U/mLh [156] Other Gold 50 µm disk 0.1-0.4 µM [157] Brass tubes 2 @ 5mm, 2.5mm gap N.R. [70] Brass tubes 2 @ 2.5mm, 1.5mm gap N.R. [70] Carbon 300 µm disk 0.02 µM [158]

Hanson, Pappas, Holland, West Virginia University Page 31 of 31
Carbon fibers @ 6 µm ~250 µm disk array .0017 µM [159] Carbon 300 µm disk 2.0 µM [160] Carbon 500 µm disk 0.9-4 µM [161] Carbon 500 µm disk 1.7 µMf [162] N.R. not reported SA surface area a PQQ Pyrroloquinoline quinone b PPY Polypyrrole c Electrode dimensions in text conflict with referenced fabrication d Reference indicates LOD calculation using S/N = 2 e AchE/ChO Acetylcholineesterate/Cholineoxidase f reported in units of g/L, converted to M for comparision g reported in units of ppb, converted to µM for comparision h reported LOD conversion to µM not possible