Determination of nucleosides and nucleobases in different species of Cordyceps by capillary...
8
Journal of Pharmaceutical and Biomedical Analysis 50 (2009) 307–314 Contents lists available at ScienceDirect Journal of Pharmaceutical and Biomedical Analysis journal homepage: www.elsevier.com/locate/jpba Determination of nucleosides and nucleobases in different species of Cordyceps by capillary electrophoresis–mass spectrometry Feng-Qing Yang a , Liya Ge b,∗ , Jean Wan Hong Yong b , Swee Ngin Tan b,∗ , Shao-Ping Li a,∗∗ a Institute of Chinese Medical Sciences, University of Macau, Macau SAR, China b Natural Sciences and Science Education Academic Group, Nanyang Technological University, 1 Nanyang Walk, Singapore 637616, Singapore article info Article history: Received 5 March 2009 Received in revised form 23 April 2009 Accepted 29 April 2009 Available online 5 May 2009 Keywords: Capillary electrophoresis Mass spectrometry Nucleosides Nucleobases Cordyceps abstract In present study, a capillary electrophoresis–mass spectrometry (CE–MS) method was developed for the simultaneous analysis of 12 nucleosides and nucleobases including cytosine, adenine, guanine, cyti- dine, cordycepin, adenosine, hypoxanthine, guanosine, inosine, 2 -deoxyuridine, uridine and thymidine in natural and cultured Cordyceps using 5-chlorocytosine arabinoside as an internal standard (IS). The CE sep- aration conditions and MS parameters were optimized systematically for achieving good CE resolution and MS response of the investigated compounds. The optimum CE electrolyte was 100mM formic acid con- taining 10% (v/v) methanol. The optimum MS parameters were as follows: 75% (v/v) methanol containing 0.3% formic acid with a flow rate of 3 L/min was selected as the sheath liquid; the flow rate and temper- ature of drying gas were 6 L/min and 350 ◦ C, respectively. The optimized CE–MS method was successfully applied for the simultaneous determination of 12 nucleosides and nucleobases in natural and cultured Cordyceps. On the basis of quantitative results, the total content of nucleosides is much higher in cultured Cordyceps (9138 ± 4823 g/g for cultured C. sinensis; 3722 ± 1446 g/g for C. militaris) than in natural ones (2167 ± 412 g/g). However, the hypoxanthine (131 ± 47 g/g) and inosine (335 ± 90 g/g) are much higher in natural C. sinensis. Cordycepin, which is abundant in cultured C. militaris (2276.5 ± 842.6 g/g), is only found in natural C. sinensis with very low content and cannot be detected in the cultured ones. © 2009 Elsevier B.V. All rights reserved. 1. Introduction As a very precious traditional Chinese medicine (TCM) with the functions of replenishing kidney and soothing lung, Cordy- ceps has been used for treating a wide range of disorders, mainly including, fatigue, night sweating, hyposexualities, hyperglycemia, hyperlipidemia, asthemia after severe illness, respiratory disease, renal dysfunction and failure, arrhythmias and other heart diseases, and liver disease [1,2]. Nucleosides and nucleobases, involved in the regulation and modulation of various physiological processes in body through purinergic and/or pyrimidine receptors [3,4], are recognized to be the main bioactive components in Cordyceps [5]. Adenosine has been used as a marker for the quality control of C. sinensis in Chinese Pharmacopoeia [6]. To date, more than 10 nucleosides, nucleobases and their related compounds, including adenine, adenosine, cyto- sine, cytidine, uridine, guanine, guanosine, hypoxanthine, inosine, thymine, thymidine, 2 -deoxyuridine and cordycepin have been isolated and/or identified from Cordyceps [5]. Therefore, determi- ∗ Corresponding authors. Fax: +65 68969432. ∗∗ Corresponding author. Tel.: +853 83974692; fax: +853 28841358. E-mail addresses: [email protected] (S.N. Tan), [email protected] (S.-P. Li). nation of nucleosides and nucleobases is extremely important for the pharmacological study and quality control of Cordyceps and its products. Until now, several chromatographic methods such as thin layer chromatography (TLC) [7,8], high-performance liquid chromatog- raphy (HPLC) [9–11], liquid chromatography–mass spectrometry (LC–MS) [12–14] and ultra-performance liquid chromatography (UPLC) [15] have been applied for the analysis of nucleosides and related compounds in Cordyceps. In addition, capillary elec- trophoresis (CE) has steadily begun to play an increasing important role in various pharmaceutical analyses. Typically, CE has many attractive features for the separation and quantification such as simplicity, high separation efficiency, small sample volume require- ment and low organic solvent consumption [16–18]. To date, the nucleoside and nucleobase compounds in Cordyceps have been ana- lyzed by capillary zone electrophoresis (CZE) [19–24] and capillary electrochromatography (CEC) [25]. However, in the previous CE methods, only a limited number of nucleosides and nucleobases were determined in most cases [19–24]. Furthermore, these meth- ods were typically lacking of analytical specificity because of the low selectivity of UV detector, which resulted in identification and quantification difficulties for the analysis of real samples. Mass spectrometry (MS) provides a specific and selective tool, in which a selected ion can be used for the quantification analysis [18]. 0731-7085/$ – see front matter © 2009 Elsevier B.V. All rights reserved. doi:10.1016/j.jpba.2009.04.027
Transcript of Determination of nucleosides and nucleobases in different species of Cordyceps by capillary...
Db
Fa
b
a
ARRAA
KCMNNC
1
tcihra
mptbPasti
0d
Journal of Pharmaceutical and Biomedical Analysis 50 (2009) 307–314
Contents lists available at ScienceDirect
Journal of Pharmaceutical and Biomedical Analysis
journa l homepage: www.e lsev ier .com/ locate / jpba
etermination of nucleosides and nucleobases in different species of Cordycepsy capillary electrophoresis–mass spectrometry
eng-Qing Yanga, Liya Geb,∗, Jean Wan Hong Yongb, Swee Ngin Tanb,∗, Shao-Ping Lia,∗∗
Institute of Chinese Medical Sciences, University of Macau, Macau SAR, ChinaNatural Sciences and Science Education Academic Group, Nanyang Technological University, 1 Nanyang Walk, Singapore 637616, Singapore
r t i c l e i n f o
rticle history:eceived 5 March 2009eceived in revised form 23 April 2009ccepted 29 April 2009vailable online 5 May 2009
eywords:apillary electrophoresisass spectrometry
a b s t r a c t
In present study, a capillary electrophoresis–mass spectrometry (CE–MS) method was developed forthe simultaneous analysis of 12 nucleosides and nucleobases including cytosine, adenine, guanine, cyti-dine, cordycepin, adenosine, hypoxanthine, guanosine, inosine, 2′-deoxyuridine, uridine and thymidine innatural and cultured Cordyceps using 5-chlorocytosine arabinoside as an internal standard (IS). The CE sep-aration conditions and MS parameters were optimized systematically for achieving good CE resolution andMS response of the investigated compounds. The optimum CE electrolyte was 100 mM formic acid con-taining 10% (v/v) methanol. The optimum MS parameters were as follows: 75% (v/v) methanol containing0.3% formic acid with a flow rate of 3 �L/min was selected as the sheath liquid; the flow rate and temper-
◦
ucleosidesucleobasesordycepsature of drying gas were 6 L/min and 350 C, respectively. The optimized CE–MS method was successfullyapplied for the simultaneous determination of 12 nucleosides and nucleobases in natural and culturedCordyceps. On the basis of quantitative results, the total content of nucleosides is much higher in culturedCordyceps (9138 ± 4823 �g/g for cultured C. sinensis; 3722 ± 1446 �g/g for C. militaris) than in naturalones (2167 ± 412 �g/g). However, the hypoxanthine (131 ± 47 �g/g) and inosine (335 ± 90 �g/g) are muchhigher in natural C. sinensis. Cordycepin, which is abundant in cultured C. militaris (2276.5 ± 842.6 �g/g),
. sinen
is only found in natural C. Introduction
As a very precious traditional Chinese medicine (TCM) withhe functions of replenishing kidney and soothing lung, Cordy-eps has been used for treating a wide range of disorders, mainlyncluding, fatigue, night sweating, hyposexualities, hyperglycemia,yperlipidemia, asthemia after severe illness, respiratory disease,enal dysfunction and failure, arrhythmias and other heart diseases,nd liver disease [1,2].
Nucleosides and nucleobases, involved in the regulation andodulation of various physiological processes in body through
urinergic and/or pyrimidine receptors [3,4], are recognized to behe main bioactive components in Cordyceps [5]. Adenosine haseen used as a marker for the quality control of C. sinensis in Chineseharmacopoeia [6]. To date, more than 10 nucleosides, nucleobases
nd their related compounds, including adenine, adenosine, cyto-ine, cytidine, uridine, guanine, guanosine, hypoxanthine, inosine,hymine, thymidine, 2′-deoxyuridine and cordycepin have beensolated and/or identified from Cordyceps [5]. Therefore, determi-∗ Corresponding authors. Fax: +65 68969432.∗∗ Corresponding author. Tel.: +853 83974692; fax: +853 28841358.
E-mail addresses: [email protected] (S.N. Tan), [email protected] (S.-P. Li).
731-7085/$ – see front matter © 2009 Elsevier B.V. All rights reserved.oi:10.1016/j.jpba.2009.04.027
sis with very low content and cannot be detected in the cultured ones.© 2009 Elsevier B.V. All rights reserved.
nation of nucleosides and nucleobases is extremely important forthe pharmacological study and quality control of Cordyceps and itsproducts.
Until now, several chromatographic methods such as thin layerchromatography (TLC) [7,8], high-performance liquid chromatog-raphy (HPLC) [9–11], liquid chromatography–mass spectrometry(LC–MS) [12–14] and ultra-performance liquid chromatography(UPLC) [15] have been applied for the analysis of nucleosidesand related compounds in Cordyceps. In addition, capillary elec-trophoresis (CE) has steadily begun to play an increasing importantrole in various pharmaceutical analyses. Typically, CE has manyattractive features for the separation and quantification such assimplicity, high separation efficiency, small sample volume require-ment and low organic solvent consumption [16–18]. To date, thenucleoside and nucleobase compounds in Cordyceps have been ana-lyzed by capillary zone electrophoresis (CZE) [19–24] and capillaryelectrochromatography (CEC) [25]. However, in the previous CEmethods, only a limited number of nucleosides and nucleobaseswere determined in most cases [19–24]. Furthermore, these meth-
ods were typically lacking of analytical specificity because of thelow selectivity of UV detector, which resulted in identification andquantification difficulties for the analysis of real samples.Mass spectrometry (MS) provides a specific and selective tool, inwhich a selected ion can be used for the quantification analysis [18].
3 al and
Abpns
08 F.-Q. Yang et al. / Journal of Pharmaceutic
s a multidimensional analytical approach, CE–MS coupling com-
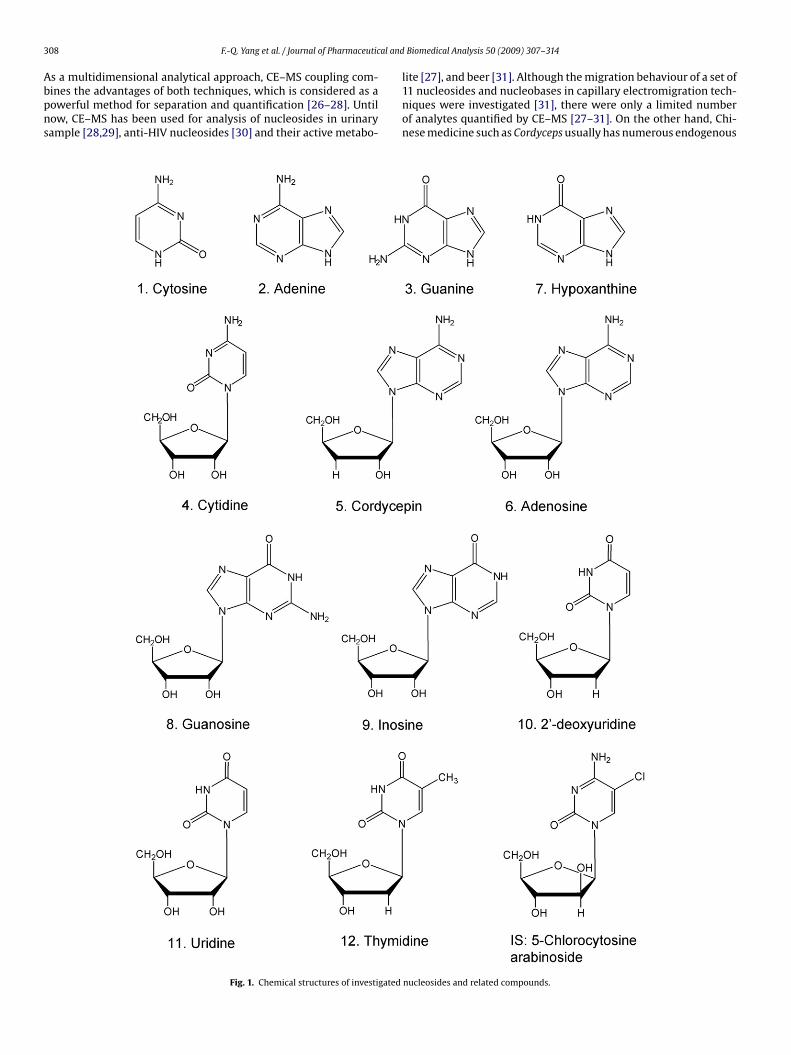
ines the advantages of both techniques, which is considered as aowerful method for separation and quantification [26–28]. Untilow, CE–MS has been used for analysis of nucleosides in urinaryample [28,29], anti-HIV nucleosides [30] and their active metabo-Fig. 1. Chemical structures of investigated
Biomedical Analysis 50 (2009) 307–314
lite [27], and beer [31]. Although the migration behaviour of a set of
11 nucleosides and nucleobases in capillary electromigration tech-niques were investigated [31], there were only a limited numberof analytes quantified by CE–MS [27–31]. On the other hand, Chi-nese medicine such as Cordyceps usually has numerous endogenousnucleosides and related compounds.
F.-Q. Yang et al. / Journal of Pharmaceutical and Biomedical Analysis 50 (2009) 307–314 309
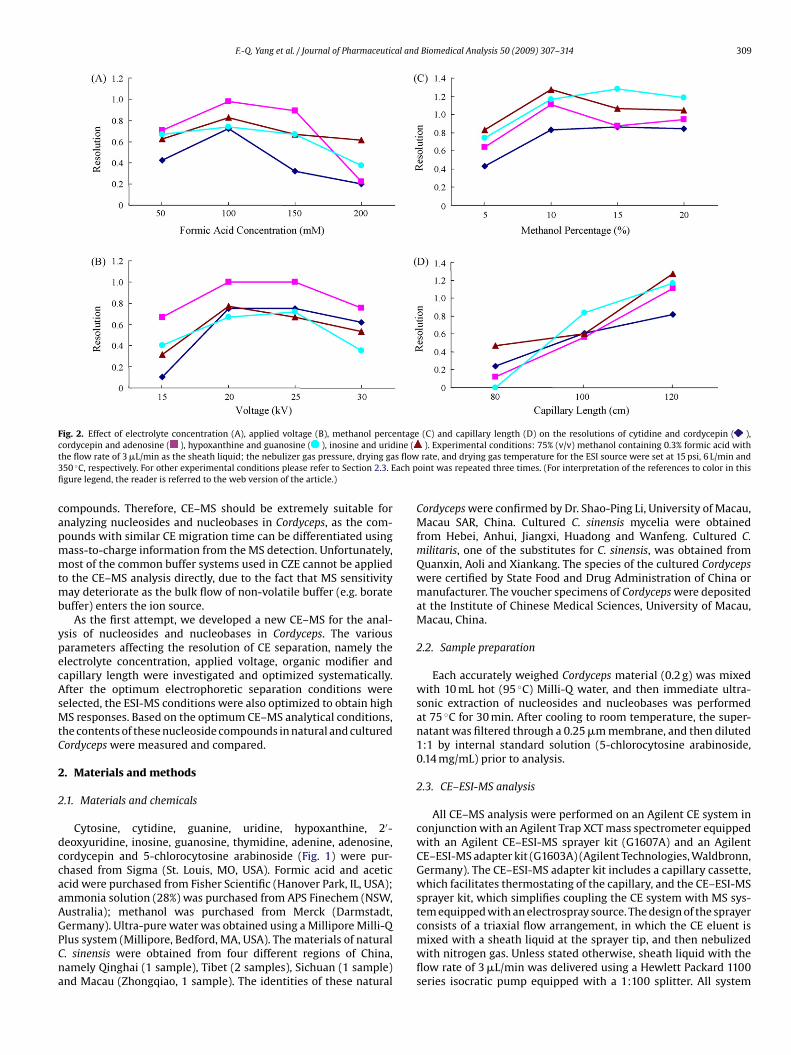
Fig. 2. Effect of electrolyte concentration (A), applied voltage (B), methanol percentage (C) and capillary length (D) on the resolutions of cytidine and cordycepin ( ),c ine (t s flow3 ach pfi
capmmtmb
ypecAsMtC
2
2
dccaaAGPCna
ordycepin and adenosine ( ), hypoxanthine and guanosine ( ), inosine and uridhe flow rate of 3 �L/min as the sheath liquid; the nebulizer gas pressure, drying ga50 ◦C, respectively. For other experimental conditions please refer to Section 2.3. Egure legend, the reader is referred to the web version of the article.)
ompounds. Therefore, CE–MS should be extremely suitable fornalyzing nucleosides and nucleobases in Cordyceps, as the com-ounds with similar CE migration time can be differentiated usingass-to-charge information from the MS detection. Unfortunately,ost of the common buffer systems used in CZE cannot be applied
o the CE–MS analysis directly, due to the fact that MS sensitivityay deteriorate as the bulk flow of non-volatile buffer (e.g. borate
uffer) enters the ion source.As the first attempt, we developed a new CE–MS for the anal-
sis of nucleosides and nucleobases in Cordyceps. The variousarameters affecting the resolution of CE separation, namely thelectrolyte concentration, applied voltage, organic modifier andapillary length were investigated and optimized systematically.fter the optimum electrophoretic separation conditions wereelected, the ESI-MS conditions were also optimized to obtain highS responses. Based on the optimum CE–MS analytical conditions,
he contents of these nucleoside compounds in natural and culturedordyceps were measured and compared.
. Materials and methods
.1. Materials and chemicals
Cytosine, cytidine, guanine, uridine, hypoxanthine, 2′-eoxyuridine, inosine, guanosine, thymidine, adenine, adenosine,ordycepin and 5-chlorocytosine arabinoside (Fig. 1) were pur-hased from Sigma (St. Louis, MO, USA). Formic acid and aceticcid were purchased from Fisher Scientific (Hanover Park, IL, USA);mmonia solution (28%) was purchased from APS Finechem (NSW,ustralia); methanol was purchased from Merck (Darmstadt,
ermany). Ultra-pure water was obtained using a Millipore Milli-Qlus system (Millipore, Bedford, MA, USA). The materials of natural. sinensis were obtained from four different regions of China,amely Qinghai (1 sample), Tibet (2 samples), Sichuan (1 sample)nd Macau (Zhongqiao, 1 sample). The identities of these natural). Experimental conditions: 75% (v/v) methanol containing 0.3% formic acid withrate, and drying gas temperature for the ESI source were set at 15 psi, 6 L/min and
oint was repeated three times. (For interpretation of the references to color in this
Cordyceps were confirmed by Dr. Shao-Ping Li, University of Macau,Macau SAR, China. Cultured C. sinensis mycelia were obtainedfrom Hebei, Anhui, Jiangxi, Huadong and Wanfeng. Cultured C.militaris, one of the substitutes for C. sinensis, was obtained fromQuanxin, Aoli and Xiankang. The species of the cultured Cordycepswere certified by State Food and Drug Administration of China ormanufacturer. The voucher specimens of Cordyceps were depositedat the Institute of Chinese Medical Sciences, University of Macau,Macau, China.
2.2. Sample preparation
Each accurately weighed Cordyceps material (0.2 g) was mixedwith 10 mL hot (95 ◦C) Milli-Q water, and then immediate ultra-sonic extraction of nucleosides and nucleobases was performedat 75 ◦C for 30 min. After cooling to room temperature, the super-natant was filtered through a 0.25 �m membrane, and then diluted1:1 by internal standard solution (5-chlorocytosine arabinoside,0.14 mg/mL) prior to analysis.
2.3. CE–ESI-MS analysis
All CE–MS analysis were performed on an Agilent CE system inconjunction with an Agilent Trap XCT mass spectrometer equippedwith an Agilent CE–ESI-MS sprayer kit (G1607A) and an AgilentCE–ESI-MS adapter kit (G1603A) (Agilent Technologies, Waldbronn,Germany). The CE–ESI-MS adapter kit includes a capillary cassette,which facilitates thermostating of the capillary, and the CE–ESI-MSsprayer kit, which simplifies coupling the CE system with MS sys-tem equipped with an electrospray source. The design of the sprayer
consists of a triaxial flow arrangement, in which the CE eluent ismixed with a sheath liquid at the sprayer tip, and then nebulizedwith nitrogen gas. Unless stated otherwise, sheath liquid with theflow rate of 3 �L/min was delivered using a Hewlett Packard 1100series isocratic pump equipped with a 1:100 splitter. All system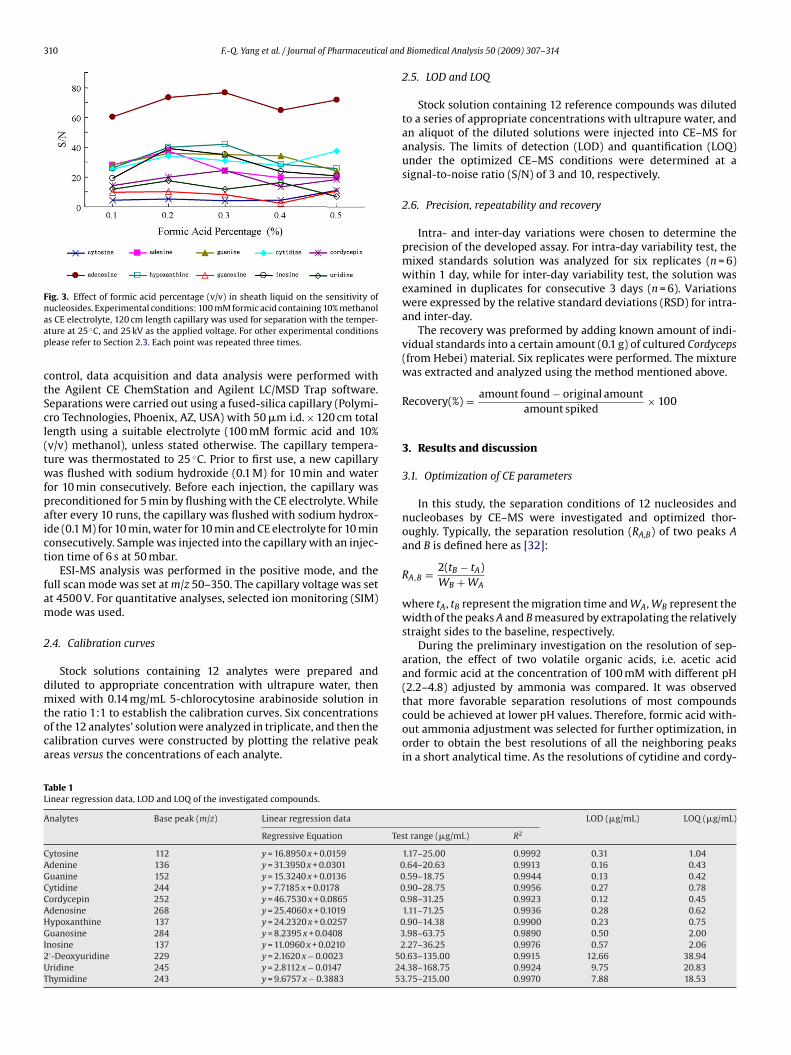
310 F.-Q. Yang et al. / Journal of Pharmaceutical and
Fig. 3. Effect of formic acid percentage (v/v) in sheath liquid on the sensitivity ofnaap
ctScl(twfpaict
fam
2
dmtoca
TL
A
CAGCCAHGI2UT
ucleosides. Experimental conditions: 100 mM formic acid containing 10% methanols CE electrolyte, 120 cm length capillary was used for separation with the temper-ture at 25 ◦C, and 25 kV as the applied voltage. For other experimental conditionslease refer to Section 2.3. Each point was repeated three times.
ontrol, data acquisition and data analysis were performed withhe Agilent CE ChemStation and Agilent LC/MSD Trap software.eparations were carried out using a fused-silica capillary (Polymi-ro Technologies, Phoenix, AZ, USA) with 50 �m i.d. × 120 cm totalength using a suitable electrolyte (100 mM formic acid and 10%v/v) methanol), unless stated otherwise. The capillary tempera-ure was thermostated to 25 ◦C. Prior to first use, a new capillaryas flushed with sodium hydroxide (0.1 M) for 10 min and water
or 10 min consecutively. Before each injection, the capillary wasreconditioned for 5 min by flushing with the CE electrolyte. Whilefter every 10 runs, the capillary was flushed with sodium hydrox-de (0.1 M) for 10 min, water for 10 min and CE electrolyte for 10 minonsecutively. Sample was injected into the capillary with an injec-ion time of 6 s at 50 mbar.
ESI-MS analysis was performed in the positive mode, and theull scan mode was set at m/z 50–350. The capillary voltage was sett 4500 V. For quantitative analyses, selected ion monitoring (SIM)ode was used.
.4. Calibration curves
Stock solutions containing 12 analytes were prepared andiluted to appropriate concentration with ultrapure water, thenixed with 0.14 mg/mL 5-chlorocytosine arabinoside solution in
he ratio 1:1 to establish the calibration curves. Six concentrationsf the 12 analytes’ solution were analyzed in triplicate, and then thealibration curves were constructed by plotting the relative peakreas versus the concentrations of each analyte.
able 1inear regression data, LOD and LOQ of the investigated compounds.
nalytes Base peak (m/z) Linear regression data
Regressive Equation Tes
ytosine 112 y = 16.8950 x + 0.0159denine 136 y = 31.3950 x + 0.0301 0uanine 152 y = 15.3240 x + 0.0136 0ytidine 244 y = 7.7185 x + 0.0178 0ordycepin 252 y = 46.7530 x + 0.0865 0denosine 268 y = 25.4060 x + 0.1019ypoxanthine 137 y = 24.2320 x + 0.0257 0uanosine 284 y = 8.2395 x + 0.0408 3
nosine 137 y = 11.0960 x + 0.0210 2′-Deoxyuridine 229 y = 2.1620 x − 0.0023 50ridine 245 y = 2.8112 x − 0.0147 24hymidine 243 y = 9.6757 x − 0.3883 53
Biomedical Analysis 50 (2009) 307–314
2.5. LOD and LOQ
Stock solution containing 12 reference compounds was dilutedto a series of appropriate concentrations with ultrapure water, andan aliquot of the diluted solutions were injected into CE–MS foranalysis. The limits of detection (LOD) and quantification (LOQ)under the optimized CE–MS conditions were determined at asignal-to-noise ratio (S/N) of 3 and 10, respectively.
2.6. Precision, repeatability and recovery
Intra- and inter-day variations were chosen to determine theprecision of the developed assay. For intra-day variability test, themixed standards solution was analyzed for six replicates (n = 6)within 1 day, while for inter-day variability test, the solution wasexamined in duplicates for consecutive 3 days (n = 6). Variationswere expressed by the relative standard deviations (RSD) for intra-and inter-day.
The recovery was preformed by adding known amount of indi-vidual standards into a certain amount (0.1 g) of cultured Cordyceps(from Hebei) material. Six replicates were performed. The mixturewas extracted and analyzed using the method mentioned above.
Recovery(%) = amount found − original amountamount spiked
× 100
3. Results and discussion
3.1. Optimization of CE parameters
In this study, the separation conditions of 12 nucleosides andnucleobases by CE–MS were investigated and optimized thor-oughly. Typically, the separation resolution (RA,B) of two peaks Aand B is defined here as [32]:
RA,B = 2(tB − tA)WB + WA
where tA, tB represent the migration time and WA, WB represent thewidth of the peaks A and B measured by extrapolating the relativelystraight sides to the baseline, respectively.
During the preliminary investigation on the resolution of sep-aration, the effect of two volatile organic acids, i.e. acetic acidand formic acid at the concentration of 100 mM with different pH(2.2–4.8) adjusted by ammonia was compared. It was observed
that more favorable separation resolutions of most compoundscould be achieved at lower pH values. Therefore, formic acid with-out ammonia adjustment was selected for further optimization, inorder to obtain the best resolutions of all the neighboring peaksin a short analytical time. As the resolutions of cytidine and cordy-LOD (�g/mL) LOQ (�g/mL)
t range (�g/mL) R2
1.17–25.00 0.9992 0.31 1.04.64–20.63 0.9913 0.16 0.43.59–18.75 0.9944 0.13 0.42.90–28.75 0.9956 0.27 0.78.98–31.25 0.9923 0.12 0.45
1.11–71.25 0.9936 0.28 0.62.90–14.38 0.9900 0.23 0.75.98–63.75 0.9890 0.50 2.00.27–36.25 0.9976 0.57 2.06.63–135.00 0.9915 12.66 38.94.38–168.75 0.9924 9.75 20.83.75–215.00 0.9970 7.88 18.53
F.-Q. Yang et al. / Journal of Pharmaceutical and Biomedical Analysis 50 (2009) 307–314 311
Table 2Short term and long term repeatability of the investigated compounds.
Analytes Short term(n = 6), RSD (%)
Long term (n = 6),RSD (%)
RPAa RtR RPA RtR
Cytosine 3.5 0.4 4.5 0.7Adenine 1.9 0.4 1.6 0.7Guanine 1.3 0.4 4.6 0.7Cytidine 2.7 0.3 4.5 0.4Cordycepin 3.6 0.3 4.0 0.4Adenosine 2.1 0.1 2.6 0.4Hypoxanthine 2.3 0.1 2.2 0.2Guanosine 2.1 0.2 1.7 0.2Inosine 2.1 0.3 2.4 0.42′-Deoxyuridine 2.7 0.4 4.9 0.8Uridine 2.3 0.4 4.3 0.8T
n
ciloowt1c1a
wtTttTaa
pptaksr(m
p1n2a(gl
3i2owac
/g)
ofth
ein
vest
igat
edco
mp
oun
ds
inn
atu
rala
nd
cult
ure
dCo
rdyc
eps.
Nat
ura
lC.s
inen
sis
Cu
ltu
red
C.si
nens
isC
ult
ure
dC.
mili
tari
s
Sich
uan
Qin
ghai
Zhon
gqia
oTi
bet
1Ti
bet
2A
nh
ui
Heb
eiH
uad
ong
Jian
gxi
Wan
fen
gA
oli
Qu
anxi
nX
ian
kan
g
44.
3±
1.3a
+b+
++
++
+12
9.3
±6.
9+
++
+10
0.8
±0.
94
4.2
±2.
679
.0±
3.2
34.8
±1.
383
.7±
2.5
601.
5±
18.3
212.
1±
8.1
70.7
±3.
675
5.7
±24
.228
3.0
±8.
719
1.0
±5.
6+
26.3
±1.
019
.2±
1.2
++
147.
4±
7.2
+50
6.8
±24
.611
7.8
±3.
2+
400.
4±
17.5
554.
5±
23.1
59.3
±2.
6+
+32
4.0
±4.
712
1.4
±5.
333
.2±
1.4
+14
6.3
±5.
216
2.7
±5.
422
7.3
±5.
274
.3±
3.0
821.
8±
25.8
105.
8±
4.0
++
35.7
±1.
532
.8±
1.8
++
++
–c–
––
–32
40.9
±53
.316
82.9
±55
.119
05.7
±4
8.0
431.
2±
2.5
309.
0±
3.9
263.
7±
8.9
232.
7±
7.7
353.
0±
16.2
1197
.8±
49.
822
51.6
±10
8.0
276
4.9
±11
9.8
2945
.0±
71.1
5569
.6±
54.8
279.
9±
14.2
534.
1±
25.4
1452
.0±
22.5
e18
6.1
±7.
010
8.0
±1.
96
4.5
±2.
713
4.7
±5.
216
2.0
±4.
772
.9±
4.7
65.6
±4.
2+
++
++
+34
3.8
±12
.739
9.9
±10
.119
6.9
±5.
927
8.7
±3.
540
3.7
±13
.420
63.5
±52
.326
51.2
±88
.723
41.1
±93
.434
09.9
±12
3.3
4304
.3±
165.
626
0.1
±8.
717
0.6
±5.
140
2.5
±15
.74
44.
8±
14.7
401.
3±
10.6
215.
1±
6.1
311.
4±
8.4
300.
3±
10.3
+51
4.3
±22
.8–
++
––
–in
e+
–+
++
++
++
++
++
1170
.4±
40.1
932.
5±
30.8
767.
2±
34.0
1236
.8±
31.0
1142
.7±
31.7
1346
.1±
38.5
1604
.6±
48.
212
78.5
±15
.843
68.
8±
61.1
6938
.0±
208.
9+
+14
98.7
±4
9.5
––
––
++
––
++
––
–
ftri
pli
cate
s±
SD.
lim
its
ofqu
anti
fica
tion
.bl
e.
hymidine 2.4 0.4 3.8 0.8
a RPA, relative peak area to internal standard; RtR, relative retention time to inter-al standard.
epin, cordycepin and adenosine, hypoxanthine and guanosine, andnosine and uridine were the poorest as compared to other ana-ytes, they were chosen as optimization markers. Then, the effectf different concentrations including 50, 100, 150 and 200 mMf formic acid on the separation of nucleosides and nucleobasesas investigated with 25 kV separation voltage, 25 ◦C capillary
emperature and 120 cm capillary length. As shown in Fig. 2A,00 mM formic acid concentration was found to be a suitableompromise in resolving all of the tested compounds. Therefore,00 mM was selected as the optimized concentration of formiccid.
For the applied voltage, 15, 20, 25 and 30 kV were investigated,hile the formic acid concentration was kept at 100 mM, capillary
emperature was set at 25 ◦C with the length of capillary as 120 cm.he voltage of 20 and 25 kV had similar effect on the resolutions ofhe investigated compounds, but compared to 20 kV, the analyticalime was reduced when 25 kV was used as applied voltage (Fig. 2B).hus, a voltage of 25 kV was considered to be the suitable voltage,s the 12 nucleosides and nucleobases were well separated withinshorter analytical time.
As organic modifier (e.g. methanol) can improve the resolution,eak shape and baseline separation of some analytes [33], differentercentages of methanol (5%, 10%, 15% and 20%, v/v) in the elec-rolyte were also investigated, when the formic acid concentration,pplied voltage, capillary temperature and capillary length wereept at 100 mM, 25 kV, 25 ◦C and 120 cm, respectively. The resultshowed that the effect of the methanol on the resolutions wereelatively higher when the percentage of methanol reached 10%Fig. 2C). Consequently, 10% (v/v) methanol was selected as organic
odifier.The separation of compounds should be based on the appro-
riate length of capillary, thus different lengths of capillary (80,00 and 120 cm) were tested for the separation of nucleosides anducleobases, when 100 mM formic acid containing 10% methanol,5 ◦C, and 25 kV were used as CE electrolyte, capillary temperaturend applied voltage, respectively. As it can be seen from the resultsFig. 2D), long capillary (120 cm) led to better resolutions of investi-ated compounds, and was finally chosen as the optimum capillaryength.
In addition, different capillary temperatures (15, 20, 25 and0 ◦C) were also investigated with 100 mM formic acid contain-
ng 10% methanol as CE electrolyte, 120 cm as capillary length and5 kV as the applied voltage (data not shown). As the temperature
f the capillary had no significant effect on the separation, 25 ◦Cas selected. Considering both the resolutions of 12 compoundsnd total analytical time, the optimum conditions of CE were con-luded to be: 100 mM formic acid containing 10% (v/v) methanol as Ta
ble
3C
onte
nts
(�g
An
alyt
es
Cyt
osin
eA
den
ine
Gu
anin
eC
ytid
ine
Cor
dyc
epin
Ad
enos
ine
Hyp
oxan
thin
Gu
anos
ine
Inos
ine
2′ -D
eoxy
uri
dU
rid
ine
Thym
idin
e
aA
vera
geo
bU
nd
erth
ec
Un
dete
cta
312 F.-Q. Yang et al. / Journal of Pharmaceutical and Biomedical Analysis 50 (2009) 307–314
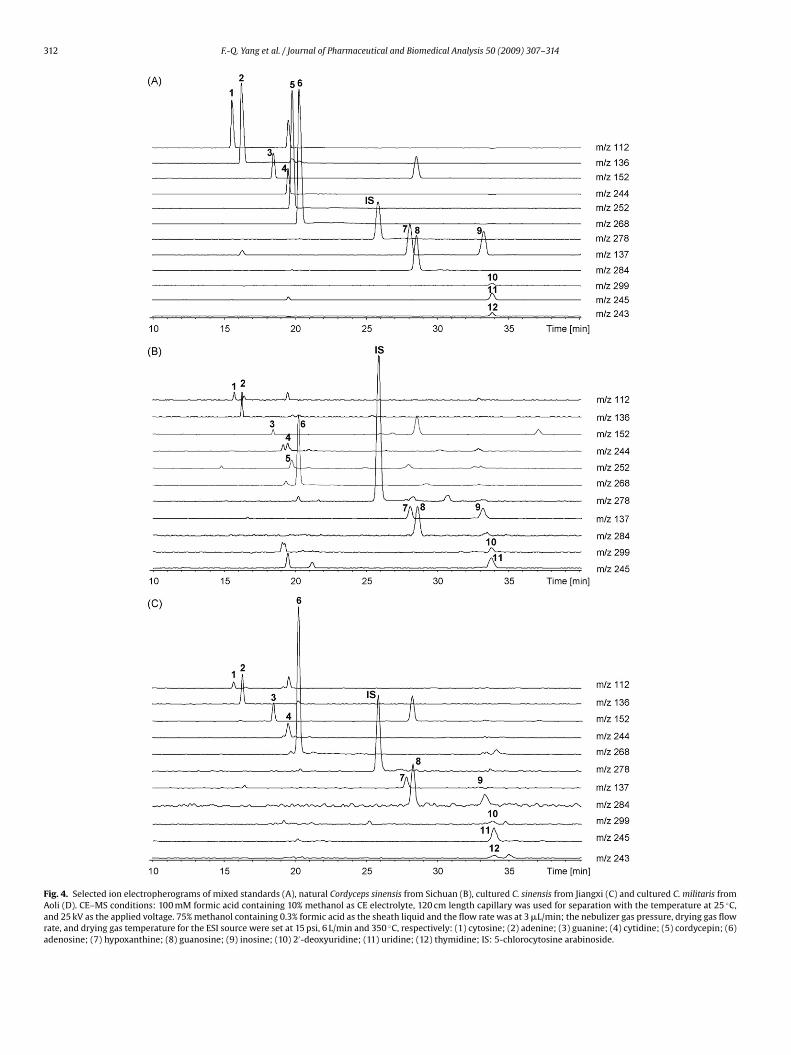
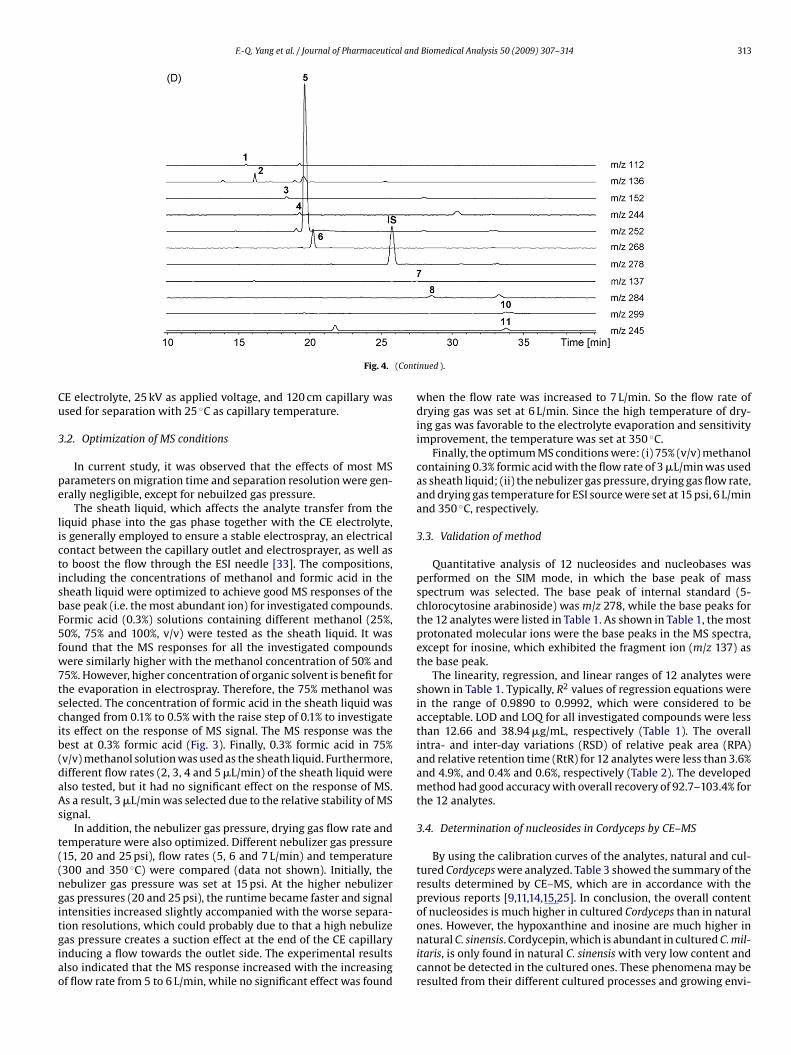
Fig. 4. Selected ion electropherograms of mixed standards (A), natural Cordyceps sinensis from Sichuan (B), cultured C. sinensis from Jiangxi (C) and cultured C. militaris fromAoli (D). CE–MS conditions: 100 mM formic acid containing 10% methanol as CE electrolyte, 120 cm length capillary was used for separation with the temperature at 25 ◦C,and 25 kV as the applied voltage. 75% methanol containing 0.3% formic acid as the sheath liquid and the flow rate was at 3 �L/min; the nebulizer gas pressure, drying gas flowrate, and drying gas temperature for the ESI source were set at 15 psi, 6 L/min and 350 ◦C, respectively: (1) cytosine; (2) adenine; (3) guanine; (4) cytidine; (5) cordycepin; (6)adenosine; (7) hypoxanthine; (8) guanosine; (9) inosine; (10) 2′-deoxyuridine; (11) uridine; (12) thymidine; IS: 5-chlorocytosine arabinoside.
F.-Q. Yang et al. / Journal of Pharmaceutical and Biomedical Analysis 50 (2009) 307–314 313
(Cont
Cu
3
pe
lictisbF5fw7tscib(daAs
t((ngitgiao
Fig. 4.
E electrolyte, 25 kV as applied voltage, and 120 cm capillary wassed for separation with 25 ◦C as capillary temperature.
.2. Optimization of MS conditions
In current study, it was observed that the effects of most MSarameters on migration time and separation resolution were gen-rally negligible, except for nebuilzed gas pressure.
The sheath liquid, which affects the analyte transfer from theiquid phase into the gas phase together with the CE electrolyte,s generally employed to ensure a stable electrospray, an electricalontact between the capillary outlet and electrosprayer, as well aso boost the flow through the ESI needle [33]. The compositions,ncluding the concentrations of methanol and formic acid in theheath liquid were optimized to achieve good MS responses of thease peak (i.e. the most abundant ion) for investigated compounds.ormic acid (0.3%) solutions containing different methanol (25%,0%, 75% and 100%, v/v) were tested as the sheath liquid. It wasound that the MS responses for all the investigated compoundsere similarly higher with the methanol concentration of 50% and5%. However, higher concentration of organic solvent is benefit forhe evaporation in electrospray. Therefore, the 75% methanol waselected. The concentration of formic acid in the sheath liquid washanged from 0.1% to 0.5% with the raise step of 0.1% to investigatets effect on the response of MS signal. The MS response was theest at 0.3% formic acid (Fig. 3). Finally, 0.3% formic acid in 75%v/v) methanol solution was used as the sheath liquid. Furthermore,ifferent flow rates (2, 3, 4 and 5 �L/min) of the sheath liquid werelso tested, but it had no significant effect on the response of MS.s a result, 3 �L/min was selected due to the relative stability of MSignal.
In addition, the nebulizer gas pressure, drying gas flow rate andemperature were also optimized. Different nebulizer gas pressure15, 20 and 25 psi), flow rates (5, 6 and 7 L/min) and temperature300 and 350 ◦C) were compared (data not shown). Initially, theebulizer gas pressure was set at 15 psi. At the higher nebulizeras pressures (20 and 25 psi), the runtime became faster and signalntensities increased slightly accompanied with the worse separa-
ion resolutions, which could probably due to that a high nebulizeas pressure creates a suction effect at the end of the CE capillarynducing a flow towards the outlet side. The experimental resultslso indicated that the MS response increased with the increasingf flow rate from 5 to 6 L/min, while no significant effect was foundinued ).
when the flow rate was increased to 7 L/min. So the flow rate ofdrying gas was set at 6 L/min. Since the high temperature of dry-ing gas was favorable to the electrolyte evaporation and sensitivityimprovement, the temperature was set at 350 ◦C.
Finally, the optimum MS conditions were: (i) 75% (v/v) methanolcontaining 0.3% formic acid with the flow rate of 3 �L/min was usedas sheath liquid; (ii) the nebulizer gas pressure, drying gas flow rate,and drying gas temperature for ESI source were set at 15 psi, 6 L/minand 350 ◦C, respectively.
3.3. Validation of method
Quantitative analysis of 12 nucleosides and nucleobases wasperformed on the SIM mode, in which the base peak of massspectrum was selected. The base peak of internal standard (5-chlorocytosine arabinoside) was m/z 278, while the base peaks forthe 12 analytes were listed in Table 1. As shown in Table 1, the mostprotonated molecular ions were the base peaks in the MS spectra,except for inosine, which exhibited the fragment ion (m/z 137) asthe base peak.
The linearity, regression, and linear ranges of 12 analytes wereshown in Table 1. Typically, R2 values of regression equations werein the range of 0.9890 to 0.9992, which were considered to beacceptable. LOD and LOQ for all investigated compounds were lessthan 12.66 and 38.94 �g/mL, respectively (Table 1). The overallintra- and inter-day variations (RSD) of relative peak area (RPA)and relative retention time (RtR) for 12 analytes were less than 3.6%and 4.9%, and 0.4% and 0.6%, respectively (Table 2). The developedmethod had good accuracy with overall recovery of 92.7–103.4% forthe 12 analytes.
3.4. Determination of nucleosides in Cordyceps by CE–MS
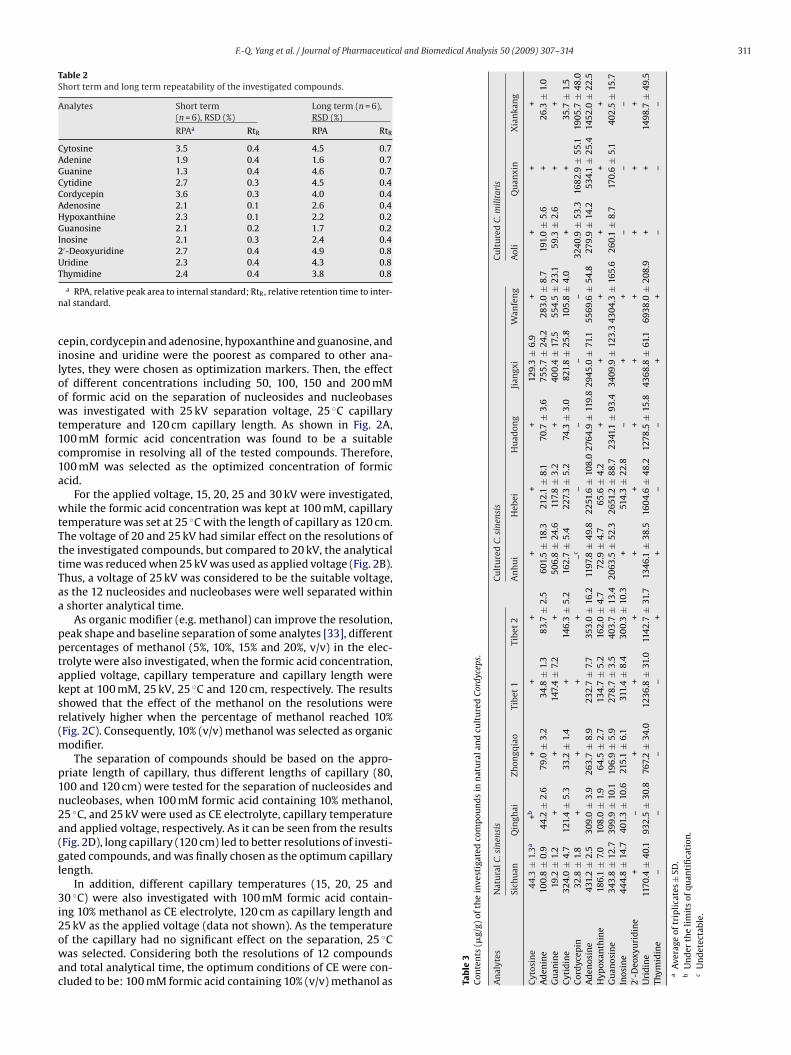
By using the calibration curves of the analytes, natural and cul-tured Cordyceps were analyzed. Table 3 showed the summary of theresults determined by CE–MS, which are in accordance with theprevious reports [9,11,14,15,25]. In conclusion, the overall contentof nucleosides is much higher in cultured Cordyceps than in natural
ones. However, the hypoxanthine and inosine are much higher innatural C. sinensis. Cordycepin, which is abundant in cultured C. mil-itaris, is only found in natural C. sinensis with very low content andcannot be detected in the cultured ones. These phenomena may beresulted from their different cultured processes and growing envi-
3 al and
rcwmfets
uCsbsbodweaaTbtnpwawopetHnbn
4
tncaccw
A
TU
[
[
[[[
[
[[[
[[
[[
[
[
[[
[
[37] K. Koshida, J. Harmenberg, U. Stendahl, B. Wahren, E. Borgstrom, L. Helstrom,
14 F.-Q. Yang et al. / Journal of Pharmaceutic
onments. As the cultured samples were grown in nutrient-richonditions and matured in a very short period of time, the fungiere vigorous and produced more nucleosides, which are the keyaterials to produce DNA. Furthermore, the synthesis pathways
or inosine and its base hypoxanthine, and cordycepin are differ-nt form the normal nucleosides (adenosine, guanosine, uridine,hymidine, etc.). Therefore, variation of the enzymes in differentamples produced difference in the content of those compounds.
As shown in Fig. 4, the nucleosides and nucleobases werenequivocal identified by MS detection and their migration times.E–MS showed the advantages on the separation of some nucleo-ides and nucleobases that cannot be separated in previous reportsy HPLC or LC–MS, such as hypoxanthine and guanine [14], adeno-ine and adenine [9]. Therefore, it is obviously that CE–MS coulde an alternative method for HPLC or LC–MS for the separationf nucleosides and nucleobases. However, the separation of 2′-eoxyuridine, uridine and thymidine is a problem for CE analysis,hich can be compensated by MS detection in current study. Nev-
rtheless, more work is still needed to further improve on the LODnd LOQ of the present CE–MS approach for measuring nucleosidesnd nucleobases present in traditional Chinese medicinal materials.he higher LOD of the current CE–MS method will be compensatedy further developments of new CE technology (e.g. on-columnransition of capillary isotachophoresis to CZE [34]) and/or byovel on-line pre-concentration method (e.g. field-amplified sam-le stacking [35]) in future works. It is expected that combinedith pre-concentration techniques the CE–MS method can also be
pplied for the determination of nucleosides and nucleobases on aide range of biological fluids, such as urine and blood as the levels
f nucleosides and their metabolic compounds have been pro-osed as markers for diagnosis of cancers, AIDS, myocardial cellularnergy status, diseases progress and therapy responses [36–39]. Onhe other hand, CEC, a rapidly evolving hybrid technique betweenPLC and CE, had demonstrated its advantages on the analysis ofucleosides and nucleobases in Cordyceps [25]. Therefore, it woulde interesting to couple the CEC approach to MS for the analysis ofucleosides and nucleobases in the future.
. Conclusion
CE–MS, to the best of our knowledge, is reported for the firstime as an analytical tool for simultaneous determination of the 12ucleosides and nucleobases. The effectiveness of this new analyti-al CE–MS method was evaluated by the unequivocal identificationnd quantification of nucleosides and nucleobases in natural andultured Cordyceps. The results presented in current work wereomparable with the more established techniques, such as LC–MS,ith lower sample and solvent consumption.
cknowledgements
The research was supported grants from Macao Science andechnology Development Fund (077/2005/A and 028/2006/A2),niversity of Macau (RG086/04-05S) to S.-P. Li. We are grateful to
[
[
Biomedical Analysis 50 (2009) 307–314
Angela Ah Buan LIM-Ang and Anna Say Guek YEE-Lee from NaturalSciences and Science Education Academic Group, Nanyang Techno-logical University for their technical assistance.
References
[1] J.S. Zhu, G.M. Halpern, K. Johns, J. Altern. Complement. Med. 4 (1998) 289–303.[2] J.S. Zhu, G.M. Halpern, K. Johns, J. Altern. Complement. Med. 4 (1998) 429–457.[3] V. Ralevic, G. Burnstock, Pharmacol. Rev. 50 (1998) 413–492.[4] K.A. Jacobson, M.F. Jarvis, M. Williams, J. Med. Chem. 45 (2002) 4057–4093.[5] S.P. Li, F.-Q. Yang, K.W.K. Tsim, J. Pharm. Biomed. Anal. 41 (2006) 1571–1584.[6] P.R.C. The Pharmacopoeia Commission of (Ed.), Pharmacopoeia of the People’s
Republic of China, vol. 1, Chemical Industry Publishing House, Beijing, 2005, pp.75–76.
[7] L.L. Mi, S.W. Zhang, J.J. Sun, Z.H. Wang, X.K. Hong, Chin. Trad. Pat. Med. 25 (2003)402–405.
[8] M.L. Hao, Drug Stand. Chin. 4 (2003) 340–341.[9] S.P. Li, P. Li, C.M. Lai, Y.X. Gong, K.K.W. Kan, T.T.X. Dong, K.W.K. Tsim, Y.T. Wang,
J. Chromatogr. A 1036 (2004) 239–243.[10] M.S. Shiao, Z.N. Wang, L.J. Lin, J.Y. Lien, J.J. Wang, Bot. Bull. Acad. Sin. 35 (1994)
261–267.[11] L. Yu, J. Zhao, S.P. Li, H. Fan, M. Hong, Y.T. Wang, Q. Zhu, J. Sep. Sci. 29 (2006)
953–958.12] F.Q. Guo, A. Li, L.F. Huang, Y.Z. Liang, B.M. Chen, J. Pharm. Biomed. Anal. 40
(2006) 623–630.[13] L.F. Huang, Y.Z. Liang, F.Q. Guo, Z.F. Zhou, B.M. Chen, J. Pharm. Biomed. Anal. 33
(2003) 1155–1162.[14] H. Fan, S.P. Li, J.J. Xiang, C.M. Lai, F.Q. Yang, J.L. Gao, Y.T. Wang, Anal. Chim. Acta
567 (2006) 218–228.[15] F.Q. Yang, J. Guan, S.P. Li, Talanta 73 (2007) 269–273.[16] L. Ge, S. Tan, J.W. Yong, S.N. Tan, Electrophoresis 27 (2006) 4779–4791.[17] P. Li, S.P. Li, Y.T. Wang, Electrophoresis 27 (2006) 4808–4819.[18] A. Gaspar, M. Englmann, A. Fekete, M. Harir, P. Schmitt-Kopplin, Electrophoresis
29 (2008) 66–79.[19] S.P. Li, P. Li, T.T.X. Dong, K.W.K. Tsim, Electrophoresis 22 (2001) 144–150.20] Y.J. Sun, J.Y. Ling, H. Zhan, P. Lv, C.Y. Sun, C.K. Zhang, J. Shangdong Univ. 37 (2002)
345–348.21] J.H. Ruan, Y.Q. Sun, J. Shenyang Pharm. Univ. 19 (2002) 112–114.22] X.R. Hou, L.J. Luan, Y.Y. Cheng, Chin. J. Chin. Mater. Med. 30 (2005) 447–449.23] J.Y. Ling, Y.J. Sun, H. Zhang, P. Lv, C.K. Zhang, J. Biosci. Bioeng. 94 (2002) 371–
374.24] Y.X. Gong, S.P. Li, P. Li, J.J. Liu, Y.T. Wang, J. Chromatogr. A 1055 (2004) 215–
221.25] F.Q. Yang, S.P. Li, P. Li, Y.T. Wang, Electrophoresis 28 (2007) 1681–1688.26] M.L. Gross, The Encyclopedia of Mass Spectrometry, Elsevier Science, 2003.27] X. Cahours, H. Dessans, P. Morin, M. Dreux, L. Agrofoglio, J. Chromatogr. A 895
(2000) 101–109.28] S.F. Wang, X.P. Zhao, Y. Mao, Y.Y. Cheng, J. Chromatogr. A 1147 (2007) 254–260.29] H.M. Liebich, S. Müller-Hagedorn, F. Klaus, K. Meziane, K.R. Kim, A. Fricken-
schmidt, B. Kammerer, J. Chromatogr. A 1071 (2005) 271–275.30] X. Cahours, P. Morin, H. Dessans, L. Agrofoglio, Electrophoresis 23 (2002) 88–92.31] M. Haunschmidt, W. Buchberger, C.W. Klampfl, J. Chromatogr. A 1213 (2008)
88–92.32] The United States Pharmacopoeia, 25th Asian ed., United States Pharmacopoeial
Convention, Rockville, MD, 2002, pp. 1990–1991.33] C.S. Liu, X.F. Li, D. Pinto, E.B. Hansen, C.E. Cerniglia, N.J. Dovichi, Electrophoresis
19 (1998) 3183–3189.34] T. Rasmuson, G.R. Bjork, Acta Oncol. 34 (1995) 61–67.35] X. Fang, W. Wang, L. Yang, K. Chandrasekaran, T. Kristian, B.M. Balgley, C.S. Lee,
Electrophoresis 29 (2008) 2215–2223.36] M. Lagarrigue, A. Bossee, A. Begos, N. Delaunay, A. Varenne, P. Gareil, B. Bellier,
J. Chromatogr. A 1178 (2008) 239–247.
Urol. Res. 13 (1985) 213–218.38] R.W. Trewyn, R. Glaser, D.R. Kelly, D.G. Jackson, W.P. Graham, Cancer Detect.
Prev. 49 (1982) 2513–2517.39] C.C. Marvel, J. Del Rowe, E.G. Bremer, J.R. Moskal, Mol. Chem. Neuropathol. 21
(1994) 353–368.