Food capillary suspensions
99
Food capillary suspensions zur Erlangung des akademischen Grades eines DOKTORS DER INGENIEURWISSENSCHAFTEN (Dr.-Ing.) der Fakultät für Chemieingenieurwesen und Verfahrenstechnik des Karlsruher Institut für Technologie (KIT) genehmigte DISSERTATION von Dipl.-Ing. Susanne Elisabeth Wollgarten aus Karlsruhe Referent: Prof. Dr. Norbert Willenbacher Korreferent: Prof. Dr. Peter Fischer Tag der mündlichen Prüfung: 17. August 2015
-
Upload
khangminh22 -
Category
Documents
-
view
1 -
download
0
Transcript of Food capillary suspensions

Food capillary suspensions
zur Erlangung des akademischen Grades eines
DOKTORS DER INGENIEURWISSENSCHAFTEN (Dr.-Ing.)
der Fakultät für Chemieingenieurwesen und Verfahrenstechnik des
Karlsruher Institut für Technologie (KIT)
genehmigte
DISSERTATION
von
Dipl.-Ing. Susanne Elisabeth Wollgarten
aus Karlsruhe
Referent: Prof. Dr. Norbert Willenbacher
Korreferent: Prof. Dr. Peter Fischer
Tag der mündlichen Prüfung: 17. August 2015
simianer
Schreibmaschinentext

simianer
Schreibmaschinentext
DOI: 10.5445/IR/1000049292
simianer
Schreibmaschinentext
simianer
Schreibmaschinentext
simianer
Schreibmaschinentext
simianer
Schreibmaschinentext
simianer
Schreibmaschinentext
simianer
Schreibmaschinentext
simianer
Schreibmaschinentext
simianer
Schreibmaschinentext

Acknowledgements
Acknowledgements
First of all I would like to thank my supervisor Prof. Dr. Norbert Willenbacher for his encouraging
support and advice throughout this work.
I am grateful to Prof. Dr. Peter Fischer for being the second reviewer even everything was a bit on
short notice.
I also want to thank Dr. Erin Koos and Dr. Bernhard Hochstein for their help and fruitful discussions
that highly contributed to the success of this thesis.
Thanks to Sebastian Jaksch and Henrich Frielinghaus from Jülich Center of Neutron Sciences for
giving the possibility to conduct SANS measurements and all their help with the data as well as Irene
Natalia for her help with the measurements.
I acknowledge the advice from Daniel Kadow (August Storck KG). Without his help I would not have
been able to suppress the autofluorescence of the cocoa particles.
I thank my students Annkathrin Siegert, Benjamin Erb, Eva Donner, Vanessa Gall, Vera Schmid,
Julian Ungerer, Walter Oswald, Helena Melzer, Nico Leister and especially Ceren Yuce for doing
excellent work in the lab conducting lots of experiments that are used in this thesis.
I was really lucky to have wonderful colleges during my time at the Institute for Mechanical Process
Engineering and Mechanic. Special thanks go to Clara Weis, Monica Schneider, Dirk Sachsenheimer
and Leon Jampolski, for a fantastic time, all your guidance and help in scientific, personal or culinary
concerns.
Finally, I want to thank my parents and my husband Christopher for all their support during the last
years.
simianer
Schreibmaschinentext
simianer
Schreibmaschinentext

Abstract
Abstract
When a small amount of a secondary immiscible fluid is added to a particle suspension, the
rheological properties of the suspension can alter dramatically. The addition of the secondary liquid
can create a sample-spanning particle network due to capillary bridges formed between the particles,
inducing a transition from a fluid-like to a gel-like state. This results in an increase in yield stress and
low shear viscosity up to several orders of magnitude. Accordingly, also the stability of the
suspensions alters dramatically. Particles that are stabilized in a sample-spanning network due to
capillary bridges do not sediment, even after long term storage. Capillary suspensions can be created
whether the secondary fluid preferentially wets the particles or not. Mixtures where the secondary
fluid is the better wetting liquid (three phase contact angle is smaller than 90°) are referred to as
pendular state suspensions. If the bulk fluid is preferentially wetting, the contact angle is greater than
90° and the suspension is in the so-called capillary state. Capillary suspensions can be used in a wide
range of applications, including processing of porous ceramics, preparation of crack free films or the
formulation of novel food products. This latter topic is the focus of this thesis.
The present thesis is divided into two parts. First, oil continuous capillary suspensions are studied. It
will be discussed how capillary forces can be used to control the stability and flow behavior of food
products. Simple model systems of particles in oil suspensions are investigated to determine the
parameters that affect the network formation and the resulting rheological properties. For this, two
food systems were chosen: corn starch and cocoa particles in vegetable oil. Water is used as the
secondary liquid in both admixtures. Food suspensions were compared to simpler model systems made
from CaCO3 and polyvinylchloride (PVC) particles.
It is shown that capillary suspensions offer new opportunities for the formulation of food products. A
clear transition from a liquid or very weak gel with no secondary phase added, to a strong gel-like
state when water is added to the oil continuous suspensions made from cocoa or starch granules can be
seen. This indicates that strong capillary forces act in this food model systems as has been reported
earlier for other suspensions.
The wetting behavior of the particles with water and oil has been studied using confocal microscopy as
well as contact angle measurements using the sessile drop method. Various rheological parameters of
capillary suspensions are documented including oscillatory and steady rotational rheometry data.
Texture modifications can be done by adapting the amount of the secondary fluid and the wetting
properties like the contact angle the two fluids form with the particles. On the other hand, the
secondary fluid viscosity has no influence on formation and flow behavior of capillary suspensions.
The adsorption of water by particles from natural sources during storage can dramatically influence
the properties of oil continuous suspensions since capillary bridges form spontaneously from adsorbed
simianer
Schreibmaschinentext

Abstract
water layers. Suspension rheology is similar if the water is absorbed prior to suspension preparation by
conditioning the particles or added to the suspension afterwards. These findings lead to the conclusion
that the formation of these capillary suspensions is energetically favorable and not controlled by
mechanical energy input.
Capillary bridges offer an additional advantage to chocolate or other temperature sensitive systems by
increasing the heat stability of the products. This stability has been documented via optical
experiments and was also measured using rheological setups. When water is incorporated to a model
chocolate made from cocoa butter and cocoa particles, the blocks preserve their shape during one hour
at 50°C. Pure model chocolate however melts after 30 minutes. This heat stability is due to the particle
network created with the addition of water. The cocoa butter is trapped in between the formed network
and the shape can be maintained. Increased volume fraction of secondary fluid as well as higher
particle loading lead to a more stable product.
In the second part, I focus on the flow behavior of aqueous cocoa suspensions and how this can be
adjusted by temperature or addition of a secondary liquid. A thorough rheological characterization is
provided and potential mechanisms causing particle network formation are discussed. For this
particles have been extracted with various solvents and the influence of added secondary fluid on the
flow behavior is investigated.
When cocoa particles are dispersed in water and stored at a temperature of 30°C, a network of
particles is formed which leads to an increase in low shear viscosity and a gel-like, creamy texture.
Heating the sample further up to 40°C or above results in a network collapse and the suspension
behaves fluid-like again. The critical factor controlling this behavior is the residual cocoa butter in the
particles. At 30°C, the cocoa butter is in a semicrystalline state and bridges of this cocoa butter
between the particles are formed via a diffusion process (similar to sintering) or just by sticking
together upon contact due to cocoa butter that has leaked to the surface. The cocoa butter is completely
liquid at 40°C and partly forms emulsion droplets in the water phase that are not connected to the
particles as shown via confocal imaging. The key role of cocoa butter for network formation, texture
and flow of the aqueous suspensions has been proven by extracting it from the particles. Particles,
where the fat has been removed show no temperature dependent change in flow behavior.
Adding a secondary fluid to the cocoa suspension results also in an increased yield stress attributed to
the formation of a network of particles even at room temperature. This bridging phenomenon only
appears for particles with residual cocoa butter content. This leads to the assumption that the
secondary fluid dissolves the cocoa butter and, similar to the heated particles a soft and sticky semi-
crystalline fluid is created that glues the particles together. This process is faster for short chain
solvents with a polar end-group compared to longer chain fatty acids and can be correlated to the
speed at which the respective fluid dissolves the cocoa butter. Less polar substances like silicone oil or

Abstract
sunflower oil do not induce a particle network formation, which is attributed to the poor and slow
solubility of cocoa butter in these fluids.
SANS experiments also revealed structural differences between samples stored at different
temperatures. Samples stored at 30°C or at 20°C, but with added oleic acid exhibit a scattering peak
corresponding to a characteristic length scale of about 50 Å whereas the characteristic length reduces
to about 35 Å for a pure cocoa suspension stored at 20°C. This length scale is attributed to the cocoa
butter layer on the particle surface and completely vanishes upon storage at 40°C.
This research should encourage the development of low fat cocoa spreads that are not based on gums,
hydrogels or other polysaccharides, but provide structural stability through a particle network formed
within the suspension, resulting in a creamy texture.
Finally, it has been shown how the flow behavior of oil and water continuous food suspensions and
correspondingly their creaminess and texture can be tuned in a wide range via appropriate preparation
method and addition of an adequate, immiscible secondary fluid. This may open up a new pathway for
the formulation of novel food products based on cocoa or other finely dispersed particles.

Zusammenfassung V
Zusammenfassung
Wenn eine geringe Menge einer zweiten Flüssigkeit zu einer Partikelsuspension hinzugegeben wird,
welche mit der flüssigen Phase (Bulkphase) nicht mischbar ist, können die rheologischen
Eigenschaften der Suspension dramatisch verändert werden. Durch die Zugabe der Zweitphase
entsteht ein Partikelnetzwerk in der Suspension welches durch Kapillarbrücken zwischen den
Partikeln zusammengehalten wird. Dieses Netzwerk führt zu einer Zustandsänderung der Suspension,
von einem flüssigen in einen gelartigen Zustand. Dadurch werden die Fließgrenze und Viskosität im
niedrigen Scherratenbereich um mehrerer Größenordnungen erhöht. Dementsprechend verändert sich
auch die Stabilität der Suspension. Partikel, welche in einem Netzwerk stabilisiert sind sedimentieren
auch nach langer Lagerzeit nicht. Kapillarsuspensionen können gebildet werden wenn die Zweitphase
die Partikel besser benetzt als die Hauptphase, aber auch wenn die Zweitphase die schlechter
benetzende Phase ist. Mischungen, bei welchen die Zweitphase die Partikel besser benetzt, werden als
„pendular state“ bezeichnet (der drei-Phasen Winkel ist dann kleiner 90°). Ist die Hauptphase die
besser benetzende Phase ist der Kontaktwinkel größer als 90° und die Suspension befindet sich im
„capillary state“. Kapillarsuspensionen können in einer Vielzahl von Anwendungen eingesetzt werden.
Diese sind unter anderem die Herstellung poröser Keramiken, die Trocknung riss freier Filme oder die
Formulierung von neuartigen Lebensmitteln. Letzteres ist Gegenstand dieser Arbeit.
Die Dissertationsschrift ist in zwei Teile aufgeteilt. Zunächst werden Suspensionen auf Ölbasis
beschrieben und es wird diskutiert wie die Kapillarkräfte zwischen den Partikeln genutzt werden
können, um die Fließeigenschaften und die Stabilität von Lebensmittelsuspensionen zu beeinflussen.
Einfache Modellsysteme wurden gewählt um die Parameter zu untersuchen welche die
Netzwerkbildung beeinflussen und somit auch Einfluss auf die rheologischen Eigenschaften der
Produkte haben. Diese beiden Modellsysteme sind Kakao- und Stärkepartikel, welche in
Sonnenblumenöl dispergiert wurden. Wasser diente als Zweitphase in den Systemen. Die
Lebensmittelsuspensionen werden mit Modellsystemen aus Kalziumkarbonat und Polyvinylchlorid
PVC verglichen.
Es wurde gezeigt, dass der Übergang von einer Flüssigkeit zu einem gelartigen Zustand bei beiden
Lebensmittel-Modellsystemen möglich ist und ein starkes kapillares Partikelnetzwerk ausgebildet
werden kann. Die Benetzungseigenschaften der Partikel mit Wasser und Öl wurden mittels konfokaler
Mikroskopie und Kontakwinkelmessungen über die Methode des sitzenden Tropfens bestimmt.
Verschiedene rheologische Parameter von Kapillarsuspensionen wurden bestimmt, dazu gehören
Daten aus oszillatorischer und rotatorischre Rotationsrheometrie.
Die Textur kann durch die zugegebene Menge an Zweitphase und die Benetzungseigenschaften wie
Grenzflächenspannung und Kontaktwinkel verändert werden. Jedoch hat die Viskosität der

Zusammenfassung VI
zugegebenen Zweitphase keinen Einfluss auf die Netzwerkstruktur und somit auch nicht auf die
Fleißeigenschaften wie Fließgrenze oder Viskosität. Untersuchungen zu unterschiedlichen
Mischungen aus hydrophilen und hydrophoben Partikeln führten zu keinem allgemeingültigen
Ergebnis.
Die Adsorption von Wasser auf der Partikeloberfläche beeinflusst das rheologische Verhalten der
erzeugten Suspension. Das Wasser welches über die Lagerung in einer feuchten Umgebung von den
Partikeln aufgenommen wurde bildet spontan Kapillarbrücken zwischen den Partikeln aus. Ein
Vergleich von Kapillarsuspensionen aus Partikeln, welche auf diese Weise vorkonditionierten wurde,
mit Suspensionen, bei denen das Wasser als Zweiphase zudosiert wurde, zeigte, dass sich die
entstandenen Suspensionen rheologisch nahezu identisch verhalten. Dies führte zu dem Schluss, dass
die Bildung der Kapillarbrücken einen energetisch favorisierten Zustand darstellt und nicht durch
mechanischen Energieeintrag bestimmt wird.
Kapillarbrücken können die Hitzestabilität von Schokolade oder anderen temperaturempfindlichen
erhöhen. Diese Stabilität wurde mittels optischer und rheologischer Methoden dokumentiert. Wenn
Wasser in Modellschokolade aus Kakaobutter und Kakaopartikeln eingerührt wird, erhalten die
Schokoladenblöcke ihre Form für über eine Stunde wenn sie bei 50°C gelagert werden. Reine
Modellschokolade dagegen schmilzt innerhalb von 30 Minuten. Dies ist auf das Partikelnetzwerk
zurückzuführen, welches durch die Zugabe von Wasser gebildet wurde. Die geschmolzene
Kakaobutter bleibt im Netzwerk eingeschlossen und läuft nicht aus. Eine Erhöhung des
Zweitphasenanteils, sowie auch des Partikelvolumenanteils führten zu einem stabileren Produkt.
Im zweiten Teil der Arbeit wurde das Fließverhalten von wasserbasierten Kakaosuspensionen näher
untersucht. Es wurde erarbeitet wie Suspensionsstruktur durch Temperaturerhöhung oder die Zugabe
einer zweiten nicht mischbaren Flüssigkeit verändert werden kann. Eine ausführliche rheologische
Charakterisierung wurde durchgeführt und potentielle Mechanismen, welche die Netzwerkbildung
unterstützen wird diskutiert. Durch Extraktion der Partikel mittels verschiedener Lösungsmittel konnte
der Einfluss der Temperatur mit und ohne Zweitphase untersucht werden.
Wurden Kakaopartikel in Wasser dispergiert und bei einer Temperatur von 30°C über Nacht gelagert,
bildete sich ein Partikelnetzwerk, welches ein Ansteigen der Viskosität im niedrigen Scherratenbereich
und eine gelartige, cremige Textur bewirkt. Eine weitere Erwärmung auf 40°C oder höher verursachte
ein Kollabieren des Netzwerkes und die Suspension ging wieder in den flüssigen Zustand über. Es
konnte gezeigt werden, dass die noch in den Kakaopartikeln enthalte Kakaobutter hier den
entscheidenden Faktor darstellt. Bei 30°C ist die Kakaobutter in einem halbkristallinen Zustand und
die Brücken werden gebildet durch eine Art Diffusionsprozess oder durch einfaches Aneinanderkleben
der Partikel durch die an die Oberfläche diffundierte Kakaobutter. Bei 40°C ist die Kakaobutter flüssig
und bildet teilweise Emulsionstropfen in der Suspension, welche nicht zur Netzwerkbildung beitragen
können. Dies konnte mittel konfokaler Mikroskopie gezeigt werden. Durch die Extraktion der Butter

Zusammenfassung VII
mittels n-Hexan konnte die Schlüsselrolle der Kakaobutter bei der Netzwerkbildung bestätigt werden.
Suspensionen, die mit extrahierten Partikeln hergestellt wurden, zeigten keinen Einfluss der
Lagertemperatur auf das Fließverhalten.
Die Zugabe einer nicht mischbaren Zweitphase bei Raumtemperatur resultierte ebenfalls in eine
Erhöhung der Fließgrenze und der Viskosität. Dies konnte jedoch auch nur für Partikel beobachtet
werden, welche noch Kakaobutter enthielten. Dies führt zu der Annahme, dass die Zweitphase die
Kakaobutter anlöst und ähnlich wie bei der Temperaturerhöhung zu einer klebrigen Oberfläche der
Partikel führt. Diese Zweitphasen benötigen eine polare Endgruppe und der Prozess ist schneller je
kürzer die Kohlenstoffkette. Der zeitabhängige Netzwerkaufbau konnte mit der Löslichkeit der
Kakaobutter in der Zweitphase korreliert werden. Unpolare Flüssigkeiten wie Sonnenblumenöl oder
Silikonöl konnten keine Netzwerke ausbilden.
Neutronenstreuexperimente zeigten strukturelle Unterschiede der Suspensionen bei unterschiedlichen
Lagerbedingungen. Proben, welche bei 30°C gelagert wurden, und Proben mit zugegebener
Zweitphase, die bei 20°C gelagert wurden, zeigten ein Streumaximum, welches eine charakteristische
Länge von ca. 50 Å entspricht. Diese reduzierte sich zu 35Å bei Proben ohne Zweitphase, welche bei
20°C gelagert wurden. Dieses Streumaximum wurde auf die Kakaobutterschicht auf den Partikel
zurückgeführt und verschwand ganz bei einer Lagertemperatur von 40°C.
Diese Forschungsergebnisse sollen die Entwicklung von fettreduzierten Lebensmitteln unterstützen,
welche nicht mittels Hydrogelen oder anderen Polysachariden hergestellt werden, sondern allein durch
das Partikelnetzwerk Stabilität und eine cremige Textur erhalten.
Schussendlich wurde gezeigt, wie das Fließverhalten von öl- und wasserbasierten Suspensionen im
Bezug auf ihre Textur und Cremigkeit durch die richtige Herstellungsmethode und passende
Zweitphase verändert werden kann. Dies eröffnet neue Möglichkeiten um innovative Lebensmittel auf
Kakaobasis oder anderen dispergierten Partikeln zu formulieren.

Content VIII
Content
Acknowledgements ................................................................................................................................. I
Abstract ................................................................................................................................................. II
Zusammenfassung ................................................................................................................................ V
Content .............................................................................................................................................. VIII
List of symbols ...................................................................................................................................... X
1 Introduction ................................................................................................................................. 13
1.1 State of the art ........................................................................................................................ 13
1.2 Scope of this work ................................................................................................................. 14
2 Theoretical background .............................................................................................................. 16
2.1 Particle interactions and stabilization in suspensions ............................................................ 16
2.2 Capillary suspensions ............................................................................................................ 18
2.3 Wetting and rewetting ........................................................................................................... 20
2.4 Droplet breakup and mixing conditions ................................................................................ 22
3 Materials and methods ................................................................................................................ 24
3.1 Materials ................................................................................................................................ 24
3.1.1 Particles ......................................................................................................................... 24
3.1.2 Hydrophobic substances ................................................................................................ 26
3.1.3 Hydrophilic substances .................................................................................................. 27
3.2 Methods ................................................................................................................................. 29
3.2.1 Rheological measurements ............................................................................................ 29
3.2.2 Microscopy .................................................................................................................... 32
3.2.3 Contact angle and interfacial tension............................................................................. 32
3.2.4 Standard sample preparation ......................................................................................... 34
3.2.5 Particle treatment ........................................................................................................... 34
3.2.6 Small angle neutron scattering ...................................................................................... 37
3.2.7 Heat stability .................................................................................................................. 37

Content IX
4 Results and discussion ................................................................................................................. 39
4.1 Oil continuous suspensions ................................................................................................... 39
4.1.1 Wetting behavior of starch and cocoa particles in oil.................................................... 39
4.1.2 Network formation in suspensions from cocoa and starch particles ............................. 41
4.1.3 Rheological behavior of cocoa and starch suspensions ................................................. 43
4.1.4 Influence of contact angle and viscosity ratio ............................................................... 47
4.1.5 Mixtures of hydrophilic and hydrophobic particles ...................................................... 51
4.1.6 Particle preconditioning ................................................................................................. 53
4.1.7 Thermal stability ............................................................................................................ 58
4.1.8 Resistance against melting ............................................................................................ 59
4.2 Water continuous suspensions ............................................................................................... 65
4.2.1 Effect of temperature on flow behavior of pure aqueous cocoa suspensions ................ 65
4.2.2 Extraction of cocoa particles ......................................................................................... 68
4.2.3 Effect of secondary fluids on flow behavior of aqueous cocoa suspensions ................. 71
5 Conclusions .................................................................................................................................. 81
List of figures ....................................................................................................................................... 83
List of tables ......................................................................................................................................... 88
References ............................................................................................................................................ 89

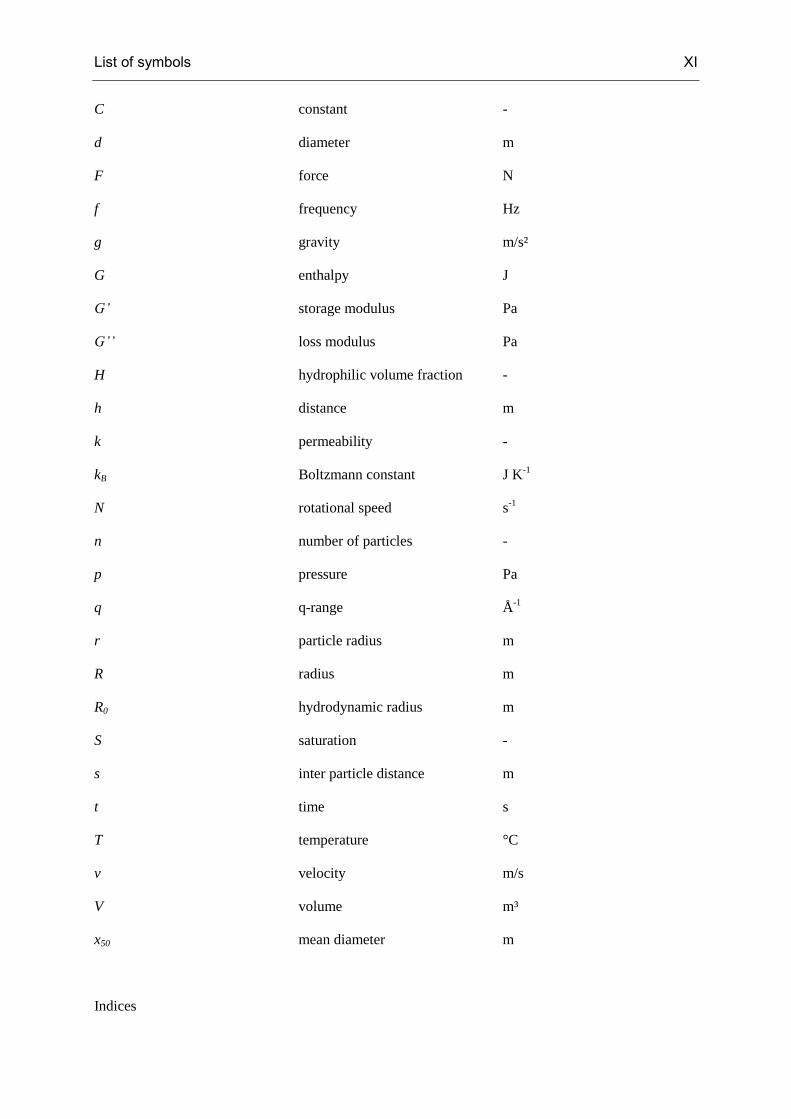
List of symbols X
List of symbols
Greek symbols:
symbol description unit
α crystal form -
β crystal form -
γ deformation -
shear rate s-1
Γ interfacial tension N/m
δ phase shift -
ζ area fraction -
η dynamic viscosity Pa s
Θ angle degree
θ contact angle degree
λ wave length nm
ρ density g/cm³
σ stress Pa
τ shear stress Pa
φ humidity -
ϕ volume fraction -
ω angular frequency
Latin symbols:
symbol description unit
A area m²
a slope -
B constant -
List of symbols XI
C constant -
d diameter m
F force N
f frequency Hz
g gravity m/s²
G enthalpy J
G’ storage modulus Pa
G’’ loss modulus Pa
H hydrophilic volume fraction -
h distance m
k permeability -
kB Boltzmann constant J K-1
N rotational speed s-1
n number of particles -
p pressure Pa
q q-range Å-1
r particle radius m
R radius m
R0 hydrodynamic radius m
S saturation -
s inter particle distance m
t time s
T temperature °C
v velocity m/s
V volume m³
x50 mean diameter m
Indices

List of symbols XII
b bulk
c Cassie
cap capillary
crit critical
d disperse
dr droplet
eff effective
f fluid
l liquid
m minimum
max maximum value
mix mixing blade
o oil
s solid
sec secondary fluid
v air
vdw van-der-Waals
w water
y yield
Introduction p a g e | 13
1 Introduction
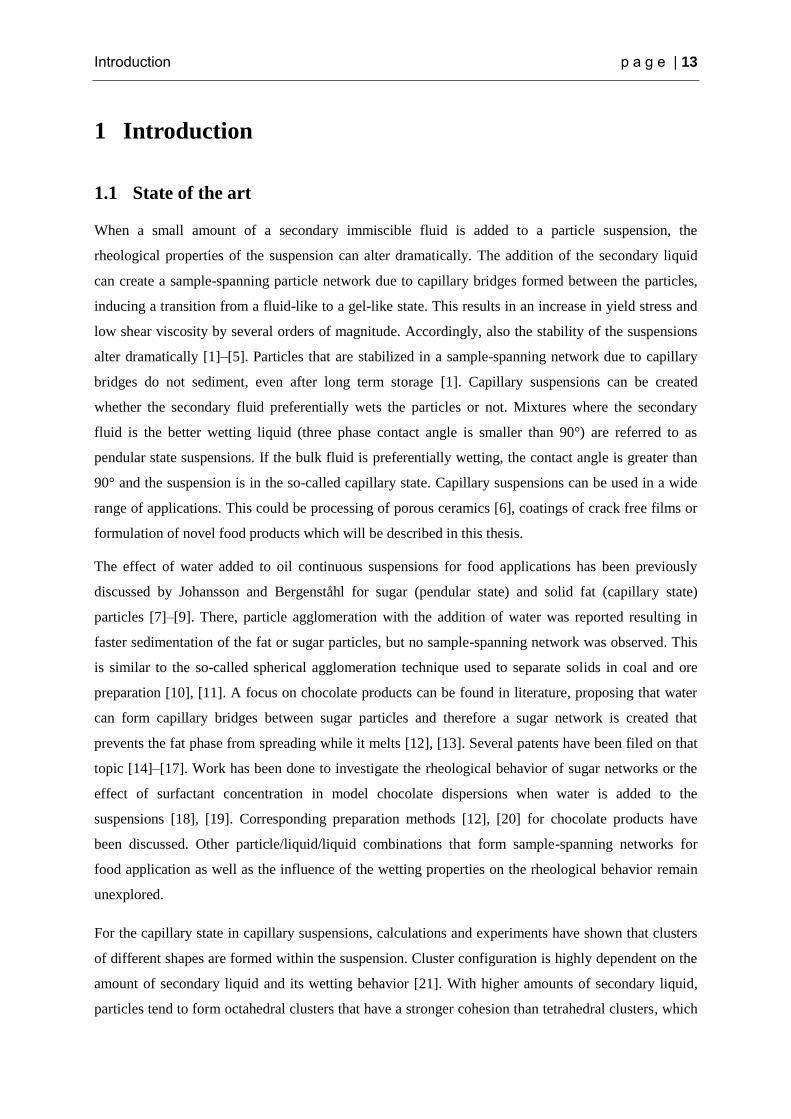
1.1 State of the art
When a small amount of a secondary immiscible fluid is added to a particle suspension, the
rheological properties of the suspension can alter dramatically. The addition of the secondary liquid
can create a sample-spanning particle network due to capillary bridges formed between the particles,
inducing a transition from a fluid-like to a gel-like state. This results in an increase in yield stress and
low shear viscosity by several orders of magnitude. Accordingly, also the stability of the suspensions
alter dramatically [1]–[5]. Particles that are stabilized in a sample-spanning network due to capillary
bridges do not sediment, even after long term storage [1]. Capillary suspensions can be created
whether the secondary fluid preferentially wets the particles or not. Mixtures where the secondary
fluid is the better wetting liquid (three phase contact angle is smaller than 90°) are referred to as
pendular state suspensions. If the bulk fluid is preferentially wetting, the contact angle is greater than
90° and the suspension is in the so-called capillary state. Capillary suspensions can be used in a wide
range of applications. This could be processing of porous ceramics [6], coatings of crack free films or
formulation of novel food products which will be described in this thesis.
The effect of water added to oil continuous suspensions for food applications has been previously
discussed by Johansson and Bergenståhl for sugar (pendular state) and solid fat (capillary state)
particles [7]–[9]. There, particle agglomeration with the addition of water was reported resulting in
faster sedimentation of the fat or sugar particles, but no sample-spanning network was observed. This
is similar to the so-called spherical agglomeration technique used to separate solids in coal and ore
preparation [10], [11]. A focus on chocolate products can be found in literature, proposing that water
can form capillary bridges between sugar particles and therefore a sugar network is created that
prevents the fat phase from spreading while it melts [12], [13]. Several patents have been filed on that
topic [14]–[17]. Work has been done to investigate the rheological behavior of sugar networks or the
effect of surfactant concentration in model chocolate dispersions when water is added to the
suspensions [18], [19]. Corresponding preparation methods [12], [20] for chocolate products have
been discussed. Other particle/liquid/liquid combinations that form sample-spanning networks for
food application as well as the influence of the wetting properties on the rheological behavior remain
unexplored.
For the capillary state in capillary suspensions, calculations and experiments have shown that clusters
of different shapes are formed within the suspension. Cluster configuration is highly dependent on the
amount of secondary liquid and its wetting behavior [21]. With higher amounts of secondary liquid,
particles tend to form octahedral clusters that have a stronger cohesion than tetrahedral clusters, which

Introduction p a g e | 14
are more favored for lower secondary liquid contents [21]. First approaches have been made to
determine the strength of a capillary water bridge between two glass spheres in oil, showing that
stronger forces are measured for secondary liquids with higher viscosity [22]. It also has been shown
that the strength of a capillary suspension in the pendular as well as in the capillary state is
proportional to the inverse of the particle size. Temperature can also alter the yielding and flow of
capillary suspensions dramatically via its effect on interfacial tension and wetting properties. The
addition of surfactant can prevent the formation of capillary bridges which results in a change in flow
behavior of the capillary suspension [2], [3].
One current trend in food science is focusing on low fat products, to support healthier eating without
the lack of taste and familiar mouthfeel. The texture of low-fat food products must be adjusted to
mimic regular full fat products in order to gain consumer acceptance [23]. A similar mouthfeel and the
stability of regular fat products can be achieved by producing emulsions with similar droplet size as
full fat products [23]–[25]. Particle stabilized emulsions have been widely studied as a pathway for
making low calorie food products. Especially fat particles and crystals are known to form stable
Pickering emulsions [26]–[28]. Chocolate products using cocoa particles as emulsion stabilizers have
also been used to incorporate water in chocolate products [16], [29]–[34]. The stability of Pickering
emulsions is influenced by particle shape and size, and especially by surface properties like the
wettability of the particles by the surrounding fluids [35]. No study has been found that uses a
hydrophobic substance to create a sample spanning network induced by capillary bridges between
particles in a suspension for food products. The addition of a fatty acid to the water continuous
suspension of cocoa particles may result in capillary bridging or lead to the adsorption of the fatty acid
to the surface then causing hydrophobic interactions between the particles. The latter were found to
lead to spherical agglomeration in CaCO2 suspensions [36]. The combination of both mechanisms
could also be possible [37]. Capillary bridges can be induced by addition of a secondary fluid, but may
also be created using fat already incorporated in the food particles. It has been reported that food
particles like ground seeds with an oil content form agglomerates during, e.g., roasting due to the oil
released. Particles stick together since oily capillary bridges are formed between them [38]. These
investigations were restricted to dry granular matter and no work has been done yet regarding the
behavior of such particles upon heating in suspension.
Natural organic particles are often used as Pickering stabilizers for food products but the wetting
behavior seems to be ambiguous. For cocoa particles it was found that higher surface energy fluids
like water exhibit higher contact angles than hydrophobic substances with a lower surface energy [39].
1.2 Scope of this work
The present thesis will be divided into two parts. First, oil continuous capillary suspension will be
studied. It will be discussed how capillary forces can be used to control the stability and flow behavior

Introduction p a g e | 15
of food products. When particles are dispersed in oil the capillary force may be used to stabilize the
particles or to introduce a higher viscosity by simply mixing a small amount of a secondary liquid to
the suspension instead of using other more complex rheology control agents.
Simple model systems of particles in oil suspensions are investigated to determine the parameters that
affect the network formation and the resulting rheological properties. For this, two food model systems
were chosen: corn starch and cocoa particles in vegetable oil. Water is used as the secondary liquid in
both admixtures. Food suspensions will be compared to simpler model systems from CaCO3 and
polyvinylchloride (PVC) particles. The effect of secondary phase viscosity and contact angle on
suspension strength is systematically investigated. Since food products are hardly made out of one
particle type, mixtures of hydrophilic and hydrophobic particles will be described. The influence of
adsorption of water to the particles prior to dispersing in the oil phase and the resulting flow properties
will also be discussed. It has been found that cocoa particles dispersed in cocoa butter do also form
sample spanning networks when aqueous liquids are added which results in an increased heat stability.
Melting behavior is documented with optical and rheological methods.
In the second part, we focus on the flow behavior of aqueous cocoa suspensions and how this can be
adjusted by temperature or addition of a secondary liquid. A thorough rheological characterization is
provided and potential mechanisms causing particle network formation are discussed. For this
particles have been extracted with various solvents and the influence of added secondary fluid on the
flow behavior was investigated. Structural analysis was performed using confocal and electro scanning
microscopy as well as computer tomography and small angle neutron scattering.
This research should encourage the development of low fat cocoa spreads that are not based on gums,
hydrogels or other polysaccharides, but provide structural stability through a particle network formed
within the suspension, resulting in a creamy texture.

Theoretical background p a g e | 16
2 Theoretical background
This chapter will give an overview of the general theoretical background of the research in this thesis.
First, particle interactions with a focus on capillary forces will be described. Then the phenomenon of
capillary suspensions and the re-wetting behavior of the liquid phase at the particle surface will be
explained. For the preparation of capillary suspensions mixing conditions play an important role, so an
overview is also given here.
2.1 Particle interactions and stabilization in suspensions
Dispersed systems are heterogeneous mixtures from a dispersed phase in a bulk phase. If this
dispersed phase is made from solid particles a suspension is created. Mixtures of two immiscible
liquids are called emulsions.
The rheological behavior of the particle suspension is influences by the particle volume fraction ϕ,
which is defined as follows,
(2.1)
with Vd, being the dispersed phase and Vb the bulk phase of the system. Also particle form and particle
interactions play an important role in suspension flow behavior. Particle interactions can be attractive
or repulsive and mainly influence the stability of a suspension against sedimentation. Common particle
interactions are extensively discussed in literature [40] and are summarized in the following:
Van-der-Waals attraction
Brownian motion
Electrostatic repulsion
Steric interactions
Form closure
Capillary forces
For this thesis steric interaction can be neglected, since particles are beyond the colloidal range and are
not sterical stabilized. In oil continuous suspensions also no electrostatic interactions need to be taken
into account. Interactions due to particle shape (form closure) as could be assumed for cocoa particles
might have an influence on particle agglomeration, but this will be neglected in this thesis and
therefore will not be discussed here.
Van-der-Waals forces result from dipole-dipole interactions induced by electron fluctuations at the
atomic level. These Interactions can be permanent/permanent (Keesom interactions),

Theoretical background p a g e | 17
induced/permanent (Debye interactions) and induced/induced interactions (London interactions). Van-
der-Waals interactions can be calculated according to Hamaker [41] for two spheres of equal radius r
and a small interparticle distance s of s << 2r [40]:
(2.2)
With AH being the Hamaker constant which is a function of particle material and typically varies
between 10-19
and 10-21
J [40]. The Van-der-Waals force is inversely proportional to the squared
particle distance s and therefore strongly decreases when particles separate.
Capillary forces are well known in wet granular material as a particle bridging mechanism. In
suspensions they have been known to cause particle bridging in spherical agglomeration processes [10]
and have recently been introduced to also cause sample spanning network formation in suspensions [1].
The capillary force depends on the particle radii, the interfacial tension γ between the fluid and the
surrounding gas in contact with the particles and the wetting angle θ the fluid forms against the solid
surface. In Figure 1 two spheres connected with a liquid bridge are shown.
Figure 1: Schematic image of two spheres connected with a pendular liquid bridge. On the left
particles are on contact and on the right they have the distance s (adapted from [42]).
The force Fcap between two equally-sized spheres of radius r connected by a pendular bridge is given
by [46], [47],
(2.3)
If it is assumed that the particles are in contact and that the pendular bridge is small compared to the
particles s << r this is simplified to [43], [44]:
(2.4)
Theoretical background p a g e | 18
For larger droplets, the force will depend on the volume of the wetting fluid, with various corrections
given based on the filling angle and shape of the droplet. Additional corrections are available for
surface roughness and particles that are not in contact [43], [45]. A detailed description of capillary
forces in wet granular material is given by Herminghaus [42].
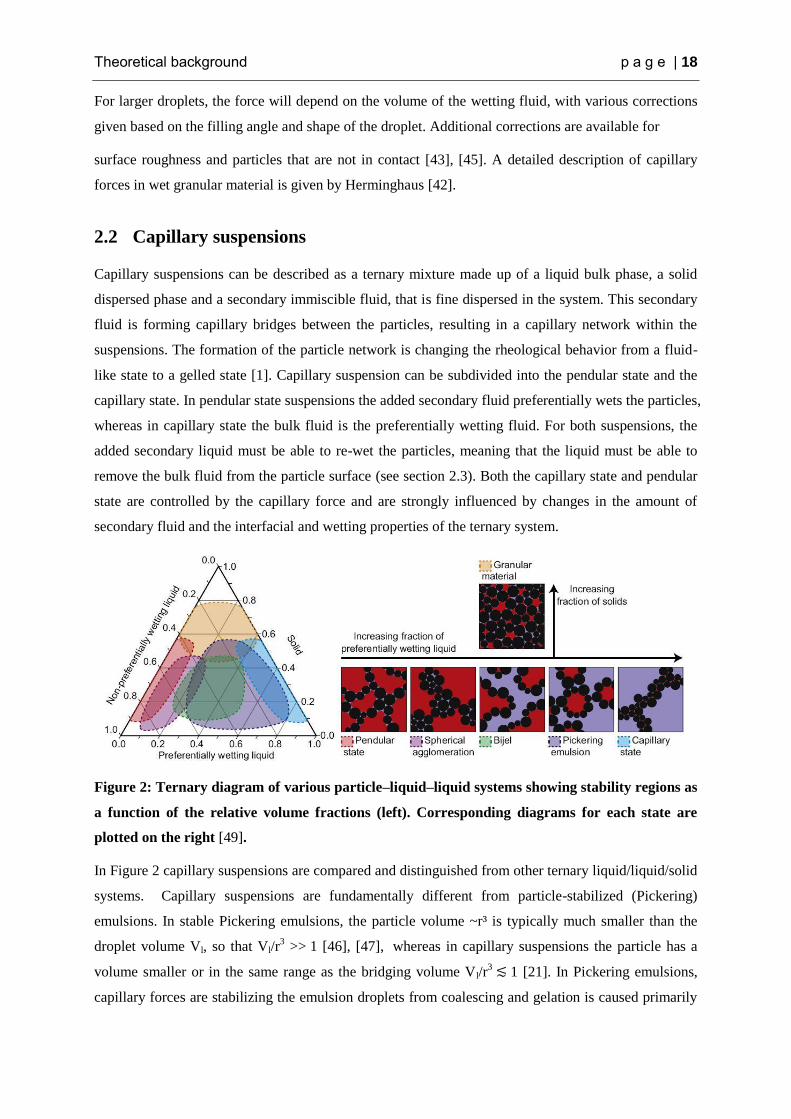
2.2 Capillary suspensions
Capillary suspensions can be described as a ternary mixture made up of a liquid bulk phase, a solid
dispersed phase and a secondary immiscible fluid, that is fine dispersed in the system. This secondary
fluid is forming capillary bridges between the particles, resulting in a capillary network within the
suspensions. The formation of the particle network is changing the rheological behavior from a fluid-
like state to a gelled state [1]. Capillary suspension can be subdivided into the pendular state and the
capillary state. In pendular state suspensions the added secondary fluid preferentially wets the particles,
whereas in capillary state the bulk fluid is the preferentially wetting fluid. For both suspensions, the
added secondary liquid must be able to re-wet the particles, meaning that the liquid must be able to
remove the bulk fluid from the particle surface (see section 2.3). Both the capillary state and pendular
state are controlled by the capillary force and are strongly influenced by changes in the amount of
secondary fluid and the interfacial and wetting properties of the ternary system.
Figure 2: Ternary diagram of various particle–liquid–liquid systems showing stability regions as
a function of the relative volume fractions (left). Corresponding diagrams for each state are
plotted on the right [49].
In Figure 2 capillary suspensions are compared and distinguished from other ternary liquid/liquid/solid
systems. Capillary suspensions are fundamentally different from particle-stabilized (Pickering)
emulsions. In stable Pickering emulsions, the particle volume ~r³ is typically much smaller than the
droplet volume Vl, so that Vl/r3 >> 1 [46], [47], whereas in capillary suspensions the particle has a
volume smaller or in the same range as the bridging volume Vl/r3 1 [21]. In Pickering emulsions,
capillary forces are stabilizing the emulsion droplets from coalescing and gelation is caused primarily

Theoretical background p a g e | 19
through the Van-der-Waals force acting between adjacent particles [48]. In capillary suspensions, the
gelation is caused directly by the capillary force, creating a sample spanning particle network.
Spherical agglomeration is often created when the secondary fluid volume fraction in pendular state
suspensions is increased [6], but also a mechanical energy input is necessary.
The secondary fluid content in a capillary suspension is characterized by the so-called saturation of the
preferentially wetting fluid S,
(2.5)
which is close to zero for the pendular state and approaches one for the capillary state [1], [44]
Saturation S is chosen in analogy to wet granular material, where saturations is described as the ratio
between total pore volume (air) and the total volume between the particles (fluid filled and unfilled
pores). In the present case, the fluid that wets the particles less well corresponds to the air in wet
granular media. Capillary suspensions where the secondary fluid is better wetting ( < 90°) have a
saturation S close to 0, whereas in mixtures where the bulk fluid is the better wetting fluid ( > 90°)
saturations close to 1 are obtained.
The capillary force in a pendular state suspension can be calculated analogue to capillary bridges in
wet granular matter (see eq.(2.4)), but surface tension must be replaced by the interfacial tension of the
two liquids and the contact angle must be measured in the three phase system [1]–[3], [21], [50]. In
capillary state suspensions the strength of the particle clusters can be calculated using the theory of
Pickering emulsions. A single particle that is placed at an interface of two fluids is held with the
energy E given by [35],
(2.6)
where the sign in the parentheses is negative for contact angles < 90° and positive for angles > 90°.
For removing this particle from the interface this Energy E must be spend. This theory can be applied
to capillary suspensions when the capillary network is seen as connected clusters of particles. In each
cluster the particles are held at the interface of a small droplet as has been shown by Lauga and
Brennes [51] who evaporated small particle stabilized emulsion droplets to form clusters connected by
capillary forces, as shown in Figure 3.
Figure 3: Clusters formed by evaporation of Pickering stabilized droplets [51].
Theoretical background p a g e | 20
The yield stress σy of a pendular state suspension is related to the capillary force [3], [44],
(2.7)
where f() is a function of the volume fraction of the particles and depends on the number of contacts
per particle. The volume of the bridge V and the distance between the two particles s are included in
the function .
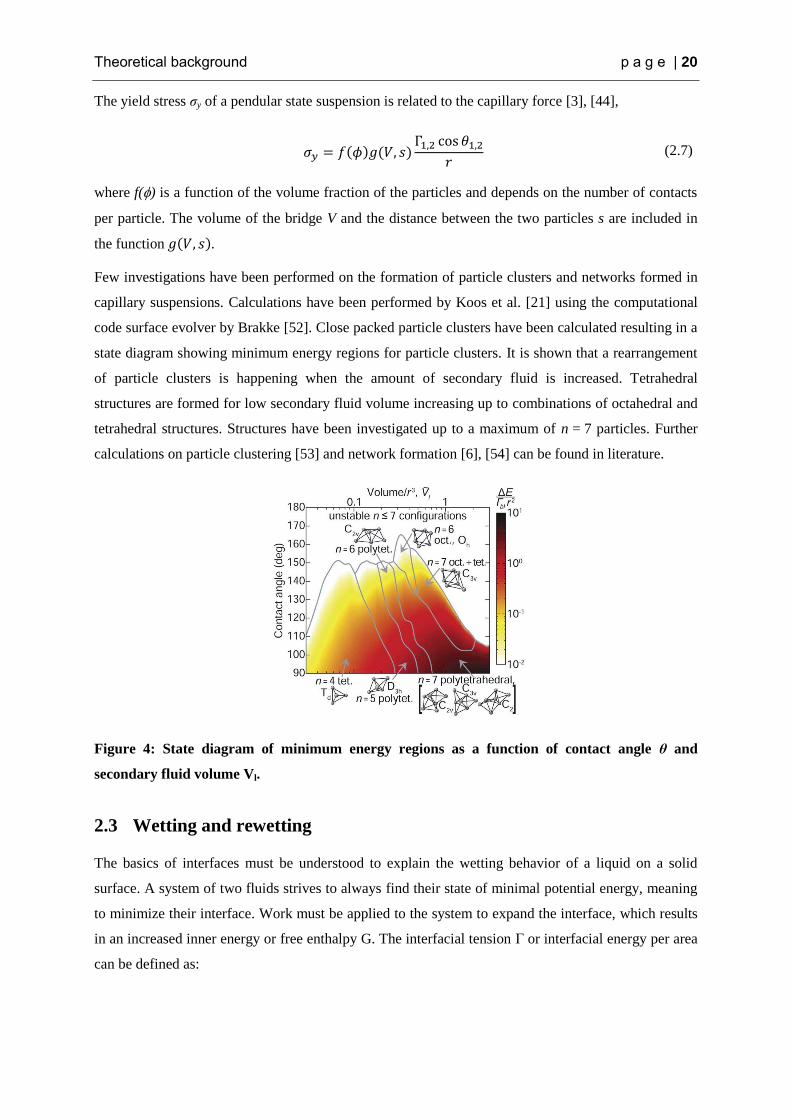
Few investigations have been performed on the formation of particle clusters and networks formed in
capillary suspensions. Calculations have been performed by Koos et al. [21] using the computational
code surface evolver by Brakke [52]. Close packed particle clusters have been calculated resulting in a
state diagram showing minimum energy regions for particle clusters. It is shown that a rearrangement
of particle clusters is happening when the amount of secondary fluid is increased. Tetrahedral
structures are formed for low secondary fluid volume increasing up to combinations of octahedral and
tetrahedral structures. Structures have been investigated up to a maximum of n = 7 particles. Further
calculations on particle clustering [53] and network formation [6], [54] can be found in literature.
Figure 4: State diagram of minimum energy regions as a function of contact angle θ and
secondary fluid volume Vl.
2.3 Wetting and rewetting
The basics of interfaces must be understood to explain the wetting behavior of a liquid on a solid
surface. A system of two fluids strives to always find their state of minimal potential energy, meaning
to minimize their interface. Work must be applied to the system to expand the interface, which results
in an increased inner energy or free enthalpy G. The interfacial tension Γ or interfacial energy per area
can be defined as:

Theoretical background p a g e | 21
(2.8)
At a curved interface the pressure difference between the two phases must be taken into account. This
is expressed via the Young-Laplace equation, which equals zero for even surfaces,
(2.9)
with r1 and r2 being the principal curvatures of the surface. The interfacial tension of a solid surface
with a liquid cannot be measured directly. It is calculated via a force balance at the three-phase contact
line. The wetting of a liquid on a solid substrate can therefore be described by eq. (2.10), which is
called the Young equation:
(2.10)
with θ1,2 being the equilibrium three-phase contact angle, where the drop shape on the solid
corresponds to a minimum free energy [55]. Surface tensions Γ1s and Γ2s are measured between the
solid and the two fluids “1” and “2”, Γ12 corresponds to the interfacial tension between the two fluids.
For the application in capillary suspension these two fluids refer to the bulk and the secondary fluid. In
order to form a capillary suspension the added secondary fluid must be able to rewet the particles
meaning to replace the attached liquid from the particle surface. Displacement of fluid 2 by fluid 1 is
feasible if the difference between the two wetting tensions is positive [56]:
(2.11)
Interfacial tensions Γ2v and Γ1v as well as corresponding contact angles θiv are measured against air.
The contact angle θ1,2 the two liquids form with the solid particle can be calculated using the modified
Young-Dupré equation [1], [57]:
(2.12)
Corrections of the contact angle for porous and rough surfaces can be made using the model by
Wenzel [58] as well as the model of Cassie and Baxter [59]. For heterogeneous surfaces as used in this
study the Cassie and Baxter model is more appropriate. The idea behind this model is to define the
contact angle of a droplet sitting on a composite material, where the droplet is in contact with an area
fraction ζ1 of material 1 and ζ2 of material 2. This result in a corrected contact angle θc calculated as
(2.13)

Theoretical background p a g e | 22
To apply this to a rough surface it is assumed that the droplet sits on the peaks of the surface leaving
the surface valley free of the liquid. So the droplet sits on a composite material made from the
substrate and the surrounding fluid. If the surrounding fluid is air or oil and the droplet is water, the
contact angle the surrounding fluid forms with the wetting liquid is 180°. In this case the formula
simplifies to [59], [60]:
(2.14)
2.4 Droplet breakup and mixing conditions
When the secondary fluid is mixed to the particle suspension it needs to be finely distributed. The
simplest approach is to assume laminar droplet breakup. For this the theory of Grace [61] can applied.
The Grace diagram allows determining the necessary shear rate for the breakup of spherical droplets in
a quasi steady homogeneous flow. For this the capillary number Ca can be taken into account,
describing the relationship of viscous forces and the surface tension between two immiscible fluids:
(2.15)
The critical capillary number Cacrit describes the size rcrit of droplets formed at given , η and Γ. For
capillary numbers smaller than Cacrit only droplet deformation can be detected.
Figure 5: Droplet breakup criteria for a single droplet undergoing shear and elongational stress
[61].
Mixing a suspension in a beaker using a dispenser mixer blade turbulent mixing conditions can be
assumed. Here droplet breakup origins from eddies that superimpose the main flow. A closer look on
turbulence theory can be found in the literature [62], [63]. For an estimate of droplet size of the
secondary fluid that is mixed to the bulk suspensions in a beaker using a mixing blade, the theory of a
stirrer vessel can be applied. Here the minimum droplet diameter accessible in emulsion preparation

Theoretical background p a g e | 23
can be calculated by applying dimensional analysis [64]. This leads to a dependency of the minimum
mean droplet diameter ddr,m on mixing conditions [65]:
(2.16)
with N being the rotational speed, dmix the diameter of the mixing blade, ϕd the volume fraction of the
dispersed phase and C1 and C2 constants that must be determined experimentally. Experimental tests
as well as theoretical considerations of turbulence procure the constants needed for full
characterization of the system. It can be seen that the minimum droplet diameter is a function of
mixing conditions (N, dmix) that were kept constant for all preparations as well as material properties
like interfacial tension and liquid phase density, which are varied for different systems.

Materials and methods p a g e | 24
3 Materials and methods
3.1 Materials
In this section an overview of the different particles and liquids used in the experimental section will
be given.
3.1.1 Particles
Different particles were used in this study. Starch and cocoa particles represent food systems, while
calcium carbonate and polyvinylchloride (PVC) particles serve as model system in the first part of the
thesis (oil continuous systems). The particle size was measured using a LALLS (Low Angle Laser
Light Scattering, Sympatec HELOS H0309) while the particles were suspended in paraffin oil or water
and subjected to ultrasonic dispersion using a Sympatec QUIXEL unit. The particle size distributions
of particles described below are plotted in Figure 6.
10-1
100
101
102
1
2
3
q3 (
µm
-1)
x (µm)
Vinnolit
Modified starch
Cocoa
Natural starch
Figure 6: Particle size distribution of particles used in this study.
Cocoa particles
Cocoa solids are a product obtained by the processing of cocoa beans. The cocoa tree is growing in
West Africa, South-East Asia and South America. The beans are fermented and dried before they are
shipped to the chocolate manufacturing countries. Especially, the fermenting process which is done
directly after harvesting, can influence the cocoa flavor. The process is hardly industrialized and the
method strongly depends on growing county. In the chocolate factories the beans are roasted,
winnowed and ground. The cocoa butter is pressed out of the product leaving the cocoa press cake as a
residual. The cocoa powder is now produced by milling the cake. The fat content of the cocoa powder
is adjusted in the pressing process step and can vary between 10% and 22%. Since cocoa particles are

Materials and methods p a g e | 25
a natural product and highly dependent on origin country of the beans, weather conditions and
fermenting process, quality and properties are varying with every batch [66].
Two types of cocoa particles were utilized in this study. As a standard, cocoa powder 10/12 SN
donated by ADM Schokinag GmbH Mannheim was used. The cocoa particles were non-alkalized and
had a fat content of 11%. All ingredients are listed in Table 1. As a comparison a second product was
used. Cocoa particles (20-22) provided by Storck GmbH, Halle (Saale) were also non-alkalized and
had a fat content of 22%. Cocoa particles exhibit a density of ρcocoa =1.44 g/cm³.
Table 1: Ingredients of cocoa solids (10/12 SN) provided by ADM Schokinag.
Ingredient Protein Sugar Starch Fat Fibre
Per 100g 22.0g 2.0g 10.0g 11.0g 31.1g
As the processing of cocoa implies, every cocoa particle is different in shape, size and composition.
They exhibit a very rough and porous surface and can be agglomerated as can be seen in Figure 7.
Figure 7: Scanning electron microscopy (SEM) image of cocoa solids
Starch
Starch granules are the mayor storage of carbohydrates in plants. They are quasi-crystalline, water
insoluble and dense [67]. The two components amylose and amylopectin are forming the starch
granule. Amylose consists of 1000-10000 D-glucopyranosyl units that are bond with α-D-(1-4)
glucopyranosyl units and is a mostly linear molecule. Amylopectin is highly branched and is also
linked together by α-D-(1-4) glucopyranosyl residues, but with (1-6) bonds at the branch points [68].
Amylose as well as amylopectin can form crystalline structures that origin from a helix or doublehelix
structure of the molecules. Amorphous and crystalline structures are arranged in a lamellar structure
that form layers in the granule [69].
The starch granules used in this study were maize starch G*Gel 03401 provided by Cargill
Deutschland GmbH, Krefeld. The density of the starch is given to be ρstarch = 1.5g/cm³.

Materials and methods p a g e | 26
Calcium carbonate particles
Fumed calcium carbonate particles are used in this study as a model system. Particles are used with
their naturally hydrophilic surface (SOCAL 31) with an average mean particle diameter of x50 = 70 nm
as well as hydrophobically modified particles (SOCAL U1S1) with an average mean particle diameter
of x50 = 80 nm. Both products were produced by Solvay Chemicals, Hannover, Germany. SOCAL is
an odorless, white powder with a density of ρSOCAL = 2.71 g/cm³. The hydrophobic particles are
modified using fatty acids which are bond to the particle surface.
PVC/PVA particles
Polyvinylchloride (PVC) is an amorphous, plastic polymer that is used in a wide range of applications.
Polyvinyl acetate is also a thermoplastic polymer. Particles Vinnolit C 12/62 V used here are prepared
from a mixture of PVC and PVA (12% PVA) and are provided by Vinnolit GmbH, Ismaning,
Germany. The particles have a spherical and non-porous shape and a narrow particle size distribution
(see Figure 6). The density of the particles is ρPVC = 1.38 g/cm³.
3.1.2 Hydrophobic substances
Sunflower oil
Commercial sunflower oil was used in this study (“Ja!” Rewe Markt GmbH). Sunflower oil consists of
triglycerides, which have free fatty acids attached to glycerol backbone. In sunflower oil they are
mainly formed from double unsaturated linoleic acid (C 18:2) and unsaturated oleic acid (C18:1). A
small fraction of free fatty acids (~1.8 %) are present in the oil. Measured viscosity was η = 39 mPa s
with a density of ρ = 0.92 g/cm³.
Cocoa butter
Cocoa butter is a mixture of different triglycerides, which vary in fatty acid composition and therefore
exhibit different properties in melting behavior and range.
Table 2: Different crystal forms of cocoa butter (adapted from [66]).
Greek label γ α β2’ β1’ β2 β2
Roman label I II III IV V IV
Temp. range 16-18°C 22-24°C 24-26°C 26-28°C 32-34°C 34-36°C
loose packing
unstable form
dense packing
stable form

Materials and methods p a g e | 27
Most cocoa butter consists of 35% oleic acid (C18:1), about 34% stearic acid (C18:0) and 26%
palmitic acid (C16:0). Because of the different triglyceride compositions, the fats show polymorphism.
This means that they can crystallize in a number of different ways, where some crystallize in double-
chain packing and others in triple-chain packing. Cocoa butter can possess six different crystal forms
that are labelled with Greek or Roman letters [66]. An overview of the different forms and melting
temperatures are given in Table 2, with γ being a crystal form in this section. Cocoa butter used in this
thesis was purchased from Spiceworld GmbH, Salzburg, Austria.
Other hydrophobic substances
In Table 3 the properties of hydrophobic substances used in this thesis are summarized.
Table 3: Properties of hydrophobic substances used as secondary fluids for water continuous
suspensions.
Substance Purchased
from
Chemical
Formular
Density Viscosity
Linoleic
acid
Sigma-
Aldrich, St.
Louis, USA
C18H32O2 0.89 g/cm³ 27.0 mPa s
Oleic acid Alfar Aesar,
Karlsruhe,
Germany
C18H34O2 0.89 g/cm³ 33.7 mPa s
Octanol Merck
KGaA,
Darmstadt,
Germany
C8H18O 0.83 g/cm³ 85.0 mPa s
Octanoic
acid
Alfar Aesar,
Karlsruhe,
Germany
C8H16O2 0.91 g/cm³ 58.8 mPa s
Octyl
acetate
Alfar Aesar,
Karlsruhe,
Germany
C10H20O2 0.87 g/cm³ 1.8 mPa s
Silicon oil
AK 10
Wacker
Chemie AG,
München,
Germany
Si (CH3)3 Si
(CH3)n Si (CH3)3
0.93 g/cm³ 9.3 mPa s
3.1.3 Hydrophilic substances
As hydrophilic liquids water and aqueous solutions of glycerol, fructose and PEO were used. Glycerol
is an alcohol with three hydroxyl groups and the chemical name propanetriol. It is widely used in food
and pharmaceutical industry as a humectant, lubricant or solvent. It is completely miscible with water.
Viscosity and density data for various mixtures with water are given in Table 4.
Materials and methods p a g e | 28
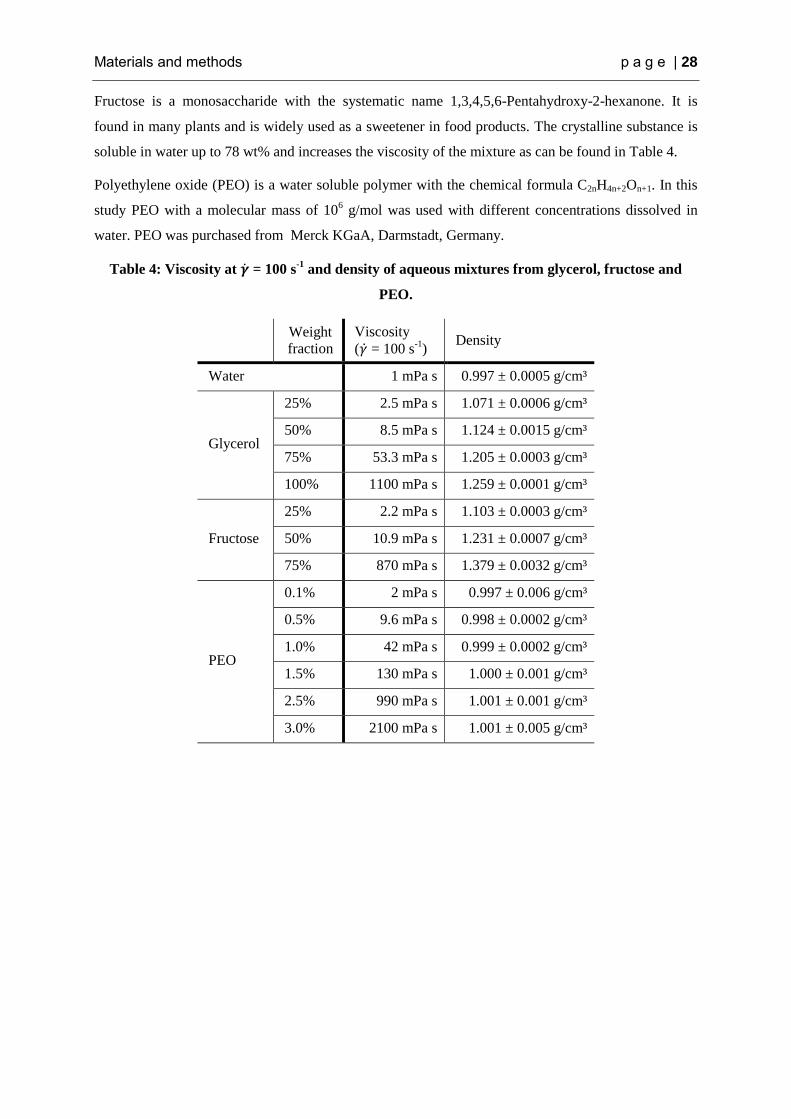
Fructose is a monosaccharide with the systematic name 1,3,4,5,6-Pentahydroxy-2-hexanone. It is
found in many plants and is widely used as a sweetener in food products. The crystalline substance is
soluble in water up to 78 wt% and increases the viscosity of the mixture as can be found in Table 4.
Polyethylene oxide (PEO) is a water soluble polymer with the chemical formula C2nH4n+2On+1. In this
study PEO with a molecular mass of 106 g/mol was used with different concentrations dissolved in
water. PEO was purchased from Merck KGaA, Darmstadt, Germany.
Table 4: Viscosity at = 100 s-1
and density of aqueous mixtures from glycerol, fructose and
PEO.
Weight
fraction
Viscosity
( = 100 s-1
) Density
Water 1 mPa s 0.997 ± 0.0005 g/cm³
Glycerol
25% 2.5 mPa s 1.071 ± 0.0006 g/cm³
50% 8.5 mPa s 1.124 ± 0.0015 g/cm³
75% 53.3 mPa s 1.205 ± 0.0003 g/cm³
100% 1100 mPa s 1.259 ± 0.0001 g/cm³
Fructose
25% 2.2 mPa s 1.103 ± 0.0003 g/cm³
50% 10.9 mPa s 1.231 ± 0.0007 g/cm³
75% 870 mPa s 1.379 ± 0.0032 g/cm³
PEO
0.1% 2 mPa s 0.997 ± 0.006 g/cm³
0.5% 9.6 mPa s 0.998 ± 0.0002 g/cm³
1.0% 42 mPa s 0.999 ± 0.0002 g/cm³
1.5% 130 mPa s 1.000 ± 0.001 g/cm³
2.5% 990 mPa s 1.001 ± 0.001 g/cm³
3.0% 2100 mPa s 1.001 ± 0.005 g/cm³

Materials and methods p a g e | 29
3.2 Methods
3.2.1 Rheological measurements
All measurements were conducted using a rotational rheometer (MARS II, Thermo Fisher Scientific,
Karlsruhe, Germany) with a sandblasted rough plate-plate geometry (35 mm diameter) and a gap size
of 1 mm if not stated otherwise. Measurements where done in triplicate and the calculated standard
deviations are shown as error bars in the diagrams. For water continuous samples, the environment of
the probes filled in the rheometer gap was water saturated to prevent drying of the sample while
measuring.
Rheological measurements are based on the plate-plate model pictured in Figure 8. In stress controlled
rheometers one moving plate with radius R is turning with an applied torque around its axis over a
second plate with a gap size h. This torque is inducing the angular frequency ω. The sample is filled in
the gap and adhesion at the plate wall is assumed and mandatory. The shear rate is defined as
follows:
0 < x < R (3.1)
The rheometer used here is a stress-controlled measurement device where the deformation is detected
at given torque, which is proportional to the shear stress.
Figure 8: Schematic diagram of a plate-plate setup of a rotational rheometer with the gap size h
and radius R.
The strength of capillary suspensions is characterized here through the apparent yield stress (for
brevity subsequently termed yield stress). The yield stress is defined as the stress at which the sample
begins to flow irreversibly. These measurements were conducted using stress-steps, where the yield
stress was found as the point at which the slope of the logarithmic deformation as a function of the
logarithmic shear stress changes from a low value ≈ 1 to a high value >>1. For this the deformation γ
was plotted over the shear stress σ and the point of intersection between two adjusted tangents was
determined using the RheoWin Software from Thermo Fischer. Karlsruhe, Germany (see Figure 9).

Materials and methods p a g e | 30
The sample viscosity was measured using shear rate steps. The shear rate was increased incrementally
and held at a constant value, for at least 10 s and for a maximum of 100 s, until the stress reached a
steady state, (dσ/σ)/dt < 0.01 s-1
, before recording the shear stress and corresponding viscosity.
10-1
100
101
10-4
10-3
10-2
10-1
100
101
102
y
(Pa)
Figure 9: Example for yield stress evaluation: Socal particles ϕ = 10% dispersed in sunflower oil.
For small amplitude oscillatory measurements a sinusoidal stress signal was applied to the sample and
the responding deformation was detected. The linear viscoelastic behavior of the sample is then
characterized in terms of the storage modulus
(3.2)
and the loss modulus
(3.3)
where is the strain amplitude, the stress amplitude and δ the phase shift between applied and
responded signal. In the linear-viscoleastic regime (LVE) G’ and G’’ are independent of applied
deformation or stress and for the suspensions with dominating attractive particle interactions G’,
which describes the elastic part of the deformation, is dominating over the viscous dissipation (G’’).
The LVE regime is determined via amplitude sweeps. The deformation or the shear stress is increased
at constant frequency over time and the critical point (γcrit and σcrit) where G’ is not constant anymore
(with a deviation of 10%) is determined as the end of the LVE regime and the response signal
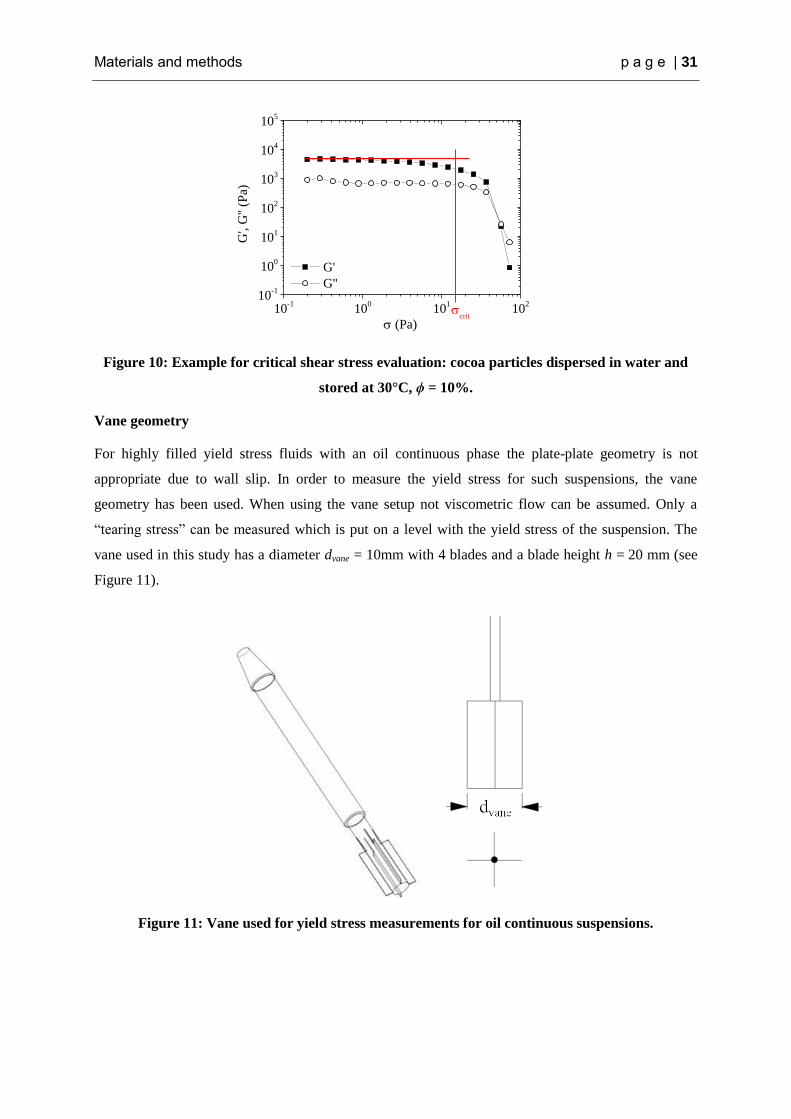
becomes non-linear. An example is given in Figure 10. Frequency sweeps were always performed in
the LVE regime. Viscoelastic properties are measured over a wide frequency range to characterize the
gel-like behavior of the suspension.
Materials and methods p a g e | 31
10-1
100
101
102
10-1
100
101
102
103
104
105
crit
G',
G''
(Pa)
(Pa)
G'
G''
Figure 10: Example for critical shear stress evaluation: cocoa particles dispersed in water and
stored at 30°C, ϕ = 10%.
Vane geometry
For highly filled yield stress fluids with an oil continuous phase the plate-plate geometry is not
appropriate due to wall slip. In order to measure the yield stress for such suspensions, the vane
geometry has been used. When using the vane setup not viscometric flow can be assumed. Only a
“tearing stress” can be measured which is put on a level with the yield stress of the suspension. The
vane used in this study has a diameter dvane = 10mm with 4 blades and a blade height h = 20 mm (see
Figure 11).
Figure 11: Vane used for yield stress measurements for oil continuous suspensions.

Materials and methods p a g e | 32
3.2.2 Microscopy
An inverse Leica TCS SP8 confocal laser scanning microscope (Leica Microsystems, Mannheim,
Germany) was used for microscopic images. The microscope was supplied with lasers of 488 nm and
552 nm wavelength. Figure 12 shows a schematic image of the optical path of the microscope.
The advantage of using a laser scanning microscope is given through a specific signal, high contrast
and no particles out of focus light. The fluorescent substance or dye absorbs a photon of the particular
excitation wavelength and emits at different specific wavelength. Since the emitted photon has less
energy, a longer wavelength is generated; this is described in Planck’s law [70]. The oil phase in this
study was labeled using Nile Red (purchased from Sigma Aldrich). The absorption and emission
maxima are highly dependent on the solvent and vary with the different hydrophobic phases used in
this study. The water phase was stained with Promofluor-488 Carboxylic acid (Promokine, Heidelberg,
Germany) which inhibits an absorption maximum of 490 nm when used with the 488 nm laser and
Rhodamine B (purchased from Carl Roth, Germany), where the absorption maximum in aqueous
solution is between 542 nm and 554 nm.
Figure 12: Schematic image of the laser path through the microscope [71].
The inverse fluorescence microscope Axio Observer D1 by Zeiss (Carl Zeiss AG, Oberkochen,
Germany) was also used in this study. It was set up with a 365 nm laser and also a white light camera
was attached, allowing the creation of overlaid images from laser and white light signals.
3.2.3 Contact angle and interfacial tension
Contact angle
The contact angle one fluid forms a particle surface in the presence of a secondary fluid is calculated
by using the sessile drop method. Contact angle was measured directly in the three phase system [72],

Materials and methods p a g e | 33
[73]. Powder was pressed to a tablet using a hand press machine and soaked with the bulk fluid to
ensure that no open pores are left in the pellet.
Figure 13: Schematic images of contact angle measurements when the high density fluid is the
bulk phase (left) and when the low density fluid is the bulk phase (right).
Due to density differences, two setups were used for contact angle measurements. For oil continuous
systems, the pressed pellet was placed in a glass container filled with oil and a drop of secondary fluid
was placed onto the particle surface. If water is the continuous phase, the tablet was mounted in the
glass container as described in Figure 13 and secondary fluid was injected under the pellet with a
needle [74]. Contact angle was measured immediately through the secondary phase droplet and
calculated via image analysis (Drop shape analysis software by Krüss GmbH, Hamburg). The droplet
shape was fitted using a Laplace-Young approach and the angle between the manually set baseline was
displayed. Given value have been corrected by taking surface roughness into account (see section 2.3).
Interfacial tension
Interfacial tension γow between the two fluid phases was measured using the pendant drop method. The
droplet is hanging on a needle which was placed in the other fluid. The fluid with the lower density is
used as the surrounding fluid and the droplet is formed using the higher density fluid. The droplet
shape is captured via image analysis [75]. The correlation between the geometry of the formed droplet
and the interfacial tension is based on the Lapalce equation (see eq. (2.9)) and the calculation is
performed using a nonlinear differential equation which refers to Bashforth and Adam [76]:
(3.4)
with
(3.5)
where hdr is a geometrical parameter and rdr the radius of curvature at coordinates x,z and Θdr, which
are depicted in Figure 14, g is the gravitational constant and Δρ the density difference between the
droplet and the surrounding fluid.

Materials and methods p a g e | 34
Figure 14: Geometric description of the pendant drop [77].
3.2.4 Standard sample preparation
Capillary suspensions were prepared as follows: particles were mixed into the bulk fluid using a
turbulent beater blade (at 500–2000 rpm for 20 min) until a uniform suspension was created. This
mixture was then held under vacuum (100 mbar) for a few minutes to remove air bubbles. The
secondary fluid was added to the suspension and thoroughly mixed using a dispenser stirrer (at
1700 rpm for 5 min). The samples were held in airtight containers until the measurements were
completed. All samples were measured after 24 h of storage if not stated otherwise.
3.2.5 Particle treatment
Pre-conditioning of particles
Hygroscopic particles can absorb water when stored in a humid environment. Sorption kinetics are
dependent on the vapor pressure around the particles and particle surface chemistry. In this setup,
particles are stored in a closed container over water at 20°C so the system is in an equilibrium state.
The saturation vapor pressure pw, max over water can be calculated using the Magnus- Equation:
(3.6)
For 20°C a value of pw,max = 2.3 kPa = 0.023 bar is calculated. So the maximum absolute humidity of
φw,max can be calculated using following equation:
(3.7)
A maximum absolute humidity of 17.2 g/m³ for 20°C is determined. Vapor pressure pw and therefore
humidity can be varied by replacing the free water surface with saturated salt solutions. With

Materials and methods p a g e | 35
decreased vapor pressure, water sorption of the particles for a given time is reduced compared to
particles stored over pure water. Relative humidity
(3.8)
at 20°C for saturated solutions as well as solubility of salts in water are listed in Table 5.
Sorption at a particle surface is described using a sorption isotherm, which describes the equilibrium
state of a solid surface with the environment. At constant temperature molecules of water ad- and
desorb in the same amount. Different models can be used to describe the sorption isotherms of
surfaces depending on multilayer or monolayer absorption. The most common model used is the BET
(Brunauer–Emmett–Teller) model since it takes mono- as well as multilayer absorption into account. It
has been adjusted and improved to fit for food systems [78], for example the equation given by Kats
[79]. The Guggenheim, Anderson, de Boer (GAB) model [80] is also widely used in literature and has
been modified to give a versatile fit to measured data [81]–[84].
Table 5: Relative humidity of saturated salt solutions and the solubility of salt in water.
Type of salt
Relative humidity
φrel. at 20°C for
saturated solutions
solubility
Lithium chloride (LiCl) 12 % 832 g/l
Sodium chloride (NaCl) 76 % 358 g/l
Magnesium chloride (MgCl2) 33% 108 g/l
For this study particles were stored over distilled water in a closed vessel for 2 to 21 days at 20°C. The
volume of the particles (21 ml) was kept constant, since the real surface of the particles could not be
detected. Water uptake of conditioned granules was determined by the weight gain of granules during
storage. So the amount of water was controlled by time and not via vapor pressure variation at
equilibrium state. Water sorption over time for different particles is shown in Figure 15. For Socal
U1S1 particles which adsorb water quickly over time, saturated salt solutions are used to allow a more
precise water sorption. All samples with saturated salt solutions were stored for two days and the
amount of water was therefore controlled by the vapor pressure in the closed vessel.

Materials and methods p a g e | 36
0 100 200 300 400 50010
-3
10-2
10-1
100
starch Vinnolit P 4472
cocoa Socal U1S1abso
rbed
wat
er (
gw
ater/g
dry
mas
s)
time (h)
Figure 15: Absorbed amount of water for different particles over time. Particles had been stored
over distilled water at 20°C.
Hydrophobisation of starch particles
For experiments regarding contact angle variation, the starch granules were treated with octenyl
succinic anhydride (OSA) bought from Carl Roth to make the particles more hydrophobic [85]. For
hydrophobization, the starch granules were dispersed in water and OSA was added in different
concentrations (0%, 1%, 2% and 3 wt.% of the particle mass). Mixtures were stirred for 3 h and then
centrifuged for 20 min. at 5000 min-1
. The starch was washed three times by dispersing the particles in
water and repeating the centrifugation step. Particles were then dried at 40°C for 72 h. Before
dispersing the treated starch granules in oil for sample preparation, the powder was ground using a
mortar and pestle to carefully break agglomerated formed during the drying process.
Particle extraction and dying
Cocoa particles contain water soluble, oil soluble (cocoa butter) and non soluble substances as
mentioned before in section 3.1.1. For capillary wetting the contact angle is important and this is
influenced by the soluble substances in the particle. The particles have been extracted via cross-flow
liquid-liquid extraction using a centrifuge. As solvents water, ethanol and n-hexane were used. 27.5 g
of solvent was mixed with 6 g of particles and placed on a shaking table for 30 min. The mixture was
then centrifuged (Hettlich Lab Technology, Universal 320) at 8980 g for 15 min. The solvent was
disposed and replaced with new solvent. This procedure was repeated 3 times. Particles were dried
over silica for at least 2 days and were then milled using a mortar. Particle size distribution of natural
and extracted particles (see section 3.2.5) is given in Figure 16.
For dying of particles the procedure was similar: particles were dispersed in water and the dye was
added. For each experiment 0.5 g of dye and 30 g of particles were added in water. After reaction time,
the particles were washed and dried as written above. Cocoa particles were dyed with Toluidine blue,
starch and Socal particles with Rhodamine B.

Materials and methods p a g e | 37
100
101
102
0
1
xm (m)
pure cocoa
extracted with ethanol
extracted with n-hexane
extracted with water
q3 (
m-1
)
T = 20 °C
Figure 16: Particle size distribution of extracted and non extracted cocoa particles.
3.2.6 Small angle neutron scattering
Small angle neutron scattering (SANS) experiments were performed at the KWS-1 instrument of the
Jülich center for neutron sciences (JCNS) outstation at the FRM II, Garching, Germany. For the
experiments, a wavelength of λ = 0.7 nm (Δλ/λ = 20%) and sample-detector distances of 1.4, 8 and
20 m were used thus covering the q-range from q = 0.0012 Å-1
to q = 0.23 Å-1
, with q being defined as,
(3.9)
where Θscat is the scattering angle. The samples were mounted in standard glass cuvettes with a light
path of 0.5 mm in a double-walled aluminum sample holder. Data reduction was done using the
software QtiKWS provided by JCNS. SANS curves were fitted with a Gaussian model to analyze the
peak shift at large q values. Suspensions were prepared in D2O instead of H2O for these experiments in
order to increase the scattering contrast between the organic particles and the surrounding fluid. For
the scattering length density calculation, the cocoa particles are treated as cellulose.
3.2.7 Heat stability
Sample preparation
The model chocolate was prepared as follows: Cocoa butter was melted in a water bath at 50°C and
cocoa solids were added under stirring. Water or other secondary fluids were heated separately and
added to the bulk suspension also under stirring at 800 rps for 5 minutes. So prepared model chocolate
was poured into a cylindrical silicon form with a diameter and height of 25 mm. Samples were stored
to cool for 24 h at 20°C. The so formed blocks were analyzed using optical and rheological methods.

Materials and methods p a g e | 38
Optical melting experiments
For optical measurements the model chocolate block was placed in an oven at 50°C and pictures were
taken every 5 minutes. The height of the chocolate block was determined using the open source
software image j. Height was then normalized by the initial height and plotted over time for varied
water contents.
Rheological melting experiments
Rheological measurements were carried out on a Haake Rheometer RS 150 by varying the temperature
using a Peltier element in the bottom plate. Samples were melted on the bottom plate at 40°C and then
sheared in sinusoidal oscillation mode for 25 minutes at 25°C and f = 1 Hz to let the sample cool down.
Subsequently, temperature was increased linearly from 25°C to 45°C in 46 min and G‘ and G‘‘ were
detected at a constant frequency of f = 1 Hz and a shear stress of τ = 0.1 Pa.

Results and discussion p a g e | 39
4 Results and discussion
4.1 Oil continuous suspensions
The following sections focus on capillary suspensions that were prepared and investigated by
dispersing starch and cocoa particles in oil. A closer look will be taken on the rheological behaviour
and what factors are influencing suspension stability. Starch particles can serve as a well defined food
model system for capillary suspensions. They exhibit properties typical for food particles, as they are
hygroscopic, irregular shaped and have a wide particle size distribution. Also suspensions from cocoa
particles have been investigated. These particles are additionally porous, exhibit various form factors
in one batch and consist of different components (see section 3.1.1) which results in heterogeneous
surface properties. These organic suspensions are also compared to model systems made from calcium
carbonate, as well as PVC and glass particles. Parts of the results described in the following sections
have been published in Food Hydrocolloid [86].
4.1.1 Wetting behavior of starch and cocoa particles in oil
Capillary bridging in suspension as well as wetting behavior of the particles has been imaged using
two different microscopes as described in section 3.2.2.
A starch suspension was prepared by dispersing starch granules in sunflower oil at a volume fraction
of = 0.33. The contact angle of added water in the three phase system was measured to be θ = 129
14° via the sessile drop method. Although starch granules do have a hydrophilic nature, the direct
measurement of the contact angle in the three-phase system shows a wetting angel greater than 90°.
Since the angle is not measured using a single particle, we have to consider that tablet surface
roughness and porosity could play a role. Corresponding calculations have been performed using a
modified Cassie equation (see equ. (2.14) with a area fraction of ζ = 0.5 and the contact angle reduces
to θ = 116°. Still, contact angle measurements using the sessile drop method can be defective due to
water sorption and tablet porosity.
Figure 17: CLSM images of starch particles dispersed in oil and brought in contact to a water
interface. The oil phase is displayed in red while water is colored in green.

Results and discussion p a g e | 40
Therefore, confocal microscopic (CLSM) images have been taken to have a closer look at the wetting
and adsorption behavior of the starch particles. For this, the granules have been dispersed in oil and an
interface with water was created by adding a droplet of the oil/starch mixture next to a water droplet
on an object slide. The oil phase was dyed with Nile Red and the water phase with Promofluor-488.
Particles were one time dispersed in oil (appears red in the image) and the other time in water (appears
green in the image) to see how the initial wetting is influencing the re-wetting and adsorption behavior
at the interface. In Figure 17 CLMS images of starch in water and oil are displayed. Particles have first
been suspended in oil and then brought in contact to the water interface. One can see that the starch
particles are re-wetted by the water phase and diffuse to the water sided interface. But oil is
surrounding the particles and clusters are created which can be small or even larger agglomerates. It
has to be mentioned that the images taken here are done in quiescent and no mechanical or thermal
force is applied. Obviously starch particles can be rewetted by the water phase but an exact wetting
angle could not be determined using this technique. Since wetting behavior is not clear defined, no
statement is made whether the suspension is in the pendular or capillary state. Therefore for further
discussion the amount of secondary fluid for starch suspensions is given via a secondary fluid
saturation Ssec which does not indicate a statement about wettability:
(4.1)
The second system investigated here are cocoa particles suspended in vegetable oil with water as
secondary fluid. The suspension is presumably in the capillary state since oil as the bulk fluid is the
better wetting liquid as has been reported by Galet [39]. The three phase contact angle was measured
to be θ = 148 4.5° using the sessile drop method in the three phase system. To further analyze the
contact angle and the re-wetting behavior of the particles, microscopic images from particles at the oil-
water interface were taken. The results are shown in Figure 18.
Figure 18: Cocoa particles at the oil/water interface. Particles have been first dispersed in oil
(left) and in water (right) before creating the interface.
In the images where particles initially were dispersed in oil, it can be clearly seen how the particles
stick to the interface. It cannot be clearly distinguished if the particles prefer to be in the water or oil
phase. Depending on particle nature we can see both preferences. If we take a closer look to the
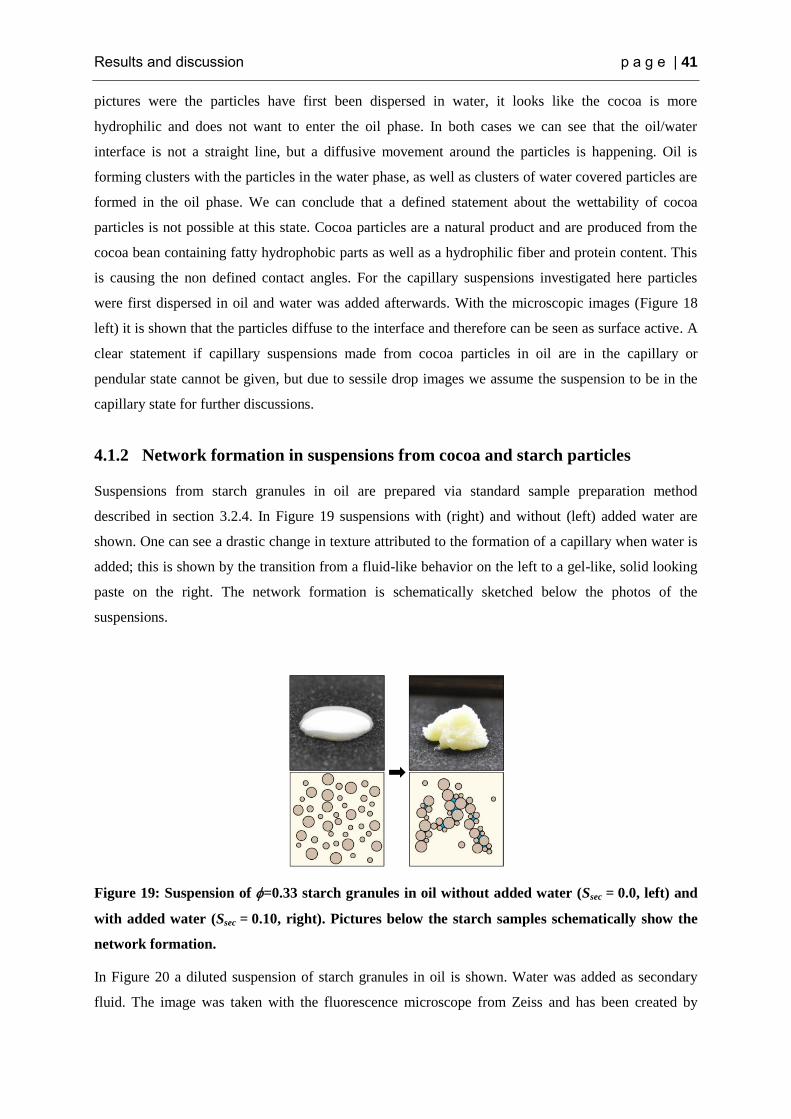
Results and discussion p a g e | 41
pictures were the particles have first been dispersed in water, it looks like the cocoa is more
hydrophilic and does not want to enter the oil phase. In both cases we can see that the oil/water
interface is not a straight line, but a diffusive movement around the particles is happening. Oil is
forming clusters with the particles in the water phase, as well as clusters of water covered particles are
formed in the oil phase. We can conclude that a defined statement about the wettability of cocoa
particles is not possible at this state. Cocoa particles are a natural product and are produced from the
cocoa bean containing fatty hydrophobic parts as well as a hydrophilic fiber and protein content. This
is causing the non defined contact angles. For the capillary suspensions investigated here particles
were first dispersed in oil and water was added afterwards. With the microscopic images (Figure 18
left) it is shown that the particles diffuse to the interface and therefore can be seen as surface active. A
clear statement if capillary suspensions made from cocoa particles in oil are in the capillary or
pendular state cannot be given, but due to sessile drop images we assume the suspension to be in the
capillary state for further discussions.
4.1.2 Network formation in suspensions from cocoa and starch particles
Suspensions from starch granules in oil are prepared via standard sample preparation method
described in section 3.2.4. In Figure 19 suspensions with (right) and without (left) added water are
shown. One can see a drastic change in texture attributed to the formation of a capillary when water is
added; this is shown by the transition from a fluid-like behavior on the left to a gel-like, solid looking
paste on the right. The network formation is schematically sketched below the photos of the
suspensions.
Figure 19: Suspension of =0.33 starch granules in oil without added water (Ssec = 0.0, left) and
with added water (Ssec = 0.10, right). Pictures below the starch samples schematically show the
network formation.
In Figure 20 a diluted suspension of starch granules in oil is shown. Water was added as secondary
fluid. The image was taken with the fluorescence microscope from Zeiss and has been created by

Results and discussion p a g e | 42
overlaying the white light image with the fluorescence intensity image, for the latter the low intensity
scattering has been removed and the higher intensity has been colored in yellow. The water is located
between the particles, which indicates that a strong cohesion is created due to capillary forces.
Figure 20: Microscopic image of a capillary suspension made from starch granules in oil with
water as secondary phase. Water was colored with a fluorescent dye (PromoFluor-488 Premium,
carboxylic acid) which appears yellow in the picture.
The transition of a cocoa suspension from a weakly viscoelastic fluid to a gel upon addition of water is
shown in Figure 21. These images demonstrate that capillary suspensions can be created in cocoa
suspensions even when no sugar is present. Cocoa particles form networks and maintain a smooth
texture but do not cause large agglomerates as it has been reported for sugar particle suspensions [13].
Stability against sedimentation of cocoa particles suspended in oil at a volume fraction of = 0.35 is
also pictured in Figure 21. The pure suspension shows clear phase separation after 5 days resting
(Figure 21, right A), whereas the suspension with water added as secondary fluid (S = 0.90) shows no
settlement at all (Figure 21, right B). This indicates that a sample spanning network is created, which
is preventing the particles from sedimentation.
Figure 21: Suspension of =0.35 cocoa solids in oil suspension without added water (S = 1.0, left)
and with added water (S = 0.90, middle). Right image: sedimentation behavior after a storage
time of 5 days, (A) no water added, (B) S = 0.90.
Cocoa particles are known to exhibit a strong autofluorescence [87], [88] in all available wavelength
excitations of optical microscopes. This makes it hard to detect capillary bridges since it cannot be
distinguished between particle autofluorescence and the dyed secondary fluid. Fluorescence of the
particles is due to phenolic substances in the cocoa that cannot be removed easily. An attempt has been
made to suppress the auto-fluorescence by dying the cocoa particles with toluidine blue. This dye is
docking on the phenolic groups in the cocoa particles resulting in a reduced fluorescent signal [89].
This is pictured in Figure 22. It can be clearly seen that on the left picture the particles show
A B

Results and discussion p a g e | 43
fluorescence for both laser extinctions, the 488 nm laser signal is pictured in green, the 552 nm in red
and overlaid fluorescence appears yellow. In the middle image the fluorescent signal is highly
suppressed by the toluidine blue. Only a weak fluorescent signal occurs for the 488 nm laser and some
yellow spots refer to an overlaid signal. In the left image water that been colored with a carboxylic
acid (promofluor-488) is added to the sample via the regular suspension preparation method. Cocoa
particles appear red or yellow, whereas the water phase appears pure green in the image. Apparently,
the water phase is homogeneously distributed between the particles. However, a network structure
cannot be visualized.
Figure 22: Confocal images of cocoa particles in oil with and without added water. The system
was excited with both laser lines (488 nm and 552 nm). In the left image cocoa particles are used
as provided, in the middle they have been dyed with toluidine blue and the right image shows a
dyed particles suspension with water as secondary fluid (green). The microscope setup was kept
constant.
4.1.3 Rheological behavior of cocoa and starch suspensions
Rotational shear measurements were performed for oil based systems made with cocoa and starch
particles. In the following section the basic rheological parameters like yield stress and viscosity are
discussed as a function of volume fraction and saturation. Also steady shear data is compared with
oscillatory shear measurements performed on the same rotational rheometer. In Figure 23 A the yield
stress of starch granules in oil is shown as a function of saturation varied between Ssec = 0.0 to
Ssec = 0.10 for volume fractions of ϕ = 0.29 and ϕ = 0.33. Yield stress data are normalized to the
respective value of the suspension where no water is added. The suspensions with water as secondary
phase show a linear increase of yield stress in a semilogarithmic plot and the absolute value of the
slope is = 30.3 ± 2.8 for both concentrations. This results in an increase of σy by three orders of
magnitude when Ssec is increased from 0.0 to 0.1. This confirms the reinforcement of a sample
spanning network when water is added to the starch in oil suspension since the yield stress is
characteristic of the network strength. Starch suspensions with higher saturation exhibit a strong,
inhomogeneous agglomeration, so reliable measurements could not be performed at saturations
Ssec > 0.10.

Results and discussion p a g e | 44
0.00 0.05 0.10
100
101
102
103
A
|a|=30.3
y/
y,0
= 29%
= 33%
Ssec
0.3 0.4 0.5 0.6 0.7 0.8 0.9 1.0
100
101
102
103
104
B
= 30 %
= 35 %
= 40 %
y/
y
,0
S
|a|=14.4
Figure 23: Normalized yield stress as a function of saturation of the preferentially wetting fluid
for (A) corn starch and (B) cocoa particles.
In Figure 23B the yield stress for cocoa suspensions with different volume fractions of cocoa is plotted
over a wide range of saturation S. Again, yield stress data are normalized to the corresponding value
where no water is present (S = 1.00). The normalized yield stress for different volume fractions
follows a single master curve. Similar behavior has been observed for PVC capillary suspensions as
shown in Figure 24.
Figure 24: Yield stress of a PVC suspension (capillary state) and a suspension made from
Hermatite particles (pendular state) in DINP/water mixtures [1].
The yield stress of the cocoa suspension increases until a saturation of 0.7 is reached and then drops
until a value close to the initial stress is obtained. This latter decrease is presumably due to spherical
agglomeration [10], [11]. In previous studies spherical agglomeration within capillary suspensions at
elevated degrees of saturation was reported for oxide powders in oil [50]. The process of wet
granulation with water as bridging fluid is used to agglomerate dry cocoa powder [90]. The same
granulation can also occur in suspension at high secondary liquid fractions during mixing. When the
saturation exceeds 0.5, phase inversion is visible: water acts as the continuous phase and the
suspension begins to phase separate. Again, a linear increase of the reduced yield stress as a function

Results and discussion p a g e | 45
of saturation is found in semilogarithmic representation for 0.9 < S < 1.0 with a slope of
= 14.4 ± 1.0, which is half the value found for starch suspensions. This difference may be caused
by several factors such as wetting angle, interfacial tension and, most relevant here, the fact that cocoa
particles have a higher porosity. This may lead to an uptake of water into the particles, which is then
not available for capillary bridging. Differences in wetting behavior and the resulting effect on the
rheology of the admixture are discussed in the following sections.
Viscosity curves for starch (A) and cocoa (B) suspensions in oil at different saturations are shown in
Figure 25. In both cases, the low shear viscosity increases with the addition of water by several orders
of magnitude. At shear rates > 500 s-1
the curves approach each other, since capillary bridges are
breaking and viscosity is then just a function of particle volume fraction. This strong degree of shear-
thinning guarantees that capillary forces do not affect processing or application where high shear rates
are involved [91]. For spherical hard sphere suspensions with particle loadings between = 0.33 and
= 0.35 and b = 34 mPas we expect a high shear viscosity of 180 – 220 mPas [40], [92]. The absolute
values observed here for the cocoa and starch suspensions are about a factor of 2-3 times higher. This
is partly due to the non-spherical shape of the particles but may also indicate residual agglomerates in
the suspension. For the starch suspensions, the high shear rate viscosity perfectly matches irrespective
of the saturation. This confirms that granule swelling does not play a significant role in these capillary
suspensions and bridges can be destroyed completely under high shear conditions.
10-3
10-2
10-1
100
101
102
10-1
100
101
102
103
104
105
106A
(s-1)
Ssec
= 0.00
Ssec
= 0.04
Ssec
= 0.06
(
Pa
s)
10-3
10-2
10-1
100
101
102
10-1
101
103
105
(
Pa
s)
S=1.00
S=0.95
S=0.90
S=0.85
(s-1)
Figure 25: Viscosity vs. shear rate for suspension of starch granules (ϕ=33%, A) and cocoa
particles (ϕ=35%, B) suspended in oil, at different saturation levels.
For the cocoa particles (Figure 25B), the viscosity curve with no added water (S = 1.0) has a lower
high shear viscosity value than samples were water was incorporated. This could be an evidence for
water absorption by the particles [93]. Since the amount of water, that we add as the secondary liquid
is small compared to the whole particle volume, we assume residual agglomerates to be responsible
for the increased high shear viscosity and not only particle swelling. At intermediate shear rates, all
viscosity curves for starch as well as cocoa suspensions exhibit a short plateau region where we

Results and discussion p a g e | 46
assume structural changes to occur. Flow-induced break-up or reorganization of agglomerates might
be involved there [21].
Comparison of rotational and oscillatory measurements
Oscillatory shear tests can be used to describe the viscous and elastic behavior of a suspension. In the
following, oscillatory amplitude sweeps and frequency sweeps are discussed. In Figure 26 a frequency
sweep, operated at σ = 5 Pa of a corn starch suspension (ϕ = 33%) with different amounts of water is
depicted. The complex shear modulus
(4.2)
is plotted over the frequency. A clear transition from a fluid like behavior, for the sample without
added water (Ssec = 0.00), to a gel like and highly elastic behavior, for samples with added water, can
be seen. The more water is added to the suspension, the higher the complex modulus.
10-1
100
101
102
10-2
10-1
100
101
102
103
104
105
106
|G*| (
Pa)
f (Hz)
Ssec
= 0.00
Ssec
= 0.04
Ssec
= 0.08
Figure 26: Frequency sweep of corn starch suspensions (ϕ = 33%) with varied saturations.
Measurements have been performed at σ = 5 Pa.
In the previous section yield stress is measured via a continuous shear test in stress controlled mode.
But the strength of the network of a capillary suspension can also be characterized by performing
oscillatory shear tests [1], [21], [86]. The advantage of oscillatory amplitude tests lies in a reduced
sensitivity for wall slip. This has been explained in more detail in chapter 3.2.1. For suspensions
correlations between yield stress values obtained from steady shear and oscillatory shear
measurements have been widely studied [94]–[96] and for different fluids various correlations can be
found. For capillary suspensions no general approach has been done yet. Two characteristic data
points can be calculated from oscillatory data which can be correlated to the yield stress: The
crossover point of G’ and G’’ called σcross over and the critical stress where G’ is reduced by 10% of its
value from linear viscoelastic region written as σcrit..

Results and discussion p a g e | 47
In Figure 27 the yield stresses obtained from steady shear measurements are plotted over the critical
shear stress from oscillatory measurements (A) and over the crossover point (B) for starch and cocoa
suspensions, which have been prepared with varied secondary fluids (aqueous fructose and glycerol
mixtures) and secondary fluid contents. For the suspensions shown here the yield stress from steady
shear data exhibit a linear relationship with the critical shear stress calculated from oscillatory data,
since the slope is measured to be =1.07. Critical stress data σcrit can therefore be calculated from σy
by applying the equation σcrit = 0.14 σy1.07
. In contrast for the cross over point σcross over, the slops is
=1.2 indicating a weak non-linear relationship, which can be describes as σcross over = 0.21 σy1.2
.
These results are not in line with data found in literature for silica dispersions [97], where it is said that
the cross over tends to overestimate the yield stress of suspensions.
Figure 27: Correlation of yield stresses obtained from shear measurements and oscillatory
measurements: critical stress (A) and crossover point (B).
4.1.4 Influence of contact angle and viscosity ratio
For a basic characterization of the capillary suspensions of particles dispersed in oil, measurements
were done using starch particles dispersed in sunflower oil with water as secondary fluid. To
investigate the influence of wetting angle, interfacial tension and viscosity ratio, the particle surface
was treated and various aqueous glycerol and poly ethylene oxide (PEO) mixtures have been used as
secondary fluid. All yield stress measurements have been carried out using the vane geometry to avoid
wall slip. The suspensions were all prepared with a volume fraction of starch particles of ϕ = 0.33.
Secondary phase viscosity
If we have a look at the force of capillary bridges acting between two particles, a direct influence of
secondary phase viscosity on capillary strength and therefore flow behavior of capillary suspensions is
not expected [44]. But the preparation step of capillary suspensions may be seen as an emulsification
of the secondary fluid in the bulk fluid. For emulsion preparation, it is known that laminar droplet
breakup is a function of the ratio of dispersed phase and continuous phase viscosity = [61].

Results and discussion p a g e | 48
Therefore, we have investigated the influence of the viscosity ratio on secondary phase distribution
and flow behavior. To modify the secondary phase viscosity, water was thickened with polyethylene
oxide (PEO) varying in concentration from 0.1 wt.% to 2.5wt.%. This increases the viscosity of the
secondary phase by three orders of magnitude. But within experimental uncertainty all solutions show
the same value of interfacial tension γ = 22 2 mN/m.
Figure 28 shows corresponding yield stress for a cocoa and a starch suspension. The yield stress does
not change significantly with increasing secondary phase viscosity, i.e. the droplet breakup conditions
do not have an influence on network strength. The capillary bridging even occurs at ratios >>1
where shear induced droplet breakup should not appear assuming laminar shear flow and quasi-static
conditions [61]. This suggests that the bridging phenomenon is not a just function of droplet breakup
and emulsification of the secondary phase. Instead we propose that the network state is energetically
more favorable and the network formation also depends on the diffusion of the secondary fluid. This
energetic favorability was previously demonstrated for the formation of small particle number clusters
induced by a non-wetting secondary fluid [21].
10-2
10-1
100
101
100
101
102
103
y (
Pa)
cocoa in oil; S = 0.80
starch in oil; Ssec
= 0.06
d /
c
Figure 28: Yield stress of corn starch (ϕ = 0.33) and cocoa (ϕ = 0.35) particles suspended in oil
with aqueous PEO solutions of different viscosity as secondary phase versus the viscosity ratio of
water to oil ηd/ηc.
Assuming droplet breakup occurs at a Capillary Number Ca ≈ 1 a minimal attainable droplet size due
to mixing can be estimated assuming = 500 s-1
and = 0.5 Pas, which refers to the suspension
where no water was added. Calculation results in a minimum droplet radius of r ≈ 96 µm, which is
much larger than the typical size (<< 5 µm) of a capillary bridge for the particle sizes used here. This
is further evidence for a diffusion driven, energetically favored network formation.
Contact angle
Changing the contact angle of the two fluids with the particle without influencing the interfacial
tension can be done by treating the particle surface. This can be achieved easily for starch particles.

Results and discussion p a g e | 49
Their surface can be covered with octenyl succinic anhydride (OSA), thus is making the particle more
hydrophobic [85]. Accordingly, the wetting angle in the three phase system starch/vegetable oil/water
should increase. Nevertheless, the three phase contact angles measured via sessile drop method for all
treatment levels investigated here were found to be θ = 1307° and no difference was detected with
our setup. On the other hand, an increase in OSA concentration results in a reduction in the yield stress
as shown in Figure 29 for two saturation levels.
0 1 2 3
101
102
Ssec
= 0.10
Ssec
= 0.06
y (
Pa)
% OSA
Figure 29: Yield stress of suspensions (ϕ = 0.33) prepared from particles treated with OSA in oil
for two saturations (Ssec = 0.06 and Ssec = 0.10) over OSA concentration.
It seems that subtle differences in surface properties not resolvable with conventional analytical
methods still have a remarkable impact on the rheology of these capillary suspensions. At constant
saturation a linear decrease of the yield value is detected. This demonstrates that particle surface
treatment is an option to tune the flow behavior of capillary suspension.
Figure 30 shows the yield stress of a corn starch in vegetable oil suspension ( = 0.33) with water or
glycerol/water mixtures added as secondary liquid at various degrees of saturation Ssec. At given Ssec
the yield stress increases with increasing glycerol content. Samples with pure glycerol as the
secondary liquid show yield stresses up to one order of magnitude higher than samples made with pure
water. The yield stress at Ssec = 0.06, for example, is σy = 39 4 Pa with water as the secondary phase,
whereas with glycerol the yield stress is measured to be σy = 405 22 Pa at the same saturation. This
behavior fits the capillary bridging theory, whether the suspension is in the capillary or pendular state.
Assuming capillary state, the Theory of Binks (section 2.2) can be applied. Particles that are placed at
an interface of two fluids are held with the energy E given by eq. (2.6). The maximum energy Emax is
therefore given at a contact angle of 90° and approaches zero for contact angles close to 180°. The
energy gain coming with the formation of clusters varies with contact angle and degree of saturation
[21]. In the aforementioned paper, it is described, that strongest clusters i.e. cluster structures with the
lowest energy are formed at contact angles close to 90° and high saturations. Since glycerol and

Results and discussion p a g e | 50
sunflower oil form a contact angle with starch granules closer to 90° than for water/sunflower oil
(Table 6), the force for cluster breakup is higher and the corresponding clusters are more stable. This
results in a more stable network and finally in a higher yield stress if glycerol is used as secondary
fluid. Even when assuming that the results of sessile drop measurements are not true equilibrium
values, a trend in wetting can be seen: with more glycerol in the mixture better wettability of the starch
by the secondary fluid can be detected. In pendular state, when applying equation (2.4) it can be stated
that for lower contact angles the capillary force between two particles becomes stronger. In conclusion,
whether the system is in pendular or in capillary state, lower contact angles result in stronger particle
bridging and an increased yield stress of the suspension.
Table 6: Contact angles measured via sessile drop method between starch and various glycerol-
water mixtures in the presence of sunflower oil as well as viscosity of these mixtures at 20°C.
viscosity
in mPa s
contact angle
in °
water 1 126 13.0
25% glycerol 2.5 104 17.1
50% glycerol 8.5 101 2.7
75% glycerol 53.3 93 7.9
100% glycerol 1100 92 9.0
Uptake of secondary fluid by the starch granules could also be a reason for the variation of the yield
stress with glycerol/water mixing ratio at constant S. Starch granules absorb water which is
incorporated into their amorphous parts [67]. Water that is trapped within the granules is not available
to act as a bridging fluid. The strength of the network should decrease with increasing fraction of
water in the secondary liquid since the effective saturation Seff is lower than the nominal saturation Ssec
calculated from the amount of added fluid. In contrast, glycerol is not absorbed by the particles due to
its higher molecular weight and therefore more secondary fluid is available for capillary bridging. For
the measured difference in yield stress due to water incorporation into the granules, about 0.8g of
water per 10g of starch must be trapped in the granules. This is a reasonable number [67], so water
uptake as well as variation of contact angle might contribute to the variation of yield stress in capillary
starch suspension. For non absorbing glass particles atomic force measurements performed by
Negreiros [22] also have revealed that glycerol forms stronger capillary bridges in oil than water. They
claim viscous forces to be the reason for this difference, but an influence on viscosity cannot be
confirmed by rheological measurements in this study (see Figure 29).
Swelling of starch granules through the uptake of water increases the granule volume by about 12%
for the maximum water uptake calculated above [67]. This small difference in volume fraction does

Results and discussion p a g e | 51
not account for the overall increase in yield stress in capillary suspensions and it would imply that the
difference in σy between suspensions prepared with glycerol or water should monotonically increase
with Ssec.
0.00 0.02 0.04 0.06 0.08 0.10 0.12
100
101
102
103
y (
Pa)
Ssec
100% glycerol
75% glycerol
50% glycerol
25% glycerol
water
Figure 30: Yield stress of a starch suspension in oil (ϕ = 0.33) vs. saturation for various
glycerol/water mixtures as secondary fluid.
4.1.5 Mixtures of hydrophilic and hydrophobic particles
In food products suspensions do rarely consist of just one particle type, but are mixtures of particles of
different shape and surface properties (roughness, wetting). In this section a closer look is taken on
mixtures of hydrophilic and hydrophobic particles and how they behave rheologically. Pure
Suspensions of hydrophilic or hydrophobic particles already can show different flow behaviour [99].
For mixtures of hydrophilic and hydrophobic particles in an water/oil emulsion it has been found that
adding hydrophilic particles to a Pickering stabilized emulsion system with hydrophobic particles
results in an phase transition of the emulsion when more than twice the mass of hydrophilic particles
compared to the hydrophobic once are added to the system [100]. The aim of this experiment is to find
out if we can create pendular state suspensions as well as capillary state suspension by changing
particle surface properties while keeping the bulk and secondary phase constant.
Two particle combinations have been analyzed in order to identify a general behavior. First, mixtures
of hydrophilic Socal particles (Socal 31, x50 = 70 nm) and hydrophobic Socal particles (Socal U1S1,
x50 = 80 nm) in sunflower oil with a volume fraction of ϕ = 10% were investigated. Water was added
as secondary fluid at two saturation levels. Hydrophobized Socal U1S1 suspensions (ϕ = 10%) without
secondary fluid exhibit a yield stress of σy = 8.5 ± 0.5 Pa. Yield stress is linearly decreasing with
increasing volume fraction of hydrophilic Socal until a yield value of σy = 1.4 ± 0.1 Pa is reached for
pure Socal 31 suspensions.

Results and discussion p a g e | 52
0.2 0.6 1.00.0 0.4 0.810
1
102
y /
y,
S=
0
hydrophilic fraction H
Ssec
= 0.03
Ssec
= 0.05
Figure 31: Normalized yield stress over hydrophilic fraction for Socal particle mixtures in oil
with a volume fraction of ϕ = 10% and saturations of Ssec = 0.03 and Ssec = 0.05.
The results of the measurements for saturations of Ssec = 0.03 and Ssec = 0.05 are shown in Figure 31.
For hydrophilic volume fractions H = Vhydrophilic particles / Vhydrophobic particles < 0.6 the yield stress is
increasing with increasing H for both saturations. As has been reported before, hydrophobic Socal
particles in silicon oil can form capillary suspensions with the addition of small amounts of water [1].
At the given saturations we have already exceeded the plateau region [1], so no different behavior is
expected between the two saturations. Yield stress of the suspensions with added water is constant and
increase in yield stress is due to decreasing zero value σy,S=0. For higher fractions of hydrophilic
particles (H = 0.7) the normalized yield stress first drops and then increases again.
Figure 32: Confocal images of Socal particle mixtures in oil with water (Ssec = 0.05) as secondary
fluid. From left to right: H = 0; H = 0.3; H = 0.7; H = 1.
The structural changes occurring in the analyzed system here can be visualized using confocal
microscopy. Hydrophilic particles have been dyed using Rhodamine B, water was colored with
Promofluor-488, the oil phase and the hydrophobic particles were kept uncolored. Images of different
hydrophilic fractions of Socal at Ssec = 0.05 are pictured in Figure 32. One can see that for H = 0 the
water (appears green in the images) is distributed through small droplets in the sample. For H = 1,
hardly any water can be detected. This is due to the large amount of dyed particles covering the water
signal. With a hydrophilic fraction of H = 0.3, the distribution of the water is fairly homogeneous and

Results and discussion p a g e | 53
appears more floc like. At H = 0.7 a clear change is visible, the water appears as large droplets,
covered by particles. These larger droplets reduce the water that is available for particle capillary
bridging and therefore the yield stress is decreased as shown in Figure 31. From the confocal images it
cannot be clear said if the structure is mainly build by hydrophilic or hydrophobic particles.
As a second system starch particles have been hydrophobized and mixtures from natural and treated
particles were investigated. The hydrophobization of the particles is described in Section 3.2.5. In
contrast to the Socal suspension this system shows a monotonic variation of σy. The yield stress
decreases with increasing amount of hydrophobized particles and at H = 0 σy equals the value σy,S=0 of
the pure suspension. This is demonstrated in Figure 33. The yield stress first drops slowly, since there
are still hydrophilic particles in the system which can form a sample spanning network. Then σy
decreases due to a lower “capillary active” particle volume fraction, indicating a weaker network [86].
If no natural starch particles are left in the system no sample spanning network can be created and the
yield stress drops.
0.0 0.5 1.010
1
102
y /
y
, S
=0
hydrophilic fraction H
Figure 33: Yield stress of a starch in oil suspension (ϕ = 35%) with a water saturation of
Ssec = 0.07 plotted over hydrophilic fraction H of starch particles.
4.1.6 Particle preconditioning
From wet granular material science it is well known that particles form capillary bridging networks
not only if water is added directly to the granular substance which is a common approach in wet
granulation processes [101], [102] but also if the particles themselves contain water that is adsorbed on
the particle surface as a water layer due to capillary condensation. This is intensively discussed in
reference [103]. Capillary bridges form if the wet particles come into contact. The system is then not
in an energetically favorable state since a sharp edge is created between the water layers [104]. The
wetting liquid induces the formation of a bridge which is energetically favorable and are held together
due to the negative Laplace pressure across the curved surface [104].

Results and discussion p a g e | 54
Capillary forces can also form in ternary mixtures where one fluid is adsorbed to the particle surface
and the bridges are formed upon contact of two particles [105]. It has been reported that capillary
bridges are formed between particles dispersed in partially miscible liquids due to an absorbed fluid
layer when stepping into the two phase region [106], [107]. This aggregation can be formed
spontaneously [4], [108] or can been induced by shear [109].
In the following section experiments are discussed revealing how initially wet particles behave when
dispersed into a dry, unpolar bulk phase. We compare the rheological behavior between two
preparation methods of the suspensions. These preparation methods are schematically depicted in
Figure 34. On the one hand, the particles were preconditioned with a specific amount of water as has
been described in section 3.2.5 and these wet particles were directly dispersed in sunflower oil. On the
other hand the same amount of water that has been soaked by the particles in the first preparation
method is added drop wise under shear after dispersing the dry particles in oil. The setup for particle
preconditioning as well as amount of absorbed water by different particles are described in section
3.2.5.
Figure 34: schematic diagram of two preparation methods for oil continuous capillary
suspensions.
First measurements were performed using three different model systems: the PVC particle Vinnolit C
12/62 V and two different calcium carbonate particles Socal U1S1 (hydrophobic) and Socal 31
(hydrophilic). In Figure 35 the data obtained from Cavalier [110] is compared to own data from
conditioned Socal 31 particles. The water content related to the bulk phase from Cavalier’s data has
been calculated from given water activity (aw-value) using Herny’s law, which leads to mw = aw / 606
[110]. The plot shows that the yield stresses show a similar dependence on mw but the Cavalier data
exhibit much higher absolute values. This can be attributed to the different hydrophobic bulk phase
substances and a slightly higher volume fraction of particles in the Cavalier study.

Results and discussion p a g e | 55
0.000 0.001 0.00210
0
101
102
mw (%)
data from Cavalier
preconditioned Socal 31
y (P
a)
Figure 35: Yield stress of a suspension from Socal 31 in dioctylphthalate (ϕ=10.8%) with
different water content in the oil phase [110] compared to a suspension from preconditioned
Socal 31 particles in sunflower oil (ϕ=10%) plotted over the water content (calculated to the oil
phase).
In Figure 36 the yield stress data from hydrophobic and hydrophilic Socal suspensions are plotted over
saturation S. One can see that for hydrophilic calcium carbonate particles (Socal 31) the yield stress is
higher for direct addition of water. So it seems that a small amount of water is trapped in the
conditioned particles that cannot contribute to network formation. Also due to the very high sensitivity
of the systems to small volumes of water, humidity while sample preparation can also have a high
impact even though using dried particles. For the hydrophobic Socal (Socal U1S1) particles the
measured data points show a wider deviation than for the hydrophilic ones. The experiments reveal
that suspensions prepared with conditioned particles tend to have a higher yield value than suspensions
made from dry particles with subsequent water addition. First, it seems unlikely that water absorbs to
hydrophobic particles during the preconditioning step, but as has been reported before even fully
hydrophobic particles can adsorb water due to defect sites at the surface [111]. It has also been shown
that the greater the hydrogen bonding capacity and the smaller the size, the higher the water adsorption
on particle surfaces [112]–[114]. So for Socal U1S1 particles water is adsorbed at the surface and
water incorporated into the suspension this way is available to form a capillary suspension. It has been
reported earlier that hydrophobically modified calcium carbonate particles in oil form a capillary state
suspension when water is added [1], [3]. So we propose that the water that is bond around the particle
surface is displaced by the oil and thus available to form small Socal particle cluster, further
aggregating into a sample spanning capillary network. The deviation between the suspensions from
conditioned particles and the direct addition of water can be explained as for Socal 31 particles by
humidity or irreversible bonding of water into the particles.

Results and discussion p a g e | 56
0.000 0.005 0.010 0.015 0.020
100
101
102
A
S
water added to bulk
suspension
conditioned Socal 31
y /
y, S
=0
0.985 0.990 0.995 1.000
100
101
B
water added to bulk
suspension
conditioned Socal
S
y /
y, S
=0
Figure 36: Comparison of yield values of suspensions made from pre conditioned and dry Socal
particles (A: Socal 31, ϕ = 10%; B: Socal U1S1, ϕ = 14%) plotted over the saturation S.
The different suspension preparation methods described above have also been used for Vinnolit
particles. The results are depicted in Figure 37. Yield stress of suspensions prepared with the two
preparation methods nicely coincide within measurement error. The yield stress does not increase
drastically upon the addition of water, but an increase of the factor of three can be measured and
considered to be due to a weak network formation. The results discussed above all clearly show that
capillary suspensions can be formed using both preparation methods for pendular and capillary state as
long as particles exhibit a slight hygroscopic nature. It also suggests that theory from wet granular
material discussed in the section above can be applied to the three-phase systems considered here.
0.94 0.95 0.96 0.97 0.98 0.99 1.00
1
2
3
conditioned Vinnolit
water added to bulk suspension
S
y
in P
a
Figure 37: Comparison of yield values of suspensions made from pre-conditioned and dry
Vinnolit particles (ϕ=35%) plotted over the saturation S.
Food particles like cocoa and starch tend to absorb water as well as oil. For this it is interesting how
the two preparation methods compare. In Figure 38A the yield stress data from cocoa particle
suspensions prepared with the two methods are shown. For saturation values S < 0.90 direct water
addition reveals higher values for the yield stress than particle preconditioning. Is the particle soaked
with water before coming in contact with the oil phase, parts of the soaked water might be irreversibly

Results and discussion p a g e | 57
incorporated in the inhomogeneous particles especially at high water content, resulting in a reduced
yield value compared to suspensions prepared via standard procedure. The bridge formation will be
induced by the energetically driven curvature formation described for wet granular material in the
section above. If the particles however are soaked with oil and the added water needs to remove the oil
from the surface afterwards in order to build a capillary bridge, less water can be soaked by the
particles and more fluid is available for the network formation.
In contrast, for starch suspensions yield stress values from both preparation methods match perfectly
as illustrated in Figure 38B. It has been investigated before that starch granules do adsorb water in a
single layer and, with higher relative pressure, multiple layers. The uptake can exceed a few molecular
layers if the granule swells and thus incorporates water molecules [67], [81], [115]. Water added to the
suspension is always utilized in the same way for both methods, whether all water is used for the
formation of bridges or if parts of the secondary fluid are still incorporated into the particles and not
available for network formation. The difference in behavior of starch and cocoa suspensions may be
due to the fact that cocoa particles exhibit a more porous and inhomogeneous structure, as well as a
wider particle size distribution with highly anisotropic form factors (see section 3.1.1) compared to
starch particles.
The findings for model starch and cocoa suspensions clearly demonstrate that water which is ad- or
absorbed by the particles is not trapped in the particle structure but obviously can diffuse from an
adsorption layer into capillary bridges, no additional mechanical energy input is required to create
capillary suspensions. The phenomenon suggests a new preparation method for all hygroscopic
particles that form capillary suspensions when oil is the bulk phase. So the described method may be a
valuable route for processing of new food products, but also points at a complication in existing
processes where the product consistency may dramatically depend on the storage conditions for the
solid particles.
0.03 0.06 0.09 0.1210
0
101
102
103
A
water added to
bulk suspension
conditioned starch
y (
Pa)
Ssec
0.80 0.85 0.90 0.9510
0
101
102
103
B
water added to
bulk suspension
conditioned cocoa
S
y
(Pa)
Figure 38: Comparison of yield values of suspensions made from preconditioned and dry starch
(A, ϕ=33%) and cocoa (B, ϕ=35%) particles plotted over the saturation Ssec and S.

Results and discussion p a g e | 58
4.1.7 Thermal stability
For temperature stability measurements samples were stored at different temperatures (-18°C, 4°C,
20°C and 40°C) in a closed vessel for 19h and yield stress was measured after letting the samples
cool/warm up to 20°C. At 40°C samples were also stored in an open vessel to see the influence of
evaporation at elevated temperatures. Yield stress values after 19h of storage are plotted in Figure 39.
Frozen sample as well as the sample stored in an open vessel at 40°C show a distinct lower yield value
than samples stored at 4°C, 20°C and 40°C, closed.
Since σy for the sample stored at 40°C in the closed vessel is significantly higher than that of the
sample stored in the open vessel, we can conclude that water evaporates from the samples at 40°C thus
lowering the saturation and accordingly the yield value. This also indicates that water does diffuse
through the oil phase, but influences the stability only by evaporation since the closed sample does
only show a minor yield stress reduction compared to 4°C and no change compared to 20°C. Freezing
the capillary suspension clearly destroys parts of the capillary network. Ice crystals formed during this
slow freezing process may detach from the particle surface during re-heating to 20°C prior to the yield
stress measurement. It is reported that Pickering stabilized emulsions exhibit a good freeze-thaw
stability [116], but fat and ice crystals can also induce a loss in stability during freeze-thaw cycles due
to collision-mediated destabilization [117], [118]. This might explain the destabilized network in the
frozen capillary suspension. But ice crystals formed during the slow freezing process may just detach
from the particle surface and phase separate thus not being available for capillary bridging after re-
heating.
-20 -10 0 10 20 30 40
102
103
closed
open
y /
y
,S=
0
Ts (°C)
Figure 39: Yield stress of cocoa suspensions (ϕ = 30%, S = 0.9) stored at different temperatures
for 19h.
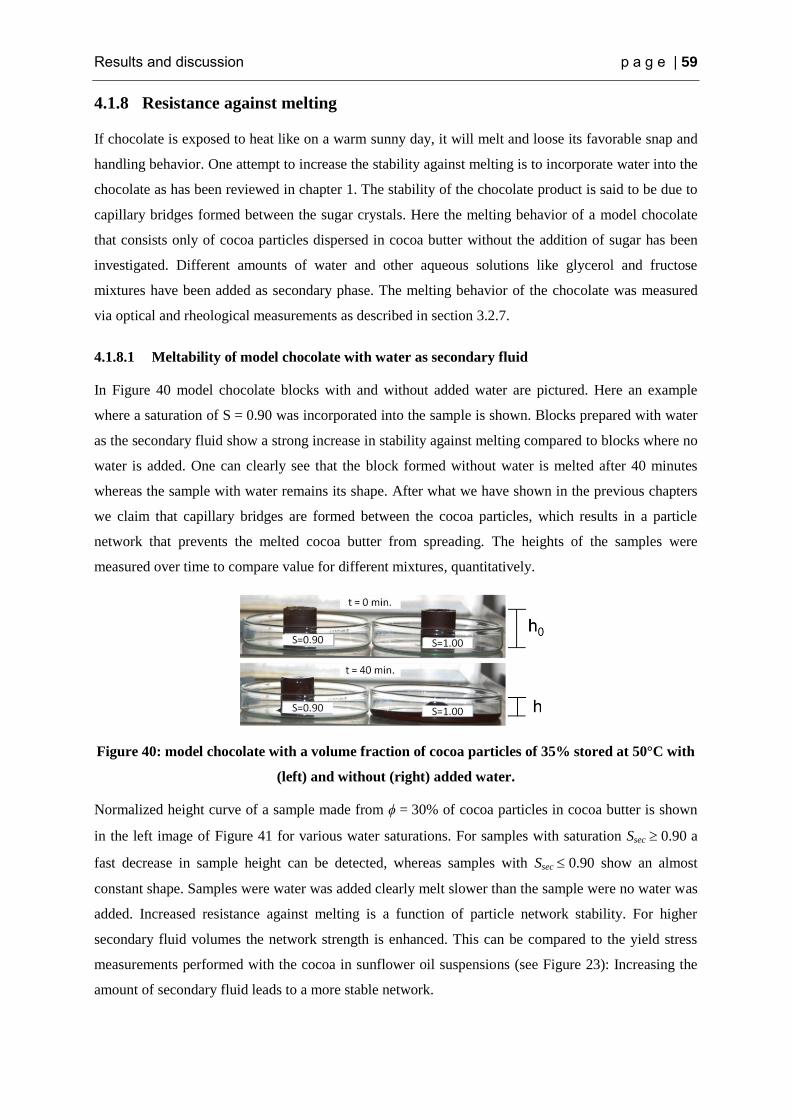
Results and discussion p a g e | 59
4.1.8 Resistance against melting
If chocolate is exposed to heat like on a warm sunny day, it will melt and loose its favorable snap and
handling behavior. One attempt to increase the stability against melting is to incorporate water into the
chocolate as has been reviewed in chapter 1. The stability of the chocolate product is said to be due to
capillary bridges formed between the sugar crystals. Here the melting behavior of a model chocolate
that consists only of cocoa particles dispersed in cocoa butter without the addition of sugar has been
investigated. Different amounts of water and other aqueous solutions like glycerol and fructose
mixtures have been added as secondary phase. The melting behavior of the chocolate was measured
via optical and rheological measurements as described in section 3.2.7.
4.1.8.1 Meltability of model chocolate with water as secondary fluid
In Figure 40 model chocolate blocks with and without added water are pictured. Here an example
where a saturation of S = 0.90 was incorporated into the sample is shown. Blocks prepared with water
as the secondary fluid show a strong increase in stability against melting compared to blocks where no
water is added. One can clearly see that the block formed without water is melted after 40 minutes
whereas the sample with water remains its shape. After what we have shown in the previous chapters
we claim that capillary bridges are formed between the cocoa particles, which results in a particle
network that prevents the melted cocoa butter from spreading. The heights of the samples were
measured over time to compare value for different mixtures, quantitatively.
Figure 40: model chocolate with a volume fraction of cocoa particles of 35% stored at 50°C with
(left) and without (right) added water.
Normalized height curve of a sample made from ϕ = 30% of cocoa particles in cocoa butter is shown
in the left image of Figure 41 for various water saturations. For samples with saturation Ssec 0.90 a
fast decrease in sample height can be detected, whereas samples with Ssec 0.90 show an almost
constant shape. Samples were water was added clearly melt slower than the sample were no water was
added. Increased resistance against melting is a function of particle network stability. For higher
secondary fluid volumes the network strength is enhanced. This can be compared to the yield stress
measurements performed with the cocoa in sunflower oil suspensions (see Figure 23): Increasing the
amount of secondary fluid leads to a more stable network.

Results and discussion p a g e | 60
In the right image of Figure 41 the apparent viscoelastic moduli for the same sample as shown in the
left image is displayed. G’ and G’’ is plotted over temperature, which was linearly increased from
32°C to 40°C within 46 minutes. The sample with a saturation of S = 0.85 is in the linear viscoelastic
region during the whole measurement. The storage modulus G’ is dominating over the loss modulus
G’’, i.e. the chocolate is not in a fluid like state, but behaves like a solid throughout the whole
temperature range. For a saturation of S = 0.95 a stronger decrease of G’ and G’’ can be detected over
temperature, but still elastic behavior is dominating. Samples with no water added show a crossover of
G’ and G’’ at around 36°C. Here the sample is melted and the suspension is in a liquid like state. This
temperature is slightly higher than reported for commercial products, where the melting temperature is
said to be around 30°C [66]. This might be due to the different processing like tempering and conching
of the commercially produced chocolate [119], [120] and the sample shown here.
0 10 20 30 40 50 600.0
0.2
0.4
0.6
0.8
1.0
A
=30%
S=1.00
S=0.95
S=0.90
S=0.85
h /
h0
t (min)
32 34 36 38 4010
-1
100
101
102
103
104
105
B
T (°C)
G',
G''
(Pa)
=30%
S=1.00
S=0.95
S=0.85
Figure 41: Sample height h normalized to the height at the beginning of the test h0 plotted over
storage time at 50°C for various saturations at a volume fraction of cocoa particles of 30% (A).
G’ (closed symbol) and G’’ (open symbols) is plotted over temperature T for the same samples
as seen in (A) at f=1Hz and τ=0.1 Pa (B).
Besides water content, the volume fraction of the particles in the suspension does also play a role in
melting behavior. In Figure 42 this is pictured for a suspension made without (A) and with water as
secondary fluid (B) with cocoa particle volume fractions of 25%, 30% and 35%. Figure (A) shows that
the volume fraction has no influence on the melting behavior when water is added. Only a very
instable van-der-Waals network exists between the cocoa particles. When the fat phase is melted, the
network collapses independent of particle volume fraction. If water is added to the suspension, a
different behavior is detected. The higher the volume fraction, the higher is the plateau that remains
after the block is melted. More particles are available to provide a stronger network. This network
resists shrinkage which results in a less collapsed looking chocolate block. Therefore, at constant
saturation and wetting behavior the created network is more heat stable. With higher volume fractions
the melting is also slower than for samples with lower volume fraction. Since without added water the
volume fraction of cocoa particles does not play a role in melting behavior, this is attributed to the

Results and discussion p a g e | 61
flow of melted cocoa butter through the porous structure provided by the cocoa particle network. In
previous work it has been shown that with higher volume fraction and constant saturation the porosity
of the capillary network is slightly decreasing [50]. But phase transport though porous media cannot
be described by the porosity alone, but is generally expressed by the specific permeability.
Permeability of a system is a function of many variables like size and shape of pores and particles, as
well as ratio of open and closed pores. Many different models have been published to describe the
theory of fluid flow through porous media, a summary can be found in reference [121]. For the
systems shown here no further statement can be made besides that permeability decreases with
increasing volume fraction.
0 10 20 30 40 50 60 700.0
0.2
0.4
0.6
0.8
1.0
A
=0.25
=0.30
=0.35
h /
h0
t (min)
0 10 20 30 40 50 60 700.0
0.2
0.4
0.6
0.8
1.0
B
S=0.90
water
=25%
=30%
=35%
h /
h0
t (min)
Figure 42: Comparison of melting behavior of suspensions with cocoa particle volume fractions
of 25%, 30% and 35% for saturations S = 1.0 (A) and S = 0.90 (B).
Model system
As a non food model system calcium carbonate particles have been dispersed in melted paraffin wax at
a volume fraction of ϕ = 8% and cooled over night at 20°C in a round form as described in section
3.2.7. In one sample water was added to a saturation of S = 0.05 (we assume pendular state) and one
was left without further treatment. In Figure 43 the two blocks are shown before and after exposure to
50°C for 110 minutes.
Figure 43: Calcium carbonate in paraffin wax (ϕ=8%) with (left) and without (right) added
water, before (upper image) and after (lower image) exposure to 50°C for 110 min.

Results and discussion p a g e | 62
The model system behaves similar to the cocoa suspensions: The sample where water has been added
melts slower than the sample without secondary fluid. It also retains its shape, whereas samples
without water collapse. The melting characteristics of these samples are depicted in Figure 44
confirming results obtained for cocoa particles suspended in cocoa butter. The increased resistance
against heat with addition of secondary fluid to a particle suspension seems to be a universal
phenomenon that may be used for various industrial applications.
0 20 40 60 80 100 120
0.0
0.2
0.4
0.6
0.8
1.0
h /
h0
t (min)
with water
without water
Figure 44: Height of the melting samples at 50°C shown in Figure 43 plotted over time.
4.1.8.2 Influence of varied secondary phase
The melting behavior of the model chocolate is strongly influenced by the kind of secondary fluid
added to the particle suspension. The type of secondary fluid has an impact on wetting behavior
between the particles and the two fluids. This wetting behavior is mainly influencing the network
strength [3]. Viscosity of the secondary fluid is contributing to the droplet size distribution, since
viscosity ratio is controlling mixing conditions in the two fluid suspension [61]. Glycerol and aqueous
fructose solution (75 wt.%) have been used as secondary fluid to investigate their impact on melting
behavior. We have shown before, that viscosity ratio in the here examined range does not have an
impact on yield value of the resulting capillary suspension for cocoa in sunflower oil suspensions (see
Figure 30). This leads to the assumption that in the samples shown here this is also a valid statement.
Figure 45 shows the melting behavior of the chocolate with the two different secondary fluids. In the
left figure (A) data are shown for suspensions where glycerol with saturations of S = 0.05, S = 0.10
and S = 0.15 was used as secondary fluid. It can be seen that with increasing saturation melting is
delayed and a higher plateau value is reached. In contrast to water (see Figure 41), all saturations
shown here are inducing a melding resistance, whereas with water stability is only reached for
saturations S > 0.10. The right figure (B) shows the melting behavior when an aqueous fructose
solution, prepared with 75wt% fructose, was added as secondary fluid. Melting behavior varies
strongly compared to water or glycerol. The sample does not show increased heat stability compared

Results and discussion p a g e | 63
to the pure model chocolate where no secondary fluid was added. The difference in melting behavior
indicates a stronger particle network for glycerol stabilized suspensions compared to suspensions
stabilized with aqueous fructose solution.
0 10 20 30 40 50 60 700.0
0.2
0.4
0.6
0.8
1.0
A
=35%
glycerol
h /
h0
t (min)
S=0.95
S=0.90
S=0.85
0 10 20 30 40 50 60 700.0
0.2
0.4
0.6
0.8
1.0
B
=35%
75% fructose
S=0.95
S=0.90
S=0.85
h /
h0
t (min)
Figure 45: Melting behavior of the model chocolate with glycerol (A) and 75wt% fructose (B) as
secondary fluids, with varied saturation.
To confirm that changes in particle network stability are due to different wetting behavior of the two
fluids, the contact angle the fluids form with the model chocolate block is investigated. The contact
angle measurements for the heat stability experiments have been performed similar to the method
described in section 3.2.3, but with a simpler setup. Model chocolate blocks were prepared as written
above and the secondary fluid droplet was placed on the surface without further treatment. This
measurement was done in air, since tempering and covering with cocoa butter was not possible with
the available instrument. We assume that results will reflect similar trends as direct measurements in
the three phase system. In Figure 46 the contact angles of glycerol (left) and 75% fructose solution
(right) on the model chocolate block with ϕ = 30% are shown. Glycerol forms a contact angle of
Θglycerol = 94 ± 4.5° and fructose of Θfructose = 110° ± 1°. The contact angle of glycerol is closer to 90°
which indicates a stronger attachment of the particles at a surface. [47], [122]. The difference between
the two angles might seem not to be very significant but applying it to Binks’ theory for particles
attached at a surface (see eq. (2.6)) detachment energy for every particle is increased by a factor of two
for glycerol compared to the fructose solution.
Figure 46: Contact angle of glycerol (left) and 75% fructose solution (right) in model chocolate
plate.
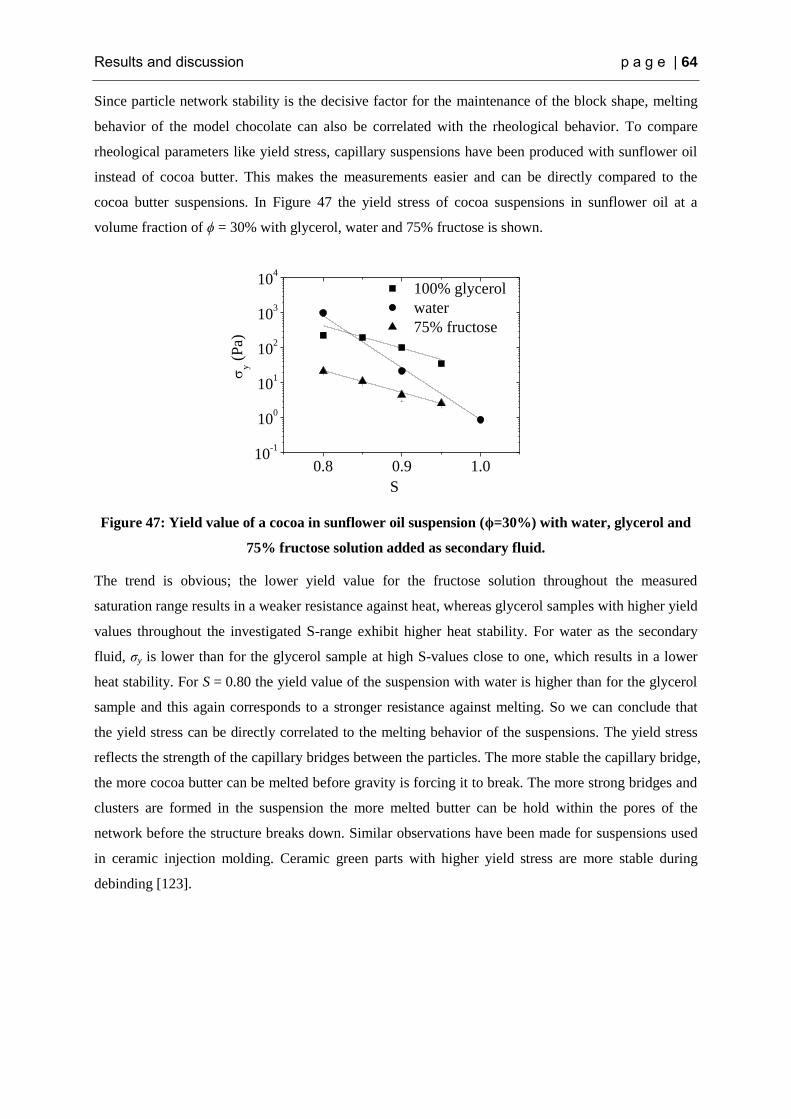
Results and discussion p a g e | 64
Since particle network stability is the decisive factor for the maintenance of the block shape, melting
behavior of the model chocolate can also be correlated with the rheological behavior. To compare
rheological parameters like yield stress, capillary suspensions have been produced with sunflower oil
instead of cocoa butter. This makes the measurements easier and can be directly compared to the
cocoa butter suspensions. In Figure 47 the yield stress of cocoa suspensions in sunflower oil at a
volume fraction of ϕ = 30% with glycerol, water and 75% fructose is shown.
0.8 0.9 1.010
-1
100
101
102
103
104
100% glycerol
water
75% fructose
y (
Pa)
S
Figure 47: Yield value of a cocoa in sunflower oil suspension (ϕ=30%) with water, glycerol and
75% fructose solution added as secondary fluid.
The trend is obvious; the lower yield value for the fructose solution throughout the measured
saturation range results in a weaker resistance against heat, whereas glycerol samples with higher yield
values throughout the investigated S-range exhibit higher heat stability. For water as the secondary
fluid, σy is lower than for the glycerol sample at high S-values close to one, which results in a lower
heat stability. For S = 0.80 the yield value of the suspension with water is higher than for the glycerol
sample and this again corresponds to a stronger resistance against melting. So we can conclude that
the yield stress can be directly correlated to the melting behavior of the suspensions. The yield stress
reflects the strength of the capillary bridges between the particles. The more stable the capillary bridge,
the more cocoa butter can be melted before gravity is forcing it to break. The more strong bridges and
clusters are formed in the suspension the more melted butter can be hold within the pores of the
network before the structure breaks down. Similar observations have been made for suspensions used
in ceramic injection molding. Ceramic green parts with higher yield stress are more stable during
debinding [123].

Results and discussion p a g e | 65
4.2 Water continuous suspensions
Cocoa particles have been used to prepare water continuous suspensions. First, the effect of
temperature on the flow behavior of cocoa in water suspensions (ϕ = 15 vol%) will be discussed,
including the influence of cocoa butter on this effect.
Secondly, various secondary fluids have been added to the cocoa suspensions to identify if capillary
suspension can be build with these water continuous suspensions. Influences of secondary phase chain
length, interfacial tension and solubility on flow behavior have been investigated. Also building
mechanisms for particle networks in these cocoa suspensions will be discussed.
4.2.1 Effect of temperature on flow behavior of pure aqueous cocoa suspensions
Suspensions of ϕ = 15 vol% cocoa particles in water were stored at three different temperatures Ts for
24h in sealed containers. After that, the viscosity function was immediately measured at a temperature
Tm = 20°C. Samples were placed into the rheometer and rested for 1 minute to assure constant
temperature. Corresponding viscosity functions are plotted in Figure 48. Storage at 30°C results in a
three decades higher low shear viscosity than storage at 20°C, whereas the suspension stored at 40°C
exhibits a viscosity level even lower than that of the sample stored at 20°C. The high shear data for
20°C and 30°C samples was taken using a capillary rheometer as described in [124]. At shear rates >
10000 s-1
, the viscosity data of samples stored at different temperatures superimpose.
10-2
10-1
100
101
102
103
104
10-2
10-1
100
101
102
103
104
Ts = 20°C
Ts = 30°C
Ts = 40°C
Ts = 30°C, stirred
(
Pas
)
(s-1)
Figure 48: Viscosity function of cocoa samples (ϕ=15%) stored at 20°C, 30°C and 40°C for 24 h.
Measurements plotted with an open symbol were completed using a capillary rheometer. Stirred
sample was prepared by mixing the sample during storage using a magnetic stirrer.
Obviously, storing water continuous suspensions of cocoa powder at different temperatures has an
enormous effect on the flow behavior of these suspensions. One might assume that the viscosity
increase results from a swelling of the particles, however, the strong increase observed here cannot be
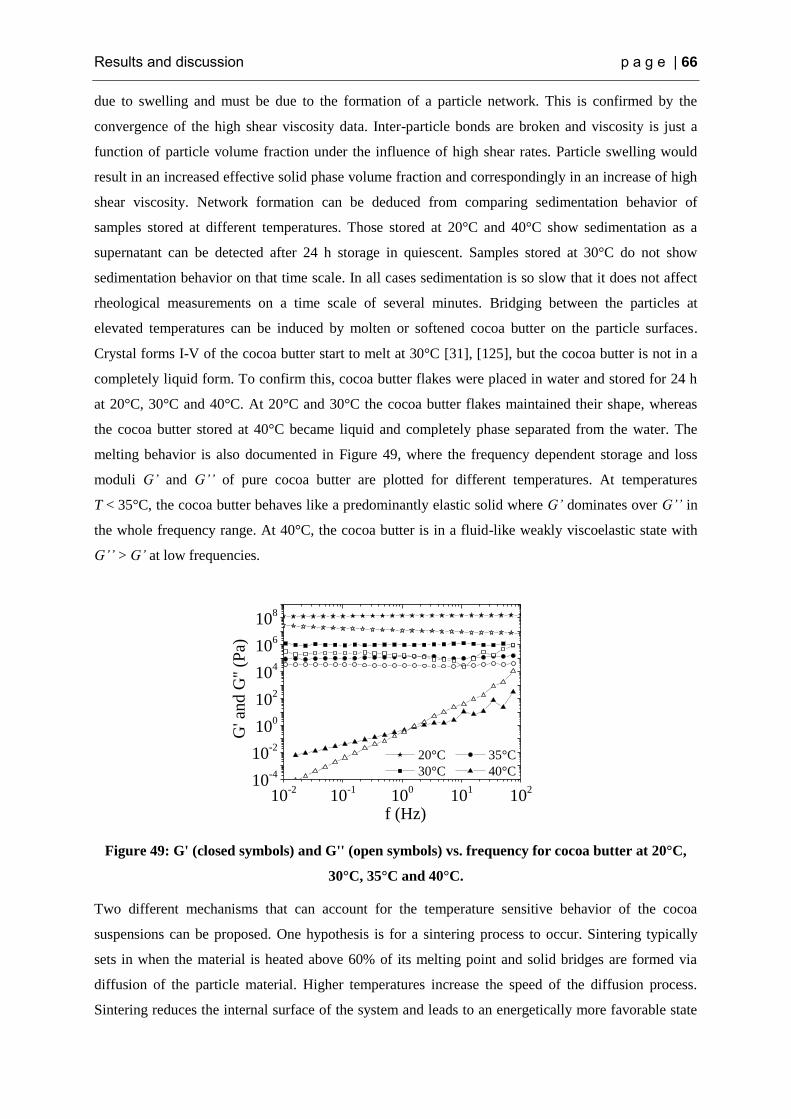
Results and discussion p a g e | 66
due to swelling and must be due to the formation of a particle network. This is confirmed by the
convergence of the high shear viscosity data. Inter-particle bonds are broken and viscosity is just a
function of particle volume fraction under the influence of high shear rates. Particle swelling would
result in an increased effective solid phase volume fraction and correspondingly in an increase of high
shear viscosity. Network formation can be deduced from comparing sedimentation behavior of
samples stored at different temperatures. Those stored at 20°C and 40°C show sedimentation as a
supernatant can be detected after 24 h storage in quiescent. Samples stored at 30°C do not show
sedimentation behavior on that time scale. In all cases sedimentation is so slow that it does not affect
rheological measurements on a time scale of several minutes. Bridging between the particles at
elevated temperatures can be induced by molten or softened cocoa butter on the particle surfaces.
Crystal forms I-V of the cocoa butter start to melt at 30°C [31], [125], but the cocoa butter is not in a
completely liquid form. To confirm this, cocoa butter flakes were placed in water and stored for 24 h
at 20°C, 30°C and 40°C. At 20°C and 30°C the cocoa butter flakes maintained their shape, whereas
the cocoa butter stored at 40°C became liquid and completely phase separated from the water. The
melting behavior is also documented in Figure 49, where the frequency dependent storage and loss
moduli G’ and G’’ of pure cocoa butter are plotted for different temperatures. At temperatures
T < 35°C, the cocoa butter behaves like a predominantly elastic solid where G’ dominates over G’’ in
the whole frequency range. At 40°C, the cocoa butter is in a fluid-like weakly viscoelastic state with
G’’ > G’ at low frequencies.
10-2
10-1
100
101
102
10-4
10-2
100
102
104
106
108
G' a
nd
G''
(Pa)
f (Hz)
20°C 35°C
30°C 40°C
Figure 49: G' (closed symbols) and G'' (open symbols) vs. frequency for cocoa butter at 20°C,
30°C, 35°C and 40°C.
Two different mechanisms that can account for the temperature sensitive behavior of the cocoa
suspensions can be proposed. One hypothesis is for a sintering process to occur. Sintering typically
sets in when the material is heated above 60% of its melting point and solid bridges are formed via
diffusion of the particle material. Higher temperatures increase the speed of the diffusion process.
Sintering reduces the internal surface of the system and leads to an energetically more favorable state

Results and discussion p a g e | 67
[126]. For cocoa particles, cocoa butter would be the diffusing material and particle bridging could
therefore be a function of the diffusion properties of cocoa butter when the particles are in contact. The
other option is for the cocoa butter to be in a semi-crystalline state at 30°C. This may correspond to an
increased tackiness compared to the liquid state at 40°C or the solid, fully crystalline state at 20°C
[127], [128].
The stickiness, or self-adhesion, of the cocoa butter can be correlated to the storage modulus G' of the
butter at given temperature. Modulus values G' ≈ 105 Pa correspond to a pronounced tackiness of soft
polymers as pointed out by Dahlquist [129] who quoted that good tack for pressure sensitive adhesives
is achieved for G' < 3.3 105 Pa at low frequency. According to Figure 49, the modulus G’ of cocoa
butter at 30°C and 35°C is in the range of 105 Pa, so a good tack or stickiness should be provided.
Values for cocoa butter at 20°C exceed this range (G’ ≈ 108 Pa) and no stickiness can be expected
anymore. At 40°C, cocoa butter is liquid and accordingly does not provide any tackiness. Therefore,
particles that come into contact at 30°C will stick together due to adhesive forces when cocoa butter is
located at the surface. Moreover, I like to emphasize that the standard system is in quiescence during
the tempering process, so shear-induced agglomeration can be excluded.
Figure 50: Photographic images of diluted cocoa suspensions stored at 20°C (A), 30°C (B) and
40°C (C).
As proposed earlier [86], capillary bridges may form from liquid cocoa butter spread over the particles
surface, when particles come in contact, but this is not evident here. At 40°C, the suspension behaves
similarly to the suspension stored at 20°C. For visual analysis of the samples at different temperatures,
cocoa suspensions where diluted and corresponding images are shown in Figure 50 confirming that no
agglomerates are formed at 40°C as well as at 20°C, whereas at 30°C a clear floc formation is visible
in the diluted samples. It has been reported earlier that the addition or the presence of too much
secondary fluid may lead to spherical agglomeration [6], but as shown here this is not the reason for
the reduced viscosity at 40°C.
In order to probe the resistance of the network against shear, one sample stored at 30°C was
continuously stirred during storage time using a magnetic stirrer bar at 200 rpm In Figure 48, the
viscosity of the stirred sample is plotted in comparison to the sample left in quiescence at the same
temperature. The low shear viscosity of the stirred sample is clearly lower than that of the sample

Results and discussion p a g e | 68
stored at rest. Continuous shearing either diminishes the formation of bridges between the particles or
larger capillary agglomerates are formed resulting in a weaker network [3], [130].
102
103
104
105
10-1
100
101
102
T
t (s)
(
Pas
)
20
25
30
35
40
T (
°C)
Figure 51: Continuous shearing of a cocoa suspension (ϕ = 15%) at = 0.1 s-1
during cooling
from 40°C to 20°C.
Figure 51 shows the viscosity of a cocoa sample measured at = 0.1 s-1
during a temperature ramp
from 40°C down to 20°C. It is demonstrated that the viscosity of the sample once heated to 40°C will
not go to the level found for the sample stored at 20°C for 24h. Instead, the viscosity increases to the
value found for the sample stirred during storage at 30°C (30 Pa s) and remains at this high level even
upon further cooling to 20°C. Once the cocoa butter is released from the particle interior, bridges will
be liquid and unstable at 40°C, stable and viscoelastic at 30°C and solid at 20°C. As we have a
continuous shearing process while measuring, the viscosity is close to the “30°C stirred” level shown
in Figure 48 and not the level of the standard 30°C sample stored at rest.
4.2.2 Extraction of cocoa particles
The influence of cocoa butter included in the particles was further investigated by preparing
suspensions of particles with the cocoa butter extracted. Particle extraction was performed using
ethanol and n-hexane. N-hexane removes the fatty phase whereas ethanol is also capable of removing
polar substances from the particles. Extracted particles have been evaluated considering particle size
as described in the materials and methods section and wetting behavior. The wetting behavior has been
analyzed via the sessile drop method. In the following diagrams (Figure 52) contact angle and change
in droplet volume trends are shown for natural and extracted cocoa powders.
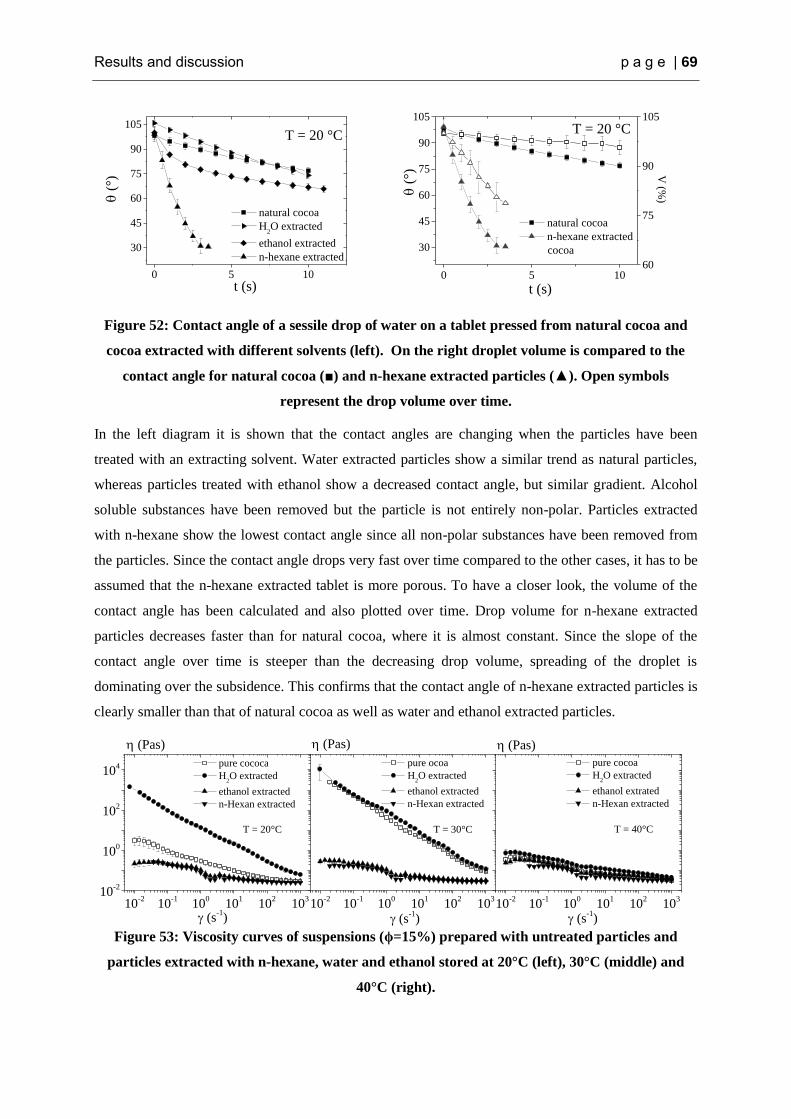
Results and discussion p a g e | 69
0 5 10
30
45
60
75
90
105
natural cocoa
H2O extracted
ethanol extracted
n-hexane extracted
(
°)
t (s)
T = 20 °C
0 5 10
30
45
60
75
90
105
natural cocoa
n-hexane extracted
cocoa
(
°) V (%
)
t (s)
T = 20 °C
60
75
90
105
Figure 52: Contact angle of a sessile drop of water on a tablet pressed from natural cocoa and
cocoa extracted with different solvents (left). On the right droplet volume is compared to the
contact angle for natural cocoa (■) and n-hexane extracted particles (▲). Open symbols
represent the drop volume over time.
In the left diagram it is shown that the contact angles are changing when the particles have been
treated with an extracting solvent. Water extracted particles show a similar trend as natural particles,
whereas particles treated with ethanol show a decreased contact angle, but similar gradient. Alcohol
soluble substances have been removed but the particle is not entirely non-polar. Particles extracted
with n-hexane show the lowest contact angle since all non-polar substances have been removed from
the particles. Since the contact angle drops very fast over time compared to the other cases, it has to be
assumed that the n-hexane extracted tablet is more porous. To have a closer look, the volume of the
contact angle has been calculated and also plotted over time. Drop volume for n-hexane extracted
particles decreases faster than for natural cocoa, where it is almost constant. Since the slope of the
contact angle over time is steeper than the decreasing drop volume, spreading of the droplet is
dominating over the subsidence. This confirms that the contact angle of n-hexane extracted particles is
clearly smaller than that of natural cocoa as well as water and ethanol extracted particles.
10-2
10-1
100
101
102
103
10-2
100
102
104
10-2
10-1
100
101
102
10310
-210
-110
010
110
210
3
(s-1
) (s-1
) (s-1
)
T = 20°C
pure cococa
H2O extracted
ethanol extracted
n-Hexan extracted
(Pas)
T = 30°C
pure ocoa
H2O extracted
ethanol extracted
n-Hexan extracted
(Pas)
T = 40°C
pure cocoa
H2O extracted
ethanol extrated
n-Hexan extracted
(Pas)
Figure 53: Viscosity curves of suspensions (ϕ=15%) prepared with untreated particles and
particles extracted with n-hexane, water and ethanol stored at 20°C (left), 30°C (middle) and
40°C (right).

Results and discussion p a g e | 70
In Figure 53, the flow behavior of suspensions made from differently treated particles at different
temperatures is displayed. Particles extracted with n-hexane and ethanol do not show an increase in
low shear viscosity when stored at 30°C while the untreated and the water extracted system clearly
exhibit an increased low shear viscosity as was previously discussed. These findings demonstrate that
the residual cocoa butter is critical for the structure formation and unusually high viscosity of the
suspension stored at 30°C. At 20°C and 40°C storage temperature, viscosity curves for suspensions of
extracted and non-extracted particles superpose. In summary, the storage temperature does not affect
the flow behavior of suspensions made from n-hexane or ethanol extracted cocoa particles and this is
attributed to the absence of the cocoa butter. Cocoa particles that have been extracted with water form
suspensions that inhibit even at 20°C a higher viscosity than untreated particle suspensions. This may
be due to the extraction of water soluble components (e.g. phenolic substances, organic acids (lactic-,
acetic- and citric acid), proteins and free amino acids as well as carbohydrates (saccharose)) that may
lower the low shear viscosity of the suspension by stabilizing the particles. Also, as can be seen in
Figure 16, the extraction process breaks the cocoa agglomerates, which is reducing the average
particle size. Smaller particle sizes result in a higher low shear viscosity if attractive particle
interactions dominate.
0 2 4 6 8 10 12 14 1610
0
101
102
cocoa butterno
yield
stress 11%
22%
y (
Pa s
)
()
Figure 54: Yield stress plotted over particle volume fraction of water continuous cocoa
suspensions stored at 30°C for 12 h. Particles with a cocoa butter content of 11% and 22% were
used.
Cocoa particles with different amounts of remaining cocoa butter are commercially used. Here I have
investigated suspensions of cocoa particles with 11% residual cocoa butter as standard and also cocoa
particles with 22% remaining butter for comparison. In Figure 54 the yield stresses of cocoa
suspensions with varied particle volume fraction and the two different cocoa butter contents stored at
30°C are plotted. The yield stress characterizes the strength of the particle network within the
suspension similar as the low shear viscosity of the samples. The yield stress increases with increasing
particle loading, but below ϕ = 5%, no yield stress can be detected. Samples made from cocoa with 22%

Results and discussion p a g e | 71
of residual cocoa butter exhibit a higher yield value throughout the whole concentration range. More
cocoa butter obviously leads to a stronger network and we attribute this to the formation of more and
larger cocoa butter bridges between the particles.
4.2.3 Effect of secondary fluids on flow behavior of aqueous cocoa suspensions
As written in section 4.1 for oil continuous suspensions, gelling can be achieved by adding a
secondary immiscible fluid to the suspension. In this section the influence of added secondary fluids is
investigated for water continuous suspensions.
Figure 55: Suspension of cocoa particles (=0.15) in water without (A) and with (B) linoleic acid
(S=0.02) added as secondary liquid.
For network formation in water continuous suspensions, the secondary liquid must be able to rewet the
particles, meaning it has to remove water from the particle surface. Thus, a slightly polar fluid that is
immiscible with water must be used. It has been found that fatty acids like linoleic acid or oleic acid
are able to induce a network in cocoa suspensions. In Figure 55 the transition from a fluid-like
suspension of cocoa in water (A) to a gel-like behavior (B) is seen, when linoleic acid is added as
secondary liquid.
0.00 0.05 0.10 0.15 0.2010
0
101
102
103
104
y (
Pa)
S
=15 %
=20 %
=25 %
Figure 56: Yield stress over saturation of suspensions of cocoa particles in water for cocoa
volume fractions of 15%, 20% and 25%. The saturation of secondary fluid (oleic acid) was
varied from S=0.0 to S=0.2. The dotted line represents the yield value of a commercial cocoa
spread (Rewe “Feine Welt”).
B A

Results and discussion p a g e | 72
The increase in the yield stress due to the addition of oleic acid to the suspension of cocoa particles in
water is shown in Figure 56 for different volume fractions of cocoa particles. Suspensions formed with
linoleic acid and oleic acid show the same rheological behavior. An increase in the yield stress as high
as in the oil continuous suspensions presented earlier is not observed. But up to on order of magnitude
change can be measured and the attainable yield stress level is similar to that of a commercial fat
continuous chocolate spread. It should be noted, that in contrast to the oil continuous suspensions, the
yield stress of water continuous cocoa suspensions reaches a maximum value at lower fractions of
secondary liquid.
Figure 57: REM images from dried cocoa samples without (left) and with saturations of S=0.05
(middle) and S= 0.10 (right).
In Figure 57 REM images of dried cocoa particles (20°C, vacuum) are shown. The left picture shows
the pure cocoa powder, whereas in the middle and right picture linoleic acid was added to the
suspension prior to drying. For a saturation of S=0.05 a more agglomerated structure is detected.
Particles are not assembled flat as can be seen in the left picture, but show a more round structure with
more homogenous pores. On the right picture it can be seen that the surface properties have changed.
The lighter spots in the image may be interpreted as fat that is located at the particle surface. This fat
might be a mixture of linoleic acid and cocoa butter and could be contributing to the sticky particle
surface as has already been described in section 4.2.1.
4.2.3.1 Influence of increased temperature
In Figure 58 the viscosity curves of suspensions with and without added oleic acid obtained at
different storage temperatures are shown. A strong effect of oleic acid added to the suspension is
visible for the suspension stored at 20°C. The suspension with added oleic acid shows a low shear
viscosity almost two orders of magnitude higher than that of the pure suspension. In contrast, for 30°C
the curves superpose but at an higher level than the 20°C curve with secondary fluid. Suspensions
stored at 40°C do not show an increase of low shear viscosity upon the addition of oleic acid.

Results and discussion p a g e | 73
10-2
10-1
100
101
102
103
10-2
10-1
100
101
102
103
104
(
Pas
)
Ts= 20°C
Ts= 30°C
Ts= 40°C
Ts= 20°C, n-hexane
extracted
(s-1
)
Figure 58: Viscosity functions of cocoa suspensions (ϕ=15%) made from untreated cocoa
particles stored at 20°C, 30°C and 40°C with (filled symbols, S=0.02) and without (open symbols)
the addition of oleic acid. For comparison also data for a suspension of n-hexane extracted
particles with added oleic acid is shown.
Different hypotheses can now be proposed regarding the effect of adding oleic acid to a cocoa
suspension. First, the adsorption of oleic acid to the particle surface may render the surface of the
cocoa particles more hydrophobic as reported for other particle systems [37], [131], [132]. According
to Koh et al. [37], oleic acid added to a water based sheelite suspension absorbs to the particle surface
inducing a hydrophobic attraction that causes particle agglomeration. Furthermore, they propose that
simultaneously oleic acid can form liquid bridges between particles, holding them together. These two,
probably interfering processes, may also occur for the cocoa particle system described here. The
second possible mechanism is the dissolution and extraction of the cocoa butter distributed inside the
cocoa particles by the oleic acid. Solving cocoa butter in oleic acid could result in a waxy, sticky
surface around the particles gluing them together upon contact. Oleic acid may act as a plasticizer for
cocoa butter having a similar effect on mobility and stickiness as increasing the temperature. This
phenomenon has been investigated by mixing oleic acid and cocoa butter on a ratio that occurs in a
cocoa particle (residual cocoa butter of 11%) suspension with saturation S = 0.02 and ϕ = 15% (80 ml
of oleic acid and 110g cocoa butter) on a shaking table for 24 h. G’ and G’’ data for this mixture are
compared to values of cocoa butter at different temperatures. This is plotted in Figure 59. The moduli
of the cocoa butter/oleic acid mixture coincide with cocoa butter data at 30°C. So the stickiness of the
mixture is confirmed. This supports the thesis that a sticky layer is causing the particles to form a
network upon contact whether cocoa butter is softened by appropriate heating or by mixing with oleic
acid.
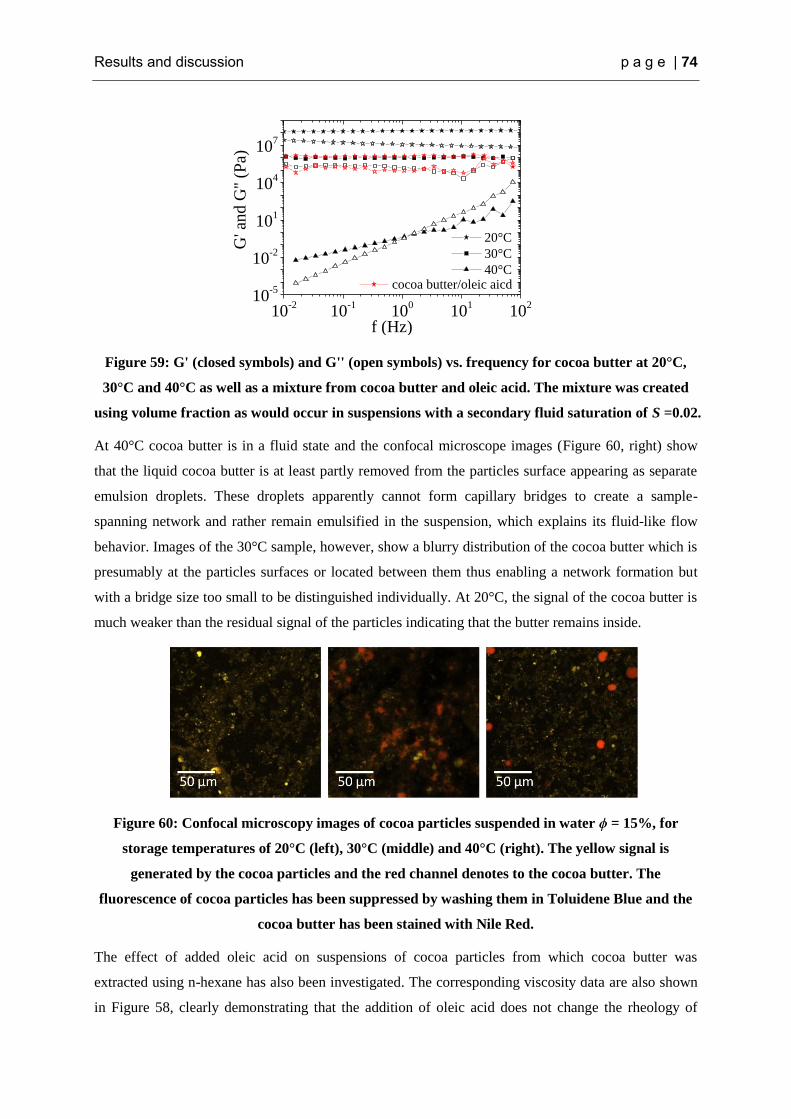
Results and discussion p a g e | 74
10-2
10-1
100
101
102
10-5
10-2
101
104
107
cocoa butter/oleic aicd
G' a
nd
G''
(Pa)
f (Hz)
20°C
30°C
40°C
Figure 59: G' (closed symbols) and G'' (open symbols) vs. frequency for cocoa butter at 20°C,
30°C and 40°C as well as a mixture from cocoa butter and oleic acid. The mixture was created
using volume fraction as would occur in suspensions with a secondary fluid saturation of S =0.02.
At 40°C cocoa butter is in a fluid state and the confocal microscope images (Figure 60, right) show
that the liquid cocoa butter is at least partly removed from the particles surface appearing as separate
emulsion droplets. These droplets apparently cannot form capillary bridges to create a sample-
spanning network and rather remain emulsified in the suspension, which explains its fluid-like flow
behavior. Images of the 30°C sample, however, show a blurry distribution of the cocoa butter which is
presumably at the particles surfaces or located between them thus enabling a network formation but
with a bridge size too small to be distinguished individually. At 20°C, the signal of the cocoa butter is
much weaker than the residual signal of the particles indicating that the butter remains inside.
Figure 60: Confocal microscopy images of cocoa particles suspended in water ϕ = 15%, for
storage temperatures of 20°C (left), 30°C (middle) and 40°C (right). The yellow signal is
generated by the cocoa particles and the red channel denotes to the cocoa butter. The
fluorescence of cocoa particles has been suppressed by washing them in Toluidene Blue and the
cocoa butter has been stained with Nile Red.
The effect of added oleic acid on suspensions of cocoa particles from which cocoa butter was
extracted using n-hexane has also been investigated. The corresponding viscosity data are also shown
in Figure 58, clearly demonstrating that the addition of oleic acid does not change the rheology of

Results and discussion p a g e | 75
cocoa suspensions when cocoa butter is removed. This result leads to the conclusion that the high low
shear viscosity achieved upon adding oleic acid is a result of particle bridges formed from cocoa
butter/oleic acid mixtures and cocoa butter is the key parameter controlling the flow behavior of
aqueous cocoa suspensions.
To further understand the network formation process, the viscosity of suspensions with and without
added oleic acid stored at 20°C was measured over time of storage, starting right after sample
preparation and continuing with discrete steps using a new sample for every measurement point.
Corresponding viscosity data taken at =0.1s-1
is plotted in Figure 61. Viscosity increases in all cases
but with different slopes. Samples with added secondary fluid exhibit higher initial viscosities, but the
viscosity values match after 7h for the samples stored at 30°C as already shown in Figure 58. The
sample with oleic acid stored at 20°C needs longer time for network formation, but after 10h it reaches
a similar viscosity level as those stored at 30°C. This further supports the hypothesis that cocoa butter
is dissolved by the secondary fluid as already described in the previous section. Obviously, the process
of melting the cocoa butter at 30°C is faster than dissolving it in oleic acid at 20°C.
10-1
100
101
100
101
102
103
(
Pa s
)
t (h)
20°C; S = 0.02
30°C; S = 0.00
30°C; S = 0.02
Figure 61: Time evolution of network formation for pure cocoa samples (ϕ = 15%) stored at
20°C and 30°C with and without added secondary fluid. Viscosity data was measured at a shear
rate of =0.1 s-1
. The rheometer was filled with a fresh sample for each measurement.
4.2.3.2 Variation of secondary and bulk fluids
The effect of adding oleic acid to cocoa suspensions has been discussed so far. Now, different fluids
immiscible with water but comprising different functional groups, varied hydrocarbon chain lengths
and entirely unpolar oils will be compared. These substances and their characteristic features are listed
in Table 7. In contrast of what has been found for oil-based capillary food suspensions [86] interfacial
tension is not the decisive factor for network formation and thickening, since sunflower oil and oleic
acid show similar equilibrium interfacial tensions against water at 20°C, but a change in viscosity can
only be detected when oleic acid is added.

Results and discussion p a g e | 76
Table 7: Characteristics and solubility of immiscible liquids added as secondary fluids to cocoa
suspensions
octyl
acetate octanoic acid oleic acid octanol
sunflower
oil
silicon oil
AK10
functional
group -OCOOH -COOH -COOH -OH - -
interfacial
tension 20 mN/m 8 mN/m 14 mN/m 8 mN/m 22 mN/m 39 mN/m
chain length 8 C 8 C 18 C 8 C 16 C-20 C -
capillary
effect X X
solubility of
cocoa butter < 1h 1:42 h 8 h 8:15 h >58 h insoluble
Yield stress values obtained at different times after preparation of the two-fluid cocoa suspensions
(S = 0.01) are plotted in Figure 62. Obviously, secondary fluids exhibiting a shorter chain length (C8
vs. C18) induce faster increase of yield stress than fluids with longer chains like oleic acid. After a
storage time of 100h suspensions prepared with secondary fluids of different chain length show the
same yield value. This leads to the conclusion that the chain length of the secondary fluid determines
the kinetics of network formation in these suspensions, but does not affect the final network strength
despite the different interfacial tension.
100
101
102
100
101
102
y (
Pa)
t (h)
octanol
octanoic acid
octyl acetat
oleic acid
Figure 62: Yield stress over time for aqueous cocoa suspensions (ϕ = 15%) with different
secondary fluids (S=0.01). The rheometer was filled with a fresh sample for every measurement
point.
Different functional endgroups obviously do not result in a measureable difference with respect to the
yield stress or gel strength of the suspension. However, suspensions with added sunflower oil or
silicon oil do not show any measurable effect on flow behavior compared to the regular bulk
suspension. We attribute these findings to a different solubility of cocoa butter in the different

Results and discussion p a g e | 77
secondary fluids. Cocoa butter did not completely dissolve in sunflower oil or silicone oil even after
58 h. In contrast, cocoa butter dissolved completely in octanoic acid within 2h and in oleic acid within
8h. Mixtures of cocoa butter with these organic acids form wax-like, soft, sticky fluids at the
concentration ratios present in the cocoa suspensions (ϕ = 15%, residual cocoa butter within particles
11%, S = 0.02) and this seems to be the prerequisite for the formation of network structures similar to
those developing when pure aqueous cocoa suspensions are heated to T = 30°C.
Mixtures from oleic acid and sunflower oil have been prepared and added to the cocoa suspension as
secondary fluid. The yield stress of the resulting suspensions is plotted in Figure 63. The higher the
amount of oleic acid in the mixture, the stronger the suspension gels. Samples with only sunflower oil
as secondary fluid hardly show an increase in yield stress, which is σ = 40.0 ± 2.1 Pa with added
sunflower oil compared to σ = 23.2 ± 6.5 Pa without added secondary fluid. This increase may be
ascribed to the low fraction of free fatty acids that are regularly present in the commercial oil. This
further confirms that only free fatty acids or other slightly polar substances can cause a sample
spanning network in aqueous cocoa suspensions, whereas entirely non-polar triglycerides do not
contribute to particle clustering.
0 20 40 60 80 10010
1
102
103
y (
Pa)
fraction of oleic acid (%)
Figure 63: Yield stress over fraction of oleic acid in secondary fluid for cocoa suspensions
(ϕ = 20%, S = 0.01).
Bulk fluid viscosity has been varied by adding different concentrations of fructose and to the water
phase. Adding glycerol and fructose is not only changing the viscosity of the bulk phase, but also
influences the three phase wetting behavior. In Figure 64 the normalized yield stress is plotted over the
bulk viscosity (left) and over the interfacial tension between bulk and secondary phase (right).

Results and discussion p a g e | 78
0 2 4 6 8 10 12
4
6
8
10
water
25% fructose 50% glycerol
50% fructose 25% glycerol
y /
y
,S=
0
bulk
(mPas)
15 20 25 30
5
10
15 water 50% fructose
25% fructose 50% glycerol
25% glycerol
y /
y
,S=
0
(mN/m)
Figure 64: Normalized yield stress of cocoa suspensions with aqueous mixtures from fructose
and glycerol as bulk fluids plotted over the bulk viscosity (left) and the interfacial tension (right).
Secondary fluid (linoleic acid) saturation was kept constant at S = 0.02.
A weak linear dependency of normalized yield stress on bulk viscosity, but not on interfacial tension is
detected. In oil continuous capillary suspensions we did find that the formation of capillary
suspensions is not a function of droplet breakup, but a diffusion driven process (see section 4.1.4).
Since the network formation in water continuous suspension is a slow process (see Figure 62)
compared to network build-up in oil continuous suspension the influence of diffusion might be more
distinct and observable here. The diffusion coefficient D is not a function of interfacial tension but
inversely proportional to the bulk viscosity,
(4.3)
with kB being the Boltzmann constant and R0 the hydrodynamic radius of the diffusing molecule. In
contrast, droplet breakup is proportional to bulk viscosity η and inversely proportional to interfacial
tension Γ assuming laminar mixing conditions and droplet breakup to occur for Ca > 1. But since
turbulent conditions can be assumed when using a dispenser mixer blade, interfacial tension does
account for droplet size ddr (2.16). It cannot be clear said, but it is assumed that the network formation
is a combination of mechanisms, droplet breakup and diffusion.
4.2.3.3 Structural information about cocoa suspensions from SANS and micro computed
tomography
Small angle neutron scattering experiments were used to identify structural changes upon heating or
addition of secondary fluid to water based cocoa suspensions. In Figure 65, the scattering curves of
samples made from ϕ=15% cocoa powder in water at 20°C with and without secondary fluid and at
30°C as well as 40°C without secondary fluid are shown. The scattering intensity strongly decreases
with increasing q-value in all cases. The samples stored at 20°C and 30°C exhibit a characteristic peak
in the high q-range. For the pure cocoa suspensions this peak occurs at q = 0.173 Å-1
corresponding to

Results and discussion p a g e | 79
a characteristic length of 36 Å. We can interpret this as a bilayer of triglyceride molecules. For the
samples with added oleic acid this length increases to 51 Å and a characteristic length is 53 Å is found
for the pure suspension heated to 30°C. This would then correspond to a triple layer of triglyceride.
No peak is found for the sample stored at 40°C.
The characteristic length in the suspensions revealed by the peak in the scattering intensity is
interpreted as a layer of cocoa butter covering the cocoa particles. The thickness of this layer increases
when cocoa butter leaks to the particle surface at elevated temperatures or when oleic acid is added.
No surface layer of cocoa butter exists at 40°C. As already shown in Figure 60, the cocoa butter
separates from the particles at this temperature and forms large droplets which do not contribute to the
scattering intensity in the q-range investigated here. The surface layer observed in SANS experiments
may not be sufficient to facilitate bridging between particles considering their irregular shape but its
change is another indication for the leaking of the butter from the particle interior at elevated
temperatures or upon addition of a secondary fluid. The stickiness of the surface layer provided either
by the mixture of cocoa butter and oleic acid or by the pure cocoa butter at elevated temperature is
decisive for the formation of a sample spanning network structure and a distinct rheological behavior
corresponding to a creamy texture.
0.05 0.1 0.15
0.2
0.4
0.6
0.81
20°C with oleic acid
20°C no oleic acid
30°C no oleic acid
40°C no oleic acid
I (c
m-1
)
q (Å-1)
Figure 65: Scattering intensity I vs. scattering vector q for cocoa in water samples (ϕ= 15%) at
temperatures of 20°C, 30°C and 40°C and 20°C with added oleic acid (S = 0.02).
Structural changes in aqueous cocoa suspensions can also be detected using micro tomography.
Suspensions with and without added linoleic acid have been dried in vacuum (20°C) and carefully put
in a phoenix nanotom (GE measurements & control, located at Max Planck Institute, Göttingen).
Images resulting from these measurements are shown in Figure 66. Samples without secondary fluid
appear dark and unstructured since detection of individual cocoa particles is below the resolution limit
of the device (1µm). In contrast, samples with secondary fluid show a more structured image. Cocoa
particle agglomerates are seen to be uniform in size and a uniform network structure is visible
throughout the sample. Due to the limited solution of the microtomography device individual liquid
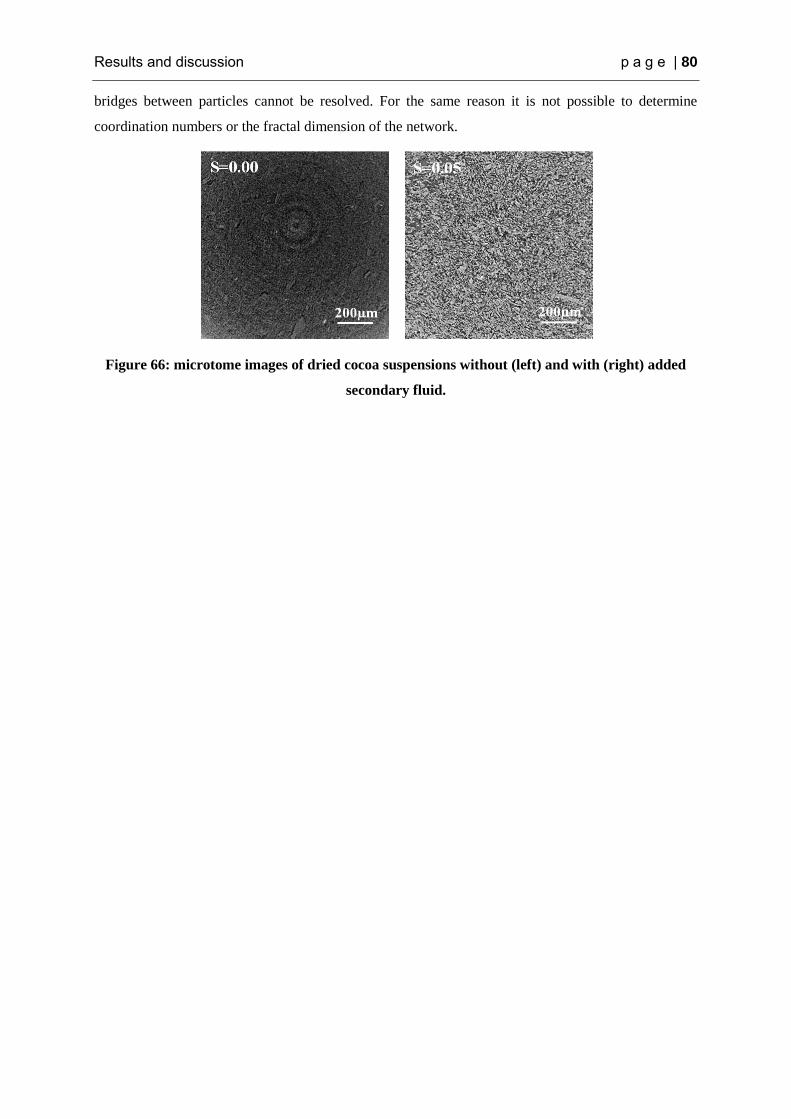
Results and discussion p a g e | 80
bridges between particles cannot be resolved. For the same reason it is not possible to determine
coordination numbers or the fractal dimension of the network.
Figure 66: microtome images of dried cocoa suspensions without (left) and with (right) added
secondary fluid.

Conclusions p a g e | 81
5 Conclusions
Capillary suspensions offer new opportunities for the formulation of food products. We can see a clear
transition from a liquid or very weak gel with no secondary phase added, to a strong gel-like state
when water is added to the oil continuous suspensions made from cocoa or starch granules. This
indicates that strong capillary forces act in this food model systems as has been reported earlier for
suspensions of inorganic or synthetic polymer particles [1]. Stability against sedimentation can be
dramatically increased, texture can be modified and flow properties can be easily adjusted according to
the demands of a broad variety of processing and application techniques and perception demands.
The wetting behavior of the particles with water and oil has been documented using confocal
microscopy as well as contact angle measurements using the sessile drop method. Various rheological
parameters of capillary suspensions have been documented and compared, revealing that oscillatory
shear measurements underestimate the yield stress obtained from rotational shear data. Texture
modifications can be done mainly by adapting the amount of the secondary fluid, but also by changing
the wetting properties like the contact angle the two fluids form with the particles. On the other hand,
the secondary fluid viscosity has no influence on rheological quantities like yield stress or low shear
viscosity of the investigated capillary suspensions. Furthermore, the adsorption of water by particles
from environmental sources during storage can dramatically influence the properties of oil continuous
suspensions since capillary bridges form spontaneously from adsorbed water layers. Suspension
rheology is similar if the water is absorbed prior to suspension preparation or added to the suspension
afterwards. These findings lead to the conclusion that the formation of these capillary suspensions is
energetically favorable and not controlled by mechanical energy input. This aspect might be of special
relevance from a technical or processing perspective.
Capillary bridges offer an additional advantage to chocolate or other temperature sensitive systems by
preserving shape stability even if the continuous phase of the suspension is molten. This stability has
been documented via optical experiments and also was measured using rheological setups. Increased
volume of secondary fluid as well as higher volume fractions of particles lead to a more stable product.
The rheological behavior of aqueous cocoa particle suspensions stored at different temperatures or
modified by the addition of a secondary fluid has also been investigated in this study. When cocoa
particles are dispersed in water and stored at a temperature of 30°C, a network of particles is formed
which leads to an increase in low shear viscosity and a gel-like, creamy texture. Heating the sample
further up to 40°C or above results in a network collapse and the suspension behaves fluid-like again.
The critical factor controlling this behavior is the residual cocoa butter in the particles. At 30°C, the
cocoa butter is in a semicrystalline state and bridges of this cocoa butter between the particles are
formed via a diffusion process (similar to sintering) or just by sticking together upon contact due to
cocoa butter that has leaked to the surface. The cocoa butter is completely liquid at 40°C and partly

Conclusions p a g e | 82
forms emulsion droplets in the water phase that do not contribute to the particle network as shown via
confocal imaging. The key role of cocoa butter for network formation, texture and flow of the aqueous
suspensions has been proven by extracting it from the particles as well as increasing the amount of
cocoa butter. Particles, where the fat has been removed show no temperature dependent change in flow
behavior. Particles with higher butter content form stronger networks as proven for a wide range of
particle loadings. Samples, once heated above 30°C, will not go back to their initial state at 20°C and
remain in a gelled state. High network strength is obtained upon storage over extended periods of time
at rest (>24h).
Adding a secondary fluid to the cocoa suspension results also in an increased yield stress attributed to
the formation of a network of particles even at room temperature. This bridging phenomenon only
appears for particles with residual cocoa butter content. This leads to the assumption that the
secondary fluid dissolves the cocoa butter and similar to the heated particle suspensions a soft and
sticky semi-crystalline fluid is created that glues the particles together. This process is faster for short
chain solvents with a polar end-group compared to longer chain fatty acids and can be correlated to the
speed at which the respective fluid dissolves the cocoa butter. Less polar substances like silicone oil or
sunflower oil do not induce a particle network formation, which is attributed to the poor and slow
solubility of cocoa butter in these fluids.
SANS experiments also revealed structural differences between samples stored at different
temperatures. Samples stored at 30°C or at 20°C, but with added oleic acid exhibit a scattering peak
corresponding to a characteristic length scale of about 50 Å whereas the characteristic length reduces
to about 35 Å for a pure cocoa suspension stored at 20°C. This length scale is attributed to the cocoa
butter layer on the particle surface and completely vanishes upon storage at 40°C.
Finally, we have shown how the flow behavior of oil and water continuous food suspensions and
correspondingly their creaminess and texture can be tuned in a wide range via appropriate thermal
treatment or addition of an adequate, immiscible secondary fluid. This may open up a new pathway for
the formulation of novel food products based not only on cocoa but any other finely dispersed particle
species.

List of figures p a g e | 83
List of figures
Figure 1: Schematic image of two spheres connected with a pendular liquid bridge. On the left
particles are on contact and on the right they have the distance s (adapted from [42]). ........................ 17
Figure 2: Ternary diagram of various particle–liquid–liquid systems showing stability regions as a
function of the relative volume fractions (left). Corresponding diagrams for each state are plotted on
the right [49]. ......................................................................................................................................... 18
Figure 3: Clusters formed by evaporation of Pickering stabilized droplets [51]. .................................. 19
Figure 4: State diagram of minimum energy regions as a function of contact angle θ and secondary
fluid volume Vl. ..................................................................................................................................... 20
Figure 5: Droplet breakup criteria for a single droplet undergoing shear and elongational stress [61]. 22
Figure 6: Particle size distribution of particles used in this study. ........................................................ 24
Figure 7: Scanning electron microscopy (SEM) image of cocoa solids ................................................ 25
Figure 8: Schematic diagram of a plate-plate setup of a rotational rheometer with the gap size h and
radius R. ................................................................................................................................................. 29
Figure 9: Example for yield stress evaluation: Socal particles ϕ = 10% dispersed in sunflower oil. .... 30
Figure 10: Example for critical shear stress evaluation: cocoa particles dispersed in water and stored at
30°C, ϕ=10%. ........................................................................................................................................ 31
Figure 11: Vane used for yield stress measurements for oil continuous suspensions. .......................... 31
Figure 12: Schematic image of the laser path through the microscope [71]. ........................................ 32
Figure 13: Schematic images of contact angle measurements when the high density fluid is the bulk
phase (left) and when the low density fluid is the bulk phase (right). ................................................... 33
Figure 14: Geometric description of the pendant drop [77]. ................................................................. 34
Figure 15: Absorbed amount of water for different particles over time. Particles had been stored over
distilled water at 20°C. .......................................................................................................................... 36
Figure 16: Particle size distribution of extracted and non extracted cocoa particles. ............................ 37
Figure 17: CLSM images of starch particles dispersed in oil and brought in contact to a water interface.
The oil phase is displayed in red while water is colored in green. ........................................................ 39
Figure 18: Cocoa particles at the oil/water interface. Particles have been first dispersed in oil (left) and
in water (right) before creating the interface. ........................................................................................ 40

List of figures p a g e | 84
Figure 19: Suspension of =0.33 starch granules in oil without added water (Ssec = 0.0, left) and with
added water (Ssec = 0.10, right). Pictures below the starch samples schematically show the network
formation. .............................................................................................................................................. 41
Figure 20: Microscopic image of a capillary suspension made from starch granules in oil with water as
secondary phase. Water was colored with a fluorescent dye (PromoFluor-488 Premium, carboxylic
acid) which appears yellow in the picture. ............................................................................................ 42
Figure 21: Suspension of =0.35 cocoa solids in oil suspension without added water (S = 1.0, left) and
with added water (S = 0.90, middle). Right image: sedimentation behavior after a storage time of 5
days, (A) no water added, (B) S = 0.90. ................................................................................................ 42
Figure 22: Confocal images of cocoa particles in oil with and without added water. The system was
excited with both laser lines (488 nm and 552 nm). In the left image cocoa particles are used as
provided, in the middle they have been dyed with toluidine blue and the right image shows a dyed
particles suspension with water as secondary fluid (green). The microscope setup was kept constant. 43
Figure 23: Normalized yield stress as a function of saturation of the preferentially wetting fluid for (A)
corn starch and (B) cocoa particles. ...................................................................................................... 44
Figure 24: Yield stress of a PVC suspension (capillary state) and a suspension made from Hermatite
particles (pendular state) in DINP/water mixtures [1]. .......................................................................... 44
Figure 25: Viscosity vs. shear rate for suspension of starch granules (ϕ=33%, A) and cocoa particles
(ϕ=35%, B) suspended in oil, at different saturation levels. ................................................................. 45
Figure 26: Frequency sweep of corn starch suspensions (ϕ = 33%) with varied saturations.
Measurements have been performed at σ = 5 Pa. .................................................................................. 46
Figure 27: Correlation of yield stresses obtained from shear measurements and oscillatory
measurements: critical stress (A) and crossover point (B). ................................................................... 47
Figure 28: Yield stress of corn starch (ϕ = 0.33) and cocoa (ϕ = 0.35) particles suspended in oil with
aqueous PEO solutions of different viscosity as secondary phase versus the viscosity ratio of water to
oil ηd/ηc. ................................................................................................................................................. 48
Figure 29: Yield stress of suspensions (ϕ = 0.33) prepared from particles treated with OSA in oil for
two saturations (Ssec = 0.06 and Ssec = 0.10) over OSA concentration. .................................................. 49
Figure 30: Yield stress of a starch suspension in oil (ϕ = 0.33) vs. saturation for various glycerol/water
mixtures as secondary fluid. .................................................................................................................. 51
Figure 31: Normalized yield stress over hydrophilic fraction for Socal particle mixtures in oil with a
volume fraction of ϕ = 10% and saturations of Ssec = 0.03 and Ssec = 0.05. ........................................... 52

List of figures p a g e | 85
Figure 32: Confocal images of Socal particle mixtures in oil with water (Ssec = 0.05) as secondary fluid.
From left to right: H = 0; H = 0.3; H = 0.7; H = 1. ............................................................................... 52
Figure 33: Yield stress of a starch in oil suspension (ϕ = 35%) with a water saturation of Ssec = 0.07
plotted over hydrophilic fraction H of starch particles. ......................................................................... 53
Figure 34: schematic diagram of two preparation methods for oil continuous capillary suspensions. . 54
Figure 35: Yield stress of a suspension from Socal 31 in dioctylphthalate (ϕ=10.8%) with different
water content in the oil phase [110] compared to a suspension from preconditioned Socal 31 particles
in sunflower oil (ϕ=10%) plotted over the water content (calculated to the oil phase). ........................ 55
Figure 36: Comparison of yield values of suspensions made from pre conditioned and dry Socal
particles (A: Socal 31, ϕ = 10%; B: Socal U1S1, ϕ = 14%) plotted over the saturation S. ................... 56
Figure 37: Comparison of yield values of suspensions made from pre-conditioned and dry Vinnolit
particles (ϕ=35%) plotted over the saturation S. ................................................................................... 56
Figure 38: Comparison of yield values of suspensions made from preconditioned and dry starch (A,
ϕ=33%) and cocoa (B, ϕ=35%) particles plotted over the saturation Ssec and S. ................................... 57
Figure 39: Yield stress of cocoa suspensions (ϕ = 30%, S = 0.9) stored at different temperatures for
19h. ........................................................................................................................................................ 58
Figure 40: model chocolate with a volume fraction of cocoa particles of 35% stored at 50°C with (left)
and without (right) added water. ........................................................................................................... 59
Figure 41: Sample height h normalized to the height at the beginning of the test h0 plotted over storage
time at 50°C for various saturations at a volume fraction of cocoa particles of 30% (A). G’ (closed
symbol) and G’’ (open symbols) is plotted over temperature T for the same samples as seen in (A) at
f=1Hz and τ=0.1 Pa (B). ........................................................................................................................ 60
Figure 42: Comparison of melting behavior of suspensions with cocoa particle volume fractions of
25%, 30% and 35% for saturations S = 1.0 (A) and S = 0.90 (B). ........................................................ 61
Figure 43: Calcium carbonate in paraffin wax (ϕ=8%) with (left) and without (right) added water,
before (upper image) and after (lower image) exposure to 50°C for 110 min. ..................................... 61
Figure 44: Height of the melting samples at 50°C shown in Figure 43 plotted over time. ................... 62
Figure 45: Melting behavior of the model chocolate with glycerol (A) and 75wt% fructose (B) as
secondary fluids, with varied saturation. ............................................................................................... 63
Figure 46: Contact angle of glycerol (left) and 75% fructose solution (right) in model chocolate plate.
............................................................................................................................................................... 63

List of figures p a g e | 86
Figure 47: Yield value of a cocoa in sunflower oil suspension (ϕ=30%) with water, glycerol and 75%
fructose solution added as secondary fluid. ........................................................................................... 64
Figure 48: Viscosity function of cocoa samples (ϕ=15%) stored at 20°C, 30°C and 40°C for 24 h.
Measurements plotted with an open symbol were completed using a capillary rheometer. Stirred
sample was prepared by mixing the sample during storage using a magnetic stirrer. ........................... 65
Figure 49: G' (closed symbols) and G'' (open symbols) vs. frequency for cocoa butter at 20°C, 30°C,
35°C and 40°C. ...................................................................................................................................... 66
Figure 50: Photographic images of diluted cocoa suspensions stored at 20°C (A), 30°C (B) and 40°C
(C). ......................................................................................................................................................... 67
Figure 51: Continuous shearing of a cocoa suspension (ϕ = 15%) at = 0.1 s-1
during cooling from
40°C to 20°C. ........................................................................................................................................ 68
Figure 52: Contact angle of a sessile drop of water on a tablet pressed from natural cocoa and cocoa
extracted with different solvents (left). On the right droplet volume is compared to the contact angle
for natural cocoa (■) and n-hexane extracted particles (▲). Open symbols represent the drop volume
over time. ............................................................................................................................................... 69
Figure 53: Viscosity curves of suspensions (ϕ=15%) prepared with untreated particles and particles
extracted with n-hexane, water and ethanol stored at 20°C (left), 30°C (middle) and 40°C (right). .... 69
Figure 54: Yield stress plotted over particle volume fraction of water continuous cocoa suspensions
stored at 30°C for 12 h. Particles with a cocoa butter content of 11% and 22% were used. ................. 70
Figure 55: Suspension of cocoa particles (=0.15) in water without (A) and with (B) linoleic acid
(S=0.02) added as secondary liquid. ...................................................................................................... 71
Figure 56: Yield stress over saturation of suspensions of cocoa particles in water for cocoa volume
fractions of 15%, 20% and 25%. The saturation of secondary fluid (oleic acid) was varied from S=0.0
to S=0.2. The dotted line represents the yield value of a commercial cocoa spread (Rewe “Feine
Welt”). ................................................................................................................................................... 71
Figure 57: REM images from dried cocoa samples without (left) and with saturations of S=0.05
(middle) and S= 0.10 (right). ................................................................................................................. 72
Figure 58: Viscosity functions of cocoa suspensions (ϕ=15%) made from untreated cocoa particles
stored at 20°C, 30°C and 40°C with (filled symbols, S=0.02) and without (open symbols) the addition
of oleic acid. For comparison also data for a suspension of n-hexane extracted particles with added
oleic acid is shown. ............................................................................................................................... 73

List of figures p a g e | 87
Figure 59: G' (closed symbols) and G'' (open symbols) vs. frequency for cocoa butter at 20°C, 30°C
and 40°C as well as a mixture from cocoa butter and oleic acid. The mixture was created using volume
fraction as would occur in suspensions with a secondary fluid saturation of S =0.02. ......................... 74
Figure 60: Confocal microscopy images of cocoa particles suspended in water ϕ = 15%, for storage
temperatures of 20°C (left), 30°C (middle) and 40°C (right). The yellow signal is generated by the
cocoa particles and the red channel denotes to the cocoa butter. The fluorescence of cocoa particles has
been suppressed by washing them in Toluidene Blue and the cocoa butter has been stained with Nile
Red. ....................................................................................................................................................... 74
Figure 61: Time evolution of network formation for pure cocoa samples (ϕ = 15%) stored at 20°C and
30°C with and without added secondary fluid. Viscosity data was measured at a shear rate of =0.1 s-1
.
The rheometer was filled with a fresh sample for each measurement. .................................................. 75
Figure 62: Yield stress over time for aqueous cocoa suspensions (ϕ = 15%) with different secondary
fluids (S=0.01). The rheometer was filled with a fresh sample for every measurement point. ............. 76
Figure 63: Yield stress over fraction of oleic acid in secondary fluid for cocoa suspensions (ϕ = 20%, S
= 0.01). .................................................................................................................................................. 77
Figure 64: Normalized yield stress of cocoa suspensions with aqueous mixtures from fructose and
glycerol as bulk fluids plotted over the bulk viscosity (left) and the interfacial tension (right).
Secondary fluid (linoleic acid) saturation was kept constant at S=0.02. ............................................... 78
Figure 65: Scattering intensity I vs. scattering vector q for cocoa in water samples (ϕ= 15%) at
temperatures of 20°C, 30°C and 40°C and 20°C with added oleic acid (S = 0.02). .............................. 79
Figure 66: microtome images of dried cocoa suspensions without (left) and with (right) added
secondary fluid. ..................................................................................................................................... 80

List of tables p a g e | 88
List of tables
Table 1: Ingredients of cocoa solids (10/12 SN) provided by ADM Schokinag. .................................. 25
Table 2: Different crystal forms of cocoa butter (adapted from [66]). .................................................. 26
Table 3: Properties of hydrophobic substances used as secondary fluids for water continuous
suspensions. ........................................................................................................................................... 27
Table 4: Viscosity at = 100 s-1
and density of aqueous mixtures from glycerol, fructose and PEO. . 28
Table 5: Relative humidity of saturated salt solutions and the solubility of salt in water. ................... 35
Table 6: Contact angles measured via sessile drop method between starch and various glycerol-water
mixtures in the presence of sunflower oil as well as viscosity of these mixtures at 20°C. ................... 50
Table 7: Characteristics and solubility of immiscible liquids added as secondary fluids to cocoa
suspensions ............................................................................................................................................ 76

References p a g e | 89
References
[1] E. Koos and N. Willenbacher, “Capillary forces in suspension rheology,” Science (80-. )., vol.
331, no. 6091, pp. 897–900, 2011.
[2] E. Koos, J. Dittmann, and N. Willenbacher, “Kapillarkräfte in Suspensionen: Rheologische
Eigenschaften und potenzielle Anwendungen,” Chemie Ing. Tech., vol. 83, no. 8, pp. 1305–
1309, Aug. 2011.
[3] E. Koos, J. Johannsmeier, L. Schwebler, and N. Willenbacher, “Tuning suspension rheology
using capillary forces,” Soft Matter, vol. 8, no. 24, p. 2620, 2012.
[4] C. Gögelein, M. Brinkmann, M. Schröter, and S. Herminghaus, “Controlling the formation of
capillary bridges in binary liquid mixtures.,” Langmuir, vol. 26, no. 22, pp. 17184–9, Nov.
2010.
[5] S. Van Kao, L. E. Nielsen, and C. T. Hill, “Rheology of concentrated suspensions of spheres.
II. Suspensions agglomerated by an immiscible second liquid,” J. Colloid Interface Sci., vol.
53, no. 3, pp. 367–373, Dec. 1975.
[6] J. Dittmann and N. Willenbacher, “Micro Structural Investigations and Mechanical Properties
of Macro Porous Ceramic Materials from Capillary Suspensions,” J. Am. Ceram. Soc., vol. 6,
p. n/a–n/a, Aug. 2014.
[7] D. Johansson and B. Bergenståhl, “The influence of food emulsifiers on fat and sugar
dispersions in oils. I. Adsorption, sedimentation,” J. Am. Oil Chem. Soc., vol. 69, no. 8, pp.
705–717, Aug. 1992.
[8] D. Johansson and B. Bergenståhl, “The influence of food emulsifiers on fat and sugar
dispersions in oils. II. Rheology, colloidal forces,” J. Am. Oil Chem. Soc., vol. 69, no. 8, pp.
718–727, Aug. 1992.
[9] D. Johansson and B. Bergenståhl, “The influence of food emulsifiers on fat and sugar
dispersions in oils. III. Water content, purity of oils,” J. Am. Oil Chem. Soc., vol. 69, no. 8, pp.
728–733, Aug. 1992.
[10] I. Puddington and B. Sparks, “Spherical agglomeration processs,” Min. Sci Eng, vol. 7, no. 3,
pp. 282–288, 1975.
[11] E. Leonard, R. Greer, R. Markuszewski, and T. Wheelock, “Coal desulfurization and deashing
by oil agglomeration,” Sep. Sci. Technol., vol. 6, no. 1, pp. 1589–1609, 1981.
[12] L. A. Killian and J. N. Coupland, “Manufacture and application of water-in-oil emulsions to
induce the aggregation of sucrose crystals in oil: A model for melt-resistant chocolate,” Food
Biophys., vol. 7, no. 2, pp. 124–131, Feb. 2012.
[13] T. a. Stortz and A. G. Marangoni, “Heat resistant chocolate,” Trends Food Sci. Technol., vol.
22, no. 5, pp. 201–214, May 2011.
[14] G.-F. Schubiger and W. Rostgno, “Process for preparing a heat resistant chocolate product,”
US Pat. No. 3,218,174, 1965.

References p a g e | 90
[15] S. Simbürger, “Rapid development of heat resistance in chocolate and chocolate-like
confectionary products,” US Pat. No. 7,579,031 B2, 2009.
[16] H. Traitler, E. Windhab, and B. Wolf, “Process for manufactoring chocolate compositions
containing water,” US Patent No. 6,165,540, 2000.
[17] H. Russel and B. Zenlea, “Chocolate coated edibles,” US Pat. No. 2,457,110, 1948.
[18] C. Garbolino, “The influence of surfactants and moisture on the colloidial and rheological
properties of model chocolate dipersions,” [Doctoral thesis] The Pennsylvania State University,
2002.
[19] G. R. Ziegler, C. Garbolino, and J. N. Coupland, “The influence of surfactants and moisture on
the colloidial and rheological properties of model chocolat dispersions,” in 3rd International
Symposium on Food Rheology and Structure, 2003, pp. 335–339.
[20] D. Hugelshofer, “Structural and Rhcological Properties of Concentrated Suspensions Mixed
with an Emulsion,” [Doctoral thesis] ETH Zürich, 2000.
[21] E. Koos and N. Willenbacher, “Particle configurations and gelation in capillary suspensions,”
Soft Matter, vol. 8, no. 14, p. 3988, 2012.
[22] A. a. Negreiros, T. O. Althaus, G. Niederreiter, S. Palzer, M. J. Hounslow, and A. D. Salman,
“Microscale study of particle agglomeration in oil-based food suspensions: The effect of
binding liquid,” Powder Technol., vol. 270, pp. 528–536, 2015.
[23] B. J. D. Le Révérend, I. T. Norton, P. W. Cox, and F. Spyropoulos, “Colloidal aspects of
eating,” Curr. Opin. Colloid Interface Sci., vol. 15, no. 1–2, pp. 84–89, Apr. 2010.
[24] W. Cain, A. H. Clark, P. Dunphy, M. G. Jones, I. T. Norton, and S. B. Ross-Murphy, “Edible
Plastic Dispersions,” US Patent 4,956,193, 1990.
[25] I. T. Norton, C. R. Brown, and J. Underdown, “Low Fat Spread,” US Patent 5,508,056, 1996.
[26] D. Rousseau and S. Hodge, “Stabilization of water-in-oil emulsions with continuous phase
crystals,” Colloids Surfaces A Physicochem. Eng. Asp., vol. 260, no. 1–3, pp. 229–237, Jun.
2005.
[27] D. Rousseau, “Fat crystals and emulsion stability — a review,” Food Res. Int., vol. 33, no. 1,
pp. 3–14, Jan. 2000.
[28] S. Ghosh and D. Rousseau, “Fat crystals and water-in-oil emulsion stability,” Curr. Opin.
Colloid Interface Sci., vol. 16, no. 5, pp. 421–431, Oct. 2011.
[29] T. S. Skelhon, P. K. A. Olsson, A. R. Morgan, and S. A. F. Bon, “High internal phase agar
hydrogel dispersions in cocoa butter and chocolate as a route towards reducing fat content,”
Food Funct., vol. 4, no. 9, p. 1314, 2013.
[30] T. -a. L. Do, J. Vieira, J. M. Hargreaves, J. R. Mitchell, and B. Wolf, “Structural characteristics
of cocoa particles and their effect on the viscosity of reduced fat chocolate,” LWT - Food Sci.
Technol., vol. 44, no. 4, pp. 1207–1211, May 2011.

References p a g e | 91
[31] J. E. Norton, P. J. Fryer, J. Parkinson, and P. W. Cox, “Development and characterisation of
tempered cocoa butter emulsions containing up to 60% water,” J. Food Eng., vol. 95, no. 1, pp.
172–178, Nov. 2009.
[32] J. E. Norton and P. J. Fryer, “Investigation of changes in formulation and processing
parameters on the physical properties of cocoa butter emulsions,” J. Food Eng., vol. 113, no. 2,
pp. 329–336, Nov. 2012.
[33] T. S. Skelhon, N. Grossiord, A. R. Morgan, and S. a. F. Bon, “Quiescent water-in-oil Pickering
emulsions as a route toward healthier fruit juice infused chocolate confectionary,” J. Mater.
Chem., vol. 22, no. 36, p. 19289, 2012.
[34] J. Gould, J. Vieira, and B. Wolf, “Cocoa particles for food emulsion stabilisation.,” Food
Funct., vol. 4, no. 9, pp. 1369–75, Sep. 2013.
[35] B. P. Binks and S. O. Lumsdon, “Influence of particle wettability on the type and stability of
surfactant-free emulsions,” Langmuir, vol. 16, no. 23, pp. 8622–8631, Nov. 2000.
[36] Y. Kawashima, T. Handa, Y. Takeuchi, and H. Takenaka, “Spherical Agglomeration of
Calcium Carbonate Dispersed in Aqueous Media Containing Sodium Oleate,” Powder
Technol., vol. 46, pp. 61 – 66, 1986.
[37] P. T. L. Koh, P. H. T. Uhlherr, and J. R. G. Andrews, “The effect of capillary condasation and
liquid bridging on the bonding of hydrophobic particles in shear-floculation,” J. Colloid
Interface Sci., vol. 108, no. 1, pp. 95–103, 1985.
[38] N. Takenaka, K. Ogata, T. Yabe, R. Yamauchi, and K. Kato, “Effect of Oil and Sugar Contents
on the Surface of Dehulled-Roasted Sesame Seeds on Adhesion Between the Seeds,” J. Food
Sci., vol. 71, no. 6, pp. E303–E307, Aug. 2006.
[39] L. Galet, T. Vu, D. Oulahna, and J. Fages, “The wetting behaviour and dispersion rate of cocoa
powder in water,” Food Bioprod. Process., vol. 82, no. 4, pp. 298–303, Dec. 2004.
[40] W. B. Russel, Colloidal Dispersions. Cambridge: Cambridge University Press, 1989.
[41] H. C. Hamaker, “The London—van der Waals attraction between spherical particles,” Physica,
vol. 4, no. 10, pp. 1058–1072, 1937.
[42] S. Herminghaus, Wet granular matter. Singapore: World Scientific Publishing Co. Pte. Ltd.,
2013.
[43] W. Pietsch, “Haftkraft, Kapillarkraft, Flüssigkeitsvolumen und Grenzwinkel einer
Flüssigkeitsbrücke zwischen zwei Kugeln,” Chemie Ing. Tech., vol. 15, pp. 885–893, 1967.
[44] H. Schubert, “Capillary Force - Modeling and Application in Particulate Technology,” Powder
Technol., vol. 37, pp. 105–116, 1984.
[45] H.-J. Butt, “Capillary forces: influence of roughness and heterogeneity,” Langmuir, vol. 24, no.
9, pp. 4715–21, May 2008.
[46] B. P. Binks, “Particles as surfactants—similarities and differences,” Curr. Opin. Colloid
Interface Sci., vol. 7, no. 1–2, pp. 21–41, Mar. 2002.

References p a g e | 92
[47] R. Aveyard, B. P. Binks, and J. H. Clint, “Emulsions stabilised solely by colloidal particles,”
Adv. Colloid Interface Sci., vol. 100–102, pp. 503–546, Feb. 2003.
[48] I. Akartuna, A. R. Studart, E. Tervoort, U. T. Gonzenbach, and L. J. Gauckler, “Stabilization of
oil-in-water emulsions by colloidal particles modified with short amphiphiles.,” Langmuir, vol.
24, no. 14, pp. 7161–7168, Jul. 2008.
[49] E. Koos, “Capillary suspensions: Particle networks formed through the capillary force,” Curr.
Opin. Colloid Interface Sci., vol. 19, no. 6, pp. 575–584, 2014.
[50] J. Dittmann, E. Koos, and N. Willenbacher, “Ceramic capillary suspensions: Novel processing
route for macroporous ceramic materials,” J. Am. Ceram. Soc., vol. 96, no. 2, pp. 391–397,
Dec. 2012.
[51] E. Lauga and M. P. Brenner, “Evaporation-driven assembly of colloidal particles,” Phys. Rev.
Lett., vol. 93, no. 23, pp. 1–4, 2004.
[52] K. a. Brakke, “The Surface Evolver,” Exp. Math., vol. 1, no. 2, pp. 141–165, 1992.
[53] V. N. Manoharan, M. T. Elsesser, and David J. Pine, “Dense Packing and Symmetry in Small
Clusters of Microspheres,” Science (80-. )., vol. 301, pp. 483–487, 2003.
[54] A. Fortini, “Clustering and gelation of hard spheres induced by the Pickering effect,” Phys.
Rev. E - Stat. Nonlinear, Soft Matter Phys., vol. 85, no. 4, pp. 1–4, 2012.
[55] M. J. Schwuger, Lehrbuch der Grenzflächenchemie. Stuttgart: Georg Thieme Verlag, 1996.
[56] H.-D. Dörfler, Grenzflächen und kolloid-disperse Systeme. Berlin Heidelberg New York:
Springer Verlag, 2002.
[57] B. P. Binks and J. H. Clint, “Solid Wettability from Surface Energy Components: Relevance to
Pickering Emulsions,” Langmuir, vol. 18, no. 4, pp. 1270–1273, Feb. 2002.
[58] R. N. Wenzel, “Resistance of solid surfaces to wetting by water,” J. Ind. Eng. Chem.
(Washington, D. C.), vol. 28, pp. 988–994, 1936.
[59] A. B. D. Cassie and S. Baxter, “Wettability of porous surfaces,” Trans. Faraday Soc., vol. 40,
pp. 546–551, 1944.
[60] L. Yan, K. Wang, J. Wu, and L. Ye, “Hydrophobicity of model surfaces with closely packed
nano- and micro-spheres,” Colloids Surfaces A Physicochem. Eng. Asp., vol. 296, no. 1–3, pp.
123–131, Mar. 2007.
[61] H. P. Grace, “Dispersion phenomena in high viscosity immiscible fluid systems and application
of static mixers as dispersion devices in such systems,” Chem. Eng. Commun., vol. 14, pp.
225–277, 1982.
[62] A. N. Kolmogorov, Sammelband zur statistischen Theorie der Turbulenz. Akademie Verlag
Berlin, 1958.
[63] H. Tennekes and J. L. Lumley, A first course in turbulence. Cambridge, Massachusetts: MIT
Press., 2007.
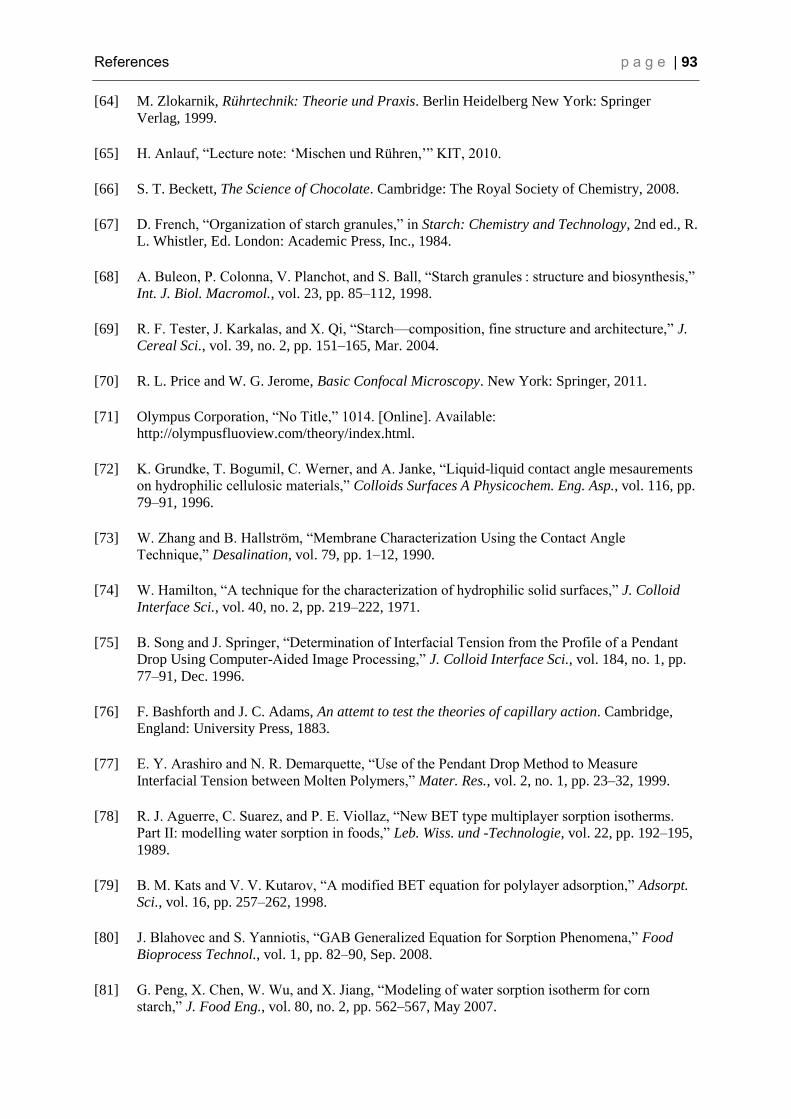
References p a g e | 93
[64] M. Zlokarnik, Rührtechnik: Theorie und Praxis. Berlin Heidelberg New York: Springer
Verlag, 1999.
[65] H. Anlauf, “Lecture note: ‘Mischen und Rühren,’” KIT, 2010.
[66] S. T. Beckett, The Science of Chocolate. Cambridge: The Royal Society of Chemistry, 2008.
[67] D. French, “Organization of starch granules,” in Starch: Chemistry and Technology, 2nd ed., R.
L. Whistler, Ed. London: Academic Press, Inc., 1984.
[68] A. Buleon, P. Colonna, V. Planchot, and S. Ball, “Starch granules : structure and biosynthesis,”
Int. J. Biol. Macromol., vol. 23, pp. 85–112, 1998.
[69] R. F. Tester, J. Karkalas, and X. Qi, “Starch—composition, fine structure and architecture,” J.
Cereal Sci., vol. 39, no. 2, pp. 151–165, Mar. 2004.
[70] R. L. Price and W. G. Jerome, Basic Confocal Microscopy. New York: Springer, 2011.
[71] Olympus Corporation, “No Title,” 1014. [Online]. Available:
http://olympusfluoview.com/theory/index.html.
[72] K. Grundke, T. Bogumil, C. Werner, and A. Janke, “Liquid-liquid contact angle mesaurements
on hydrophilic cellulosic materials,” Colloids Surfaces A Physicochem. Eng. Asp., vol. 116, pp.
79–91, 1996.
[73] W. Zhang and B. Hallström, “Membrane Characterization Using the Contact Angle
Technique,” Desalination, vol. 79, pp. 1–12, 1990.
[74] W. Hamilton, “A technique for the characterization of hydrophilic solid surfaces,” J. Colloid
Interface Sci., vol. 40, no. 2, pp. 219–222, 1971.
[75] B. Song and J. Springer, “Determination of Interfacial Tension from the Profile of a Pendant
Drop Using Computer-Aided Image Processing,” J. Colloid Interface Sci., vol. 184, no. 1, pp.
77–91, Dec. 1996.
[76] F. Bashforth and J. C. Adams, An attemt to test the theories of capillary action. Cambridge,
England: University Press, 1883.
[77] E. Y. Arashiro and N. R. Demarquette, “Use of the Pendant Drop Method to Measure
Interfacial Tension between Molten Polymers,” Mater. Res., vol. 2, no. 1, pp. 23–32, 1999.
[78] R. J. Aguerre, C. Suarez, and P. E. Viollaz, “New BET type multiplayer sorption isotherms.
Part II: modelling water sorption in foods,” Leb. Wiss. und -Technologie, vol. 22, pp. 192–195,
1989.
[79] B. M. Kats and V. V. Kutarov, “A modified BET equation for polylayer adsorption,” Adsorpt.
Sci., vol. 16, pp. 257–262, 1998.
[80] J. Blahovec and S. Yanniotis, “GAB Generalized Equation for Sorption Phenomena,” Food
Bioprocess Technol., vol. 1, pp. 82–90, Sep. 2008.
[81] G. Peng, X. Chen, W. Wu, and X. Jiang, “Modeling of water sorption isotherm for corn
starch,” J. Food Eng., vol. 80, no. 2, pp. 562–567, May 2007.

References p a g e | 94
[82] P. P. Lewicki, “The applicability of the GAB model to food water sorption isotherms,” Int. J.
Food Sci. Technol., no. 32, pp. 553–557, 1997.
[83] E. O. Timmermann, J. Chirife, and H. A. Iglesias, “Water sorption isotherms of foods and
foodstu � s : BET or GAB parameters ?,” J. Food Eng., vol. 48, pp. 19–31, 2001.
[84] a. H. Al-Muhtaseb, W. a. M. McMinn, and T. R. a. Magee, “Water sorption isotherms of starch
powders,” J. Food Eng., vol. 61, no. 3, pp. 297–307, Feb. 2004.
[85] R. Bhosale and R. Singhal, “Process optimization for the synthesis of octenyl succinyl
derivative of waxy corn and amaranth starches,” Carbohydr. Polym., vol. 66, no. 4, pp. 521–
527, Nov. 2006.
[86] S. Hoffmann, E. Koos, and N. Willenbacher, “Using capillary bridges to tune stability and flow
behavior of food suspensions,” Food Hydrocoll., vol. 40, pp. 44–52, Feb. 2014.
[87] M. A. Auty, M. Twomey, T. P. Guinee, and D. M. Mulvihill, “Development and application of
confocal scanning laser microscopy methods for studying the distribution of fat and protein in
selected dairy products.,” J. Dairy Res., vol. 68, no. 3, pp. 417–27, Aug. 2001.
[88] M. A. Rao, S. S. H. Rizvi, A. H. Datta, and J. Ahmed, Eds., Engineering Properties of Food.
CRC Press, 2014.
[89] D. Kadow, “Das cyanogene Syndrom bei Hevea brasiliensis,” 2010.
[90] T. . Vu, L. Galet, J. Fages, and D. Oulahna, “Improving the dispersion kinetics of a cocoa
powder by size enlargement,” Powder Technol., vol. 130, no. 1–3, pp. 400–406, Feb. 2003.
[91] J. F. Steffe, Rheological methods in food process engineering. East Lansing: Freemann Press,
1992.
[92] F. Horn, W. Richtering, J. Bergenholtz, N. Willenbacher, and N. Wagner, “Hydrodynamic and
colloidal interactions in concentrated charge-stabilized polymer dispersions.,” J. Colloid
Interface Sci., vol. 225, no. 1, pp. 166–178, May 2000.
[93] L. Svanberg, N. Lorén, and L. Ahrné, “Chocolate swelling during storage caused by fat or
moisture migration.,” J. Food Sci., vol. 77, no. 11, pp. E328–34, Nov. 2012.
[94] Q. D. Nguyen and D. V. Boger, “Measuring the flow properties of yield stress fluids,” Annu.
Rev. Fluid Mech., vol. 24, pp. 47–88, 1992.
[95] B. Derakhshandeh, R. J. Kerekes, S. G. Hatzikiriakos, and C. P. J. Bennington, “Rheology of
pulp fibre suspensions: A critical review,” Chem. Eng. Sci., vol. 66, no. 15, pp. 3460–3470,
Aug. 2011.
[96] M. Larsson and J. Duffy, “An Overview of Measurement Techniques for Determination of
Yield Stress,” Annu. Trans. Nord. Rheololy Soc., vol. 21, pp. 125–138, 2013.
[97] H. J. Walls, S. B. Caines, A. M. Sanchez, and S. a. Khan, “Yield stress and wall slip
phenomena in colloidal silica gels,” J. Rheol. (N. Y. N. Y)., vol. 47, no. 4, p. 847, 2003.
[98] T. G. Mezger, The Rheology Handbook, 2nd ed. Hannover: Vincents Network GmbH & Co
KG, 2006.

References p a g e | 95
[99] A. J. G. Van Diemen, F. W. A. M. Schreuder, and H. N. Stein, “Rheology of Suspensions of
Hydrophilic and Hydrophobic Solid Particles in Nonaqueous Media,” J. Colloid Interface Sci.,
vol. 104, no. 1, pp. 87–94, 1985.
[100] B. P. Binks and S. O. Lumsdon, “Transitional Phase Inversion of Solid-Stabilized Emulsions
Using Particle Mixtures,” Langmuir, vol. 16, no. 8, pp. 3748–3756, Apr. 2000.
[101] S. M. Iveson, J. D. Litster, K. Hapgood, and B. J. Ennis, “Nucleation, growth and breakage
phenomena in agitated wet granulation processes: a review,” Powder Technol., vol. 117, no. 1–
2, pp. 3–39, Jun. 2001.
[102] A. D. Salman, M. J. Hounslow, and J. P. K. Seville, “Granulation,” in Handbook of Powder
Technology, Volume 11., Amsterdam: Elsevier B.V., 2007.
[103] H.-J. Butt and M. Kappl, “Normal capillary forces.,” Adv. Colloid Interface Sci., vol. 146, no.
1–2, pp. 48–60, Feb. 2009.
[104] S. Herminghaus, “Dynamics of wet granular matter,” Adv. Phys., vol. 54, no. 3, pp. 221–261,
May 2005.
[105] C. Bauer, T. Bieker, and S. Dietrich, “Wetting-induced effective interaction potential between
spherical particles,” Phys. Rev. E, vol. 62, no. 4, pp. 5324–5338, Oct. 2000.
[106] T. Araki and H. Tanaka, “Wetting-induced depletion interaction between particles in a phase-
separating liquid mixture,” Phys. Rev. E, vol. 73, no. 6, p. 061506, Jun. 2006.
[107] D. Beysens and T. Narayanan, “Wetting-Induced Aggregation of Colloids,” J. Stat. Phys., vol.
95, pp. 997–1008, 1999.
[108] T. Cheng and Y. U. Wang, “Spontaneous Formation of Stable Capillary Bridges for Firming
Compact Colloidal Microstructures in Phase Separating Liquids: A Computational Study,”
Langmuir, vol. 28, pp. 2696–2703, 2012.
[109] N. Hijnen and P. S. Clegg, “Colloidal aggregation in mixtures of partially miscible liquids by
shear-induced capillary bridges.,” Langmuir, vol. 30, no. 20, pp. 5763–70, May 2014.
[110] K. Cavalier, “Effects of water on the rheological properties of calcite suspensions in
dioctylphthalate,” Colloids Surfaces A Physicochem. Eng. Asp., vol. 197, no. 1–3, pp. 173–181,
Feb. 2002.
[111] Y. Rudich, I. Benjamin, R. Naaman, E. Thomas, S. Trakhtenberg, and R. Ussyshkin, “Wetting
of Hydrophobic Organic Surfaces and Its Implications to Organic Aerosols in the
Atmosphere,” J. Phys. Chem. A, vol. 104, no. 22, pp. 5238–5245, Jun. 2000.
[112] E. Demou, “Uptake of water by organic films: the dependence on the film oxidation state,”
Atmos. Environ., vol. 37, no. 25, pp. 3529–3537, Aug. 2003.
[113] G. W. H. Höhne, W. F. Hemminger, and H.-J. Flammersheim, Differential Scannig
Calorimetry, 2nd Editio. Berlin Heidelberg New York: Springer-Verlag, 2010.
[114] P. Saxena and L. M. Hildemann, “Water Absorption by Organics: Survey of Laboratory
Evidence and Evaluation of UNIFAC for Estimating Water Activity,” Environ. Sci. Technol.,
vol. 31, no. 11, pp. 3318–3324, Nov. 1997.
References p a g e | 96
[115] L. Czepirski and J. Szymon, “Fitting of different models for water vapour sorption on potato
starch granules,” Appl. Surf. Sci., vol. 196, pp. 150–153, 2002.
[116] M. Rayner, D. Marku, M. Eriksson, M. Sjöö, P. Dejmek, and M. Wahlgren, “Biomass-based
particles for the formulation of Pickering type emulsions in food and topical applications,”
Colloids Surfaces A, vol. 458, pp. 48–62, 2014.
[117] S. Ghosh and D. Rousseau, “Freeze-thaw stability of water-in-oil emulsions,” J. Colloid
Interface Sci., vol. 339, no. 1, pp. 91–102, 2009.
[118] C. Lin, G. He, C. Dong, H. Liu, G. Xiao, and Y. Liu, “Effect of Oil Phase Transition on Freeze
/ Thaw-Induced Demulsification of Water-in-Oil Emulsions,” Most, no. 19, pp. 5291–5298,
2008.
[119] C. Hoskin, “Sensory of chocolate and their development,” Am J Clin Nutr, vol. 60, no. 6, pp.
1068–1070, 1994.
[120] J. Chevalley, “Rheology of Chocolate,” J. Texture Stud., vol. 6, no. 2, pp. 177–196, Jul. 1975.
[121] F. A. L. Dullien, Porous Media - Fluid Transport and Pore Structure, 2nd Editio. San Diego:
Academic Press INc., 1992.
[122] B. P. Binks and S. O. Lumsdon, “Stability of oil-in-water emulsions stabilised by silica
particles,” Methods, no. April, pp. 3007–3016, 1999.
[123] S. Novak, A. Dakskobler, and V. Ribitsch, “The effect of water on the behaviour of alumina-
paraffin suspensions for low-pressure injection moulding ( LPIM ),” vol. 20, pp. 2175–2181,
2000.
[124] M. Pahl, W. Gleißle, and H. M. Laun, Praktische Rheologie d er Kunststoffe und Elastomere,
4th editio. Düsseldorf: VDI Gesellschaft Kunststofftechnik, 1995.
[125] S. T. Beckett, “Controlling the Flow Properties of Liquid Chocolate,” in Science of Chocolate,
Cambridge: Royal Society of Chemistry, 2000.
[126] H. Salmang and H. Scholze, Keramik. Berlin Heidelberg: Springer Verlag, 2007.
[127] B. Adhikari, T. Howes, B. R. Bhandari, and V. Truong, “Stickiness in Foods: a Review of
Mechanisms and Test Methods,” Int. J. Food Prop., vol. 4, no. 1, pp. 1–33, Mar. 2001.
[128] R. D. Adams, Ed., Adhesive bonding. Cambridge: Woolhead Publishing Limited, 2005.
[129] C. A. Dahlquist, “Tack,” in In Adhesion fundamentals and practice, London: McLaren and
Sons Ltd., 1969.
[130] T. Domenech and S. Velankar, “Capillary-driven percolating networks in ternary blends of
immiscible polymers and silica particles,” Rheol. Acta, vol. 53, pp. 593–605, 2014.
[131] Z. Sadowski and R. W. Smith, “the Stability of Semi-Soluble Salt Type Mineral Suspensions in
Oleate Solution,” J. Dispers. Sci. Technol., vol. 10, no. 6, pp. 715–737, Jan. 1989.

References p a g e | 97
[132] M. M. Wu, G. A. Robbins, R. A. Winschel, and F. P. Burke, “Low-Temperature Coal
Weathering: Its Chemical Nature and Effects on Coal Properties,” Energy and Fuels, vol. 2, pp.
150–157, 1988.