Modeling of Sedimentation and Creaming in Suspensions and ...
22
fluids Article Modeling of Sedimentation and Creaming in Suspensions and Pickering Emulsions Rajinder Pal Department of Chemical Engineering, University of Waterloo, Waterloo, ON N2L 3G1, Canada; [email protected]; Tel.: +1-519-888-4567 (ext. 32985) Received: 20 September 2019; Accepted: 18 October 2019; Published: 22 October 2019 Abstract: Suspensions and emulsions are prone to kinetic instabilities of sedimentation and creaming, wherein the suspended particles and droplets fall or rise through a matrix fluid. It is important to understand and quantify sedimentation and creaming in such dispersed systems as they affect the shelf-life of products manufactured in the form of suspensions and emulsions. In this article, the unhindered and hindered settling/creaming behaviors of conventional emulsions and suspensions are first reviewed briefly. The available experimental data on settling/creaming of concentrated emulsions and suspensions are interpreted in terms of the drift flux theory. Modeling and simulation of nanoparticle-stabilized Pickering emulsions are carried out next. The presence of nanoparticles at the oil/water interface has a strong influence on the creaming/sedimentation behaviors of single droplets and swarm of droplets. Simulation results clearly demonstrate the strong influence of three-phase contact angle of nanoparticles present at the oil/water interface. This is the first definitive study dealing with modeling and simulation of unhindered and hindered creaming and sedimentation behaviors of nanoparticle-stabilized Pickering emulsions. Keywords: Pickering; emulsion; suspension; droplet; nanoparticles; creaming; sedimentation; drift flux; Stokes law; contact angle 1. Introduction Emulsions and suspensions form a large group of materials of industrial importance [1]. In suspensions, the dispersed phase consists of fine insoluble solid particles whereas in emulsions the dispersed phase consists of fine immiscible liquid droplets. In conventional emulsions, the dispersed droplets are stabilized against coalescence by the presence of surfactant at the oil-water interface. Pickering emulsions are a special class of emulsions where the dispersed droplets are stabilized against coalescence by solid nanoparticles which accumulate at the oil-water interface and provide steric barrier against intimate contact and coalescence between approaching droplets [2–11]. Thus Pickering emulsions are surfactant-free (see Figure 1). As Pickering emulsions are free of surfactants, they can replace conventional emulsions in household and personal care products where surfactants are known to exhibit adverse effects such as skin and eye irritation [5,12]. Due to outstanding properties of Pickering emulsions, there has been a rapid growth of interest in such systems recently [2–35]. In interfacial catalysis, the solid nanoparticles placed at the oil-water interface can be used to serve the dual purpose of catalyst and emulsion stabilizer [22–26]. Furthermore, chemical reactions can be carried out simultaneously in both aqueous and non-aqueous phases by placing solid catalyst nanoparticles at the oil-water interface [22–26]. Figure 2 shows a cryo-SEM image of an aqueous droplet of Pickering emulsion covered with silica nanoparticles [35]. The cryo-SEM image shows that the silica nanoparticles present at the interface are closely packed and they form a shell on the droplet. Fluids 2019, 4, 186; doi:10.3390/fluids4040186 www.mdpi.com/journal/fluids
-
Upload
khangminh22 -
Category
Documents
-
view
2 -
download
0
Transcript of Modeling of Sedimentation and Creaming in Suspensions and ...

fluids
Article
Modeling of Sedimentation and Creaming inSuspensions and Pickering Emulsions
Rajinder Pal
Department of Chemical Engineering, University of Waterloo, Waterloo, ON N2L 3G1, Canada;[email protected]; Tel.: +1-519-888-4567 (ext. 32985)
Received: 20 September 2019; Accepted: 18 October 2019; Published: 22 October 2019�����������������
Abstract: Suspensions and emulsions are prone to kinetic instabilities of sedimentation and creaming,wherein the suspended particles and droplets fall or rise through a matrix fluid. It is importantto understand and quantify sedimentation and creaming in such dispersed systems as they affectthe shelf-life of products manufactured in the form of suspensions and emulsions. In this article,the unhindered and hindered settling/creaming behaviors of conventional emulsions and suspensionsare first reviewed briefly. The available experimental data on settling/creaming of concentratedemulsions and suspensions are interpreted in terms of the drift flux theory. Modeling and simulationof nanoparticle-stabilized Pickering emulsions are carried out next. The presence of nanoparticlesat the oil/water interface has a strong influence on the creaming/sedimentation behaviors of singledroplets and swarm of droplets. Simulation results clearly demonstrate the strong influence ofthree-phase contact angle of nanoparticles present at the oil/water interface. This is the first definitivestudy dealing with modeling and simulation of unhindered and hindered creaming and sedimentationbehaviors of nanoparticle-stabilized Pickering emulsions.
Keywords: Pickering; emulsion; suspension; droplet; nanoparticles; creaming; sedimentation; driftflux; Stokes law; contact angle
1. Introduction
Emulsions and suspensions form a large group of materials of industrial importance [1].In suspensions, the dispersed phase consists of fine insoluble solid particles whereas in emulsions thedispersed phase consists of fine immiscible liquid droplets. In conventional emulsions, the disperseddroplets are stabilized against coalescence by the presence of surfactant at the oil-water interface.Pickering emulsions are a special class of emulsions where the dispersed droplets are stabilized againstcoalescence by solid nanoparticles which accumulate at the oil-water interface and provide stericbarrier against intimate contact and coalescence between approaching droplets [2–11]. Thus Pickeringemulsions are surfactant-free (see Figure 1). As Pickering emulsions are free of surfactants, theycan replace conventional emulsions in household and personal care products where surfactants areknown to exhibit adverse effects such as skin and eye irritation [5,12]. Due to outstanding propertiesof Pickering emulsions, there has been a rapid growth of interest in such systems recently [2–35].In interfacial catalysis, the solid nanoparticles placed at the oil-water interface can be used to servethe dual purpose of catalyst and emulsion stabilizer [22–26]. Furthermore, chemical reactions canbe carried out simultaneously in both aqueous and non-aqueous phases by placing solid catalystnanoparticles at the oil-water interface [22–26]. Figure 2 shows a cryo-SEM image of an aqueousdroplet of Pickering emulsion covered with silica nanoparticles [35]. The cryo-SEM image shows thatthe silica nanoparticles present at the interface are closely packed and they form a shell on the droplet.
Fluids 2019, 4, 186; doi:10.3390/fluids4040186 www.mdpi.com/journal/fluids

Fluids 2019, 4, 186 2 of 22
Fluids 2019, 4, x FOR PEER REVIEW 2 of 23
nanoparticles are preferentially wetted by the aqueous phase. In such situations, oil-in-water (O/W) type of emulsions are favored. When the contact angle is greater than 90°, the nanoparticles are relatively more wetted by the oil phase [10]. In such situations, water-in-oil (W/O) emulsions are favored. A large variety of nanoparticles, inorganic and organic, exhibit partial wetting characteristics [3–8,18] and hence are suitable for stabilization of emulsions.
Figure 1. Schematic representation of conventional surfactant-stabilized and Pickering nanoparticle-stabilized oil-in-water (O/W) emulsions (Adapted with permission from [11]).
Figure 2. A cryo-scanning electron microscopy (cryo-SEM) image of droplet of W/O Pickering emulsion (Adapted with permission from [35]).
Sedimentation and creaming, wherein particles or droplets fall or rise through a fluid in which they are suspended under the influence of gravity, is a common occurrence in suspensions and emulsions [36,37]. Sedimentation and creaming are usually undesirable as they affect the shelf-life of the product. According to some estimates [37], nearly 40% of the cost of developing a new food emulsion product is incurred in testing of the shelf-life. Creaming and sedimentation are kinetic
Figure 1. Schematic representation of conventional surfactant-stabilized and Pickeringnanoparticle-stabilized oil-in-water (O/W) emulsions (Adapted with permission from [11]).
Fluids 2019, 4, x FOR PEER REVIEW 2 of 22
nanoparticles are preferentially wetted by the aqueous phase. In such situations, oil-in-water (O/W) type of emulsions are favored. When the contact angle is greater than 90°, the nanoparticles are relatively more wetted by the oil phase [10]. In such situations, water-in-oil (W/O) emulsions are favored. A large variety of nanoparticles, inorganic and organic, exhibit partial wetting characteristics [3–8,18] and hence are suitable for stabilization of emulsions.
Figure 1. Schematic representation of conventional surfactant-stabilized and Pickering nanoparticle-stabilized oil-in-water (O/W) emulsions (Adapted with permission from [11]).
Figure 2. A cryo-scanning electron microscopy (cryo-SEM) image of droplet of W/O Pickering emulsion (Adapted with permission from [35]).
Sedimentation and creaming, wherein particles or droplets fall or rise through a fluid in which they are suspended under the influence of gravity, is a common occurrence in suspensions and emulsions [36,37]. Sedimentation and creaming are usually undesirable as they affect the shelf-life of the product. According to some estimates [37], nearly 40% of the cost of developing a new food emulsion product is incurred in testing of the shelf-life. Creaming and sedimentation are kinetic
Figure 2. A cryo-scanning electron microscopy (cryo-SEM) image of droplet of W/O Pickering emulsion(Adapted with permission from [35]).
For nanoparticles to adsorb at the oil-water interface, it is necessary that the nanoparticles arepartially wetted by both water and oil phases. Thus three-phase contact angle of nanoparticles isimportant [2–10]. If the contact angle measured through the aqueous phase is less than 90◦, thenanoparticles are preferentially wetted by the aqueous phase. In such situations, oil-in-water (O/W)type of emulsions are favored. When the contact angle is greater than 90◦, the nanoparticles arerelatively more wetted by the oil phase [10]. In such situations, water-in-oil (W/O) emulsions are favored.A large variety of nanoparticles, inorganic and organic, exhibit partial wetting characteristics [3–8,18]and hence are suitable for stabilization of emulsions.

Fluids 2019, 4, 186 3 of 22
Sedimentation and creaming, wherein particles or droplets fall or rise through a fluid in whichthey are suspended under the influence of gravity, is a common occurrence in suspensions andemulsions [36,37]. Sedimentation and creaming are usually undesirable as they affect the shelf-lifeof the product. According to some estimates [37], nearly 40% of the cost of developing a new foodemulsion product is incurred in testing of the shelf-life. Creaming and sedimentation are kineticinstabilities that not only affect the uniformity (uniform distribution of droplets) of the product,they are also precursors to thermodynamic instabilities [38]. For example, a creamed oil-in-wateremulsion consisting of a concentrated layer of oil droplets at the top of the sample tends to coalesce(thermodynamic instability) faster due to close proximity of oil droplets in the creamed layer. Thus agood understanding of the sedimentation and creaming behaviors of emulsions and suspensions isimportant in the formulation, handling, processing, and storage of such dispersed systems.
The objectives of this work are as follows: (a) to briefly review the unhindered and hinderedsettling/creaming behaviors of conventional emulsions and suspensions; (b) to interpret the existinghindered settling/creaming experimental data on conventional emulsions and suspensions in termsof the drift flux theory; (c) to develop a new model for unhindered and hindered settling/creamingof nanoparticle-stabilized Pickering emulsions; and (d) to simulate the settling/creaming behavior ofPickering emulsions using the proposed model.
2. Theoretical Background
2.1. Settling of a Single Rigid Particle
Consider a rigid particle of mass m settling in a liquid matrix under the action of a gravitationalforce. The forces acting on the particle are: gravity force (FG), drag force (FD), and buoyancy force (FB).Thus the net force acting on the particle in the downward direction is:
Fnet,downward = mdUdt
= FG − FB − FD (1)
The gravitational force FG on the particle is equal to mg, the drag force FD on the particle is equalto CDAp
(ρU2/2
), where CD is the drag coefficient and Ap is the projected area of the particle measured
in a plane normal to direction of motion of particle (for spherical particle, Ap = πR2), and the buoyancyforce FB on the particle is equal to weight of the fluid displaced by the particle, that is, FB = mρg/ρp
where ρp is particle density. Thus:
mdUdt
= mg−mgρρp−
CDApρU2
2(2)
or,dUdt
= g(ρp − ρ
ρp
)−
CDApρU2
2m(3)
Under steady state condition (dU/dt = 0), the particle settles at a constant velocity called theterminal velocity. Thus:
U0 =
√√2gm
(ρp − ρ
)ApρpCDρ
(4)
For spherical particles:
m =πD3
pρp
6and Ap =
πD2p
4(5)

Fluids 2019, 4, 186 4 of 22
This leads to the following settling velocity of spherical particles:
U0 =
√√4g
(ρp − ρ
)Dp
3CDρ(6)
The drag coefficient is a function of the particle Reynolds number (Rep), defined as:
Rep =ρDpU0
µ(7)
For creeping flow around a spherical particle (Rep < 0.1), CD is given by the Stokes Law as:
CD =24
Rep(8)
Upon substitution of the expression for CD into Equation (6), the following expression for the terminalsettling velocity of spherical rigid particles is obtained:
U0 =gD2
p
(ρp − ρ
)18µ
Rep < 0.1 (9)
2.2. Settling of a Swarm of Particles (Hindered Settling)
In the preceding section, the settling behavior of a single rigid particle in quiescent fluid isdiscussed. In practical applications, sedimentation of a swarm of particles is important. Due tohydrodynamic interactions between the neighboring particles, the settling velocity of a swarm ofparticles is hindered or slower. When a swarm of particles settle, the suspending medium fluid movesupward in order to compensate for the settling of particles (see Figure 3). Due to the backflow drag onthe particles, the particles settle at a velocity lower than that of an isolated article.
Fluids 2019, 4, x FOR PEER REVIEW 4 of 23
𝑈0 = 4𝑔 𝜌𝑝 − 𝜌 𝐷𝑝3𝐶𝐷𝜌 (6)
The drag coefficient is a function of the particle Reynolds number (Re ), defined as:
Re = ρ𝐷 𝑈μ (7)
For creeping flow around a spherical particle (Re < 0.1), 𝐶𝐷 is given by the Stokes Law as:
𝐶𝐷 = 24Re𝑝 (8)
Upon substitution of the expression for 𝐶𝐷 into Equation (6), the following expression for the terminal settling velocity of spherical rigid particles is obtained:
𝑈0 = 𝑔𝐷𝑝2 𝜌𝑝−𝜌18𝜇 Re < 0.1 (9)
2.2. Settling of a Swarm of Particles (Hindered Settling)
In the preceding section, the settling behavior of a single rigid particle in quiescent fluid is discussed. In practical applications, sedimentation of a swarm of particles is important. Due to hydrodynamic interactions between the neighboring particles, the settling velocity of a swarm of particles is hindered or slower. When a swarm of particles settle, the suspending medium fluid moves upward in order to compensate for the settling of particles (see Figure 3). Due to the backflow drag on the particles, the particles settle at a velocity lower than that of an isolated article.
Figure 3. Hindered batch settling of particles.
The relative decrease in the settling velocity of particles in a dilute suspension is proportional to 𝜙, the volume fraction of particles, and is given as:
Figure 3. Hindered batch settling of particles.

Fluids 2019, 4, 186 5 of 22
The relative decrease in the settling velocity of particles in a dilute suspension is proportional toφ, the volume fraction of particles, and is given as:
Up −U0
U0= −αφ (10)
where Up is the settling velocity of particles in a suspension of concentration φ. Equation (10) can bere-written as:
Up = U0(1− αφ) (11)
Assuming the spatial distribution of particles to be random, Batchelor [39] theoretically found thevalue of α to be 6.55.
The linear relationship, Equation (11), is valid only at low concentrations (φ < 0.05). At highparticle concentrations, the hindrance effect becomes more pronounced and the relationship becomesnon-linear. A number of empirical and semi-empirical correlations have been proposed in the literatureto describe hindered settling of particles at high particle concentrations. The most popular ones are dueto Richardson and Zaki [40] and Garside and Al-Dibouni [41]. The Richardson and Zaki correlation isgiven as:
Up = U0(1−φ)n (12)
where n is a function of particle Reynolds number Rep. For low Rep(Rep < 0.2), n = 4.65. The Garsideand Al-Dibouni correlation is given as:
UR −AB−UR
= 0.06(Rep)ε+0.2 (13)
where A = ε4.14, B = 0.8ε1.28 (when ε ≤ 0.85), B = ε2.65 (when ε > 0.85), ε is volume fraction of fluid,and UR is defined as:
UR =Up
εU0(14)
In the limit Rep → 0 , Equation (13) reduces to:
Up = U0(1−φ)5.14 (15)
This equation has the same form as that of the Richardson and Zaki equation, Equation (12), with adifferent value of n. Al-Naafa and Sami-Selim [42] proposed the following equation to describe theirdata on sedimentation of monodisperse suspensions:
Up = U0(1−φ)6.55 (16)
In the limit φ→ 0 , Equation (16) reduces to Batchelor’s equation, Equation (11) with α = 6.55.
3. Drift Flux Theory and Re-Interpretation of Existing Hindered Settling Data
3.1. Drift Flux Theory
The drift flux theory is used widely in the analysis of two-phase flows when the two phasesmove with different velocities. For example, it can be used to predict the in-situ gas hold up in bubblygas-liquid two-phase flows from the knowledge of superficial gas and liquid velocities, bubble size, andfluid properties. The drift flux theory can be readily applied to sedimentation of particles in non-dilutesuspensions. The advantage of the drift flux theory is that it can applied to both batch sedimentationand continuous sedimentation of suspensions. Note that in batch sedimentation there is no net motionof suspension, that is, the particles and the matrix fluid move in opposite directions such that the net

Fluids 2019, 4, 186 6 of 22
suspension velocity is zero with respect to a stationary observer. In continuous sedimentation, thesuspension has a net motion with a non-zero net velocity with respect to a stationary observer.
Consider a suspension of solid particles in Newtonian liquid. The drift velocity of solid particles,
denoted as→
Upm, is defined as:→
Upm =→
Up −→
Um (17)
where→
Up is the particle velocity and→
Um is the mixture (suspension) velocity with respect to a stationaryobserver. Thus the drift velocity of a particle is the velocity of a particle relative to an observer moving
with the suspension velocity→
Um. The suspension velocity→
Um can be expressed as:
→
Um =→
J p +→
J l (18)
where→
J p is the volumetric flux of particles and→
J l is the volumetric flux of liquid phase. The volumetricfluxes are related to particle and liquid velocities as follows:
→
J p = φ→
Up (19)
→
J l = (1−φ)→
Ul (20)
where→
Ul is the liquid phase velocity. From Equations (17) and (18), it follows that:
→
Upm =→
Up −
(→
J p +→
J l
)(21)
Substituting the relations for→
J p (Equation (19)) and→
J l (Equation (20)) into Equation (21), we obtain:
→
Upm = (1−φ)(→
Up −→
Ul
)= (1−φ)
→
Us (22)
where→
Us =(→
Up −→
Ul
)is the slip velocity between the particles and the fluid (liquid).
The drift flux of particles, denoted as→
J pm, is related to the drift velocity of particles→
Upm as:
→
J pm = φ→
Upm (23)
Substitution of Equations (21) into (23) yields:
→
J pm = (1−φ)→
J p −φ→
J l (24)
From the knowledge of volumetric fluxes→
J p,→
J l and volume fraction of particles φ, one can calculate
the drift flux using Equation (24). Once the drift flux is known, the drift velocity→
Upm can be calculated
from Equation (23) and the slip velocity→
Us can be calculated from Equation (22).The drift velocity can be expressed as:
→
Upm =→
U0 f (φ) (25)
where→
U0 is the settling velocity of a single isolated particle in quiescent liquid and f (φ) is the hinderedsettling function of the form of Richardson and Zaki correlation. Thus,
→
Upm =→
U0(1−φ)n (26)

Fluids 2019, 4, 186 7 of 22
→
J pm = φ→
Upm =→
U0φ(1−φ)n (27)
In the absence of any relative motion or slip between the particles and fluid, we have:
→
Upm = 0 ;→
J pm = 0 ;→
Us = 0 (28)
Under these conditions, the suspension flow can be treated as a homogeneous single-phase flow withaverage properties. In the present topic of discussion, that is, batch sedimentation of particles wherethere is no net flow of suspension, the following relations are applicable:
→
Um = 0 (29)
→
Upm =→
Up (30)
→
J pm = φ→
Up (31)
→
Up =→
U0(1−φ)n (32)
3.2. Re-interpretation of Existing Hindered Settling Data in Terms of Drift Flux Theory
According to the drift flux model, the normalized drift velocity (see Equation (25)) is a function ofthe concentration of particles or droplets. The normalized drift velocity UDri f t,N can be expressed inscalar form as:
UDri f t,N = Upm/U0 = (1−φ)n (33)
where the value of the exponent n needs to be determined from experimental data. For low particleReynolds number, the Richardson and Zaki correlation gives n = 4.65.
Two sets of experimental data on creaming (upward motion) of oil droplets in concentratedoil-in-water emulsions and four sets of experimental data on settling of particles in concentratedsuspensions are considered to validate the drift flux model, Equation (33). Table 1 provides the detailsof the emulsion and suspension systems considered here. The experimental data covers both creamingin emulsions and sedimentation in suspensions over broad ranges of droplet/particle concentrationand sizes.
Table 1. Six sets of creaming/sedimentation data taken from different sources.
Set No. DispersionType
Creaming orSedimentation
Particle VolumeFraction
Particle MeanDiameter Reference
1 emulsion creaming 0–0.40 1.72 µm Chanamai &McClements [43]
2 emulsion creaming 0–0.40 0.86 µm Chanamai &McClements [43]
3 suspension sedimentation 0–0.40 788 µm Nicolai et al. [44]4 suspension sedimentation 0–0.48 3.1 µm Buscall et al. [45]5 suspension sedimentation 0–0.15 136 µm Davis & Birdsell [46]6 suspension sedimentation 0–0.53 0.27–0.31 µm Davis et al. [47]
Figure 4 shows the experimental data for emulsions and suspensions plotted as normalized driftvelocity versus droplet or particle concentration (vol. %). Interestingly the experimental data for verydifferent dispersed systems such as emulsions undergoing creaming effect (upward motion of oildroplets) and suspensions undergoing sedimentation effect (downward motion of particles), with verydifferent droplet or particle sizes (see Table 1), show the same trend. However, there is a significantscatter of experimental data from one set to another. The likely cause for this scatter is the solvation ofparticles and droplets. The particles and droplets of dispersions become coated with thin layers or

Fluids 2019, 4, 186 8 of 22
films of matrix fluid due to strong attractive interactions between the particle/droplet surfaces and thematrix molecules. The attractive interactions between the particle surface and matrix molecules areparticularly important when the particles/droplets are electrically charged or the droplets are stabilizedby surfactant (see Figure 5).
Fluids 2019, 4, x FOR PEER REVIEW 8 of 23
layers or films of matrix fluid due to strong attractive interactions between the particle/droplet surfaces and the matrix molecules. The attractive interactions between the particle surface and matrix molecules are particularly important when the particles/droplets are electrically charged or the droplets are stabilized by surfactant (see Figure 5).
Figure 4. Experimental data for creaming/sedimentation of emulsions and suspensions plotted as normalized drift velocity versus droplet or particle concentration (vol. %).
Figure 5. Particle/droplet coated with a thin film of immobilized matrix fluid.
The solvation films become part of the particles increasing their effective size and volume fraction. The effective volume fraction of solvated particles 𝜙 can be expressed as:
Figure 4. Experimental data for creaming/sedimentation of emulsions and suspensions plotted asnormalized drift velocity versus droplet or particle concentration (vol. %).
Fluids 2019, 4, x FOR PEER REVIEW 8 of 23
layers or films of matrix fluid due to strong attractive interactions between the particle/droplet surfaces and the matrix molecules. The attractive interactions between the particle surface and matrix molecules are particularly important when the particles/droplets are electrically charged or the droplets are stabilized by surfactant (see Figure 5).
Figure 4. Experimental data for creaming/sedimentation of emulsions and suspensions plotted as normalized drift velocity versus droplet or particle concentration (vol. %).
Figure 5. Particle/droplet coated with a thin film of immobilized matrix fluid.
The solvation films become part of the particles increasing their effective size and volume fraction. The effective volume fraction of solvated particles 𝜙 can be expressed as:
Figure 5. Particle/droplet coated with a thin film of immobilized matrix fluid.
Fluids 2019, 4, 186 9 of 22
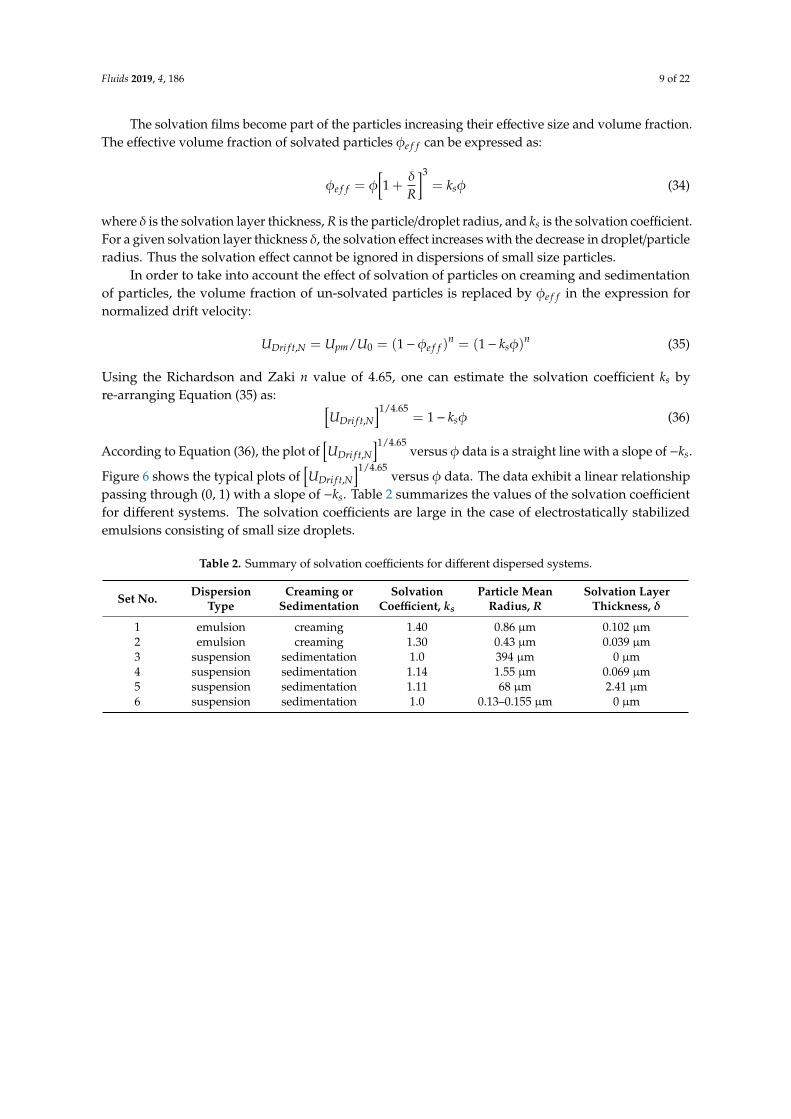
The solvation films become part of the particles increasing their effective size and volume fraction.The effective volume fraction of solvated particles φe f f can be expressed as:
φe f f = φ[1 +
δR
]3= ksφ (34)
where δ is the solvation layer thickness, R is the particle/droplet radius, and ks is the solvation coefficient.For a given solvation layer thickness δ, the solvation effect increases with the decrease in droplet/particleradius. Thus the solvation effect cannot be ignored in dispersions of small size particles.
In order to take into account the effect of solvation of particles on creaming and sedimentationof particles, the volume fraction of un-solvated particles is replaced by φe f f in the expression fornormalized drift velocity:
UDri f t,N = Upm/U0 = (1−φe f f )n = (1− ksφ)
n (35)
Using the Richardson and Zaki n value of 4.65, one can estimate the solvation coefficient ks byre-arranging Equation (35) as: [
UDri f t,N]1/4.65
= 1− ksφ (36)
According to Equation (36), the plot of[UDri f t,N
]1/4.65versus φ data is a straight line with a slope of −ks.
Figure 6 shows the typical plots of[UDri f t,N
]1/4.65versus φ data. The data exhibit a linear relationship
passing through (0, 1) with a slope of −ks. Table 2 summarizes the values of the solvation coefficientfor different systems. The solvation coefficients are large in the case of electrostatically stabilizedemulsions consisting of small size droplets.
Table 2. Summary of solvation coefficients for different dispersed systems.
Set No. DispersionType
Creaming orSedimentation
SolvationCoefficient, ks
Particle MeanRadius, R
Solvation LayerThickness, δ
1 emulsion creaming 1.40 0.86 µm 0.102 µm2 emulsion creaming 1.30 0.43 µm 0.039 µm3 suspension sedimentation 1.0 394 µm 0 µm4 suspension sedimentation 1.14 1.55 µm 0.069 µm5 suspension sedimentation 1.11 68 µm 2.41 µm6 suspension sedimentation 1.0 0.13–0.155 µm 0 µm

Fluids 2019, 4, 186 10 of 22Fluids 2019, 4, x FOR PEER REVIEW 10 of 23
Figure 6. Typical plots of 𝑈 , / . versus 𝜙 experimental data.
The experimental data for emulsions and suspensions are re-plotted in Figure 7 as normalized drift velocity versus effective volume fraction of particles/droplets 𝜙 (vol. %). Now the scatter in experimental data is reduced significantly and the following model describes the data adequately:
𝑈𝐷𝑟𝑖𝑓𝑡,𝑁 == (1 − 𝜙𝑒𝑓𝑓)4.65 = (1 − 𝑘𝑠𝜙)4.65 (37)
Figure 6. Typical plots of[UDri f t,N
]1/4.65versus φ experimental data.
The experimental data for emulsions and suspensions are re-plotted in Figure 7 as normalizeddrift velocity versus effective volume fraction of particles/droplets φe f f (vol. %). Now the scatter inexperimental data is reduced significantly and the following model describes the data adequately:
UDri f t,N == (1−φe f f )4.65 = (1− ksφ)
4.65 (37)

Fluids 2019, 4, 186 11 of 22
Fluids 2019, 4, x FOR PEER REVIEW 11 of 23
Figure 7. Normalized drift velocity versus effective volume fraction of particles/droplets 𝜙 .
Figure 8 shows the plot of normalized drift flux 𝐽 , as a function of effective dispersed-phase concentration 𝜙 . The experimental data are compared with the following model for normalized drift flux:
𝐽𝑑𝑟𝑖𝑓𝑡,𝑁 = 𝐽𝑝𝑚/𝑈0 = 𝜙𝑒𝑓𝑓 (1 − 𝜙𝑒𝑓𝑓)4.65
(38)
where 𝜙 = 𝑘 𝜙. The experimental data follow the drift flux model, Equation (38), reasonably well.
Figure 7. Normalized drift velocity versus effective volume fraction of particles/droplets φe f f .
Figure 8 shows the plot of normalized drift flux Jdri f t,N as a function of effective dispersed-phaseconcentration φe f f . The experimental data are compared with the following model for normalizeddrift flux:
Jdri f t,N = Jpm/U0 = φe f f (1−φe f f )4.65 (38)
where φe f f = ksφ. The experimental data follow the drift flux model, Equation (38), reasonably well.Fluids 2019, 4, x FOR PEER REVIEW 12 of 23
Figure 8. Normalized drift flux 𝐽 , as a function of effective dispersed-phase concentration 𝜙 (vol %).
In summary, the creaming and sedimentation experimental data obtained for a variety of different systems covering a broad range of particle and droplet sizes can be described adequately by the drift flux model, Equations (37) and (38). In what follows, this drift flux approach is applied to modeling of creaming and sedimentation of Pickering emulsions.
4. Modeling and Simulation of Creaming and Sedimentation of Pickering Emulsions
4.1. Upward Rise and Downward Settling of A Single Pickering Emulsion Droplet
Consider a single Pickering emulsion droplet shown in Figure 9. The droplet has a core-shell morphology with liquid core and a monolayer of packed nanoparticles as a shell. The droplet may rise (cream) or settle (sediment) depending on the difference between the effective density of droplet and the density of matrix fluid.
Figure 9. Core-shell Pickering emulsion droplet.
Figure 10 shows a schematic diagram of a Pickering emulsion droplet with relevant dimensions. The effective density of the Pickering core-shell droplet is different from that of the bare droplet due
Figure 8. Normalized drift flux Jdri f t,N as a function of effective dispersed-phase concentration φe f f
(vol %).
In summary, the creaming and sedimentation experimental data obtained for a variety of differentsystems covering a broad range of particle and droplet sizes can be described adequately by the driftflux model, Equations (37) and (38). In what follows, this drift flux approach is applied to modeling ofcreaming and sedimentation of Pickering emulsions.

Fluids 2019, 4, 186 12 of 22
4. Modeling and Simulation of Creaming and Sedimentation of Pickering Emulsions
4.1. Upward Rise and Downward Settling of a Single Pickering Emulsion Droplet
Consider a single Pickering emulsion droplet shown in Figure 9. The droplet has a core-shellmorphology with liquid core and a monolayer of packed nanoparticles as a shell. The droplet may rise(cream) or settle (sediment) depending on the difference between the effective density of droplet andthe density of matrix fluid.
Fluids 2019, 4, x FOR PEER REVIEW 12 of 23
Figure 8. Normalized drift flux 𝐽 , as a function of effective dispersed-phase concentration 𝜙 (vol %).
In summary, the creaming and sedimentation experimental data obtained for a variety of different systems covering a broad range of particle and droplet sizes can be described adequately by the drift flux model, Equations (37) and (38). In what follows, this drift flux approach is applied to modeling of creaming and sedimentation of Pickering emulsions.
4. Modeling and Simulation of Creaming and Sedimentation of Pickering Emulsions
4.1. Upward Rise and Downward Settling of A Single Pickering Emulsion Droplet
Consider a single Pickering emulsion droplet shown in Figure 9. The droplet has a core-shell morphology with liquid core and a monolayer of packed nanoparticles as a shell. The droplet may rise (cream) or settle (sediment) depending on the difference between the effective density of droplet and the density of matrix fluid.
Figure 9. Core-shell Pickering emulsion droplet.
Figure 10 shows a schematic diagram of a Pickering emulsion droplet with relevant dimensions. The effective density of the Pickering core-shell droplet is different from that of the bare droplet due
Figure 9. Core-shell Pickering emulsion droplet.
Figure 10 shows a schematic diagram of a Pickering emulsion droplet with relevant dimensions.The effective density of the Pickering core-shell droplet is different from that of the bare droplet due toloading of nanoparticles at the interface. The effective density of core-shell droplets can be calculatedusing the following approach assuming a monolayer of spherical nanoparticles present on the dropletsurface. The number of particles loaded on the droplet is:
N =4π(R∗)2
πR2np
β = 4(R∗/Rnp)2β (39)
where Rnp is the radius of the nanoparticle, R∗ is the radius of spherical surface passing through theequator of nanoparticles (see Figure 10), β is the fraction of the surface area 4π(R∗)2 occupied by thenanoparticles. For square packing of nanoparticles shown in Figure 11, β = 0.785. For hexagonalpacking (see Figure 12), β = 0.907.Fluids 2019, 4, x FOR PEER REVIEW 13 of 23
Figure 10. Schematic diagram of a Pickering emulsion droplet with relevant dimensions.
to loading of nanoparticles at the interface. The effective density of core-shell droplets can be calculated using the following approach assuming a monolayer of spherical nanoparticles present on the droplet surface. The number of particles loaded on the droplet is: 𝑁 = 4𝜋(𝑅∗)𝜋𝑅 𝛽 = 4(𝑅∗/𝑅 ) 𝛽 (39)
where 𝑅 is the radius of the nanoparticle, 𝑅∗ is the radius of spherical surface passing through the equator of nanoparticles (see Figure 10), 𝛽 is the fraction of the surface area 4𝜋(𝑅∗) occupied by the nanoparticles. For square packing of nanoparticles shown in Figure 11, 𝛽 = 0.785. For hexagonal packing (see Figure 12), 𝛽 = 0.907.
Figure 11. Square packing of nanoparticles.
Figure 10. Schematic diagram of a Pickering emulsion droplet with relevant dimensions.

Fluids 2019, 4, 186 13 of 22
Fluids 2019, 4, x FOR PEER REVIEW 13 of 23
Figure 10. Schematic diagram of a Pickering emulsion droplet with relevant dimensions.
to loading of nanoparticles at the interface. The effective density of core-shell droplets can be calculated using the following approach assuming a monolayer of spherical nanoparticles present on the droplet surface. The number of particles loaded on the droplet is: 𝑁 = 4𝜋(𝑅∗)𝜋𝑅 𝛽 = 4(𝑅∗/𝑅 ) 𝛽 (39)
where 𝑅 is the radius of the nanoparticle, 𝑅∗ is the radius of spherical surface passing through the equator of nanoparticles (see Figure 10), 𝛽 is the fraction of the surface area 4𝜋(𝑅∗) occupied by the nanoparticles. For square packing of nanoparticles shown in Figure 11, 𝛽 = 0.785. For hexagonal packing (see Figure 12), 𝛽 = 0.907.
Figure 11. Square packing of nanoparticles. Figure 11. Square packing of nanoparticles.Fluids 2019, 4, x FOR PEER REVIEW 14 of 23
Figure 12. Hexagonal packing of nanoparticles.
4.2. Oil-in-water (O/W) Emulsions
For oil-in-water (O/W) emulsions, the thickness of the interfacial layer of nanoparticles protruding into the matrix aqueous fluid (see Figure 13) is given as follows [10]: ℎ = 𝑅 (1 + cos𝜃) (40)
where 𝜃 is the three-phase contact angle measured through the aqueous phase. The radius 𝑅∗ can be expressed as: 𝑅∗ = 𝑅 + ℎ − 𝑅 = 𝑅 1 + 𝑅𝑅 cos𝜃 (41)
Figure 13. Thickness of interfacial layer of solid nanoparticles protruding into the continuous phase of an emulsion.
where 𝑅 is the radius of bare emulsion droplet (see Figure 10). The mass of nanoparticles present on the surface of a single oil droplet can be calculated as follows: 𝑚 = 𝑁𝜌 (4𝜋𝑅 /3) (42)
Figure 12. Hexagonal packing of nanoparticles.
4.2. Oil-in-water (O/W) Emulsions
For oil-in-water (O/W) emulsions, the thickness of the interfacial layer of nanoparticles protrudinginto the matrix aqueous fluid (see Figure 13) is given as follows [10]:
h = Rnp(1 + cosθ) (40)
where θ is the three-phase contact angle measured through the aqueous phase. The radius R∗ can beexpressed as:
R∗ = Rd + h−Rnp = Rd
(1 +
Rnp
Rdcosθ
)(41)

Fluids 2019, 4, 186 14 of 22
where Rd is the radius of bare emulsion droplet (see Figure 10). The mass of nanoparticles present onthe surface of a single oil droplet can be calculated as follows:
mnanoparticles = Nρnp(4πR3
np/3)
(42)
Fluids 2019, 4, x FOR PEER REVIEW 14 of 23
Figure 12. Hexagonal packing of nanoparticles.
4.2. Oil-in-water (O/W) Emulsions
For oil-in-water (O/W) emulsions, the thickness of the interfacial layer of nanoparticles protruding into the matrix aqueous fluid (see Figure 13) is given as follows [10]: ℎ = 𝑅 (1 + cos𝜃) (40)
where 𝜃 is the three-phase contact angle measured through the aqueous phase. The radius 𝑅∗ can be expressed as: 𝑅∗ = 𝑅 + ℎ − 𝑅 = 𝑅 1 + 𝑅𝑅 cos𝜃 (41)
Figure 13. Thickness of interfacial layer of solid nanoparticles protruding into the continuous phase of an emulsion.
where 𝑅 is the radius of bare emulsion droplet (see Figure 10). The mass of nanoparticles present on the surface of a single oil droplet can be calculated as follows: 𝑚 = 𝑁𝜌 (4𝜋𝑅 /3) (42)
Figure 13. Thickness of interfacial layer of solid nanoparticles protruding into the continuous phase ofan emulsion.
From Equations (39) and (42) it follows that:
mnanoparticles = (16π/3)(R∗)2Rnpβρnp (43)
The mass of the matrix fluid attached to the interfacial layer of nanoparticles is as follows:
mmatrix− f luid−immobilized = N[4R2
nph− (π/3)h2(3Rnp − h
)]ρw (44)
Thus the effective density of an oil droplet of a Pickering O/W emulsion can be expressed as:
ρd,e f f =(mbare−droplet + mnanoparticles + mmatrix− f luid−immobilized
)/(4πR3
e f f /3)
(45)
where Re f f is the effective radius of the composite droplet (Re f f = Rd + h) and mbare−droplet is the mass
of the bare oil droplet given as(4πR3
d/3)ρo where ρo is the oil density.
Using the effective density of a droplet given by Equation (45), the rise velocity of a single Pickeringoil droplet suspended in water matrix can now be calculated from the following modified Stokes law:
U0 =2gR2
e f f
(ρw − ρd,e f f
)9µ
(46)
Figures 14 and 15 show the simulation results for two model Pickering O/W emulsions:PSNPMO-OW and SNPCO-OW, respectively. PSNPMO-OW refers to Pickering O/W emulsionconsisting of polystyrene nanoparticles (PSNP) and mineral oil (MO) droplets. SNPCO-OW refers toPickering O/W emulsion consisting of silica nanoparticles (SNP) and castor oil (CO) droplets. For thePSNPMO-OW Pickering emulsion, the values of the various parameters used in the simulation are:Rd = 1 µm, Rnp = 0.1 µm, ρo = 773 kg/m3, ρw = 997 kg/m3, ρnp = 1054 kg/m3, µ = 0.89 mPa.s, andg = 9.8 m/s2. For the SNPCO-OW Pickering emulsion, the values of the various parameters used inthe simulation are: Rd = 1 µm, Rnp = 0.1 µm, ρo = 960 kg/m3, ρw = 997 kg/m3, ρnp = 2650 kg/m3,

Fluids 2019, 4, 186 15 of 22
µ = 0.89 mPa.s, and g = 9.8 m/s2. The Stokes (rise or fall) velocity Uo and relative density ρd,e f f /ρo ofa single Pickering oil droplet are plotted as functions of contact angle. The solid curves are generatedusing β = 0.785 (square packing of nanoparticles at the interface) and the dashed curves are generatedusing β = 0.907 (hexagonal packing of nanoparticles at the interface).
Fluids 2019, 4, x FOR PEER REVIEW 15 of 23
From Equations (39) and (42) it follows that: 𝑚 = (16𝜋/3)(𝑅∗) 𝑅 𝛽𝜌 (43)
The mass of the matrix fluid attached to the interfacial layer of nanoparticles is as follows: 𝑚 = 𝑁 4𝑅 ℎ − (𝜋/3)ℎ (3𝑅 − ℎ) 𝜌 (44)
Thus the effective density of an oil droplet of a Pickering O/W emulsion can be expressed as: 𝜌 , = (𝑚 + 𝑚 + 𝑚 )/(4𝜋𝑅 /3) (45)
where 𝑅 is the effective radius of the composite droplet (𝑅 = 𝑅 + ℎ) and 𝑚 is the mass of the bare oil droplet given as (4𝜋𝑅 /3)𝜌 where 𝜌 is the oil density.
Using the effective density of a droplet given by Equation (45), the rise velocity of a single Pickering oil droplet suspended in water matrix can now be calculated from the following modified Stokes law:
𝑈0 = 2gReff2 ρw − ρd,eff9μ (46)
Figures 14 and 15 show the simulation results for two model Pickering O/W emulsions: PSNPMO-OW and SNPCO-OW, respectively. PSNPMO-OW refers to Pickering O/W emulsion consisting of polystyrene nanoparticles (PSNP) and mineral oil (MO) droplets. SNPCO-OW refers to Pickering O/W emulsion consisting of silica nanoparticles (SNP) and castor oil (CO) droplets. For the PSNPMO-OW Pickering emulsion, the values of the various parameters used in the simulation are: 𝑅 = 1 μm, 𝑅 = 0.1 μm, 𝜌 = 773 kg/m3, 𝜌 = 997 kg/m3, 𝜌 = 1054 kg/m3, 𝜇 = 0.89 mPa. s, and 𝑔 = 9.8 m/s2. For the SNPCO-OW Pickering emulsion, the values of the various parameters used in the simulation are: 𝑅 = 1 μm, 𝑅 = 0.1 μm, 𝜌 = 960 kg/m3, 𝜌 = 997 kg/m3, 𝜌 = 2650 kg/m3, 𝜇 = 0.89 mPa. s, and 𝑔 = 9.8 m/s2. The Stokes (rise or fall) velocity 𝑈 and relative density 𝜌 , 𝜌⁄ of a single Pickering oil droplet are plotted as functions of contact angle. The solid curves are generated using 𝛽 = 0.785 (square packing of nanoparticles at the interface) and the dashed curves are generated using 𝛽 = 0.907 (hexagonal packing of nanoparticles at the interface).
Figure 14. Variations of Stokes rise velocity and relative density of a single Pickering oil droplet with contact angle (PSNPMO-OW Pickering emulsion). The solid curves represent square packing and the dashed curves represent hexagonal packing of nanoparticles at the oil-water interface.
Figure 14. Variations of Stokes rise velocity and relative density of a single Pickering oil droplet withcontact angle (PSNPMO-OW Pickering emulsion). The solid curves represent square packing and thedashed curves represent hexagonal packing of nanoparticles at the oil-water interface.Fluids 2019, 4, x FOR PEER REVIEW 16 of 23
Figure 15. Variations of Stokes settling velocity and relative density of a single Pickering oil droplet with contact angle (SNPCO-OW Pickering emulsion). The solid curves represent square packing and the dashed curves represent hexagonal packing of nanoparticles at the oil-water interface.
For the PSNPMO-OW Pickering emulsion (Figure 14), the Stokes rise velocity of a Pickering oil droplet increases initially with the increase in contact angle, reaches a maximum value, and then falls off with further increase in the contact angle. The relative density of a single composite droplet shows the opposite behavior in that the density initially decreases, reaches a minimum, and then rises with further increase in the contact angle. With the increase in contact angle initially from a value of zero, the mass of the attached high-density matrix fluid to the droplet is decreased as the matrix fluid is displaced with the increase in contact angle. Consequently the density of the composite droplet decreases and there occurs a corresponding increase in the Stokes rise velocity due to an increase in the density difference between the composite droplet and matrix fluid. However, with further increase in the contact angle, the amount of the matrix fluid displaced is little but the effective radius of the composite droplet becomes smaller and smaller resulting in an increase in the effective density of a composite droplet and the corresponding decrease in the Stokes velocity. Upon increasing the packing density of nanoparticles from square packing to hexagonal packing, the relative density curve of Pickering oil droplet shifts upward to higher densities, as expected. The Stokes rise velocity curve shows the opposite behavior in that it shifts to lower velocities due to decrease in the density difference between the Pickering oil droplet and matrix fluid.
For the SNPCO-OW Pickering emulsion (Figure 15), the composite oil droplets are no longer able to cream or rise in the matrix fluid as the effective density of the Pickering oil droplets exceeds the density of the matrix fluid. Note that the oil density (𝜌 = 960 kg/m3) is now close to that of the matrix fluid density (𝜌 = 997 kg/m3) and that the silica nanoparticles have a high density (𝜌 =2650 kg/m3). The relative density and Stokes settling velocity of Pickering oil droplet increase with the increase in the contact angle. The relative density increases with the increase in the contact angle due to a decrease in the effective radius of the composite droplet. The Stokes settling velocity increases due to an increase in the density difference between the composite droplet and matrix fluid. With the increase in the packing density of nanoparticles from square packing to hexagonal packing, the relative density curve of Pickering oil droplet shifts upward to higher densities, as expected. The Stokes settling velocity curve also shifts upward to higher velocities due to an increase in the density difference between the Pickering oil droplet and matrix fluid.
Figure 15. Variations of Stokes settling velocity and relative density of a single Pickering oil dropletwith contact angle (SNPCO-OW Pickering emulsion). The solid curves represent square packing andthe dashed curves represent hexagonal packing of nanoparticles at the oil-water interface.

Fluids 2019, 4, 186 16 of 22
For the PSNPMO-OW Pickering emulsion (Figure 14), the Stokes rise velocity of a Pickering oildroplet increases initially with the increase in contact angle, reaches a maximum value, and thenfalls off with further increase in the contact angle. The relative density of a single composite dropletshows the opposite behavior in that the density initially decreases, reaches a minimum, and then riseswith further increase in the contact angle. With the increase in contact angle initially from a value ofzero, the mass of the attached high-density matrix fluid to the droplet is decreased as the matrix fluidis displaced with the increase in contact angle. Consequently the density of the composite dropletdecreases and there occurs a corresponding increase in the Stokes rise velocity due to an increasein the density difference between the composite droplet and matrix fluid. However, with furtherincrease in the contact angle, the amount of the matrix fluid displaced is little but the effective radius ofthe composite droplet becomes smaller and smaller resulting in an increase in the effective densityof a composite droplet and the corresponding decrease in the Stokes velocity. Upon increasing thepacking density of nanoparticles from square packing to hexagonal packing, the relative density curveof Pickering oil droplet shifts upward to higher densities, as expected. The Stokes rise velocity curveshows the opposite behavior in that it shifts to lower velocities due to decrease in the density differencebetween the Pickering oil droplet and matrix fluid.
For the SNPCO-OW Pickering emulsion (Figure 15), the composite oil droplets are no longer ableto cream or rise in the matrix fluid as the effective density of the Pickering oil droplets exceeds thedensity of the matrix fluid. Note that the oil density (ρo = 960 kg/m3) is now close to that of the matrixfluid density (ρw = 997 kg/m3) and that the silica nanoparticles have a high density (ρnp = 2650kg/m3). The relative density and Stokes settling velocity of Pickering oil droplet increase with theincrease in the contact angle. The relative density increases with the increase in the contact angle dueto a decrease in the effective radius of the composite droplet. The Stokes settling velocity increasesdue to an increase in the density difference between the composite droplet and matrix fluid. Withthe increase in the packing density of nanoparticles from square packing to hexagonal packing, therelative density curve of Pickering oil droplet shifts upward to higher densities, as expected. TheStokes settling velocity curve also shifts upward to higher velocities due to an increase in the densitydifference between the Pickering oil droplet and matrix fluid.
4.3. Water-in-oil (W/O) Emulsions
For water-in-oil (W/O) emulsions, the thickness of the interfacial layer of nanoparticles protrudinginto the matrix fluid (oil) is given as follows [10]:
h = Rnp(1− cosθ) (47)
where θ is the three-phase contact angle measured through the aqueous phase. The radius R∗ can beexpressed as:
R∗ = Rd + h−Rnp = Rd
(1−
Rnp
Rdcosθ
)(48)
The mass of nanoparticles present on the surface of a single water droplet can be calculated fromEquation (43). The mass of the matrix fluid attached to the interfacial layer of nanoparticles is as follows:
mmatrix− f luid−immobilized = N[4R2
nph− (π/3)h2(3Rnp − h
)]ρo (49)
Thus the effective density of a water droplet of Pickering W/O emulsion can be expressed as:
ρd,e f f =(mbare−droplet + mnanoparticles + mmatrix− f luid−immobilized
)/(4πR3
e f f /3)
(50)
where Re f f is the effective radius of the composite droplet (Re f f = Rd + h) and mbare−droplet is the mass
of the bare water droplet given as(4πR3
d/3)ρw where ρw is the water density.

Fluids 2019, 4, 186 17 of 22
Using the effective density of a droplet given by Equation (50), the sedimentation or settlingvelocity of a single Pickering water droplet suspended in oil matrix can now be calculated from thefollowing modified Stokes law:
U0 =2gR2
e f f
(ρd,e f f − ρo
)9µ
(51)
Figures 16 and 17 show the simulation results for two model Pickering W/O emulsions:PSNPMO-WO and SNPCO-WO, respectively. PSNPMO-WO refers to Pickering W/O emulsionconsisting of polystyrene nanoparticles (PSNP) and mineral oil (MO) matrix. SNPCO-WO refers toPickering W/O emulsion consisting of silica nanoparticles (SNP) and castor oil (CO) matrix. The valuesof the parameters are the same as given earlier for the model Pickering O/W emulsions (PSNPMO-OWand SNPCO-OW) except for the matrix fluid viscosity µ. For the PSNPMO-WO Pickering emulsion,the viscosity of the matrix fluid (mineral oil) is 2.5 mPa.s and for the SNPCO-WO Pickering emulsion,the viscosity of the matrix fluid (castor oil) is 650 mPa.s. The Stokes settling velocity Uo and relativedensity ρd,e f f /ρw of a single Pickering water droplet are plotted as functions of contact angle. Thesolid curves are generated using β = 0.785 (square packing of nanoparticles at the interface) and thedashed curves are generated using β = 0.907 (hexagonal packing of nanoparticles at the interface).
For both PSNPMO-WO and SNPCO-WO Pickering W/O emulsions, the effective density of thecomposite water droplet decreases with the increase in the contact angle from 90◦ to 180◦ due to anincrease in the effective radius of the composite droplet. The Stokes settling velocity of a Pickeringwater droplet decreases with the increase in contact angle due to a decrease in the density differencebetween the composite droplet and matrix fluid. Upon increasing the packing density of nanoparticlesfrom square packing to hexagonal packing, the relative density curve of Pickering water dropletshifts upward to higher densities, as expected. The Stokes settling velocity curve also shifts to highervelocities due to an increase in the density difference between the Pickering water droplet and matrixfluid (oil).Fluids 2019, 4, x FOR PEER REVIEW 18 of 23
Figure 16. Variations of Stokes settling velocity and relative density of a single Pickering water droplet with contact angle (PSNPMO-WO Pickering emulsion). The solid curves represent square packing and the dashed curves represent hexagonal packing of nanoparticles at the oil-water interface.
Figure 17. Variations of Stokes settling velocity and relative density of a single Pickering water droplet with contact angle (SNPCO-WO Pickering emulsion). The solid curves represent square packing and the dashed curves represent hexagonal packing of nanoparticles at the oil-water interface.
For both PSNPMO-WO and SNPCO-WO Pickering W/O emulsions, the effective density of the composite water droplet decreases with the increase in the contact angle from 90° to 180° due to an increase in the effective radius of the composite droplet. The Stokes settling velocity of a Pickering water droplet decreases with the increase in contact angle due to a decrease in the density difference between the composite droplet and matrix fluid. Upon increasing the packing density of nanoparticles from square packing to hexagonal packing, the relative density curve of Pickering water droplet shifts upward to higher densities, as expected. The Stokes settling velocity curve also
Figure 16. Variations of Stokes settling velocity and relative density of a single Pickering water dropletwith contact angle (PSNPMO-WO Pickering emulsion). The solid curves represent square packing andthe dashed curves represent hexagonal packing of nanoparticles at the oil-water interface.

Fluids 2019, 4, 186 18 of 22
Fluids 2019, 4, x FOR PEER REVIEW 18 of 23
Figure 16. Variations of Stokes settling velocity and relative density of a single Pickering water droplet with contact angle (PSNPMO-WO Pickering emulsion). The solid curves represent square packing and the dashed curves represent hexagonal packing of nanoparticles at the oil-water interface.
Figure 17. Variations of Stokes settling velocity and relative density of a single Pickering water droplet with contact angle (SNPCO-WO Pickering emulsion). The solid curves represent square packing and the dashed curves represent hexagonal packing of nanoparticles at the oil-water interface.
For both PSNPMO-WO and SNPCO-WO Pickering W/O emulsions, the effective density of the composite water droplet decreases with the increase in the contact angle from 90° to 180° due to an increase in the effective radius of the composite droplet. The Stokes settling velocity of a Pickering water droplet decreases with the increase in contact angle due to a decrease in the density difference between the composite droplet and matrix fluid. Upon increasing the packing density of nanoparticles from square packing to hexagonal packing, the relative density curve of Pickering water droplet shifts upward to higher densities, as expected. The Stokes settling velocity curve also
Figure 17. Variations of Stokes settling velocity and relative density of a single Pickering water dropletwith contact angle (SNPCO-WO Pickering emulsion). The solid curves represent square packing andthe dashed curves represent hexagonal packing of nanoparticles at the oil-water interface.
4.4. Drift Flux of Emulsions
As noted in Section 3.2, the normalized drift velocity UDrift,N and the normalized drift flux Jdrift,Nfor emulsions over a broad range of droplet concentration can be expressed as:
UDrift,N = (1−φeff)4.65 (52)
Jdrift,N = φeff (1−φeff)4.65 (53)
where the effective volume fraction of Pickering droplets φeff is given as:
φeff = φ
[1 +
hRd
]3
(54)
The thickness h of the interfacial layer of nanoparticles protruding into the matrix fluid is given byEquation (40) for O/W emulsions and Equation (47) for W/O emulsions.
Figure 18 shows the plots of normalized drift flux Jdrift,N versus φ for concentrated oil-in-water(O/W) emulsions for different values of contact angle. With the increase in contact angle, the normalizeddrift flux at high volume fractions of oil droplets increases due to a decrease in the effective volumefraction of the composite oil droplets.
Figure 19 shows the plots of normalized drift flux Jdrift,N versus φ for concentrated water-in-oil(W/O) emulsions for different values of contact angle. With the increase in contact angle from 90o to150◦, the normalized drift flux at high volume fractions of water droplets decreases due to an increasein the effective volume fraction of the composite water droplets.

Fluids 2019, 4, 186 19 of 22
Fluids 2019, 4, x FOR PEER REVIEW 19 of 23
shifts to higher velocities due to an increase in the density difference between the Pickering water droplet and matrix fluid (oil).
4.4. Drift Flux of Emulsions
As noted in Section 3.2, the normalized drift velocity U , and the normalized drift flux J , for emulsions over a broad range of droplet concentration can be expressed as: UDrift,N = (1 − 𝜙eff)4.65 (52) Jdrift,N = 𝜙eff (1 − 𝜙eff)4.65 (53)
where the effective volume fraction of Pickering droplets 𝜙 is given as:
𝜙eff = 𝜙 1 + ℎRd3 (54)
The thickness ℎ of the interfacial layer of nanoparticles protruding into the matrix fluid is given by Equation (40) for O/W emulsions and Equation (47) for W/O emulsions.
Figure 18 shows the plots of normalized drift flux J , versus 𝜙 for concentrated oil-in-water (O/W) emulsions for different values of contact angle. With the increase in contact angle, the normalized drift flux at high volume fractions of oil droplets increases due to a decrease in the effective volume fraction of the composite oil droplets.
Figure 19 shows the plots of normalized drift flux J , versus 𝜙 for concentrated water-in-oil (W/O) emulsions for different values of contact angle. With the increase in contact angle from 90o to 150°, the normalized drift flux at high volume fractions of water droplets decreases due to an increase in the effective volume fraction of the composite water droplets.
Figure 18. Effect of contact angle on normalized drift flux of Pickering O/W emulsions. Figure 18. Effect of contact angle on normalized drift flux of Pickering O/W emulsions.Fluids 2019, 4, x FOR PEER REVIEW 20 of 23
Figure 19. Effect of contact angle on normalized drift flux of Pickering W/O emulsions.
5. Conclusions
The creaming/settling behaviors of single droplet/particle and swarm of droplets/particles are reviewed briefly. The available experimental data on hindered creaming/settling of conventional emulsions and suspensions are interpreted in terms of a drift flux theory. The drift flux model describes the experimental data of creaming and sedimentation in conventional emulsions and suspensions adequately over a broad range of particle and droplet sizes provided that solvation of droplets/particles is taken into account. The unhindered and hindered creaming/settling behaviors of nanoparticle-stabilized Pickering emulsions are modelled. According to the proposed model, the key factors affecting the sedimentation and creaming of droplets in Pickering emulsions are: bare droplet size, size of nanoparticles, three-phase contact angle of the nanoparticles, and packing density of nanoparticles at the oil-water interface. The simulation results generated from the proposed model are presented and discussed. Experimental studies dealing with creaming/settling of single Pickering droplets and Pickering emulsions are lacking.
Funding: This research received no external funding.
Conflicts of Interest: The author declares no conflict of interest.
Notation
A parameter in Equation (13)
𝐴 projected area of particle
B parameter in Equation (13)
𝐶 drag coefficient
𝐷 diameter of particle
𝐹 buoyance force on the particle
𝐹 drag force on the particle
𝐹 gravity force (weight) on the particle
𝐹 net force on the particle
g acceleration due to gravity
Figure 19. Effect of contact angle on normalized drift flux of Pickering W/O emulsions.
5. Conclusions
The creaming/settling behaviors of single droplet/particle and swarm of droplets/particles arereviewed briefly. The available experimental data on hindered creaming/settling of conventionalemulsions and suspensions are interpreted in terms of a drift flux theory. The drift flux modeldescribes the experimental data of creaming and sedimentation in conventional emulsions andsuspensions adequately over a broad range of particle and droplet sizes provided that solvation ofdroplets/particles is taken into account. The unhindered and hindered creaming/settling behaviorsof nanoparticle-stabilized Pickering emulsions are modelled. According to the proposed model, thekey factors affecting the sedimentation and creaming of droplets in Pickering emulsions are: baredroplet size, size of nanoparticles, three-phase contact angle of the nanoparticles, and packing densityof nanoparticles at the oil-water interface. The simulation results generated from the proposed model

Fluids 2019, 4, 186 20 of 22
are presented and discussed. Experimental studies dealing with creaming/settling of single Pickeringdroplets and Pickering emulsions are lacking.
Funding: This research received no external funding.
Conflicts of Interest: The author declares no conflict of interest.
Notation
A parameter in Equation (13)Ap projected area of particleB parameter in Equation (13)CD drag coefficientDp diameter of particleFB buoyance force on the particleFD drag force on the particleFG gravity force (weight) on the particleFnet net force on the particleg acceleration due to gravityh thickness of interfacial layer of nanoparticles protruding into the matrix fluidJl volumetric flux of liquid phase (units of velocity)Jp volumetric flux of particles (units of velocity)Jpm drift flux of particles (units of velocity)Jdri f t,N normalized drift flux of particlesks solvation coefficientm massn exponent in Richarson and Zaki correlation, Equation (12)N number of nanoparticles loaded on the Pickering dropletO/W oil-in-waterR radius of particleRd radius of core (bare) dropletRe f f effective radius of composite (Pickering) dropletRnp radius of nanoparticlesR∗ radius of spherical surface passing through the equator of nanoparticles (see Figure 10)Rep particle Reynolds numbert timeU velocityUDri f t,N normalized drift velocity of particleUl liquid phase velocityUm mixture (suspension) velocityU0 unhindered terminal velocity of particleUp settling velocity of particle in suspension (hindered settling)Upm drift velocity of particleUR dimensionless velocity defined in Equation (14)Us slip velocity between particle and matrix fluidW/O water-in-oilα coefficient in Equation (11)β packing density of nanoparticles at the oil-water interfaceδ thickness of solvation layerε volume fraction of fluid in a suspensionφ actual volume fraction of particles/dropletsφe f f effective volume fraction of particles/dropletsµ viscosity of matrix fluidρ density of matrix fluidρd,e f f effective density of composite (Pickering) dropletρnp density of nanoparticleρo density of oil

Fluids 2019, 4, 186 21 of 22
ρp density of particleρw density of waterθ contact angle
References
1. Pal, R. Rheology of Particulate Dispersions and Composites; CRC Press: Boca Raton, FL, USA, 2007.2. Wu, J.; Ma, G.H. Recent studies of Pickering emulsions: Particles make the difference. Small 2006, 12,
4633–4648. [CrossRef] [PubMed]3. Yang, Y.; Fang, Z.; Chen, X.; Zhang, W.; Xie, Y.; Chen, Y.; Liu, Z.; Yuan, W. An overview of Pickering
emulsions: Solid-particle materials, classification, morphology, and applications. Front. Pharmacol. 2017, 3,287. [CrossRef] [PubMed]
4. Berton-Carabin, C.C.; Schroen, K. Pickering emulsions for food applications: Background, trends, andchallenges. Ann. Rev. Food Sci. Technol. 2015, 6, 263–297. [CrossRef] [PubMed]
5. Chevalier, Y.; Bolzinger, M.A. Emulsions stabilized with solid nanoparticles: Pickering emulsions. ColloidsSurf. 2013, 439, 23–34. [CrossRef]
6. Dickinson, E. Use of nanoparticles and microparticles in the formation and stabilization of food emulsions.Trends Food Sci. Technol. 2012, 24, 4–12. [CrossRef]
7. Dickinson, E. Food emulsions and foams: Stabilization by particles. Curr. Opin. Colloid Interface Sci. 2010, 15,40–49. [CrossRef]
8. Binks, B.P. Colloidal particles at a range of fluid-fluid interfaces. Langmuir 2017, 33, 6947–6963. [CrossRef]9. Tarimala, S.; Wu, C.Y.; Dai, L.L. Pickering emulsions—A paradigm shift. In Proceedings of the AIChE Annual
Meeting Conference Proceedings 2005, Cincinnati, OH, USA, 30 October–4 November 2005.10. Pal, R. A simple model for the viscosity of Pickering emulsions. Fluids 2018, 3, 2. [CrossRef]11. Bains, U.; Pal, R. In-situ continuous monitoring of the viscosity of surfactant-stabilized and
nanoparticles-stabilized Pickering emulsions. Appl. Sci. 2019, 9, 4044. [CrossRef]12. Rozynek, Z.; Bielas, R.; Jozefczak, A. Efficient formation of oil-in-oil Pickering emulsions with narrow size
distributions by using electric fields. Soft Matter 2018, 14, 5140–5149. [CrossRef]13. Timgren, A.; Rayner, M.; Dejmek, P.; Marku, D.; Sjoo, M. Emulsion stabilizing capacity of intact starch
granules modified by heat treatment or octenyl succinic anhydride. Food Sci. Nutr. 2013, 1, 157–171.[CrossRef] [PubMed]
14. Zoppe, J.O.; Venditti, R.A.; Rojas, O.J. Pickering emulsions stabilized by cellulose nanocrystals grafted withthermos-responsive polymer brushes. J. Colloid Interface Sci. 2012, 369, 202–209. [CrossRef] [PubMed]
15. Chen, X.; Song, X.; Huang, J.; Wu, C.; Ma, D.; Tian, M.; Jiang, H.; Huang, P. Phase behavior of Pickeringemulsions stabilized by graphene oxide sheets and resins. Energy Fuels 2017, 31, 13439–13447. [CrossRef]
16. Binks, B.P.; Fletcher, P.D.I.; Holt, B.L.; Beaussoubre, P. Phase inversion of particle-stabilized perfume oil-wateremulsions: Experiment and theory. Phys. Chem. Chem. Phys. 2010, 12, 11954–11966. [CrossRef] [PubMed]
17. Fournier, C.O.; Fradette, L.; Tanguy, P.A. Effect of dispersed phase viscosity on solid-stabilized emulsions.Chem. Eng. Res. Des. 2009, 87, 499–506. [CrossRef]
18. Tsabet, E.; Fradette, L. Effect of the properties of oil, particles, and water on the production of Pickeringemulsions. Chem. Eng. Res. Des. 2015, 97, 9–17. [CrossRef]
19. Simon, S.; Theiler, S.; Knudsen, A.; Oye, G.; Sjoblom, J. Rheological properties of particle-stabilized emulsions.J. Dispers. Sci. Technol. 2010, 31, 632–640. [CrossRef]
20. Li, C.; Liu, Q.; Mei, Z.; Wang, J.; Xu, J.; Sun, D. Pickering emulsions stabilized by paraffin wax and laponiteclay particles. J. Colloid Interface Sci. 2009, 336, 314–321. [CrossRef]
21. Leclercq, L.; Nardello-Rataj, V. Pickering emulsions based on cyclodextrinx: A smart solution for antifungalazole derivatives topical delivery. Eup. J. Pharm. Sci. 2016, 82, 126–137. [CrossRef]
22. Crossley, S.; Faria, J.; Shen, M.; Resasco, D.E. Solid nanoparticles that catalyze biofuel upgrade reactions atthe water/oil interface. Science 2010, 327, 68–72. [CrossRef]
23. Yang, B.; Leclercq, L.; Clacens, J.M.; Nardello-Rataj, V. Acidic/amphiphilic silica nanoparticles: Neweco-friendly Pickering interfacial catalysis for biodiesel production. Green Chem. 2017, 19, 4552–4562.[CrossRef]

Fluids 2019, 4, 186 22 of 22
24. Pera-Titus, M.; Leclercq, L.; Clacens, J.M.; De Campo, F.; Nardello-Rataj, V. Pickering interfacial catalysisfor biphasic systems: From emulsion design to green reactions. Angew. Chem. Int. Ed. 2015, 54, 2006–2021.[CrossRef]
25. Leclercq, L.; Company, R.; Muhlbauer, A.; Mouret, A.; Aubry, J.M.; Nardello-Rataj, V. Versatile eco-friendlyPickering emulsions based on substrate/native cyclodextrin complexes: A winning approach for solvent-freeoxidations. ChemSusChem 2013, 6, 1533–1540. [CrossRef] [PubMed]
26. Leclercq, L.; Mouret, A.; Proust, A.; Schmitt, V.; Bauduin, P.; Aubry, J.M.; Nardello-Rataj, V. Pickeringemulsions stabilized by catalytic polyoxometalate nanoparticles: A new effective medium for oxidationreactions. Chem. Eur. J. 2012, 18, 14352–14358. [CrossRef] [PubMed]
27. Kaptay, G. On the equation of the maximum capillary pressure induced by solid particles to stabilizeemulsions and foams and on the emulsion stability diagrams. Colloids Surf. A 2006, 282/283, 387–401.[CrossRef]
28. Katepalli, H.; John, V.T.; Tripathi, A.; Bose, A. Microstructure and rheology of particle stabilized emulsions:Effects of particle shape and inter-particle interactions. J. Colloid Interface Sci. 2017, 485, 11–17. [CrossRef]
29. Braisch, B.; Kohler, K.; Schuchmann, H.P.; Wolf, B. Preparation and flow behavior of oil-in-water emulsionsstabilized by hydrophilic silica particles. Chem. Eng. Technol. 2009, 32, 1107–1112. [CrossRef]
30. Ganley, W.J.; Van Duijneveldt, J.S. Controlling the rheology of montmorillonite stabilized oil-in-wateremulsions. Langmuir 2017, 33, 1679–1686. [CrossRef]
31. Hermes, M.; Clegg, P.S. Yielding and flow of concentrated Pickering emulsions. Soft Matter 2013, 9, 7568–7575.[CrossRef]
32. Ogunlaja, S.B.; Pal, R.; Sarikhani, K. Effects of starch nanoparticles on phase inversion of Pickering emulsions.Can. J. Chem. Eng. 2018, 96, 1089–1097. [CrossRef]
33. Malhotra, V.; Pal, R.; Alhassan, S. Catastrophic phase inversion of emulsions stabilized by amphiphilicnanoparticles. J. Nanofluids 2018, 7, 30–36. [CrossRef]
34. Pal, R.; Malhotra, V. Influence of hybrid nanoparticle-surfactant stabilizers on catastrophic phase inversionof emulsions. J. Nanofluids 2018, 7, 300–308. [CrossRef]
35. Sihler, S.; Schrade, A.; Cao, Z.; Ziener, U. Inverse Pickering Emulsions with Droplet Sizes below 500 nm.Langmuir 2015, 31, 10392–10401. [CrossRef] [PubMed]
36. Becher, P. Emulsions: Theory and Practice; Reinhold Publishing Corp: New York, NY, USA, 1957.37. Robins, M.M. Emulsions-creaming phenomena. Curr. Opin. Colloid Interface Sci. 2000, 5, 265–272. [CrossRef]38. Becher, P. (Ed.) Encyclopedia of Emulsion Technology: Basic Theory; Marcel Dekker: New York, NY, USA, 1983.39. Batchelor, G.K. Sedimentation in a dilute dispersion of spheres. J. Fluid Mech. 1972, 52, 245–268. [CrossRef]40. Richardson, J.F.; Zaki, W.N. Sedimentation and fluidization. Trans. Inst. Chem. Eng. 1954, 32, 35–53.41. Garside, J.; Al-Dibouni, M.R. Velocity-voidage relationships for fluidization and sedimentation in solid-liquid
systems. Ind. Eng. Chem. Process Des. Dev. 1977, 16, 206–214. [CrossRef]42. Al-Naafa, M.A.; Sami Selim, M. Sedimentation of monodisperse and bidisperse hard-sphere colloidal
suspensions. AIChE J. 1992, 38, 1618–1630. [CrossRef]43. Chanamai, R.; McClements, D.J. Dependence of creaming and rheology of monodisperse oil-in-water
emulsions on droplet size and concentration. Coll. Surf. A Physicochem. Eng. Asp. 2000, 172, 79–86.[CrossRef]
44. Nicolai, H.; Herzhaft, B.; Hinch, E.J.; Oger, L.; Guazzelli, E. Particle velocity fluctuations and hydrodynamicself-diffusion of sedimenting non-Brownian spheres. Phys. Fluids 1995, 7, 12–23. [CrossRef]
45. Buscall, R.; Goodwin, J.W.; Ottewill, R.H.; Tadros, T.F. The settling of particles through Newtonian andnon-Newtonian media. J. Colloid Interface Sci. 1982, 85, 78–86. [CrossRef]
46. Davis, R.H.; Birdsell, K.H. Hindered settling of semidilute monodisperse and polydisperse suspensions.AIChE J. 1988, 34, 123–129. [CrossRef]
47. Davis, K.E.; Russel, W.B.; Glantschnig, W.J. Settling suspensions of colloidal silica: Observations and x-raymeasurements. J. Chem. Soc. Faraday Trans. 1991, 87, 411–424. [CrossRef]
© 2019 by the author. Licensee MDPI, Basel, Switzerland. This article is an open accessarticle distributed under the terms and conditions of the Creative Commons Attribution(CC BY) license (http://creativecommons.org/licenses/by/4.0/).