Crust formation in drying colloidal suspensions
21
doi: 10.1098/rspa.2010.0039 published online 30 June 2010 Proc. R. Soc. A Robert W. Style and Stephen S. L. Peppin Crust formation in drying colloidal suspensions References pa.2010.0039.full.html#ref-list-1 http://rspa.royalsocietypublishing.org/content/early/2010/06/24/rs This article cites 22 articles P<P Published online 30 June 2010 in advance of the print journal. Subject collections (255 articles) applied mathematics Articles on similar topics can be found in the following collections Email alerting service here the box at the top right-hand corner of the article or click Receive free email alerts when new articles cite this article - sign up in articles must include the digital object identifier (DOIs) and date of initial publication. priority; they are indexed by PubMed from initial publication. Citations to Advance online prior to final publication). Advance online articles are citable and establish publication yet appeared in the paper journal (edited, typeset versions may be posted when available Advance online articles have been peer reviewed and accepted for publication but have not http://rspa.royalsocietypublishing.org/subscriptions go to: Proc. R. Soc. A To subscribe to This journal is © 2010 The Royal Society on November 11, 2010 rspa.royalsocietypublishing.org Downloaded from
-
Upload
independent -
Category
Documents
-
view
1 -
download
0
Transcript of Crust formation in drying colloidal suspensions
doi: 10.1098/rspa.2010.0039 published online 30 June 2010Proc. R. Soc. A
Robert W. Style and Stephen S. L. Peppin Crust formation in drying colloidal suspensions
Referencespa.2010.0039.full.html#ref-list-1http://rspa.royalsocietypublishing.org/content/early/2010/06/24/rs
This article cites 22 articles
P<P Published online 30 June 2010 in advance of the print journal.
Subject collections (255 articles)applied mathematics �
Articles on similar topics can be found in the following collections
Email alerting service herethe box at the top right-hand corner of the article or click Receive free email alerts when new articles cite this article - sign up in
articles must include the digital object identifier (DOIs) and date of initial publication. priority; they are indexed by PubMed from initial publication. Citations to Advance online prior to final publication). Advance online articles are citable and establish publicationyet appeared in the paper journal (edited, typeset versions may be posted when available Advance online articles have been peer reviewed and accepted for publication but have not
http://rspa.royalsocietypublishing.org/subscriptions go to: Proc. R. Soc. ATo subscribe to
This journal is © 2010 The Royal Society
on November 11, 2010rspa.royalsocietypublishing.orgDownloaded from

on November 11, 2010rspa.royalsocietypublishing.orgDownloaded from
Proc. R. Soc. Adoi:10.1098/rspa.2010.0039
Published online
Crust formation in drying colloidal suspensionsBY ROBERT W. STYLE* AND STEPHEN S. L. PEPPIN
Oxford Centre for Collaborative Applied Mathematics, University of Oxford,Mathematical Institute, 24-29 St Giles’, Oxford OX1 3LB, UK
During the drying of colloidal suspensions, the desiccation process causes the suspensionnear the air interface to consolidate into a connected porous matrix or crust. Fluidtransport in the porous medium is governed by Darcy’s law and the equations ofporoelasticity, while the equations of colloid physics govern processes in the suspension.We derive new equations describing this process, including unique boundary conditionscoupling the two regions, yielding a moving-boundary model of the concentration andstress profiles during drying. A solution is found for the steady-state growth of a one-dimensional crust during constant evaporation rate from the surface. The solution is usedto demonstrate the importance of the system boundary conditions on stress profiles anddiffusivity in a drying crust.
Keywords: colloidal dispersions; drying; crust formation
1. Introduction
Crust formation during drying is an important phenomenon in many areas ofresearch such as soil science, the drying of colloidal suspensions and the foodsciences. Often, the crust characteristics can have controlling influence on thephysics of a drying dispersion. For example in a soil the small permeability of thecrust relative to the underlying wet soil means that the rate of drying of thesoil is controlled by the crust thickness, as will be the rate of penetration ofrainwater. Stress build ups in the crust can also lead to buckling or cracking ofthe crust (e.g. Brinker & Scherer 1990; Tsapis et al. 2005) and so crust formationis also of strong relevance to materials such as paints, concrete and ceramics,which are specifically designed to avoid cracking and the associated degradationof the material.
In this paper, we model a drying colloidal dispersion in which the solid particlesare initially stably dispersed in the liquid phase as a colloidal sol. As liquidevaporates from the sol the concentration of particles increases until the particlesgel into a saturated porous network at a critical concentration determined byinter-particle forces. In the sol phase, the concentration of solid particles canbe described by a diffusion equation with non-constant diffusivity as previouslyshown by Russel et al. (1989). In the gel phase, we show that the concentration
*Author for correspondence ([email protected]).
Received 26 January 2010Accepted 1 June 2010 This journal is © 2010 The Royal Society1

2 R. W. Style and S. S. L. Peppin
on November 11, 2010rspa.royalsocietypublishing.orgDownloaded from
of solid particles is described by a similar diffusion equation, but with amodified diffusivity that depends upon the boundary conditions of the problem.When the gel is unstressed during drying the resulting diffusion equation is similarto that used by Brown et al. (2002). However when the gel is constrained duringdrying, the diffusivity is modified and tensile stresses arise which are the source ofprimary, ‘craquelure’ type cracks (Bohn et al. 2005). We use the model to examinethe growth of a steadily thickening gel in the case of a constant evaporationrate from the drying surface, and this enables us to quantitatively examine thepressure, stress and solid phase profiles that arise during drying in both unstressedand constrained gels.
2. Governing equations in the colloidal system
We consider a sol consisting of hard-sphere particles with short-ranged attractiveforces (‘sticky spheres’) that undergo dense coagulation upon gelation (see table 1for a list of parameters relevant to the system). The sol is stable up to a solidphase fraction fc at which point it forms a gel of solid phase fraction fg. Gelationoccurs at a much faster rate than the drying process so the sol is treated asimmediately gelling once it has dried above the critical phase fraction fc. Owingto the short-ranged attractive interparticle forces and to the close-packed natureof the particles, we assume that the solid network behaves elastically under stressand does not compress irreversibly like a flocculated gel. An example of such asystem is given by adhesive hard spheres proposed by Baxter (1968), and studiedexperimentally by Buzzaccaro et al. (2007).
We consider a system consisting initially of a homogeneous, stable sol incontact with air. If the vapour pressure of the air is less than the saturationvapour pressure at the sol/air interface then evaporation occurs which increasesthe concentration of colloid particles near the surface of the sol while particlediffusion increases the concentration of particles in the bulk of the sol. Providedthe air is dry enough the concentration of particles at the interface eventuallyrises above the critical volume phase fraction fc, and a saturated gel ‘crust’forms at the surface of the sol. This is shown schematically in figure 1. Furtherdrying then causes thickening of the crust until finally air invades the pores ofthe gel. We consider the period before air invades the pores of the gel phase,so the gel is always saturated with liquid. This period is of interest as itcomprises the time during drying in which tensile stresses arise (which can beresponsible for cracking if sufficiently large). Stresses typically peak at the pointat which air invades the pores of the gel and then drop off as the gel desaturates(e.g. Martinez & Lewis 2002).
In both the gel and the sol we define f to be the local solid phase fraction andv1 and v2 to be the average velocities of the liquid and the particles relative tothe laboratory frame. The volume-averaged velocity is given by
v = (1 − f)v1 + fv2. (2.1)
We take the solid and liquid phases to be incompressible, so conservation ofvolume of the liquid in the suspension means that the water content of a small
Proc. R. Soc. A

Crusting in colloidal suspensions 3
on November 11, 2010rspa.royalsocietypublishing.orgDownloaded from
Table 1. Nomenclature. Subscripts s and g refer to sol and gel properties respectively.
A Kozeny constanta Biot–Willis coefficientb non-dimensional velocity of the sol–gel interfaceD, D diffusivity, non-dimensional diffusivityD0 kBT/6pmRDs entropy of fusion per particle on crystallizationE evaporation ratee strainh (1 − 2n)/2(1 − n)f dimensionless friction factorG shear modulusg liquid–air surface tensionh distance between sol–gel and gel–air interfacesf solid phase fractionfc, fg critical solid phase fraction in the sol/gelfcp close packing solid phase fractionf0 initial solid phase fraction in the solk permeabilityK bulk moduluskB Boltzmann’s constantl scaling factor for compressibility based on particle stickiness t
m dynamic viscosityn Poisson’s ratiop pore pressureP osmotic pressureP external pressurePa atmospheric pressurepi pore pressure at the sol–gel interfacePy yield stressR particle radiuss stresss effective stresst, t ′ time, non-dimensional timeT temperaturet particle stickiness parameteryp particle volumev1, v2 average velocity of the liquid/solid particlesv volume-averaged velocityz , z length, non-dimensional lengthZ compressibility factor
volume can only vary if water is advected into or out of the volume. Thisimplies that
v(1 − f)vt
+ V · [(1 − f)v1] = 0, (2.2)
while conservation of total volume implies that the total flux into or out of anyvolume must be zero, or equivalently
V · v = 0. (2.3)
Proc. R. Soc. A

4 R. W. Style and S. S. L. Peppin
on November 11, 2010rspa.royalsocietypublishing.orgDownloaded from
colloidaldispersion
gel
air
φ
φg
φc
φ0
Figure 1. Schematic showing the system to be analysed. A colloidal dispersion undergoes a phasetransformation into a gel at a critical phase fraction fc. At gelation, the solid particles aggregateinto a gel of phase fraction fg. Drying of the sol–gel system is driven by evaporation from thegel–air boundary or from the sol–air boundary before gel-formation.
(a) Equations in the gel phase
In the gel phase, flow of the liquid through the solid matrix is given byDarcy’s law
(1 − f)(v1 − v2) = −kg(f)m
Vp, (2.4)
where kg(f) is the permeability of the gel, m is the dynamic viscosity of theliquid and p is the pore pressure of the liquid phase. Then by use of equations(2.1), (2.3) and (2.4) in the equation for conservation of liquid volume (2.2)we find that
vf
vt+ v · Vf = −V ·
(kg(f)f
mVp
). (2.5)
Provided p = p(f) this means that the equation governing the evolution of thesolid phase fraction in the gel can be written as
vf
vt+ v · Vf = V · (D(f)Vf), (2.6)
where the gel diffusivity is given by
D(f) = Dg(f) = −kg(f)fm
vpvf
. (2.7)
Proc. R. Soc. A
Crusting in colloidal suspensions 5
on November 11, 2010rspa.royalsocietypublishing.orgDownloaded from
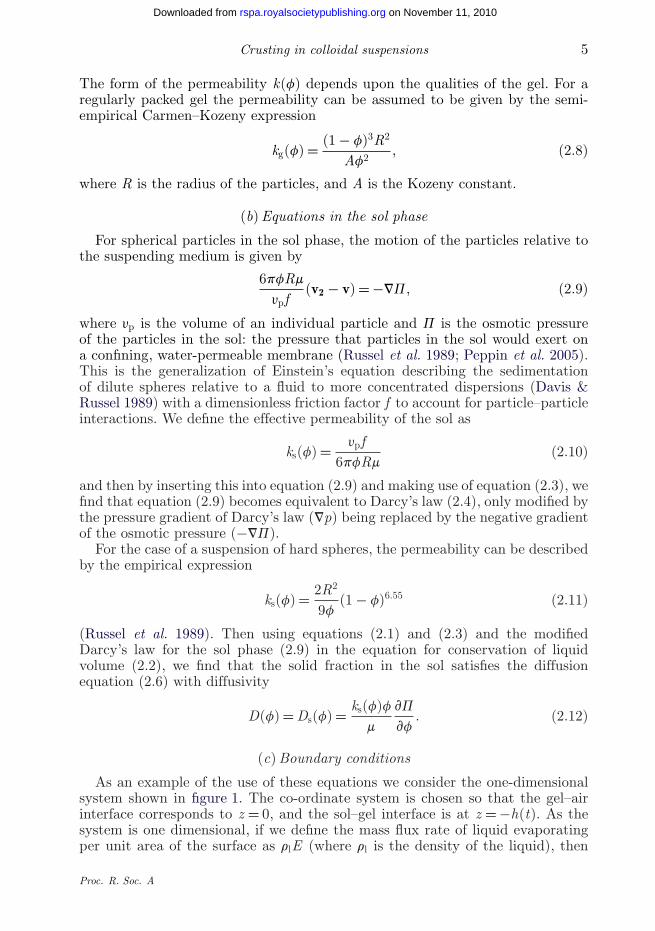
The form of the permeability k(f) depends upon the qualities of the gel. For aregularly packed gel the permeability can be assumed to be given by the semi-empirical Carmen–Kozeny expression
kg(f) = (1 − f)3R2
Af2, (2.8)
where R is the radius of the particles, and A is the Kozeny constant.
(b) Equations in the sol phase
For spherical particles in the sol phase, the motion of the particles relative tothe suspending medium is given by
6pfRm
ypf(v2 − v) = −VP, (2.9)
where yp is the volume of an individual particle and P is the osmotic pressureof the particles in the sol: the pressure that particles in the sol would exert ona confining, water-permeable membrane (Russel et al. 1989; Peppin et al. 2005).This is the generalization of Einstein’s equation describing the sedimentationof dilute spheres relative to a fluid to more concentrated dispersions (Davis &Russel 1989) with a dimensionless friction factor f to account for particle–particleinteractions. We define the effective permeability of the sol as
ks(f) = ypf6pfRm
(2.10)
and then by inserting this into equation (2.9) and making use of equation (2.3), wefind that equation (2.9) becomes equivalent to Darcy’s law (2.4), only modified bythe pressure gradient of Darcy’s law (Vp) being replaced by the negative gradientof the osmotic pressure (−VP).
For the case of a suspension of hard spheres, the permeability can be describedby the empirical expression
ks(f) = 2R2
9f(1 − f)6.55 (2.11)
(Russel et al. 1989). Then using equations (2.1) and (2.3) and the modifiedDarcy’s law for the sol phase (2.9) in the equation for conservation of liquidvolume (2.2), we find that the solid fraction in the sol satisfies the diffusionequation (2.6) with diffusivity
D(f) = Ds(f) = ks(f)fm
vP
vf. (2.12)
(c) Boundary conditions
As an example of the use of these equations we consider the one-dimensionalsystem shown in figure 1. The co-ordinate system is chosen so that the gel–airinterface corresponds to z = 0, and the sol–gel interface is at z = −h(t). As thesystem is one dimensional, if we define the mass flux rate of liquid evaporatingper unit area of the surface as rlE (where rl is the density of the liquid), then
Proc. R. Soc. A

6 R. W. Style and S. S. L. Peppin
on November 11, 2010rspa.royalsocietypublishing.orgDownloaded from
conservation of volume implies that u = Ez throughout the sol–gel system, wherez is the unit vector in the z direction. Also at the gel–air interface, conservationof solid implies that we must set v2 = 0 so
fE = Dg(f)vf
vz(0). (2.13)
At the sol–gel interface there is a phase change from the dispersed sol to theaggregated gel. Thus
f(−h)|s = fc (2.14)
andf(−h)|g = fg (2.15)
(subscripts g and s correspond to values in the gel phase and sol phase,respectively). Also at the sol–gel boundary conservation of solid gives thatf(v2 + h)|g = f(v2 + h)|s which becomes
(fg − fc)(E + h) = Dg(fg)vf
vz(−h)
∣∣∣∣g− Ds(fc)
vf
vz(−h)
∣∣∣∣s. (2.16)
Two further equations arising from matching chemical potentials of the solventand particle phases at the sol–gel interface will determine fc and fg and theseare discussed in the next section.
Finally, we consider a sol with a boundary far from the sol–gel interface so thatthe far-field boundary condition becomes
f(−∞) = f0, (2.17)
where f0 < fc is the initial concentration of the sol. This final boundary conditioncan be simply modified to a zero solid-particle flux condition for the case of animpermeable boundary bounding a finite sol.
Note that we have chosen to consider the system as isothermal. At theevaporating interface cooling will occur owing to the latent heat of evaporation,while a small amount of heat will be released as the sol crystalizes into a gel.However, we shall see that the colloidal diffusivity D is typically much smallerthan the thermal diffusivity of the system k ∼ O(10−7 m2 s−1), which means thatwe can neglect temperature variations across the film because heat diffuses awaymuch faster than the gelation process occurs (e.g. Style & Wettlaufer 2007).
3. Crust formation with an unstressed gel
Comparing the diffusivities of the solid phase fraction f in the gel and sol phasesgiven by equations (2.7) and (2.12), respectively, it can be seen that the keydifference is that the diffusivity in the sol phase is dependent upon the change inthe osmotic pressure with f, while the diffusivity in the gel phase is dependentupon the negative change in the pore pressure with f. From the definition of theosmotic pressure when the system is in equilibrium with an external pressure P,
P = P + p. (3.1)
Proc. R. Soc. A

Crusting in colloidal suspensions 7
on November 11, 2010rspa.royalsocietypublishing.orgDownloaded from
When the gel and sol are in equilibrium with the surrounding air, P inboth sol and gel becomes the atmospheric pressure, Pa, vp/vf = −vP/vfand the expressions for the diffusivities (2.7) and (2.12) become equivalent.However, we shall see later that this equivalence only holds under certainconditions. In particular, when the gel is constrained by rigid boundaries sothat anisotropic stresses on the gel are maintained, vp/vf �= −vP/vf. Therefore,the distinction between the form of the two diffusivities is an importantone to make.
We initially consider the unstressed system where the diffusivity expressions(2.7) and (2.12) are identical. In order to solve the system of equations we needto know the relationship between P and f. For a system of sticky hard spheresthe osmotic pressure is given by the expression
P(f) = fkBTyp
Z (f, t), (3.2)
(Russel et al. 1989), where kB is Boltzmann’s constant and T is the temperature,while Z (f, t) is the compressibility factor of the system which depends upon thesolid phase fraction and a ‘stickiness parameter’ t that represents the effect ofchanging the interparticle forces (Buzzaccaro et al. 2007). For a system of adhesivehard spheres the compressibility factor in the sol has been shown theoreticallyand experimentally to be given by
Zs(f, t) = 1 + f + f2 − f3
(1 − f)3+ Zadh(f, t) (3.3)
(Miller & Frenkel 2004; Buzzaccaro et al. 2007). The first term on the right-handside is the Carnahan–Starling equation for the compressibility factor of a hardsphere suspension, while the second term is due to short-ranged attractive forcesbetween the particles. For simplicity we choose Zadh(f, t) = 0 (weak adhesiveforces between the particles), although non-zero Zadh can readily be accountedfor by insertion in the following equations.
In the gel it has been shown experimentally that the compressibility factor iswell described by
Zg(f, t) = 3l(t)1 − f/fcp
, (3.4)
where l(t) is a scaling factor between 0 and 1 that reduces with increasing‘stickiness’ of the particles, and takes a value of 1 for a standard hard spherescolloidal crystal (Buzzaccaro et al. 2007). fcp is the close-packing fraction,and this can either refer to hexagonal close-packing fraction (fcp = p/3
√2)
or random close packing (fcp ≈ 0.64) depending upon the conditions underwhich the gel is formed. Typically, slow aggregation leads to hexagonalclose packing, while fast aggregation leads to random close packing. Here,we assume the drying rate is sufficiently slow that the gel is hexagonallyclose packed.
Proc. R. Soc. A

8 R. W. Style and S. S. L. Peppin
on November 11, 2010rspa.royalsocietypublishing.orgDownloaded from
(a) (b)
φ φ
ks(φ)
R2
kg(φ)
R2
kR2
DD0
φcp φcp
Ds(φ)
Dg(φ)
0.04
0.03
0.02
0.01
0.4 0.5 0.6 0.7 0.8
4
3
2
1
0.2 0.4 0.6 0.8
Figure 2. (a) Non-dimensional permeabilities in the sol/gel as functions of the solid phase fractionfrom equations (2.11) and (2.8). (b) Non-dimensional diffusivities in the sol/gel as functions of thesolid phase fraction from equations (3.5) and (3.6).
Inserting the above expressions for the osmotic pressures of the sol and thegel, along with the expressions for the permeabilities of the two phases (2.11)and (2.8), the diffusivities in each phase become
Dg(f) = 27D0l(t)2A
(1 − f)3
f
v
vf
(f
1 − f/fcp
)≡ DoDg(f) (3.5)
and
Ds(f) = D0(1 − f)6.55 v
vf
[f
(1 + f + f2 − f3
(1 − f)3
)]≡ DoDs(f), (3.6)
while the advection–diffusion equation (2.6) in one dimension is
vf
vt+ E
vf
vz= v
vz
(D(f)
vf
vz
), (3.7)
with D0 = kBT/6pmR.Figure 2 shows the non-dimensional permabilities and diffusivities given by
equations (2.8) and (2.11) and (3.5) and (3.6), respectively. The permeabilities,shown in figure 2a, have been non-dimensionalized with the particle radiussquared so it can be seen that typical permeabilities for a system of particles of10 nm particles are on the order of 10−18 m2. The diffusivities, shown in figure 2b,are non-dimensionalised with D0 ≈ 2.2 × 10⁻¹⁹/R. Therefore typical diffusivitiesfor 10 nm particles and f < 0.65 are on the order of 2.2×10⁻¹¹ m2 s−1.
The expressions for the osmotic pressure in the two different phases also allowus to determine fc and fg by equating solvent and particle chemical potentialsat the sol–gel interface. Then
fcZs(fc, t) = fgZg(fg, t) (3.8)
and
Zs(fc, t) +∫fc
f0
Zs(f, t)f
df = Ds(f0)kB
+ Zg(fg, t) +∫fg
f0
Zg(f, t)f
df, (3.9)
Proc. R. Soc. A

Crusting in colloidal suspensions 9
on November 11, 2010rspa.royalsocietypublishing.orgDownloaded from
where Ds(f0) is the entropy of fusion per particle upon crystallization at aconcentration f0 (e.g. Santore et al. 1990). These can be solved by choosing anarbitrary f0 and requiring fc → 0.494 and fg → 0.545 as t → ∞ in the hardsphere limit in order to determine Ds(f0) (these values have been observedexperimentally by Russel et al. 1989). The results show that fc and fg varyrelatively little for small amounts of ‘stickiness’ and so we take the valuesfc = 0.494 and fg = 0.545 in the following calculations.
(a) Steady-state growth of a gel crust
We consider the initial period of evaporation in which the evaporation rateper unit area of the drying surface is a constant E , and which persists up to the‘critical point’ at which the stiffness of the gel causes shrinkage to stop, and theliquid–air menisci penetrate into the interior of the gel causing the evaporationrate to fall (Brinker & Scherer 1990). We seek a steady-state solution where theinterface is moving at a constant rate and so we move the co-ordinate systemsuch that z = 0 corresponds to the sol–gel interface and the gel–air interface issituated at z = h(t). The advection–diffusion equation then becomes
vf
vt+ (E + h)
vf
vz= v
vz
(D(f)
vf
vz
), (3.10)
where a dot refers to a derivative with respect to time. We non-dimensionalizethe system by setting z = (D0/E)z, t ′ = (D0/E2)t, Dg(f) = D0Dg(f) and Ds(f) =D0Ds(f). Then by setting h = bE , the advection–diffusion equation becomes
vf
vt ′ + (1 + b)vf
vz= v
vz
(D(f)
vf
vz
), (3.11)
with D corresponding to the relevant non-dimensional diffusivity in the sol orgel phase.
In the gel phase f → fcp as the osmotic pressure increases due to the divergentnature of the compressibility factor (3.4). So assuming the sol–air boundary isfar from the sol–gel interface, we use the condition f(∞) = fcp in equation (2.13)(which takes the same form in the new co-ordinate system) to find that
Dg(f)vf
vz
∣∣∣∣∞ = fcp (3.12)
(we will prove that f(∞) = fcp is an appropriate boundary condition a posteriori).In the steady-state system, we let vf/vt ′ = 0 and then integrate equation (3.11)
once using equations (3.12) and (2.17) to find that
(1 + b)f − bfcp = Dg(f)vf
vz(3.13)
in the gel, while
(1 + b)(f − f0) = Ds(f)vf
vz(3.14)
Proc. R. Soc. A

10 R. W. Style and S. S. L. Peppin
on November 11, 2010rspa.royalsocietypublishing.orgDownloaded from
sol
gel
φEz
D0
φ0
φgφc
φcp4
2
00.1 0.2 0.3 0.4 0.5 0.6 0.7
–2
–4
Figure 3. Solid phase fraction profiles in the sol and gel near the sol–gel boundary (z = 0) for dryingof a densely packed gel at a constant evaporation rate.
Table 2. Typical values of parameters used in calculations for a system of adhesive hard spheresin water.
constant value
kB 1.38 × 10⁻²³ m2 kg s−2 K−1
T 3 × 10² Km 1 × 10⁻³ kg m−1 s−1
R 1 × 10⁻⁸ mfcp 0.74f0 0.2A 100g 7.2 × 10⁻² kg s−2
l(t) 1n 0.2E 10−6 m s−1
in the sol. Then, inserting these results into the boundary condition forconservation of mass at the sol–gel interface (2.16) (after non-dimensionalisationand transformation into the new co-ordinate system), we find that
b = f0
fcp − f0. (3.15)
Physically, this equation expresses conservation of mass across the system duringsteady gel growth, as it is the result of equating the amount of solid advectedtowards the sol–gel boundary per unit time in the far-field sol, E(1 + b)f0, to theamount of solid added to the gel per unit time, Ebfcp. For a typical system withfcp ≈ 0.74, and f0 = 0.2, the non-dimensional crust thickening rate is b ≈ 0.37 sothe gelation front will travel at 0.37 times the rate of evaporation, E .
We can solve these equations to give the solid phase fraction profile in the soland the gel, using typical values for a colloidal system as given in table 2. Theresults are shown in figure 3. It can be seen that in the gel f → fcp outside the
Proc. R. Soc. A

Crusting in colloidal suspensions 11
on November 11, 2010rspa.royalsocietypublishing.orgDownloaded from
boundary layer by the sol–gel interface, justifying our previous assumption thatf(∞) = fcp. In the sol, f decays across a boundary layer to the initial value solidphase fraction f0.
(b) Discussion
The results illustrated in figure 3 show that in the gel the solid phase fractionof the gel becomes close packed so that f = fcp outside of a boundary layer ofthickness O(d), where d = D0/E . Similarly in the sol the solid phase fractiondrops to the initial phase fraction f0 outside of a similar boundary layer ofthickness O(d). Colloidal particles are usually defined as being between 1 nmand 1 mm in radius, so using the values in table 2 we find that the boundarylayer thickness d lies between 0.2 mm for large micron-sized colloids and 220 mmfor small, nanometre-sized colloids. For many typical drying experiments (e.g.Dufresne et al. 2003) the thickness of the crust is on a scale of millimetres ratherthan micrometres and so this means that in a densely gelling colloidal system wecan treat the bulk of the crust and the sol as being at constant phase fractionfcp or f0 respectively. In particular, we note that for the larger, micron-sizedparticles the boundary layer thickness d is less than the radius of the particles sothat we can effectively treat the sol–gel interface as a sharp interface between aclose packed gel and a sol with phase fraction f0.
In this system, the boundary layer thicknesses are both O(D0/E) becauseboth diffusivities are of O(D0). Smaller diffusivities, which might occur dueto an increased particle stickiness, will result in thinner boundary layers. Onthe other hand, larger diffusivities, which can arise from including chargeson the particles, will result in thicker booundary layers. Such effects can beanalysed by substitution of appropriate expressions for Zs(f) and Zg(f) in theabove equations.
In addition to calculating the solid-fraction profile, we can obtain the porepressure profiles in the sol and the gel from the relations pg = −Pg(f) + Paand ps = −Ps(f) + Pa. These profiles are shown in figure 4a,b which showthe non-dimensional pore pressure p = (p − pi)yp/kBT in the gel and the sol,respectively. Here pi is the pressure at the sol–gel interface. It can be seen infigure 4a that outside of the boundary layer the pressure gradient in the gelasymptotes to a constant value. This can be seen from equation (2.5) by lettingf → fcp. Then
v
vz
(kg(fcp)fcp
m
vpvz
)= 0, (3.16)
and the gradient of p asymptotes to a constant value. Allowing f → fcp inequation (3.13), and by use of equations (2.7) and (2.8) we find that
vpvz
→ − mD0yp
kg(fcp)kBT= − 2Af2
cp
9(1 − fcp)3, (3.17)
outside the boundary layer in the gel. This asymptotic limit is shown as the dashedline in figure 4a and is in good agreement with the pore pressure for z > d. Fortypical parameter values from table 2 this implies that the pressure gradient isgiven by vp/vz = 1.04 × 10⁸ Pa m−1.
Proc. R. Soc. A

12 R. W. Style and S. S. L. Peppin
on November 11, 2010rspa.royalsocietypublishing.orgDownloaded from
Ez
D0
(p−pi)υp / kBT
(p−pi)υp / kBT(a) (b)
0
1
2
3
4
–5
–4
–3
–2
–1
0 1 2 3 4 5 6
–500–1000–1500–2000–2500
Figure 4. Pore pressure profiles in the sol and gel near the sol–gel boundary (z = 0) for dryingof a densely packed gel at a constant evaporation rate. (a) Continuous curve, pore pressure inthe gel. Dashed line, asymptotic limit for z 1. (b) Continuous curve, pore pressure in the sol.Dashed line, asymptotic limit for z � −1. Note the difference in horizontal scales between thetwo figures.
Figure 4b shows the pore pressure profile in the sol phase. In the sol outsideof the boundary layer the pressure asymptotes to a fixed value p−∞ whichcorresponds to the pore pressure in the bulk sol p−∞ = Pa − Ps(f0). The dashedline in the figure shows this limit which is in good agreement with the porepressure in the sol for z < −3d.
From comparing figure 4a,b it can be seen that the bulk of the pressure changein the system occurs in the gel phase in which the pressure can reach very largenegative values. The gel remains saturated until the pore pressure reaches thecapillary pressure p ≈ 2g/0.15R at which air invades the pores of the gel (e.g.Haines 1925). This capillary pressure represents the minimum pressure that isattainable in the gel, which non-dimensionally is
pmin = yp
kBT
(− 2g
0.15R+ Ps(fc)
)≈ − 2gyp
0.15RkBT. (3.18)
Using the parameter values from table 2 we find that pmin ≈ −9.7 × 10²⁰R2, andso it can be seen from figure 4a that for most colloids (with 1 nm ≤ R ≤ 1 mm), atthe point at which the pressure reaches its minimum the boundary layer thicknessis small relative to the thickness of the crust and so the pressure gradient isapproximately constant throughout the gel crust.
In the model we have assumed the evaporation rate is constant. This is justifiedby experiments on hard particles that show that the constant rate period (duringwhich E is approximately constant) persists up to the point of air invasion ofthe pores (Wedin et al. 2004). However, if E does change, these results suggestthat we can approximate the pressure distribution in the gel as a linear functionprovided the evaporation rate changes slowly.
Dufresne et al. (2006) conducted an experiment where a gel was allowed toform from evaporation of a colloidal silica sol. At a certain point evaporationwas halted by covering the evaporating surface of the gel, and the sol–gel
Proc. R. Soc. A

Crusting in colloidal suspensions 13
on November 11, 2010rspa.royalsocietypublishing.orgDownloaded from
interface was examined. It was noted that after evaporation ceased particles ina region of the first several 100 mm of the compact region of the sol–gel systemdiffused back into the sol, leaving a sharp interface. This is consistent with theboundary layer in the sol found in our model and with the two phase idea inour model of a gel phase bonded together by adhesive forces and a stable sol.However we note that the addition of chemical bonding and concentration-basedelectrostatic double layer forces in colloidal silica will presumably yield morecomplicated expressions for the osmotic pressures than those considered here(e.g. Bergna 2006).
(c) Flocculated gels
Although only densely coagulating gels have been considered so far, theequations presented here can also be extended to the consideration of looselyflocculating gels in the case of an unstressed gel. A commonly used model for thecompression of a loosely flocculated gel is that of Buscall & White (1987). In thismodel, for a gel initially of solid fraction f1, if the stress P = Pa − p on the solidpart of a gel becomes greater than the compressive yield stress Py(f1), where Pyis an increasing function of f, the solid phase fraction increases irreversibly ata specified rate until the compressive yield stress is such that P = Py(f) wheref > f1. In practice, this means that for slowly compressing gels the stress on thesolid structure of the gel is always given by P = Py(f) and this assumption haspreviously been shown to be appropriate and used by Brown et al. (2002) intheir model of a compacting gel. Therefore, in order to consider the evolution ofa flocculating gel, we need only replace the expression Pg(f) from the case of adensely coagulating gel with Pg(f) = Py(f) for an appropriate expression for theyield stress (e.g. Usher et al. 2006).
4. Stress in the gel phase
We now consider the case when a gel dries under lateral constraint so thatthe gel is under uniaxial strain. For an ideal poroelastic material, in orderto analyse the stress on the gel during drying we would treat the gel as alinear poroelastic system (e.g. Brinker & Scherer 1990). However in reality gelparameters such as the bulk and shear moduli are highly nonlinear and so wemust adapt the linear theory to accurately reflect the gel properties. Elasticstresses can build up in the gel; however, we assume that the sol remainsunstressed so that the equations describing the evolution of the sol remain thesame as described in the previous section. Equivalently we assume that the soldoes not undergo a glass transition so its shear modulus is always zero. Wealso assume that the gel is not viscoelastic so it does not flow in response toapplied stresses.
For many gels it is observed that the elastic strain response to an imposedstress depends only upon the effective stress sij = sij + apdij which represents thestress on the solid phase of the gel. Here sij is total stress, dij is the Kroneckerdelta and a is the Biot–Willis constant and the solid is incompressible so a = 1and sij becomes the Terzaghi effective stress sij + pdij (Muir Wood 1990). Inline with this observation we choose the simplest possible extension of thelinear poroelastic, isotropic stress–strain relationship, making the assumptions
Proc. R. Soc. A

14 R. W. Style and S. S. L. Peppin
on November 11, 2010rspa.royalsocietypublishing.orgDownloaded from
that the strain response of the gel depends only upon the Terzaghi effectivestress so that
deij = 12G
(dsij − n
1 + ndskkdij
), (4.1)
where G and n are the shear modulus and Poisson’s ratio of the gel, respectively,which are functions of the effective stress. eij is the natural or Hencky strain,and a d before a variable implies a small change in the variable. By summingover the indices of this constitutive relationship, we find that
de ≡ dekk = 13K
dskk ≡ 1K
ds, (4.2)
where the bulk modulus
K = 2G3
1 + n
1 − 2n. (4.3)
For a gel constrained between rigid side walls (such as in the experiments ofDufresne et al. (2003), or for a gel of infinite lateral extent, it is reasonable to treatthe system as undergoing uniaxial strain so that dexx = deyy = 0 as contraction orexpansion in the lateral directions is prevented. Also szz = −Pa at the sol–gel andgel–air interfaces and we can assume that there are no changes in vertical stressin the gel and dszz = 0. Under these assumptions, and using the definition of theeffective stress in equation (4.1), we find that
dskk
3= dp
(1 − 4h
3
), (4.4)
where
h = 12
(1 − 2n)(1 − n)
(4.5)
(cf. the discussion of uniaxial strain by Wang 2000).Now from the definition of the solid phase fraction f = Vs/V with Vs being
the volume of solid particles in the network, we find that
dekk = dVV
= dVs
Vs− df
f. (4.6)
and in the case of an incompressible solid phase, the first term on the right-handside disappears so that using equation (4.2) we find that
1K
ds = −df
f. (4.7)
Combining equations (4.7) and (4.4) we finally obtain that
vpvf
= −Kf(1 − 4h/3)
. (4.8)
and this equation can then be inserted into equation (2.7) in order to determinethe diffusivity of the gel.
Proc. R. Soc. A

Crusting in colloidal suspensions 15
on November 11, 2010rspa.royalsocietypublishing.orgDownloaded from
0.50 0.55 0.60 0.65 0.70
200
400
600υpK(φ)
800
1000
φcpφ
3kBT
Figure 5. The non-dimensionalised bulk modulus as a function of solid fraction f.
All that remains in order to obtain a complete set of equations is to determinethe parameters K and n which we assume to depend only upon the effectivestress through its three invariants during elastic compression. In the absenceof detailed knowledge of their effective stress dependence, we assume that bulkmodulus depends only upon the first invariant of the effective stress s = skk/3 (themean effective stress) and that Poisson’s ratio is a constant. This form of bulkmodulus can be justified analytically (Coussy 2004), and has been experimentallyobserved to be a good approximation in many materials (e.g. Buscall & White1987; Muir Wood 1990; Coussy 2004). Although the assumption of a constantPoisson’s ratio with a s dependent bulk modulus implies that the gel is non-conservative (Zytynski et al. 1978), we note that this approximation is oftenused, for instance in critical state soil mechanics (Muir Wood 1990), for its goodagreement with experiment.
Letting K = K (s), we see from equation (4.7) that K is only a function of fso that
K (f) = −fvs
vf. (4.9)
In order to calculate K (f) we can consider the special case where the stress isgiven by sij = −Pdij so that the mean effective stress s = −P + p is equivalentto the negative of the gel ‘osmotic pressure’ −P and K (f) = fvP/vf so thatwe can use experimental observations of P(f) in the gel to calculate the bulkmodulus dependence on f. For a dense gel of hard spheres, such as that observedby Buzzaccaro et al. (2007), the osmotic pressure in the gel is given by equations(3.4) and (3.2), and so using these equations, and the relationship between themean effective stress and the osmotic pressure in the above expression for Kwe find
K (f) = 3kBTyp
fl(t)(1 − f/fcp)2
. (4.10)
Figure 5 shows the bulk modulus as a function of the solid phase fractionfcp. We can also calculate the shear modulus from the definition (4.3) and thePoisson’s ratio n. For a Poisson’s ratio of 0.2, we see that G(f) = 3K (f)/4.
Proc. R. Soc. A
16 R. W. Style and S. S. L. Peppin
on November 11, 2010rspa.royalsocietypublishing.orgDownloaded from
This shows that the shear rigidity takes a small, finite value when the particlesfirst form a gel. However, as with the bulk rigidity, the shear rigidity of the gelwill also increase substantially as the particles approach close packing.
(a) Discussion
By the use of equation (4.4), we see immediately the impact that changing theboundary conditions during crust formation has upon the gel diffusivity. Usingthe equation for gel diffusivity (2.7) in the unstressed case
Dug (f) = −kg(f)f
m
vs
vf, (4.11)
while in the stressed case
Dsg(f) = − kg(f)f
m(1 − 4h/3)vs
vf. (4.12)
Interestingly, a simple alteration in the boundary conditions also changes thegoverning equations in the bulk. A typical Poisson’s ratio for a close-packedcolloidal crystal is approximately 0.2 (Frenkel & Ladd 1987) so that thediffusivity in the stressed case Ds
g(f) is approximately twice as large as thediffusivity in the unstressed case. In the case of steady-state crust growth thisimplies that the boundary layer thickness in the gel at the sol–gel interface willbe twice the thickness in the stressed case compared with the unstressed case.Outside the boundary layer, the solid phase fraction will still be an asymptote tofcp and from equation (3.17) it can be seen that the pressure gradient will still bean asymptote to the same value that it takes in the unstressed case. This mustbe true so that the flux of the liquid to the evaporating surface is the same inboth stressed and unstressed cases.
As the boundary layer thickness is small in both stressed and unstressed cases,in terms of pressure and solid phase fraction there will be little macroscopicallyto distinguish between the two cases. However, the key difference occurs in thepresence of a tensile stress across the crust. From equation (4.4) and the definitionof the effective stress, we find that dskk = −4hdp, and so
vsxx
vp= −2h and
vsxx
vp= 1 − 2h, (4.13)
where we have used lateral symmetry, sxx = syy and the fact that szz = −Pa toobtain this relation between lateral tensile stress and pressure. The dependenceof these relations on Poisson’s ratio is shown in figure 6 for physically allowablepositive values of Poisson’s ratio. Importantly, vsxx/vp is always negative whilevsxx/vp is always positive. During drying the pore pressure becomes large andnegative so that the lateral stress sxx will be tensile, while the lateral effectivestress sxx is compressive. Therefore, during drying because the effective stress iscompressive even for weakly adhesive gels, the gel particles will not pull aparteven though large tensile stresses can be formed across the gel. The lateral tensilestresses then cause the growth of cracks in the gel (Atkinson & Craster 1991;Scherer 1992).
Proc. R. Soc. A

Crusting in colloidal suspensions 17
on November 11, 2010rspa.royalsocietypublishing.orgDownloaded from
ν
∂σxx
∂p
∂ ∼σxx
∂p
1.0
0.5
00.1 0.2 0.3 0.4 0.5
–0.5
–1.0
Figure 6. The gradients of lateral stress with respect to pore pressure and their dependence onthe Poisson’s ratio for a gel drying under uniaxial constraint. Continuous line, the gradient of thelateral stress with respect to pore pressure. Dashed line, the gradient of the effective lateral stresswith respect to the pore pressure.
If we assume a constant Poisson’s ratio we can integrate equation (4.13) usingcontinuity of pressure and stress at the sol–gel interface to find that the lateralstress in the gel is given by sxx = −Pa − 2h(p − pi). Because the pressure gradientis a constant in the bulk of the gel the tensile stress is approximately a linearfunction of the distance from the sol–gel interface; from use of equation (3.17) wefind that sxx ≈ −Pa + 2hEmz/kg(fcp) in the gel. Also noting from the calculationof the velocity of the gelation front that the position of the evaporating interfaceis given approximately by z = bEt, we find that the stress at the evaporatinginterface is well approximated by
sxx = −Pa + 2hbE2mtkg(fcp)
, (4.14)
which increases linearly with time as has been seen in experimental observations(e.g. Martinez & Lewis 2002; Wedin et al. 2004). Typical values of parametersfrom table 2 give a surface stress of sxx = −Pa + 8.6 × 10³t.
The greatest possible tensile stress occurs when the pore pressure reaches itsminimum value p = Pa − 2g/0.15R where
smaxxx = −Pa − 2h
(− 2g
0.15R+ Ps(fc)
)≈ 2h
2g
0.15R. (4.15)
The approximation follows because the capillary pressure term is much largerthan the interface pressure and atmospheric pressure. This is an important resultbecause it is commonly assumed that the tensile stress in a gel that drivescracking is the same as the maximum capillary pressure in the liquid 2g/0.15R(e.g. Dufresne et al. 2003; Lee & Routh 2004). However, equation (4.15) showsthat when the gel crust is constrained during drying, the maximum tensile stressis altered from the maximum capillary pressure by a factor of 2h. For a Poisson’sratio of 0.2, this means that the maximum tensile stress on the gel is only threequarters of the maximum capillary pressure. This difference will have implicationsin the context of interpretation of experimental measurements of tensile stressarising during drying.
Proc. R. Soc. A

18 R. W. Style and S. S. L. Peppin
on November 11, 2010rspa.royalsocietypublishing.orgDownloaded from
5. Conclusions
In this paper, we studied the growth of a gel crust at the surface of a dryingsol. We derive equations and boundary conditions which couple poroelasticeffects in the gel with colloidal effects in the sol. In the sol and the gel phases,the solid phase fraction f satisfies similar advection–diffusion equations withnonlinear diffusivities
Dg(f) = −kg(f)fm
vpvf
and Ds(f) = ks(f)fm
vP
vf.
The dependence of Dg on the gradient of pore pressure with f gives rise to adependence of the gel diffusivity on the constraints placed on the system duringdrying. For example, we have shown that in the case of uniaxial strain the geldiffusivity approximately doubles over its value in the unstressed case.
During steady-state growth of the gel due to evaporation, f has been shown tobe constant outside of thin boundary layers on either side of the gel–sol interface,while the pore pressure at the gel–air interface scales with the thickness of thecrust. This means that macroscopically the system can be thought of as twoadjacent bulk phases of constant solid phase fractions f0 and fcp, with thepore pressure in the gel increasing linearly from the sol–gel interface to theevaporating surface.
By considering the non-hydrostatic stress state in the gel we find that thestress at the surface of the gel increases linearly with time in agreementwith experimental observations. We also find that the maximum tensile stressresponsible for cracking is not equal to the maximum capillary pressure attainableat the surface before air invasion of the pores occurs, as has been previouslyassumed. Instead, integration of equation (4.13) in the case of constant Poisson’sratio shows that the maximum tensile stress at the surface of the gel is given by
smaxxx = 1 − 2n
1 − nPmax
cap ,
where Pmaxcap is the maximum capillary pressure. Thus, for a realistic Poisson’s
ratio of 0.2, the maximum tensile stress is 0.75Pmaxcap . This result is important in
interpretation of the results of stress measurements in drying films and in theanalysis of fracture toughness of drying gels.
This work is applicable to the modelling of any system involving crustformation in a drying colloidal suspension. In addition, the equations forconsolidation in a drying gel can also be used separately to analyse the evolutionof a drying gel. Such systems are commonly found and so this model will be ofuse in understanding the behaviour of gel crusts and stress evolution in the manyfields of colloid science, including soil desiccation, xerogel formation and crackformation in drying films such as ceramics and paints. Potential extensions ofthis work include more complex interparticle potentials, the effect of additionalstress regimes, non-steady interface growth and modelling of unsaturated crusts.
This publication is based on work supported by Award No. KUK-C1-013-04, made by KingAbdullah University of Science and Technology (KAUST).
Proc. R. Soc. A

Crusting in colloidal suspensions 19
on November 11, 2010rspa.royalsocietypublishing.orgDownloaded from
References
Atkinson, C. & Craster, R. V. 1991 Plane strain fracture in poroelastic media. Proc. R. Soc. Lond. A434, 605–633. (doi:10.1098/rspa.1991.0116)
Baxter, R. J. 1968 Percus–Yevick equation for hard spheres with surface adhesion. J. Chem. Phys.49, 2770–2774. (doi:10.1063/1.1670482)
Bergna, H. E. 2006 Colloid chemistry of silica: an overview. Colloidal silica. Fundamentals andapplications. London, UK: Taylor & Francis.
Bohn, S., Platkiewicz, J., Andreotti, B., Adda-Bedia, M. & Couder, Y. 2005 Hierarchicalcrack pattern as formed by successive domain divisions. II. From disordered to deterministicbehaviour. Phys. Rev. E. 71, 046215. (doi:10.1103/PhysRevE.71.046215)
Brinker, C. J. & Scherer, G. W. 1990 Sol–gel science. The physics and chemistry of sol–gelprocessing. San Diego, CA: Elsevier.
Brown, L. A., Zukoski, C. F. & White, L. R. 2002 Consolidation during drying of aggregatedsuspensions. AIChE J. 48, 492–502. (doi:10.1002/aic.690480308)
Buscall, R. & White, L. R. 1987 The consolidation of concentrated suspensions. part 1. The theoryof sedimentation. J. Chem. Soc., Faraday Trans. 1 83, 873–891. (doi:10.1039/f19878300873)
Buzzaccaro, S., Rusconi, R. & Piazza, R. 2007 ‘Sticky’ hard spheres: equation of state,phase diagram, and metastable gels. Phys. Rev. Lett. 99, 098301. (doi:10.1103/PhysRevLett.99.098301)
Coussy, O. 2004 Poromechanics. New York, NY: Wiley.Davis, K. E. & Russel, W. B. 1989 An asymptotic description of transient settling and ultrafiltration
of colloidal dispersions. Phys. Fluids A 1, 82–100. (doi:10.1063/1.857526)Dufresne, E. R., et al. 2003 Flow and fracture in drying nanoparticle suspensions. Phys. Rev. Lett.
91, 4501. (doi:10.1103/PhysRevLett.91.224501)Dufresne, E. R., Stark, D. J., Greenblatt, N. A., Cheng, J. X., Hutchinson, J. W., Mahadevan,
L. & Weitz, D. A. 2006 Dynamics of fracture in drying suspensions. Langmuir 22, 7144–7147.(doi:10.1021/la061251+)
Frenkel, D. & Ladd, A. J. C. 1987 Elastic constants of hard-sphere crystals-science. Phys. Rev.Lett. 59, 1169. (doi:10.1103/PhysRevLett.59.1169)
Haines, W. B. 1925 Studies in the physical properties of soils. II. A note on the cohesion developedby capillary forces in an ideal soil. J. Agric. Sci. 15, 529–535. (doi:10.1017/S0021859600082460)
Lee, W. P. & Routh, A. F. 2004 Why do drying films crack? Langmuir 20, 9885–9888. (doi:10.1021/la049020v)
Martinez, C. J. & Lewis, J. A. 2002 Shape evolution and stress development during latex-silicafilm formation. Langmuir 18, 4689–4698. (doi:10.1021/la0114833)
Miller, M. A. & Frenkel, D. 2004. Phase diagram of the adhesive hard sphere fluid. J. Chem. Phys.121, 535–545. (doi:10.1063/1.1758693)
Muir Wood, D. 1990 Soil behaviour and critical state soil mechanics. Cambridge, UK: CambridgeUniversity Press.
Peppin, S. S. L., Elliott, J. A. W. & Worster, M. G. 2005 Pressure and relative motion in colloidalsuspensions. Phys. Fluids 17, 053301. (doi:10.1063/1.1915027)
Russel, W. B., Saville, D. A. & Schowalter, W. R. 1989 Colloidal dispersions. Cambridge, UK:Cambridge University Press.
Santore, M. M., Russel, W. B. & Prud’homme, R. K. 1990 A one-component model for thephase behaviour of dispersions containing associative polymers. Macromolecules 23 3821–3823.(doi:10.1021/ma00218a018)
Scherer, G. W. 1992 Crack-tip stress in gels. J. Non-Cryst. Solids 144, 201–216. (doi:10.1016/S0022-3093(05)80402-8)
Style, R. W. & Wettlaufer, J. S. 2007 Evaporatively driven morphological instability. Phys. Rev.E 76, 011602. (doi:10.1103/PhysRevE.76.011602)
Tsapis, N., Dufresne, E. R., Sinha, S. S., Riera, C. S., Hutchinson, J. W., Mahadevan, L. & Weitz,D. A. 2005 Onset of buckling in drying droplets of colloidal suspensions. Phys. Rev. Lett. 94,018302. (doi:10.1103/PhysRevLett.94.018302)
Proc. R. Soc. A

20 R. W. Style and S. S. L. Peppin
on November 11, 2010rspa.royalsocietypublishing.orgDownloaded from
Usher, S. P., Scales, P. J. & White, L. R. 2006 Prediction of transient bed height in batchsedimentation at large times. AIChE J. 52, 986–993. (doi:10.1002/aic.10709)
Wang, H. F. 2000 Theory of linear poroelasticity with applications to geomechanics and hydrogeology.Princeton, NJ: Princeton University Press.
Wedin, P., Martinez, C. J., Lewis, J. A., Daicic, J. & Bergstrom, L. 2004 Stress development duringdrying of calcium carbonate suspensions containing carboxymethylcellulose and latex particles.J. Colloid Interface Sci. 272, 1–9. (doi:10.1016/j.jcis.2003.12.030)
Zytynski, M., Randolph, M. F., Nova, R. & Wroth, C. P. 1978 On modelling the unloading–reloading behaviour of soils. Int. J. Numer. Anal. Methods Geomech. 2, 87–93. (doi:10.1002/nag.1610020107)
Proc. R. Soc. A