Brownian Dynamics Simulations of Colloidal Suspensions Containing Polymers as Precursors of...
12
Brownian Dynamics Simulations of Colloidal Suspensions Containing Polymers as Precursors of Composite Electrodes for Lithium Batteries Manuella Cerbelaud,* ,† Bernard Lestriez, † Dominique Guyomard, † Arnaud Videcoq, ‡ and Riccardo Ferrando § † Institut des Maté riaux Jean Rouxel (IMN), Universite ́ de Nantes, CNRS, 2 rue de la Houssinie ̀ re, BP32229, 44322 Nantes cedex 3, France ‡ SPCTS, UMR 7315, ENSCI, CNRS; Centre Europe ́ en de la Cé ramique, 12 rue Atlantis, 87068 Limoges cedex, France § Dipartimento di Fisica and CNR-IMEM, Via Dodecaneso 33, 16146 Genova, Italy ABSTRACT: Dilute aqueous suspensions of silicon nano- particles and sodium carboxymethylcellulose salt (CMC) are studied experimentally and numerically by Brownian dynamics simulations. The study focuses on the adsorption of CMC on silicon and on the aggregation state as a function of the suspension composition. To perform simulations, a coarse- grained model has first been developed for the CMC molecules. Then, this model has been applied to study numerically the behavior of suspensions of silicon and CMC. Simulation parameters have been fixed on the basis of experimental characterizations. Results of Brownian dynamics simulations performed with our model are found in qualitative good agreement with experiments and allow a good description of the main features of the experimental behavior. 1. INTRODUCTION Polymers are very common in colloidal systems. They are extensively used in colloidal suspensions to alter the stability. They are also often employed for adjusting rheological properties or controlling the microstructure of suspensions. Their use is particularly important in the shaping process of electrodes for lithium batteries, which are often obtained by tape-casting. 1 Lestriez et al. have indeed shown that perform- ances of lithium batteries are related to the microstructure of electrodes, which is determined by the structure of the suspensions from which they are fabricated. 2,3 Thus, under- standing the role of polymers in these suspensions is very important to control the structure of electrodes and, as a consequence, the performance of batteries. Nowadays, in the domain of lithium batteries, most of the studies concern electrodes made of silicon. Indeed, silicon is very promising as anode material because of the high theoretical quantity of electricity stored per unit of mass (3590 Ah kg −1 ) compared to that of graphite (372 Ah kg −1 ) presently used in commercial Li-ion batteries. However, during the battery cycling, silicon exhibits large volume expansion and shrinkage, which end in poor cycle life. To tackle this problem, the use of adequate polymer during the process has been proposed. 4 One of the most efficient polymers reported in the literature is the carboxymethylcellulose (CMC). 5,6 CMC is a derivative of cellulose with carboxymethyl substitutions. The level of substitution is given by its degree of substitution (DS). In an aqueous medium, carboxymethyl groups can dissociate to form carboxylate anionic groups, which are responsible for the solubility of CMC and for its conformation. 7 The number of dissociated groups is related to the pH. Numerous studies on CMC are reported in the literature. Particular attention has been paid to the mechanisms of CMC adsorption on solids. Indeed, CMC is able to bond to a solid via electrostatic interactions 8,9 or hydrophobic interactions 10,11 or hydrogen bonds. 12 Essentially, two aqueous formulations of electrodes for lithium batteries made of silicon, carbon, and CMC can be found in the literature: the first is in deionized water at natural pH 13 and the second in a buffer at pH = 3. 14 Different bonding mechanisms in the dried electrodes have been proposed to explain their good electrochemical performance. 15 However, in both formulations, it is important to study the distribution of the constituents in the mother suspensions to understand the bonding probability between them. In order to analyze the role of each parameter (pH, salt concentration, etc.) in these suspensions for electrodes, numerical simulations can be very useful. For example, Zhu et al. have performed Brownian dynamics simulations on suspensions devoted to the cathode of lithium batteries. 16 In their model, the polymer is only implicitly taken into account through the solvent properties. For silicon anodes, since a great Received: May 25, 2012 Revised: June 26, 2012 Published: June 27, 2012 Article pubs.acs.org/Langmuir © 2012 American Chemical Society 10713 dx.doi.org/10.1021/la302135v | Langmuir 2012, 28, 10713−10724
-
Upload
independent -
Category
Documents
-
view
1 -
download
0
Transcript of Brownian Dynamics Simulations of Colloidal Suspensions Containing Polymers as Precursors of...

Brownian Dynamics Simulations of Colloidal Suspensions ContainingPolymers as Precursors of Composite Electrodes for LithiumBatteriesManuella Cerbelaud,*,† Bernard Lestriez,† Dominique Guyomard,† Arnaud Videcoq,‡
and Riccardo Ferrando§
†Institut des Materiaux Jean Rouxel (IMN), Universite de Nantes, CNRS, 2 rue de la Houssiniere, BP32229, 44322 Nantes cedex 3,France‡SPCTS, UMR 7315, ENSCI, CNRS; Centre Europeen de la Ceramique, 12 rue Atlantis, 87068 Limoges cedex, France§Dipartimento di Fisica and CNR-IMEM, Via Dodecaneso 33, 16146 Genova, Italy
ABSTRACT: Dilute aqueous suspensions of silicon nano-particles and sodium carboxymethylcellulose salt (CMC) arestudied experimentally and numerically by Brownian dynamicssimulations. The study focuses on the adsorption of CMC onsilicon and on the aggregation state as a function of thesuspension composition. To perform simulations, a coarse-grained model has first been developed for the CMC molecules.Then, this model has been applied to study numerically thebehavior of suspensions of silicon and CMC. Simulationparameters have been fixed on the basis of experimentalcharacterizations. Results of Brownian dynamics simulations performed with our model are found in qualitative good agreementwith experiments and allow a good description of the main features of the experimental behavior.
1. INTRODUCTION
Polymers are very common in colloidal systems. They areextensively used in colloidal suspensions to alter the stability.They are also often employed for adjusting rheologicalproperties or controlling the microstructure of suspensions.Their use is particularly important in the shaping process ofelectrodes for lithium batteries, which are often obtained bytape-casting.1 Lestriez et al. have indeed shown that perform-ances of lithium batteries are related to the microstructure ofelectrodes, which is determined by the structure of thesuspensions from which they are fabricated.2,3 Thus, under-standing the role of polymers in these suspensions is veryimportant to control the structure of electrodes and, as aconsequence, the performance of batteries.Nowadays, in the domain of lithium batteries, most of the
studies concern electrodes made of silicon. Indeed, silicon isvery promising as anode material because of the hightheoretical quantity of electricity stored per unit of mass(3590 Ah kg−1) compared to that of graphite (372 Ah kg−1)presently used in commercial Li-ion batteries. However, duringthe battery cycling, silicon exhibits large volume expansion andshrinkage, which end in poor cycle life. To tackle this problem,the use of adequate polymer during the process has beenproposed.4 One of the most efficient polymers reported in theliterature is the carboxymethylcellulose (CMC).5,6 CMC is aderivative of cellulose with carboxymethyl substitutions. Thelevel of substitution is given by its degree of substitution (DS).In an aqueous medium, carboxymethyl groups can dissociate to
form carboxylate anionic groups, which are responsible for thesolubility of CMC and for its conformation.7 The number ofdissociated groups is related to the pH. Numerous studies onCMC are reported in the literature. Particular attention hasbeen paid to the mechanisms of CMC adsorption on solids.Indeed, CMC is able to bond to a solid via electrostaticinteractions8,9 or hydrophobic interactions10,11 or hydrogenbonds.12
Essentially, two aqueous formulations of electrodes forlithium batteries made of silicon, carbon, and CMC can befound in the literature: the first is in deionized water at naturalpH13 and the second in a buffer at pH = 3.14 Different bondingmechanisms in the dried electrodes have been proposed toexplain their good electrochemical performance.15 However, inboth formulations, it is important to study the distribution ofthe constituents in the mother suspensions to understand thebonding probability between them.In order to analyze the role of each parameter (pH, salt
concentration, etc.) in these suspensions for electrodes,numerical simulations can be very useful. For example, Zhuet al. have performed Brownian dynamics simulations onsuspensions devoted to the cathode of lithium batteries.16 Intheir model, the polymer is only implicitly taken into accountthrough the solvent properties. For silicon anodes, since a great
Received: May 25, 2012Revised: June 26, 2012Published: June 27, 2012
Article
pubs.acs.org/Langmuir
© 2012 American Chemical Society 10713 dx.doi.org/10.1021/la302135v | Langmuir 2012, 28, 10713−10724

interest lies in the polymer role, such an approach does notseem appropriate. Therefore, we propose here to develop anexplicit model for the polymer, based on experimentalobservations.In this study, a coarse-grained model is developed for
Brownian dynamics simulations of CMC. Molecules of CMCare modeled as chains of several spheres (“beads”), each onehaving a diameter equal to its Kuhn’s length.17,18 Here, beadsare large enough to keep considering the solvent as acontinuous medium. The parameters of the model are directlyderived from experimental characterizations. This simple modelis applied to study dilute suspensions of silicon and CMC.Particular attention is paid to the role of pH and of the lengthof CMC chains. We will show that this model, although beingsimple, is able to shed light on the experimental results.The paper is structured as follows. In section 2, experimental
characterizations of the dilute CMC/silicon suspensions arepresented. Then, the interaction model and the simulationmethod are described in section 3, while the choice ofparameters employed in the modeling of CMC is detailed insection 4. Finally, section 5 presents the results of simulationsperformed with silicon and CMC. The simulation results arecompared with the experimental ones throughout the text.
2. EXPERIMENTAL CHARACTERIZATIONS2.1. Materials. The silicon powder used in this study is purchased
from Alfa Aesar (diameter ds ≃ 50 nm, purity 99.999%, mass density ρ= 2330 kg m−3). Particles are covered by a thin layer of silicon oxide ofaround 2 to 4 nm. This thin layer makes the silicon hydrophilic andtherefore permits the preparation of suspensions in aqueous media.The carboxymethylcellulose sodium salts (CMC) are purchased fromAldrich. In this study, CMC has a degree of substitution DS = 0.7, andtwo molecular weights are used: Mw = 90 000 (CMC90) and Mw =250 000 (CMC250). All the suspensions are dilute, prepared with asilicon volume percentage of 1.5% in deionized water or in HClsolution. In the following, when water is used as solvent, the pH isreferred to as natural pH. When suspensions are prepared with HCl,the pH is always adjusted to 3. In all the suspensions, the quantity ofpolymer is kept so small that suspensions remain dilute. Therefore,chains are considered as separated entities and behave independ-ently.17
2.2. Zeta Potential of the Silicon Nanoparticles. The zetapotential of the silicon nanoparticles is determined with a zetasizernanoseries (Malvern Instrument) with an autotitrator MPT-2. The pHwas adjusted with 0.25 M HCl. Smoluchowski’s theory is used tocalculate the zeta potential. The natural pH of the silicon suspension inwater was found at about 5. At this pH, silicon particles have a zetapotential (ψ) of −40 mV and the suspension is stable. At pH = 3,silicon particles have a zeta potential of +5 mV and the suspension isunstable. When no CMC is added, the ionic conductivity of theaqueous silicon suspension is measured at the very low value of 15 μScm−1, indicating that no salt is brought by the silicon.2.3. Ionic Conductivity of CMC Solutions. When the CMC is in
aqueous solutions, the ionic conductivity increases linearly with itsconcentration (see Figure 1). This can be attributed to the sodiumions, which are liberated by the CMC. From the chemical formula ofthe CMC, its degree of substitution, and its molar mass, it is possibleto calculate the number of carboxymethyl groups (−COO−/Na+)borne by one CMC molecule. Assuming a complete dissociation ofthese groups, the number of Na+ ions liberated and therefore the Na+
concentration can be determined and used to calculate a theoreticalconductivity of the CMC solutions as
∑σ λ= z Ci
i i i(1)
with zi the valence of ion i, Ci its concentration, and λi its ionicconductivity. The various ions considered contributing to the ionic
conductivity are Na+, OH−, H+, and Cl−, the latter because, at pH = 3,HCl is used to fix the pH. The ionic conductivities used here are asfollows: λNa+ = 50.08 × 10⁻⁴ m2 S mol−1, λOH− = 190 × 10−4 m2 Smol−1, λH+ = 350 × 10−4 m2 S mol−1, and λCl− = 76.31 × 10⁻⁴ m2 Smol−1.19 Figure 1 shows that the calculated conductivity is a bit smallerthan the measured one. This small difference may be explained byother sources of conductivity present in the solutions such as theCMC molecules. Nevertheless, the quite good agreement betweencalculations and experimental measurements allows us to assume that,in water, CMC is fully dissociated, one CMC90 molecule bearing 289negative charges, and one CMC250 molecule, 803 negative charges.The number of charges corresponds to the number of COO− groupspresent on the molecule.
In HCl solutions, when CMC is added, an excess of HCl is neededto maintain the pH at 3 (see Table 1). This excess is used in the
protonation of the COO− groups of the CMC. According to theamounts of CMC and HCl used, we found that each molecule ofCMC90 adsorbs 170 protons, and each one of CMC250, 471 protons.Considering that CMC loses all its sodium ions in solutions and thenadsorbs protons, it comes out that, in HCl at pH = 3, CMC90 andCMC250 bear 119 and 332 negative charges, respectively. Thehypothesis that is used to estimate the conductivity allows to describeits evolution as a function of the CMC amount at pH = 3 as well as atnatural pH (see Figure 1).
Knowing the nature of ions present in suspension and theirconcentration, the ionic strength of the solutions (I) has beendetermined as a function of the amount of CMC added. Thecorresponding values that are used in the following are reported inTable 1.
2.4. Analysis of the CMC Adsorption on Silicon. Adsorption ofCMC on silicon particles (or bonding capacity between CMC andsilicon) has been determined experimentally by a method based on
Figure 1. Experimental and theoretical ionic conductivity (σ) of theCMC solutions as a function of the weight percentage of CMC (wt%of CMC = mCMC/msolvent × 100) at natural pH (in water) and at pH =3 (in HCl).
Table 1. Ionic Strength (I), Used in Simulations, as aFunction of the Weight Percentage of CMCa
wt% of CMC pH VHCl (μL) I (mol L−1)
0.00 natural 0 1.00 × 10⁻⁵
0.03 natural 0 5.71 × 10⁻⁴
0.24 natural 0 4.59 × 10⁻³
0.00 pH = 3 25 1.00 × 10⁻³
0.03 pH = 3 37 2.13 × 10⁻²
0.24 pH = 3 139 2.74 × 10⁻²
aVHCl is the volume of 1 M HCl added to maintain the pH at 3 in 25mL of CMC solutions.
Langmuir Article
dx.doi.org/10.1021/la302135v | Langmuir 2012, 28, 10713−1072410714

viscosimetry. The viscosity of a dilute polymer solutions increaseslinearly with the polymer concentration. It is thus possible to deducethe polymer concentration from a viscosity measurement.Solutions with different amounts of CMC on one side and 1.5 vol %
silicon suspensions with different amounts of CMC on the other sidehave been prepared and homogenized on rotating rolls during 20 h.Suspensions are centrifuged at 12 000 rpm during 30 min. One batchof suspensions with only CMC is also prepared without centrifugation.The supernatant is removed and held in sealed tubes for one night.The viscosity of this supernatant is then determined with a stress-controlled rheometer Physica MCR 101 from Anton Paar, using aplate−plate geometry (gap 0.7 mm). The temperature is fixed at 25 °Cby a Peltier system. For each composition, 2 consecutive cycles arecarried out (1 cycle = an increase of the shear rate from 1 to 1000 s−1
and a decrease of the shear rate from 1000 to 1 s−1). The viscosity isdetermined as the mean value obtained at the shear rate γ = 158.5 s−1
measured during the decrease of the first cycle and the increase anddecrease of the second cycle. The evolution of the viscosity as afunction of the CMC concentration is analyzed from the solutionsprepared with only CMC, and the coefficients of the master line fittingthis evolution are deduced. The same coefficients are found for thesolutions that have been centrifuged or not. This parametrization hasallowed us to determine the amount of CMC remaining in thesupernatant for the suspensions prepared with CMC and silicon. Thetotal amount of CMC adsorbed on silicon is obtained by the differencein the amount of CMC introduced in the initial suspensions. Resultsare shown in Figure 2. It is observed that adsorption of CMC on
silicon occurs at pH = 3 as well as at natural pH. For this latter case,since the charges of CMC and silicon particles are both negative, CMCadsorption is certainly not only due to electrostatic interactions, but itmay originate from hydrophobic interactions, if, for example, the silicalayer on silicon is not homogeneous, or from hydrogen bondingbetween the hydroxyl groups on silicon and CMC. For CMC90,adsorption at pH = 3 is clearly greater than at natural pH. This may beexplained by the combination of 3 phenomena: (i) polymer and siliconare oppositely charged at pH = 3, which favors adsorption; (ii) theelectrostatic repulsion between polymers is diminished, because ionicstrength is higher at pH = 3 (see Table 1); (iii) both CMC and siliconparticles are hydroxylated at pH = 3, favoring hydrogen bonding.Concerning CMC250, the polymer is quasi totally adsorbed for all
the concentrations, at both pH conditions. At natural pH, theadsorption in the mass of CMC250 is stronger than the adsorption ofCMC90. For example, for 0.24 wt % of CMC at natural pH, the massof CMC250 adsorbed is 1.75 times larger than the mass of CMC90adsorbed. However, it is worth noting that the number of CMC250molecules adsorbed is, on the contrary, 1.59 times lower than thenumber of CMC90 molecules adsorbed on silicon. So, the CMC250
adsorption in mass is larger with a smaller number of chains adsorbed,because the CMC250 polymer chains are much longer.
2.5. Analysis of the Suspension Stability. In order to determinethe effect of CMC on the stability of silicon suspensions,sedimentation tests have been carried out. These tests, easy to realize,give a qualitative description of the aggregation in the system.Suspensions are prepared with a silicon amount of 1.5 vol % and withdifferent amounts of CMC. After preparation, the differentsuspensions are introduced into closed tubes where they are allowedto settle. After 20 h, the height of the cakes is measured and the stateof the supernatant observed. The more turbid the supernatant is andthe smaller the cake is, the more stable the suspension is. On thecontrary, the clearer the supernatant is and the higher the cake is, themore aggregated the suspension is. Suspensions were not allowed tosettle for a longer time, because a parasitic reaction occurred in thetubes (probably due to the oxidation of silicon) creating gases andrendering observation of the sediment difficult afterward.
Pictures of the sedimentation tubes are shown in Figure 3 andsediment heights are reported in Table 2. First, at pH = 3, aggregation
Figure 2. Evolution of the weight percentage of CMC adsorbed as afunction of the weight percentage of CMC introduced. For clarity, allerror bars are not shown.
Figure 3. Images of the sedimentation tubes after 20 h. Suspensionswere prepared with different amounts of CMC90 and CMC250: (a)and (c) at pH = 3; (b) and (d) at natural pH.
Table 2. Sediment Height (h) Observed in theSedimentation Tubes after 20 ha
pH CMC wt % of CMC h (cm)
natural pH CMC90 0.00 1.50.03 1.50.24 2.6
CMC250 0.00 2.00.03 3.40.06 3.50.24 4.0
pH = 3 CMC90 0.00 2.20.12 2.70.24 2.80.61 3.2
CMC250 0.00 3.40.12 3.40.24 4.00.61 5.0
aSuspensions were prepared with different amounts of CMC90 andCMC250 at both natural pH and pH = 3.
Langmuir Article
dx.doi.org/10.1021/la302135v | Langmuir 2012, 28, 10713−1072410715

is stronger and faster than at natural pH. Indeed, for all theconcentrations analyzed, supernatants are clearer and sedimentshigher. Second, at both pH conditions, the sediment height tends toincrease with the amount of CMC, which suggests that CMC favorsaggregation, for example, by creating bridges between silicon particles,5
since in all cases, CMC can adsorb on silicon, as shown in Figure 2.
3. SIMULATION METHODOLOGY
3.1. Interaction Models. 3.1.1. Interaction between CMCBeads. CMC is modeled through a coarse-grained method,17 inwhich CMC molecules are represented by chains constituted ofNc “beads”, each bead having a diameter equal to the Kuhn’slength of CMC (dc = 11.8 nm).18 The connectivity betweenadjacent beads is ensured by an elastic potential
= −−U rk
r a( )2
( 2 )ij ijc celas c
c2
(2)
with rij the distance between the centers of beads, ac the beadradius (here ac = 5.9 nm) and kc an elastic constant that will bedetermined in the following.Nonadjacent beads interact through the electrostatic
potential20
πε=
κ
−
−U r
Z e er
( )4ij
r
ijc celec c
2 2 ij
(3)
with Zc the bead charge number, e the elementary charge, ε =ε0εr the dielectric constant of the solvent (εr = 81 for water),and κ the inverse Debye length defined as
κε
=e z N I
k T2 102 2
A3
B (4)
with z the electrolyte charge number (here z = 1), NAAvogadro’s number, kB Boltzmann’s constant, T the temper-ature (T = 293 K), and I the ionic strength (in mol L−1). Toavoid interpenetration between nonadjacent beads, a linearrepulsive potential is added.3.1.2. Interaction between Silicon Particles. The silicon
particles are considered as spheres of radius as = 25 nm.Interactions between two silicon particles are modeled by aDLVO potential.21,22 This interaction is the sum of anelectrostatic potential US−S
elec and a van der Waals potential US−SvdW.
For the electrostatic contribution, we used the expression23,24
πε κ=
+
κ κ
−
−⎛⎝⎜
⎞⎠⎟U r
Z e ea
er
( )4 1ij
a r
ijs selec s
2 2
s
2ijs
(5)
with rij the distance between the centers of silicon particles andZs their charge number, which is deduced from the zetapotential (ψ)25
πε κ ψκ
ψ= +⎡⎣⎢⎢
⎛⎝⎜
⎞⎠⎟
⎛⎝⎜
⎞⎠⎟⎤⎦⎥⎥Z
k Tze
azek T a
zek T
4 2 sinh12
4tanh
14s
B2 s
2
B s B
(6)
With the silicon zeta potentials given in 2.2 and the ionicstrengths in Table 1, eqs 4 and 6 give Zs = −104 and Zs = 25 atnatural pH and at pH = 3, respectively.For the van der Waals term, we used the expression26
= −−
+ +−
−
⎡⎣⎢⎢
⎛⎝⎜⎜
⎞⎠⎟⎟⎤⎦⎥⎥U r
A ar a
ar
r a
r( )
62
42
ln4
ijij ij
ij
ijs svdW s
2
2s2
s2
2
2s2
2
(7)
with A the Hamaker constant. As mentioned in section 2.1,silicon particles present a thin layer of silica at their surface. TheHamaker constants of silicon and silica in water are 9.75 ×10⁻²⁰ J and 0.46 × 10⁻²⁰ J, respectively.27 Therefore, the thinlayer of silica may have an influence on the van der Waals term.According to the summation developed for core shellparticles,28 we have evaluated the interaction potential betweentwo silicon particles with a silica layer of 2 nm. The result (seeFigure 4) shows that the presence of the thin silica layer
changes the interaction between the silicon particles and cannotbe neglected. However, the summation method is cumbersome,which is why we decided to take an effective value of A = 2 ×10⁻²⁰ J for the Hamaker constant. This approximation is quitegood for separation distances larger than rij/(2as) = 1.02 andmore approximative below (see Figure 4). Nevertheless,because of the divergence of its van der Waals part, theDLVO potential is no longer considered at small separationdistances, and thus, we believe that this approximation issufficient. Indeed, the DLVO potential is cut at −14kBT, and atcontact, a repulsive linear potential is added to avoid theinterpenetration between particles, as explained and justified ina previous work.29,30
3.1.3. Interaction between CMC Beads and SiliconParticles. To take the electrostatic interaction between aCMC bead and a silicon particle into account, the followingexpression is used:20
πε κ=
+
κ
−
− −⎛⎝⎜
⎞⎠⎟U r
Z Z ea
er
( )4
11ij
r a
ijc selec c s
2
s
( )ij s
(8)
with rij the center-to-center separation distance between thebead and the particle.As mentioned in section 2.4, electrostatic interactions cannot
explain by themselves the CMC adsorption on silicon at naturalpH. Therefore, as a first approximation, the hydrogen bondand/or the hydrophobic effect are taken into account through a
Figure 4. Van der Waals interaction US−SvdW (7) as a function of the
dimensionless center-to-center separation distance rij/(2as), for silicon(A = 9.75 × 10⁻²⁰ J), silica (A = 0.46 × 10⁻²⁰ J), silicon with a 2-nm-layer of silica (result of summation) and for an intermediate Hamakerconstant (A = 2 × 10⁻²⁰ J).
Langmuir Article
dx.doi.org/10.1021/la302135v | Langmuir 2012, 28, 10713−1072410716

Lennard-Jones potential (technique already used to modelhydrophobic interactions31)
ε=+
−+
−
⎡
⎣⎢⎢⎛⎝⎜⎜
⎞⎠⎟⎟
⎛⎝⎜⎜
⎞⎠⎟⎟
⎤
⎦⎥⎥U r
a ar
a ar
( ) 4ij aij ij
c sLJ c s
12
c s
6
(9)
with εa being the depth of the potential well.3.2. Brownian Dynamics Simulations. The system is
simulated by Brownian dynamics.32 The solvent is consideredas a continuum medium and its effect upon the solute isrepresented by a combination of frictional and random forces.The motion of particle i is thus described by the Langevinequation
∑ζ= − + + Γmv t
tv t F r t t
d ( )d
( ) { ( )} ( )ii
i ij
ij ij i(10)
with mi and vi its mass and its velocity, respectively, ζi = 6πηaithe friction coefficient, which depends on the particle radius(ai) and on the solvent viscosity (here η = 10−3 Pa s for water).Fij{rij(t)} are the pair interaction forces between the particles,which depend on the center-to-center distance between theparticles (rij(t)) and which derive from the potentialsintroduced in section 3.1 (Fij = −∇Uij). Γi is the randomforce obeying the following statistical properties:
δ δ⟨Γ ⟩ = ⟨Γ Γ ′ ⟩ = − ′t t t C t t( ) 0 and ( ) ( ) ( )i i j ij
(11)
with C = 2kBTζi to satisfy the thermal equilibrium condition.The Langevin equation is then numerically integrated due tothe algorithm developed by Mannella and Palleschi33 in orderto get the time evolution of the particle positions.This CMC/silicon system is characterized by two distinct
time scales. The velocity relaxation time of a CMC bead (mc/ζc≃ 10−13 s) is indeed much smaller than the one of a siliconparticle (ms/ζs ≃ 10−10 s). That is why we use the integrationstrategy already employed in ref 29 and summarized here.We chose a time step, δt = 10−11 s, much smaller than the
velocity relaxation time of silicon particles. Therefore, weintegrate the full Langevin equation for these particles, so thatthe evolution of their velocities and positions is given by
∑
δζ
δ
ζ δ
+ = +
+ − +⎡⎣⎢⎢
⎤⎦⎥⎥
v t t v tk T
mt Y
mv t F r t t
( ) ( )2
( )
1( ) { ( )}
i is
i
ij
ij ij
B
s
1/2
ss
(12)
δ δ+ = +r t t r t v t t( ) ( ) ( )i i i (13)
where Yi corresponds to uncorrelated Gaussian-distributedrandom numbers with an average of zero and a standarddeviation of 1.For CMC beads, the time step is much larger than their
velocity relaxation time, so that the inertia term in the Langevinequation can be neglected and their positions evolve as
∑δζ
δζ
δ+ = + +r t t r tk T
t Y F r t t( ) ( )2
( )1
{ ( )}i i ij
ij ijB
c
1/2
c
(14)
Our simulations are performed in a cubic box with periodicboundary conditions. The box size is defined by the volume
fraction of silicon particles (ϕ = 1.5%, as in experiments) andby their number. Initial configurations are generated as follows.Silicon particles are randomly placed in the box, avoidingoverlapping. The velocity of each silicon particle is randomlychosen such that its norm is equal to [(3kBT)/ms]
1/2. The firstbead of each polymer is randomly placed at a non-overlappingposition. Then, CMC chains are generated by the excludedvolume method presented in ref 34 with λ = 2. And again,overlapping between CMC beads or between a CMC bead anda silicon particle is not allowed.
4. DETERMINATION OF THE PARAMETERS FOR THECMC MODELING
In this section, we focus on the simulation of CMC molecules.Specific simulations are carried out to choose the CMCparameters that will be used in the next section (especially thenumber of beads (Nc) and the elastic constant (kc) that rule thebehavior of CMC molecules). These parameters are chosen inorder to correctly reproduce the gyration radius and thediffusion of CMC molecules. These properties are first deducedfrom the semiempirical Mark−Houwink theory.The intrinsic viscosity ([ν]) can be linked to the molar mass
of the polymer (M) as35
ν = αKM[ ] (15)
where K and α are constants that depend on the nature of thesolvent and of the polymer, and which are determinedexperimentally and generally tabulated for the classicalpolymers. For instance, the following values of K and α canbe found for CMC molecules, with DS = 1.06, in water withNaCl:36 K = 7.2 × 10⁻³ mL g−1, α = 0.95 for NaCl 0.005 M andK = 8.1 × 10⁻³ mL g−1, α = 0.92 for NaCl 0.01M.According to ref 35, the intrinsic viscosity is also linked to the
hydrodynamic radius (Rh)
νπ
=R NM
[ ]10
3h3
A
(16)
while the latter is related to the diffusion coefficient of thepolymer (Df)
πη=D
k TR6 h
fB
(17)
and for real polymers, the ratio between the hydrodynamicradius and the gyration radius is17
=RR
0.640h
g (18)
Eqs 15, 16, 17, and 18 have been used to estimate Rg and Dffor CMC molecules (DS = 1.06) in water with NaCl. Resultsare shown in Table 3.
Table 3. Estimation of the Gyration Radius and the DiffusionCoefficient of CMC Polymers with DS = 1.06, for TwoMolar Masses and Two Ionic Strengths
I (mol L−1) CMC kind Rg (nm) Df (m2 s−1)
5 × 10⁻³ 90 27.0 1.2 × 10⁻¹¹
5 × 10⁻³ 250 52.7 6.4 × 10⁻¹²
1 × 10⁻² 90 25.2 1.3 × 10⁻¹¹
1 × 10⁻² 250 48.4 6.9 × 10⁻¹²
Langmuir Article
dx.doi.org/10.1021/la302135v | Langmuir 2012, 28, 10713−1072410717
The simulation parameters (Nc and kc) are deduced from thecomparison between these results and simulation results. In thesimulations, the gyration radius is computed by37
= + +R R R Rx y zg2
g,2
g,2
g,2
(19)
with
∑= −RN
x x1
( )xi
ig,2
cg
2
(20)
∑= −RN
y y1
( )yi
ig,2
cg
2
(21)
∑= −RN
z z1
( )zi
ig,2
cg
2
(22)
where (xg, yg, zg) are the coordinates of the center of mass. TheCMC charge numbers with DS = 1.06 are calculated as insection 2.3, i.e., considering that the CMC is fully dissociated.Then, it is found that molecules of CMC90 and CMC250 bear387 and 1074 negative charges, respectively.4.1. Number of Beads in Each Polymer. Brownian
dynamics simulations were performed with one isolatedpolymer, without periodic boundary conditions. Differentnumbers of beads were tested for both CMC90 andCMC250. The charge number of each bead (Zc) is obtainedby dividing the total number of charges of the CMC moleculeby the number of beads (Nc). As a first approximation, kc wasfixed to 1 N m−1. For each value of Nc tested, the gyrationradius is computed after 5 × 10⁻⁴ s and its value is averagedover 100 independent simulations. Results are reported inTable 4. Some tests were also performed with values of the
excluded volume parameter (λ) different from 2, and nosignificant difference was observed. The gyration radius variesalmost linearly with the number of beads. Small discrepanciesmay be explained by the competition between the elongationdue to supplementary beads and the shortening due to thedecrease of the electrostatic repulsion between beads. Indeed, if
they are more numerous, they are also less charged. At constantnumber of beads, the gyration radius decreases when the ionicstrength increases, as expected from Table 3. This importantcharacteristic is well-reproduced by the present simple model.Finally, in order to fit with the Mark−Houwink’s predicitions(Table 3) (with an error ≤5%), Nc1 = 13 and Nc2 = 36 beadswere chosen for CMC90 and CMC250, respectively. It is worthnoting that the molar mass ratio (250/90 = 2.78) is fairlyrespected by this number ratio Nc2/Nc1 = 2.77.
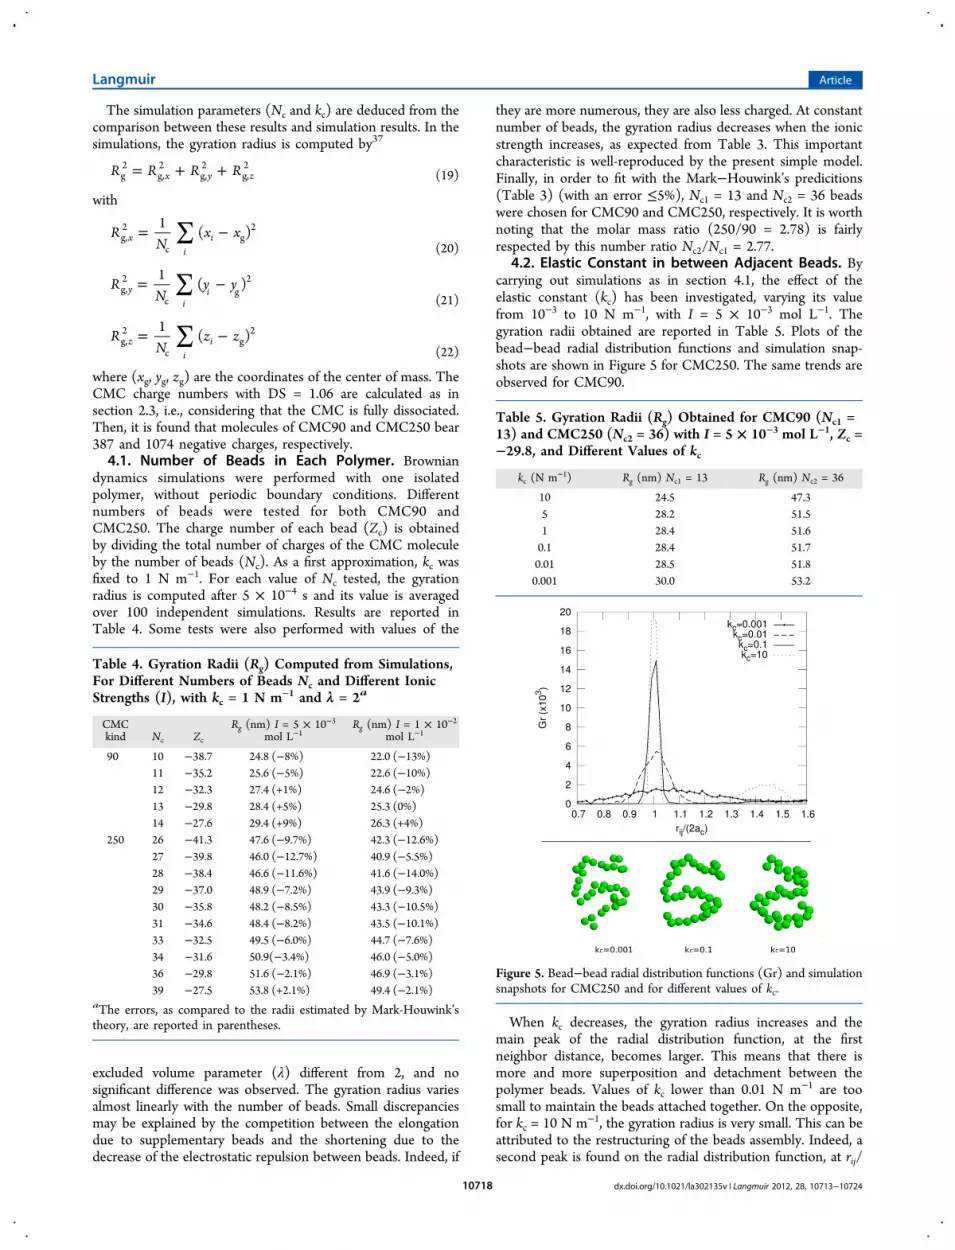
4.2. Elastic Constant in between Adjacent Beads. Bycarrying out simulations as in section 4.1, the effect of theelastic constant (kc) has been investigated, varying its valuefrom 10−3 to 10 N m−1, with I = 5 × 10⁻³ mol L−1. Thegyration radii obtained are reported in Table 5. Plots of thebead−bead radial distribution functions and simulation snap-shots are shown in Figure 5 for CMC250. The same trends areobserved for CMC90.
When kc decreases, the gyration radius increases and themain peak of the radial distribution function, at the firstneighbor distance, becomes larger. This means that there ismore and more superposition and detachment between thepolymer beads. Values of kc lower than 0.01 N m−1 are toosmall to maintain the beads attached together. On the opposite,for kc = 10 N m−1, the gyration radius is very small. This can beattributed to the restructuring of the beads assembly. Indeed, asecond peak is found on the radial distribution function, at rij/
Table 4. Gyration Radii (Rg) Computed from Simulations,For Different Numbers of Beads Nc and Different IonicStrengths (I), with kc = 1 N m−1 and λ = 2a
CMCkind Nc Zc
Rg (nm) I = 5 × 10⁻³
mol L−1Rg (nm) I = 1 × 10⁻²
mol L−1
90 10 −38.7 24.8 (−8%) 22.0 (−13%)11 −35.2 25.6 (−5%) 22.6 (−10%)12 −32.3 27.4 (+1%) 24.6 (−2%)13 −29.8 28.4 (+5%) 25.3 (0%)14 −27.6 29.4 (+9%) 26.3 (+4%)
250 26 −41.3 47.6 (−9.7%) 42.3 (−12.6%)27 −39.8 46.0 (−12.7%) 40.9 (−5.5%)28 −38.4 46.6 (−11.6%) 41.6 (−14.0%)29 −37.0 48.9 (−7.2%) 43.9 (−9.3%)30 −35.8 48.2 (−8.5%) 43.3 (−10.5%)31 −34.6 48.4 (−8.2%) 43.5 (−10.1%)33 −32.5 49.5 (−6.0%) 44.7 (−7.6%)34 −31.6 50.9(−3.4%) 46.0 (−5.0%)36 −29.8 51.6 (−2.1%) 46.9 (−3.1%)39 −27.5 53.8 (+2.1%) 49.4 (−2.1%)
aThe errors, as compared to the radii estimated by Mark-Houwink’stheory, are reported in parentheses.
Table 5. Gyration Radii (Rg) Obtained for CMC90 (Nc1 =13) and CMC250 (Nc2 = 36) with I = 5 × 10⁻³ mol L−1, Zc =−29.8, and Different Values of kc
kc (N m−1) Rg (nm) Nc1 = 13 Rg (nm) Nc2 = 36
10 24.5 47.35 28.2 51.51 28.4 51.60.1 28.4 51.70.01 28.5 51.80.001 30.0 53.2
Figure 5. Bead−bead radial distribution functions (Gr) and simulationsnapshots for CMC250 and for different values of kc.
Langmuir Article
dx.doi.org/10.1021/la302135v | Langmuir 2012, 28, 10713−1072410718

(2ac) ≃ 1.45, and the simulation snapshot shows a beadorganization as in a “necklace with two rods of pearls”. For 0.01≤ kc ≤ 5 N m−1, the value of the gyration radius does not varymuch. In the following, we chose kc = 0.1 N m−1 in order tomaintain the beads attached and avoid any restructuring of thebead assembly.4.3. Polymer Diffusion. Simulations have been performed
with a single polymer (at I = 5 × 10⁻³ mol L−1) to determine itsdiffusion coefficient from the asymptotic behavior of the beadmean-square displacement: ⟨[ri(t) − ri(0)]
2⟩ = 6Dft. The valueof the diffusion coefficient is averaged over 50 simulations, eachlasting for 9 × 10⁻⁴ s. The values found are Df = 2.9 × 10⁻¹²
and 1.9 × 10⁻¹² m2 s−1 for CMC90 and CMC250, respectively.They are lower than the expected values (see Table 3).Therefore, in order to correctly describe the relative diffusionbetween silicon particles and polymers, the solvent viscosity asfelt by the polymer beads has been decreased to an effectivevalue (ηe). This trick enhances the polymer diffusion and isactually justified, as the drag force of the solvent on the CMCmolecules is strongly overestimated with the polymer chains ofour model, which are much thicker than in reality. Differentsimulations have been performed varying the value of ηe. It isfound that Df decreases as 1/ηe, which is consistent with eq 17.In the following, in order to have polymer diffusion coefficientsclose to the ones expected and given in Table 3, we chose ηe =0.215 × 10⁻³ and 0.2 × 10⁻³ Pa s for CMC90 and CMC250,respectively. We note that essentially the same effectiveviscosity accounts for both CMC90 and CMC250.The parameters chosen for the CMC simulation are finally
reported in Table 6. The gyration radii obtained for these
parameters are also given in Table 6. When compared to theexpected values reported in Table 3, errors lower than 6% arefound. Therefore, we estimate that these parameters provide asatisfactory description of the polymer behavior.
5. CMC/SILICON SYSTEM: SIMULATION RESULTSFor all the following, the simulated system is the one describedin section 2, i.e., the DS of the polymers is equal to 0.7, andthey bear, at natural pH, 289 and 803 negative charges forCMC90 and CMC250, respectively, and, at pH = 3, 119 and332 negative charges for CMC90 and CMC250, respectively.Simulations have been carried out in ionic strength
conditions that correspond experimentally to two differentamounts of CMC (0.03 wt % and 0.24 wt %; see Table 1).Please notice that, in contrast to the experiments, we arestudying adsorption of a small number of CMC molecules onsilicon particles. The effect of ionic strength is taken intoaccount in the simulations through the electrostatic inter-actions, and not through the number of CMC chains included.
Indeed, as the polymer chains used in this model are muchthicker than the real ones, it is not possible to include in thesimulations the correct amount of CMC.
5.1. Adhesion of a CMC Chain on a Silicon Particle.Brownian dynamics simulations have been performed with onesilicon particle and one CMC molecule initially placed in such away that one bead is adsorbed. Different values of the energy,εa, used in eq 9, have been tried. Simulations snapshots areshown in Figure 6.
At natural pH, the beads and the silicon particles are bothnegatively charged and adsorption is rendered possible by theLennard-Jones potential between silicon and beads. For thelowest ionic strength (which corresponds to 0.03 wt % ofCMC), the CMC molecules can adsorb on the silicon particleswhen εa is larger than 7kBT. For εa ≤ 7kBT, attraction betweenpolymer and silicon is not high enough to counter theelectrostatic repulsion between the polymer and the siliconparticles and so to maintain the adhesion of CMC on silicon. Itappears that, the higher εa is, the more numerous the contactsbetween beads and silicon are. For I = 4.59 × 10⁻³ mol L−1
(0.24 wt % of CMC), the CMC molecules can adsorb on thesilicon even for εa = 7kBT. This can be explained by thescreening of the electrostatic repulsions between the con-stituents since the ionic strength of the suspension is higher. AtpH = 3, the polymer adsorbs on the silicon, maximizing the
Table 6. Parameters Chosen for the CMC Simulation alongwith the Gyration Radii Found for the Two Kinds ofPolymer and Two Values of the Ionic Strengtha
I(mol L−1)
CMCkind Nc
kc(N m−1) ηe (Pa s)
Rg(nm) error
5 × 10⁻³ 90 13 0.1 0.215 × 10⁻³ 28.2 4.3%5 × 10⁻³ 250 36 0.1 0.200 × 10⁻³ 55.8 5.9%1 × 10⁻² 90 13 0.1 0.215 × 10⁻³ 25.1 ∼0%1 × 10⁻² 250 36 0.1 0.200 × 10⁻³ 49.1 1.4%
aThe error between these values and the expected gyration radiireported in Table 3 is also mentioned.
Figure 6. Snapshots of simulations with 1 CMC (in green) and 1silicon particle (in red) at t = 5 × 10⁻⁵ s as a function of εa = 7, 9, or 11kBT.
Langmuir Article
dx.doi.org/10.1021/la302135v | Langmuir 2012, 28, 10713−1072410719

number of contacts between beads and silicon. At this pH,affinity is good between polymer and silicon, becauseelectrostatic interactions are more screened and also becausebeads and silicon particles are oppositely charged. Inconclusion, since CMC adsorption is observed in theexperiments also at small amount of CMC, a value of εa ≥9kBT is retained for the model.In Figure 6, for the value εa = 9kBT, few beads of CMC250
are adsorbed on the particle. In ref 20, a Monte Carlo study isdone by Stoll et al. about the organization of a polyelectrolytearound an oppositely charged particle, which corresponds tothe present situation at pH = 3. For different ionic strengths,Stoll et al. have shown that solenoid conformations areachieved by increasing the chain stiffness (angular potential).To observe if such an organization appears in this study,simulations with CMC250 have been performed for a longerperiod of time. Results after 5 × 10⁻³ s are shown in Figure 7.
At pH = 3, the polymer adsorbs totally on the silicon particle(all beads are in contact with the particle) and no particularorder is observed. Nonadjacent beads can be in contact: theionic strength is high enough to reduce repulsions between thebeads. For CMC250 at natural pH with I = 5.71 × 10⁻⁴ molL−1 (0.03 wt % of CMC), it is observed that the CMC is nottotally adsorbed on the silicon particle and the extremities ofthe chain expand in the bulk. When the ionic strength isincreased up to the level corresponding to a CMC content of0.24 wt % (I = 4.59 × 10⁻³ mol L−1), the polymer can be totallyadsorbed on the silicon. Compared to the case correspondingto 0.03 wt % of CMC250 at natural pH, the higher ionicstrength allows a decrease in the repulsions between theconstituents, but repulsions between beads are still higher thanat pH = 3. Indeed, contrary to the cases at pH = 3, the polymeris not “packed” on the silicon, i.e., nonadjacent beads are neverfound in contact in the this case: CMC250 at natural pH for I =4.59 × 10⁻³ mol L−1 (0.24 wt % of CMC). In all thesimulations, no solenoid conformation of the CMC is observed.
For the cases at pH = 3, the obtained configurationscorrespond to the case of small stiffness of chains in ref 20.
5.2. Aggregation of Two Silicon Particles with OneCMC Chain. Brownian dynamics simulations have beenperformed with two silicon particles and one CMC molecule.Simulation snapshots are shown in Figure 8.
At pH = 3, it is observed that, for all the cases, the siliconparticles are aggregated by the polymer, which is consistentwith the sedimentation tests (see section 2.5). Nevertheless, atthis pH, silicon particles alone can aggregate together becauseof their small surface charges and because of the high ionicstrength. Aggregation is promoted by the polymer as follows:first, the polymer encounters one silicon particle where itadsorbs; then, it encounters the second silicon particle and italso adsorbs on it. The two particles are thus linked together bythe polymer. Then, the polymer rearranges itself near thecontact point between the particles to maximize the number ofcontacts between beads and particles (see Figure 8). In thesecases, beads are packed around the contact and nonadjacentones are found in contact.At natural pH, for the cases corresponding to 0.03 wt %, with
εa = 7kBT, particles are not linked together, which is consistentwith the fact that adsorption is not observed for εa = 7kBT andsilicon particles feel repulsive interactions. For εa > 7kBT, thesilicon particles are linked by the polymer (“bridgingaggregation”). For CMC90, the polymer is rolled around the
Figure 7. Snapshots of simulations with 1 CMC250 and 1 siliconparticle at t = 5 × 10⁻³ s and with εa = 9kBT: (a) at natural pH for I =5.71 × 10⁻⁴ mol L−1 (0.03 wt %); (b) at natural pH for I = 4.59 × 10⁻³
mol L−1 (0.24 wt %); (c) at pH = 3 for I = 2.13 × 10⁻² mol L−1 (0.03wt %); (d) at pH = 3 for I = 2.74 × 10⁻² mol L−1 (0.24 wt %).
Figure 8. Snapshots of simulations with 1 CMC and 2 silicon particlesat t = 5 × 10⁻⁴ s as a function of εa = 7, 9, or 11 kBT.
Langmuir Article
dx.doi.org/10.1021/la302135v | Langmuir 2012, 28, 10713−1072410720

contact. For CMC250, only a part of the polymer is rolled andthe rest of the chain spreads on both silicon particles. The factthat the long CMC250 chain does not reorganize entirely nearthe contact can be explained by the strong repulsion betweenthe beads. For a higher ionic strength corresponding to a largeramount of CMC (0.24 wt %) at natural pH, the silicon particlesare also linked together by the polymer which is placed inbetween them. For CMC250, the polymer is more confinednear the contact than for the case corresponding to 0.03 wt %but less than at pH = 3. The ionic strength is not high enoughto screen the electrostatic repulsions between beads.At natural pH, when no polymer is added, the silicon
suspension is stable, which is due to the high charge of theparticles. When polymers are added, the ionic strengthincreases and we can wonder if this would be sufficient toaggregate the silicon particles. To check this, simulations havebeen performed with two silicon particles without any polymerbut with the ionic strength corresponding to 0.03 wt % and0.24 wt %. No aggregation between particles has been found.Therefore, in the simulations, the increase of ionic strength inthis case is not able to provoke aggregation and, when εa ≥9kBT, aggregation between silicon particles is promoted by thepolymer links.5.3. CMC Adsorption Capacity on a Silicon Particle. In
experiment, it is found that CMC250 chains adsorb more onsilicon (in terms of mass adsorbed) than CMC90 chains,especially at natural pH and for the higher mass content ofCMC (0.24 wt %). Simulations have been done to verifywhether the same behavior is observed. Brownian dynamicssimulations are carried out with 1 silicon particle and 22polymers of CMC90 or 8 polymers of CMC250 in order tointroduce the same mass of polymer in both cases. Simulationsare done at natural pH and with an ionic strength I = 4.59 ×10⁻³ mol L−1, which corresponds to a weight percent of 0.24 wt% of CMC. During the simulations, the number of adsorbedpolymers tends to fluctuate. Therefore, this number obtained att = 5 × 10⁻⁵ s (time at which it does not vary a lot) is averagedover 3 simulations. Some simulation snapshots are shown inFigure 9 and the mass ratio (rw) between the adsorbed mass ofCMC250 and the adsorbed mass of CMC90 as a function of εais reported in Table 7. In simulations as in experiments, themass content of CMC250 adsorbed is found higher than theone of CMC90. The value of rw found in simulations with εa =9kBT is in good agreement with the experimental one: rw(exp)= 1.75. Thus, in the following, εa will be fixed at 9kBT.According to simulations, the fact that a greater mass ofCMC250 is adsorbed is due to the larger expansion in the bulkof the longer CMC250 chains than the one of the CMC90chains (see Figure 9).5.4. Simulation of a Larger CMC/Silicon System. Other
simulations have been performed with 4 silicon particles and 60CMC90 polymers or 22 CMC250 polymers. Simulation resultsare shown in Figure 10. At natural pH, the CMC is moredispersed in the bulk compared with the case at pH = 3, wherethe CMC molecules cover the silicon particles. There is lessadsorption of CMC at natural pH than at pH = 3 (see Figure11), which is in agreement with the experiments. In Figure 11b,except for the lower ionic conductivity, there is no difference inadsorption at the different ionic strengths. This may be due tothe fact that the saturation of the CMC adsorption is notobtained in these systems. All the CMC250 introduced in thesimulation is indeed adsorbed contrary to what happens withCMC90 at natural pH. Over the simulated time, except for the
case of natural pH with I = 5.71 × 10⁻⁴ mol L−1 (0.03 wt % ofCMC), it is observed that aggregation between silicon hasoccurred. This is in agreement with the sedimentation testswhich show an aggregation for these cases. For the casecorresponding to 0.03 wt % of CMC90 at natural pH, duringthe simulations it appears that some bridges can be made by thepolymer between the particles. However, adsorption of CMCon silicon is poor and the CMC adsorbs and desorbscontinually, which makes the bridges weak, and globally, noaggregates of silicon are really formed in our simulations. Thesimulated time is quite short; therefore, aggregation couldhappen over a longer time, since we have seen in section 5.2that two silicon particles can be linked by a CMC90 in theseconditions. The bridging phenomenon is much morepronounced with the CMC250. Indeed, as these chains arelonger, the probability of making bridges is higher and thebridges remain longer during the simulation. In this case, siliconcan be aggregated by the bridges between polymers. Thisobservation is consistent with the sedimentation tests, whichshow that aggregation is more pronounced at natural pH with0.03 wt % of CMC250 than with the same amount of CMC90.
Figure 9. Snapshots of simulations with 1 silicon particle and 22CMC90 molecules or 8 CMC250 molecules at t = 5 × 10⁻⁵ s (εa =9kBT): (a) with all the CMC90 polymers; (c) with only the CMC90adsorbed polymers; (b) with all the CMC250 polymers; (d) with onlythe CMC250 adsorbed. For visibility, the box was repeated in all thedirections. For (c) and (d), the individual chains of CMC are markedwith different colors.
Table 7. Numbers of CMC90 Polymers Adsorbed (N90adso)and CMC250 Polymers Adsorbed (N250adso) as a Functionof εa
a
εa N90adso N250adso rw
9 kBT 10.33 6.33 1.7011 kBT 10.66 6.00 1.5614 kBT 13.00 6.66 1.42
aThe mass ratio (rw) corresponds to the ratio of the adsorbed mass ofCMC250 over the adsorbed mass of CMC90 (the experimental ratiowas found at 1.75).
Langmuir Article
dx.doi.org/10.1021/la302135v | Langmuir 2012, 28, 10713−1072410721

6. CONCLUSIONA coarse-grained model has been developed for carboxyme-thylcellulose molecules. This model consists of dividing thepolymer into beads of large size, equal to its Kuhn’s length.Parameters of the model have been fixed in order to respect theexperimental gyration radius and the diffusion coefficient of onemolecule. This model has been used in Brownian dynamicssimulations to study experimental dilute suspensions composedof silicon particles and CMC. Particular attention was paid tothe effects of the pH, of the CMC chain length, and of the ionic
strength (parameter related to the CMC amount in theexperiments).Even if the model remains simple, simulations are found in
qualitative good agreement with experiments and allow someexplanations for the experimental observations. First, it wasfound experimentally that the ionic conductivity andaggregation increase as a function of the quantity of CMC.Simulations at natural pH have allowed us to discriminatebetween the effects of CMC bridging and those of ionicstrength on the aggregation.In simulations, when the CMC chains are longer, the
probability of making bridges between silicon particles ishigher; therefore, aggregation of silicon is promoted more,especially when few molecules of CMC are present, which isconsistent with sedimentation tests.In simulations as in experiments, adsorption of CMC on
silicon is stronger at pH = 3 than at natural pH. This isexplained by the combination of the effects of charges and ionicstrength.Finally, in the same experimental conditions, the mass of
adsorbed CMC250 is higher than the mass of adsorbedCMC90. In simulations, this trend is observed and can beexplained by the expansion of the long CMC250 chains in bulk.According to the results, the simple model used here seems
sufficient to understand the qualitative behavior of suspensionsand can help to understand the results of experiments.However, to improve the quantitative results, a betterunderstanding of the interactions between the constituentsand the use of more sophisticated models (but also more
Figure 10. Snapshots of simulations with 4 silicon particles and 60CMC90 or 22 CMC250 molecules at pH = 3 and at natural pH, at t =5 × 10⁻⁴ s, for 0.03 wt % and 0.24 wt % of CMC.
Figure 11. Mean number of polymers adsorbed as a function of time:(a) CMC90; (b) CMC250.
Langmuir Article
dx.doi.org/10.1021/la302135v | Langmuir 2012, 28, 10713−1072410722
cumbersome) are needed, which will be the subjects for futurework.Nevertheless, the model at hand already sheds some fairly
interesting light on unexplained results given in the literatureon the colloidal suspensions used to prepare compositeelectrodes and the subsequent battery behavior of the latter.As a matter of fact, the difference in the conformation of thesimulated CMC chains adsorbed on the silicon particles as afunction of the pH could explain why the Si/CMC-basedelectrodes prepared at pH 3 show a better cycling efficiency.14
Indeed, the more compact conformation at pH 3 would allowthe formation of a better barrier between the Si active mass andthe unstable liquid electrolyte. Another unexplained result is theability of a Si/CMC-based electrode to reversibly sustain thehuge variations in volume of the silicon particles upon theiralloying/dealloying with lithium (up to 300%).13,15 Indeed, thevolume variations are such that, when simply referring to theelongation at break of a CMC macroscopic film (10%), theelectrode should rapidly disintegrate upon cycling. However,simulations give a new picture of the details at the molecularscale of how the CMC chains bind together silicon particles.Because the CMC chains arrange themselves near the contactbetween the particles as shown in Figure 8, it appears here thatwith this kind of spring-like conformation the CMC chainscould more likely maintain bridges between moving siliconparticles. Furthermore, the better cyclability of silicon electro-des based on longer CMC15 can be interpreted from thesesimulations, since numerous bridges between particles can becreated with the longer CMC. The model developed hereintroduces important prospects for the design of new and moreefficient binders for lithium battery electrodes, as the effects ofthe rigidity of the polymer backbone, ionizable group density,chain length, as well as the active mass surface chemistry on thesuspension structure can now be predicted to some extent.
■ AUTHOR INFORMATIONCorresponding Author*E-mail: [email protected].
NotesThe authors declare no competing financial interest.
■ REFERENCES(1) Lestriez, B. Functions of polymers in composite electrodes oflithium ion batteries. C. R. Chim. 2010, 13, 1341−1350.(2) Ligneel, E.; Lestriez, B.; Hudhomme, A.; Guyomard, D. On theorigin of the pre-plastisizer effect of the composite electrode forlithium battery. Electrochem. Solid-State Lett. 2007, 10, A122−A126.(3) Porcher, W.; Lestriez, B.; Jouanneau, S.; Guyomard, D.Optimizing the surfactant for the aqueous processing of LiFePO4composite electrodes. J. Power Sources 2010, 195, 2835−2843.(4) Liu, W.-R.; Yang, M.-H.; Wu, H.-C.; Chiao, S.; Wu, N.-L.Enhanced cycle life of Si anode for Li-ion batteries by using modifiedelastomeric binder. Electrochem. Solid-State Lett. 2005, 8, A100−A103.(5) Lestriez, B.; Bahri, S.; Sandu, I.; Roue, L.; Guyomard, D. On thebinding mechanism of CMC in Si negative electrodes for Li-ionbatteries. Electrochem. Commun. 2007, 9, 2801−2806.(6) Li, J.; Lewis, R.; Dahn, J. Sodium carboxmethyl cellulose. Apotential binder for Si Negative Electrodes for Li-ion Batteries.Electrochem. Solid-State Lett. 2007, 10, A17−A20.(7) Kastner, U.; Hoffmann, H.; Donges, R.; Hilbig, J Structure andsolution properties of sodium carboxymethylcellulose. Colloids Surf., A1997, 123−124, 307−328.(8) Fujimoto, J.; Petri, D. Adsorption behavior of carboxymethylcel-lulose on amino-terminated surfaces. Langmuir 2001, 17, 56−60.
(9) Hoogendam, C.; de Keizer, A.; Stuart, M. C.; Bijsterbosch, B.;Batelaan, J.; van der Horst, P. Adsorption Mechanisms ofCarboxymethyl Cellulose on Mineral Surfaces. Langmuir 1998, 14,3825−3839.(10) Khraisheh, M.; Holland, C.; Creany, C.; Harris, P.; Parrolis, L.Effect of molecular weight and concentration on the adsorption ofCMC onto talc at different ionic strengths. Int. J. Miner. Process. 2005,75, 197−206.(11) Cuba-Chiem, L.; Huynh, L.; Ralston, J.; Beattie, D. In situparticle film ATR FTIR spectroscopy of carboxymethylcelluloseadsorption on talc: binding mechanism, pH effects and adsorptionkinetics. Langmuir 2008, 24, 8036−8044.(12) Wang, J.; Somasundaran, P. Adsorption and conformation ofcarboxymethyl cellulose at solid-liquid interfaces using spectroscopicAFM and allied techniques. J. Colloid Interface Sci. 2005, 291, 75−83.(13) Beattie, S.; Larcher, D.; Morcrette, M.; Simon, B.; Tarascon, J.-M. Si electrodes for Li-ion batteries−A new way to look at an oldproblem. J. Electrochem. Soc. 2008, 155, A158−A163.(14) Mazouzi, D.; Lestriez, B.; Roue, L.; Guyomard, D. Siliconcomposite electrode with high capacity and long cycle life. Electrochem.Solid-State Lett. 2009, 12, A215−A218.(15) Bridel, J.-S.; Azaïs, T.; Morcrette, M.; Tarascon, J.-M.; Larcher,D. In situ observation and long-term reactivity of Si/C/CMCcomposites electrodes for Li-ion batteries. J. Electrochem. Soc. 2011,158, A750−A759.(16) Zhu, M.; Park, J.; Sastry, A. Particle interaction and aggregationin cathode material of Li-ion batteries: a numerical study. J.Electrochem. Soc. 2011, 158, A1155−A1159.(17) Teraoka, I. Polymer Solutions: An Introduction to PhysicalProperties; Wiley-Interscience: New York, 2002.(18) Hoogendam, C.; de Keizer, A.; Stuart, M. C.; Bijsterbosch, B.;Smit, J.; van Dijk, J.; van der Horst, P.; Batelaan, J. Persistence lengthof carboxymethyl cellulose as evaluated from size exclusionchromatography and potentiometric titrations. Macromolecules 1998,31, 6297−6309.(19) Lide, D. Handbook of Chemistry and Physics, 89th ed.; CRCPress: Boca Raton, 2008−2009.(20) Stoll, S.; Chodanowski, P. Polyelectrolyte Adsorption on anOppositely Charged Spherical Particle. Chain Rigidity Effects.Macromolecules 2002, 35, 9556−9562.(21) Derjaguin, B.; Landau, L. Theory of the stability of stronglycharged lyophobic sols and of the adhesion of strongly chargedparticles in solutions of electrolytes. Acta Physicochim. URSS 1941, 14,633−662.(22) Verwey, E.; Overbeek, J. Theory of the Stability of LyophobicColloids; Elsevier: Amsterdam, 1948.(23) Truzzolillo, D.; Bordi, F.; Sciortino, F.; Sennato, S. Interactionbetween like-charged polyelectrolyte-colloid complexes in electrolytesolution: a Monte Carlo simulation study in the Debye-Huckelapproximation. J. Chem. Phys. 2010, 133, 024901.(24) Rosenfeld, Y. Adiabatic pair potential for charged particulates inplasmas and electrolytes. Phys. Rev. E 1994, 49, 4425−4429.(25) Russel, W.; Saville, D.; Schowalter, W. Colloidal Dispersions;Cambridge University Press: Cambridge, England, 1989.(26) Lyklema, J. Fondamentals of Interface and Colloid Science;Academic Press: London, 1991; Vol. 1.(27) Cappella, B.; Dietler, G. Force-distance curves by atomic forcemicroscopy. Surf. Sci. Rep. 1999, 34, 1−104.(28) P. Viravathana, D. M. Optical Trapping of Titania/Silica Core-Shell Colloidal Particles. J. Colloid Interface Sci. 2000, 221, 301−307.(29) Cerbelaud, M.; Videcoq, A.; Abelard, P.; Pagnoux, C.; Rossignol,F.; Ferrando, R. Heteroaggregation between Al2O3 submicrometerparticles and SiO2 nanoparticles: Experiments and simulation.Langmuir 2008, 24, 3001−3008.(30) Cerbelaud, M.; Videcoq, A.; Abelard, P.; Pagnoux, C.; Rossignol,F.; Ferrando, R. Self-assembly of oppositely charged particles in diluteceramic suspensions: predictive role of simulations. Soft Matter 2009,6, 370−382.
Langmuir Article
dx.doi.org/10.1021/la302135v | Langmuir 2012, 28, 10713−1072410723

(31) Arnold, C.; Ulrich, S.; Stoll, S.; Marie, P.; Holl, Y. Monte Carlosimulations of surfactant aggregation on adsorption on soft hydro-phobic particles. J. Colloid Interface Sci. 2011, 353, 188−195.(32) Allen, M.; Tildesley, D. Computer simulation of liquids; OxfordUniversity Press: Oxford, 1987.(33) Mannella, R.; Palleschi, V. Fast and precise algorithm forcomputer simulation of stochastic differential equations. Phys. Rev. A1989, 40, 3380−3386.(34) Stoll, S.; Buffle, J. Computer Simulation of Bridging FlocculationProcesses: the Role of Colloid to Polymer Concentration Ratio onAggregation kinetics. J. Colloid Interface Sci. 1996, 180, 548−563.(35) Wu, H.-S.; Ke, D.-Y. Molecular characterization of a copolymerof 2-allylphenoxyorganocyclotriphosphazene with styrene, methylmethacrylate and vinylbenzyl chloride. Polymer 1997, 38, 431−436.(36) Brandrup, J.; Immergut, E.; Grulke, E. Polymer Handbook, 4thed.; New-York, Wiley, 1999.(37) Yang, H.; Zhao, X.; Li, Z.; Yan, F. Molecular dynamicssimulations on crystallization of polyethylene/fullerene nanocompo-sites. J. Chem. Phys. 2009, 130, 074902.
Langmuir Article
dx.doi.org/10.1021/la302135v | Langmuir 2012, 28, 10713−1072410724