Composition of the Continental Crust
51
4.1 Composition of the Continental Crust RL Rudnick, University of Maryland, College Park, MD, USA S Gao, China University of Geosciences, Wuhan, People’s Republic of China and Northwest University, Xi’an, People’s Republic of China ã 2014 Elsevier Ltd. All rights reserved. This article is a revision of the previous edition article, volume 3, pp. 1–64, © 2003, Elsevier Ltd. 4.1.1 Introduction 1 4.1.1.1 What is the Continental Crust? 2 4.1.1.2 The Importance of Determining Crust Composition 3 4.1.2 The Upper Continental Crust 3 4.1.2.1 Surface Averages 3 4.1.2.2 Sedimentary Rocks and Glacial Deposit Averages 9 4.1.2.2.1 Sedimentary rocks 10 4.1.2.2.2 Glacial deposits and loess 12 4.1.2.3 An Average Upper-Crustal Composition 16 4.1.3 The Deep Crust 17 4.1.3.1 Definitions 18 4.1.3.2 Metamorphism and Lithologies 18 4.1.3.3 Methodology 18 4.1.3.4 The Middle Crust 19 4.1.3.4.1 Samples 19 4.1.3.4.2 Seismological evidence 22 4.1.3.4.3 Middle-crust composition 22 4.1.3.5 The Lower Crust 23 4.1.3.5.1 Samples 23 4.1.3.5.2 Seismological evidence 31 4.1.3.5.3 Lower-crust composition 32 4.1.4 Bulk Crust Composition 36 4.1.4.1 A New Estimate of Crust Composition 41 4.1.4.2 Intracrustal Differentiation 41 4.1.5 Implications of the Crust Composition 42 4.1.6 Earth’s Crust in a Planetary Perspective 44 4.1.7 Summary 45 Acknowledgments 45 References 45 4.1.1 Introduction The Earth is an unusual planet in our solar system in having a bimodal topography that reflects the two distinct types of crust found on our planet. The low-lying oceanic crust is thin ( 7 km on average), composed of relatively dense rock types such as basalt and is young (200 Ma old) (see Chapter 4.13 and 4.14). In contrast, the high-standing continental crust is thick ( 40 km on average), is composed of highly diverse lithologies (virtually every rock type known on Earth) that yield an average intermediate or ‘andesitic’ bulk composition (Taylor and McLennan (1985) and references therein), and contains the oldest rocks and minerals yet observed on Earth (currently the 4.0 Ga Acasta gneisses (Bowring and Williams, 1999) and 4.4 Ga detrital zircons from the Yilgarn Block, Western Australia (Wilde et al., 2001)), respectively. Thus, the continents preserve a rich geological history of our planet’s evolution and under- standing their origin is critical for understanding the origin and differentiation of the Earth. The origin of the continents has received wide attention within the geological community, with hundreds of papers and several books devoted to the topic (the reader is referred to the following general references for further reading: Taylor and McLennan (1985), Windley (1995), and Condie (1997). Knowledge of the age and composition of the continental crust is essential for understanding its origin. Patchett and Samson (2003) review the present-day age distribution of the continental crust and Kemp and Hawkesworth Chapter 4.11 review secular evolution of crust composition. Moreover, to understand fully the origin and evolution of continents requires an understanding of not only the crust, but also the mantle lithosphere that formed more-or-less contemporane- ously with the crust and translates with it as the continents move across the Earth’s surface. The latter topic is reviewed in Chapters 3.6 and 3.8. This chapter reviews the present-day composition of the continental crust, the methods employed to derive these estimates, and the implications of the continental crust Treatise on Geochemistry 2nd Edition http://dx.doi.org/10.1016/B978-0-08-095975-7.00301-6 1
Transcript of Composition of the Continental Crust

Tre
4.1 Composition of the Continental CrustRL Rudnick, University of Maryland, College Park, MD, USAS Gao, China University of Geosciences, Wuhan, People’s Republic of China and Northwest University, Xi’an, People’s Republic ofChina
ã 2014 Elsevier Ltd. All rights reserved.
This article is a revision of the previous edition article, volume 3, pp. 1–64, © 2003, Elsevier Ltd.
4.1.1 Introduction 14.1.1.1 What is the Continental Crust? 24.1.1.2 The Importance of Determining Crust Composition 34.1.2 The Upper Continental Crust 34.1.2.1 Surface Averages 34.1.2.2 Sedimentary Rocks and Glacial Deposit Averages 94.1.2.2.1 Sedimentary rocks 104.1.2.2.2 Glacial deposits and loess 124.1.2.3 An Average Upper-Crustal Composition 164.1.3 The Deep Crust 174.1.3.1 Definitions 184.1.3.2 Metamorphism and Lithologies 184.1.3.3 Methodology 184.1.3.4 The Middle Crust 194.1.3.4.1 Samples 194.1.3.4.2 Seismological evidence 224.1.3.4.3 Middle-crust composition 224.1.3.5 The Lower Crust 234.1.3.5.1 Samples 234.1.3.5.2 Seismological evidence 314.1.3.5.3 Lower-crust composition 324.1.4 Bulk Crust Composition 364.1.4.1 A New Estimate of Crust Composition 414.1.4.2 Intracrustal Differentiation 414.1.5 Implications of the Crust Composition 424.1.6 Earth’s Crust in a Planetary Perspective 444.1.7 Summary 45Acknowledgments 45References 45
4.1.1 Introduction
The Earth is an unusual planet in our solar system in having a
bimodal topography that reflects the two distinct types of crust
found on our planet. The low-lying oceanic crust is thin (�7 km
on average), composed of relatively dense rock types such as
basalt and is young (�200 Ma old) (see Chapter 4.13 and
4.14). In contrast, the high-standing continental crust is thick
(�40 km on average), is composed of highly diverse lithologies
(virtually every rock type known on Earth) that yield an average
intermediate or ‘andesitic’ bulk composition (Taylor and
McLennan (1985) and references therein), and contains the
oldest rocks and minerals yet observed on Earth (currently the
4.0 Ga Acasta gneisses (Bowring and Williams, 1999) and
4.4 Ga detrital zircons from the Yilgarn Block, Western Australia
(Wilde et al., 2001)), respectively. Thus, the continents preserve
a rich geological history of our planet’s evolution and under-
standing their origin is critical for understanding the origin and
differentiation of the Earth.
atise on Geochemistry 2nd Edition http://dx.doi.org/10.1016/B978-0-08-095975
The origin of the continents has received wide attention
within the geological community, with hundreds of papers
and several books devoted to the topic (the reader is referred
to the following general references for further reading: Taylor
and McLennan (1985), Windley (1995), and Condie (1997).
Knowledge of the age and composition of the continental
crust is essential for understanding its origin. Patchett and
Samson (2003) review the present-day age distribution of the
continental crust and Kemp and Hawkesworth Chapter 4.11
review secular evolution of crust composition. Moreover, to
understand fully the origin and evolution of continents
requires an understanding of not only the crust, but also the
mantle lithosphere that formed more-or-less contemporane-
ously with the crust and translates with it as the continents
move across the Earth’s surface. The latter topic is reviewed in
Chapters 3.6 and 3.8.
This chapter reviews the present-day composition of the
continental crust, the methods employed to derive these
estimates, and the implications of the continental crust
-7.00301-6 1

Figure 1 Map of continental regions of the Earth, including submerged continents. (Cogley (1984); reproduced by permission of AmericanGeophysical Union from Reviews of Geophysics and Space Physics, 1984, 22, 101�122).
2 Composition of the Continental Crust
composition for the formation of the continents, Earth differ-
entiation, and its geochemical inventories.
4.1.1.1 What is the Continental Crust?
In a review of the composition of the continental crust, it is
useful to begin by defining the region under consideration
and to provide some generalities regarding its structure. The
continental crust, as considered here, extends vertically from
the Earth’s surface to the Mohorovicic discontinuity, a jump in
compressional wave speeds from�7 km s�1 to�8 km s�1 that
is interpreted to mark the crust–mantle boundary. In some
regions the Moho is transitional rather than discontinuous
and there may be some debate as to where the crust–mantle
boundary lies (cf. Griffin and O’Reilly, 1987; McDonough
et al., 1991). The lateral extent of the continents is marked by
the break in slope on the continental shelf. Using this defini-
tion, �31% of continental area is submerged beneath the
oceans (Figure 1; Cogley, 1984), and is thus less accessible to
geological sampling. For this reason, most estimates of conti-
nental crust composition derive from exposed regions of the
continents. In some cases the limited geophysical data for
submerged continental shelves reveal no systematic difference
in bulk properties between the shelves and exposed continents;
the shelves simply appear to be thinned regions of the crust. In
other cases, such as volcanic rifted margins, the submerged
continent is characterized by high-velocity layers interpreted
to represent massive basaltic intrusions associated with conti-
nental breakup (Holbrook and Kelemen, 1993). Depending
on the extent of the latter type of continental margin (which is
yet to be quantified), crust compositional estimates derived
from exposed regions may not be wholly representative of the
total continental mass.
The structure of the continental crust is defined seismically
to consist of upper-, middle-, and lower crustal layers
(Christensen and Mooney, 1995; Holbrook et al., 1992;
Rudnick and Fountain, 1995). The upper crust is readily
accessible to sampling and robust estimates of its composition
are available for most elements (Section 4.1.2). These show
the upper crust to have a granodioritic bulk composition, to be
rich in incompatible elements, and generally depleted in com-
patible elements. The deeper reaches of the crust are more
difficult to study. In general, three probes of the deep crust
are employed to unravel its composition: (1) studies of high-
grade metamorphic rocks (amphibolite or granulite facies)
exposed in surface outcrops (Bohlen and Mezger, 1989) and,
in some cases, in uplifted cross-sections of the crust reaching
to depths of 20 km or more (Fountain et al., 1990a; Hart et al.,
1990; Ketcham, 1996; Miller and Christensen, 1994); (2) stud-
ies of granulite-facies xenoliths (foreign rock fragments) that
are carried from great depths to the Earth’s surface by fast-rising
magmas (see Rudnick (1992) and references therein); and
(3) remote sensing of lower crustal lithologies through seismic
investigations (Christensen and Mooney, 1995; Holbrook
et al., 1992; Rudnick and Fountain, 1995; Smithson,
1978) and surface heat-flow studies (see Chapter 4.2).
Collectively, the observations from these probes show that
the crust becomes more mafic with depth (Section 4.1.3). In
addition, the concentration of heat-producing elements drops
off rapidly from the surface downwards. This is due, in part, to
an increase in metamorphic grade but is also due to increasing
proportions of mafic lithologies (see Chapter 4.2). Thus, the
crust is vertically stratified in terms of its chemical
composition.
In addition to this stratification, the above studies also
show that the crust is heterogeneous from place to place,
with few systematics available for making generalizations
about crustal structure and composition for different tectonic
settings. For example, the crust of Archean cratons in some
regions is relatively thin and has low seismic velocities, suggest-
ing an evolved composition (e.g., Yilgarn craton (Drummond,
1988); Kaapvaal craton (Durrheim and Green, 1992; Niu and
James, 2002); and North China craton (Gao et al., 1998a,b)).
However, in other cratons, the crust is thick (40�50 km)

Composition of the Continental Crust 3
and the deep crust is characterized by high velocities, which
imply mafic bulk compositions (Wyoming craton (Gorman
et al., 2002) and Baltic shield (Luosto and Korhonen, 1986;
Luosto et al., 1990)). The reasons for these heterogeneities
are not fully understood and we return to this topic in
Section 4.1.3. Similar heterogeneities are observed for Prote-
rozoic and Paleozoic regions (see Rudnick and Fountain
(1995) and references therein). Determining an average com-
position of such a heterogeneous mass is difficult and, at first
glance, may seem like a futile endeavor. Yet it is just such
averages that allow insights into the relative contribution of
the crust to the whole Earth-chemical budget and the origin of
the continents. Thus, deriving average compositions is critical
to studies of the continents and the whole Earth.
4.1.1.2 The Importance of Determining Crust Composition
Although the continental crust constitutes only �0.6% by
mass of the silicate Earth, it contains a very large proportion
of incompatible elements (20–70%, depending on element
and model considered; Rudnick and Fountain (1995)),
which include the heat-producing elements and members of
a number of radiogenic-isotope systems (Rb�Sr, U�Pb,
Sm�Nd, Lu�Hf). Thus the continental crust factors promi-
nently in any mass-balance calculation for the Earth as a
whole and in estimates of the thermal structure of the Earth
(Sclater et al., 1980).
In addition, knowledge of the bulk composition of the crust
and determining whether this composition has changed
through time is important for: (1) understanding the processes
by which the crust is generated and modified and (2) deter-
mining whether there is any secular evolution in crust genera-
tion and modification processes (see Chapter 4.11). The latter
has important implications for the evolution of our planet as
a whole.
In this chapter we review the composition of the upper,
middle, and lower continental crust (Sections 4.1.2 and
4.1.3). We then examine the bulk crust composition and the
implications of this composition for crust generation and
modification processes (Sections 4.1.4 and 4.1.5). Finally,
we compare the Earth’s crust with those of the other terrestrial
planets in our solar system (Section 4.1.6) and speculate about
what unique processes on Earth have given rise to this unusual
crustal distribution.
4.1.2 The Upper Continental Crust
The upper continental crust, being the most accessible part of
our planet, has long been the target of geochemical investiga-
tions (Clarke, 1889). There are two basic methods employed to
determine the composition of the upper crust: (1) establishing
weighted averages of the compositions of rocks exposed at the
surface and (2) determining averages of the composition
of insoluble elements in fine-grained clastic sedimentary
rocks or glacial deposits and using these to infer upper-crust
composition.
The first method was utilized by F. W. Clarke and colleagues
over a century ago (Clarke, 1889; Clarke and Washington,
1924) and entails large-scale sampling and weighted averaging
of the wide variety of rocks that crop out at the Earth’s surface.
All major-element (and a number of soluble trace elements)
determinations of upper-crust composition rely upon this
method.
The latter method is based on the concept that the process
of sedimentation averages wide areas of exposed crust. This
method was originally employed by Goldschmidt (1933) and
his Norwegian colleagues in their analyses of glacial sediments
to derive average composition of the crystalline rocks of the
Baltic shield and has subsequently been applied by a number
of investigators, including the widely cited work by Taylor and
McLennan (1985) to derive upper-crust composition for insol-
uble trace elements. In the following sections we review the
upper-crust composition determined from each of these
methods, then provide an updated estimate of the composi-
tion of the upper crust.
4.1.2.1 Surface Averages
In every model for the composition of the upper-continental
crust, major-element data are derived from averages of the
composition of surface exposures (Table 1). Several surface-
exposure studies have also provided estimates of the average
composition of a number of trace elements (Table 2). For
soluble elements that are fractionated during the weathering
process (e.g., sodium, calcium, strontium, barium, etc.), this is
the only way in which a reliable estimate of their abundances
can be obtained.
The earliest of such studies was the pioneering work of
Clarke (1889), who, averaging hundreds of analyses of ex-
posed rocks, determined an average composition for the crust
that is markedly similar to present-day averages of the bulk
crust (cf. Tables 1 and 9). Although Clarke’s intention was to
derive the average crust composition, his samples are limited to
the upper crust; there was little knowledge of the structure of
the Earth when these studies were undertaken; oceanic crust
was not distinguished as different from continental and the
crust was assumed to be only 16 km thick. Clarke’s values are,
therefore, most appropriately compared to upper crustal esti-
mates. Later, Clarke, joined by H. S. Washington, used a larger
data set to determine an average composition of the upper-
crust that is only slightly different from his original 1889
average (Clarke and Washington, 1924; Table 1). Compared
to more recent estimates of upper-crust composition, these
earliest estimates are less evolved (lower silicon, higher iron,
magnesium, and calcium), but contain similar amounts of the
alkali elements, potassium and sodium.
The next major undertakings in determining upper-crust
composition from large-scale surface sampling campaigns did
not appear until twenty years later in studies centered on the
Canadian, Baltic, and Ukranian Shields. It is these studies that
form the foundation on which many of the more recent esti-
mates of upper-crust composition are constructed (e.g., Taylor
and McLennan, 1985; Wedepohl, 1995).
Shaw et al. (1967, 1976, 1986) and Eade and Fahrig (1971,
1973) independently derived estimates for the average compo-
sition of the Canadian Precambrian shield. Both studies cre-
ated composites from representative samples taken over large
areas that were weighted to reflect their surface outcrop area.
The estimates of Shaw et al. are based on a significantly smaller

Table 1 Major element compositiona (in weight percent oxide) of the upper continental crust. Columns 1�9 represent averages of surface exposures and glacial clays. Columns 10�11 are derivativecompositions from these data. Column 12 shows our recommended values
Element 1Clarke(1889)
2Clarke andWashington(1924)
3Goldschmidt(1933)
4Shaw et al.(1967)
5Fahrig and Eade(1968)
6Ronov andYaroshevskiy(1976)
7Condie(1993)
8Gao et al.(1998a)b
9Borodin(1998)
10Taylor andMcLennan(1985)
11Wedepohl(1995)
12ThisStudy c
SiO2 60.2 60.30 62.22 66.8 66.2 64.8 67.0 67.97 67.12 65.89 66.8 66.62TiO2 0.57 1.07 0.83 0.54 0.54 0.55 0.56 0.67 0.60 0.50 0.54 0.64Al2O3 15.27 15.65 16.63 15.05 16.10 15.84 15.14 14.17 15.53 15.17 15.05 15.40FeOd
T 7.26 6.70 6.99 4.09 4.40 5.78 4.76 5.33 4.94 4.49 4.09 5.04MnO 0.10 0.12 0.12 0.07 0.08 0.10 0.10 0.00 0.07 0.07 0.10MgO 4.59 3.56 3.47 2.30 2.20 3.01 2.45 2.62 2.10 2.20 2.30 2.48CaO 5.45 5.18 3.23 4.24 3.40 3.91 3.64 3.44 3.51 4.19 4.24 3.59Na2O 3.29 3.92 2.15 3.56 3.90 2.81 3.55 2.86 3.21 3.89 3.56 3.27K2O 2.99 3.19 4.13 3.19 2.91 3.01 2.76 2.68 3.01 3.39 3.19 2.80P2O5 0.23 0.31 0.23 0.15 0.16 0.16 0.12 0.16 0.00 0.20 0.15 0.15Mg# 53.0 48.7 46.9 50.1 47.4 48.1 47.9 46.7 43.2 46.6 50.1 46.7
aMajor elements recast to 100% anhydrous.bCarbonate-free estimate.cSee Table 3 for derviation of this estimate.dTotal Fe as FeO.
Mg#¼molar 100�Mg/(MgþFetot).
4Com
positionof
theContinental
Crust

Table 2 Estimates of the trace-element composition of the upper continental crust. Columns 1–4 represent averages of surface exposures. Columns 5–8 are estimates derived from sedimentary andloess data. Column 9 is a previous estimate, where bracketed data are values derived from surface exposure studies. Column 10 is our recommended value (see Table 3)
Element Units 1Shaw et al.(1967, 1976)
2Eade andFahrig (1973)
3Condie(1993)
4Gao et al.(1998a)a
5Sims et al.(1990)
6Plank andLangmuir(1998)
7Peucker-Eherenbrinkand Jahn (2001)
8Taylorand McLennan(1985, 1995)
9Wedepohl(1995)b
10ThisStudyc
Li mg g�1 22 20 20 [22] 21Be ” 1.3 1.95 3 3.1 2.1B ” 9.2 28 15 17 17N ” 83 83F ” 500 561 611 557S ” 600 309 953 621Cl ” 100 142 640 370Sc ” 7 12 13.4 15 13.6d [7] 14.0V ” 53 59 86 98 107d [53] 97Cr ” 35 76 112 80 85d [35] 92Co ” 12 18 17 17d [12] 17.3Ni ” 19 19 60 38 44d [19] 47Cu ” 14 26 32 25 [14] 28Zn ” 52 60 70 71 [52] 67Ga ” 14 18 17 [14] 17.5Ge ” 1.34 1.6 1.4 1.4As ” 4.4 5.1 1.5 2 4.8Se ” 0.15 0.05 0.083 0.09Br ” 1.6 1.6Rb ” 110 85 83 82 112 110 84Sr ” 316 380 289 266 350 [316] 320Y ” 21 21 24 17.4 22 [21] 21Zr ” 237 190 160 188 190 [237] 193Nb ” 26 9.8 12 13.7 12d [26] 12Mo ” 0.78 1.2 1.5 1.4 1.1Ru ng g�1 0.34 0.34Pd ” 1.46 0.52 0.5 0.52Ag ” 55 50 55 53Cd mg g�1 0.075 0.079 0.098 0.102 0.09In ” 0.05 0.061 0.056Sn ” 1.73 5.5 2.5 2.1Sb ” 0.3 0.45 0.2 0.31 0.4I ” 1.4 1.4Cs ” 3.55 7.3 4.6d 5.8 4.9Ba ” 1070 730 633 678 550 668 624La ” 32.3 71 28.4 34.8 30 [32.3] 31Ce ” 65.6 57.5 66.4 64 [65.7] 63Pr ” 7.1 6.3 7.1
(Continued)
Com
positionof
theContinental
Crust
5

Table 2 (Continued)
Element Units 1Shaw et al.(1967, 1976)
2Eade andFahrig (1973)
3Condie(1993)
4Gao et al.(1998a)a
5Sims et al.(1990)
6Plank andLangmuir(1998)
7Peucker-Eherenbrinkand Jahn (2001)
8Taylorand McLennan(1985, 1995)
9Wedepohl(1995)b
10ThisStudyc
Nd ” 25.9 25.6 30.4 26 27Sm ” 4.61 4.59 5.09 4.5 4.7 4.7Eu ” 0.937 1.05 1.21 0.88 0.95 1.0Gd ” 4.21 3.8 2.8 4.0Tb ” 0.481 0.66 0.82 0.64 [0.5] 0.7Dy ” 2.9 3.5 [2.9] 3.9Ho ” 0.62 0.8 [0.62] 0.83Er ” 2.3 2.3Tm ” 0.33 0.30Yb ” 1.47 1.91 2.26 2.2 [1.5] 2.0Lu ” 0.233 0.32 0.35 0.32 [0.27] 0.31Hf ” 5.8 4.3 5.12 5.8 [5.8] 5.3Ta ” 5.7 0.79 0.74 0.96 1.0d 1.5 0.9W ” 0.91 3.3 2 1.4 1.9Re ng g–1 0.198 0.4 0.198Os ” 0.031 0.05 0.031Ir ” 0.02 0.022 [0.02] 0.022Pt ” 0.51 0.5Au ” 1.81 1.24 [1.8] 1.5Hg mg g–1 0.096 0.0123 0.056 0.05T1 ” 0.524 1.55 0.75 0.75 0.9Pb ” 17 18 17 18 17d 17 17Bi ” 0.035 0.23 0.13 0.123 0.16Th ” 10.3 10.8 8.6 8.95 10.7 [10.3] 10.5U ” 2.45 1.5 2.2 1.55 2.8 [2.5] 2.7
aCarbonate-free estimate.bWedepohl’s upper crust is largely derived from the Canadian Shield composites of Shaw et al. (1967, 1976). Values taken directly from Shaw et al. are shown in brackets.cSee Table 3 for derviation of this estimate.dUpdated in McLennan (2001b).
6Com
positionof
theContinental
Crust

Si(a) Al
1.4
1.2
1
0.8
0.6
Nor
mal
ized
to
UC
R a
nd G
Shaw et al.Eade and FahrigTaylor and McLennan
(b)
1.4
1.2
1
0.8
0.6
Nor
mal
ized
to
UC
R a
nd G
BorodinCondie
Ronov and YaroshevskyGao et al.
KNaCaMgFe
Si Al KNaCaMgFe
Figure 2 Comparison of different models for the major-element composition of the upper continental crust. All values normalized to the newcomposition provided in Table 3. Gray shaded field represents�10% variation from this value. (a) Compositions derived from Canadian Shield samples(Shaw et al., 1967, 1976, 1986; Fahrig and Eade, 1968; Eade and Fahrig, 1971, 1973) and the Taylor and McLennan model (1985, 1995, as modified byMcLennan, 2001b). (b) Compositions derived from surface sampling of the former Soviet Union (Ronov and Yaroshevsky, 1967, 1976; Borodin, 1998)and China (Gao et al., 1998a) and a global compilation of upper crustal rock types weighted in proportion to their areal distribution (Condie, 1993). TheCanadian shield averages appear to be more evolved (having lower Mg, Fe, and higher Na and K) than other estimates.
Composition of the Continental Crust 7
number of samples than that of Eade and Fahrig’s (i.e., �430
versus �14 000) and cover different regions of the shield, but
the results are remarkably similar (Figure 2). All major ele-
ments agree to within �10% except for CaO, which is �20%
higher, and MnO, which is 15% lower in the estimates of
Shaw et al.
Shaw et al. (1967, 1976, 1986) also measured a number of
trace elements in their shield composites and these are com-
pared to the smaller number of trace elements determined by
Eade and Fahrig in Table 2 and Figure 3. As might be
expected, considering the generally greater variability in
trace-element concentrations and the greater analytical chal-
lenge, larger discrepancies exist between the two averages. For
example, scandium, chromium, copper, lanthanum, and ura-
nium values vary by �50% or more. In some cases this may
reflect compromised data quality (e.g., lanthanum was deter-
mined by optical-emission spectroscopy in the Eade and
Fahrig study) and in other cases it may reflect real differences
in the composition between the two averages. However, for a
number of trace elements (e.g., vanadium, nickel, zinc, ru-
bidium, strontium, zirconium, and thorium), the averages
agree within 30%.
In a similar study, Ronov and Yaroshevsky (1967, 1976)
determined the average major-element composition of the
upper crust based on extensive sampling of rocks from the
Baltic and Ukranian shields and the basement of the Russian
platform (Table 1). While the SiO2, Al2O3, and K2O values fall
within 5% of those of the average Canadian Shield, as
determined by Eade and Fahrig (1971, 1973), FeOT, MgO,
and CaO are �10�30% higher, and Na2O is �30% lower
than the Canadian average, suggesting a slightly more mafic
composition.
The generally good correspondence between these indepen-
dent estimates of the composition of shield upper crust lends
confidence in the methodologies employed. However, ques-
tions can be raised about how representative the shields are of
the global upper continental crust. For example, Condie
(1993) suggests that shield averages may be biased because
(1) shields are significantly eroded and thus may not be repre-
sentative of the 5–20 km of uppermost crust that has been
removed from them and (2) they include only Precambrian
upper crust and largely ignore any Phanerozoic contribution to
upper crust. Condie (1993) derived an upper-crust composi-
tion based on over 3000 analyses of upper crustal rock types
weighted according to their distributions on geologic maps
and stratigraphic sections, mainly covering regions of North
America, Europe, and Australia. He utilized two methods in
calculating an average upper-crust composition: (1) using the
map distributions, irrespective of level of erosion and (2) for
areas that have been significantly eroded, restoring the eroded
upper crust, assuming it has a ratio of supracrustal rocks to
plutonic rocks similar to that seen in uneroded upper crustal
regions. The latter approach was particularly important for his
study, as one of his primary objectives was to evaluate whether
there has been any secular change in upper crust composition.
However, in this review, we are interested in the present-day

2.0
1.5
1.0
0.5
(c) (d)
(e) (f)
(a) (b)ScMn V Cr Co Ni Cu Zn
Transition metals
High field-strength
2.0
1.5
1.0
0.5
ZrTi
La
Pd Ag Cd In Sn Sb Au Hg
Ce Nd Sm Eu Gd Tb Yb Lu
Taylor and McLennan
Condie
Shaw Gao et al.
Hf
2.2 6.5
Nb Ta Mo W
2.0
1.5
1.0
0.50
0.0Li Rb Cs Be Sr Ba
Alkali and alkaline earth
2.0
1.5
1.0
0.5
Tl Pb Bi Th U
Actinides and heavy metals
Rare earth
2.0
1.5
1.0
0.5
Siderophile and chalcophile
Log scale
10
1.0
0.10
Eade and Fahrig
Figure 3 Comparison of different models for the trace-element composition of the upper-continental crust. All values normalized to the newcomposition provided in Table 3. Gray shaded field represents �20% variation from this value for all panels except (f), in which gray field representsa factor of two variation. Trace elements are divided into the following groups: (a) transition metals, (b) high-field strength elements, (c) alkali,alkaline-earth elements, (d) REEs, (e) actinides and heavy metals, and (f) highly siderophile and chalcophile elements (note log scale). Data fromTables 1 and 2; lanthanum estimate from Eade and Fahrig (1973) is omitted from panel D.
8 Composition of the Continental Crust
composition of the upper crust (eroded or not), so it seems
most appropriate to consider his ‘map model’ for comparisons
with other models (for a discussion of the secular evolution of
the continents, see Chapter 4.11).
Condie’s ‘map model’ is compared with other estimates of
the upper crust in Tables 1 and 2 and Figures 2 and 3. For
major elements, his upper crust composition is within 10% of
the Canadian Shield values of Eade and Fahrig. It is also within
10% of some of themajor elements estimated by Shaw, but has
generally higher magnesium and iron, and lower calcium and
potassium compared to Shaw’s estimate (Figure 2). Many trace
elements in Condie’s upper-crust composition are similar (i.e.,
within 20%) to those of Shaw’s Canadian Shield composites
(Figure 3), including the light rare-earth elements (LREEs),
strontium, yttrium, thorium, and uranium. However, several
trace elements in Condie’s average vary by�50% from those of
Shaw et al. (1967, 1976, 1986) as can be seen in the figure.
These include transition metals (scandium, vanadium, chro-
mium, and nickel), which are considerably higher in Condie’s
upper crust, and niobium, barium and tantalum, which are
significantly lower in Condie’s upper crust compared to
Shaw’s. These differences may reflect regional variations in
upper crust composition (i.e., the Canadian Shield is not rep-
resentative of the worldwide upper crust) or inaccuracies in
either of the estimates due to data quality or insufficiency. As
will be discussed below, it is likely that Condie’s values for
transition metals, niobium, tantalum, and barium are the
more robust estimates of the average upper crust composition.
A recent paper by Borodin (1998) provides an average
composition of the upper crust that includes much Soviet
shield and granite data not included in most other worldwide
averages. For this reason, it makes an interesting comparison
with other data sets. Like other upper crustal estimates, major
elements in the Borodin average upper crust (Table 1 and
Figure 2) fall within 10% of the Eade and Fahrig average for
the Canadian Shield, except for TiO2 and FeO, which are
�13% higher, and Na2O, which is �20% lower than the
Canadian average. Borodin’s limited trace element averages
(for chromium, nickel, rubidium, strontium, zirconium, nio-
bium, barium, lanthanum, thorium, and uranium – not given

Composition of the Continental Crust 9
in table or figures) fall within 50% of Shaw’s Canadian Shield
values except for niobium, which, like other upper crustal
estimates, is about a factor of 2 lower than the Canadian
average.
The most recent and comprehensive study of upper-crust
composition derived from surface exposures was carried out by
Gao et al. (1998a). Nine hundred and five composite samples
were produced from over 11 000 individual rock samples cov-
ering an area of 9.5 � 105 km2 in eastern China, which in-
cludes samples from Precambrian cratons as well as
Phanerozoic fold belts. The samples comprised both crystalline
basement rocks and sedimentary cover, the thickness of which
was determined from seismic and aeromagnetic data. Averages
were derived by combining compositions of individual map
units weighted according to their thicknesses (in the cases of
sedimentary cover) and areal exposure, for shields. The upper
crust is estimated to be �15 km thick based on seismic studies
(Gao et al., 1998a) and the crystalline rocks exposed at the
surface are assumed to maintain their relative abundance
through this depth interval. Average upper crust was calculated
both as a grand average and on a carbonate-free basis; carbon-
ates comprise a significant rock type (7�22%) in many of the
areas sampled (e.g., Yangtze craton). The grand average (in-
cluding carbonate) has a significantly different bulk composi-
tion than other estimates of the upper crust (Gao et al., 1998a;
Table 2). Most of the latter are derived from crystalline shields
and so a difference is expected. However, Condie’s map model
incorporates sedimentary cover as well as crystalline basement.
The differences between Condie’s map model and Gao et al.
grand-total upper crust suggest that the carbonate cover in
eastern China is thicker than most other areas. For this reason,
we use Gao et al. (1998a) carbonate-free compositions in
further discussions, but with the caveat that carbonates may
be an overlooked upper crustal component in many upper
crustal estimates.
The Gao et al. (1998a) major- and trace-element results are
presented in Tables 1 and 2 and plotted in Figures 2 and 3,
respectively. Unlike the model of Condie (1993), several of the
major elements fall beyond 10% of Eade and Fahrig’s
Canadian Shield data (Figures 2 and 3). These include TiO2,
FeO, MnO, and MgO, which are higher, and Na2O, which is
lower in the eastern China upper crust compared to the Cana-
dian Shield. Gao et al. (1998a) attribute these differences to
erosional differences between the two areas. Whereas the
Canadian Shield composites comprised mainly metamorphic
rocks of the amphibolite facies, the eastern China composites
contain large proportions of unmetamorphosed supracrustal
units that are considered to have, on average, higher propor-
tions of mafic volcanics. In this respect, the Gao et al. model
composition compares favorably to Condie’s map model and
the Russian estimates for all major elements. However, the
Na2O content of the eastern China upper crust is one of lowest
of all (�20% lower than Condie’s average and 10% lower than
Borodin’s values, but similar to Ronov and Yaroshevsky’s av-
erage) (Figure 2).
The trace-element composition estimated by Gao et al.
(1998a) for the Chinese upper crust is very similar to that of
Condie (1993). Like the latter model, many lithophile trace
elements in the Gao et al. model are within 50% of the
Canadian Shield averages of Shaw et al. (e.g., LREEs, yttrium,
rubidium, strontium, zirconium, hafnium, thorium, and ura-
nium), and the Chinese average has significantly higher tran-
sition metals and lower niobium, barium, and tantalum than
the Canadian Shield average. In addition, Gao et al. (1998a)
provide values for some of the less well-constrained element
concentrations. Of these, averages for lithium, beryllium, zinc,
gallium, cadmium, and gold fall within 40% of the Shaw et al.
averages, but boron, thallium, and bismuth are significantly
higher, andmercury is significantly lower in Gao’s average than
in Shaw’s. There is too little information for these elements in
general to fully evaluate the significance of these differences.
Two generalizations can be made from the above studies of
surface composites.
1. Major element data are very consistent from study to study,
with most major-element averages falling within 10% of
Eade and Fahrig’s Canadian Shield average. When differ-
ences do occur, they appear to reflect a lower percentage of
mafic lithologies in the Canadian averages: all other esti-
mates (including the Russian shield data) have higher FeO
and TiO2 than the Canadian averages and most also have
higher CaO and MgO (Figures 2 and 3). The Eade and
Fahrig average also has higher Na2O than all other estimates
(including Shaw’s estimate for the Canadian Shield).
2. Trace elements show more variation than major elements
from study to study, but some lithophile trace elements are
relatively constant: rare earth elements (REEs), yttrium, lith-
ium, rubidium, caesium, strontium, zirconium, hafnium,
lead, thorium, and uranium do not vary beyond 50% be-
tween studies. Transition metals (scandium, cobalt, nickel,
chromium, and vanadium) are consistently lower in the
Canadian Shield estimates than in other studies, which
may also be attributed to a lower percentage of mafic lithol-
ogies in the Canadian Shield (a conclusion supported by
studies of sediment composition, as discussed in the next
section). Barium is �40% higher in the Shaw et al. average
than in all other averages, including that of Eade and Fahrig,
suggesting that this value is too high. Finally, niobium and
tantalum are both about a factor of 2 higher in the Shaw
et al. average than in any other average, suggesting that the
former is not representative of the upper continental crust, a
conclusion reached independently by Plank and Langmuir
(1998) and Gallet et al. (1998) based on the composition of
marine sediments and loess (see next section).
4.1.2.2 Sedimentary Rocks and Glacial Deposit Averages
While the large-scale sampling campaigns outlined above are
the primary means by which the major-element composition
of the upper continental crust has been determined, many
estimates of the trace-element composition of the upper crust
rely on the natural wide-scale sampling processes of sedimen-
tation and glaciation. These methods are used primarily for
elements that are insoluble during weathering and are, there-
fore, transported quantitatively from the site of weathering/
glacial erosion to deposition. This methodology has been
especially useful for determining the REE composition of the
upper crust (see Taylor and McLennan (1985) and references
therein). The averages derived from each of these natural large-
scale samples are discussed in turn. When the upper crustal

10 Composition of the Continental Crust
concentration of elements is discussed, the element name is
printed in italic text so that the reader can quickly scan the text
to the element of interest.
4.1.2.2.1 Sedimentary rocksProcesses that produce sedimentary rocks include weathering,
erosion, transportation, deposition, and diagenesis. Elemental
fractionation during weathering is discussed in detail by Taylor
and McLennan (1985) (see also Chapters 7.1 and 9.1) and the
interested reader is referred to these works for more extensive
information. Briefly, elements with high solubilities in natural
waters (Figure 4) have greater potential for being fractionated
during sedimentary processing; thus, their concentration in
fine-grained sedimentary rocks may not be representative of
their source region. These elements include the alkali and
alkaline-earth elements as well as boron, rhenium, molybde-
num, gold, and uranium.
In contrast, a number of elements have very low solubilities
in waters. Their concentrations in sedimentary rocks may,
therefore, provide robust estimates of the average composition
of their source regions (i.e., average upper-continental crust).
Taylor and McLennan (1985) identified the REEs, yttrium,
scandium, thorium, and possibly cobalt as being suitably in-
soluble and thus providing useful information on upper crust
composition.
The REE patterns for post-Archean shales show striking
similarity worldwide (Figure 5): they are light REE enriched,
with a negative europium anomaly and relatively flat heavy
REEs. This remarkable consistency has led to the suggestion
10.0
8.0
6.0
4.0
2.0
Log
t
0.0
-2.0-10.0 -8.0
Fe
Th Al
Sc Co
PbY
Mn
Zn CGa
Si
CrTa
HfIn
Ge Tl
TiBe
SnZr
Nb
REE
-6.0
Lo
SolubleModerately solubleInsoluble
Figure 4 Plot of residence time (expressed as log t) against seawater uppeMcLennan, 1985).
that the REE patterns of shales reflect that of the average upper-
continental crust (Taylor and McLennan (1985) and references
therein). Thus, Taylor and McLennan’s (1985) upper crustal
REE pattern is parallel to average shale, but lower in absolute
abundances due to the presence of sediments with lower
REE abundances such as sandstones, carbonates, and
evaporites. Using a mass balance based on the proportions of
different types of sedimentary rocks, they derive an upper
crustal REE content that is 80% that of post-Archean average
shale.
Comparison of various upper crustal REE patterns is pro-
vided in Figure 5. All estimates, whether from shales, marine
sediments, or surface sampling, agree to within 20% for the
LREEs and �50% for the heavy rare-earth elements (HREEs).
The estimate of Shaw et al. (1976) has the lowest HREEs and if
these data are excluded, the HREEs agree to within 15% be-
tween the models of Condie (1993), Gao et al. (1998a), and
Taylor and McLennan (1985). Thus, the REE content of the
upper continental crust is established to within 10–25%, sim-
ilar to the uncertainties associated with its major-element
composition.
Once the REE concentration of the upper crust has been
established, values for other insoluble elements can be deter-
mined from their ratios with an REE. Using the constant ratios
of La / Th and La/Sc observed in shales, McLennan et al. (1980)
and Taylor and McLennan (1985) estimated the upper crustal
thorium and scandium contents at 11 ppm and 10.7 ppm, re-
spectively. The scandium value increased slightly (to
13.7 ppm) and the thorium value remained unchanged when
Ag
uNi
Cs
Sb
Rb
As
Mo
Ca
LiSr
B
Mg
Na
AuRe
K
U
Se
Cd
V
Bi
W
Ba
g Kysw
-4.0 -2.0 0.0
r crust partition coefficient (expressed as KswY ) (source Taylor and

1La Ce Pr
Shales and loessPAASNASCESECPAS
Loess
Nd Sm Eu Gd Tb Dy Ho Er Tm Yb Lu
10
Cho
ndrit
e no
rmal
ized
100
1000
1La(b)
(a)
Ce Pr
Upper crustShaw et al.Condie, Map
Taylor and McLennanWedepohlThis study
Gao et al.
Nd Sm Eu Gd Tb Dy Ho Er Tm Yb Lu
10
Cho
ndrit
e no
rmal
ized
100
1000
Figure 5 Comparison of REE patterns between (a) average post-Archean shales and loess and (b) various estimates of the uppercontinental crust composition. PAAS¼post-Archean Australian Shale(Taylor and McLennan, 1985); NASC¼North American shale composite(Haskin et al., 1966); ES¼European shale composite (Haskin andHaskin, 1966); ECPAS¼Eastern China post-Archean shale (Gao et al.,1998a). The loess range includes samples from China, Spitsbergen,Argentina, and France (Gallet et al., 1998; Jahn et al., 2001). Chondritevalues are from Taylor and McLennan (1985).
Composition of the Continental Crust 11
a more comprehensive sediment data set was employed by
McLennan (2001b). The sediment-derived scandium and tho-
rium averages agree to within 20% of the surface-sample aver-
ages (Table 2 and Figure 3).
Other insoluble elements include the high-field strength
elements (HFSEs – titanium, zirconium, hafnium, niobium,
tantalum, molybdenum, tungsten), beryllium, aluminum,
gallium, germanium, indium, tin, lead, and a number of
transition metals (chromium, cobalt, nickel, copper, and
zinc). Taylor and McLennan (1985) noted that some of these
insoluble elements (e.g., HFSEs) may be fractionated during
sedimentary processing if they reside primarily in heavy
minerals. More recent evaluations have suggested that this
effect is probably not significant for niobium and tantalum,
and fractionations of zirconium and hafnium due to heavy
mineral sorting are only really apparent in loess (Barth et al.,
2000; McLennan, 2001b; Plank and Langmuir, 1998). Plank
and Langmuir (1998) noted that the niobium, tantalum, and
titanium concentrations derived for the upper crust using
marine sediments are considerably different from those of
Taylor and McLennan’s upper continental crust composition.
As oceanic processes are unlikely to fractionate these elements,
Plank and Langmuir (1998) suggested that marine sediments
provide a reliable estimate of the average composition of the
upper continental crust. Using correlations between Al2O3 and
niobium, they derived a niobium concentration for the upper
crust of 13.7 ppm, and tantalum of 0.96 ppm (assuming Nb/
Ta¼14); these values are about a factor of 2 lower than Taylor
and McLennan’s (1985) upper crustal estimates. Taylor and
McLennan (1985) adopted their niobium value from Shaw
et al. (1976), and their tantalum value was derived by assum-
ing a Nb/Ta ratio of �12 for the upper crust. The Plank and
Langmuir niobium and tantalum values are similar to those
derived from the surface-sampling studies of Condie (1993),
Gao et al. (1998a), and Borodin (1998) and from more recent
evaluations of these elements in shales, loess and other terrig-
enous sedimentary rocks (Barth et al., 2000; Gallet et al., 1998;
McLennan, 2001b). All of these estimates range between
10 ppm and 14 ppm niobium and 0.74 ppm to 1.0 ppm
tantalum, an overall variation of �30%. Thus, niobium and
tantalum concentrations now appear to be nearly as well
constrained as the REE in the upper continental crust.
Plank and Langmuir (1998) also suggested, from their an-
alyses of marine sediments, increasing the upper crustal TiO2
values by �40% (from 0.5 wt% to 0.76 wt%). Thus the TiO2
content of the upper-continental crust probably lies between
0.55 wt% and 0.76 wt%, a difference of �30%.
Of the remaining insoluble elements, recent evaluation of
zirconium and hafnium concentrations derived from terrigenous
sediment (McLennan, 2001b) show no significant differences
with Taylor and McLennan’s estimates, whose upper crustal
zirconium value derives from the Handbook of Geochemistry
(Wedepohl, 1969–1978), with hafnium determined from an
assumed Zr/Hf ratio of 33. These values lie within�20% of the
surface-exposure averages (Table 2, Figure 3).
For the insoluble transition metals chromium, cobalt, and
nickel, McLennan’s (2001b) recent evaluation suggests approx-
imate factor of 2 increases in average upper crustal values over
those of Taylor and McLennan (1985). Taylor and McLennan’s
(1985) values were taken from a variety of sources (see Table 1
of Taylor and McLennan, 1981) and are similar to the Cana-
dian Shield averages, which appear to represent a more felsic
upper-crust composition, as discussed above. Even after elim-
inating these lower values, 30–40% variation exists for chro-
mium, cobalt, and nickel between different estimates (Table 2
and Figure 3), and the upper crustal concentrations of these
elements remains poorly constrained relative to REE.
McLennan (2001b) evaluated the upper crustal lead con-
centration from sediment averages and suggested a slight
(�15%) downward revision (17 ppm) from the value of
Taylor and McLennan (1985), whose value derives from a
study by Heinrichs et al. (1980). McLennan’s value is identical
to that of surface averages (Table 2) and collectively these
should be considered as a robust estimate for the lead content
of the upper crust. For the remaining insoluble elements –
beryllium, copper, zinc, gallium, germanium, indium, and tin –
no newer data are available for terrigenous sediment averages.
Estimates for some elements (e.g., zinc, gallium, germanium,
and indium) vary by only �20�30% between different

12 Composition of the Continental Crust
studies, but others (beryllium, copper, and tin) vary by a factor
of 2 or more (Table 2 and Figure 3).
It may also be possible to derive average upper crustal
abundances of elements that have intermediate solubilities
(e.g., vanadium, arsenic, silver, cadmium, antimony, caesium,
barium, tungsten, and bismuth) using their concentrations
in fine-grained sedimentary rocks, if they show significant
correlations with lanthanum. Using this method McLennan
(2001b) derived estimates of the upper crustal composition
for barium (550 ppm) and vanadium (107 ppm). McLennan’s
barium value does not differ from that of Taylor and
McLennan (1985), which derives from the Handbook of Geo-
chemistry (Wedepohl, 1969�1978). This value is �10% to a
factor of 2 lower than the shield estimates; 630�700 ppm
seems to be the most common estimate for barium from
surface exposures. McLennan’s vanadium estimate is �50%
higher than that of Taylor and McLennan (1985), which was
derived from a 50 : 50 mixture of basalt : tonalite (Taylor and
McLennan, 1981) and is similar to the Canadian Shield aver-
ages (Table 2). The revised vanadium value is similar to the
surface-exposure averages from eastern China (Gao et al.,
1998a) and Condie’s (1993) global average.
Several studies have used data for sedimentary rocks to
derive the concentration of caesium in the upper crust.
McDonough et al. (1992) found that a variety of sediments
and sedimentary rocks (including loess) have an Rb/Cs ratio of
19 (�11, 1s), which is lower than the value of 30 in Taylor and
McLennan’s (1985) upper crust. Using this ratio and assuming
a rubidium content of 110 ppm (from Shaw et al., 1986; Shaw
et al., 1976; Taylor and McLennan, 1981), led them to an
upper crustal caesium concentration of �6 ppm. Data for ma-
rine sediments compiled by Plank and Langmuir (1998) also
support a lower Rb/Cs ratio of the upper crust. Using the
observed Rb/Cs ratio of 15 and a rubidium concentration of
112 ppm, they derived an upper crustal caesium concentration
of 7.8 ppm. Although caesium data show only a poor correla-
tion with lanthanum, the apparent La/Cs ratio of sediments led
McLennan (2001b) to a revised caesium estimate of 4.6 ppm,
which yields an Rb/Cs ratio of 24. Very few data exist for
caesium from shield composites. Gao et al. determined a
value of 3.6 ppm caesium, which is very similar to the estimate
of Taylor and McLennan (1985). However, the Gao et al.
rubidium estimate (83 ppm) is lower than Taylor and
McLennan’s (112 ppm), leading to an Rb/Cs ratio of 23 in
the upper crust of eastern China. Caesium concentrations in
all estimates vary by up to 70% and there thus appears to
be substantial uncertainty in the upper crust’s caesium con-
centration. Further evidence for the caesium content of the
upper continental crust is derived from loess (see next section).
The upper crustal abundances of arsenic, antimony, and
tungsten were determined by Sims et al. (1990), based on
measurements of these elements in loess and shales. They
find As/Ce to be rather constant at 0.08, leading to an arsenic
content of 5.1�1 ppm. In a similar fashion they estimate the
upper crustal antimony content to be 0.45�0.08 ppm and
tungsten to be 3.3�1.1 ppm. The antimony and arsenic values
are factors of 2 and 3 higher, respectively, than the values given
by Taylor andMcLennan (1985), and the tungsten contents are
a factor of 2 lower than Taylor and McLennan’s (1985), which
were adopted from the Handbook of Geochemistry (Wedepohl,
1969–1978). For all three elements, the Sims et al. estimates lie
within uncertainty of the values given by Gao et al. (1998a) for
the upper crust of eastern China, and these new estimates can
thus be considered as representative of the upper crust to
within �30% uncertainty.
For the remaining moderately soluble elements silver,
cadmium, and bismuth, there are no data for sedimentary com-
posites. Taylor and McLennan (1985) adopted values from
Heinrichs et al. (1980) for cadmium and bismuth and from
the Handbook of Geochemistry (Wedepohl, 1969–1978) for sil-
ver. The only other data come from the study of Gao et al.
(1998a). So essentially there are only two studies that address
the concentrations of these elements in the upper crust: Gao
et al. (1998a) and Wedepohl (1995) (which incorporates data
from theHandbook of Geochemistry and Heinrichs et al. (1980)).
For silver and cadmium, the two estimates converge: silver is
identical and cadmium varies by 25% between Gao et al. and
Wedepohl et al. estimates. In contrast, bismuth shows a factor
of 2 variation, with the Gao et al. estimates being higher.
4.1.2.2.2 Glacial deposits and loessThe concept of analyzing glacial deposits in order to de-
termine average upper crustal composition originated with
Goldschmidt (1933, 1958). The main attraction of this
approach is that glaciers mechanically erode the rock types
that they traverse, giving rise to finely comminuted sediments
that represent averages of the bedrock lithologies. Because
the timescale between erosion and sedimentation is short,
glacial sediments experience little chemical weathering asso-
ciated with their transport and deposition. In support of
this methodology for determining upper crust composition,
Goldschmidt noted that the major-element composition of
composite glacial loams from Norway (analysed by Hougen
et al., 1925, as cited in Goldschmidt, 1933, 1958), which
sample �2 � 105 km2 of Norwegian upper crust, compares
favorably with the average igneous-rock composition deter-
mined by Clarke and Washington (1924) (Table 1). It would
take another fifty years before geochemists returned to this
method of determining upper crustal composition.
More recent studies using glacial deposits to derive average
upper-crust composition have focused on the chemical com-
position of loess – fine-grained eolian sediment derived from
glacial outwash plains (Taylor et al., 1983; Gallet et al., 1998;
Peucker-Ehrenbrink and Jahn, 2001; Hattori et al., 2003). This
can be accomplished in two ways: either using the average
composition of loess as representative of the upper continental
crust or, if an element correlates with an insoluble element
such as lanthanum whose upper concentration is well estab-
lished, using the average X/La ratio of loess (where ‘X’ is the
element of interest), and assuming an upper crustal lanthanum
value to determine the concentration of ‘X’ (e.g., McLennan,
2001b). In this and subsequent discussion of loess, we derive
upper crustal concentrations for particular elements using this
method and assuming an upper crustal lanthanum value of
31 ppm, and compare these to previous estimates for these
elements. The quoted uncertainty reflects 1s on that ratio.
Loess is rich in SiO2 (most carbonate-free loess has 73 wt%
to 80 wt% SiO2 (Taylor et al., 1983; Gallet et al., 1998), which
probably reflects both the preferential eolian transport of
quartz into loess and sedimentary recycling processes. This

Composition of the Continental Crust 13
enrichment causes other elemental concentrations to be di-
luted. In addition, some other elements may be similarly frac-
tionated during eolian processing. For example, loess shows
anomalously high concentrations of zirconium and hafnium
(Taylor et al., 1983; Barth et al., 2000), which, like the SiO2
excess, have been attributed to size sorting through eolian
concentration of zircon (Taylor et al., 1983). Thus, loess
Zr/La and Hf/La are enriched relative to the upper continental
crust and cannot be used to derive upper crustal zirconium and
hafnium concentrations. In addition, a recent study of rhe-
nium and osmium in loess suggests that osmium contents are
enhanced in loess compared to its source regions (Hattori
et al., 2003). This is explained by Hattori et al. (2003) as
being due to preferential sampling of the fine sediment frac-
tion by the wind, which may be enriched in mafic minerals
that are soft and hence more easily ground to finer, transport-
able particle sizes. Mafic-mineral enhancement could give rise
to similar fractionations between lanthanum and elements
that are found primarily in mafic minerals (e.g., nickel, vana-
dium, scandium, chromium, cobalt, manganese, etc.). In such
cases neither averages nor La/X ratios can be used to determine
a reliable estimate of upper crustal composition. However, it is
not apparent that eolian processing has significantly fraction-
ated incompatible elements from lanthanum (e.g., barium,
strontium, potassium, rubidium, niobium, thorium, etc.) that
are not hosted primarily in mafic minerals. Indeed, the close
correspondence of the thorium content of the upper crust
derived from loess La–Th correlations (10.5�1 ppm; Figure 6)
to that deduced from shales (10.7 ppm, Taylor and McLennan,
1985) suggests that upper crustal concentrations of these ele-
ments derived from loess La–X correlations are not signifi-
cantly affected by eolian processing.
Taylor et al. (1983), and later Gallet et al. (1998), deter-
mined the trace-element composition of a variety of loess
samples from around the world and found that their REE
patterns are remarkably constant and similar to that of average
shales (see previous section and Figure 5). Likewise, niobium,
tantalum, and thorium show strong positive correlations with
the REE (Figure 6; Barth et al., 2000; Gallet et al., 1998). Thus,
it appears that loess provides a robust estimate of average
upper crustal composition for insoluble, incompatible trace
elements.
Because loess is glacially derived, weathering effects are
significantly reduced compared to shales (Taylor et al., 1983),
raising the possibility that loess may provide robust upper
crustal estimates for the more soluble trace elements. However,
examination of the major-element compositions of loess
shows that all bear the signature of chemical weathering
(Gallet et al., 1998). Gallet et al. attributed this to derivation
of loess particles from rocks that had previously experienced
sedimentary differentiation. Likewise, Peucker-Ehernbrink and
Jahn (2001) noted a positive correlation between 87Rb/86Sr
and 87Sr/86Sr in loess, indicating that the weathering-induced
fractionation is an ancient feature, and therefore inherited
from the glacially eroded bedrocks. Even so, the degree of
weathering in loess, as measured by the ‘chemical index of
alteration’ (CIA¼molar Al2O3/(Al2O3þCaOþNa2OþK2O)
Nesbit and Young (1984)), is small relative to that seen in
shales (Gallet et al., 1998), and it is likely that loess would
provide a better average upper crustal estimate for moderately
soluble trace elements (e.g., arsenic, silver, cadmium, anti-
mony, caesium, barium, tungsten, and bismuth) than shales.
Unfortunately, few measurements of these elements in loess
are available (Barth et al., 2000; Gallet et al., 1998; Jahn et al.,
2001; Taylor et al., 1983). Barium data show a scattered, pos-
itive correlation with lanthanum, yielding an upper crustal
average of 510�139 ppm (Figure 6). This value of barium
concentration is similar to the one adopted by Taylor and
McLennan (1985) and is within the uncertainty of all the
other estimates save those of the Canadian Shield, which are
significantly higher (Table 2). Caesium also shows a positive,
scattered correlation with lanthanum, yielding an uncertain
upper crustal caesium content of 4.8�1.6 ppm, which is sim-
ilar to that recently suggested by McLennan (2001b). However,
caesium shows a better correlation with rubidium (Figure 7),
defining an Rb/Cs ratio of �17 in loess. Thus, if the upper
crustal rubidium concentration can be determined, better con-
straints on the caesium content can be derived.
The highly soluble elements (lithium, potassium, rubid-
ium, strontium, and uranium) show variable degrees of corre-
lation with lanthanum in loess. Strontium shows no
correlation with lanthanum, which is likely due to variable
amounts of carbonate in the loess samples (Taylor et al.,
1983). Teng et al. (2004) recently reported lithium contents
and isotopic compositions of shales and loess. Lithium con-
tents of loess show no correlation with lanthanum, but fall
within a limited range of compositions (17–41 ppm), yielding
an average of 29�10 ppm (n¼14). A similar value is derived
using the correlation observed between lithium and niobium
in shales. Thus, Teng et al. (2004) estimated the upper crustal
lithium content at 35�11 ppm, which is somewhat higher
than most previous estimates (Shaw et al., 1976; Taylor and
McLennan, 1985; Gao et al., 1998a).
Potassium and rubidium show scattered, positive correla-
tions with lanthanum (the Rb–La correlation is better, and the
K–La is worse than the Ba–La correlation) (Figure 6). These
correlations yield an upper crustal rubidium concentration of
84�17 ppm. This rubidium value is identical to those derived
from surface sampling by Eade and Fahrig (1973) , Condie
(1993) , and Gao et al. (1998a), but is lower than the widely
used value of Shaw et al. (1976) at 110 ppm. The latter
was adopted by both Taylor and McLennan (1985) and
Wedepohl (1995) for their upper crustal estimates. The
weak K–La correlation yields an upper crustal K2O value of
2.4�0.5 wt%. This is within error of the surface-exposure
averages of Fahrig and Eade (1968), Condie (1993), and
Gao et al. (1998a), but is lower than the Shaw et al. surface
averages of the Canadian shield (Shaw et al., 1967), values for
the Russian platform and the value adopted by Taylor
and McLennan (1985) based on K/U and Th/U ratios. The
loess-derived K/Rb ratio is 238, which is similar to the
‘well established’ upper crustal K/Rb ratio of 250 (Taylor and
McLennan, 1985). Because both potassium and rubidium
are highly soluble elements, and loess shows evidence for
some weathering, the potassium and rubidium contents de-
rived from loess are best viewed as minimum values for the
upper crust.
Uranium shows a reasonable correlation with lanthanum
(Figure 6), which yields an upper crustal uranium content
of 2.7�0.6 ppm. This value is within error of the averages

400.0
2.0
4.0
6.0
8.0
Cs
(pp
m)
60 80Rb (ppm)
Loess
r2= 0.36
100 120
Rb/Cs = 10
20
Figure 7 Rubidium versus caesium concentrations in loess samples.Short line is linear regression of data, thin, labeled lines representconstant Rb/Cs ratios. Symbols for crustal models and data sources as inFigure 6.
2
4
6
8
10
10 15 20 25
NbTh
30 35 40 10
10
5
15
15
20
20
25 30 35 40 45
10
800 120
100
80
60
40
20
700
600
500
400
300
200
10015 20 25 30 35 40 10 15 20 25 30 35 40 45
10
4.0
3.0
2.0
1.0
0.015 20 25 30 35
La (ppm) La (ppm)40 10 15 20 25 30 35 40 45
3.5
3.0
2.5
2.0
1.5
1.0
r2= 0.82
r2= 0.29
r2= 0.15 r2= 0.48
r2= 0.41
r2= 0.54
12
14
Ba
K2O U
Rb
Taylor and McLennan
This study
Gao et al.
Figure 6 Lanthanum versus moderately to highly soluble incompatible trace elements in loess. Although loess is derived in part from weatheredsource regions, the positive correlations suggest that weathering has not completely obliterated the original, upper crustal mixing trends. Linesrepresent linear fit to data. Various models for the average upper crustal composition are superimposed (Taylor and McLennan, 1995, as modified byMcLennan, 2001b; Gao et al., 1998a and this study – Table 3). (sources Taylor et al., 1983; Gallet et al., 1998; Barth et al., 2000; Jahn et al., 2001;Peucker-Ehernbrink and Jahn, 2001).
14 Composition of the Continental Crust
derived from surface exposures, except for the value of
Gao et al. (1998a) and Eade and Fahrig (1973), which are
distinctly lower. The loess-derived K/U ratio of 7400 is lower
than that assumed for the upper crust of 10 000 (Taylor and
McLennan, 1985), and may reflect some potassium loss due to
weathering, as discussed above.
Peucker-Ehrenbrink and Jahn (2001) analyzed loess in
order to determine the concentrations of the platinum-group
element (PGE) in the upper continental crust. To do this they
examined PGE-major-element trends and used previously de-
termined major-element compositions of the upper continen-
tal crust to infer the PGE concentrations (Table 2). Of the
elements analyzed (ruthenium, palladium, osmium, iridium,
and platinum), they found positive correlations for ruthenium,
palladium, osmium, and iridium with major and trace ele-
ments for which upper crustal values had previously been
established, leading to suggested upper crustal abundances of

Composition of the Continental Crust 15
340 ppt, 520 ppt, 31 ppt, and 22 ppt, respectively. They found
no correlation between platinum contents and other elements,
and so they simply used the average loess platinum content
(510 ppt) as representative of the upper continental crust.
We have estimated uncertainty on these values (shown in
Table 2) by using the 95% confidence limit on the correlations
Table 3 Recommended composition of the upper continental crust
Element Units Upper crust 1 Sigma % Sourcea
SiO2 wt% 66.6 1.18 2 1TiO2 ” 0.64 0.08 13 2Al2O3 ” 15.4 0.75 5 1FeOT ” 5.04 0.53 10 1MnO ” 0.10 0.01 13 1MgO ” 2.48 0.35 14 1CaO ” 3.59 0.20 6 1Na2O ” 3.27 0.48 15 1K2O ” 2.80 0.23 8 3P2O5 ” 0.15 0.02 15 1Li mg g�1 24 5 21 11Be ” 2.1 0.9 41 4B ” 17 8 50 4N ” 83 5F ” 557 56 10 4S ” 621 322 53 4Cl ” 370 382 103 4Sc ” 14.0 0.9 6 6V ” 97 11 11 6Cr ” 92 17 19 6Co ” 17.3 0.6 3 6Ni ” 47 11 24 6Cu ” 28 4 14 7Zn ” 67 6 9 7Ga ” 17.5 0.7 4 8Ge ” 1.4 0.1 9 4As ” 4.8 0.5 10 9Se ” 0.09 0.05 54 4Br ” 1.6 5Rb ” 84 17 20 10Sr ” 320 46 14 4Y ” 21 2 11 4Zr ” 193 28 14 4Nb ” 12 1 12 11Mo ” 1.1 0.3 28 12Ru ng g�1 0.34 0.02 6 13Pd ” 0.52 0.02 3 13
aSources: (1) Average of all surface exposure data from Table 1, excluding Shaw et al. (19
sediment-derived data from Plank and Langmuir (1998) and McLennan (2001b). (3) As (1)
values in Table 2, excluding Wedepohl (1995) value or Taylor and McLennan (1985) value
Wedepohl (1995). (6) Average of all surface composite data in Table 2, excluding Shaw et al
of all surface composite data in Table 2, excluding Shaw et al. (1976), and including Taylo
excluding Shaw et al. (1976) due to their fractionated Ga/Al ratio. (9) Average of sedimentar
Dervied from La/Rb correlation in loess (see text). Value is identical to surface exposure data
a factor of 2 lower than the latter and are not included in the average. (11) Average of all su
sediments and loess (Plank and Langmuir, 1998; Barth et al., 2000; McLennan, 2001b; Teng e
which derive from same source as Wedephol’s. (13) From Peucker-Ehrenbrink and Jahn (20
excluding Taylor and McLennan (1985), which is a factor of two higher than all other estimates
data in Table 2, excluding the Shaw et al. (1976) and including additional data from loess (s
plus correlation from Newsom et al. (1996), assuming W/Th¼0.2. (19) Average of all values
others. (20) From loess correlations with La (see text). Both values are within error of the avera
McLennan, 2001b).
published by Peucker-Ehrenbrink and Jahn (2001) and, for
platinum, the standard deviation of the mean (Table 3). Re-
cently, Hattori et al. (2003) suggested that preferential sampling
of mafic minerals in loess may lead to enhancement of PGE
and thus, loess-derived estimates may represent maximum con-
centrations for the upper crust. Based on samples of glacially
Element Units Upper crust 1 Sigma % Sourcea
Ag ng g�1 53 3 5 4Cd mg g�1 0.09 0.01 15 4In ” 0.056 0.008 14 4Sn ” 2.1 0.5 26 14Sb ” 0.4 0.1 28 12I ” 1.4 50 5Cs ” 4.9 1.5 31 15Ba ” 628 83 13 16La ” 31 3 9 4Ce ” 63 4 6 4Pr ” 7.1 4Nd ” 27 2 8 4Sm ” 4.7 0.3 6 4Eu ” 1.0 0.1 14 4Gd ” 4.0 0.3 7 4Tb ” 0.7 0.1 21 4Dy ” 3.9 17Ho ” 0.83 17Er ” 2.3 4Tm ” 0.30 17Yb ” 1.96 0.4 18 4Lu ” 0.31 0.05 17 4Hf ” 5.3 0.7 14 4Ta ” 0.9 0.1 13 11W ” 1.9 1 54 18Re ng g�1 0.198 13Os ” 0.031 0.009 29 13Ir ” 0.022 0.007 32 13Pt ” 0.5 0.5 95 13Au ” 1.5 0.4 26 4Hg mg g�1 0.05 0.04 76 4Tl ” 0.9 0.5 57 4Pb ” 17 0.5 3 4Bi ” 0.16 0.06 38 19Th ” 10.5 1.0 10 20U ” 2.7 0.6 21 20
67), which is replicated by Fahrig and Eade (1968). (2) As (1) above, but including
above, but also including K2O value derived from loess (see text). (4) Average of all
for Au, if it is derivitive from Shaw et al. (1976) and Taylor and McLennan (1985). (5)
. (1976), and including additional data from sediments (McLennan, 2001b). (7) Average
r and McLennan (1985) values. (8) Average of all surface composite data in Table 2,
y data from Table 2 (Sims et al., 1990) and Gao et al. (1998a) surface averages. (10)
except for the Shaw et al. (1976) values. Data from Handbook of Geochemistry are about
rface exposure data in Table 2 (minus Shaw et al. (1976), values) plus data from
t al., 2004). (12) Average of all data in Table 2, excluding Taylor and McLennan (1985),
01); see text for origin of error estimates. (14) Average of all data in Table 2,
. (15) Derived from Rb/Cs¼17 and upper crustal Rb value (see text). (16) Average of all
ee text). (17) Value interpolated from REE pattern. (18) Average of all values in Table 2,
in Table 2, excluding the Shaw et al. (1976) value, which is a factor of 5 lower than the
ge of all surface exposure data and other sedimentary data (Taylor and McLennan, 1985;

16 Composition of the Continental Crust
derived desert sands and glacial moraines, Hattori et al. (2003)
estimated an upper crustal osmium abundance of �10 ppt.
Prior to these studies, few estimates were available for the
PGE content of the upper continental crust. Peucker-
Ehrenbrink and Jahn’s loess-derived palladium value is similar
to the value published by Taylor and McLennan (1985), which
derives from the Handbook of Geochemistry (S. R. Taylor, per-
sonal communication), but is a factor of 3 smaller than that
determined by Gao et al. (1998a) for the upper crust of eastern
China. Peucker-Ehrenbrink and Jahn’s (2001) loess-derived
osmium abundance is �65% lower than the estimate of Esser
and Turekian (1993), which Peucker-Ehrenbrink and Jahn
attribute to the hydrogenous uptake of osmium by the riverine
sediments used in that study. Furthermore, the desert-sand
and glacial moraine-derived osmium value of Hattori et al.
(2003) is a factor of 3 lower than the estimate of Peucker-
Ehrenbrink and Jahn (2001). Peucker-Ehrenbrink and Jahn’s
(2001) loess-derived iridium content is the same as that pub-
lished for the Canadian Shield by Shaw et al. (1976). Thus, the
upper crustal concentration of some PGE may be reasonably
well constrained (e.g., palladium and iridium), while consid-
erable uncertainty remains for others (e.g., platinum and
osmium).
Rhenium is a highly soluble element that is easily leached
during weathering, so the rhenium abundances of loess cannot
be used directly to infer its upper crustal abundance. Following
Esser and Turekian (1993), Peucker-Ehrenbrink and Jahn
(2001) used the average 187Os/188Os ratio, osmium concentra-
tion, and average neodymium-model age of the crust to calcu-
late the rhenium content of the upper continental crust. Their
value (198 ppt) is about half that reported in Taylor and
McLennan (1985) and calculated by Esser and Turekian
(1993), who used the higher osmium abundance in their
calculation. Using a similar methodology and osmium-
isotopic composition, and the lower osmium abundance de-
termined for glacially derived desert sands, Hattori et al.
(2003) determined an upper crustal 187Re/188Os ratio of 35,
which (assuming an average neodymium model age of 2.2 Ga
for the crust) corresponds to a rhenium content of 74 ppt,
about a third of the concentration determined by Peucker-
Ehrenbrink and Jahn from loess data. Sun et al. (2003) used
the rhenium contents of undegassed arc lavas to estimate the
rhenium content of the bulk continental crust, assuming that
the crust grows primarily by arc accretion. Their value of
2.0�0.1 ppb is over an order of magnitude higher than
that estimated by Peucker-Ehrenbrink and Jahn (2001) and
Hattori et al. (2003) and is �5 times higher than the Esser
and Turekian (1993) and Taylor and McLennan (1985) values.
Because rhenium is a moderately incompatible element,
the rhenium concentration of the upper crust should be com-
parable to or higher than the bulk crust value (similar to
ytterbium). However, this extreme rhenium concentration
would require an order of magnitude higher osmium concen-
tration in the crust or an extremely radiogenic crust composi-
tion, neither of which are consistent with any current
estimates. Sun et al. (2003) suggest that rhenium may be lost
from the continents by either rhenium degassing during arc
volcanism or continental rhenium deposition into anoxoic
sediments that are recycled into the mantle. Thus the value of
2 ppb rhenium is a maximum value for the upper continental
crust and our knowledge of the rhenium content of the upper
crust remains uncertain.
4.1.2.3 An Average Upper-Crustal Composition
In Table 3 we present our best estimate for the chemical
composition of the upper continental crust. The footnote pro-
vides detailed information on how the value for each element
was derived. In general, major-element values represent aver-
ages of the different surface-exposure studies, and errors repre-
sent one standard deviation of the mean. Because two
independent studies are available for the Canadian Shield,
and because it appears the Canadian Shield has lower abun-
dances of mafic lithologies and higher abundances of sodium-
rich tonalitic–trondhjemitic granitic gneisses compared to other
areas (see Section 4.1.2.1), we include only values from one of
these studies – the Fahrig and Eade (1968) study, which encom-
passes a greater number of samples compared to that of Shaw
et al. (1967).We also incorporate TiO2 values derived from recent
sedimentary studies (McLennan, 2001b; Plank and Langmuir,
1998) and the K2O value from loess (Section 4.1.2.2) into the
upper crustal averages (note that including the latter value in
the average does not significantly change it). The standard devi-
ation for most major-element averages is 10% or less. Only the
ferromagnesian elements (iron, manganese, magnesium, and
titanium), Na2O, and P2O5 vary by up to 15%.
The trace-element abundances shown in Table 3 derive
from different methods depending on their solubility. For
most insoluble elements (see Section 4.1.2.2 and Figure 4
for definitions of solubility), we average the surface composites
in addition to sediment or loess-derived estimates to derive the
upper crustal composition. The uncertainty reported represents
1s from the mean of all estimates. For moderately and highly
soluble elements, we use the data derived from loess, if the
elements show correlations with lanthanum (r2>0.4), to infer
their concentrations. In this case, the error represents the SD of
the X/La ratio (where X is the element of interest). For elements
that show no or only a poor correlation with lanthanum in
loess and sediments (e.g., K2O, Li, Ba, and Sr), we use the
average of surface composites and sedimentary data (if some
correlations exist with lanthanum) to derive an average. In
most cases, the loess or sediment-derived values are within
error of the surface-composite averages and these are noted in
the footnote. Caesium is a special case. The loess caesium data
show a poor correlation with lanthanum, but good correlation
with rubidium. We thus use the observed Rb/Cs ratio of 17
(which is similar to the previous determination of this ratio in
sedimentary rocks (McDonough et al., 1992)) and the upper
crustal rubidium concentration of 84 ppm to derive the cae-
sium concentration of 4.9 ppm in the upper crust. The error on
this estimate derives from the standard deviation of the Rb/Cs
ratio. For some elements, only single estimates are available
(e.g., bromine, nitrogen, iodine), and these are adopted as
reported. The uncertainty of these estimates is likely to be very
high, but there is no way to estimate uncertainty quantitatively
with such few data. Remarkably, the SD on a large number of
trace elements is below 20%, and the concentrations of a few
(flourine, scandium, vanadium, cobalt, zinc, gallium, germa-
nium, arsenic, yttrium, niobium, LREEs, tantalum, lead, and
thorium) would appear to be known within �10% (Table 3).

Composition of the Continental Crust 17
However, in a number of these cases (e.g., flourine, cobalt,
gallium, germanium, and arsenic), the small uncertainties un-
doubtedly reflect the fact that there have been few independent
estimates made of the upper crust composition for these ele-
ments. It is likely that the true uncertainty for these elements is
considerably greater than expressed in Table 3.
The upper crustal composition in Table 3 has many simi-
larities to the widely used estimate of Taylor and McLennan
(1985, with recent revision by McLennan (2001b)), but also
some notable differences (Figure 8). Most of the elements that
vary by more than 20% from the estimate of Taylor and
McLennan are elements for which new data are recently avail-
able and few data exist overall (i.e., beryllium, arsenic, sele-
nium, molybdenum, tin, antimony, rhenium, osmium).
However, a number of estimates exist for K2O, P2O5, and
rubidium contents of the upper crust and our estimates are
significantly lower (by 20–40%) than Taylor and McLennan’s
upper crust. The difference in P2O5 may simply be due to
rounding errors. Taylor and McLennan (1985) report P2O5 of
0.2 wt% versus 0.15 wt% in our and other estimates of the
upper crust – Tables 2 and 3). Taylor and McLennan (1985)
derived their upper crustal K2O indirectly from thorium abun-
dances by assuming Th/U¼3.8 and K/U¼10 000. The result-
ing K2O value is the highest of any of the estimates (Table 2
and Figure 2). Likewise, Taylor and McLennan’s rubidium
value was determined from their K2O content, assuming a K/
Rb ratio of the upper crust of 250. Their rubidium concentra-
tion matches the Canadian Shield value of Shaw et al. (1976),
but is higher than all other surface-exposure studies, including
Fahrig and Eade’s Canadian Shield estimate (Table 2 and
Figure 3). In contrast, the remaining surface-exposure studies
match the rubidium value we derived from the loess Rb–La
correlation (Figure 6). We conclude that the upper crust may
have lower potassium and rubidium contents than estimated
by Taylor and McLennan (1985). This finding has implications
for total crustal heat production (see Section 4.1.4 and
Chapter 4.2).
2.0
1.8
1.6
1.4
1.2
1.0
0.8
0.6
0.4
0.2Ti
Si Al Mn Ca K Li B V Co Cu Ga As Rb Y Nb P
Fe Mg Na P Be Sc Cr Ni Zn Ge Se Sr Zr Mo
Ti Mn
As
Se
MRbBe
Upper continental crust
PK
Tayl
or &
McL
enna
n/R
udni
ck &
Gao
Figure 8 Plot of upper crustal compositional estimate of Taylor and McLenrecommended values from this study. Horizontal lines mark 20% variation. Mbounds are labeled. Of the elements that differ by over 20%, potassium andcommonly analyzed to high precision in crustal rocks.
4.1.3 The Deep Crust
The deep continental crust is far less accessible than the upper
crust and consequently, estimates of its composition carry a
greater uncertainty. Compared to the upper crust, the earliest
estimates of the composition of the deep crust are relatively
recent (i.e., 1950s and later) and derive from both seismolog-
ical and geological studies.
On the basis of observed isostatic equilibrium of the conti-
nents and a felsic upper crust composition, Poldervaart (1955)
suggested a two-layer crust with granodioritic upper crust un-
derlain by a basaltic lower crust. The topic of deep crustal
composition doesn’t seem to have been considered again
until �20 years later, when a series of works in the 1970 s
and 1980 s made significant headway into the nature of the
deep continental crust. On the basis of surface heat-flow, geo-
chemical studies of high-grade metamorphic rocks and seis-
mological data, Heier (1973) proposed that the deep crust is
composed of granulite-facies rocks that are depleted in heat-
producing elements. A similar conclusion was reached by
Holland and Lambert (1972) based on their studies of the Lewi-
sian complex of Scotland. Smithson (1978) used seismic reflec-
tions and velocities to derive both structure and composition of
the deep crust. He divided the crust into three, heterogeneous
regions: (1) an upper crust composed of supracrustal metamor-
phic rocks intruded by granites, (2) a migmatitic middle crust
and (3) a lower crust composed of a heterogenous mixture of
igneous and metamorphic rocks ranging in composition from
granite to gabbro, with an average intermediate (dioritic) com-
position. This three-layer model of the crust survives today in
most seismologically based studies. Weaver and Tarney (1980,
1981, 1984) derived a felsic and intermediate composition for
the Archeanmiddle and lower crust, respectively, based on stud-
ies of amphibolite to granulite-facies rocks exposed in the Lewi-
sian complex, Scotland. R. W. Kay and S. M. Kay (1981) were
one of the first to stress the importance of xenolith studies
to unravelling deep-crustal composition. They highlighted the
d Cd Sn Cs La Pr Sm Gd Dy Er Yb Hf W Os Au Pb Th
Ag In Sb Ba Ce Nd Eu Tb Ho Tm Lu Ta Re Ir Tl Bi U
o
SnRe
Os
Sb
nan (1995) (updated with values from McLennan, 2001b), divided byost elements fall within the �20% bounds; elements falling beyond theserubidium are probably the most significant, since these elements are

18 Composition of the Continental Crust
heterogeneous nature of the deep crust and suggested its com-
position should vary depending on tectonic setting, cautioning
against the use of singular cross sections or deep-crustal expo-
sures to derive global models. Taylor and McLennan (1985)
considered the lower crust to be the portion of the crust from
10 km depth to the Moho. Their ‘lower crust’ thus includes both
middle and lower crust, as usedhere (seeSection4.1.3.1). Taylor
andMcLennan’s (1985) lower-crust composition was derived by
subtracting the upper crust from their total-crust composition
(see Section 4.1.4). The Taylor and McLennan (1985) lower
crust is thus not based on observed lower crustal rock composi-
tions, but rather on models of upper- and total-crust composi-
tions and assumptions about the origin of surface heat flow.
More recent attempts to define deep crust composition have
relied upon linking geophysical data (principally seismic ve-
locities) to deep crustal lithologies and their associated com-
positions to derive the bulk composition of the deep crust as a
function of tectonic setting (Christensen and Mooney, 1995;
Rudnick and Fountain, 1995; Wedepohl, 1995; Gao et al.,
1998a,b). Despite the attendant large uncertainties in deriving
composition from velocity (Rudnick and Fountain, 1995;
Brittan and Warner, 1996, 1997; Behn and Kelemen, 2003)
and the lack of thorough geochemical sampling of the deep
crust in many regions, these efforts nevertheless provide the
best direct estimates of present-day deep crustal composition.
In this section we examine the composition of the deep
crust by first defining its structure and lithology and the
methods employed to determine deep crust composition. We
then examine observations on middle and lower crustal sam-
ples, average seismic velocities and the resulting models of
deep crust composition.
4.1.3.1 Definitions
Following recent compilations of the seismic-velocity structure
of the continental crust, we divide the deep crust into middle
and lower crust (Holbrook et al., 1992; Christensen and
Mooney, 1995; Rudnick and Fountain, 1995). Holbrook
et al. (1992) defined the middle crust as: (1) the middle-
third, where the velocity structure suggests a natural division
of the crust into thirds; (2) the region beneath the upper crust
and above a Conrad discontinuity, if there is a layer beneath
the Conrad; and (3) the region immediately beneath the Con-
rad if there are two distinct velocity layers beneath a Conrad
discontinuity. The lower crust is thus the layer beneath the
middle crust and above the Moho.
For a �40 km thick average global continental crust
(Christensen and Mooney, 1995; Rudnick and Fountain,
1995), the middle crust is 11 km thick and ranges in depth
from 12 km, at the top, to 23 km at the bottom (Gao et al.
(1998b) based on the compilations of data for crustal structure
in various tectonic settings by Rudnick and Fountain (1995)).
The average lower crust thus begins at 23 km depth and is
17 km thick. However, the depth and thickness of both middle
and lower crust vary from setting to setting. In fore-arcs, active
rifts, and rifted margins, the crust is generally thinner: middle
crust extends from 8 km to 17 km depth and lower crust from
17 km to 27 km depth. In Mesozoic–Cenozoic orogenic belts
the crust is thicker and middle crust extends from 16 km to
27 km depth and the lower crust from 27 km to 51 km depth
(Rudnick and Fountain, 1995).
4.1.3.2 Metamorphism and Lithologies
Studies of exposed crustal cross-sections and xenoliths indicate
that the middle crust is dominated by rocks metamorphosed
at amphibolite facies to lower granulite facies, while the lower
crust consists mainly of granulite facies rocks (Fountain
et al., 1990a; Fountain and Salisbury, 1981; Mengel et al.,
1991; Weber et al., 2002). However, exceptions to these gen-
eralities do occur. For thin crust in rifted areas, greenschist-
facies and amphibolite-facies rocks may predominate in
the middle and lower crust, respectively. In overthickened
Mesozic and Cenozoic orogenic belts (e.g., Alps, Andes, Tibet,
and Himalyas), and paleo-orogenic belts that now have
normal crustal thicknesses (e.g., Appalachains, Adirondacks,
Variscan belt), granulite-facies and eclogite-facies rocks may
be important constituents of the middle and lower crust
(Leech, 2001; LePichon et al., 1997; Lombardo and Rolfo,
2000). In contrast, amphibolite-facies lithologies may be pre-
sent in the deep crust of continental arcs (Aoki, 1971; Miller
and Christensen, 1994; Weber et al., 2002), where hydrous
fluids are fluxed from the subducting slab and the water con-
tents of underplating magmas are high.
Lithologically, both middle and lower crust are highly het-
erogeneous, as seen in surface exposures of high-grade meta-
morphic rocks, crustal cross-sections, and deep-crustal xenolith
suites. However, there is a general tendency for the middle
crust to have a higher proportion of evolved rock compositions
(as observed in cross-sections and granulite-facies terranes)
while the lower crust has a higher proportion of mafic rock
types (as observed in xenolith suites (Bohlen and Mezger,
1989)). Metasedimentary lithologies are often present, albeit
in small proportions. The exact proportions of felsic to mafic
lithologies in the deep crust varies from place to place and can
only be established through the study of crustal cross-sections
or inferred from seismic velocity profiles of the crust
(Christensen and Mooney, 1995; Rudnick and Fountain,
1995; Wedepohl, 1995; Gao et al., 1998b).
4.1.3.3 Methodology
There are three approaches to derive the composition of the
deep crust (see Rudnick and Fountain (1995) for a review).
1. By studying samples derived from the deep crust. These occur as
surface outcrops of high-grade metamorphic terranes (e.g.,
Bohlen and Mezger, 1989; Harley, 1989), tectonically
uplifted crustal cross-sections (e.g., Fountain and Salisbury,
1981; Percival et al., 1992), and as deep-crustal xenoliths
carried in volcanic pipes (Rudnick, 1992; Downes, 1993).
2. By correlating seismic velocities with rock lithologies
(Christensen and Mooney, 1995; Rudnick and Fountain,
1995; Wedepohl, 1995, Gao et al., 1998a,b).
3. From surface heat-flow measurements (see Chapter 4.2).
As pointed out by Jaupart and Mareschal (see Chapter 4.2),
surface heat flow is the only geophysical parameter that is a
direct function of crustal composition. In general, however,
heat flow provides only very broad constraints on deep-crust
composition due to the ambiguity involved in distinguishing
the amount of surface heat flow arising from crustal

Composition of the Continental Crust 19
radioactivity versus the Moho heat flux (see Chapter 4.2);
Rudnick et al., 1998). Most models of the deep-crust compo-
sition fall within these broad constraints. The exception is the
global model of Wedepohl, 1995, which produces more heat
than the average surface heat flow in the continents, thereby
allowing no mantle heat flux into the base of the crust
(Rudnick et al., 1998). In addition, the regional model of
Gao et al. (1998a) for eastern China produces too much
heat to be globally representative of the continental crust com-
position (see discussion in Rudnick et al. (1998) and Jaupart
and Mareschal (Chapter 4.2)). However, the Gao et al. com-
position may be representative of the continental crust of
eastern China, where the crust is relatively thin (30–35 km)
and the heat flow is high (>60 mW m�2). In the remaining
discussion of deep-crust composition, we rely most heavily
on methods (1)–(2), above, but return to the question of
heat flow when considering the bulk crust composition in
Section 4.1.4.
In addition tomineralogy, which is in turn a function of bulk
composition and metamorphic grade, factors affecting the seis-
mic velocities of the continental crust include temperature, pres-
sure, and the presence or absence of volatiles, fractures, and
mineralogical anisotropy. It is generally assumed that cracks
and fractures are closed under the ambient confining pressures
of the middle to lower crust (0.4–1.2 GPa). In addition, al-
though evidence for volatile transport is present in many rocks
derived from the deep crust (see Chapters 4.6 and 4.9), the low
density of these fluids allows for their escape to the upper crust
shortly after their formation. Hence, most studies assume the
deep crust does not, in general, contain an ambient, free volatile
phase (Yardley, 1986).
Some minerals are particularly anisotropic with respect
to seismic-wave speeds (e.g., olivine, sillimanite, mica
(Christensen, 1982)), which can lead to pronounced seismic
anisotropy in rocks if these minerals are crystallograph-
ically aligned through deformational processes (Meltzer and
Christensen, 2001). This, in turn, could lead to over- or under-
estimation of representative seismic velocities of the deep crust
if deformed rocks with such anisotropic minerals occur there.
Olivine is not commonly stable in the deep crust, but other
strongly anisotropic minerals are (e.g., mica, which is predom-
inantly stable in the middle crust, and sillimanite, which is
found in metapelitic rocks in the middle-to-lower crust). Some
of the largest seismic anisotropies have been recorded in mica
schists and gneisses, which can have average anisotropies over
10% (Christensen and Mooney, 1995; Meltzer and Christensen,
2001). Amphibole is also anisotropic and the average anisot-
ropies for amphibolite are also �10% (Christensen and
Mooney, 1995; Kern et al., 1996). In general, anisotropy is
expected to be highest in metapelitic rocks and amphibolites,
which contain the highest proportions of anisotropic minerals.
These lithologies appear to be subordinate in middle-crustal
sections and outcrops (described in the next section) compared
to felsic gneisses, which typically have low anisotropies
(<5%). In contrast, studies of xenoliths show metapelite to
be a common lithology in the lower crust, albeit proportion-
ally minor, and amphibolite may be important in some
regions (Section 4.1.3.5.1). Thus, seismic anisotropy could
be especially important in regions having large amounts
of metasedimentary rocks (e.g., accretionary wedges) and
amphibolite (arc crust?) in the deep crust, but is less likely to
be important in crust dominated by felsic metaigneous rocks or
mafic granulites.
Changes in P-wave velocity of a rock as a function of tem-
perature and pressure are generally assumed to be on the
order of �4�10�4km s–1 �C�1 and 2�10�4 km s�1 MPa�1
(see Rudnick and Fountain (1995) and references therein).
Because most laboratory measurements of ultrasonic velocities
are carried out at confining pressures of 0.6–1.0 GPa, no pres-
sure correction needs to be made in order to compare field and
laboratory-based velocity measurements. However, tempera-
ture influence on seismic-wave speeds can be significant, espe-
cially when comparing laboratory data collected at room
temperature to field-based measurements in areas of high
heat flow (e.g., rifts, arcs, extentional settings). The decrease
in compressional wave velocities in the deep crust under
these high geotherms can be as much as 0.3 km s�1 (see
Rudnick and Fountain, 1995, figure 1). For these reasons,
Rudnick and Fountain (1995) used regional surface heat flow
and assumed a conductive geothermal gradient, to correct the
field-based velocities to room-temperature conditions. In this
way, direct comparisons can be made between velocity profiles
and ultrasonic velocities of lower-crustal rock types measured
in the laboratory. Another benefit of this correction is that
deep-crustal velocities from areas with grossly different
geotherms can be considered directly in light of possible lith-
ologic variations. In subsequent sections we quote deep-crustal
velocities corrected to room-temperature conditions as
‘temperature-corrected velocities.’
4.1.3.4 The Middle Crust
4.1.3.4.1 SamplesThe best evidence for the compositional makeup of the middle
crust comes from studies of high-grade metamorphic terranes
and crustal cross-sections. There are far fewer studies of
amphibolite-facies xenoliths derived from mid-crustal depths
(Grapes, 1986; Leeman et al., 1985; Mattie et al., 1997; Mengel
et al., 1991; Weber et al., 2002) compared to their granulite-
facies counterparts. This may be due to the fact that it can be
difficult to distinguish such xenoliths from the exposed or
near-surface amphibolite-facies country rocks through which
the xenolith-bearing volcanic rocks erupted. For this reason,
xenolith studies have not been employed to any large extent in
understanding the composition of the middle crust, and most
information about the middle crust comes from studies of
high-grade terranes, crustal cross-sections, and seismic profiles.
Interpreting the origin of granulite-facies terranes and hence
their significance towards determining deep-crustal composition
depends on unraveling their pressure–temperature–time history
(see Chapters 4.7 and 4.8). Those showing evidence for a
‘clockwise’ P–T path (i.e., heating during decompression) are
often interpreted as having been only transiently in the lower
crust; they represent upper crustal assemblages that passed
through high P–T conditions on their way back to the surface
during continent-scale collisional orogeny. In contrast, granu-
lite terrains showing evidence for isobaric cooling can have
extended lower-crustal histories, and thus may shed light on
deep-crustal composition (see discussion in Rudnick and
Fountain (1995)). Bohlen and Mezger (1989) pointed out

20 Composition of the Continental Crust
that isobarically cooled granulite-facies terranes show evidence
of equilibration at relatively low pressures (i.e., �0.6–
0.8 GPa), corresponding to mid-crustal depths (�25 km). Al-
though a number of high-pressure and even ultra-high-pres-
sure metamorphic belts (Chapter 4.9) have been recognized
since their study, it remains true that the majority of isobari-
cally cooled granulite-facies terranes show only moderate
equilibration depths and, therefore, may provide evidence re-
garding the composition of the middle crust.
Although lithologically diverse, the average composition of
rocks analyzed from granulite terrains is evolved (Rudnick
and Presper, 1990), with median compositions correspond-
ing to granodiorite/dacite (64–66 wt% SiO2, 4.1–5.2 wt%
Na2OþK2O, based on classification of Le Bas and Streckeisen
(1991)). Rudnick and Fountain (1995) suggested that isobari-
cally cooled granulite terrains have a higher proportion of
mafic lithologies than granulites having clockwise P–T paths.
However, the median composition of rocks analyzed from
isobarically cooled terranes is indistinguishable (62 wt%
SiO2, 4.6 wt% Na2OþK2O) from the median composition of
the entire granulite-terrane population given in Rudnick and
Presper (1990). Collectively, these data point to a chemically
evolved mid-crustal composition.
Observations from crustal cross-sections also point to an
evolved mid-crust composition (Table 4). Most of these cross-
sections have been exposed by compressional uplift due
to thrust faulting (e.g., Kapuskasing, Ivrea, Kohistan, and
Musgrave). Other proposed origins for the uplift include
wide, oblique transitions (Pikwitonei), impactogenesis (Vrede-
fort), and transpression (Sierra Nevada) (Percival et al., 1992).
In nearly all these sections, sampling depth ranges from upper
to middle crust; only a few (e.g., Vredefort, Ivrea, Kohistan)
appear to penetrate into the lower crust. In the following
paragraphs we review the insights into middle (and lower)
crust lithologies gained from the studies of these crustal
cross-sections.
The Vredefort dome represents a unique, upturned section
through �36 km of crust of the Kaapvaal craton, possibly
exposing a paleo-Moho at its base (Hart et al., 1981, 1990;
Tredoux et al., 1999; Moser et al., 2001). The origin of this
structure is debated, but one likely scenario is that it was
produced by crustal rebound following meteorite impact. The
shallowest section of basement (corresponding to original
depths of 10–18 km depth) is composed of amphibolite-facies
rocks consisting of granitic gneiss (the outer granite gneiss).
The underlying granulite-facies rocks (original depths of
18�36 km) are composed of charnockites and leucogranofels
with �10% mafic and ultramafic granulites (the Inlandsee
Leucogranofels terrain). The mid-crust, as defined here, is
thus composed of amphibolite-facies felsic gneisses in fault
contact with underlying charnockites and mixed felsic granu-
lites and mafic/ultramafic granulites (Hart et al., 1990). The
lower crust, which is only partially exposed, consists of mixed
felsic and mafic/ultramafic granulites, with the proportion of
mafic rocks increasing with depth. The mantle beneath the
proposed paleo-Moho, as revealed by borehole drilling, is
dominated by 3.3–3.5 Ga serpentinized amphibole-bearing
harzburgite (Tredoux et al., 1999).
The Kapuskasing Structural Zone represents an exposed
middle-to-lower crustal section through a greenstone belt of
the Archean Canadian Shield, where the middle crust is repre-
sented by the amphibolite-facies Wawa gneiss dome and lower
granulite-facies litihologies along the Kapuskasing uplift.
Altogether, �25 km of crust are exposed out of a total crustal
thickness of 43 km (Fountain et al., 1990b; Percival and Card,
1983). The Wawa gneiss dome is dominated by tonalite–
granodiorite gneisses and their igneous equivalents (87%),
but also contains small amounts of paragneiss (5%) and
mafic gneiss and intrusives (8%) (Burke and Fountain, 1990;
Fountain et al., 1990b; Shaw et al., 1994). The slightly deeper-
level Kapuskasing Structural Zone has a greater proportion of
paragneisses and mafic lithologies. It contains 35% mafic or
anorthositic gneisses, 25% dioritic gneisses, 20% paragneiss,
and only 20% tonalite gneisses.
Like the high-grade rocks of the Kapusksasing Structural
Zone, those in the Pikwitonei crustal cross-section represent
high-grade equivalents of granite–gneiss–greenstone succes-
sions (Fountain and Salisbury, 1981; Percival et al., 1992).
Approximately 25 km of upper-to-middle crust is exposed in
this section out of a total-crustal thickness of 37 km (Fountain
et al., 1990b). Both amphibolite- and granulite-facies rocks are
dominated by tonalitic gneiss with minor mafic gneiss, and
metasedimentary rocks.
The Wutai–Jining Zone is suggested to be an exposed cross-
section through the Archean North China craton (Kern et al.,
1996). Rocks from this exposure equilibrated at depths of up
to �30 km, thus sampling middle and uppermost lower crust,
but leaving the lowermost 10 km of crust unexposed (Kern et al.,
1996). Like the previously described cross-sections, felsic gneisses
dominate themiddle crust; tonalitic–trondhjemitic–granodioritc,
and granitic gneisses comprise 89%of the dominant amphibolite
to granulite-facies Henshan-Fuping terrains, the remaining
lithologies are amphibolite-mafic granulite (8%) and metape-
lite (3%). Tonalitic–trondhjemitic–granodioritc and granitic
gneiss (54%) are less significant but still dominant in the
lower-crustal Jining terrain.
TheMusgrave Range (Fountain and Salisbury, 1981 ; Percival
et al., 1992) and the Bamble Sector of southern Norway (Pinet
and Jaupart, 1987; Alirezaei and Cameron, 2002) represent two
crustal sections through Proterozoic crust of central Australia
and the Baltic Shield, respectively. In both sections, the middle
crust is dominated by quartzofeldspathic gneiss. The lower crust
consists of silicic to intermediate gneiss, felsic granulite, and
mafic granulite with layered mafic and ultramafic intrusions
being important lithological components in the Musgrave
Range and metasediments being important in the lower crust
of southern Norway.
The Ivrea–Verbano Zone in the southern Alps of Italy was
the first to be proposed as an exposed deep-crustal section by
Berckhemer (1969) and has subsequently been the focus of
extensive geological, geochemical, and geophysical studies
(e.g., Mehnert, 1975; Fountain, 1976; Dostal and Capedri,
1979; Voshage et al., 1990; Quick et al., 1995). The Paleozoic
rocks of the Ivrea zone are unusual when compared with Pre-
cambrian granulite outcrops because they contain a large propor-
tion of mafic lithologies and, as such, closely resemble granulite
xenoliths in composition (Rudnick, 1990b). Amphibolite-facies
rocks of the middle crust consist of felsic gneiss, amphibolite,
metapelite (kinzigite), and marble, whereas the lower crustal
section comprises mafic granulite and diorite, which formed by

Table 4 Chemical and petrological composition of crustal cross-sections
Referencea Age Setting, (uplift origin)b Current crustalthickness (km)
Maximumdepth (km)
Middle crust lithologies Lower crust lithologies
ArcheanVredefortDome
1–3 2.6–3.6 Ga Kaapvaal craton, (3) 36 36 (w/paleoMoho)
Amphibolite-facies granitic gneiss Granulite-facies charnockites,leucogranofels, mafic, and ultramaficgranulites
KapuskasingUplift
4–5 2.5–2.7 Ga Superior craton, (1) 43 25 Amphibolite-facies87% felsic8% mafic-intermediate5% metasediment
Lower granulite-facies35% mafic/anorthositic25% diorite20% metasediments20% felsic
Pikwitoneigranulitedomain
6–9 2.5–3.1 Ga Superior craton, (2) 37 25 Amphibolite-lower granulite facies.Dominately tonalite gneiss, minormafic gneisses, quartzites,anorthosites.
Granulite-facies. Predominantly silicic tointermediate gneiss, with minorparagneiss, mafic-ultramafic bodies andanorthosites
Wutai-Jiningzone
10 2.5–2.8 Ga North China Craton, (2) 40 30 Amphibolite-lower granuilte facies.89% tonalitic-trondhjemitic-granodioritic-granitic gneiss8% amphibolite and mafic granulite3% metapelite
Granulite-facies.54% tonalitic-trondhjemitic-granodioritic-granitic gneiss32% mafic granulite6% metapelite8% metasandstone
ProterozoicMusgraveranges
6, 8, 11 1.1–2.0 Ga Central Australia, (1) 40 Unknown Quartzofeldspathic gneiss,amphibolite, metapelite, marble,calc-silicate gneiss
Silicic to intermediate gneiss, maficgranulite, layered mafic-ultramaficintrusions
S. Norway 12–13 1.5–2.0 Ga Baltic Shield, (2) 35 Unknown Quartzofeldspathic gneiss,amphibolite, metasediments
Felsic granulite, mafic granulite,metasediments
PhanerozoicIvrea-Verbanozone
14–17 Permian Alps, (1) 35 30 Amphibolite-facies. felsic gneiss,amphibolite, metapelite (kinzigite),marble
Granulite facies, mafic intrusives andultramafic cumulates, resistic metapelite(stronalite), diorite
SierraNevada,California
8, 18–20 Cretaceous Continental arc, (4) 27–43 30 Mafic to felsic gneiss, amphibolite,diorite-tonalite
Granofels, mafic granulite, graphite-bearingmetasediments
Kohistan,Pakistan
8, 21 Late Jurassic–Eocene Oceanic arc, (1) Unknown 45 Diroite, metadiorite, gabbronorite Amphibolite, metagabbro, gabbronorite,garnet gabbro, garnet homblendite,websterite
Talkeetna,Alaska
22–23 Jurassic Oceanic arc, (1) 25–35 13 Gabbro, tonalite, diorite Garnet gabbro, amphibole gabbro, dunite,wehrlite, pyroxenite
aReferences: 1. Hart et al., 1990, 2. Tredoux et al., 1999, 3. Moser et al., 2001, 4. Fountain et al., 1990a, 5. Shaw et al., 1994, 6. Fountain and Salisbury, 1981, 7. Fountain et al., 1987, 8. Percival et al., 1992, 9. Fountain and Salisbury 1995, 10. Kern
et al., 1996, 11. Clitheroe et al., 2000, 12. Pinet and Jaupart, 1987, 13. Alirezaei and Cameron, 2002, 14. Mehnert, 1975, 15. Fountain, 1976, 16. Voshage et al., 1990, 17. Mayer et al., 2000, 18. Ross, 1985, 19. Saleeby, 1990, 20. Ducea, 2001, 21.
Miller and Christensen, 1994, 22. Pearcy et al., 1990, 23. see Chapter 4.21 Magmatic arcs (Kelemen et al.).bThe different mechanisms responsible for uplift of these crustal cross sections include (1) compressional uplifts along thrust faults, (2) wide, oblique transitions, which are also compressional in origin, but over wide transitions, with no one thrust fault
obviously responsible for their uplift, (3) meteorite impact, and (4) transpressional uplifts, which are vertical uplifts along a transcurrent faults (Percival et al., 1992).
Com
positionof
theContinental
Crust
21

22 Composition of the Continental Crust
intrusion and subsequent fractionation of basaltic melts that
partially melted the surrounding metasediments (now resistic
stronalite) (Mehnert, 1975; Dostal and Capedri, 1979; Fountain
et al., 1976; Voshage et al., 1990). Detailed mapping by Quick
et al. (1995) demonstrated that mantle peridotites in the
southern Ivrea Zone are lenses that were tectonically interfin-
gered with metasedimentary rocks prior to intrusion of
the gabbroic complex and the present exposures reside an
unknown distance above the pre-Alpine contiguous mantle.
Thus reference to the section as a complete crust–mantle tran-
sition could be misleading. Altogether, the exposed rocks rep-
resent�30 km of crust with�5 km lowermost crust remaining
unexposed (Fountain et al., 1990a). The similarity in isotope
composition and age between the Ivrea zone cumulates
and Hercynian granites in the upper crust led Voshage et al.
(1990) to speculate that these granites were derived from
lower-crustal magma chambers similar to those in the Ivrea
Zone, suggesting that basaltic underplating may be important
in the formation and modification of the lower continental
crust (Rudnick, 1990a).
Three sections through Mesozoic arcs show contrasting
bulk compositions, depending on their settings (continental
versus oceanic). In the southern Sierra Nevada, a tilted section
exposes the deeper reaches of the Sierra Nevada batholith,
which is part of a continental arc formed during the Mesozoic.
This section is dominated by arc-related granitoids to depths of
�30 km, which have a tonalitic bulk chemistry (Ducea and
Saleeby, 1996; Ducea, 2001). At the deepest structural levels,
the mafic Tehachapi Complex comprises mafic and felsic
gneiss, amphibolite, diorite, tonalite, granulite, and rare meta-
sediments (Percival et al., 1992; Ross, 1985). In contrast,
two sections through accreted intraoceanic arcs have consider-
ably more mafic middle-crust compositions. In the Jurassic
Talkeetna section of southeastern Alaska, the middle crust
comprises gabbro and tonalite (4.5 km), which is underlain
by variably deformed garnet gabbro and gabbro with cumulate
dunite, wehrlite, and pyroxenite (2.2 km) in the lower crust
(Pearcy et al., 1990; see Chapter 4.21). The upper, middle, and
lower crustal units are estimated to have an average SiO2 of
57%, 52%, and 44–45%, respectively. The Late Jurassic–
Eocene Kohistan arc of Pakistan represents a 45 km thick
reconstructed crustal column through a deformed, intruded
intraoceanic arc sequence exposed in the Himalayan collision
zone (Miller and Christensen, 1994). The depth interval from
10 km to 18 km is dominated by diorite and metadiorite.
Rocks below this level, from �18 km to the Moho, are domi-
nated by metamorphosed mafic to ultramafic rocks from a
series of layered mafic intrusions.
In summary, exposed amphibolite- to granulite-facies ter-
ranes and middle crustal cross-sections contain a wide variety
of lithologies, including metasedimentary rocks, but they are
dominated by igneous and metamorphic rocks of the diorite–
tonalite–trondhjemite–granodiorite (DTTG), and granite suites.
This is true not only for Precambrian shields but also for
Phanerozoic crust and continental arcs, as documented in the
crustal cross-sections described above. However, intraoceanic
arcs may contain substantially greater proportions of mafic
rocks in the middle and lower crust, as illustrated by the Kohi-
stan and Talkeetna arc sections (Pearcy et al., 1990; Miller and
Christensen, 1994; see Chapter 4.21).
4.1.3.4.2 Seismological evidenceThe samples described above provide evidence of the litholo-
gies likely to be present in the middle crust. By definition,
however, these samples no longer reside in the middle crust
and additional information is required in order to determine
the composition of the present-day middle crust. For this, we
turn to seisomological data for continental crust from a variety
of tectonic settings.
Except for active rifts and some intraoceanic island arcs, which
exhibit the highest middle-crust P-wave velocities (6.7�0.3 km s�1 (Rudnick and Fountain, 1995) and 6.8�0.2kms�1
(data from Holbrook et al., 1992) corrected to room temp-
erature), other continental tectonic units have room-temperature
middle-crustal P-wave velocities between 6.4kms�1 and
6.6 kms�1 (Rudnick and Fountain, 1995). This range overlaps
the average velocity of in situmiddle crust, whichwas determined
by Christensen and Mooney (1995) to be from 6.3 km s�1 to
6.6�0.3 km s�1, with an average of 6.5�0.2 km s�1 over the
depth range of 15�25 km. When corrected for temperature (an
increase of 0.1–0.2 km s�1, depending on the regional
geotherm), these average middle-crustal velocities are similar to
the room-temperature velocities considered by Rudnick and
Fountain (1995). Thus, the middle crust has average, room-tem-
perature-corrected velocity between 6.4 km s�1 and 6.7 km s�1.
Amphibolite-facies felsic gneisses have room temperature
P-wave velocities of 6.4�0.1 km s�1 (Rudnick and Fountain,
1995). This compares well with the room-temperature velocity
of average biotite (tonalite) gneiss at 6.32�0.17 km s�1
(20 km depth; Christensen and Mooney, 1995). Granitic
gneiss has a slightly lower velocity (6.25�0.11 km s�1;
Christensen and Mooney (1995)), but is within uncertainty of
the tonalite. Amixture of such gneisses with 0–30% amphibolite
or mafic gneiss of the same metamorphic grade
(Vp¼7.0 km s�1; Rudnick and Fountain, 1995, Christensen
and Mooney, 1995) yields P-wave velocities in the range ob-
served for most middle crust. The above seismic data are thus
consistent with the observations from granulite terranes and
crustal cross-sections, and suggest that the middle crust is dom-
inated by felsic gneisses.
4.1.3.4.3 Middle-crust compositionCompared to other regions of the crust (upper, lower, and
bulk), few estimates have been made of the composition of
the middle crust (Table 5, and Figures 9 and 10). Moreover,
these estimates provide data for a far more limited number of
elements, and large differences exist between different esti-
mates. The estimates of Weaver and Tarney (1984), Shaw
et al. (1994) and Gao et al. (1998a) are based on surface
sampling of amphibolite-facies rocks in the Lewisian Complex,
the Canadian Shield, and Eastern China, respectively. Rudnick
and Fountain (1995) modeled the middle crust as 45% inter-
mediate amphibolite-facies gneisses, 45% mixed amphibolite
and felsic amphibolite-facies gneisses, and 10% metapelite.
This mixture is very similar to that of Christensen and Mooney
(1995), who proposed a middle crust of 50% tonalitic gneiss,
35% amphibolite, and 15% granitic gneiss. Unfortunately,
compositional data are not available for Christensen and
Mooney’s samples and so the chemical composition of their
middle crust cannot be calculated.

Composition of the Continental Crust 23
The estimates of Rudnick and Fountain (1995) and Gao
et al. (1998a) show a broad similarity, although the latter is
more evolved, having higher SiO2, K2O, barium, lithium, zir-
conium, and LREEs and LaN/YbN and lower total FeO, scan-
dium, vanadium, chromium, and cobalt with a significant
negative europium anomaly (Figures 9 and 10). These differ-
ences are expected, based on the slightly higher compressional
velocity of Rudnick and Fountain’s global middle crust com-
pared to that of Eastern China (6.6 km s�1 versus 6.4 km s�1;
Gao et al., 1998b). The consistency is surprising considering
that the two estimates are based on different sample bases and
different approaches, one global and the other regional.
The middle-crustal compositions of Weaver and Tarney
(1984) and Shaw et al. (1994) deviate from the above esti-
mates by being markedly higher in SiO2 and lower in TiO2,
FeO, MgO, and CaO. Moreover, these middle-crust composi-
tions are more felsic (based on the above elements) than all
estimates of the upper-continental crust composition given in
Table 1. Thus, it is unlikely that the Weaver and Tarney (1984)
and Shaw et al. (1994) compositions are representative of the
global average middle crust, as both heat flow and seismic
observations require that the crust becomes more mafic with
depth. It should be noted, however, that heat production for
Shaw’s middle-crust composition is indistinguishable from
those of Rudnick and Fountain (1995) and Gao et al.
(1998a) at �1.0 mW m�3, due largely to the very high K/Th
and K/U of Shaw et al. estimate. The middle crust of Weaver
and Tarney (1984) has significantly higher heat production,
at 1.4 mW m�3.
Generally speaking, it would be best to derive the middle-
crust composition from observed seismic-wave speeds and
chemical analyses of amphibolite-facies rocks. However, few
such data sets exist. Only two studies attempt to define the
global average seismic-wave speeds for the middle crust
(Christensen and Mooney, 1995; Rudnick and Fountain,
1995) and neither provides chemical data for amphibolite
facies samples. Rudnick and Fountain used compiled chemical
data for granulite-facies rocks and inferred the concentrations
of fluid-mobile elements (e.g., rubidium, uranium) of their
amphibolite facies counterparts, while Christensen and Mooney
(1995) did not publish their chemical data for the amphibolite-
facies rocks they studied. For this reason, we have chosen to
estimate the middle-crust composition by averaging the esti-
mates of Rudnick and Fountain (1995) and Gao et al. (1998a)
(Table 5), where corresponding data are available. Although the
latter study is regional in nature, its similarity to the global
model of Rudnick and Fountain (1995) suggests that it is not
anomalous from a global perspective (unlike the lower crust of
Eastern China as described in Section 4.1.3.5) and it provides
additional estimates for little-measured trace elements.
This middle crust has an intermediate composition with
lower SiO2 and K2O concentrations and higher FeO, MgO,
and CaO concentrations than average upper crust (Table 1),
consistent with the geophysical evidence (cited above) of a chem-
ically stratified crust. Differences in trace-element concentrations
between these two estimates are generally less than 30%, with the
exceptions of P2O5, lithium, copper, barium, lanthanum, and
uranium (Figure 10). The concentrations of these elements are
considered to be less constrained. The middle crust is LREE
enriched and exhibits the characteristic depletion of niobium
relative to lanthanum and enrichment of lead relative to cerium
seen in all other parts of the crust (Figure 11).
In summary, our knowledge of middle-crustal composition
is limited by the small number of studies that have focused on
the middle crust and the ambiguity in deriving chemical com-
positions from seismic velocities. Thus, the average composi-
tion given in Table 5 is poorly constrained for a large number
of elements. Seismological and heat-flow data suggest an in-
crease in seismic-wave speeds and a decrease in heat produc-
tion with depth in the crust. Studies of crustal cross-sections
show the middle crust to be dominated by felsic gneisses of
tonalitic bulk composition. The average middle-crust com-
position given in Table 5 is consistent with these broad
constraints and furthermore suggests that the middle crust
contains significant concentrations of incompatible trace
elements. However, the uncertainty on the middle-crust com-
position, particularly the trace elements, remains large.
4.1.3.5 The Lower Crust
4.1.3.5.1 SamplesLike the middle crust, the lower crust also contains a wide
variety of lithologies, as revealed by granulite xenoliths, ex-
posed high-pressure granulite terranes and crustal cross-
sections. Metaigneous lithologies range from granite to gabbro,
with a predominance of the latter in most lower crustal xeno-
lith suites. Exceptions include xenolith suites from Argentina
(Lucassen et al., 1999) and central Spain (Villaseca et al.,
1999), where the xenoliths are dominated by intermediate to
felsic granulites and the Massif Central (Leyreloup et al., 1977;
Downes et al., 1990) and Hannuoba, China (Liu et al., 2001),
where intermediate to felsic granulites comprise nearly half the
population. Metapelites occur commonly in both terranes and
xenoliths, but only rarely do other metasedimentary litholo-
gies occur in xenolith suites; unique xenolith localities have
been documented with meta-arenites (Upton et al., 1998) and
quartzites (Hanchar et al., 1994), but so far marbles occur only
in terranes. The reason for their absence in lower crustal xeno-
lith suites is uncertain – they may be absent in the lower crust
sampled by volcanoes, they may not survive transport in the
hot magma, or they may simply have been overlooked by
xenolith investigators.
These issues related to the representativeness of xenolith
sampling are the reason why robust estimates of lower-crustal
composition must rely on a grand averaging technique, such as
using seismic velocities to infer composition.
Information on the lower crust derived from crustal cross-
sections has been given in Section 4.1.3.4.1 and only the main
points are summarized here. All crustal cross-sections show an
increase in mafic lithologies with depth and most of those in
which possible crust-mantle boundaries are exposed reveal a
lower crust that is dominated by mafic compositions. For
example, in the Ivrea Zone, Italy, the lower crust is dominated
by mafic granulite formed from basaltic underplating of coun-
try rock metapelite (Voshage et al., 1990). The same is true for
the Kohistan sequence, Pakistan (Miller and Christensen,
1994), although here metapelites are lacking. Although the
crust–mantle boundary is not exposed in the Wutai-Jining
terrain, the granulite-facies crust exposed in this cross-section
has a more mafic composition than the rocks of the middle-

Table 5 Compositional estimates of the middle continental crust. Major elements in weight percent. Trace element concentration units the same asin Table 2
1Weaver and Tarney (1984)
2Shaw et al. (1994)
3Rudnick and Fountain (1995)
4Gao et al. (1998a)
5This study a
1 Sigmaa %
SiO2 68.1 69.4 62.4 64.6 63.5 2 2TiO2 0.31 0.33 0.72 0.67 0.69 0.04 6Al2O3 16.33 16.21 15.96 14.08 15.0 1 9FeOT
b 3.27 2.72 6.59 5.45 6.02 0.8 13MnO 0.04 0.03 0.10 0.11 0.10 0.00 2MgO 1.43 1.27 3.50 3.67 3.59 0.1 3CaO 3.27 2.96 5.25 5.24 5.25 0.01 0Na2O 5.00 3.55 3.30 3.48 3.39 0.1 4K2O 2.14 3.36 2.07 2.52 2.30 0.3 14P2O5 0.14 0.15 0.10 0.19 0.15 0.06 43Mg# 43.8 45.5 48.6 54.5 51.5Li 20.5 7 16 12 6 55Be 2.29 2.29B 3.2 17 17NF 524 524S 20 20Cl 182 182Sc 5.4 22 15 19 5 27V 46 118 95 107 16 15Cr 32 43 83 69 76 10 13Co 30 25 18 22 5 23Ni 20 18 33 34 33.5 0.7 2Cu 8 20 32 26 8 33Zn 50 70 69 69.5 0.7 1Ga 17 18 17.5 0.7 4Ge 1.13 1.13As 3.1 3.1Se 0.064 0.064BrRb 74 92 62 67 65 4 5Sr 580 465c 281 283 282 1 1Y 9 16 22 17.0 20 4 18Zr 193 129 125 173 149 34 23Nb 6 8.7 8 11 10 2 22Mo 0.3 0.60 0.60RuPd 0.76 0.76Ag 48 48Cd 0.061 0.061InSn 1.30 1.30Sb 0.28 0.28TICs 0.98 2.4 1.96 2.2 0.3 14Ba 713 1376 402 661 532 183 34La 36 22.9 17 30.8 24 10 41Ce 69 42.1 45 60.3 53 11 21Pr 5.8 5.8Nd 30 18.3 24 26.2 25 2 6Sm 4.4 2.8 4.4 4.74 4.6 0.2 5Eu 1.09 0.78 1.5 1.20 1.4 0.2 16Gd 2.11 4.0 4.0Tb 0.41 0.28 0.58 0.76 0.7 0.1 19Dy 1.54 3.8 3.8Ho 0.82 0.82Er 2.3 2.3Tm 0.14 0.32Yb 0.76 0.63 2.3 2.17 2.2 0.09 4
(Continued)
24 Composition of the Continental Crust

Table 5 (Continued)
1Weaver and Tarney (1984)
2Shaw et al. (1994)
3Rudnick and Fountain (1995)
4Gao et al. (1998a)
5This study a
1 Sigmaa %
Lu 0.1 0.12 0.41 0.32 0.4 0.06 17Hf 3.8 3.3 4.0 4.79 4.4 0.6 13Ta 1.8 0.6 0.55 0.6 0.04 6W 0.60 0.60ReOsIrPt 0.85 0.85Au 0.66 0.66Hg 0.0079 0.0079Tl 0.27 0.27Pb 22 9.0 15.3 15 15.2 0.2 1Bi 0.17 0.17Th 8.4 6.4 6.1 6.84 6.5 0.5 8U 2.2 0.9 1.6 1.02 1.3 0.4 31
aAverages and standard deviations of middle crustal composition by Rudnick and Fountain (1995) and Gao et al. (1998a), or from either of these two studies if data from the other one
are unavailable.bTotal Fe as FeO.cRecalculated from original data given by Shaw et al. (1994; Table 4), due to a typographical error in the published table.
Mg#¼molar 100�Mg/(MgþFetot).
Major elements recast to 100% anhydrous.
2.0
1.5
1.0
0.5
0.0AlSi
Nor
mal
ized
to
R a
nd G
Fe Mg Ca Na K
Weaver and TarneyShaw et al.Gao et al.Rudnick and Fountain
Figure 9 Comparison of the major-element composition of the middlecontinental crust as determined by sampling of surface exposures(Shaw et al., 1994; Weaver and Tarney, 1984) and inferred frommiddle-crustal seismic velocities combined with surface and xenolithsamples (Rudnick and Fountain, 1995; Gao et al., 1998a). All valuesnormalized to the new composition provided in Table 5 (‘R&G’), which isan average between the values of Gao et al. (1998a) and Rudnickand Fountain (1995). Gray shaded field represents �10% variation fromthis value.
Composition of the Continental Crust 25
crust section. Even in the Vredefort and Sierra Nevada cross-
sections, which are dominated by granitic rocks throughout
most of the crustal sections (Ducea, 2001; Hart et al., 1990),
the deepest reaches of exposed crust are characterized by more
mafic lithologies (Ross, 1985; Hart et al., 1990; Table 4).
There have been a number of studies of granulite-facies
xenoliths since the reviews of Rudnick (1992) and Downes
(1993) and a current tabulation of xenolith studies is pro-
vided in Table 6, which provides a summary of most lower
crustal xenolith studies published through 2002. Perhaps most
significant are the studies of lower-crustal xenoliths from
Archean cratons, which had been largely lacking prior to 1992
(Kempton et al., 1995, 2001; Davis, 1997; Markwick and
Downes, 2000; Schmitz and Bowring, 2000, 2003a,b; Downes
et al., 2002). These studies reveal a great diversity in lower-crustal
lithologies within Archean cratons, which appear to correlate
with seismic structure of the crust.
Lower-crustal xenoliths from the Archean part of the Baltic
(or Fennoscandian) Shield, like their post-Archean counter-
parts, are dominated by mafic lithologies (Kempton et al.,
1995, 2001; Markwick and Downes, 2000; Holtta et al.,
2000). Most equilibrated at depths of 22–50 km and contain
hydrous phases (amphibole�biotite). Partial melting and res-
tite development is evident in some migmatitic xenoliths, but
cumulates are absent (Kempton et al., 1995, 2001; Holtta
et al.,2000). A curious feature of these samples is the common
occurrence of potassic phases (e.g., potassium feldspar, horn-
blende, biotite) in otherwise mafic granulites. These mafic
xenoliths have been interpreted to represent gabbroic intru-
sions that underplated the Baltic Shield during the Paleopro-
terozoic flood-basalt event (2.4–2.5 Ga) and later experienced
potassium-metasomatism coincident with partial melting
at �1.8 Ga, a major period of granitic magmatism in this
region (Kempton et al., 2001; Downes et al., 2002). The domi-
nately mafic compositions of these xenoliths is consistent with
the thick layer of high-velocity (�7 km s�1) material imaged
beneath the Archean crust of the Baltic Shield (Luosto et al.,
1989, 1990). The xenolith studies suggest that this layer
formed during Paleoproterozoic basaltic underplating and is
not part of the original Archean architecture of this Shield.
In contrast to the Baltic Shield, mafic granulites appear to
be absent in lower-crustal xenolith suites from the Archean
Kaapvaal craton, which are dominated by metapelite and
unique ultra-high-temperature granulites of uncertain petro-
genesis (Dawson et al., 1997; Dawson and Smith, 1987;

(a) (b)
(c) (d)
0.5
Mn Sc V Cr Co Ni Cu Zn
1.0
1.5
2.0
0.5
1.0
1.5
2.0
Li Rb Cs Sr Ba Pb Th U
0.5
1.0
1.5
2.0
0.5
1.0
1.5
2.0
Transition metals
Alkali, alkaline earth and actinides
High field-strength
Weaver and TarneyShaw et al. Rudnick and Fountain
Gao et al.
Rare earth
Ti Zr Hf Nb Ta Mo
La Ce Nd Sm Eu Gd Yb Lu
3.1
2.6
Figure 10 Comparison of the trace-element composition of the middle continental crust as determined by sampling of surface exposures (Shaw et al.,1994; Weaver and Tarney, 1984) and inferred from middle-crustal seismic velocities combined with surface and xenolith samples (Rudnick andFountain, 1995; Gao et al., 1998a). All values normalized to the new composition provided in Table 5 (‘R&G’), which is an average of the values of Gaoet al. (1998a) and Rudnick and Fountain (1995). Gray shaded field represents �20% variation from this value. (a) transition metals, (b) high-fieldstrength elements, (c) alkali, alkaline earth and actinides, and (d) REEs.
1000
100
10
1
1000
100
10
1
Chondrite normalized
Middle crust
La
Cs
Rb
Mantle normalized
Weaver and TarneyShaw et al.
Rudnick and Fountain
Gao et al.
This study
Th K La Pb Sr Zr Sm Ti Ho
Ba U Nb Ce Pr Nd Hf Eu Y Yb
Ce Pr Nd Sm Eu Gd Tb Dy Ho Er Tm Yb Lu
Figure 11 REE (upper) and multi-element plot (lower) of thecompositions of the middle crust given in Table 5. Chondrite values fromTaylor and McLennan (1985) and primitive mantle values fromMcDonough and Sun (1995).
26 Composition of the Continental Crust
Schmitz and Bowring, 2003a,b). These xenoliths derive from
depths of >30 km and show evidence for multiple thermal
metamorphic overprints starting with ultrahigh temperature
metamorphism at�2.7 Ga, which is associated with Ventersdorp
magmatism (Schmitz and Bowring, 2003a,b). The absence of
mafic granulites is consistent with the relatively low P-wave
velocities in the lower crust of the Kaapvaal craton (Durrheim
and Green, 1992; Nguuri et al., 2001; Niu and James, 2002), but
it is not clear whether the lack of a mafic lower crust reflects the
original crustal structure of this Archean craton (Nguuri et al.,
2001) or reflects loss of a mafic complement some time after
crust formation in the Archean (Niu and James, 2002).
Lower crustal xenoliths from the Hannuoba basalts, situ-
ated in the central zone of the North China Craton, show a
diversity of compositions ranging from felsic to mafic metaig-
neous granulites and metapelites (Gao et al., 2000; Chen et al.,
2001; Liu et al., 2001; Zhou et al., 2002); approximately half
the xenoliths have evolved compositions (Liu et al., 2001). All
granulite xenoliths equilibrated under high temperatures
(700–1000 �C), corresponding to depths of 25–40 km (Chen
et al., 2001), but mafic granulites yield higher temperatures
than metapelitic xenoliths, suggesting their derivation from
deeper crustal levels (Liu et al., 2001). Liu et al. used regional
seismic refraction data and the lithologies observed in the
Hannuoba xenoliths to infer the lower-crust composition in
this part of the North China craton. They describe a layered
lower crust in which the upper portion (from 24 km to
�38 km, Vp�6.5 km s�1), consists largely of felsic granulites
and metasediments, and is underlain by a ‘lowermost’ crust
(38–42 km, Vp�7.0 km s�1) composed of intermediate gran-
ulites, mafic granulites, pyroxenite, and peridotite. Thus, the
bulk lower crust in this region is intermediate in composition,
consistent with the relatively large proportion of evolved

Table 6 Geochemical and mineral chemical studies of lower crustal xenoliths
Locality Host Xenolith types Types of analyses Pipe age Crust age Age References
North AmericaNunivak Island, Alaska AB MG ME, Min. <5 Ma Phanerozoic Francis (1976)Central Slave Province,Canada
K MGG, FG, MG U–Pb 50–70 Ma Archean 2.5 Ga, 1.3 Ga(meta)
Davis (1997)
Kirkland Lake, Ontario,Superior craton
K AN, MG U–Pb 160 Ma Archean 2.6–2.8 Ga,2.4–2.5 Ga(meta)
Moser and Heaman (1997)
Ayer’s cliff, Quebec K MG, PG Min. �100 Ma Proterozoic Trzcienski and Marchildon (1989)Popes Harboura, NovaScotia
K MG, PG, FG ME, TE, Min. <400 Ma Phanerozoic Owen (1988), Eberz (1991)
Snake River Plainsa,Idaho
Evol.B
PG Sr, Nd, Pb <2 Ma Archean �2.8 Ga Leeman et al. (1985, 1992)
Bearpaw Mts.,Montana
K MGG, MG, FG ME, TE, O, U–Pb 45 Ma Archean �2.6 Ga Collerson et al. (1989), Kempton and Harmon (1992), Moecheret al. (1994), Rudnick et al. (1999)
Simcoe Volcanic Field,WashingtonCascades
AB MG FI <1 Ma Phanerozoic Ertan and Leeman (1999)
Riley County, Kansas K MGG, EC Min. <230 Ma Proterozoic Meyer and Brookins (1976)Central Sierra Nevada,California
AB MGG, EC, FG, MP ME, TE, Min., Sr,Nd, O, U–Pb
8–11 Ma Proterozoic 180 Ma Dodge et al. (1986, 1988), Domenick et al. (1983), Ducea andSaleeby (1996, 1998)
Colorado/Wyoming K MGG, MG ME, Min. Proterozoic Bradley and McCallum (1984)Mojave Desert,California
AB MP, FG, IG, QZ, MGG ME, TE, Min., Sr,Nd, Pb, U–Pb
Archean �1.7 Ga Hanchar et al. (1994)
Navajo Volcanic Field,Colorado Plateau
K MGG, FG, AM, EC, MP ME, TE, Min., Sr,Nd
25–30 Ma Proterozoic �1.8 Ga Ehrenberg and Griffin (1979), Broadhurst (1986), Wendlandtet al. (1993, 1996), Mattie et al. (1997), Condie et al. (1999)
Camp Creek, Ariszona L MGG, AM, EC ME, TE, Min., Sr,Nd, Pb
23–27 Ma Proterozoic 1.2–1.9 Ga Esperanca et al. (1988)
Chino Valley, Arizona L MGG, AM ME, TE, Min. 25 Ma Proterozoic Arculus and Smith (1979), Schulze and Helmstadt (1979),Arculus et al. (1988)
San FranciscoVolcanic Field
AB MG, IG ME, TE, Min., Sr,Nd
<20 Ma Proterozoic �1.9 Ga Chen and Arculus (1995)
Geronimo VolcanicField, New Mexico
AB MG, IG ME, TE, Min., Sr,Nd, Pb, O
<3 Ma Proterozoic 1.1–1.4 Ga Kempton et al. (1990), Kempton and Harmon (1992)
Kilbourne Hole,New Mexico
AB MG, AN, PG, FG Min., ME, Sr, Nd,Pb, O, U–Pb
<1 Ma Proterozoic 1.5 Ga Padovani and Carter (1977), Davis and Grew (1977), Jameset al. (1980), Padovani et al. (1982), Reid et al. (1989),Leeman et al. (1992), Scherer et al. (1997).
Elephant Butte,New Mexico
AB MG Min., ME <3 Ma Proterozoic Baldridge (1979)
Engle Basin,New Mexico
AB MG Min. <3 Ma Proterozoic Warren et al. (1979)
West Texas AB MGG, IG, FG ME, Sr, Nd, Pb, U–Pb
<40 Ma Proterozoic 1.1 Ga Cameron and Ward (1998)
(Continued)
Com
positionof
theContinental
Crust
27

Table 6 (Continued)
Locality Host Xenolith types Types of analyses Pipe age Crust age Age References
Northern Mexico AB MG, PG, FG ME, TE, Min., Sr,Nd, C, U–Pb
<25 Ma Proterozoic From 1 to1400 Ma
Nimz et al. (1986), Ruiz et al. (1988a,b), Roberts and Ruiz(1989), Hayob et al. (1989), Rudnick and Cameron (1991),Cameron et al. (1992), Moecher et al. (1994), Smith et al.(1996), Scherer et al. (1997)
Central Mexico AB MG ME, Min, Nd Phanerozoic 1.5 Ga Urrutia-Fucagauchi and Uribe-Cifuentes (1999)San Luis Potosi,Central Mexico
AB MG, MGG, IG ME, TE, Min., Sr,Nd
<1 Ma Proterozoic �1.2 Ga Schaaf et al. (1994)
South AmericaMercaderes, SWColumbia
AB MG, MGG, IG, HB, ME, TE, Min., Sr,Nd, Pb
<10 Ma Phanerozoic Weber et al. (2002)
Salta Rift, NWArgentina
AB FG, MG Min., ME, TE, Sr,Nd, Pb
Mesozoic Proterozoic �1.8 Ga Lucassen et al. (1999)
Calbuco Volcano, Chile AND MG ME, TE, Min., Sr,Nd
<1000 years Paleozoic Hickey-Vargas et al. (1995)
Pali Aike, SouthernChile
AB MG ME, Min., FI <3 Ma Phanerozoic Selverstone and Stern (1983)
EuropeScotland, NorthernUplands
AB MG, AN, IG, MP, MGG,HB
ME, TE, Min., Nd,Sr, U–Pb
�300 Ma Archean/Proterozoic
360 Ma, 1.8 Ga van Breeman and Hawkesworth (1980), Upton et al. (1983),Halliday et al. (1984), Hunter et al. (1984), Upton et al. (1998,2001)
Eastern Finland K MG, MGG, AM ME, TE, Min., Nd,U–Pb
525 Ma Archean 1.7–2.6 Ga Holtta et al. (2000)
ArkhangelskKimberlite, Balticshield, Russia
K MGG ME, TE, Min., Sr,Nd
360 Ma Archean 1.7–1.9 Ga Markwick and Downes (2000)
Elovy island, Balticshield, Russia
K MGG, EC, FG, AM ME, TE, Min., Sr,Nd, Pb, U–Pb
360–380 Ma Archean �1.8 Ga, 2.4–2.5 Ga
Kempton et al. (1995, 2001), Downes et al. (2002)
Belarus, Russia K MGG, EC, HB ME, TE, Min., Sr,Nd
370 Ma Markwick et al. (2001)
Pannonian basin, W.Hungary
AB MG, MGG ME, TE, Min., Sr,Nd, O
2–5 Ma Phanerozoic Embey-Isztin et al. (1990), Kempton et al. (1997), Embey-Isztinet al. (2003), Dobosi et al. (2003)
Kampernich, E. Eifel,Germany
AB MGG, AM ME, TE, Min., Sr,Nd, Hf, Pb, O
<1 Ma Phanerozoic 1.5 Ga or�450 Ma?
Okrusch et al. (1979), Stosch and Lugmair (1984), Rudnick andGoldstein (1990), Loock et al. (1990), Kempton and Harmon(1992), Sachs and Hansteen (2000)
Wehr Volcanoa, E.Eifel, Germany
AB AM ME, TE, Min. <1 Ma Phanerozoic Worner et al. (1982), Grapes (1986)
N. HessianDepression,Germany
AB MGG, MG, PG, FG ME, TE, Min., O <50 Ma Phanerozoic Mengel and Wedepohl (1983)Mengel (1990)
Massif Central, France AB MGG, MG, PG, FG ME, TE, Nd, Sr, Pb,O, C
<5 Ma Phanerozoic �350 Ma Leyreloup et al. (1977), Dostal et al. (1980), Vidal and Postaire(1985), Downes and Leyreloup (1986), Kempton and Harmon(1992), Downes et al. (1991), Moecher et al. (1994)
Tallante, Spain AB PG Min. <20 Ma Phanerozoic Vielzeuf (1983)Central Spain K IG, FG, MP ME, TE, Min. Early Mesozoic Proterozoic Villaseca et al. (1999)
(Continued)
28Com
positionof
theContinental
Crust

Sardinia, Italy AB MG Min. �3 Ma Phanerozoic Rutter (1987)AfricaHoggar, Algeria AB MG, AN, PG ME, TE <20 Ma Proterozoic Leyreloup et al. (1982)Man Shield, SierraLeone
K MGG, AN, EC ME, Min., U–Pb 90–120 Ma Archean Toft et al. (1989), Barth et al. (2002)
Lashaine, Tanzania AB MGG, EC, AN ME, TE, Min., Sr,Nd, Pb, C
<20 Ma Proterozoic Dawson (1977), Jones et al. (1983), Cohen et al. (1984),Moecher et al. (1994)
Fort Portal, Uganda AB MGG, MG Min., ME, TE <3 Ma Proterozoic Thomas and Nixon (1987)Free State Kimberlites,Kaapvaal Craton,South Africa
K PG Min., U–Pb 90–140 Ma Archean �2.7 Ga(meta)
Dawson and Smith (1987), Dawson et al. (1997), Schmitz andBowring (2003a,b)
Newlands Kimberlite,Kaapvaal Craton,South Africa
K PG U–Pb 114 Ma Archean �2.7 Ga Schmitz and Bowring (2003a,b)
Lesotho, South Africa K MGG, MG, FG, MP, EC ME, TE, Min., Sr,Nd, Pb, U–Pb
90–140 Ma Proterozoic 1.4 Ga,1.1–1.0 Ga(meta)
Davis (1977), Rogers and Hawkesworth (1982), Griffin et al.,1979), Rogers (1977), van Calsteren et al. (1986), Huang et al.(1995), Schmitz and Bowring (2003a)
Orapa, ZimbabweCraton, Botswana
K MP U–Pb 93 Ma Proterozoic 2.0 Ga (meta),1.24 Ga(meta)
Schmitz and Bowring (2003a)
Central Cape Province,EasternNamaqualand, SouthAfrica
K MGG, AM ME, TE, Min., Sr,Nd, Pb, U–Pb
90–140 Ma Proterozoic �1.1 Ga(meta)
van Calsteren et al. (1986), Pearson et al. (1995), Schmitz andBowring (2000), Schmitz and Bowring (2003a)
Middle EastMt. Carmel, Israel AB MGG Min. �100 Ma Phanerozoic Esperanca and Garfunkel (1986), Mittlefehldt (1986)Birket Ram, Israel AB MGG, Am TE 10 000 years Phanerozoic Mittlefehldt (1984)Jordan AB MG Min. <2 Ma Proterozoic Nasir (1992), Nasir (1995)Shamah volcanicfields, Syria
AB MG Nasir and Safarjalani (2000)
AsiaUdachnaya, Siberia,Russia
K MGG Min. Archean Shatsky et al. (1990, 1983)
Tariat Depression,Central Mongolia
AB MG, MGG, IG, AM ME, TE, Min., Sr,Nd, Pb, O
<5 Ma Proterozoic Kempton and Harmon (1992), Kopylova et al. (1995), Stoschet al. (1995)
Hannuoba, NorthChina Craton
AB FG, IG, MG, MGG, AN,MP
ME, TE, Sr, Nd, Pb,U–Pb
14–27 Ma Archean �2.5, 1.9, 0.4,0.22 Ga
Gao et al. (2000), Liu et al. (2001), Chen et al. (2001), Zhou et al.(2002)
Xinyang, North Chinacraton
AB MGG ME, TE, Min. Mesozoic Archean Zheng et al. (2003)
Penghu Islands, SEChina
AB MG Lee et al. (1993)
Southeastern China AB MG, MGG, IG, FG ME, TE, Min., Sr,Nd
<20 Ma Archean/Proterozoic
Yu et al. (2003)
Ichinomegata, Japan AND AM ME, TE, Min., Sr 10 000 years Phanerozoic Kuno (1967), Aoki (1971), Zashu et al. (1980), Tanaka and Aoki(1981)
Deccan Traps, India K MG ME, Min. Dessai et al. (1999), Dessai and Vasseli (1999)
(Continued)
Com
positionof
theContinental
Crust
29
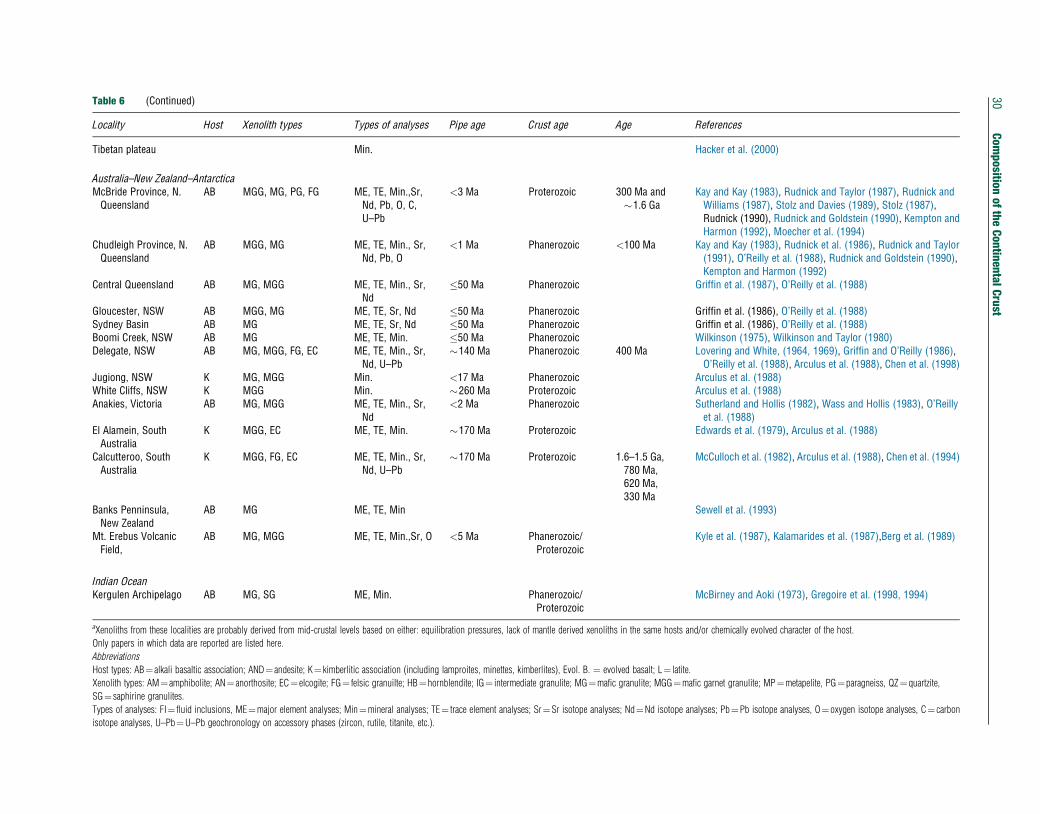
Table 6 (Continued)
Locality Host Xenolith types Types of analyses Pipe age Crust age Age References
Tibetan plateau Min. Hacker et al. (2000)
Australia–New Zealand–AntarcticaMcBride Province, N.Queensland
AB MGG, MG, PG, FG ME, TE, Min.,Sr,Nd, Pb, O, C,U–Pb
<3 Ma Proterozoic 300 Ma and�1.6 Ga
Kay and Kay (1983), Rudnick and Taylor (1987), Rudnick andWilliams (1987), Stolz and Davies (1989), Stolz (1987),Rudnick (1990), Rudnick and Goldstein (1990), Kempton andHarmon (1992), Moecher et al. (1994)
Chudleigh Province, N.Queensland
AB MGG, MG ME, TE, Min., Sr,Nd, Pb, O
<1 Ma Phanerozoic <100 Ma Kay and Kay (1983), Rudnick et al. (1986), Rudnick and Taylor(1991), O’Reilly et al. (1988), Rudnick and Goldstein (1990),Kempton and Harmon (1992)
Central Queensland AB MG, MGG ME, TE, Min., Sr,Nd
�50 Ma Phanerozoic Griffin et al. (1987), O’Reilly et al. (1988)
Gloucester, NSW AB MGG, MG ME, TE, Sr, Nd �50 Ma Phanerozoic Griffin et al. (1986), O’Reilly et al. (1988)Sydney Basin AB MG ME, TE, Sr, Nd �50 Ma Phanerozoic Griffin et al. (1986), O’Reilly et al. (1988)Boomi Creek, NSW AB MG ME, TE, Min. �50 Ma Phanerozoic Wilkinson (1975), Wilkinson and Taylor (1980)Delegate, NSW AB MG, MGG, FG, EC ME, TE, Min., Sr,
Nd, U–Pb�140 Ma Phanerozoic 400 Ma Lovering and White, (1964, 1969), Griffin and O’Reilly (1986),
O’Reilly et al. (1988), Arculus et al. (1988), Chen et al. (1998)Jugiong, NSW K MG, MGG Min. <17 Ma Phanerozoic Arculus et al. (1988)White Cliffs, NSW K MGG Min. �260 Ma Proterozoic Arculus et al. (1988)Anakies, Victoria AB MG, MGG ME, TE, Min., Sr,
Nd<2 Ma Phanerozoic Sutherland and Hollis (1982), Wass and Hollis (1983), O’Reilly
et al. (1988)El Alamein, SouthAustralia
K MGG, EC ME, TE, Min. �170 Ma Proterozoic Edwards et al. (1979), Arculus et al. (1988)
Calcutteroo, SouthAustralia
K MGG, FG, EC ME, TE, Min., Sr,Nd, U–Pb
�170 Ma Proterozoic 1.6–1.5 Ga,780 Ma,620 Ma,330 Ma
McCulloch et al. (1982), Arculus et al. (1988), Chen et al. (1994)
Banks Penninsula,New Zealand
AB MG ME, TE, Min Sewell et al. (1993)
Mt. Erebus VolcanicField,
AB MG, MGG ME, TE, Min.,Sr, O <5 Ma Phanerozoic/Proterozoic
Kyle et al. (1987), Kalamarides et al. (1987),Berg et al. (1989)
Indian OceanKergulen Archipelago AB MG, SG ME, Min. Phanerozoic/
ProterozoicMcBirney and Aoki (1973), Gregoire et al. (1998, 1994)
aXenoliths from these localities are probably derived from mid-crustal levels based on either: equilibration pressures, lack of mantle derived xenoliths in the same hosts and/or chemically evolved character of the host.
Only papers in which data are reported are listed here.
Abbreviations
Host types: AB¼ alkali basaltic association; AND¼ andesite; K¼ kimberlitic association (including lamproites, minettes, kimberlites), Evol. B. ¼ evolved basalt; L¼ latite.
Xenolith types: AM¼ amphibolite; AN¼ anorthosite; EC¼ elcogite; FG¼ felsic granuilte; HB¼hornblendite; IG¼ intermediate granulite; MG¼mafic granulite; MGG¼mafic garnet granulite; MP¼metapelite, PG¼paragneiss, QZ¼quartzite,
SG¼ saphirine granulites.
Types of analyses: FI¼ fluid inclusions, ME¼major element analyses; Min¼mineral analyses; TE¼ trace element analyses; Sr¼Sr isotope analyses; Nd¼Nd isotope analyses; Pb¼Pb isotope analyses, O¼oxygen isotope analyses, C¼ carbon
isotope analyses, U–Pb¼U–Pb geochronology on accessory phases (zircon, rutile, titanite, etc.).
30Com
positionof
theContinental
Crust
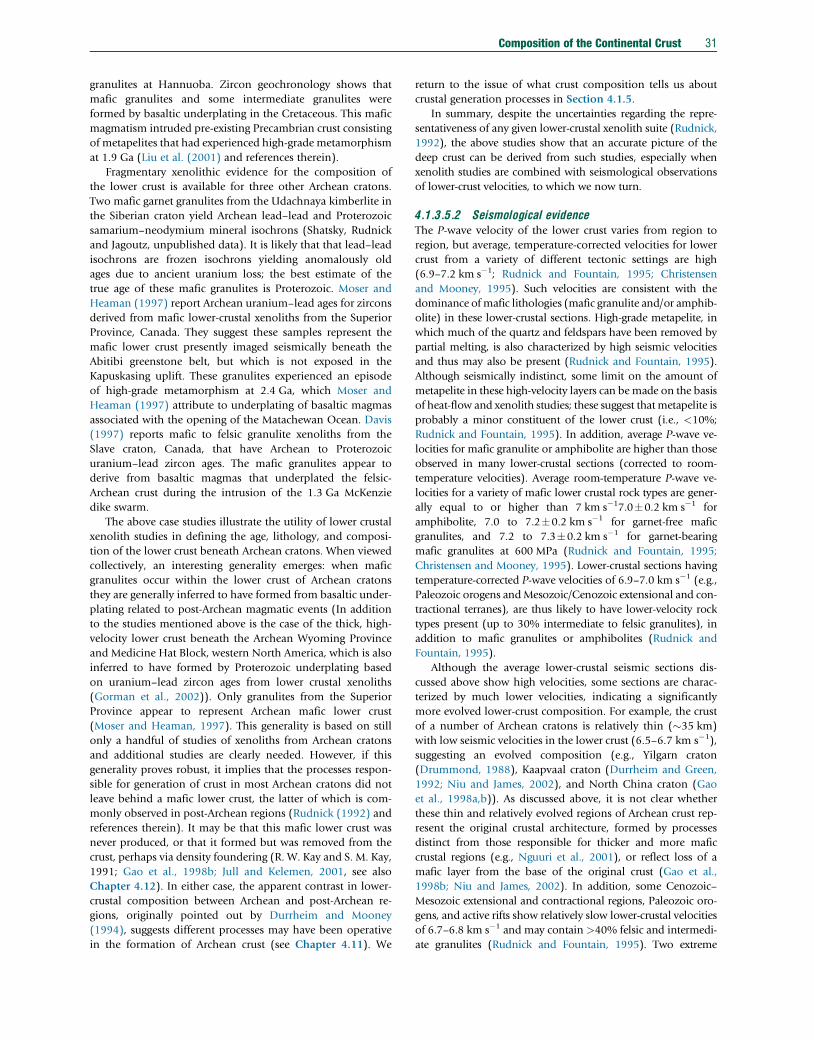
Composition of the Continental Crust 31
granulites at Hannuoba. Zircon geochronology shows that
mafic granulites and some intermediate granulites were
formed by basaltic underplating in the Cretaceous. This mafic
magmatism intruded pre-existing Precambrian crust consisting
of metapelites that had experienced high-grade metamorphism
at 1.9 Ga (Liu et al. (2001) and references therein).
Fragmentary xenolithic evidence for the composition of
the lower crust is available for three other Archean cratons.
Two mafic garnet granulites from the Udachnaya kimberlite in
the Siberian craton yield Archean lead–lead and Proterozoic
samarium–neodymium mineral isochrons (Shatsky, Rudnick
and Jagoutz, unpublished data). It is likely that that lead–lead
isochrons are frozen isochrons yielding anomalously old
ages due to ancient uranium loss; the best estimate of the
true age of these mafic granulites is Proterozoic. Moser and
Heaman (1997) report Archean uranium–lead ages for zircons
derived from mafic lower-crustal xenoliths from the Superior
Province, Canada. They suggest these samples represent the
mafic lower crust presently imaged seismically beneath the
Abitibi greenstone belt, but which is not exposed in the
Kapuskasing uplift. These granulites experienced an episode
of high-grade metamorphism at 2.4 Ga, which Moser and
Heaman (1997) attribute to underplating of basaltic magmas
associated with the opening of the Matachewan Ocean. Davis
(1997) reports mafic to felsic granulite xenoliths from the
Slave craton, Canada, that have Archean to Proterozoic
uranium–lead zircon ages. The mafic granulites appear to
derive from basaltic magmas that underplated the felsic-
Archean crust during the intrusion of the 1.3 Ga McKenzie
dike swarm.
The above case studies illustrate the utility of lower crustal
xenolith studies in defining the age, lithology, and composi-
tion of the lower crust beneath Archean cratons. When viewed
collectively, an interesting generality emerges: when mafic
granulites occur within the lower crust of Archean cratons
they are generally inferred to have formed from basaltic under-
plating related to post-Archean magmatic events (In addition
to the studies mentioned above is the case of the thick, high-
velocity lower crust beneath the Archean Wyoming Province
and Medicine Hat Block, western North America, which is also
inferred to have formed by Proterozoic underplating based
on uranium–lead zircon ages from lower crustal xenoliths
(Gorman et al., 2002)). Only granulites from the Superior
Province appear to represent Archean mafic lower crust
(Moser and Heaman, 1997). This generality is based on still
only a handful of studies of xenoliths from Archean cratons
and additional studies are clearly needed. However, if this
generality proves robust, it implies that the processes respon-
sible for generation of crust in most Archean cratons did not
leave behind a mafic lower crust, the latter of which is com-
monly observed in post-Archean regions (Rudnick (1992) and
references therein). It may be that this mafic lower crust was
never produced, or that it formed but was removed from the
crust, perhaps via density foundering (R. W. Kay and S. M. Kay,
1991; Gao et al., 1998b; Jull and Kelemen, 2001, see also
Chapter 4.12). In either case, the apparent contrast in lower-
crustal composition between Archean and post-Archean re-
gions, originally pointed out by Durrheim and Mooney
(1994), suggests different processes may have been operative
in the formation of Archean crust (see Chapter 4.11). We
return to the issue of what crust composition tells us about
crustal generation processes in Section 4.1.5.
In summary, despite the uncertainties regarding the repre-
sentativeness of any given lower-crustal xenolith suite (Rudnick,
1992), the above studies show that an accurate picture of the
deep crust can be derived from such studies, especially when
xenolith studies are combined with seismological observations
of lower-crust velocities, to which we now turn.
4.1.3.5.2 Seismological evidenceThe P-wave velocity of the lower crust varies from region to
region, but average, temperature-corrected velocities for lower
crust from a variety of different tectonic settings are high
(6.9–7.2 km s�1; Rudnick and Fountain, 1995; Christensen
and Mooney, 1995). Such velocities are consistent with the
dominance of mafic lithologies (mafic granulite and/or amphib-
olite) in these lower-crustal sections. High-grade metapelite, in
which much of the quartz and feldspars have been removed by
partial melting, is also characterized by high seismic velocities
and thus may also be present (Rudnick and Fountain, 1995).
Although seismically indistinct, some limit on the amount of
metapelite in these high-velocity layers can bemade on the basis
of heat-flow and xenolith studies; these suggest thatmetapelite is
probably a minor constituent of the lower crust (i.e., <10%;
Rudnick and Fountain, 1995). In addition, average P-wave ve-
locities for mafic granulite or amphibolite are higher than those
observed in many lower-crustal sections (corrected to room-
temperature velocities). Average room-temperature P-wave ve-
locities for a variety of mafic lower crustal rock types are gener-
ally equal to or higher than 7 km s�17.0�0.2 km s�1 for
amphibolite, 7.0 to 7.2�0.2 km s�1 for garnet-free mafic
granulites, and 7.2 to 7.3�0.2 km s�1 for garnet-bearing
mafic granulites at 600 MPa (Rudnick and Fountain, 1995;
Christensen and Mooney, 1995). Lower-crustal sections having
temperature-corrected P-wave velocities of 6.9–7.0 km s�1 (e.g.,
Paleozoic orogens andMesozoic/Cenozoic extensional and con-
tractional terranes), are thus likely to have lower-velocity rock
types present (up to 30% intermediate to felsic granulites), in
addition to mafic granulites or amphibolites (Rudnick and
Fountain, 1995).
Although the average lower-crustal seismic sections dis-
cussed above show high velocities, some sections are charac-
terized by much lower velocities, indicating a significantly
more evolved lower-crust composition. For example, the crust
of a number of Archean cratons is relatively thin (�35 km)
with low seismic velocities in the lower crust (6.5–6.7 km s�1),
suggesting an evolved composition (e.g., Yilgarn craton
(Drummond, 1988), Kaapvaal craton (Durrheim and Green,
1992; Niu and James, 2002), and North China craton (Gao
et al., 1998a,b)). As discussed above, it is not clear whether
these thin and relatively evolved regions of Archean crust rep-
resent the original crustal architecture, formed by processes
distinct from those responsible for thicker and more mafic
crustal regions (e.g., Nguuri et al., 2001), or reflect loss of a
mafic layer from the base of the original crust (Gao et al.,
1998b; Niu and James, 2002). In addition, some Cenozoic–
Mesozoic extensional and contractional regions, Paleozoic oro-
gens, and active rifts show relatively slow lower-crustal velocities
of 6.7–6.8 km s�1 and may contain >40% felsic and intermedi-
ate granulites (Rudnick and Fountain, 1995). Two extreme

32 Composition of the Continental Crust
examples are the southern Sierra Nevada and Central Andean
backarc. In both cases, the entire crustal columns are character-
ized by P-wave velocities of less than 6.4 km s�1 (Beck and
Zandt, 2002; Wernicke et al., 1996). A relatively high-velocity
(Vp¼6.4–6.8 km s�1) layer of<5 km in thickness occurs only at
the base of the Central Andean backarc at �60 km depth.
In summary, the seismic velocity of the lower crust is variable
from region to region, but is generally high, suggesting a dom-
inance of mafic lithologies. However, most seismic sections
require the presence of evolved compositions in addition to
mafic lithologies in the lower crust (up to 30% for average
velocity of 6.9 km s�1) and a few regions (e.g., continental arcs
and some Archean cratons) are characterized by slow lower
crust, indicating a highly evolved average composition. This
diversity of lithologies is consistent with that seen in both crustal
cross-sections and lower-crustal xenolith suites and also pro-
vides a mechanism (lithological layering) to explain the com-
mon occurrence of seismic reflections observed in many seismic
reflection profiles (Mooney and Meissner, 1992).
4.1.3.5.3 Lower-crust compositionTable 7 lists previous estimates of the composition of the lower
crust. These estimates include averages of exposed granulites
(columns 1 and 2; Weaver and Tarney, 1984; Shaw et al.,1994),
averages of individual lower-crustal xenolith suites (columns
3–6, Condie and Selverstone, 1999; Liu et al., 2001; Rudnick
and Taylor, 1987; Villaseca et al., 1999), the median composi-
tion of lower-crustal xenoliths (column 7; updated from
Rudnick and Presper (1990), with data from papers cited in
Table 6 (the complete geochemical database for lower crustal
xenoliths is available on the GERM web site http://earthref.org/
cgi-bin/erda.cgi?n¼1,2,3,8 and also on the Treatise web site),
averages derived from linking seismic velocity data for the lower
crust with the compositions of lower-crustal rock types (col-
umns 8–10; Rudnick and Fountain, 1995; Wedepohl, 1995;
Gao et al., 1998a), and Taylor and McLennan’s model lower
crust (column 11). It is readily apparent from this table and
Figures 12 and 13 that, compared to estimates of the upper-crust
composition (Table 1), there is much greater variability in esti-
mates of the lower-crust composition. For example, TiO2, MgO,
FeOT, and Na2O all vary by over a factor of 2, CaO varies by
almost a factor of 7, and K2O varies by over an order of magni-
tude between the different estimates (Figures 12 and 13). Trace
elements show correspondingly large variations (Figure 13). In
contrast, modern estimates of major elements in the upper
crust generally fall within 20% of each other (Table 1 and
Figure 2 – gray shading) and most trace elements fall with
50%. We now explore the possible reasons for these variations,
with an eye towards determining a ‘best estimate’ of the global
lower-crust composition.
The two lower-crustal estimates derived from averages of
surface granulites are generally more evolved than other
estimates (Table 7, and Figures 12 and 13). Weaver and
Tarney’s (1984) lower-crustal estimate derives from the average
of Archean Scourian granulites in the Lewisian complex,
Scotland. It is one of the most evolved compositions given
in the table and is characterized by a steeply fractionated
REE pattern, which is characteristic of Archean granitoids
of the tonalite–trondhjemite–granodiorite assemblage (see
Chapter 4.11) and severe depletions in the large-ion
lithophile elements, in addition to thorium and uranium
(Rudnick et al., 1985). The estimate of Shaw et al. (1994)
derives from a weighted average of the granulite-facies rocks
of the Kapuskasing Structural Zone, Canadian Shield. The
average is intermediate in overall composition. As discussed
in Section 4.1.3.4.1, the Kapuskasing cross-section provides
samples down to depths of �25 km, leaving the lower 20 km
of lower crust unexposed. Seismic-velocity data show this
unexposed deepest crust to be mafic in bulk composition,
consistent with the limited data for lower-crustal xenoliths
from the Superior province (Moser and Heaman, 1997).
Thus, the lower-crustal estimates of Weaver and Tarney
(1984) and Shaw et al. (1994) may be representative of
evolved lower crust in Archean cratons lacking a high-velocity
lower crust, but are unlikely to be representative of the global
continental lower crust (Archean cratons constitute only �7%
of the total area of the continental crust (Goodwin, 1991)).
The lower-crustal estimates derived from particular xenolith
suites (columns 3–6, Table 7) were selected to illustrate the
great compositional heterogeneity in the deep crust. The aver-
age weighted composition of lower-crustal xenoliths from cen-
tral Spain (Villaseca et al., 1999) is one of the most felsic
compositions in Table 7 (with �63 wt% SiO2, Figure 12(b)).
It has higher K2O content than nearly every estimate of the
upper crust composition (Table 1), and has such a high heat
production (0.8 mW m�3), that a 40 km thickness of crust with
average upper- and middle-crustal compositions given in
Tables 3 and 5, respectively, would generate a surface heat
flow of 41 mWm�2. This is equivalent to 100% of surface heat
flow through Archean crust, 85% of surface heat flow through
Proterozoic crust, and 71% of the surface heat flow through
Paleozoic crust (see Chapter 4.2). Assuming the heat flux
through the Moho is �17 mWm�2 (see Chapter 4.2) this
lower-crust composition could thus be representative of the
lower crust in Phanerozoic regions with high surface heat flow,
but clearly cannot be representative of the global average lower
crust. Likewise, the ‘evolved’ xenolith-derived lower crustal esti-
mate of Liu et al. (2001) for the central zone of the North China
craton, also has a high-K2O content that exceeds that in most
modern estimates of the upper continental crust (Table 1 and
Figure 12(b)). Total crustal heat production calculated as de-
scribed above using the Liu et al. composition for the lower crust
yields a value of 0.95 mWm�3, which corresponds to a surface
heat flow of 34 mWm�2. This composition is thus unlikely to
be representative of the lower crust in Archean cratons, where
average surface heat flow is 41�1 mWm�2 (Nyblade and Pol-
lack, 1993). However, surface heat flow through this part of the
North China craton is unusually high (50 mWm�2; Hu et al.,
2000), thus permitting a more radiogenic lower crust in this
region. Other peculiarities of this bulk composition include an
extreme Mg# of 76 (Mg#¼100 * molar Mg/(MgþFe)) and
extreme nickel (347 ppm) and chromium (490 ppm) contents.
These values are especially unusual given the rather felsic bulk
composition of this estimate and reflect the very high Mg#mafic
granulites present in this suite and the inclusion of up to 25%
peridotite within the lower-crustal mixture modeled by Liu et al.
(2001). This estimate also has the highest strontium and barium
contents of all estimates (712 ppm and 1434 ppm, respectively)
and is the most HREE depleted (Table 7). The two remaining
average lower-crustal xenolith suites (Rudnick and Taylor, 1987

Table 7 Compositional estimates of the lower continental crust. Major elements in weight percent. Trace element concentration units the same as in Table 2
1Weaver andTarney (1984)
2Shaw et al.(1994)
3Rudnick andTaylor (1987)
4Condie andSelverstone(1999)
5Villasecaet al. (1999)
6Liu et al.(2001)
7Global LowerCrustal Xenolith
8Rudnick andFountain (1995)
9Wedepohl(1995)
10Gao et al.(1998a)
11Taylor andMcLennan (1985,1995)
SiO2 62.9 58.3 49.6 52.6 62.7 59.6 52.0 53.4 59.0 59.8 54.3TiO2 0.5 0.65 1.33 0.95 1.04 0.60 1.13 0.82 0.85 1.04 0.97b
A12O3 16.0 17.4 16.4 16.4 17.4 13.9 17.0 16.9 15.8 14.0 16.1FeOT
a 5.4 7.09 12.0 10.5 7.52 5.44 9.08 8.57 7.47 9.30 10.6MnO 0.08 0.12 0.22 0.16 0.10 0.08 0.15 0.10 0.12 0.16 0.22MgO 3.5 4.36 8.72 6.04 3.53 9.79 7.21 7.24 5.32 4.46 6.28CaO 5.8 7.68 10.1 8.50 1.58 4.64 10.28 9.59 6.92 6.20 8.48Na2O 4.5 2.70 1.43 3.19 2.58 2.60 2.61 2.65 2.91 3.00 2.79K2O 1.0 1.47 0.17 1.37 3.41 3.30 0.54 0.61 1.61 1.75 0.64b
P2O5 0.19 0.24 0.21 0.16 0.13 0.13 0.10 0.21Mg# 53.4 52.3 56.5 50.5 45.6 76.2 58.6 60.1 55.9 46.1 51.4Li 14 3.3 5 6 13 13 11Be 1.7 1.1 1.0B 3.2 5 7.6 8.3N 34F 429 703S 408 231Cl 278 216Sc 16 33 28 17 20 29 31 25 26 35b
V 140 217 139 100 189 196 149 185 271b
Cr 88 168 276 133 178 490 145 215 228 123 219b
Co 38 31 20 22 31 41 38 38 36 36b
Ni 58 75 141 73 65 347 80 88 99 64 156b
Cu 28 29 40 32 26 37 50 90Zn 83 83 89 85 78 79 102 83Ga 15 17 13 17 19 18Ge 1.4 1.24 1.6As 1.3 1.6 0.8Se 0.17 0.17 0.05Br 0.28Rb 11 41 12 37 90 51 7 11 41 56 12b
Sr 569 447 196 518 286 712 354 348 352 308 230Y 7 16 28 40 8 20 16 27 18 19Zr 202 114 127 86 206 180 68 68 165 162 70Nb 5 5.6 13 7.75 15 6.4 5.6 5.0 11 10 6.7b
Mo 0.8 0.8 0.6 0.54 0.8RuPd 2.78 1Ag 80 51 90Cd 0.101 0.097 0.098In 0.052 0.050
(Continued)
Com
positionof
theContinental
Crust
33
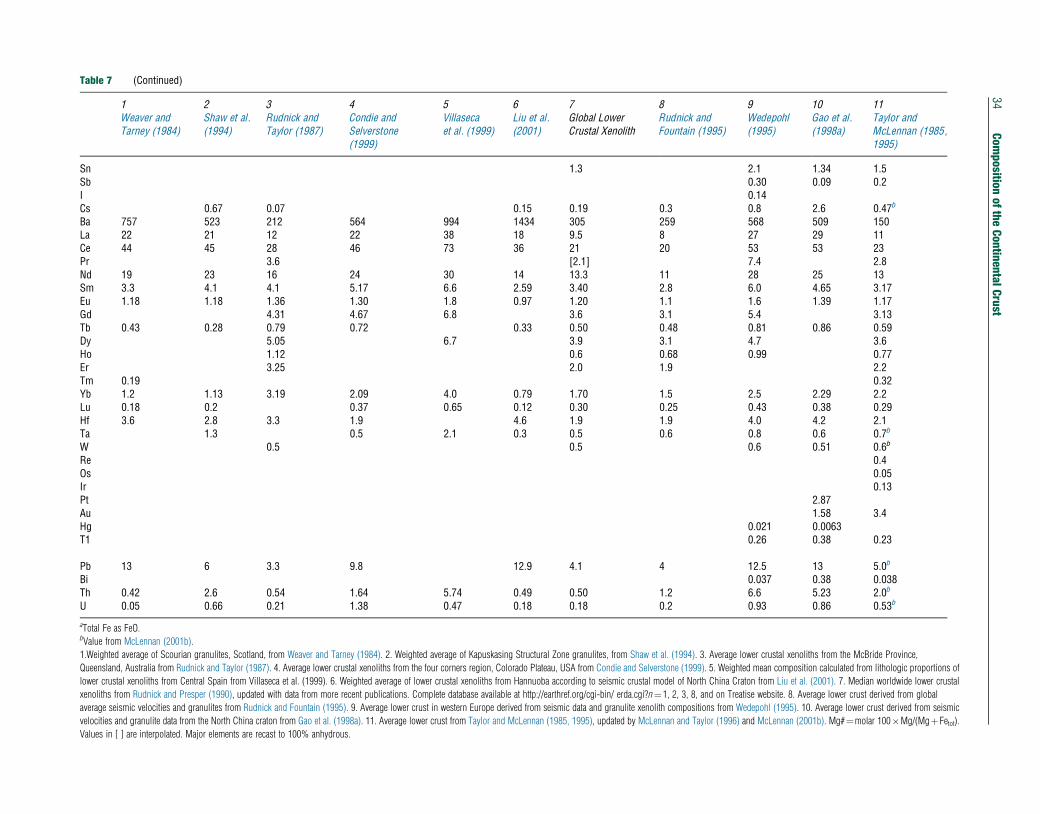
Table 7 (Continued)
1Weaver andTarney (1984)
2Shaw et al.(1994)
3Rudnick andTaylor (1987)
4Condie andSelverstone(1999)
5Villasecaet al. (1999)
6Liu et al.(2001)
7Global LowerCrustal Xenolith
8Rudnick andFountain (1995)
9Wedepohl(1995)
10Gao et al.(1998a)
11Taylor andMcLennan (1985,1995)
Sn 1.3 2.1 1.34 1.5Sb 0.30 0.09 0.2I 0.14Cs 0.67 0.07 0.15 0.19 0.3 0.8 2.6 0.47b
Ba 757 523 212 564 994 1434 305 259 568 509 150La 22 21 12 22 38 18 9.5 8 27 29 11Ce 44 45 28 46 73 36 21 20 53 53 23Pr 3.6 [2.1] 7.4 2.8Nd 19 23 16 24 30 14 13.3 11 28 25 13Sm 3.3 4.1 4.1 5.17 6.6 2.59 3.40 2.8 6.0 4.65 3.17Eu 1.18 1.18 1.36 1.30 1.8 0.97 1.20 1.1 1.6 1.39 1.17Gd 4.31 4.67 6.8 3.6 3.1 5.4 3.13Tb 0.43 0.28 0.79 0.72 0.33 0.50 0.48 0.81 0.86 0.59Dy 5.05 6.7 3.9 3.1 4.7 3.6Ho 1.12 0.6 0.68 0.99 0.77Er 3.25 2.0 1.9 2.2Tm 0.19 0.32Yb 1.2 1.13 3.19 2.09 4.0 0.79 1.70 1.5 2.5 2.29 2.2Lu 0.18 0.2 0.37 0.65 0.12 0.30 0.25 0.43 0.38 0.29Hf 3.6 2.8 3.3 1.9 4.6 1.9 1.9 4.0 4.2 2.1Ta 1.3 0.5 2.1 0.3 0.5 0.6 0.8 0.6 0.7b
W 0.5 0.5 0.6 0.51 0.6b
Re 0.4Os 0.05Ir 0.13Pt 2.87Au 1.58 3.4Hg 0.021 0.0063T1 0.26 0.38 0.23
Pb 13 6 3.3 9.8 12.9 4.1 4 12.5 13 5.0b
Bi 0.037 0.38 0.038Th 0.42 2.6 0.54 1.64 5.74 0.49 0.50 1.2 6.6 5.23 2.0b
U 0.05 0.66 0.21 1.38 0.47 0.18 0.18 0.2 0.93 0.86 0.53b
aTotal Fe as FeO.bValue from McLennan (2001b).
1.Weighted average of Scourian granulites, Scotland, from Weaver and Tarney (1984). 2. Weighted average of Kapuskasing Structural Zone granulites, from Shaw et al. (1994). 3. Average lower crustal xenoliths from the McBride Province,
Queensland, Australia from Rudnick and Taylor (1987). 4. Average lower crustal xenoliths from the four corners region, Colorado Plateau, USA from Condie and Selverstone (1999). 5. Weighted mean composition calculated from lithologic proportions of
lower crustal xenoliths from Central Spain from Villaseca et al. (1999). 6. Weighted average of lower crustal xenoliths from Hannuoba according to seismic crustal model of North China Craton from Liu et al. (2001). 7. Median worldwide lower crustal
xenoliths from Rudnick and Presper (1990), updated with data from more recent publications. Complete database available at http://earthref.org/cgi-bin/ erda.cgi?n¼1, 2, 3, 8, and on Treatise website. 8. Average lower crust derived from global
average seismic velocities and granulites from Rudnick and Fountain (1995). 9. Average lower crust in western Europe derived from seismic data and granulite xenolith compositions from Wedepohl (1995). 10. Average lower crust derived from seismic
velocities and granulite data from the North China craton from Gao et al. (1998a). 11. Average lower crust from Taylor and McLennan (1985, 1995), updated by McLennan and Taylor (1996) and McLennan (2001b). Mg#¼molar 100�Mg/(MgþFetot).
Values in [ ] are interpolated. Major elements are recast to 100% anhydrous.
34Com
positionof
theContinental
Crust

2.0
1.5
1.0
Terrains and models
0.5Nor
mal
ized
to
R a
nd F
Nor
mal
ized
to
R a
nd F
0.0
2.0
1.5
1.0
0.5
0.0
Si Al Fe Mg Ca Na K
Si(b)
(a)
N. Queensland
Weaver and Tarney
Shaw et al.
Wedepohl
Taylor and McLennan
Gao et al.
Colorado PlateauCentral Spain
Median Xenolith
E. China
Al Fe Mg
Xenolith suites
Ca Na K
Figure 12 Comparison of different major-element estimates of thecomposition of the lower continental crust. All data normalized to thelower-crust composition of Rudnick and Fountain (1995), which isadopted here. Gray shaded field represents �10% variation from themodel of Rudnick and Fountain (1995). (a) Models based on granuliteterrains (Scourian granulites: Weaver and Tarney, 1984; KapuskasingStructural Zone: Shaw et al., 1986), seismological models (EasternChina: Gao et al., 1998a,b; western Europe: Wedepohl, 1995) and Taylorand McLennan (1985, 1995; modified by McLennan, 2001b) model lowercrust. (b) Models based on weighted averages of lower crustal xenoliths.These include: Northern Queensland, Australia (Rudnick and Taylor, 1987);Colorado Plateau, USA (Condie and Selverstone, 1999); Central Spain(Villaseca et al., 1999); eastern China (Liu et al., 2001) and the medianglobal lower crustal xenolith composition, updated from Rudnick andPresper (1990). Note that K data for eastern China and Central Spain areco-incident on this plot, making it hard to distinguish the separate lines.
Composition of the Continental Crust 35
and Condie and Selverstone, 1999) both have mafic composi-
tions that more closely approximate the global average-xenolith
composition (column 7 in Table 7).
It has been shown repeatedly from numerous xenolith stud-
ies that the majority of lower-crustal xenoliths are mafic in
composition (Rudnick and Presper (1990), Rudnick (1992),
and Downes (1993) and references therein). Thus, the ‘best
estimate’ of the lower crust made on the basis of xenolith studies
is found in column 7 of Table 7, which gives the median com-
position of all analyzed lower-crustal xenoliths. Yet it remains
unclear to what degree xenolith compositions reflect average
lower crust. Uncertainties include the degree to which volcanic
pipes sample a representative cross-section of the deep crust and
whether certain xenoliths (e.g., felsic xenoliths and meta-
carbonates) suffer preferential disaggregation or dissolution in
the host magmas. In addition, large compositional variations are
apparent from place to place (Figure 12(b)) and xenolith data
are only available for limited regions of the continents.
For these reasons, the best estimates of lower-crustal com-
position rely on combining seismic velocities of the lower
crust with compositions of ‘typical’ lower-crustal lithologies
to derive the bulk composition (Christensen and Mooney,
1995; Rudnick and Fountain, 1995; Wedepohl, 1995; Gao
et al., 1998a). Wedepohl (1995) used seismic data from the
European Geotraverse and Gao et al. (1998a) used data from
the North China craton to estimate lower-continental crust
composition. The resulting compositions derived from these
studies (Table 7, and Figures 12 and 13) reflect the thin and
more evolved crust in these regions relative to global averages,
and produce too much heat to be representative of global
lower crust (Rudnick et al., 1998; see Chapter 4.2).
The studies of Rudnick and Fountain (1995) and
Christensen and Mooney (1995) are probably best representa-
tive of the global deep continental crust, as these authors used
overlapping, but not identical, global seismic data sets and
independent geochemical data sets to derive the bulk-crust
composition. Christensen and Mooney (1995) do not provide
the compositional data they used for their lower-crustal assem-
blages and they do not report a lower-crust composition; thus,
one cannot derive an independent estimate of the bulk lower
crust from their work. However, they do model the global
lower crust (25�40 km depth) as containing �7% tonalite
gneiss and 93% mafic lithologies (including amphibolite,
mafic granulite, and mafic-garnet granulite). Such a mafic-
bulk composition is consistent with the results of Rudnick
and Fountain (1995) (Table 7). Thus, we adopt the lower-
crust composition of Rudnick and Fountain (1995) as the
best available model of global lower-crust composition, with
the proviso that our understanding will evolve as more exten-
sive and detailed information becomes available about the
seismic velocity structure of the lower crust. This composition
has higher iron, magnesium, and calcium, and considerably
lower potassium than most other estimates of the lower conti-
nental crust (Figure 12), reflecting the overall high P-wave
velocities in the lower crust on a worldwide basis and the
use of lower crustal xenoliths to derive the average mafic gran-
ulite composition. Reliance on xenolith data also accounts for
the lower concentrations of highly incompatible trace elements
in this composition (e.g., LREEs, rubidium, caesium, barium,
thorium, and uranium) compared tomost other estimates of the
lower crust (Figure 13). For trace elements not considered by
Rudnick and Fountain (1995), we adopt the averages of values
given in Gao et al. (1998a), Wedepohl (1995), or studies
focused specifically on the lower-crustal composition of partic-
ular trace elements (e.g., antimony, arsenic, molybdenum (Sims
et al., 1990); boron (Leeman et al., 1992); tungsten (Newsom
et al., 1996); rhenium; and osmium (Saal et al., 1998)). The
resulting lower-crustal composition is given in Table 8.
It is interesting to note that the lower-crust composition of
Rudnick and Fountain (1995) is quite similar to that of Taylor
and McLennan (1985, 1995). However, this similarity is
deceptive as Taylor and McLennan’s ‘lower crust’ actually rep-
resents the crust below the ‘upper crust’ or between �10 km
depth and the Moho. Thus, Taylor and McLennan’s lower
crust is equivalent to the combined middle and lower
crust given here, and is considerably less evolved than the
crustal models adopted here (see Section 4.1.4 for a descrip-
tion of how Taylor and McLennan’s crust composition was
derived).

3.0
2.5 Transition metals High field-strength
2.0
1.5
1.0
0.5
(a) (b)
(c) (d)
4.0
3.5
3.0
2.5
2.0
1.5
1.0
0.5
4.0
3.5
3.0
2.5
2.0
1.5
1.0
0.5
La Ce Nd Sm Eu Gd Yb Lu
Rare earthWeaver and Tarney
Shaw et al.
Gao et al.
Wedepohl
Taylor and McLennan
Median xenolith
Li Rb Cs Sr Ba Pb Th U
3.0
2.5
2.0
1.5
1.0
0.5
Ti Zr Hf Nb TaMn Sc V Cr Co Ni Cu Zn
Figure 13 Comparison of different models of the trace-element composition of the lower continental crust. All values normalized to the lower-crustcomposition of Rudnick and Fountain (1995), which is adopted here as the ‘best estimate’ of the global lower crust. Gray-shaded field represents�30% variation from this value. Trace elements are divided into the following groups: (a) transition metals, (b) high-field strength elements, (c) alkali,alkaline earth, and actinides, and (d) REEs.
36 Composition of the Continental Crust
In summary, our knowledge of lower-crustal composition,
like the middle crust, is limited by the ambiguity in deriving
chemical compositions from seismic velocities, the lack of
high-quality data for a number of trace elements and by the
still fragmentary knowledge of the seismic structure of the
continental crust. Although the various lower-crustal composi-
tional models in Table 7 show large variations, the true uncer-
tainty in the global model is likely to fall within the
seismologically constrained estimates and thus the uncertainty
is on the order of �30% for most major elements. Uncer-
tainties in trace-element abundances are generally higher
(Figure 13). Whereas concentrations of the transition metals
between the different estimates generally fall within �60%,
uncertainties in the highly incompatible trace elements (e.g.,
caesium and thorium; Figure 13) and highly siderophile ele-
ments (e.g., PGE) can be as large as an order of magnitude.
Despite these rather large uncertainties, there are some conclu-
sions that can be drawn from this analysis. The lower crust has
a mafic composition and is strongly depleted in potassium and
other highly incompatible elements relative to higher levels of
the crust. The lower crust is LREE enriched and probably has a
positive europium anomaly (Figure 14). Like the upper and
middle crust, it is also characterized by enrichment in lead
relative to cerium and praseodymium and depletion in nio-
bium relative to lanthanum. It is also likely to be enriched in
strontium relative to neodymium (Figure 14).
4.1.4 Bulk Crust Composition
The earliest estimates of the continental crust composition
were derived from analyses and observed proportions of upper
crustal rock types (Clarke, 1889; Clarke and Washington,
1924; Ronov and Yaroshevsky, 1967). These estimates do not
take into account the changes in both lithological proportions
and metamorphic grade that are now recognized to occur with
depth in the crust (see Section 4.1.3) and are thus more
appropriately regarded as estimates of upper-crust composi-
tion. (It is interesting to note, however, the remarkably good
correspondence of these earliest estimates with those of today
(cf. Tables 1 and 9)). Taylor (1964) used a different approach
to estimate bulk crust composition. Following Goldschmidt
(1933), he assumed that the nearly constant REE pattern of
sedimentary rocks reflected the REE pattern of the crust as a
whole, and recreated that pattern by mixing ‘average’ felsic-
and mafic-igneous rocks in approximately equal proportions.
His composition (Table 9) is also remarkably similar to more
modern estimates for a large number of elements, but like the
earliest estimates, is more appropriately considered an upper
crustal estimate since sediments derive strictly from upper
crustal sources. Following the plate-tectonic revolution,
Taylor (1967) modified his crust-composition model. Recog-
nizing that the present site of continental growth is at
convergent-plate margins, he developed the ‘island arc’ or ‘an-
desite’ model for crustal growth and hence crust composition.
In this model (Taylor, 1967, 1977), the crust is assumed to have
a composition equal to average convergent-margin andesite.
Taylor and McLennan (1985) discussed the difficulties with
this approach. Moreover, it is now recognized that basalts dom-
inate present intra-oceanic arcs (see Chapter 4.21, and refer-
ences therein).
Crust-composition estimates made since the 1970s derive
from a variety of approaches. Smithson (1978) was the first to
use seismic velocities to determine the lithological makeup of

Table 8 Recommended composition of the lower continental crust.Major elements in weight percent. Trace element concentration units thesame as in Table 2
Element Lowercrust
Sourcea Element Lowercrust
Sourcea
SiO2 53.4 1 Ag 65 2TiO2 0.82 1 Cd 0.1 2Al2O3 16.9 1 In 0.05 4FeOT 8.57 1 Sn 1.7 2MnO 0.10 1 Sb 0.1 5MgO 7.24 1 I 0.1 4CaO 9.59 1 Cs 0.3 1Na2O 2.65 1 Ba 259 1K2O 0.61 1 La 8 1P2O5 0.10 1 Ce 20 1Li 13 2 Pr 2.4 7Be 1.4 2 Nd 11 1B 2 3 Sm 2.8 1N 34 4 Eu 1.1 1F 570 2 Gd 3.1 1S 345 2 Tb 0.48 1Cl 250 2 Dy 3.1 1Sc 31 1 Ho 0.68 1V 196 1 Er 1.9 1Cr 215 1 Tm 0.24 7Co 38 1 Yb 1.5 1Ni 88 1 Lu 0.25 1Cu 26 1 Hf 1.9 1Zn 78 1 Ta 0.6 1Ga 13 1 W 0.6 8Ge 1.3 2 Re 0.18 9As 0.2 5 Os 0.05 9Se 0.2 2 Ir 0.05 10Br 0.3 4 Pt 2.7 6Rb 11 1 Au 1.6 11Sr 348 1 Hg 0.014 2Y 16 1 Tl 0.32 2Zr 68 1 Pb 4 1Nb 5 1 Bi 0.2 2Mo 0.6 5 Th 1.2 1Ru 0.75 6 U 0.2 1Pd 2.8 4
aSources: 1. Rudnick and Fountain (1995). 2. Average of values given in Wedepohl
(1995) and Gao et al. (1998a). 3. Leeman et al. (1992). 4. Wedepohl (1995). 5.
Calculated assuming As/Ce¼0.01, Sb/Ce¼0.005 and Mo/Ce¼0.03 (Sims et al.,
1990). 6. Assuming Ru/Ir ratio and Pt/Pd ratios equal to that of upper continental cust.
7. Value interpolated from REE pattern. 8. Average of all values in Table 7, plus
correlation from Newsom et al. (1996), using W/Th¼0.5. 9. Saal et al. (1998). 10.
Taylor and McLennan (1985). 11. Gao et al. (1998a).
1000
100
10
1La
Chondrite normalized
Lower crust
Ce Pr Nd Sm Eu Gd Tb Dy Ho Er Tm Yb Lu
1000
100
10
1Cs
Rb Th K La Pb Sr Zr Sm Ti Ho
Mantle normalized
Weaver and TarneyShaw et al.Rudnick and FountainWedepohlGao et al.Taylor and McLennan
Ba U Nb Ce Pr Nd Hf Eu Y Yb
Figure 14 REE (upper) and multi-element plot (lower) of thecompositions of the lower crust given in Table 7. Compositions derivedfrom individual xenolith suites not shown. Chondrite values from Taylorand McLennan (1985) and primitive mantle values from McDonoughand Sun (1995).
Composition of the Continental Crust 37
the deep crust. His crust composition is similar to other esti-
mates, save for the very high alkali element contents (4 wt%
Na2O and 2.7 wt% K2O), which presumably reflects the choice
of granitic rocks used in his calculations. Holland and Lambert
(1972), Weaver and Tarney (1984), and Shaw et al. (1986)
recognized the importance of granulite-facies rocks in the deep
crust and based their crustal models on the composition of
rocks from high-grade terranes exposed at the Earth’s surface
and previous estimates of upper crustal composition.
Taylor and McLennan (1985, 1995), like Taylor’s pre-
vious estimates (Taylor, 1967, 1977), derived their crust
composition using an approach based on assumptions about
its formation processes. They assumed that 75% of the crust
grew during the Archean from bimodal volcanism and the
remaining 25% originated from post-Archean accretion of is-
land arcs having an average andesite composition (from
Taylor, 1977). To constrain the proportions of mafic- to
felsic-Archean volcanics, they used heat-flow data from Ar-
chean cratons, which is relatively low and uniform at
�40 mWm�2 (see Chapter 4.2). Assuming that half the sur-
face heat flow derives from the mantle yielded a mafic to felsic
proportion of 2 : 1. This dominantly mafic Archean-crustal
component is reflected in the major- and trace-element com-
position of their crust. Their crust has low SiO2 and K2O, high
MgO and CaO, and very high FeO content. It also has the
highest transition-metal concentrations and lowest incompat-
ible element concentrations of all the models presented in
Table 9.
Refinements of the Taylor and McLennan (1985) model are
provided by McLennan and Taylor (1996) and McLennan
(2001b). The latter is a modification of several trace-element
abundances in the upper crust and as such, should not
affect their compositional model for the bulk crust, which
does not rely on their upper crustal composition. Neverthe-
less, McLennan (2001b) does provide modified bulk-crust
estimates for niobium, rubidium, caesium, and tantalum

Table 9 Compositional estimates of the bulk continental crust. Major elements in weight percent. Trace element concentration units the same as in Table 2.
1Taylor(1964)
2Ronov andYaroshevsky (1967)
3Holland andLambert (1972)
4Smithson(1978)
5Weaver andTarney (1984)
6Shaw et al.(1986)
7Christensen andMooney (1995)
8Rudnick andFountain (1995)
9Wedepohl(1995)
10Gaoet al. (1998a)
11Taylor andMcLennan(1985, 1995)
12Thisstudya
SiO2 60.4 62.2 62.8 63.7 63.9 64.5 62.4 60.1 62.8 64.2 57.1 60.6TiO2 1.0 0.8 0.7 0.7 0.6 0.7 0.9 0.7 0.7 0.8 0.9 0.72AI2O3 15.6 15.7 15.7 16.0 16.3 15.1 14.9 16.1 15.4 14.1 15.9 15.9FeOT
b 7.3 6.3 5.5 5.3 5.0 5.7 6.9 6.7 5.7 6.8 9.1 6.71MnO 0.12 0.10 0.10 0.10 0.08 0.09 0.10 0.11 0.10 0.12 0.18 0.10MgO 3.9 3.1 3.2 2.8 2.8 3.2 3.1 4.5 3.8 3.5 5.3 4.66CaO 5.8 5.7 6.0 4.7 4.8 4.8 5.8 6.5 5.6 4.9 7.4 6.41Na2O 3.2 3.1 3.4 4.0 4.2 3.4 3.6 3.3 3.3 3.1 3.1 3.07K2O 2.5 2.9 2.3 2.7 2.1 2.4 2.1 1.9 2.7 2.3 1.3 1.81P2O5 0.24 0.20 0.19 0.14 0.20 0.20 0.18 0.13Mg# 48.7 47.0 50.9 49.0 50.5 50.1 44.8 54.3 54.3 48.3 50.9 55.3
Li 20 11 18 17 13 17Be 2.8 2.4 1.7 1.5 1.9B 10 9.3 11 18 10 11N 20 60 56F 625 525 602 553S 260 697 283 404Cl 130 472 179 244Sc 22 13 22 16 19 30 21.9V 135 96 131 98 128 230 138Cr 100 56 90 119 126 92 185 135Co 25 26 25 24 24 29 26.6Ni 75 35 54 51 56 46 105 59Cu 55 26 24 25 38 75 27Zn 70 71 73 65 81 80 72Ga 15 16 15 18 18 16Ge 1.5 1.4 1.25 1.6 1.3As 1.8 1.7 3.1 1.0 2.5Se 0.05 0.12 0.13 0.05 0.13Br 2.5 1.0 0.88Rb 90 61 76 58 78 69 37c 49Sr 375 503 317 325 333 285 260 320Y 33 14 26 20 24 17.5 20 19Zr 165 210 203 123 203 175 100 132Nb 20 13 20 8d 19 11 8d 8Mo 1.5 1.1 0.65 1.0 0.8Ru 0.1 0.57Pd 0.4 1.74 1 1.5Ag 70 70 52 80 56Cd 0.20 0.10 0.08 0.10 0.08
38Com
positionof
theContinental
Crust

In 0.1 0.05 0.05 0.05Sn 2.0 2.3 1.5 2.5 1.7Sb 0.2 0.3 0.2 0.2 0.2I 0.5 0.8 0.7
Cs 3.0 2.6 3.4 2.8 1.5c 2Ba 425 707 764 390 584 614 250 456La 30 28 18 30 31.6 16 20Ce 60 57 42 60 60.0 33 43Pr 8.2 6.7 3.9 4.9Nd 28 23 20 27 27.4 16 20Sm 6 4.1 3.9 5.3 4.84 3.5 3.9Eu 1.2 1.09 1.2 1.3 1.27 1.1 1.1Gd 5.4 4.0 3.3 3.7Tb 0.9 0.53 0.56 0.65 0.82 0.60 0.6Dy 3.0 3.8 3.7 3.6Ho 1.2 0.80 0.78 0.77Er 2.8 2.1 2.2 2.1Tm 0.48 0.24 0.30 0.32 0.28Yb 3.0 1.5 2.0 2.0 2.2 2.2 1.9Lu 0.50 0.23 0.33 0.35 0.35 0.30 0.30Hf 3 4.7 5 3.7 4.9 4.71 3.0 3.7Ta 2 4 0.7d 1.1 0.6 0.8c 0.7W 1.5 1.0 0.7 1.0 1Re 0.4 0.4 0.19Os 0.05 0.05 0.041Ir 0.05 0.10 0.037Pt 0.4 1.81 0.5Au 40 2.5 1.21 3.0 1.3Hg 0.08 0.040 0.009 0.03Tl 0.45 0.52 0.39 0.36 0.50Pb 12.5 15 20 12.6 14.8 15 8.0 11Bi 0.17 0.085 0.27 0.06 0.18Th 9.6 5.7 9 5.6 8.5 7.1 4.2 5.6U 2.7 1.3 1.8 1.4 1.7 1.2 1.1 1.3
aSee Table 10 for derviation of this estimate.bTotal Fe as FeO. Mg#¼molar 100�Mg/(MgþFetot).cUpdated by McLennan (2001b).dUp dated by Barth et al. (2000).
Major elements recast to 100% anhydrous.
Com
positionof
theContinental
Crust
39

Table 10 Recommended composition of the bulk continental crust
Element Units Element Units
SiO2 wt% 60.6 Ag ng g�1 56TiO2 ” 0.7 Cd mg g�1 0.08Al2O3 ” 15.9 In ” 0.052FeOT ” 6.7 Sn ” 1.7MnO ” 0.10 Sb ” 0.2MgO ” 4.7 Ia ” 0.7CaO ” 6.4 Cs ” 2Na2O ” 3.1 Ba ” 456K2O ” 1.8 La ” 20P2O5 ” 0.1 Ce ” 43Li mg g�1 16 Pr ” 4.9Be ” 1.9 Nd ” 20B ” 11 Sm ” 3.9Na ” 56 Eu ” 1.1F ” 553 Gd ” 3.7S ” 404 Tb ” 0.6Cl ” 244 Dy ” 3.6Sc ” 21.9 Ho ” 0.77V ” 138 Er ” 2.1Cr ” 135 Tm ” 0.28Co ” 26.6 Yb ” 1.9Ni ” 59 Lu ” 0.30Cu ” 27 Hf ” 3.7Zn ” 72 Ta ” 0.7Ga ” 16 W ” 1Ge ” 1.3 Rea ng g�1 0.188As ” 2.5 Osa ” 0.041Se ” 0.13 Ira ” 0.037Bra ” 0.88 Pt ” 1.5Rb ” 49 Au ” 1.3Sr ” 320 Hg mg g�1 0.03Y ” 19 Tl ” 0.50Zr ” 132 Pb ” 11Nb ” 8 Bi ” 0.18Mo ” 0.8 Th ” 5.6Rua ng g�1 0.6 U ” 1.3Pd ” 1.5 ”
aMiddle crust is not considered due to lack of data.
The total-crust composition is calculated according to the upper, middle and
lower-crust compositions obtained in this study and corresponding weighing factors of
0.317, 0.296 and 0.388. The weighing factors are based on the layer thickness of the
global continental crust, recalculated from crustal structure and areal proportion of
various tectonic units given by Rudnick and Fountain (1995).
40 Composition of the Continental Crust
(and these are dealt with in the footnotes of Table 9).
McLennan and Taylor (1996) revisited the heat-flow con-
straints on the proportions of mafic and felsic rocks in the
Archean crust and revised the proportion of Archean-aged
crust to propose a more evolved bulk crust composition. This
revised composition is derived from a mixture of 60% Archean
crust (which is a 50 : 50 mixture of mafic and felsic end-
member lithologies), and 40% average-andesite crust of
Taylor (1977). McLennan and Taylor (1996) focused on po-
tassium, thorium, and uranium, and did not provide amended
values for other elements, although other incompatible ele-
ments will be higher (e.g., rubidium, barium, LREEs) and
compatible elements lower in a crust composition so revised.
More recently, a number of studies have estimated the bulk-
crust composition by deriving lithological proportions for
the deep crust from seismic velocities (as discussed in
Section 4.1.3) with upper crustal contributions based on
data for surface rocks or previous estimates of the upper crust
(Christensen andMooney, 1995; Rudnick and Fountain, 1995;
Wedepohl, 1995; Gao et al., 1998a) (Table 9). Like previous
estimates of the crust, all of these show intermediate bulk
compositions with very similar major-element contents. The
greatest differences in major elements between these recent
seismologically based estimates are for MgO, CaO, and K2O,
which show �30% variation, with the Rudnick and Fountain
(1995) estimate having the highest MgO and CaO, and lowest
K2O (Table 9, Figure 15). Most trace elements from these
estimates fall within 30% total variation as well (Figure 16);
the exceptions are trace elements for which very limited data
exist (i.e., sulfur, chlorine, arsenic, tin, mercury, bismuth, and
the PGEs). Niobium and tantalum also show >30% total
variation, but this is due to the very high niobium and
tantalum contents of Wedepohl’s estimate, which reflects
his reliance on the old Canadian Shield data, for which
niobium content is anomalously high (see discussion in
Section 4.1.2.1). These elements were also compromised in
the Rudnick and Fountain (1995) crust composition, which
relied (indirectly) on the Canadian Shield data for the upper
crust by adopting the Taylor and McLennan upper-crust com-
position (see discussions in Plank and Langmuir (1998) and
Barth et al. (2000)). The values for niobium and tantalum in
the Rudnick and Fountain (1995) model given in Table 9 have
been updated by Barth et al. (2000). These values are similar to
those of Gao et al. (1998a) and thus the concentrations of
these elements are known to within 30% in the bulk crust.
Of all the estimates in Table 9, that of Taylor andMcLennan
(1985, 1995) stands out as being the most mafic overall
(Figures 15 and 16). This mafic composition stems from
their model for Archean crust, which constitutes 75% of their
crust and is composed of a 2 : 1 mixture of mafic- to felsic-
igneous rocks. This relatively mafic crust composition was
necessitated by their inferred low heat production in Archean
crust and the inferred large proportion of the Archean-aged
crust. However, such a high proportion of mafic rocks in the
Archean crust is at odds with seismic data (summarized in
Section 4.1.3), which show that the crust of most Archean
cratons is dominated by low velocities, implying the presence
of felsic (not mafic) compositions, even in the lower crust.
In addition, some of the assumptions used by Taylor and
McLennan (1985) regarding heat flow are not very robust, as
recognized by McLennan and Taylor (1996) (see also discus-
sion in Rudnick et al., 1998). First, the 20 mWm�2 of mantle
heat flow they assumed for Archean cratons is probably too
high (see Chapter 4.2), thus allowing for more heat produc-
tion in the crust. Second, granulite-facies felsic rocks are often
depleted in heat-producing elements (the Scourian granulites
are an extreme example), thereby allowing a greater proportion
of felsic rocks in the crust. Third, it is unlikely that 75% of the
present continents were formed in the Archean (see
Chapter 4.10) and, importantly, the observed low surface
heat flow that is the rationale for Taylor and McLennan’s
(1985, 1995) dominantly mafic crust composition is restricted
to Archean cratons, which constitute only �7% of the present
continental crust (Goodwin, 1991). Indeed, heat production
of the Taylor and McLennan (1985, 1995) crustal model falls

1.4 Rudnick and FountainWedepohlGao et al.
Chirstensen and MooneySmithson
Holland and Lambert
Weaver and Tarney
Shaw et al.
Taylor and McLennan
(a)
(b)
Nor
mal
ized
to
R a
nd G
1.2
1.0
0.8
0.6
Si Al Fe Mg Ca Na K
1.4
Nor
mal
ized
to
R a
nd G
1.2
1.0
0.8
0.6
Si Al Fe Mg Ca Na K
Figure 15 Comparison of different estimates of the major-elementcomposition of the bulk continental crust. All data normalized to the newcomposition given here (Table 10, ‘R&G’); gray shading depicts 10%variation from this composition. (a) Models based on seismological data(Rudnick and Fountain, 1995; Wedepohl, 1995; Gao et al., 1998a;Christensen and Mooney, 1995 and Smithson, 1978). (b) Models basedon both surface exposures (Holland and Lambert, 1972; Weaver andTarney, 1984; Shaw et al., 1986) and Taylor and McLennan’s (1985,1995) model-generated crust composition.
Composition of the Continental Crust 41
outside the range estimated for average continental crust
by Jaupart and Mareschal (see Chapter 4.2) (i.e.,
0.58 mW m�2 versus 0.79–0.99 mWm�2). The modifications
made to this model by McLennan and Taylor (1996) help to
reconcile their model with the above observations, but the
proportion of mafic rocks in Archean-aged crust still appears
to be high (based on observed seismic velocities) and the total
heat production (at 0.70 mW m�2) may still be somewhat low.
4.1.4.1 A New Estimate of Crust Composition
In column 12 of Table 9 we present a new estimate of the bulk
crust composition. This composition derives from our esti-
mates of upper, middle, and lower crust given in Tables 3,5,
and 8, mixed in the proportions derived from the global com-
pilation of Rudnick and Fountain (1995): 31.7% upper, 29.6%
middle, and 38.8% lower crust. Our new crustal estimate
thus relies heavily on the previously derived lower crust of
Rudnick and Fountain (1995), the middle crust of Rudnick
and Fountain and Gao et al. (1998a) and the new estimate of
upper-crust composition provided here (Table 3). The latter is
very similar to the upper crust of Taylor and McLennan (1985)
(Figure 8), which was used by Rudnick and Fountain (1995) in
calculating their bulk crust composition. The main differences
lie in the concentrations of K2O, rubidium, niobium, and
tantalum, which are lower in the new estimate of the upper
continental crust provided here. Accordingly, this new estimate
has many similarities with that of Rudnick and Fountain
(1995), but contains lower potassium, rubidium, niobium,
and tantalum, and considers a wider range of trace elements
than given in that model. The heat production of this new
estimate is 0.89 mW m�2, which falls in the middle of the
range estimated for average-crustal heat production by Jaupart
and Mareschal (see Chapter 4.2).
Figures 15–17 show how this composition compares to
other estimates of crust composition. Figure 15 shows that
our new composition has generally higher MgO, CaO, and
FeO, and lower Na2O and K2O than most other seismically
based models. The differences between our model and that
of Wedepohl (1995) and Gao et al. (1998a) likely reflect
the regional character of these latter models (western Europe,
eastern China), where the crust is thinner and more evolved
than the global averages (Chirstensen and Mooney, 1995, and
Rudnick and Fountain, 1995). The lower MgO and higher
alkali elements in Christensen and Mooney’s model compared
to ours must stem from the differences in the chemical data-
bases used to construct these two models, as the lithological
proportions of the deep crust are very similar (Section 4.1.3).
Rudnick and Fountain (1995) (and hence our current compo-
sition) used the compositions of lower-crustal xenoliths to
constrain the mafic end-member of the deep crust. These
xenoliths have high Mg# and low alkalis (Table 7), and thus
may be chemically distinct from mafic rocks exposed on the
Earth’s surface (the chemical data used by Christensen and
Mooney, 1995).
The variations between the different seismological-based
crust compositions can be considered representative of the un-
certainties that exist in our understanding of the bulk crust
composition. Some elemental concentrations (e.g., silicon, alu-
minum, sodium) are known to within 20% uncertainty. The
remaining major-element and many trace-element (transition
metals, high-field strength elements, most REE) concentrations
are known to within 30% uncertainty. Still some trace element
concentrations are yet poorly constrained in the crust, including
many of the highly siderophile elements (Figure 16).
4.1.4.2 Intracrustal Differentiation
Table 11 provides the composition of the upper, middle,
lower, and bulk crust for comparison purposes and Figure 17
compares their respective REE and extended trace-element pat-
terns. The upper crust has a large negative europium anomaly
(Eu/Eu*, Table 11) that is largely complemented by the posi-
tive europium anomaly of the lower crust; the middle crust
has essentially no europium anomaly. Similar complementary
anomalies exist for strontium. These features, in addition to
the greater LREE enrichment of the upper crust relative to
the lower crust, suggests that the upper crust is largely the
product of intracrustal magmatic differentiation in the pres-
ence of plagioclase (see Taylor and McLennan, 1985; see
Chapter 4.11). That is, the upper crust is dominated by
granite that differentiated from the lower crust through partial
melting, crystal fractionation and mixing processes. The mid-
dle crust has an overall trace-element pattern that is very sim-
ilar to the upper crust, indicating that it too is dominated by

2.0
(a) (b)
(d)
(f)
(c)
(e)
Mn Cr Co Ni Cu Zn
Transition metals
2.8
S V
1.5
1.0
0.5
2.0
Alkali and alkaline earth
Actinides and heavy metals
Li Cs Sr BaRb
1.5
1.0
0.5
2.0
Tl Bi Th UPb
1.5
1.0
0.5
2.0
Siderophile and chalcophile
2.3
Pd In SbSn Au HgAg Cd
1.5
1.0
0.5
2.0
La Sm GdEu Tb Yb Lu
Rudnick and FountainWedepohl
Taylor and McLennan
Rare earthGao et al.
Ce Nd
1.5
1.0
0.5
2.0
Ti Hf TaNb Mo W
High field-strength
2.2
Zr
1.5
1.0
0.5
Figure 16 Comparison of the trace-element composition of bulk continental crust from seismological and model-based approaches. All datanormalized to the new composition given here (Table 10, “R&G”). Gray shading depicts�30% variation from Rudnick and Gao composition (this work).(a) Transition metals, (b) high-field strength elements, (c) alkali and alkaline earth metals, and (d) REEs, (e) actinides and heavy metals, and(f) siderophile and chalcophile elements.
42 Composition of the Continental Crust
the products of intracrustal differentiation. All segments of the
crust are characterized by an overall enrichment of the
most incompatible elements, as well as high La/Nb and
low Ce/Pb ratios. These are characteristics of convergent mar-
gin magmas (see Chapter 4.16, and references therein)
and thus have implications for the processes responsible for
generation of the continental crust as discussed in the next
section.
4.1.5 Implications of the Crust Composition
Despite the uncertainties in estimating crust composition dis-
cussed in the previous section, there are a number of similar-
ities that all crust-compositional models share and these may
be important for understanding the origin of the crust. The
crust is characterized by an overall intermediate igneous-rock
composition, with relatively high Mg#. It is enriched in incom-
patible elements (Figure 18), and contains up to 50% of
the silicate Earth’s budget of these elements (Rudnick and
Fountain, 1995). It is also well established that the crust is
depleted in niobium relative to lanthanum, and has a sub-
chondritic Nb/Ta ratio. These features are not consistent with
formation of the crust by single-stage melting of peridotitic
mantle, as discussed in Rudnick (1995), Kelemen (1995) and
Rudnick et al. (2000) (see also Chapter 4.21).
If one assumes that the crust grows ultimately by igneous
processes (i.e., magmatic transport of mass from the mantle
into the crust), then the disparity between crust composition
and the composition of primary mantle melts requires the
operation of additional processes to produce the present crust
composition. As reviewed in Rudnick (1995) and Kelemen
(1995), these additional processes could include (but are not
limited to):
1. Recycling of mafic/ultramafic lower crust and upper mantle
via density foundering (often referred to as delamination within the
geochemical literature). In this process, lithologically stratified
continental crust is thickened during an orogenic event, caus-
ing the mafic lower crust to transform to eclogite, which has a
higher density than the underlying mantle peridotite. Provided

Table 11 Comparison of the upper, middle, lower and total continentalcrust compositions recommended here. See Table 2 for Units
Element Uppercrust
Middlecrust
Lowercrust
Totalcrust
SiO2 66.6 63.5 53.4 60.6TiO2 0.64 0.69 0.82 0.72Al2O3 15.4 15.0 16.9 15.9FeOT 5.04 6.02 8.57 6.71MnO 0.10 0.10 0.10 0.10MgO 2.48 3.59 7.24 4.66CaO 3.59 5.25 9.59 6.41Na2O 3.27 3.39 2.65 3.07K2O 2.80 2.30 0.61 1.81P2O5 0.15 0.15 0.10 0.13Total 100.05 100.00 100.00 100.12Mg# 46.7 51.5 60.1 55.3Li 24 12 13 16Be 2.1 2.3 1.4 1.9B 17 17 2 11N 83 34 56F 557 524 570 553S 621 249 345 404Cl 370 182 250 244Sc 14.0 19 31 21.9V 97 107 196 138Cr 92 76 215 135Co 17.3 22 38 26.6Ni 47 33.5 88 59Cu 28 26 26 27Zn 67 69.5 78 72Ga 17.5 17.5 13 16Ge 1.4 1.1 1.3 1.3As 4.8 3.1 0.2 2.5Se 0.09 0.064 0.2 0.13Br 1.6 0.3 0.88Rb 84 65 11 49Sr 320 282 348 320Y 21 20 16 19Zr 193 149 68 132Nb 12 10 5 8Mo 1.1 0.60 0.6 0.8Ru 0.34 0.75 0.57Pd 0.52 0.76 2.8 1.5Ag 53 48 65 56Cd 0.09 0.061 0.10 0.08In 0.056 0.05 0.052Sn 2.1 1.30 1.7 1.7Sb 0.4 0.28 0.10 0.2I 1.4 0.14 0.71Cs 4.9 2.2 0.3 2Ba 628 532 259 456La 31 24 8 20Ce 63 53 20 43Pr 7.1 5.8 2.4 4.9Nd 27 25 11 20Sm 4.7 4.6 2.8 3.9Eu 1.0 1.4 1.1 1.1Gd 4.0 4.0 3.1 3.7Tb 0.7 0.7 0.48 0.6Dy 3.9 3.8 3.1 3.6Ho 0.83 0.82 0.68 0.77Er 2.3 2.3 1.9 2.1
(Continued)
Table 11 (Continued)
Element Uppercrust
Middlecrust
Lowercrust
Totalcrust
Tm 0.30 0.32 0.24 0.28Yb 2.0 2.2 1.5 1.9Lu 0.31 0.4 0.25 0.30Hf 5.3 4.4 1.9 3.7Ta 0.9 0.6 0.6 0.7W 1.9 0.60 0.60 1Re 0.198 0.18 0.188Os 0.031 0.05 0.041Ir 0.022 0.05 0.037Pt 0.5 0.85 2.7 1.5Au 1.5 0.66 1.6 1.3Hg 0.05 0.0079 0.014 0.03Tl 0.9 0.27 0.32 0.5Pb 17 15.2 4 11Bi 0.16 0.17 0.2 0.18Th 10.5 6.5 1.2 5.6U 2.7 1.3 0.2 1.3Eu/Eu* 0.72 0.96 1.14 0.93Heat production(mW m�3)
1.65 1.00 0.19 0.89
Nb/Ta 13.4 16.5 8.3 12.4Zr/Hf 36.7 33.9 35.8 35.5Th/U 3.8 4.9 6.0 4.3K/U 9475 15 607 27 245 12 367La/Yb 15.4 10.7 5.3 10.6Rb/Cs 20 30 37 24K/Rb 283 296 462 304La/Ta 36 42 13 29
Composition of the Continental Crust 43
the right temperatures and viscosities exist (i.e., hot and goey),
the base of the lithosphere will sink into the underlying
asthenosphere. Numerical simulations of this process show
that it is very likely to occur at the time of arc–continent
collision (and in fact, may be impossible to avoid)(Jull and
Kelemen, 2001).
2. Production of crust from a mixture of silicic melts derived from
subducted oceanic crust, and basaltic melts from peridotite. This pro-
cess is likely to have been more prevalent in a hotter, Archean
Earth (although see Chapter 4.21 for an alternative view) and
would have involved extensive silicic melt–peridotite reaction as
the slab melts traverse the mantle wedge (Kelemen, 1995).
The abundance of Archean-aged granitoids of the so-called
‘TTG’ suite (trondhjemite, tonalite, granodiorite) are often cited
as the surfacemanifestations of these processes (Drummond and
Defant, 1990; Martin, 1994; see Chapter 4.11).
3. Weathering of the crust, with preferential recycling of
Mg�Ca into the mantle via hydrothermally altered mid-ocean
ridge basalt (Albarede, 1998; Anderson, 1982). This hypothesis
states that during continental weathering, soluble cations such
as Ca2þ, Mg2þ, and Naþ are carried to the oceans while silicon
and aluminum remain behind in the continental regolith.
Whereas other elements (e.g., sodium) may be returned to
the continents via arc magmatism, magnesium may be prefer-
entially sequestered into altered seafloor basalts and returned
to the mantle via subduction, producing a net change in the
crust composition over time. However, one potential problem

100
10
1000
1La(a)
(b)
Chondrite normalized
Upper crustMiddle crustLower crust
Ce Pr Nd Sm Eu Gd Tb Dy Ho Er Tm Yb Lu
100
10
1Cs
Rb Th K La Pb Sr Zr Sm Ti Ho
Mantle normalized
Ba U Nb Ce Pr Nd Hf Eu Y Yb
Figure 17 Comparison of (a) rare-earth and (b) additionaltrace-element compositions of the upper, middle, and lower crustrecommended here. Chondrite values from Taylor and McLennan (1985),mantle-normalizing values from McDonough and Sun (1995).
1000
100
10
1La Ce Pr Nd
Chondrite normalized
Total crust
Sm Eu Gd Tb Dy Ho Er Tm Yb Lu
1000
100
10
1Cs Ba Nb Ce Pr Nd Hf Eu Y YbU
Mantle normalized
Rb Th K La Pb Sr Zr Sm Ti Ho
Weaver and TarneyRudnick and FountainThis StudyWedepohlGao et al.Taylor and McLennan
Figure 18 REE (upper) and multi-element plot (lower) of thecompositions of the continental crust given in Table 9. Chondrite valuesfrom Taylor and McLennan (1985), mantle-normalizing values fromMcDonough and Sun (1995).
44 Composition of the Continental Crust
with this hypothesis is that examination of altered ocean-floor
rocks suggests that magnesiummay not be significantly seques-
tered there (see Chapter 4.16).
A fourth possibility, that ultramafic cumulates representing
the chemical complement to the andesitic crust are present in
the uppermost mantle, is not supported by studies of mantle
xenoliths, which show a predominance of restitic peridotite
over cumulates (e.g., Wilshire et al., 1988). If such cumulates
were originally there, they must have been subsequently re-
moved via a process such as density foundering.
All of the above processes require return of mafic to ultra-
mafic lithologies to the convecting mantle. These lithologies
are the chemical complement of the present-day andesitic
crust. Thus crustal recycling, in various forms, must have
been important throughout Earth history.
Another implication of the distinctive trace element com-
position of the continental crust is that the primary setting of
crust generation is most likely to be that of a convergent
margin. The characteristic depletion of niobium relative to
lanthanum seen in the crust (Figure 18) is a ubiquitous feature
of convergent margin magmas (see review of Kelemen et al.
(Chapter 4.21)) and is virtually absent in intraplate magmas.
Simple mixing calculations indicate that the degree of niobium
depletion seen in the crust suggests that at least 80% of the
crust was generated in a convergent margin (Barth et al., 2000;
Plank and Langmuir, 1998).
4.1.6 Earth’s Crust in a Planetary Perspective
The other terrestrial planets show a variety of crustal types, but
none that are similar to that of the Earth. Mercury has an
ancient, heavily cratered crust with a high albedo (see review
of Taylor and Scott (Chapter 1.18)). Its brightness plus the
detection of sodium, and more recently the refractory element
calcium, in the Mercurian atmosphere (Bida et al., 2000) has
led to the speculation that Mercury’s crust may be anorthositic,
like the lunar highlands (see Taylor, 1992 and references
therein). The MESSENGER mission (http://messenger.jhuapl.
edu/), currently planned to rendezvous with Mercury in 2007,
should considerably illuminate the nature of the crust on
Mercury.
In contrast to Mercury’s ancient crust, high-resolution radar
mapping of Venus’ cloaked surface has revealed an active planet,
both tectonically and volcanically (see review of Fegley
(Chapter 1.19) and references therein). Crater densities are
relatively constant, suggesting a relatively young surface
(�300–500 Ma, Phillips et al., 1992; Schaber et al., 1992;
Strom et al., 1994). It has been suggested that this statistically
random crater distribution may reflect episodes of mantle over-
turn followed by periods of quiescence (Schaber et al., 1992;
Strom et al., 1994). Most Venusian volcanoes appear to erupt
basaltic magmas, but a few are pancake-shaped, which may

Composition of the Continental Crust 45
signify the eruption of a highly viscous lava such as rhyolite (e.g.,
Ivanov and Head, 1999). The unimodal topography of Venus is
distinct from that of the Earth and there appear to be no equiv-
alents to Earth’s oceanic and continental dichotomy. It is possi-
ble that the high elevations on Venus were produced tectonically
by compression of basaltic rocks made rigid by the virtual ab-
sence of water (Mackwell et al., 1998).
Of the terrestrial planets, only Mars has the bimodal topo-
graphic distribution seen on the Earth (Smith et al., 1999). In
addition, evolved igneous rocks, similar to the andesites
found in the continents on Earth, have also been observed
on the Martian surface, although their significance and rela-
tive abundance is a matter of contention (see review by
McSween (Chapter 1.22)). However, the bimodal topogra-
phy of Mars appears to be an ancient feature (Frey et al.,
2002), unlike the Earth’s, which is a product of active plate
tectonics. It remains to be seen whether the rocks that com-
pose the high-standing southern highlands of Mars bear any
resemblance to those of Earth’s continental crust (McLennan,
2001a; Wanke et al., 2001).
4.1.7 Summary
The crust is the Earth’s major repository of incompatible ele-
ments and thus factors prominently into geochemical mass-
balance calculations for the whole Earth. For this reason, and
to understand the processes by which it formed, determining the
composition of the continental crust has been a popular pursuit
of geochemists from the time the first rocks were analyzed.
It has been known for over a century that the continental
crust has an average composition approximating to andesite
(when cast as an igneous rock type) (Clarke, 1889; Clarke and
Washington, 1924). The myriad studies on continental crust
composition carried out in the intervening years have refined
our picture of the crust’s composition, particularly for trace
elements.
Based on seismic investigations the crust can be divided
into three regions: upper, middle, and lower continental
crust. The upper crust is the most accessible region of the
solid earth and its composition is estimated from both
weighted averages of surface samples and studies of shales
and loess. The latter is a particularly powerful means of esti-
mating the average upper crustal concentrations of insoluble to
moderately soluble trace elements. Most estimates of the
major-element composition of the upper continental crust
fall within 20% standard deviation of the mean and thus the
composition of this important reservoir appears to be reason-
ably well known. The concentrations of some trace elements
also appear to be known to within 20% (most of the transition
metals, rubidium, strontium, yttrium, zirconium, niobium,
barium, REE, hafnium, tantalum, lead, thorium, and ura-
nium), whereas others are less-precisely known. In particular,
very few estimates have been made of the upper crust’s halo-
gen, sulfur, germanium, arsenic, selenium, indium, and
platinum-group element concentration.
Lacking the access and widescale natural sampling by
sediments afforded the upper crust, the composition of the
deep crust must be inferred from more indirect means. Both
heat flow and seismic velocities have been employed towards
this end. Heat flow provides bounds on the potassium, tho-
rium, and uranium content of the crust, and seismic-wave
speeds can be interpreted, with some caveats, in terms of rock
types, whose compositions are derived from averages of ap-
propriate deep-crustal lithologies. The middle crust is per-
haps the least well characterized of the three crustal regions.
This is due to the lack of systematic geochemical studies of
amphibolite-facies crustal lithologies. In contrast, the lower
crust has been the target of a number of geochemical investi-
gations, yet there is wide variation in different estimates of
lower-crust composition. This reflects, in part, the highly
heterogeneous character of this part of the Earth. However,
some generalities can be made. Heat production must de-
crease and seismic velocities are observed to increase with
depth in the crust. Thus the lower crust is, on an average,
mafic in composition and depleted in heat-producing ele-
ments. Curiously, the lower crust of many Archean cratons,
where heat flow is lowest, has relatively slow P-wave veloci-
ties. Such low velocities imply the dominance of evolved rock
types and thus these rocks must be highly depleted in potas-
sium, thorium, and uranium compared to their upper crustal
counterparts.
The andesitic continental crust composition is difficult to
explain if the crust is generated by single-stage melting of
peridotitic mantle, and additional processes must therefore
be involved in its generation. All of these processes entail
return of mafic or ultramafic crustal material (which is com-
plementary to the present continental crust) to the convecting
mantle. Thus crustal recycling, in various forms, must have
been important throughout Earth history and is undoubtedly
related to the plate-tectonic cycle on our planet. Crustal recy-
cling, along with the presence of abundant water to facilitate
melting (Campbell and Taylor, 1985), may be the major factor
responsible for our planet’s unique crustal dichotomy.
Acknowledgments
We thank Sandy Romeo and Yongshen Liu for their able assis-
tance in the preparation of this manuscript and updating of the
lower-crustal xenolith database. Reviews by Kent Condie and
Scott McLennan and comments from Herbert Palme and Rich
Walker improved the presentation. This work was supported by
NSF grant EAR 99031591 to R.L.R., a National Nature Science
Foundation of China grant (40133020) and a Chinese Ministry
of Science and Technology grant (G1999043202) to S.G.
References
Albarede F (1998) The growth of continental crust. In: Vauchez A and Meissner RO(eds.) Continents and Their Mantle Roots, Tectonophysics, vol. 296, 1–2, pp. 1–14.Amsterdam: Elsevier.
Alirezaei S and Cameron EM (2002) Mass balance during gabbro-amphibolitetransition, Bamble sector, Norway: Implications for petrogenesis and tectonic settingof the gabbros. Lithos 60(1–2): 21–45.
Anderson AT (1982) Parental basalts in subduction zones: Implications for continentalevolution. Journal of Geophysical Research 87: 7047–7060.
Aoki K-I (1971) Petrology of mafic inclusion from Itinome-gata, Japan. Contributions toMineralogy and Petrology 30: 314–331.
Arculus RJ and Smith D (1979) Eclogite, pyroxenite, and amphibolite inclusions in theSullivan Buttes latite, Chino Valley, Yavapai County, Arizona. In: Boyd FR and

46 Composition of the Continental Crust
Meyer HOA (eds.) The Mantle Sample: Inclusions in Kimberlites and OtherVolcanics, pp. 309–317. Washington, DC: American Geophysical Union.
Arculus RJ, Ferguson J, Chappell BW, et al. (1988) Trace element and isotopiccharacteristics of eclogites and other xenoliths derived from the lower continental crustof southeastern Australia and southwestern Colorado Plateau USA. In: Smith DC (ed.)Eclogites and Eclogite-Facies Rocks, pp. 335–386. Amsterdam: Elsevier.
Baldridge WS (1979) Mafic and ultramafic inclusion suites from the Rio Grande Rift(New Mexico) and their bearing on the composition and thermal state of thelithosphere. Journal of Volcanology and Geothermal Research 6: 319–351.
Barth M, McDonough WF, and Rudnick RL (2000) Tracking the budget of Nb and Ta inthe continental crust. Chemical Geology 165: 197–213.
Barth M, Rudnick RL, Carlson RW, Horn I, and McDonough WF (2002) Re–Os andU–Pb geochronological constraints on the eclogite-tonalite connection in theArchean Man Shield, West Africa. Precambrian Research 118(3–4): 267–283.
Beck SL and Zandt G (2002) The nature of orogenic crust in the central Andes.Journal of Geophysical Research 107(B10): 2230.
Behn MD and Kelemen PB (2003) The relationship between seismic P-wave velocityand the composition of anhydrous igneous and meta-igneous rocks. Geochemistry,Geophysics, Geosystems (4): 1041. http://dx.doi.org/10.1029/2002GC000393.
Berckhemer H (1969) Direct evidence for the composition of the lower crust and Moho.Tectonophysics 8: 97–105.
Berg JH, Moscati RJ, and Herz DL (1989) A petrologic geotherm from a continental riftin Antarctica. Earth and Planetary Science Letters 93: 98–108.
Bida TA, Killen RM, and Morgan TH (2000) Discovery of calcium in Mercury’satmosphere. Nature 404: 159–161.
Bohlen SR and Mezger K (1989) Origin of granulite terranes and the formation of thelowermost continental crust. Science 244: 326–329.
Borodin LS (1998) Estimated chemical composition and petrochemical evolution of theupper continental crust. Geochemistry International 37(8): 723–734.
Bowring SA and Williams IS (1999) Priscoan (4.00–4.03 Ga) orthogneisses fromnorthwestern Canada. Contributions to Mineralogy and Petrology 134(1): 3–16.
Bradley SD and McCallum ME (1984) Granulite facies and related xenoliths fromColorado-Wyoming kimberlite. In: Kornprobst J (ed.) Kimberlites: II. The Mantleand Crust–Mantle Relationships, vol. 11B, pp. 205–218. Amsterdam: Elsevier.
Broadhurst JR (1986) Mineral reactions in xenoliths from the Colorado Plateau:Implications for lower crustal conditions and fluid composition. In: Dawson JB,Carswell DA, Hall J, and Wedepohl KH (eds.) The Nature of the Lower ContinentalCrust, Geological Society Special Publication 24, pp. 331–349. London, GeologicalSociety of London.
Brittan J and Warner M (1996) Seismic velocity, heterogeneity, and the composition ofthe lower crust. Tectonophysics 264: 249–259.
Brittan J and Warner M (1997) Wide-angle seismic velocities in heterogeneous crust.Geophysical Journal International 129: 269–280.
Burke MM and Fountain DM (1990) Seismic properties of rocks from an exposure ofextended continental crust—new laboratory measurements from the Ivrea zone.Tectonophysics 182: 119–146.
Cameron KL and Ward RL (1998) Xenoliths of Grenvillian granulite basement constrainmodels for the origin of voluminous Tertiary rhyolites, Davis Mountains, west Texas.Geology 26(12): 1087–1090.
Cameron KL, Robinson JV, and Niemeyer S, et al. (1992) Contrasting styles of pre-Cenozoic and mid-Tertiary crustal evolution in northern Mexico: Evidence fromdeep crustal xenoliths from La Olivina. Journal of Geophysical Research97: 17353–17376.
Campbell IH and Taylor SR (1985) No water, no granites—no oceans, no continents.Geophysical Research Letters 10: 1061–1064.
Chen S, O’Reilly SY, and Zhou X, et al. (2001) Thermal and petrological structure of thelithosphere beneath Hannuoba, Sino-Korean craton, China: Evidence fromxenoliths. Lithos 56: 267–301.
Chen W and Arculus RJ (1995) Geochemical and isotopic characteristics of lower crustalxenoliths, San Francisco volcanic field, Arizona, USA. Lithos 36(3–4): 203–225.
Chen YD, O’Reilly SY, Kinny PD, and Griffin WL (1994) Dating lower crust andupper-mantle events—an ion microprobe study of xenoliths from kimberlitic pipes,South-Australia. Lithos 32(1–2): 77–94.
Chen YD, O’Reilly SY, Griffin WL, and Krogh TE (1998) Combined U–Pb dating andSm–Nd studies on lower crustal and mantle xenoliths from the Delegate basaltic pipes,southeastern Australia. Contributions to Mineralogy and Petrology 130(2): 154–161.
Christensen NI (1982) Vol. II, Seismic velocities. In: Carmichael RS (ed.) Handbook ofPhysical Properties of Rocks, pp. 1–228. Boca Raton, FL: CRC Press.
Christensen NI and Mooney WD (1995) Seismic velocity structure and composition ofthe continental crust: A global view. Journal of Geophysical Research 100(B7):9761–9788.
Clarke FW (1889) The relative abundance of the chemical elements. PhilosophicalSociety of Washington Bulletin XI: 131–142.
Clarke FW and Washington HS (1924) The composition of the Earth’s crust. USGeological Survey Professional Paper 127.
Clitheroe G, Gudmundsson O, and Kennett BLN (2000) The crustal thickness ofAustralia. Journal of Geophysical Research 105(B6): 13697–13713.
Cogley JG (1984) Continental margins and the extent and number of the continents.Reviews of Geophysics and Space Physics 22: 101–122.
Cohen RS, O’Nions RK, and Dawson JB (1984) Isotope geochemistry of xenoliths fromEast Africa: Implications for development of mantle reservoirs and their interaction.Earth and Planetary Science Letters 68: 209–220.
Collerson KD, Hearn BC, MacDonald RA, Upton BF, and Park JG (1988) Granulitexenoliths from the Bearpaw Mountains, Montana: Constraints on the character andevolution of lower continental crust. Terra Cognita 8: 270.
Condie KC (1993) Chemical composition and evolution of the upper continentalcrust: Contrasting results form surface samples and shales. Chemical Geology104: 1–37.
Condie KC (1997) Plate Tectonics and Crustal Evolution. Oxford, UK:Butterworth-Heinemann.
Condie KC and Selverstone J (1999) The crust of the Colorado plateau: New views of anold arc. Journal of Geology 107(4): 387–397.
Condie KC, Latysh N, Van Schmus WR, KozuchM, and Selverstone J (1999) Geochemistry,Nd and Sr isotopes, and U/Pb zircon ages of Navajo Volcanic Field, Four Corners area,southwestern United States. Chemical Geology 156(1–4): 95–133.
Davis GL (1977) The ages and uranium contents of zircons from kimberlites andassociated rocks. Carnegie Institution of Washington Yearbook 76: 631–635.
Davis GL and Grew ES (1977) Age of zircon from a crustal xenolith, Kilbourne Hole,New Mexico. Carnegie Institution of Washington Yearbook 77: 897–898.
Davis WJ (1997) U–Pb zircon and rutile ages from granulite xenoliths in the Slaveprovince: Evidence for mafic magmatism in the lower crust coincident withProterozoic dike swarms. Geology 25(4): 343–346.
Dawson JB (1977) Sub-cratonic crust and upper-mantle models based on xenolithsuites in kimberlite and nephelinitic diatremes. Journal of the Geological Society134: 173–184.
Dawson JB and Smith JV (1987) Reduced sapphirine granulite xenoliths from the LaceKimberlite, South Africa: Implications for the deep structure of the Kaapvaal Craton.Contributions to Mineralogy and Petrology 95: 376–383.
Dawson JB, Harley SL, Rudnick RL, and Ireland TR (1997) Equilibration and reaction inArchaean quartz-sapphirine granulite xenoliths from the Lace Kimberlite pipe, SouthAfrica. Journal of Metamorphic Geology 15(2): 253–266.
Dessai AG and Vaselli O (1999) Petrology and geochemistry of xenoliths inlamprophyres from the Deccan Traps: Implications for the nature of the deep crustboundary in western India. Mineralogical Magazine 63(5): 703–722.
Dessai AG, Knight K, and Vaselli O (1999) Thermal structure of the lithosphere beneaththe Deccan Trap along the western Indian continental margin: Evidence fromxenolith data. Journal of the Geological Society of India 54(6): 585–598.
Dobosi G, Kempton PD, Downes H, Embey-Isztin A, Thirlwall M, and Greenwood P(2003) Lower crustal granulite xenoliths from the Pannonian Basin, Hungary: Part 2.Sr–Nd–Pb–Hf and O isotope evidence for formation of continental lower crust bytectonic emplacement of oceanic crust. Contributions to Mineralogy and Petrology144: 671–683.
Dodge FCW, Lockwood JP, and Calk LC (1988) Fragments of the mantle and crust frombeneath the Sierra Nevada batholith: Xenoliths in a volcanic pipe near Big Creek,California. Geological Society of America Bulletin 100: 938–947.
Dodge FW, Calk LC, and Kistler RW (1986) Lower crustal xenoliths, Chinese Peak lavaflow, central Sierra Nevada. Journal of Petrology 27: 1277–1304.
Domenick MA, Kistler RW, Dodge FW, and Tatsumoto M (1983) Nd and Sr isotopicstudy of crustal and mantle inclusions from the Sierra Nevada and implications forbatholith petrogenesis. Geological Society of America Bulletin 94: 713–719.
Dostal J and Capedri S (1979) Rare earth elements in high-grade metamorphic rocksfrom the western Alps. Lithos 12: 41–49.
Dostal J, Dupuy C, and Leyreloup A (1980) Geochemistry and petrology ofmeta-igneous granulitic xenoliths in Neogene volcanic rocks of the Massif Central,France—implications for the lower crust. Earth and Planetary Science Letters50: 31–40.
Downes H (1993) The nature of the lower continental crust of Europe–petrologicaland geochemical evidence from xenoliths. Physics of the Earth and PlanetaryInteriors 79(1–2): 195–218.
Downes H and Leyreloup AF (1986) Granulitic xenoliths from the French MassifCentral—petrology, Sr and Nd isotope systematics and model age estimates.In: Dawson B, Carswell DA, Hall J, and Wedepohl KH (eds.) The Nature of the LowerContinental Crust, pp. 319–330. London: Geological Society of London.
Downes H, Dupuy C, and Leyreloup AF (1990) Crustal evolution of the Hercynian belt ofwestern Europe: Evidence from lower-crustal granulitic xenoliths (FrenchMassif-Central). Chemical Geology 83(3–4): 209–231.

Composition of the Continental Crust 47
Downes H, Kempton PD, Briot D, Harmon RS, and Leyreloup AF (1991) Pb and O isotopesystematics in granulite facies xenoliths, French Massif-Central—implications forcrustal processes. Earth and Planetary Science Letters 102(3–4): 342–357.
Downes H, Peltonen P, Manttari I, and Sharkov EV (2002) Proterozoic zircon ages fromlower crustal granulite xenoliths, Kola Peninsula, Russia: Evidence for crustalgrowth and reworking. Journal of the Geological Society 159: 485–488.
Drummond BJ (1988) A review of crust upper mantle structure in the Precambrian areasof Australia and implications for Precambrian crustal evolution. PrecambrianResearch 40(1): 101–116.
Drummond MS and Defant MJ (1990) A model for trondhjemite-tonalite-dacite genesisand crustal growth via slab melting: Archean to modern comparisons. Journal ofGeophysical Research 95(B13): 21503–21521.
Ducea M (2001) The California arc: Thick granitic batholiths, eclogitic residues,lithospheric-scale thrusting, and magmatic flare-ups. GSA Today 11(11): 4–10.
Ducea MN and Saleeby JB (1996) Buoyancy sources for a large, unrooted mountainrange, the Sierra Nevada, California: Evidence from xenolith thermobarometry.Journal of Geophysical Research 101(B4): 8229–8244.
Ducea MN and Saleeby JB (1998) The age and origin of a thick mafic-ultramafickeel from beneath the Sierra Nevada batholith. Contributions to Mineralogy andPetrology 133(1–2): 169–185.
Durrheim RJ and Green RWE (1992) A seismic refraction investigation of the ArchaeanKaapvaal craton, South Africa, using mine tremors as the energy source.Geophysical Journal International 108: 812–832.
Durrheim RJ and Mooney WD (1994) The evolution of the Precambrian lithosphere:Seismological and geochemical constraints. Journal of Geophysical Research99: 15359–15374.
Eade KE and Fahrig WF (1971) Chemical Evolutionary Trends of ContinentalPlates—Preliminary Study of the Canadian Shield. Bulletin - Geological Survey ofCanada 179, 51p.
Eade K E and Fahrig W F (1973) Regional, Lithological, and Temporal Variation in theAbundances of some Trace Elements in the Canadian Shield. Geological Survey ofCanada Paper 72–46, Ottawa, Ontario.
Eberz GW, Clarke DB, Chatterjee AK, and Giles PS (1991) Chemical and isotopiccomposition of the lower crust beneath the Meguma Lithotectonic Zone, Nova Scotia:Evidence from granulite facies xenoliths. Contributions to Mineralogy and Petrology109: 69–88.
Edwards AC, Lovering JF, and Ferguson J (1979) High pressure basic inclusions fromthe Kayrunnera kimberlitic breccia pipe in New South Wales, Australia.Contributions to Mineralogy and Petrology 69: 185–192.
Ehrenberg SN and Griffin WL (1979) Garnet granulite and associated xenoliths inminette and serpentinite diatremes of the Colorado Plateau. Geology 7: 483–487.
Embey-Isztin A, Scharbert HG, Deitrich H, and Poultidis H (1990) Mafic granulite andclinopyroxenite xenoliths from the Transdanubian volcanic region (Hungary):Implication for the deep structure of the Pannonian Basin. Mineralogical Magazine54: 463–483.
Embey-Isztin A, Downes H, Kempton PD, Dobosi G, and Thirlwall M (2003) Lowercrustal granulite xenoliths from the Pannonian Basin, Hungary: Part 1. Mineralchemistry, thermobarometry and petrology. Contributions to Mineralogy andPetrology 144: 652–670.
Ertan IE and Leeman WP (1999) Fluid inclusions in mantle and lower crustalxenoliths from the Simcoe volcanic field, Washington. Chemical Geology 154(1–4):83–95.
Esperanca S and Garfunkel Z (1986) Ultramafic xenoliths from the Mt. Carmel area(Karem Maharal Volcano), Israel. Lithos 19: 43–49.
Esperanca S, Carlson RW, and Shirey SB (1988) Lower crustal evolution under centralArizona: Sr, Nd, and Pb isotopic and geochemical evidence from the maficxenoliths of Camp Creek. Earth and Planetary Science Letters 90: 26–40.
Esser BK and Turekian KK (1993) The osmium isotopic composition of the continentalcrust. Geochimica et Cosmochimica Acta 57: 3093–3104.
Fahrig WF and Eade KE (1968) The chemical evolution of the Canadian Shield.Geochimica et Cosmochimica Acta 5: 1247–1252.
Fountain DM (1976) The Ivrea-Verbano and Strona-Ceneri zones, northern Italy: Across-section of the continental crust—new evidence from seismic velocities ofrock samples. Tectonophysics 33: 145–165.
Fountain DM and Salisbury MH (1981) Exposed cross sections through the continentalcrust: Implications for crustal structure, petrology, and evolution. Earth andPlanetary Science Letters 56: 263–277.
Fountain DM and Salisbury MH (1995) Seismic properties of rock samples from thePikwitonei granulite belt—God’s Lake domain crustal cross section, Manitoba.Canadian Journal of Earth Sciences 33(5): 757–768.
Fountain DM, Percival J, and Salisbury MH (1990a) Exposed cross sections of thecontinental crust-synopsis. In: Salisbury MH and Fountain DM (eds.) ExposedCross-Sections of the Continental Crust, pp. 653–662. Amsterdam: Kluwer.
Fountain DM, Salisbury MH, and Percival J (1990b) Seismic structure of the continentalcrust based on rock velocity measurements from the Kapuskasing uplift. Journal ofGeophysical Research 95: 1167–1186.
Fountain DM, Salisbury MH, and Furlong KP (1987) Heat production and thermalconductivity of rocks from the Pikwitonei-Sachigo continental cross section, centralManitoba: Implications for the thermal structure of Archean crust. Canadian Journalof Earth Sciences 24: 1583–1594.
Francis DM (1976) Corona-bearing pyroxene granulite xenoliths and the lower crustbeneath Nunivak Island, Alaska. Canadian Mineralogist 14: 291–298.
Frey HV, Roark JH, Shockey KM, Frey EL, and Sakimoto SEH (2002) Ancient lowlandson Mars. Geophysical Research Letters 29(10) 22-1–22-4.
Gallet S, Jahn B-M, van Vliet Lanoe B, Dia A, and Rossello E (1998) Loessgeochemistry and its implications for particle origin and composition of the uppercontinental crust. Earth and Planetary Science Letters 156: 157–172.
Gao S, Luo T-C, and Zhang B-R, et al. (1998a) Chemical composition of the continentalcrust as revealed by studies in east China. Geochimica et Cosmochimica Acta62: 1959–1975.
Gao S, Zhang B-R, Jin Z-M, Kern H, Luo T-C, and Zhao Z-D (1998b) How mafic is thelower continental crust? Earth and Planetary Science Letters 106: 101–117.
Gao S, Kern H, and Liu YS, et al. (2000) Measured and calculated seismic velocities anddensities for granulites from xenolith occurrences and adjacent exposed lowercrustal sections: A comparative study from the North China craton. Journal ofGeophysical Research 105(B8): 18965–18976.
Goldschmidt VM (1933) Grundlagen der quantitativen Geochemie. Fortschritte derMineralogie, Kristallographie und Petrographie 17: 112.
Goldschmidt VM (1958) Geochemistry. Oxford: Oxford University Press.Goodwin AM (1991) Precambrian Geology. London: Academic Press.Gorman AR, Clowes RM, and Ellis RM, et al. (2002) Deep probe: Imaging the roots of
western North America. Canadian Journal of Earth Sciences 39(3): 375–398.Grapes RH (1986) Melting and thermal reconstitution of pelitic xenoliths, Wehr volcano,
East Eifel, West Germany. Journal of Petrology 27: 343–396.Gregoire M, Mattielli N, and Nicollet C, et al. (1994) Oceanic mafic granulite xenoliths
from the Kerguelen archipelago. Nature 367: 360–363.Gregoire M, Cottin JY, Giret A, Mattielli N, and Weis D (1998) The meta-igneous
granulite xenoliths from Kerguelen archipelago: Evidence of a continent nucleationin an oceanic setting. Contributions to Mineralogy and Petrology 133(3): 259–283.
Griffin WL and O’Reilly SY (1986) The lower crust in eastern Australia: Xenolith evidence.In: Dawson B, Carswell DA, Hall J, and Wedepohl KH (eds.) The Nature of the LowerContinental Crust, Geological Society Special Publication 25, pp. 363–374. London,Geological Society of London.
Griffin WL and O’Reilly SY (1987) Is the continental Moho the crust–mantle boundary?Geology 15: 241–244.
Griffin WL, Carswell DA, and Nixon PH (1979) Lower-crustal granulites and eclogitesfrom Lesotho, southern Africa. In: Boyd FR and Meyer HOA (eds.) The MantleSample: Inclusions in Kimberlites, pp. 59–86. Washington, DC: AmericanGeophysical Union.
Griffin WL, Sutherland FL, and Hollis JD (1987) Geothermal profile and crust–mantletransition beneath east-central Queensland: Volcanology, xenolith petrology andseismic data. Journal of Volcanology and Geothermal Research 31: 177–203.
Griffin WL, Jaques AL, Sie SH, Ryan CG, Cousens DR, and Suter GF (1988) Conditionsof diamond growth: A proton microprobe study of inclusions in West Australiandiamonds. Contributions to Mineralogy and Petrology 99: 143–158.
Hacker BR, Gnos E, Ratschbacher L, et al. (2000) Hot and dry deep crustal xenolithsfrom Tibet. Science 287(5462): 2463–2466.
Halliday AN, Aftalion M, Upton BGJ, Aspen P, and Jocelyn J (1984) U–Pb isotopic agesfrom a granulite-facies xenolith from Partan Craig in the Midland Valley of Scotland.Transactions of the Royal Society of Edinburgh: Earth and Environmental Science75: 71–74.
Hanchar JM, Miller CF, Wooden JL, Bennett VC, and Staude J-MG (1994) Evidencefrom xenoliths for a dynamic lower crust, eastern Mojave desert, California. Journalof Petrology 35: 1377–1415.
Harley SL (1989) The origin of granulites: A metamorphic perspective. GeologicalMagazine 126: 215–247.
Hart RJ, Nicolaysen LO, and Gale NH (1981) Radioelement concentrations in the deepprofile through Precambrian basement of the Vredefort structure. Journal ofGeophysical Research 86: 10639–10652.
Hart RJ, Andreoli MAG, Tredoux M, and Dewit MJ (1990) Geochemistry across anexposed section of Archean crust at Vredefort, South Africa with implications formidcrustal discontinuities. Chemical Geology 82(1–2): 21–50.
Haskin MA and Haskin LA (1966) Rare earths in European shales: A redetermination.Science 154: 507–509.
HaskinL A, Wildeman TR, Frey FA, Collins KA, Keedy CR, and Haskin MA (1966) Rareearths in sediments. Journal of Geophysical Research 71(24): 6091–6105.

48 Composition of the Continental Crust
Hattori Y, Suzuki K, Honda M, and Shimizu H (2003) Re–Os isotope systematics of theTaklimakan Desert sands, moraines and river sediments around the TaklimakanDesert, and of Tibetan soils. Geochimica et Cosmochimica Acta 67: 1195–1206.
Hayob JL, Essene EJ, Ruiz J, Ortega-Gutierrez F, and Aranda-Gomez JJ (1989) Younghigh-temperature granulites form the base of the crust in central Mexico. Nature342: 265–268.
Heier KS (1973) Geochemistry of granulite facies rocks and problems of their origin.Philosophical Transactions of the Royal Society Series A 273: 429–442.
Heinrichs H, Schulz-Dobrick B, and Wedepohl KH (1980) Terrestrial geochemistry ofCd, Bi, Tl, Pb, Zn, and Rb. Geochimica et Cosmochimica Acta 44: 1519–1533.
Hickey-Vargas R, Abdollahi MJ, Parada MA, Lopezescobar L, and Frey FA (1995)Crustal xenoliths from Calbuco volcano, Andean southern volcaniczone—implications for crustal composition and magma-crust interaction.Contributions to Mineralogy and Petrology 119(4): 331–344.
Holbrook WS and Kelemen PB (1993) Large igneous province on the US Atlanticmargin and implications for magmatism during continental breakup. Nature364: 433–436.
Holbrook WS, Mooney WD, and Christensen NI (1992) The seismic velocity structure ofthe deep continental crust. In: Fountain DM, Arculus R, and Kay RW (eds.)Continental Lower Crust, pp. 1–44. Amsterdam: Elsevier.
Holland JG and Lambert RSJ (1972) Major element chemical composition of shieldsand the continental crust. Geochimica et Cosmochimica Acta 36: 673–683.
Holtta P, Huhma H, Manttari I, Peltonen P, and Juhanoja J (2000) Petrology andgeochemistry of mafic granulite xenoliths from the Lahtojoki kimberlite pipe, easternFinland. Lithos 51(1–2): 109–133.
Hu S, He L, and Wang J (2000) Heat flow in the continental area of China: A new dataset. Earth and Planetary Science Letters 179: 407–419.
Huang YM, van Calsteren P, and Hawkesworth CJ (1995) The evolution of thelithosphere in southern Africa—a perspective on the basic granulite xenoliths fromkimberlites in South-Africa. Geochimica et Cosmochimica Acta 59(23): 4905–4920.
Hunter RH, Upton BGJ, and Aspen P (1984) Meta-igneous granulite and ultramaficxenoliths from basalts of the Midland Valley of Scotland: Petrology andmineralogy of the lower crust and upper mantle. Transactions of the Royal Society ofEdinburgh 75: 75–84.
Ivanov MA and Head JW (1999) Stratigraphic and geographic distribution ofsteep-sided domes on Venus: Preliminary results from regional geologicalmapping and implications for their origin. Journal of Geophysical Research104(E8): 18907–18924.
Jahn BM, Gallet S, and Han JM (2001) Geochemistry of the Xining, Xifeng, and Jixiansections, Loess Plateau of China: Eolian dust provenance and paleosol evolutionduring the last 140 ka. Chemical Geology 178(1–4): 71–94.
James DE, Padovani ER, and Hart SR (1980) Preliminary results on the oxygen isotopiccomposition of the lower crust, Kilbourne Hole Maar, New Mexico. GeophysicalResearch Letters 7: 321–324.
Jones AP, Smith JV, Dawson JB, and Hansen EC (1983) Metamorphism, partialmelting, and K-metasomatism of garnet-scapolite-kyanite granulite xenoliths fromLashaine, Tanzania. Journal of Geology 91: 143–166.
Jull M and Kelemen PB (2001) On the conditions for lower crustal convective instability.Journal of Geophysical Research 106(4): 6423–6446.
Kalamarides RI, Berg JH, and Hank RA (1987) Lateral isotopic discontinuity in the lowercrust: An example from Antarctica. Science 237: 1192–1195.
Kay RW and Kay SM (1981) The nature of the lower continental crust: Inferences fromgeophysics, surface geology, and crustal xenoliths. Reviews of Geophysics andSpace Physics 19: 271–297.
Kay RW and Kay SM (1991) Creation and destruction of lower continental crust.Geologische Rundschau 80: 259–278.
Kay SM and Kay RW (1983) Thermal history of the deep crust inferred from granulitexenoliths, Queensland, Australia. American Journal of Science 283: 486–513.
Kelemen PB (1995) Genesis of high Mg# andesites and the continental crust.Contributions to Mineralogy and Petrology 120: 1–19.
Kempton PD and Harmon RS (1992) Oxygen-isotope evidence for large-scalehybridization of the lower crust during magmatic underplating. Geochimica etCosmochimica Acta 55: 971–986.
Kempton PD, Harmon RS, Hawkesworth CJ, and Moorbath S (1990) Petrology andgeochemistry of lower crustal granulites from the Geronimo volcanic field,southeastern Arizona. Geochimica et Cosmochimica Acta 54: 3401–3426.
Kempton PD, Downes H, and Sharkov EV, et al. (1995) Petrology and geochemistry ofxenoliths from the northern Baltic shield: Evidence for partial melting and metasomatismin the lower crust beneath an Archaean terrane. Lithos 36(3–4): 157–184.
Kempton PD, Downes H, and Embey-Isztin A (1997) Mafic granulite xenoliths inNeogene alkali basalts from the western Pannonian Basin: Insights into the lowercrust of a collapsed orogen. Journal of Petrology 38(7): 941–970.
Kempton PD, Downes H, Neymark LA, Wartho JA, Zartman RE, and Sharkov EV (2001)Garnet granulite xenoliths from the northern Baltic shield the underplatedlower crust of a palaeoproterozoic large igneous province. Journal of Petrology42(4): 731–763.
Kern H, Gao S, and Liu Q-S (1996) Seismic properties and densities of middle andlower crustal rocks exposed along the North China geoscience transect. Earth andPlanetary Science Letters 139: 439–455.
Ketcham RA (1996) Distribution of heat-producing elements in the upper and middlecrust of southern and west central Arizona: Evidence from core complexes. Journalof Geophysical Research 101(B6): 13611–13632.
Kopylova MG, O’Reilly SY, and Genshaft YS (1995) Thermal state of the lithospherebeneath Central Mongolia: Evidence from deep-seated xenoliths from theShavaryn-Saram volcanic centre in the Tariat depression, Hangai, Mongolia. Lithos36: 243–255.
Kuno H (1967) Mafic and ultramafic nodules from Itinome-gata, Japan. In: Wiley PJ(ed.) Ultramafic and Related Rocks, pp. 337–342. New York: Wiley.
Kyle PR, Wright A, and Kirsch I (1987) Ultramafic xenoliths in the late CenozoicMcMurdo volcanic group, western Ross Sea embayment, Antarctica. In: Nixon PH(ed.) Mantle Xenoliths, pp. 287–294. New York: Wiley.
Le Bas MJ and Streckeisen AL (1991) The IUGS systematics of igneous rocks. Journalof the Geological Society 148: 825–833.
Lee C-Y, Chung SL, Chen C-H, and Hsieh YL (1993) Mafic granulite xenoliths fromPenghu Islands: Evidence for basic lower crust in SE China continental margin.Journal of the Geological Society of China 36(4): 351–379.
Leech ML (2001) Arrested orogenic development: Eclogitization, delamination, andtectonic collapse. Earth and Planetary Science Letters 185(1–2): 149–159.
Leeman WP, Menzies MA, Matty DJ, and Embree GF (1985) Strontium, neodymium,and lead isotopic compositions of deep crustal xenoliths from the Snake River Plain:Evidence for Archean basement. Earth and Planetary Science Letters 75: 354–368.
Leeman WP, Sisson VB, and Reid MR (1992) Boron geochemistry of the lowercrust-evidence from granulite terranes and deep crustal xenoliths. Geochimica etCosmochimica Acta 56(2): 775–788.
LePichon X, Henry P, and Goffe B (1997) Uplift of Tibet: From eclogites to granulites-implications for the Andean Plateau and the Variscan belt. Tectonophysics273(1–2): 57–76.
Leyreloup A, Dupuy C, and Andriambololona R (1977) Catazonal xenoliths in FrenchNeogene volcanic rocks: Constitution of the lower crust: 2. Chemical compositionand consequences of the evolution of the French Massif Central Precambrian crust.Contributions to Mineralogy and Petrology 62: 283–300.
Leyreloup A, Bodinier JL, Dupuy C, and Dostal J (1982) Petrology and geochemistry ofgranulite xenoliths from Central Hoggar (Algeria)—implications for the lower crust.Contributions to Mineralogy and Petrology 79: 68–75.
Liu YS, Gao S, Jin SY, et al. (2001) Geochemistry of lower crustal xenoliths fromNeogene Hannuoba basalt, North China craton: Implications for petrogenesisand lower crustal composition. Geochimica et Cosmochimica Acta 65(15):2589–2604.
Lombardo B and Rolfo F (2000) Two contrasting eclogite types in the Himalayas:Implications for the Himalayan orogeny. Journal of Geodynamics 30(1–2): 37–60.
Loock G, Seck HA, and Stosch H-G (1990) Granulite facies lower crustal xenoliths fromthe Eifel, West Germany: Petrological and geochemical aspects. Contributions toMineralogy and Petrology 105: 25–41.
Lovering JF and White AJR (1964) The significance of primary scapolite in granuliticinclusions from deep-seated pipes. Journal of Petrology 5: 195–218.
Lovering JF and White AJR (1969) Granulitic and eclogitic inclusions from basic pipesat Delegate, Australia. Contributions to Mineralogy and Petrology 21: 9–52.
Lucassen F, Lewerenz S, Franz G, Viramonte J, and Mezger K (1999) Metamorphism,isotopic ages and composition of lower crustal granulite xenoliths from theCretaceous Salta Rift, Argentina. Contributions to Mineralogy and Petrology 134(4):325–341.
Luosto U and Korhonen H (1986) Crustal structure of the baltic shield based onoff-fennolora refraction data. Tectonophysics 128: 183–208.
Luosto U, Fluh ER, Lund C-E, and Group W (1989) The crustal structure alongthe POLAR profile from seismic refraction investigations. Tectonophysics162: 51–85.
Luosto U, Tiira T, Korhonen H, et al. (1990) Crust and upper mantle structure along theDSS Baltic profile in SE Finland. Geophysical Journal International 101: 89–110.
Mackwell SJ, Zimmerman ME, and Kohlstedt DL (1998) High-temperature deformationof dry diabase with application to tectonics on Venus. Journal of GeophysicalResearch 103(B1): 975–984.
Markwick AJW and Downes H (2000) Lower crustal granulite xenoliths from theArkhangelsk kimberlite pipes: Petrological, geochemical and geophysical results.Lithos 51(1–2): 135–151.

Composition of the Continental Crust 49
Markwick AJW, Downes H, and Veretennikov N (2001) The lower crust of SE Belarus:Petrological, geophysical, and geochemical constraints from xenoliths.Tectonophysics 339(1–2): 215–237.
Martin H (1994) The Archean grey gneisses and the genesis of continental crust.In: Condie KC (ed.) Archean Crustal Evolution, pp. 205–259. Amsterdam: Elsevier.
Mattie PD, Condie KC, Selverstone J, and Kyle PR (1997) Origin of the continental crustin the Colorado Plateau: Geochemical evidence from mafic xenoliths from theNavajo volcanic field, southwestern USA. Geochimica et Cosmochimica Acta61(10): 2007–2021.
Mayer A, Mezger K, and Sinigoi S (2000) New Sm–Nd ages for the Ivrea-Verbano Zone,Sesia and Sessera valleys (Northern-Italy). Journal of Geodynamics 30(1–2): 147–166.
McBirney AR and Aoki K-I (1973) Factors governing the stability of plagioclase at highpressures as shown by spinel-gabbro xenoliths from the Kerguelen archipelago.American Mineralogist 58: 271–276.
McCulloch MT, Arculus RJ, Chappell BW, and Ferguson J (1982) Isotopic andgeochemical studies of nodules in kimberlite have implications for the lowercontinental crust. Nature 300: 166–169.
McDonough WF and Sun S-S (1995) Composition of the Earth. Chemical Geology120: 223–253.
McDonough WF, Rudnick RL, and McCulloch MT (1991) The chemical and isotopiccomposition of the lower eastern Australian lithosphere: A review. In: Drummond B(ed.) The Nature of the Eastern Australian Lithosphere, Geological Society ofAustralia Special Publication 17, pp.163–188. Sydney.
McDonough WF, Sun S-S, Ringwood AE, Jagoutz E, and Hofmann AW (1992)Potassium, rubidium, and cesium in the Earth and Moon and the evolution of themantle of the Earth. Geochimica et Cosmochimica Acta 56: 1001–1012.
McLennan SM (2001a) Crustal heat production and the thermal evolution of Mars.Geophysical Research Letters 28(21): 4019–4022.
McLennan SM (2001b) Relationships between the trace element composition ofsedimentary rocks and upper continental crust. Geochemistry, Geophysics,Geosystems 2: 1021.
McLennan SM and Taylor SR (1996) Heat flow and the chemical composition ofcontinental crust. Journal of Geology 104: 377–396.
McLennan SM, Nance WB, and Taylor SR (1980) Rare earth element-thoriumcorrelations in sedimentary rocks, and the composition of the continental crust.Geochimica et Cosmochimica Acta 44: 1833–1839.
Mehnert KR (1975) The Ivrea zone: A model of the deep crust. Neues Jahrbuch furMineralogie (Abhandlungen) 125: 156–199.
Meltzer A and Christensen N (2001) Nanga Parbat crustal anisotrophy: Implication forinterpretation of crustal velocity structure and shear-wave splitting. GeophysicalResearch Letters 28(10): 2129–2132.
Mengel K (1990) Crustal xenoliths from Tertiary volcanics of the northern Hessiandepression: Petrological and chemical evolution. Contributions to Mineralogy andPetrology 104: 8–26.
Mengel K and Wedepohl KH (1983) Crustal xenoliths in Tertiary volcanics from thenorthern Hessian depression. In: Fuchs K, et al. (ed.) Plateau Uplift, pp. 332–335.Berlin: Springer.
Mengel K, Sachs PM, Stosch HG, Worner G, and Loock G (1991) Crustal xenoliths fromCenozoic volcanic fields of West Germany implications for structure andcomposition of the continental crust. Tectonophysics 195(2–4): 271.
Meyer HOA and Brookins DG (1976) Sapphirine, sillimanite, and garnet in granulitexenoliths from Stockdale kimberlite, Kansas. American Mineralogist 61: 1194–1202.
Miller JD and Christensen NI (1994) Seismic signature and geochemistry of an islandarc: A multidisciplinary study of the Kohistan accreted terrane, northern Pakistan.Journal of Geophysical Research 99(B6): 11623–11642.
Mittlefehldt DW (1984) Genesis of clinopyroxene-amphibole xenoliths from BirketRam: Trace element and petrologic constraints. Contributions to Mineralogy andPetrology 88: 280–287.
Mittlefehldt DW (1986) Petrology of high pressure clinopyroxenite series xenoliths,Mount Carmel, Israel. Contributions to Mineralogy and Petrology 94: 245–252.
Moecher DP, Valley JW, and Essene EJ (1994) Extraction and carbon isotope analysisof CO2 from scapolite in deep crustal granulites and xenoliths. Geochimica etCosmochimica Acta 58(2): 959–967.
Mooney WD and Meissner R (1992) Multi-genetic origin of crustal reflectivity: A reviewof seismic reflection profiling of the continental lower crust and Moho.In: Fountain DM, Arculus R, and Kay RW (eds.) Continental Lower Crust, pp. 45–80.Elsevier.
Moser DE and Heaman LM (1997) Proterozoic zircon growth in Archean lower crustxenoliths, southern Superior craton: A consequence of Matachewan ocean opening.Contributions to Mineralogy and Petrology 128: 164–175.
Moser DE, Flowers RM, and Hart RJ (2001) Birth of the Kaapvaal tectosphere 3.08billion years ago. Science 291(5503): 465–468.
Nasir S (1992) The lithosphere beneath the northwestern part of the Arabian plate(Jordan)—evidence from xenoliths and geophysics. Tectonophysics 201(3–4):357–370.
Nasir S (1995) Mafic lower crustal xenoliths from the northwestern part of the Arabianplate. European Journal of Mineralogy 7(1): 217–230.
Nasir S and Safarjalani A (2000) Lithospheric petrology beneath the northern part of theArabian plate in Syria: Evidence from xenoliths in alkali basalts. Journal of AfricanEarth Sciences 30(1): 149–168.
Nesbitt HW and Young GM (1984) Prediction of some weathering trends of plutonic andvolcanic rocks based on thermodynamic and kinetic considerations. Geochimica etCosmochimica Acta 48: 1523–1534.
Newsom HE, Sims KWW, Noll PD Jr., Jaeger WL, Maehr SA, and Beserra TB (1996) Thedepletion of tungsten in the bulk silicate Earth: Constraints on core formation.Geochimica et Cosmochimica Acta 60: 1155–1169.
Nguuri TK, Gore J, and James DE, et al. (2001) Crustal structure beneath southernAfrica and its implications for the formation and evolution of the Kaapvaal andZimbabwe cratons. Geophysical Research Letters 28(13): 2501–2504.
Nimz GJ, Cameron KL, Cameron M, and Morris SL (1986) Petrology of the lowercrust and upper mantle beneath southeastern Chihuahua, Mexico. GeofısicaInternacional 25: 85–116.
Niu FL and James DE (2002) Fine structure of the lowermost crust beneath the Kaapvaalcraton and its implications for crustal formation and evolution. Earth and PlanetaryScience Letters 200(1–2): 121–130.
Nyblade AA and Pollack HN (1993) A global analysis of heat flow from Precambrianterrains: Implications for the thermal structure of Archean and Proterozoiclithosphere. Journal of Geophysical Research 98: 12207–12218.
Okrusch M, Schroder B, and Schnutgen A (1979) Granulite-facies metabasite ejecta inthe Laacher Sea area, Eifel, West Germany. Lithos 12: 251–270.
O’Reilly SY, Griffin WL, and Stabel A (1988) Evolution of Phanerozoic eastern Australianlithosphere: Isotopic evidence for magmatic and tectonic underplating.In: Menzies MA and Cox KG (eds.) Oceanic and Continental Lithosphere:Similarities and Differences, Special Volume Journal of Petrology, pp. 89–108.Oxford: Oxford University Press.
Owen JV, Greenough JD, Hy C, and Ruffman A (1988) Xenoliths in a mafic dyke atPopes Harbour, Nova Scotia: Implications for the basement to the Meguma Group.Canadian Journal of Earth Sciences 25: 1464–1471.
Padovani ER and Carter JL (1977) Aspects of the deep crustal evolution beneath southcentral New Mexico. In: Heacock JG (ed.) The Earth’s Crust, pp. 19–55.Washington, DC: American Geophysical Union.
Padovani ER and Hart SR (1981) Geochemical constraints on the evolution of the lowercrust beneath the Rio Grande rift. Conference on the Processes of Planetary Rifting,pp. 149–152. Lunar and Planetary Science Institute.
Padovani ER, Hall J, and Simmons G (1982) Constraints on crustal hydration below theColorado Plateau from Vp measurements on crustal xenoliths. Tectonophysics84: 313–328.
Patchett PJ and Samson SD (2003) Ages and growth of the continental crust fromradiogenic isotopes. In: Holland HD and Turekian KK (eds.) Treatise onGeochemistry, vol 3, pp. 321–348. Oxford: Elsevier.
Pearcy LG, DeBari SM, and Sleep NH (1990) Mass balance calculations for two sectionsof island arc crust and implications for the formation of continents. Earth andPlanetary Science Letters 96: 427–442.
Pearson NJ, O’Reilly SY, and Griffin WL (1995) The crust-mantle boundary beneathcratons and craton margins: A transect across the south-west margin of theKaapvaal craton. Lithos 36(3–4): 257–287.
Percival JA and Card KD (1983) Archean crust as revealed in the Kapuskasing uplift,Superior province, Canada. Geology 11: 323–326.
Percival JA, Fountain DM, and Salisbury MH (1992) Exposed cross sections aswindows on the lower crust. In: Fountain DM, Arculus R, and Kay RW (eds.)Continental Lower Crust, pp. 317–362. Amsterdam: Elsevier.
Peucker-Ehrenbrink B and Jahn B-M (2001) Rhenium-osmium isotope systematics andplatinum group element concentations: Loess and the upper continental crust.Geochemistry, Geophysics, Geosystems 2: 1061.
Phillips RJ, Raubertas RF, and Arvidson RE, et al. (1992) Impact craters and Venusresurfacing history. Journal of Geophysical Research 97(E10): 15923–15948.
Pinet C and Jaupart C (1987) The vertical distribution of radiogenic heat production inthe Precambrian crust of Norway and Sweden: Geothermal implications.Geophysical Research Letters 14: 260–263.
Plank T and Langmuir CH (1998) The chemical composition of subductingsediment and its consequences for the crust and mantle. Chemical Geology145: 325–394.
Poldervaart A (1955) The chemistry of the Earth’s crust. Geological Society of AmericaSpecial Paper 62: 119–144.

50 Composition of the Continental Crust
Quick JE, Sinigoi S, and Mayer A (1995) Emplacement of mantle peridotite in the lowercontinental crust, Ivrea-Verbano zone, northwest Italy. Geology 23(8): 739–742.
Reid MR, Hart SR, Padovani ER, and Wandless GA (1989) Contribution of metapeliticsediments to the composition, heat production, and seismic velocity of the lowercrust of southern New Mexico. Earth and Planetary Science Letters 95: 367–381.
Roberts S and Ruiz J (1989) Geochemical zonation and evolution of the lower crust inMexico. Journal of Geophysical Research 94: 7961–7974.
Rogers NW (1977) Granulite xenoliths from Lesotho kimberlites and the lowercontinental crust. Nature 270: 681–684.
Rogers NW and Hawkesworth CJ (1982) Proterozoic age and cumulate origin forgranulite xenoliths, Lesotho. Nature 299: 409–413.
Ronov AB and Yaroshevsky AA (1967) Chemical structure of the Earth’s crust.Geokhimiya 11: 1285–1309.
Ronov AB and Yaroshevsky AA (1976) A new model for the chemical structure of theEarth’s crust. Geokhimiya 12: 1761–1795.
Ross DC (1985) Mafic gneissic complex (batholithic root?) in the southernmost SierraNevada, California. Geology 13: 288–291.
Rudnick RL (1990a) Continental crust: Growing from below. Nature 347: 711–712.Rudnick RL (1990b) Nd and Sr isotopic compositions of lower crustal xenoliths from
North Queensland, Australia: Implications for Nd model ages and crustal growthprocesses. Chemical Geology 83: 195–208.
Rudnick RL (1992) Xenoliths—samples of the lower continental crust. In: Fountain DM,Arculus R, and Kay RW (eds.) Continental Lower Crust, pp. 269–316. Amsterdam:Elsevier.
Rudnick RL (1995) Making continental crust. Nature 378: 571–578.Rudnick RL and Cameron KL (1991) Age diversity of the deep crust in northern Mexico.
Geology 19: 1197–1200.Rudnick RL and Goldstein SL (1990) The Pb isotopic compositions of lower
crustal xenoliths and the evolution of lower crustal Pb. Earth and Planetary ScienceLetters 98: 192–207.
Rudnick RL and Fountain DM (1995) Nature and composition of the continental crust:A lower crustal perspective. Reviews of Geophysics 33(3): 267–309.
Rudnick RL and Presper T (1990) Geochemistry of intermediate to high-pressuregranulites. In: Vielzeuf D and Vidal P (eds.) Granulites and Crustal Evolution,pp. 523–550. Amsterdam: Kluwer.
Rudnick RL and Taylor SR (1987) The composition and petrogenesis of the lower crust:A xenolith study. Journal of Geophysical Research 92(B13): 13981–14005.
Rudnick RL and Taylor SR (1991) Petrology and geochemistry of lower crustal xenolithsfrom northern Queensland and inferences on lower crustal composition.In: Drummond B (ed.) The Eastern Australian Lithosphere, Geological Society ofAustralia Special Publication, pp.189–208.
Rudnick RL and Williams IS (1987) Dating the lower crust by ion microprobe. Earth andPlanetary Science Letters 85: 145–161.
Rudnick RL, McLennan SM, and Taylor SR (1985) Large ion lithophile elements inrocks from high-pressure granulite facies terrains. Geochimica et CosmochimicaActa 49: 1645–1655.
Rudnick RL, McDonough WF, McCulloch MT, and Taylor SR (1986) Lower crustalxenoliths from Queensland, Australia: Evidence for deep crustal assimilation andfractionation of continental basalts. Geochimica et Cosmochimica Acta50: 1099–1115.
Rudnick RL, McDonough WF, and O’Connell RJ (1998) Thermal structure, thicknessand composition of continental lithosphere. Chemical Geology 145: 399–415.
Rudnick RL, Ireland TR, Gehrels G, Irving AJ, Chesley JT, and Hanchar JM (1999)Dating mantle metasomatism: U–Pb geochronology of zircons in cratonic mantlexenoliths from Montana and Tanzania. In: Gurney JJ, Gurney JL, Pascoe MD, andRichardson SR (eds.) Proceedings of the VIIth International Kimberlite Conference,pp. 728–735. Cape Town: Red Roof Design.
Rudnick RL, Barth M, Horn I, and McDonough WF (2000) Rutile-bearing refractoryeclogites: Missing link between continents and depleted mantle. Science287: 278–281.
Ruiz J, Patchett PJ, and Arculus RJ (1988a) Nd–Sr isotope composition of lower crustalxenoliths—evidence for the origin of mid-Tertiary felsic volcanics in Mexico.Contributions to Mineralogy and Petrology 99: 36–43.
Ruiz J, Patchett PJ, and Ortega-Gutierrez F (1988b) Proterozoic and Phanerozoicbasement terranes of Mexico from Nd isotopic studies. Geological Society ofAmerica Bulletin 100: 274–281.
Rutter MJ (1987) The nature of the lithosphere beneath the Sardinian continental block:Mantle and deep crustal inclusions in mafic alkaline lavas. Lithos 20: 225–234.
Saal AE, Rudnick RL, Ravizza GE, and Hart SR (1998) Re–Os isotope evidence forthe composition, formation and age of the lower continental crust. Nature393: 58–61.
Sachs PM and Hansteen TH (2000) Pleistocene underplating and metasomatism of thelower continental crust: A xenolith study. Journal of Petrology 41(3): 331–356.
Saleeby JB (1990) Progress in tectonic and petrogenetic studies in an exposedcross-section of young (c. 100 Ma) continental crust southern Sierra Nevada,California. In: Salisbury MH and Fountain DM (eds.) Exposed Cross-Sections of theContinental Crust, pp. 137–159. Norwell, MA: Kluwer Academic.
Schaaf P, Heinrich W, and Besch T (1994) Composition and Sm–Nd isotopic data of thelower crust beneath San-Luis-Potosi, Central Mexico—evidence from agranulite-facies xenolith suite. Chemical Geology 118(1–4): 63–84.
Schaber GG, Strom RG, Moore HJ, et al. (1992) Geology and distribution of impactcraters on Venus–what are they telling us. Journal of Geophysical Research 97(E8):13257–13301.
Scherer EK, Cameron KL, Johnson CM, Beard BL, Barovich KM, and Collerson KD(1997) Lu–Hf geochronology applied to dating Cenozoic events affecting lowercrustal xenoliths from Kilbourne Hole, New Mexico. Chemical Geology 142: 63–78.
Schmitz MD and Bowring SA (2000) The significance of U–Pb zircon dates in lowercrustal xenoliths from the southwestern margin of the Kaapvaal craton, southernAfrica. Chemical Geology 172: 59–76.
Schmitz MD and Bowring SA (2003a) Constraints on the thermal evolution ofcontinental lithosphere from U–Pb accessory mineral thermochronometry of lowercrustal xenoliths, southern Africa. Contributions to Mineralogy and Petrology144: 592–618.
Schmitz MD and Bowring SA (2003b) Ultrahigh-temperature metamorphism in thelower crust during Neoarchean Ventersdorp rifting and magmatism, Kaapvaalcraton, southern Africa. Geological Society of America Bulletin 115: 533–548.
Schulze DJ and Helmstaedt H (1979) Garnet pyroxenite and eclogite xenoliths from theSullivan Buttes latite, Chino valley, Arizona. In: Boyd FR and Meyer HOA (eds.) TheMantle Sample: Inclusions in Kimberlites and Other Volcanics, pp. 318–329.Washington, DC: American Geophysics Union.
Sclater JG, Jaupart CJ, and Galson D (1980) The heat flow through oceanic andcontinental crust and the heat loss of the earth. Reviews of Geophysics and SpacePhysics 18: 269–311.
Selverstone J and Stern CR (1983) Petrochemistry and recrystallization history ofgranulite xenoliths from the Pali-Aike volcanic field, Chile. American Mineralogist68: 1102–1111.
Sewell RJ, Hobden BJ, and Weaver SD (1993) Mafic and ultramafic mantle anddeep-crustal xenoliths from Banks Peninsula, South-Island, New-Zealand.New Zealand Journal of Geology and Geophysics 36(2): 223–231.
Shatsky V, Rudnick RL, and Jagoutz E (1990) Mafic granulites from Udachnaya pipe,Yakutia: Samples of Archean lower crust? Deep Seated Magmatism and Evolution ofLithosphere of the Siberian Platform, 23–24.
Shatsky VS, Sobolev NV, and Pavlyuchenko VS (1983) Fassaıte-garnet-anorthitexenolith from the Udachnaya kimberlite pipe, Yakutia. Doklady Akademii Nauk SSSR272(1): 188–192.
Shaw DM, Reilly GA, Muysson JR, Pattenden GE, and Campbell FE (1967) An estimateof the chemical composition of the Canadian Precambrian shield. Canadian Journalof Earth Sciences 4: 829–853.
Shaw DM, Dostal J, and Keays RR (1976) Additional estimates of continental surfacePrecambrian shield composition in Canada. Geochimica et Cosmochimica Acta40: 73–83.
Shaw DM, Cramer JJ, Higgins MD, and Truscott MG (1986) Composition of theCanadian Precambrian shield and the continental crust of the Earth. In: Dawson JB,Carswell DA, Hall J, and Wedepohl KH (eds.) The Nature of the Lower ContinentalCrust, vol. 24, pp. 257–282. London: Geological Society of London.
Shaw DM, Dickin AP, Li H, McNutt RH, Schwarcz HP, and Truscott MG (1994) Crustalgeochemistry in the Wawa-Foleyet region, Ontario. Canadian Journal of EarthSciences 31(7): 1104–1121.
Sims KWW, Newsom HE, and Gladney ES (1990) Chemical fractionation duringformation of the Earth’s core and continental crust: Clues from As, Sb, W, and Mo.In: Newsom HE, Jones JH, and Newson JH (eds.) Origin of the Earth, pp. 291–317.Oxford: Oxford University Press.
Smith DE, Zuber MT, Solomon SC, et al. (1999) The global topography of Mars andimplications for surface evolution. Science 284(5419): 1495–1503.
Smith RD, Cameron KL, McDowell FW, Niemeyer S, and Sampson DE (1996) Generationof voluminous silicic magmas and formation of mid-Cenozoic crust beneathnorth-central Mexico: Evidence from ignimbrites, associated lavas, deep crustalgranulites, and mantle pyroxenites. Contributions to Mineralogy and Petrology123: 375–389.
Smithson SB (1978) Modeling continental crust-structural and chemical constraints.Geophysical Research Letters 5(9): 749–752.
Stolz AJ (1987) Fluid activity in the lower crust and upper mantle: Mineralogicalevidence bearing on the origin of amphibole and scapolite in ultramafic and maficgranulite xenoliths. Mineralogical Magazine 51: 719–732.
Stolz AJ and Davies GR (1989) Metasomatized lower crustal and upper mantle xenolithsfrom north Queensland: Chemical and isotopic evidence bearing on the

Composition of the Continental Crust 51
composition and source of the fluid phase. Geochimica et Cosmochimica Acta53: 649–660.
Stosch H-G and Lugmair GW (1984) Evolution of the lower continental crust: Granulitefacies xenoliths from the Eifel, West Germany. Nature 311: 368–370.
Stosch H-G, Ionov DA, Puchtel IS, Galer SJG, and Sharpouri A (1995) Lower crustalxenoliths from Mongolia and their bearing on the nature of the deep crust beneathcental Asia. Lithos 36: 227–242.
Strom RG, Schaber GG, and Dawson DD (1994) The global resurfacing of Venus.Journal of Geophysical Research 99(E5): 10899–10926.
Sun W, Bennett VC, Eggins SM, Kamenetsky VS, and Arculus RJ (2003) Evidence forenhanced mantle to crust rhenium transfer from undegassed arc magmas. Nature422: 294–297.
Sutherland FL and Hollis JD (1982) Mantle-lower crust petrology from inclusionsin basaltic rocks in eastern Australia—an outline. Journal of Volcanology andGeothermal Research 14: 1–29.
Tanaka T and Aoki K-I (1981) Petrogenetic implications of REE and Ba data on mafic andultramafic inclusions from Itinome-gata, Japan. Journal of Geology 89: 369–390.
Taylor SR (1964) Abundance of chemical elements in the continental crust—a newtable. Geochimica et Cosmochimica Acta 28: 1273–1285.
Taylor SR (1967) The origin and growth of continents. Tectonophysics 4: 17–34.Taylor SR (1977) Island arc models and the composition of the continental crust.
In: Talwani M (ed.) Island Arcs, Deep Sea Trenches and Back-Arc Basins,pp. 325–336. Washington, DC: American Geophysical Union.
Taylor SR (1992) Solar System Evolution. Cambridge: Cambridge University Press.Taylor SR and McLennan SM (1981) The composition and evolution of the continental
crust: Rare Earth element evidence from sedimentary rocks. PhilosophicalTransactions of the Royal Society Series A 301: 381–399.
Taylor SR and McLennan SM (1985) The Continental Crust: Its Composition andEvolution. Oxford: Blackwell.
Taylor SR and McLennan SM (1995) The geochemical evolution of the continentalcrust. Reviews of Geophysics 33: 241–265.
Taylor SR, McLennan SM, and McCulloch MT (1983) Geochemistry of loess,continental crustal composition and crustal model ages. Geochimica etCosmochimica Acta 47: 1897–1905.
Teng F, McDonough WF, Rudnick RL, et al. (2004) Lithium isotopic composition andconcentration of the upper continental crust. Geochimica et Cosmochimica Acta 68:4167–4178.
Thomas CW and Nixon PH (1987) Lower crustal granulite xenoliths in carbonatitevolcanoes of the western rift of East Africa. Mineralogical Magazine 51: 621–633.
Toft PB, Hills DV, and Haggerty SE (1989) Crustal evolution and the granulite toeclogite transition in xenoliths from kimberlites in the West African craton.Tectonophysics 161: 213–231.
Tredoux M, Hart RJ, Carlson RW, and Shirey SB (1999) Ultramafic rocks at the center ofthe Vredefort structure: Further evidence for the crust on edge model. Geology27(10): 923–926.
Trzcienski WE and Marchildon N (1989) Kyanite-garnet-bearing Cambrian rocks andGrenville granulites from the Ayers Cliff, Quebec, Canada, Lamprophyre DikeSuite—deep crustal fragments from the northern appalachians. Geology 17(7):637–640.
Upton BGJ, Aspen P, and Chapman NA (1983) The upper mantle and deep crustbeneath the British Isles: Evidence from inclusion suites in volcanic rocks. Journalof the Geological Society 140: 105–122.
Upton BGJ, Aspen P, Rex DC, Melcher F, and Kinny P (1998) Lower crustal and possibleshallow mantle samples from beneath the Hebrides: Evidence from a xenolithic dykeat Gribun, western Mull. Journal of the Geological Society 155: 813–828.
Upton BGJ, Aspen P, and Hinton RW (2001) Pyroxenite and granulite xenoliths frombeneath the Scottish northern Highlands terrane: Evidence for lower-crust/upper-mantle relationships. Contributions to Mineralogy and Petrology 142(2): 178–197.
Urrutia-Fucugauchi J and Uribe-Cifuentes RM (1999) Lower-crustal xenoliths from theValle de Santiago maar field, Michoacan-Guanajuato volcanic field, central Mexico.International Geology Review 41(12): 1067–1081.
van Breeman O and Hawkesworth CJ (1980) Sm–Nd isotopic study of garnets and theirmetamorphic host rocks. Transactions of the Royal Society of Edinburgh 71: 97–102.
van Calsteren PWC, Harris NBW, Hawkesworth CJ, Menzies MA, and Rogers NW(1986) Xenoliths from southern Africa: A perspective on the lower crust.In: Dawson JB, Carswell DA, Hall J, and Wedepohl KH (eds.) The Nature of theLower Continental Crust, Geological Society Special Publication, vol. 25, pp.351–362. London, Geological Society of London.
Vidal P and Postaire B (1985) Etude par la methode Pb–Pb de roches de hautgrade metamorphique impliquees dans la chaıne Hercynienne. Chemical Geology49: 429–449.
Vielzeuf D (1983) The spinel and quartz associations in high grade xenoliths fromTallante (S. E. Spain) and their potential use in geothermometry and barometry.Contributions to Mineralogy and Petrology 82: 301–311.
Villaseca C, Downes H, Pin C, and Barbero L (1999) Nature and composition of thelower continental crust in central Spain and the granulite-granite linkage: Inferencesfrom granulitic xenoliths. Journal of Petrology 40(10): 1465–1496.
Voshage H, Hofmann AW, and Mazzucchelli M, et al. (1990) Isotopic evidence from theIvrea zone for hybrid lower crust formed by magmatic underplating. Nature347: 731–736.
Wanke H, Bruckner J, Dreibus G, Rieder R, and Ryabchikov I (2001) Chemicalcomposition of rocks and soils at the pathfinder site. Space Science Reviews 96(1–4):317–330.
Warren RG, Kudo AM, and Keil K (1979) Geochemistry of lithic and single-crystalinclusions in basalts and a characterization of the upper mantle-lower crust in theEngle Basin, Rio Grande Rift, New Mexico. In: Riecker RE (ed.) Rio Grande Rift:Tectonics and Magmatism, pp. 393–415. Washington, DC: American GeophysicalUnion.
Wass SY and Hollis JD (1983) Crustal growth in southeastern Australia—evidencefrom lower crustal eclogitic and granulitic xenoliths. Journal of MetamorphicGeology 1: 25–45.
Weaver BL and Tarney J (1980) Continental crust composition and nature of the lowercrust: Constraints from mantle Nd–Sr isotope correlation. Nature 286: 342–346.
Weaver BL and Tarney J (1981) Lewisian gneiss geochemistry and Archaean crustaldevelopment models. Earth and Planetary Science Letters 55: 171–180.
Weaver BL and Tarney J (1984) Empirical approach to estimating the composition of thecontinental crust. Nature 310: 575–577.
Weber MBI, Tarney J, Kempton PD, and Kent RW (2002) Crustal make-up of thenorthern Andes: Evidence based on deep crustal xenolith suites, Mercaderes, SWColombia. Tectonophysics 345(1–4): 49–82.
Wedepohl H (1995) The composition of the continental crust. Geochimica etCosmochimica Acta 59: 1217–1239.
Wedepohl KH (1969–1978) Handbook of Geochemistry. Berlin: Springer.Wendlandt E, DePaolo DJ, and Baldridge WS (1993) Nd and Sr isotope
chronostratigraphy of Colorado Plateau lithosphere: Implications for magmaticand tectonic underplating of the continental crust. Earth and Planetary ScienceLetters 116: 23–43.
Wendlandt E, DePaolo DJ, and Baldridge WS (1996) Thermal history of ColoradoPlateau lithosphere from Sm–Nd mineral geochronology of xenoliths. GeologicalSociety of America Bulletin 108(7): 757–767.
Wernicke B, Clayton R, Ducea M, et al. (1996) Origin of high mountains in thecontinents: The southern Sierra Nevada. Science 271: 190–193.
Wilde SA, Valley JW, Peck WH, and Graham CM (2001) Evidence from detrital zirconsfor the existence of continental crust and oceans on the Earth 4.4 Gyr ago. Nature409(6817): 175–178.
Wilkinson JFG (1975) An Al-spinel ultramafic-mafic inclusion suite and highpressure megacrysts in an analcimite and their bearing on basaltic magmafractionation at elevated pressures. Contributions to Mineralogy and Petrology53: 71–104.
Wilkinson JFG and Taylor SR (1980) Trace element fractionation trends of thoeiiticmagma at moderate pressure: Evidence from an Al-spinel ultramafic-mafic inclusionsuite. Contributions to Mineralogy and Petrology 75: 225–233.
Wilshire HW, Meyer CE, and Nakata JK, et al. (1988) Mafic and Ultramafic Xenolithsfrom Volcanic Rocks of the Western United States US Geological SurveyProfessional Paper 1443. Washington, DC: US Government Printing Office.
Windley BF (1995) The Evolving Continents. Wiley.Worner G, Schmincke H-U, and Schreyer W (1982) Crustal xenoliths from the
Quaternary Wehr volcano (East Eifel). Neues Jahrbuch fur Mineralogie(Abhandlungen) 144(1): 29–55.
Yardley BWD (1986) Is there water in the deep continental crust? Nature 323: 111.Yu JH, O’Reilly SY, Griffin WL, Xu XS, Zhang M, and Zhou XM (2003) The thermal
state and composition of the lithospheric mantle beneath the Leizhou PeninsulaSouth China. Journal of Volcanology and Geothermal Research 122(3–4):165–189.
Zashu S, Kaneoka I, and Aoki K-I (1980) Sr isotope study of mafic and ultramaficinclusions from Itinome-gata, Japan. Geochemical Journal 14: 123–128.
Zheng JP, Sun M, Lu FX, and Pearson N (2003) Mesozoic lower crustal xenoliths andtheir significance in lithospheric evolution beneath the Sino-Korean craton.Tectonophysics 361(1–2): 37–60.
Zhou XH, Sun M, Zhang GH, and Chen SH (2002) Continental crust and lithosphericmantle interaction beneath North China: Isotopic evidence from granulite xenolithsin Hannuoba, Sino-Korean craton. Lithos 62(3–4): 111–124.