Scales of Heterogeneities in the Continental Crust and Upper Mantle
24
Pure appl. geophys. 156 (1999) 29–52 0033 – 4553/99/010029–24 $ 1.50 +0.20/0 Scales of Heterogeneities in the Continental Crust and Upper Mantle MARC TITTGEMEYER, 1 FRIEDEMANN WENZEL, 1 TROND RYBERG 2 and KARL FUCHS 3 Abstract — A seismological characterization of crust and upper mantle can refer to large-scale averages of seismic velocities or to fluctuations of elastic parameters. Large is understood here relative to the wavelength used to probe the earth. In this paper we try to characterize crust and upper mantle by the fluctuations in media properties rather than by their average velocities. As such it becomes evident that different scales of heterogeneities prevail in different layers of crust and mantle. Although we cannot provide final models and an explanation of why these different scales exist, we believe that scales of inhomogeneities carry significant information regarding the tectonic processes that have affected the lower crust, the lithospheric and the sublithospheric upper mantle. We focus on four different types of small-scale inhomogeneities: (1) the characteristics of the lower crust, (2) velocity fluctuations in the uppermost mantle, (3) scattering in the lowermost lithosphere and on (4) heterogeneities in the mantle transition zone. Key words: Inhomogeneous media, scattering, lower crust, upper mantle, transition zone. Introduction Seismologists characterize crust and upper mantle in two ways. They either specify the velocities of elastic waves, or their fluctuations. In the first case the earth is described by a velocity-depth function, which typically shows P -wave velocities between 6.4 and 7.2 km s -1 in the lower crust, a jump to velocities between 8.0 and 8.3 km s -1 at the crust-mantle boundary, a 1 Geophysical Institute, Karlsruhe University, Hertzstr. 16, 76187 Karlsruhe, Germany. E-mail: [email protected] 2 GeoForschungZentrum, Telegrafenberg, 14473 Potsdam, Germany. 3 Geophysical Institute, Karlsruhe University, Hertzstr. 16, 76187 Karlsruhe, Germany.
Transcript of Scales of Heterogeneities in the Continental Crust and Upper Mantle

Pure appl. geophys. 156 (1999) 29–520033–4553/99/010029–24 $ 1.50+0.20/0
Scales of Heterogeneities in the Continental Crust and UpperMantle
MARC TITTGEMEYER,1 FRIEDEMANN WENZEL,1 TROND RYBERG2 andKARL FUCHS3
Abstract—A seismological characterization of crust and upper mantle can refer to large-scaleaverages of seismic velocities or to fluctuations of elastic parameters. Large is understood here relativeto the wavelength used to probe the earth.
In this paper we try to characterize crust and upper mantle by the fluctuations in media propertiesrather than by their average velocities. As such it becomes evident that different scales of heterogeneitiesprevail in different layers of crust and mantle. Although we cannot provide final models and anexplanation of why these different scales exist, we believe that scales of inhomogeneities carry significantinformation regarding the tectonic processes that have affected the lower crust, the lithospheric and thesublithospheric upper mantle.
We focus on four different types of small-scale inhomogeneities: (1) the characteristics of the lowercrust, (2) velocity fluctuations in the uppermost mantle, (3) scattering in the lowermost lithosphere andon (4) heterogeneities in the mantle transition zone.
Key words: Inhomogeneous media, scattering, lower crust, upper mantle, transition zone.
Introduction
Seismologists characterize crust and upper mantle in two ways. They eitherspecify the velocities of elastic waves, or their fluctuations.
In the first case the earth is described by a velocity-depth function, whichtypically shows P-wave velocities between 6.4 and 7.2 km s−1 in the lower crust, ajump to velocities between 8.0 and 8.3 km s−1 at the crust-mantle boundary, a
1 Geophysical Institute, Karlsruhe University, Hertzstr. 16, 76187 Karlsruhe, Germany. E-mail:[email protected]
2 GeoForschungZentrum, Telegrafenberg, 14473 Potsdam, Germany.3 Geophysical Institute, Karlsruhe University, Hertzstr. 16, 76187 Karlsruhe, Germany.

Marc Tittgemeyer et al.30 Pure appl. geophys.,
small gradient of increasing velocities in the uppermost mantle, a low-velocity zonebetween 180 and 220 km depth and another positive gradient zone above andbetween the discontinuities at 410 and 660 km, respectively. This velocity-depthfunction may change laterally, and will show modification in values for differenttectonic regimes.
Velocity models for the lithosphere are usually derived from refraction seismicdata. The elastic waves generated by controlled seismic sources are received at thesurface along seismic lines, which extend from the source to distances of hundred,or several hundreds to thousands of km, depending upon the target. The waves thatpropagate through the crust and upper mantle along different paths appear asseismic phases in the seismogram sections. The travel times of those phases can beinverted for the velocity-depth structure.
Inversion of travel times from correlated phases results in a model in whichvelocities between interfaces are averaged over many wavelengths. In fact, thephysical notion of a phase relies on ray theory which is only applicable for mediawith large blocks of velocities which do not change strongly on the scale of awavelegth. The individual blocks (or layers) can be separated by sharp interfaces(AKI and RICHARDS, 1980).
Fluctuations of the medium cause wave scattering and coda effects on transmit-ted waves (AKI and CHOUET, 1975). Scattering analysis is widely conducted forcrustal earthquakes and array records of teleseismic events, but rarely for controlledsource data other than near-vertical reflection data.
To date, controlled source seismology (seismic reflection and refraction data)and long-period passive seismology provide the impression that the upper mantle israther homogeneous. For near-vertical reflections the mantle appears transparent ascompared to the reflective lower crust (e.g., BOIS and ECORS, 1991; HAMMER andCLOWES, 1997; MATTHEWS, 1986; MEISSNER and DEKORP, 1991; THOMPSON
and HILL, 1986). Mantle reflections are sometimes observed (e.g., BREWER et al.,1983; THOUVENOT et al., 1995; WARNER and MCGEARY, 1987), but as discretereflections rather than spatially distributed reflectivity. Refraction data allow theobservation of a Pn phase which serves to define a sub-Moho velocity or velocitygradient (cf., SHERIFF and GELDHARD, 1982). Long-range observations allow forthe definition of discrete velocity contrasts in the mantle, but again the modelsdisplay a mantle which is mostly homogeneous on the scale of several wavelengths.
Descriptions of the earth’s mantle by its velocity fluctuations rather than by itsaverage velocity are mostly restricted to interpretation of studies of wave fluctua-tion beneath seismological arrays (WU and FLATTE, 1990), to modelling waveforms for propagation in oceanic lithosphere (e.g., GETTRUST and FRAZER, 1981;MALLICK and FRAZER, 1990) and more recently to the understanding of ahigh-frequency phase observed in Russian long-range data with nuclear explosionsas the source (RYBERG et al., 1995).

Scales of Heterogeneities 31Vol. 156, 1999
Those data from the Russian Peaceful Explosion Program (PNE) offer a uniquepossibility to systematically assess the scattering properties of the upper mantlefrom the Mohorovicic discontinuity (Moho) to the bottom of the transition zone at670 km depth.
In this paper we endeavor to characterize crust and upper mantle not primarilyby their well-known average velocities but rather by the fluctuations in mediaproperties. In doing this it follows that different scales of heterogeneities prevail indifferent layers of crust and mantle. Although we cannot provide final models andexplanations of why these different scales exist, we believe that scales of inhomo-geneities carry significant information on the tectonic processes when they affect thelower crust, the lithospheric and the sublithospheric upper mantle.
We focus on four different types of small-scale inhomogeneities: (1) the charac-teristics of the lower crust, (2) velocity fluctuations in the uppermost mantle, (3)scattering in the lowermost lithosphere and on (4) heterogeneities in the mantletransition zone.
Characteristics of the Lower Crust
Important information relative to the continental lithosphere is provided bynear-vertical reflections backscattered from the lithosphere along reflection seismicprofiles. These data carry little information concerning the crustal velocities, butpermit the generation of seismic record sections—either stacked sections or mi-grated sections—which provide an image of the velocity and/or density fluctua-tions. If the earth were as homogeneous as most models inverted from refractionseismic experiments suggest, reflection seismology would have never developed forlithospheric applications.
However, the earth’s crust does contain fluctuations which can be imaged byreflection seismology (cf., MOONEY and MEISSNER, 1992). In the upper crust thesereflections can be correlated with features of surface geology and represent deepsedimentary layers, volcanic intrusions, thrust and normal faults. In general faultsbecome listric at midcrustal levels and rarely cut through the lower crust (e.g.,ALLMENDINGER and COCORP, 1983; COOK et al., 1981; MATTHEWS, 1986).
The lower crust is very often characterized by numerous subhorizontal orshallow dipping reflections which seem to be randomly distributed. They terminateabruptly at a certain depth (MEISSNER, 1986; OLIVER, 1986), which usuallycoincides with the Moho as found from wide-angle refraction seismic data (cf.,MOONEY and BROCHER, 1987). This widespread observation gave rise to thenotion of a laminated (GLOCKE and MEISSNER, 1976) or layered (FOUNTAIN,1987) lower crust.
A variety of explanations were initially discussed as the physical cause of thesereflection patterns. The most widely accepted is that the layered lower crust is the

Marc Tittgemeyer et al.32 Pure appl. geophys.,
result of intensive stretching (see e.g., REY, 1993) under thermodynamic conditionsin which rocks deform in plastic flow (KIRBY and KRONENBERG, 1987; KUSZNIR,1991). This flow affects material of different impedance and generates anisotropicorientation of minerals by localized deformation (e.g., LUSCHEN et al., 1990;SMITHSON, 1989, cf. POHL and WENZEL, Realistic Models of Anisotropic LaminatedLower Crust, this volume). This effect would produce the observed predominantlyhorizontal reflection pattern.
Figure 1 shows a seismic reflection record section from the central Black Forest(LUSCHEN et al., 1987). Its reflectivity is concentrated within the lower crust, theupper mantle appears as transparent, only a few reflections are discernible in theupper crust.
Figure 1Lower crustal seismic lamellae as observed on a seismic reflection profile recorded in the Black Forest,SW-Germany (LUSCHEN et al., 1987). Crustal reflectivity increases abruptly at about 5.5 s two-way time(TWT) and terminates at 9 s at the Moho. The high amplitudes of the reflections require the existenceof significant velocity contrasts (95% or larger) in the lower crust. Lower crustal seismic lamellae havebeen observed throughout the world with varying amplitudes, lateral continuity, and dips depending on
the tectonic setting (adopted from MOONEY and MEISSNER, 1992).

Scales of Heterogeneities 33Vol. 156, 1999
Figure 2Record section of the refraction profile in the Black Forest. The right panel shows the vertical component.Reduction velocity is 6.0 km s−1. Upper crustal phase (Pg ) and mantle reflections (PMP) are recognized.Data are scaled to maximum trace amplitude. The left panel shows the preferred 1-D model with strongfluctuation in the lower crust, causing the PiP coda (adopted from SANDMEIER and WENZEL, 1986).
Velocity depth distribution and reflectivity pattern carry different information.The first reflects the state of chemical differentiation of the earth and the metamor-phic conditions at depth. If models derived from reflection data are groupedaccording to the tectonic setting, one finds characteristic differences between oldshields, rifted areas, crust thickened by ongoing orogeny, volcanic arcs a.s.o. (cf.,MOONEY and MEISSNER, 1992; REY, 1993).
Reflectivity of the lower crust is usually attributed to extension and/or mag-matic intrusions. Extension can be a result of late to post-orogenic collapse oractive or passive rifting of the lithosphere. In both scenarios lower crustal temper-atures are high enough to promote plastic flow which tends to align minerals andmaterial of different composition horizontally. The dynamic processes that affectthe lower crust generate a particular scale (vertical and horizontal) that can beobserved with reflection seismic experiments. Those typically invoke frequenciesbetween 10 Hz and 50 Hz and near-vertical wave propagation.
The lower crustal reflectivity and wide-angle seismic observations are related intwo ways (BRAILLE and CHIANG, 1986). The velocity (or impedance) fluctuationswithin the lower crust are also visible in high-resolution seismic refraction data.They appear as coda wavetrain that follows the midcrustal reflection (PiP) from theConrad discontinuity. This has been observed from and modelled for the data setshown in Figure 2 (SANDMEIER and WENZEL, 1986). It served as proof thatimpedance fluctuations are actually causing the reflections and allowed to quantifythe size of fluctuations. For a velocity model based on this data set LEVANDER and

Marc Tittgemeyer et al.34 Pure appl. geophys.,
GIBSON (1991) introduced isotropic two-dimensional random fluctuation with acorrelation distance of 200 m.
The second more surprising feature is that the bottom of the reflectivity patternnormally coincides with the Moho as defined from refraction data. This has beenshown for many coincident reflection/refraction lines (MOONEY and BROCHER,1987). The generally accepted explanation is that the lower crust deforms in aplastic state whereas the uppermost mantle, due to its different lithology, may bebrittle. However, this does not explain the generation of the heterogeneities andtheir disappearance at Moho level. Another possible explanation is that lower crustand upper mantle deform in a ductile manner (cf., RANALLI, 1995), althoughdifferent lithologies and/or different strain rates generate different scales of struc-tures. Those developed in the lower crust are detectable with the near-verticalreflection seismic geometry and frequency window; those in the upper mantle arenot.
From reflection seismic records, the notion of reflective lower crust and trans-parent upper mantle arose. It must be emphasized, however, that the mantle is onlytransparent for the frequency range and the geometry of this particular method,namely for near-vertical incidence. There is no reason to believe that the mantle ishomogeneous on a scale of tens of kilometers, that it has not been affected bytectonic processes and that those processes have not left their fingerprints asimpedance fluctuations on a particular scale. In fact, inspection of wide-angle dataand their coda properties reveals that a significant change in scale of fluctuationsoccurs especially between lower crust and upper mantle (ENDERLE et al., 1997). Theparticular scale at Moho level is imaged in the coda properties of the wide-angleMoho reflection (PMP). The scale of mantle fluctuations is contained in long-rangerefraction data which allow observation of the so-called teleseismic Pn and Sn
phases.
Fluctuations in the Uppermost Mantle
Long-range refraction seismic data analyzed for the teleseismic Pn and Sn phasesbelong to the system of deep seismic sounding profiles carried out by Russianscientists from 1971 to 1990 (Fig. 3) (cf., EGORKIN and MIKHALTSEV, 1990).Peaceful Nuclear Explosions (PNE) and numerous chemical explosions were usedas powerful sources. In particular, the seismic data from the QUARTZ profile,located in northern Eurasia, were used to investigate the teleseismic Pn (RYBERG etal., 1995). About 400 short-period (1–2 Hz) three-component, analogue recordingsystems were deployed to record the ground motion which resulted in maximumobservation distances of about 3200 km. The average station spacing of about 10km along the profiles provides a unique data density for studies of the uppermantle’s reflection response in an unprecedented resolution.

Scalesof
Heterogeneities
35V
ol.156,
1999
Figure 3Map of northern Eurasia with the seven major DSS profiles (heavy dotted lines) and the locations of the Peaceful Nuclear Explosions (filled circles). The majortectonic provinces are indicated. The projects were managed by GEON, the geophysical exploration unit of the Ministry of Geology of the former USSR.

Marc Tittgemeyer et al.36 Pure appl. geophys.,
The recorded wave field of the PNEs along the long-range profiles exhibitsdistinct phases that are associated with the large-scale velocity structure of theupper mantle (e.g., EGORKIN and PAVLENKOVA, 1981; MECHIE et al., 1993;RYBERG et al., 1996). In addition to these distinct phases, the high-frequency partof the wave field differs strongly from the corresponding low-frequency constituent.RYBERG et al. (1995) show that it is clearly dominated by the teleseismic Pn,defined as a phase which travels with a group velocity of 8.1 km s−1 within themantle lithosphere to observational distances of several thousands of kilometers. Ithas no sharp onset and at distances greater than 1300 km it arrives after the wavediving through the upper mantle. This phase contains only high-frequency en-ergy—therefore it is also referred to as high-frequency teleseismic Pn—in the bandbetween 5–10 Hz and is characterized by a long incoherent coda.
Whenever frequencies generated by the source are high enough (5–10 Hz), thephase appears on the PNE recordings. Thus it can clearly be identified on the shotsof the profile QUARTZ (Fig. 4), and is also reported on profile RUBY I(TITTGEMEYER et al., 1997). The teleseismic Pn phase can also be observed on othercontrolled source experiments, such as Early Rise (HALES, 1972), and ENDERLE etal. (1997) argues that the Pn observed on the long-range profiles in western Europecan be interpreted as the same feature. TITTGEMEYER et al. (1997) relate the
Figure 4High-pass filtered (corner frequency fc=5 Hz) vertical-component time-distance record section (reduc-tion velocity 6red=8.0 km s−1) on profile QUARTZ for shotpoint 323 recorded in the Northwest. It istrace normalized individually to maximum trace amplitude. The marked strong wave band traveling with
a group velocity of �8.1 km s−1 is the high-frequency teleseismic Pn.

Scales of Heterogeneities 37Vol. 156, 1999
appearance of the teleseismic Pn on the PNE profiles to its correspondent in the Swave field, the teleseismic Sn.
The notion teleseismic Pn /Sn has been used previously by MOLNAR and OLIVER
(1969), who investigated efficient long-range propagation of mostly Sn wavesgenerated by earthquakes. Those waves could be observed to travel with uppermantle velocities for several thousands of kilometers and are reported as highfrequency signals both for continental and oceanic paths. Unfortunately the spare-ness of the net of earthquake stations did not allow plotting seismic record sectionsand thus visualization of the evolution of the teleseismic Pn /Sn with distance.
As a likely explanation for the efficient propagation of the Pn, several authorsconsider the existence of a sub-Moho waveguide. For this waveguide severaltheories have been proposed: transmission of energy in a low-velocity zone beneaththe Moho (SUTTON and WALKER, 1972); tunneling of low-frequency wavesthrough thin high-velocity layers (FUCHS and SCHULZ, 1976); transmission ofenergy in a high-velocity layer beneath the Moho as ‘lid’ and normal modes(MANTOVANI et al., 1977; STEPHENS and ISACKS, 1977); transmission of energy asa whispering-gallery wave multiple reflected at the crust-mantle boundary (MENKE
and RICHARDS, 1980); and propagation in models containing random velocityfluctuations in the crust and/or upper mantle (MENKE and CHENG, 1984;RICHARDS and MENKE, 1983). By simulations of the wave propagation in analogseismic models of scattering earth structure, MENKE and RICHARDS (1983) demon-strated that layers of scatterers within the mantle could explain, in certain respects,the coda phenomenon of the teleseismic Pn. TITTGEMEYER et al. (1996) showedthat random successions of high- and low-velocity layers acting as a waveguide canquantitatively explain the main features of the teleseismic Pn as observed on profileQUARTZ, such as coda length, enhancement of high frequencies, and a groupvelocity of 8.0 km s−1 to 8.1 km s−1.
Our favorite upper mantle model is shown in Figure 5. It includes a standardcrustal structure with homogeneous upper and lower crust with P-wave velocities of6.0 km s−1 for the upper and 6.5 km s−1 for the lower crust between 16 and 35 kmdepth. Moho is marked by a first-order discontinuity at 35 km depth. The upper 75km of the mantle are characterized by a slightly positive gradient zone. For thiszone we assume a constant QP of 1400 and a constant QS of 600. The density-depthdistribution is calculated according to Birch’s relation (BIRCH, 1961).
The observations on long-range seismic profiles call for a class of upper mantlemodels which are characterized by random fluctuations in elastic parameters.According to the results of TITTGEMEYER et al. (1996), we focus on P-wavevelocity fluctuations whilst the S-wave velocity is kept constant in our model. Thus,the P-wave velocity variations are accompanied by variations in Poisson’s ratio. Ifthe velocity fluctuations are in the range of 93%, a new feature in the wave field,the teleseismic Pn, arises. If they are smooth, low-frequency, in comparison to thefrequency content of the incident source signal, the notion of a heterogeneous

Marc
Tittgem
eyeret
al.38
Pure
appl.geophys.,

Scales of Heterogeneities 39Vol. 156, 1999
mantle is still consistent with the initially discussed observation under the reflectionseismic aperture and frequency content, that the upper mantle appears to betransparent.4
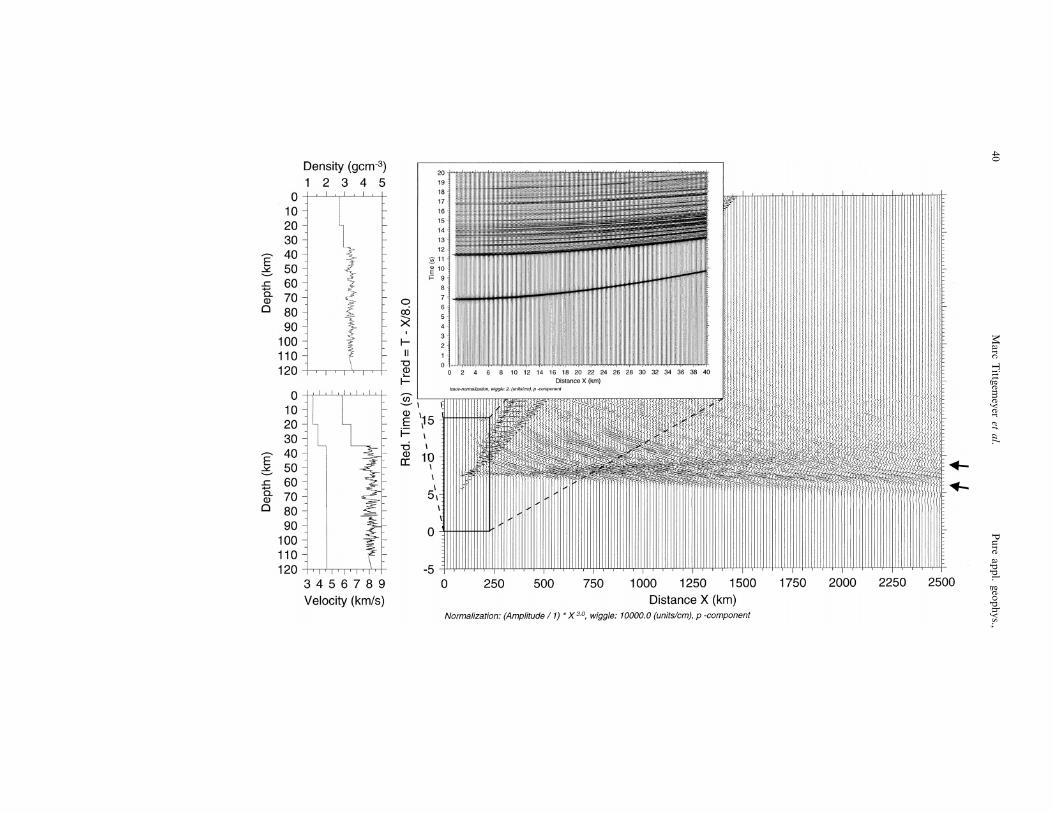
In Figure 6 the theoretical seismic response of a model similar to that shown inFigure 5 is displayed. The appearance of the fluctuations in this model is more rough,high-frequency, owing to the different correlation function.
Random models of heterogeneity have the advantage of being concisely describedby a spatial correlation function and the magnitude of variation in physical properties(FRANKEL and CLAYTON, 1986).
The power spectrum of the medium corresponds to the Fourier transform of itsautocorrelation function (Theorem of WIENER-CHINTSCHIN, cf. REIF, 1987). There-fore a simple way to characterize a random medium is through a monotonicallydecaying autocorrelation function (cf., HOLLIGER and LEVANDER, 1992). The rateof decay of the autocorrelation function is a measure for the degree of randomnessof the medium. The most prominent analytical correlation functions are the Gaussianand the exponential correlation function (cf., FRANKEL, 1989). The spectrum of aGaussian correlated medium indicates a slowly decaying spatial correlation at shortto intermediate lags and dominance of low to intermediate wave numbers. Its rapidexponential decay results in smooth medium with little contribution from highwave-number heterogeneities. The spectrum of an exponential correlated mediumbehaves differently. The spectrum displays a much broader range of wave numberswhich contribute to the heterogeneity spectrum. The medium is rougher and morecomplex than the Gaussian medium due to its wider range of contributing wavenumbers.
The model depicted in Figure 6 is based on an exponential correlation function,whereas the fluctuations on the other (Fig. 5) are Gaussian correlated.
To calculate the wide-angle response of both models, a P-wave point source waslocated in 100 m depth, and a source time function with a dominant frequency of4 Hz was used. Representing the typical frequency content of reflection seismograms,
Figure 5P-wave theoretical record sections calculated with the reflectivity method (FUCHS and MULLER, 1971).The velocity-depth functions that the calculation of the seismograms is based on are displayed to the left.IASPEI-91 (KENNETT and ENGDAHL, 1991) serves as a reference background model to which P-wavevelocity fluctuations are superimposed. The fluctuations are characterized by a spatial correlation lengthof 700 m and a standard deviation of 3%. They are distributed according to a Gaussian correlationfunction. Note that a teleseismic Pn is generated with its significant characteristics, high-frequency content(compared to the lower frequency precursor), extensive coda and a constant group velocity of 8.0 km s−1.The near-vertical response (see inset) of that model remains the same as if the model would be not
heterogeneous.
4 The vertical change in velocity gradient (D6/Dz) could act as a filter on near-vertically incidentsignals (WOLF, 1937).
Marc
Tittgem
eyeret
al.40
Pure
appl.geophys.,

Scales of Heterogeneities 41Vol. 156, 1999
Figure 7Vertical-component time-distance record section (reduction velocity 6red=8.0 km s−1) on profileQUARTZ (for the location see Fig. 3) for shotpoint 323 recorded in the Northwest. The offset rangebetween 0 and 1500 km is shown. At distances between 700 and 1500 km the wave field is hardlydescribed by a phase. The wave field becomes very irregular. This is taken as evidence that strong
scattering occurs at the respective depth of about 100–180 km.
the theoretical record sections depicted in the inset of Figures 5 and 6 werecalculated with a dominant frequency of the source signal of 30 Hz.
Whereas the wide-angle response of both models is quite similar to that whichis observed, the near-vertical response of the rough model is in strong contrast tothat which is widely seen.
Because the actual size of fluctuations will probably change with the dimension-ality of the models, we do not want to discuss petrological implications in a
Figure 6P-wave theoretical record sections calculated with the reflectivity method (FUCHS and MULLER, 1971).The velocity-depth functions that the calculation of the seismograms is based on are displayed to the left.IASPEI-91 (KENNETT and ENGDAHL, 1991) serves as a reference background model to which P-wavevelocity fluctuations are superimposed. The fluctuations are distributed according to an exponentialcorrelation function. Statistically, they are characterized by a spatial correlation length of 700 m and astandard deviation of 3%. Note that even though the wide-angle response is quite similar to that which
is observed, the near-vertical response (see inset) is in strong contrast to that which is widely seen.

Marc Tittgemeyer et al.42 Pure appl. geophys.,
quantitative sense. It is conceivable that the fluctuations represent preferred orienta-tion of olivine with a random component.
Upper mantle and lower crust are different in terms of composition, composi-tional variety and rheology. Lower crust is assumed to be predominantly mafic butto contain both mafic and felsic rocks which allow for high impedance contrasts.The mantle could have a mineralogically more homogeneous composition but withhighly anisotropic material, in particular olivine (cf., ANDERSON, 1989). Fluctua-tions caused by anisotropy are pure velocity variations with constant density. Thiswould result in fairly small near-vertical impedance contrasts. Additionally mantlematerial at a given geotherm can yield higher differential stresses than lower crustalrocks. These differences may result in different scales of vertical layering andhorizontal extent of inhomogeneities.
Scattering in the Lowermost Lithosphere
In the offset range of about 700 to 1200 km the first-arrival wave field of mostPNE data displays a high degree of irregularity.
Figure 7 shows an example from QUARTZ where fluctuations of arrival time ofseveral seconds are observed. The arrivals have apparent velocities ranging fromabout 8.0 to 8.7 km s−1. For an explanation MECHIE et al. (1993) proposed amodel consisting of alternating high- and low-velocity layers. THYBO and PERCHUC
(1997a,b) interpret this property as wave-field fluctuation caused by velocityvariatons between the 8° discontinuity at �100 km depth and the Lehmanndiscontinuity (LEHMANN, 1964) at a depth of �220 km (its depth being variable,depending on the thermal regime). Similar features were also observed on theFENNOLORA (HAUSER et al., 1990) profiles (cf., PERCHUC and THYBO, 1996)which are, like QUARTZ, located in an old stable continent. No real phasecorrelation is possible in this particular offset range. The associated depth range isabout 100 to 180 km, which corresponds to the lowermost part of the lithosphere.
The waves beyond 1200 km are more regular as regards their first arrivals. Itcan thus be concluded that the lower lithosphere is characterized by intensivescattering. The underlaying medium is clearly more homogeneous. Although wehave no quantitative model of lower lithosphere scattering, it is obvious that thespatial scale of scatterers in this part of the lithosphere must be larger than in theuppermost mantle.
The Mantle Transition Zone
The upper mantle transition zone has been mapped by passive seismology usingvarious data sets. Accordingly, P to S conversion of long-period data (PETERSEN etal., 1993), P wide-angle underside reflections and conversions (ESTABROOK and

Scales of Heterogeneities 43Vol. 156, 1999
KIND, 1996; KENNETT and ENGDAHL, 1991), long-period shear waves (SS andScS) (REVENAUGH and JORDAN, 1991; SHEARER, 1991, 1996; SHEARER andMASTERS, 1992) tomographic methods (CREAGER and JORDAN, 1984, 1986;FUKAO et al., 1992; VAN DER HILST et al., 1991; WIDIYANTORO and HILST, 1996)and near-vertical P %P % underside reflections (BENZ and VIDALE, 1993) were used toconstrain the elastic properties of the mantle transition zone.
Most of these methods are based on relatively long-period signals (\5 s) andrequire substantial data processing (deconvolution stacking, etc.) of wave forms andthus inherently average over large spatial regions. Consequently, they can hardlyserve as an indication for small-scale variabilities of the transition zone. Short-period data are more sensitive to small velocity fluctuations than long-period data.This is usually viewed as disadvantageous, but can be taken as a measure of thespatial scale of these fluctuations and can possibly answer questions concerning thedegree of chemical homogenization of the mantle.
Controlled source seismic data sets (such as the PNEs recorded in northernEurasia) have several potential advantages in contrast to earthquake data. Well-known shot times and locations and a relatively simple source function in conjunc-tion with a relatively dense spatial sampling of the wave field provide high-qualitydata sets.
The amplitudes of seismic phases from the upper mantle discontinuities can beinfluenced by several factors. The energy distribution along the wide-anglephases, mainly the top-side reflection at the boundary and the refraction belowit, depends substantially on the velocity contrast and the sharpness of the dis-continuity. The depth of a reflector and its possible topography will producechanges in the energy distribution along the phases due to caustics and focussing/defocussing effects. Scatterers in the overlaying upper mantle and/or in the crustwill also have an impact on the wave field by introducing an incoherent scatteringcoda and other amplitude fluctuations. Local site effects are well-known fromstrong motion analysis to easily change the amplitudes by a factor of 5 to 10.Tuning by resonance effects can enhance frequency range and thus considerablychange the wave forms.
On the other hand short-period data are more sensitive to small-scale lateralfluctuations in the elastic properties of the medium. The wave form is influenced bythe medium properties along the seismic ray path and region around it that isdescribed by the Fresnel zone. Short-period P %P % underside reflections (BENZ andVIDALE, 1993) inferred sharp discontinuities at 410 and 660 km depth. Thesereflections are very sensitive to the width of the transition at both respective depths.The fact that they appear and disappear from place to place is indicative ofsubstantial lateral variations of at least this property of the transition zone.Previous work by PAULSSEN (1988) with short-period data recorded by the NARSarray used P to S conversions. The author notes substantial lateral variations inimpedance contrast across the discontinuities.

Marc Tittgemeyer et al.44 Pure appl. geophys.,
Figure 8Examples of vertical component record sections recorded along PNE profiles in northern Eurasia.Depicted are the recordings of two shots along QUARTZ (top right and left), of the southernmost shotalong METEORITE (middle left), and the recordings shot 3 recorded along KRATON (middle right)from east to west. All data are shown trace normalized and time reduced (reduction velocity 6red=10.0km s−1), and to further enhance the mantle phases a low-pass filter (corner frequency fc=1.25 Hz) wasapplied. The sketch at the bottom right provides an overview of the arrival time for the reflected(P410P, P660P) and refracted (P410, P660) seismic phases associated with the mantle transition zone. Thisis based on the model IASPEI-91 (KENNETT and ENGDAHL, 1991). The panel to the bottom left shows
a stack of all available PNE data (18 shots recorded along 7 profiles, cf., RYBERG et al., 1998).

Scales of Heterogeneities 45Vol. 156, 1999
Figure 8 shows the examples of the seismic record sections with phases of thetransition zone for 4 PNE shotpoints recorded along the profiles QUARTZ,KRATON and METEORITE. A reduction velocity has been chosen as 10 km s−1
so that the 410 km response is aligned horizontally. The travel-time curvespredicted by the model of the International Association of Seismology and Physicsof the Earth’s Interior 1991 (IASPEI-91) (KENNETT and ENGDAHL, 1991) aredisplayed in the right lower corner. In addition one panel shows the stack of allavailable PNE data (18 shots recorded along 7 profiles, cf., RYBERG et al., 1998).This panel represents the average structure of the 410 km discontinuity undernorthern Eurasia and is fully compatible with the IASPEI-91 model. While thetravel times of the reflected and refracted phases from the mantle transition zoneare in good agreement with the times predicted by IASPEI-91, there is significantvariation of their (relative) amplitudes. The four data sets (Fig. 8) show character-istic differences of the 410 km response with regard to the amplitude of the waverefracted beneath the discontinuity and the wide-angle reflection from the disconti-nuity. KRATON and METEORITE indicate a critical point at about 1500 kmdistance; in contrast, the critical point of the QUARTZ profiles seems to be shiftedto larger offsets. This, however, may be an effect of the relative amplitude scalingof the seismograms. Nonetheless the main difference can be seen in the amplituderatio of wide-angle reflection and refraction. All profiles, apart from QUARTZ-1display a high-amplitude refraction. This is indicative of a relatively large velocitygradient beneath the discontinuity and/or for variable velocity contrasts across orfor topographic effects along the discontinuity. THYBO et al. (1997) even suppliedan interpretation concluding a second reflector in the depth range of 400 km.
The refraction in QUARTZ-1 is barely visible, which must be related to arelatively small velocity gradient of the refractor. The sites of the mantle sampledby QUARTZ-1 and -3 are within a few hundred kilometers distance (cf., RYBERG
et al., 1996). Thus the properties of the transition zone can obviously change on thislateral scale. The wide-angle reflection is very well established in QUARTZ-1 and-3, but much less pronounced in both other profiles. This calls for differentreflection properties of the 410 km discontinuity beneath northeast Eurasia. Similarobservations of the relative amplitudes for the 660 km phases hold true for the 670km discontinuity (RYBERG et al., 1998), except for the reduced velocity step acrossthat discontinuity. While the stacking method applied by RYBERG et al. (1998)tends to average the variability of the 410 and 660 km discontinuity, the individualrecord sections show a substantial and systematic scatter of amplitudes for thephases of the mantle transition zone. The relatively consistent behavior of theamplitudes along the seismic phases allows us to exclude strong site effects (crustalscatterers, tuning due to the crust, etc.). Therefore, most of the observed amplitudefeatures should be caused by structures in the upper mantle.
Concluding from the PNE data base alone, it would be hard to tell whetherfocussing/defocussing effects due to topography along the boundaries or a more

Marc Tittgemeyer et al.46 Pure appl. geophys.,
complicated velocity structure (transitional discontinuities with varying thicknesses,small-scale velocity fluctuation acting as scatterers, or several phase transitionsoccurring at slightly different depths: g spinel to perovskite and magnesiowustiteand/or a transition from garnet to perovskite for the 660 km discontinuity (DUFFY
and ANDERSON, 1989; IRIFUNE, 1987; ITA and STIXRUDE, 1992; ITO and TAKA-
HASHI, 1989; KUSKOV and PANFEROV, 1991) are responsible for the observation.
Conclusions
The data presented to date indicate that the crust/mantle system shows conspic-uous fluctuations in elastic parameters with different scales: Reflection data show alayered or reflective lower crust with velocity fluctuations as high as 10%, withvariable vertical and lateral scales, the latter typically being in the 100 m range. Atthe crust/mantle boundary (Moho) the scale of heterogeneities changes.
PNE data from super-long refraction seismic profiles in Russia give evidence ofrandom fluctuations in the upper mantle. 1-D modeling provides a vertical scale ofthe inhomogeneities in the km range. The horizontal correlation length is unknown.We estimate it to be in the 10 km range in order to trap the elastic energy andpropagate it out to 3000 km offset from the source. Observations of Sn wavesrecorded at permanent seismic stations and data with oceanic travel path indicatethat these upper mantle fluctuations may also represent a wide-spread feature.Those fluctuations of the uppermost mantle have a larger correlation length and aresmoother as compared to the lower crust. This change in scale is in fact the physicalreason for the coincidence of reflection and refraction Moho. Figure 9 portrays acartoon which summarizes the described properties.
The deepest portion of the lithosphere seems to consist of heterogeneousmaterial with correlation lengths of several wavelengths which lead to distortions offirst-arrival times of P waves.
Figure 9Long distance wave propagation of Pn and Sn is achieved by statistical fluctuations of elastic parametersin the uppermost mantle, which differ markedly in the scale of structure and in the magnitude ofvariation from the overlaying lower crust. Here a typical lower crustal structure which could reproducewhat is widely observed, is generated after HOLLIGER et al. (1994). Statistically this is represented byheterogeneity with a fractal dimension of 2.7, a bimodal velocity distribution of 5% and a horizontal andvertical characteristic scale of 800 and 200 m, respectively. With the anticipation that the results from1-D modeling still determine the 2-D case, mantle, heterogeneities are spatially Gaussian distributed andhave a characteristic vertical scale length of 700 m. The aspect ratio is set arbitrarily to 4 (as in the lowercrust). The standard deviation of the velocity distribution of 3% is assumed to be smaller for 2-Dmodeling rather than in the 1-D case. Both targets, lower crust and uppermost mantle, provide a genericdescription of geologic heterogeneity and represent end-member models in the description of reflecting
structures.

Scales of Heterogeneities 47Vol. 156, 1999

Marc Tittgemeyer et al.48 Pure appl. geophys.,
The different scales and the associated scattering have significant influence onwide-angle seismic data. The fluctuation characteristics for the uppermost mantlegenerate a new (non-Fermat) phase, whereas the coarse structure at the bottom ofthe lithosphere leads to the destruction of a clear refracted phase.
Once the scales and their variations are established, their geological andpetrological significance becomes the key problem. At this point only speculationand options can be discussed. The layered lower crust may represent the evidencefor a decoupling of motion between the upper crust and mantle during tectonicprocesses acting at high temperatures. The Moho with its conspicuous crust/mantlemix (cf., ENDERLE et al., 1997) could have acted as detachment during theseprocesses. Upper mantle and lower crust are different in terms of composition,compositional variety and rheology. Mantle material at a given geotherm can yieldhigher differential stresses than lower crustal rocks. These differences may result indifferent scales of vertical layering and horizontal extent of inhomogeneities (TITT-
GEMEYER et al., 1996).The fluctuations in the deep lithosphere were interpreted as the result of partial
melting processes by THYBO and PERCHUC (1997a) (cf., also THYBO and PERCHUC,1997b), assuming that the geotherm of a cold continental area exceeds the soliduscurve of upper mantle material at a depth of 100 to 200 km.
We believe that the PNE images of the transition zone reflect the complexity ofthis particular regime. Modern seismic tomography evidences that slabs penetratethe transition zone, however those do not necessarily do so. Also the transitionzone may represent the source of hot spot volcanism. It represents a layer of thedynamic earth to which material is added and from which material is extracted. Aresult of these ongoing processes should be a certain amount of lateral inhomogene-ity. In this view the transition zone can be compared with the Moho. Both arerecognized as global features which result from the earth’s evolution and chemicalstratification. Its detailed structure, however, reflects and depends considerably onits history.
Acknowledgments
In particular, for many fruitful discussions, the authors wish to thank SergeiShapiro. We appreciate the thorough reviews by Hans Thybo and an anonymousreferee which assisted in improving the paper. The digital data for the PNE profileswere kindly made available by the GEON/Russian Geological Committee withinthe EUROPROBE cooperation agreement. The ministry of Education and Re-search of Germany (BMBF) supported the digitization of the PNE data at GEON.M.T.’s work is funded by the Deutsche Forschungsgemeinschaft (grant WE1394/10–1). GMT (WESSEL and SMITH, 1995) was used for plotting most of the figures.The calculations were performed on the SNI VPP300/4 of the computer center,

Scales of Heterogeneities 49Vol. 156, 1999
Karlsruhe University and on a Cray T3E of the German National SupercomputerCenter in Stuttgart.
REFERENCES
AKI, K., and CHOUET, B. (1975), Origin of Coda Wa6es: Source, Attenuation, and Scattering Effects, J.Geophys. Res 80, 3322–3342.
AKI, K., and RICHARDS, P. G., Quantitati6e Seismology: Theory and Methods, vols. I and II (W. H.Freeman and Company, San Francisco 1980).
ALLMENDINGER, R. W., and COCORP (1983), Cenozoic and Mesozoic Structures of the Eastern Basinand Range Pro6ince, Utah, from COCORP Seismic-reflection Data, Geology 11, 532–536.
ANDERSON, D. L., Theory of the Earth (Blackwell Scientific Publications, Boston, Oxford, London,Endinburgh, Melbourne 1989).
BENZ, H. M., and VIDALE, J. E. (1993), Sharpness of Upper-mantle Discontinuities Determined fromHigh-frequency Reflections, Nature 365, 147–149.
BIRCH, F. (1961), The Velocity of Compressional Wa6es in Rocks to 10 kbars, Part 2, J. Geophys. Res.66, 2199–2224.
BOIS, C., and ECORS, Late- and post-orogenic e6olution of the crust studied from ECORS deep seismicprofiles. In Continental Lithosphere: Deep Seismic Reflections (eds. R. Meissner, L. Brown, H.-J.Durbaum, W. Franke, K. Fuchs, and F. Seifert), vol. 22 (AGU Geodynamics Series, 1991).
BRAILLE, L., and CHIANG, C. S., The continental Mohoro6icic discontinuity; results from near-6ertical andwide-angle seismic refraction studies. In Reflection Seismology: A Global Perspecti6e (eds. M. Barazangiand L. D. Brown), vol. 13, Geodyn. Series ed. (Am. Geophys. Union 1986) pp 257–272.
BREWER, J. A., MATTHEWS M. R., WARNER, M. R., HALL, J., SMYTHIE, D. K., and WHITTINGTON,R. J. (1983), BIRPS Deep Seismic Reflection Studies of the British Caledonies—The WINCH Profile,Nature 305, 206–210.
COOK, F. A., BROWN, L. D., KAUFMAN, S., OLIVER, J., and PETERSEN (1981), COCORP SeismicProfiling of the Apalachian Orogen beneath the Costal Plain of Georgia, Geol. Sco. Am. Bull. 92,738–748.
CREAGER, K. C., and JORDAN, T. H. (1984), Slab Penetration into the Lower Mantle, J. Geophys. Res.89, 3031–3049.
CREAGER, K. C., and JORDAN, T. H. (1986), Slab Penetration into the Lower Mantle beneath theMariana and Other Island Arcs of the Northwest Pacific, J. Geophys. Res. 91, 3573–3589.
DUFFY, T. S., and ANDERSON, D. L. (1989), Seismic Velocities in Mantle Minerals and the Mineralogyof the Upper Mantle, J. Geophys. Res. 94, 1895–1912.
EGORKIN, A. V., and PAVLENKOVA, N. I. (1981), Studies of Mantle Structure of U.S.S.R. Territory onLong-range Seismic Profiles, Phys. Earth Planet. Inter. 25, 12–26.
EGORKIN, V. A., and MIKHALTSEV, A. V., The results of seismic in6estigations along geotra6erses. InSuper-deep Continental Drilling and Deep Geophysical Sounding (eds. K. Fuchs, Y. A. Kozlovsky,A. I. Krivtsov, and D. Zoback) (Springer Berlin, Heidelberg, New York 1990) pp. 111–119.
ENDERLE, U., TITTGEMEYER, M., ITZIN, M., PRODEHL, C., and FUCHS, K., Scales of structure in thelithosphere—Image of processes. In Stress and Stress Release in the Lithosphere—Structure andDynamic Processes in the Rifts of Western Europe (eds. K. Fuchs, R. Altherr, B. Muller, and C.PRODEHL), vol. 275, Special Issue (Tectonophysics 1997) pp. 165–198.
ESTABROOK, C., and KIND, R. (1996), The Nature of the 660 km Upper-mantle Seismic Discontinuityfrom Precursors to the PP Phase, Science 274, 1179–1182.
FOUNTAIN, D. M., Geological and geophysical nature of the lower continental crust as re6ealed by exposedcross sections of the continental crust. In Geophysics and Petrology of the Deep Crust and Upper Mantle(eds. S. J. Noller, S. H. Kirby, and J. E. Nelson-Pike), vol. 956 (U.S. Geol. Survey Circular 1987) pp.25–26.
FRANKEL, A. (1989), Re6iew of Numerical Experiments on Seismic Wa6e Sattering, Pure appl. geophys.131, 639–685.

Marc Tittgemeyer et al.50 Pure appl. geophys.,
FRANKEL, A., and CLAYTON, R. W. (1986), Finite-difference Simulations of Seismic Scattering:Implications for the Propagation of Short-period Seismic Wa6es in the Crust and Models of CrustalHeterogeneity, J. Geophys. Res 91, 6465–6489.
FUCHS, K., and MULLER, G. (1971), Computation of Synthetic Seismograms with the Reflecti6ity Methodand Comparison to Obser6ations, Geophys. J. Royal Astron. Soc. 23, 417–433.
FUCHS, K., and K. SCHULZ (1976), Tunneling of Low-frequency Wa6es through the Subcrustal Litho-sphere in Southern Germany, J. Geophys 42, 175–190.
FUKAO, Y., OBAYASHI, M., INOUE, H., and NENBAI, M. (1992), Subducting Slabs Stagnant in theMantle Transition Zone, J. Geophys. Res. 97, 4809–4822.
GETTRUST, J. F., and FRAZER, L. N. (1981), A Computer Model Study of the Propagation of theLong-range Pn Phase, Geophys. Res. Lett. 8, 749–752.
GLOCKE, A., and MEISSNER, R., Near-6ertical reflections recorded at the wide-angle profile in theRheinish Massif. In Explosion Seismology in Central Europe (eds. P. Giese, C. Prodehl, and A. Stein)(Springer Verlag, Berlin 1976) pp. 252–256.
HALES, A. L. (1972), The Tra6el Times of P Seismic Wa6es and their Rele6ance to the Upper MantleVelocity Distribution, Tectonophysics 13, 447–482.
HAMMER, P. T. C., and CLOWES, R. M. (1997), Moho Reflecti6ity Patterns—A Comparison of CanadianLITHOPROBE Transects, Tectonophysics 269, 179–198.
HAUSER, F., PRODEHL, C., and SCHIMMEL, M. (1990), Fennolora, Open File Report 90–2, GeophysicalInstitute.
HOLLIGER, K., and LEVANDER, A. R. (1992), A Stochastic View of Lower Crustal Fabric Based onE6idence from the I6rea Zone, Geophys. Res. Lett. 19, 1153–1156.
HOLLIGER, K., LEVANDER, A., CARBONELL, R., and HOBBS, R. (1994), Some Attributes of Wa6efieldsScattered from I6rea-type Lower Crust, Tectonophysics 119, 497–510.
IRIFUNE, T. (1987), An Experimental In6estigation of the Pyroxene-garnet Transformation in a PyroliteComposition and its Bearing on the Constitution of the Mantle, Phys. Earth Planet. Inter. 45, 324–336.
ITA, J., and STIXRUDE, L. (1992), Petrology, Elasticity, and Composition of the Mantle Transition Zone,J. Geophys. Res. 97, 6849–6866.
ITO, E., and TAKAHASHI, E. (1989), Postspinel Transformation in the System Mg2SiO4-Fe2SiO4 andSome Geophysical Implications, J. Geophys. Res. 94, 10,637–10,646.
KENNETT, B. L. N., and ENGDAHL, E. R. (1991), Tra6el Times for Global Earthquake Location andPhase Identification, Geophys. J. Int. 105, 429–465.
KIRBY, S., and KRONENBERG, A. (1987), Rheology of the Lithosphere: Selected Topics, Rev. Geophys.Space Phys. 25, 1219–1244.
KUSKOV, O. L., and PANFEROV, A. B. (1991), Constitution of the Mantle. Part 3: Density, ElasticProperties and the Mineralogy of the 400-km Discontinuity, Phys. Earth Planet Inter. 69, 85–100.
KUSZNIR, N. J., The distribution of stress with depth in the lithosphere: Thermorheological and geodynamicconstraints, vol. 194. In Tectonic Stress in Lithosphere (The Royal Society, London 1991).
LEHMANN, I. (1964), On the Velocity of P in Upper Mantle, Bull. Seismol. Soc. Am. 54, 1097–1103.LEVANDER, A., and GIBSON, B. S. (1991), Wide-angle Seismic Reflections from Two-dimensional Random
Target Zones, J. Geophys. Res. 96, 10251–10260.LUSCHEN, E., NOLTE, B., and FUCHS, K., Shear-wa6e e6idence for an anisotropic lower crust beneath the
Black Forest, SW Germany. In Seismic Probing of Continents and their Margins (eds. J. H. Leven,D. M. Finlayson, C. Wright, J. C. Dooley, and B. L. N. Kennett), vol. 173, Special Series(Tectonophysics 1990) pp 483–493.
LUSCHEN, E., et al. (1987), Near-6ertical and Wide-angle Seismic Sur6eys in the Black Forest, SWGermany, J. Geophys. 62, 1–30.
MALLICK, S., and FRAZER, L. N. (1990), P0/S0 Synthetics for a Variety of Oceanic Models and theirImplications for the Structure of the Oceanic Lithosphere, Geophys. J. Int. 100, 235–253.
MANTOVANI, E., SCHWAB, F., LIAO, H., and KNOPOFF L. (1977), Teleseismic Sn: A Guided Wa6e in theMantle, Geophys. J. Royal Astr. Soc. 51, 709–726.
MATTHEWS, D. H., Seismic reflections from the lower crust around Britain. In Nature of the LowerContinental Crust (eds. J. B. Dawson, D. A. Carswell, J. Hall, and K. H. Wedepohl), vol. 24 (Geol.Soc. London, Spec. Publ. 1986) pp. 11–21.

Scales of Heterogeneities 51Vol. 156, 1999
MECHIE, J., EGORKIN, A. V., FUCHS, K., RYBERG, T., SOLODILOV, L., and WENZEL, F. (1993), P-wa6eMantle Velocity Structure beneath Northern Eurasia from Long-range Recordings along the ProfileQUARTZ, Phys. Earth Planet. Inter. 79, 269–286.
MEISSNER, R., The Continental Crust (Acad. Press, Orlando 1986).MEISSNER, R., and DEKORP, The DEKORP sur6eys: Major achie6ements for tectonical and reflecti6e
styles. In Continental Lithosphere: Deep Seismic Reflections (eds. R. Meissner, L. Brown, H.-J.Durbaum, W. Franke, K. Fuchs, and F. Seifert), vol. 22 (AGU Geodynamics Series 1991) pp. 69–76.
MENKE, W. H., and CHENG, R. (1984), Numerical Studies of the Coda Fall-off Rate of MultipleScattered Wa6es in Randomly Layered Media, Bull. Seismol. Soc. Am. 74, 1605–1621.
MENKE, W. H., and RICHARDS, P. G. (1980), Crust-mantle Whispering Gallery Phases: A DeterministicModel of Teleseismic Pn Wa6e Propagation, J. Geophys. Res. 85, 5416–5422.
MENKE, W. H., and RICHARDS, P. G. (1983), The Horizontal Propagation of P Wa6es through ScatteringMedia: Analog Model Studies Rele6ant to Long-range Pn Propagation, Bull. Seismol. Soc. Am. 73,125–142.
MOLNAR, P., and OLIVER, J. (1969), Lateral Variation of Attenuation in the Upper Mantle andDiscontinuities in the Lithosphere, J. Geophys. Res. 74, 2648–2682.
MOONEY, W. D., and BROCHER, T. M. (1987), Coincident Seismic Reflection/Refraction Studies of theContinental Lithosphere: A Global Re6iew, Rev. Geophys. 25, 723–742.
MOONEY, W. D., and MEISSNER, R., Multi-generic origin of crustal reflecti6ity: A re6iew of seismicreflection profiling of the continental lower crust and Moho. In Continental Lower Crust (eds. D. M.Fountain, R. Arculus, and K. W. Kay) (Elsevier Amsterdam 1992) pp. 179–199.
OLIVER, J., A global perspecti6e on seismic reflection profiling of the continental crust. In ReflectionsSeismology: A Global Perspecti6e (eds. M. Barazangi and L. Brown), vol. 13 (AGU Geodynamic Series1986) pp. 1–3.
PAULSSEN, H. (1988), E6idence for a Sharp 670-km Discontinuity as Inferred from P–S Con6erted Wa6es,J. Geophys. 93, 10,489–10,500.
PERCHUC, E., and THYBO, H. (1996), A New Model of Upper Mantle P Wa6es below the Baltic Shield:Indication of Partial Melt in the 95 to 160 km Depth Range, Tectonophysics 253, 227–245.
PETERSEN, N., VINNIK, L., KOSAREV, G., KIND, R., ORESHIN, S., and STAMMLER, K. (1993),Sharpness of Mantle Discontinuities, Geophys. Res. Lett. 20, 859–862.
RANALLI, G., Rheology of the Earth, 2nd ed. (Chapman and Hall, London 1995).REIF, F., Statistical Physics and Theory of Heat (in German), 3rd ed. (Walter de Gruyter, Berlin, New
York 1987).REVENAUGH, J. S., and JORDAN, T. H. (1991), Mantle Layering from ScS Re6erberations, 2. The
Transition Zone, J. Geophys. Res. 96, 19,763–19,780.REY, P. (1993), Seismic and Tectonometamorphic Characters of the Lower Continental Crust in Phanero-
zoic Areas: A Consequence of Post-thickening Extension, Tectonics 112, 580–590.RICHARDS, P. G., and MENKE, W. (1983), The Apparent Attenuation of a Scattering Medium, Bull.
Seismol. Soc. Am. 73, 1005–1021.RYBERG, T., FUCHS, K., EGORKIN, A. V., and SOLODILOV, L. (1995), Obser6ation of High-frequency
Teleseismic Pn on Long-range QUARTZ Profile across Northern Eurasia, J. Geophys. Res. 100,18,151–18,163.
RYBERG, T., WENZEL, F., MECHIE, J., EGORKIN, A. V., FUCHS, K., and SOLODILOV, L. (1996), 2DVelocity Structure beneath Northern Eurasia Deri6ed from the Super Long-range Seismic ProfileQUARTZ, Bull. Seismol. Soc. Am. 86, 857–867.
RYBERG, T., WENZEL, F., EGORKIN, A. V., and SOLODOILOV, L. (1998), Properties of the MantleTransition Zone in Northern Eurasia, J. Geophys. Res. 103, 811–822.
SANDMEIER, K.-J., and WENZEL, F. (1986), Synthetic Seismograms for a Complex Model, Geophys. Res.Lett. 13, 22–25.
SHEARER, P. M. (1991), Constrains on Upper Mantle Discontinuities from Obser6ations of Long-periodReflected and Con6erted Phases, J. Geophys. Res. 96, 18,147–18,182.
SHEARER, P. M. (1996), Transition Zone Velocity Gradients and the 520 km Discontinuity, J. Geophys.Res. 101, 3053–3066.
SHEARER, P. M., and MASTERS, T. G. (1992), Global Mapping of Topography on the 660 kmDiscontinuity, Nature 355, 791–796.

Marc Tittgemeyer et al.52 Pure appl. geophys.,
SHERIFF, R. E., and GELDHARD, L. P., Exploration Seismology; Vol. 1, History, Theory and DataAcquisition (Cambridge Univ. Press 1982).
SMITHSON, S. B., Contrasting types of lower crust. In Properties and Processes of Earth ’s Lower Crust,(ed. R. F. Mereu) vol. 51 (AGU Geophys. Monograph, Washington D.C. 1989) pp. 53–63.
STEPHENS, C., and ISACKS, B. L. (1977), Toward an Understanding of Sn: Normal Modes of Lo6e Wa6esin Oceanic Structure, Bull. Seismol. Soc. Am. 67, 69–78.
SUTTON, G. H., and WALKER, D. A. (1972), Oceanic Mantle Phases Recorded on Seismographs on theNorthwestern Pacific at Distances between 7° and 40°, Bull. Seismol. Soc. Am. 62, 631–655.
THOMPSON, G. A., and HILL, J. L., The deep crust in con6ergent and di6ergent terranes: Laramide upliftsand Basin and Range rifts. In The Continental Crust (eds. M. Barazangi and L. D. Brown), vol. 14, InGeodyn. Ser. (Am. Geophys. Union 1986) pp. 243–256.
THOUVENOT, F., KASHUBIN, S. N., POUPINET, G., MAKOVSKIY, V. V., KASHUBINA, T. V., MATTE, P.,and JENATTON, L. (1995), The Root of the Urals: E6idence from Wide-angle Reflection Seismics,Tectonophysics 250, 1–13.
THYBO, H., and PERCHUC, E. (1997a), The Seismic 8° Discontinuity and Partial Melting in ContinentalMantle, Science 275, 1626–1629.
THYBO, H., and PERCHUC E., A partially molten zone beneath the global 8° discontinuity at �100 kmdepth with a new interpretation of the Lehmann discontinuity. In Upper Mantle Heterogeneities fromActi6e and Passi6e Seismology (ed K. Fuchs) vol. 17. In NATO ASI Series (Kluwer AcademicPublishers, Dordrecht, NL 1997b) pp. 343–350.
THYBO, H., PERCHUC, E., and PAVLENKOVA, N., Two reflectors in the 400 km depth range re6ealed frompeaceful nuclear explosion seismic sections. In Upper Mantle Heterogeneities from Acti6e and Passi6eSeismology (ed. K. Fuchs) vol. 17. In NATO ASI Series (Kluwer Academic Publishers, Dordrecht, NL1997) pp. 97–104.
TITTGEMEYER, M., WENZEL, F., FUCHS, K., and RYBERG, T. (1996), Wa6e Propagation in a MultipleScattering Upper Mantle—Obser6ation and Modelling, Geophys. J. Int. 127, 492–502.
TITTGEMEYER, M., RYBERG, T., FUCHS, K., and WENZEL, F., Obser6ation of teleseismic Pn�Sn on superlong-range seismic profiles in northern Eurasia and their implications for the structure of the lithosphere.In Upper Mantle Heterogeneities from Acti6e and Passi6e Seismology (ed. K. Fuchs) vol. 17. In NATOASI Series (Kluwer Academic Publishers, Dordrecht, NL 1997) pp. 63–73.
VAN DER HILST, R. D., ENGDAHL, E. R., SPAKMAN, W., and NOLET, G. (1991), Tomographic Imagingof Subducted Lithosphere below Northwest Pacific Island Arcs, Nature 353, 37–43.
WARNER, M., and MCGEARY, S. (1987), Seismic Reflection Coefficients from Mantle Fault Zones,Geophys. J. Royal Astron. Soc. 89, 223–230.
WESSEL, P., and SMITH, W. H. F. (1995), New Version of the Generic Mapping Tools (GMT), version 3.0released, Eos Trans. AGU 76, 329.
WIDIYANTORO, S., and VAN DER HILST, R. D. (1996), Structure and E6olution of Lithospheric Slabbeneath the Sunda Arc, Indonesia, Science 271, 1566–1570.
WOLF, A. (1937), The Reflection of Elastic Wa6es from Transition Layers of Variable Velocities,Geophysics 2, 357–363.
WU, R.-S., and FLATTE, S. M. (1990), Transmission Fluctuation across an Array and Heterogeneities inthe Crust and Upper Mantle, Pure appl. geophys. 132, 175–196.
(Received October 1, 1997; revised March 5, 1998)
.