Where Can Seismic Anisotropy Be Detected in the Earth's Mantle? In Boundary Layers

Mantle Petrology: Field Observations and high Pressure experimentations: a Tribute to Francis R. (Joe) Boyd© The Geochemical Society, Special Publication N° 6, 1999
Editors: Yingwei Fei, Constance M. Bertka, and Bjorn O. Mysen
79
Mantle structural geology from seismic anisotropy
PAUL SILVER1, DAVID MAINPRICE
2, WALID BEN ISMAÏL2, ANDRÉA TOMMASI
2, and GUILHEM BARRUOL2
1Department of Terrestrial Magnetism, 5241 Broad Branch Road, N.W., Washington, DC 20015, U.S.A.2Laboratoire de Tectonophysique, ISTEEM, CNRS UMR 5558, Université Montpellier II,
34095 Montpellier cedex 05, France.
Abstract--Seismic anisotropy is a ubiquitous feature of the subcontinental mantle. This can beinferred both from direct seismic observations of shear wave splitting from teleseismic shear waves, aswell as the petrofabric analyses of mantle nodules from kimberlite pipes. The anisotropy is principallydue to the strain-induced lattice preferred orientation (LPO) of olivine. The combined use of thesemantle samples, deformation experiments on olivine, and numerical modeling of LPO, provides a criticalframework for making inferences about mantle deformation from observed seismic anisotropy. In mostcases there is a close correspondence between mantle deformation derived from seismic observations ofanisotropy, and crustal deformation, from the Archean to the present. This implies that the mantle plays amajor, if not dominant role in continental deformation. No clear evidence is found for a continentalasthenospheric decoupling zone, suggesting that continents are probably coupled to general mantlecirculation.
INTRODUCTION
The mantle nodules that are brought to the surfaceby kimberlitic eruptions form the foundation forinferring the geological properties of thesubcontinental mantle. These rocks provide a uniquemeans of constraining the composition, petrology,temperature, pressure, age, and physical propertiesof the subcontinental mantle. JOE BOYD has beenthe leader in recognizing and exploiting the valuableinformation that these rocks contain. More recently,these same rocks have also been used to constrainthe degree and style of deformation in thesubcontinental mantle, through a comparison of thepetrofabrics in these rocks and the observations ofseismic anisotropy that are produced by this fabric.There has been a rapidly growing interest in seismicanisotropy as a way of constraining the deformationof the continental upper mantle. There are two basicproblems that can be addressed with this approach:the deformation of the mantle portion of continentalplates, and the mantle flow field beneath theseplates. The first problem represents a naturalextension of structural geology into the mantle anddown to the base of the plate. The second problemaddresses the nature of the mantle flow field justbelow the plates, down to the transition zone. Amajor stimulus for the recent focus on the study ofmantle deformation is the rapid increase in thenumber of observations related to anisotropy. Thishas come from the establishment, over the lastdecade, of a global network of broadbandseismographs, and perhaps more importantly, fromthe deployment of portable instruments, whichallow for the collection of anisotropy data inparticular regions of geologic interest.
Shear-wave splitting observations are the mostunambiguous manifestation of anisotropy available
to seismologists. They are also very simple androbust measurements that are now made routinely.Their utility in constraining subcontinental mantledeformation is analogous to the use of isotropictravel times as a means of studying variations inmantle temperature and composition. As integralfunctions of the anisotropy along the path of theshear wave, they provide valuable information aboutflow and deformation in the upper mantle. Whilemeasuring the splitting parameters is a reasonablystraightforward seismological task, working out therelationship between anisotropy and mantledeformation is somewhat less so, as it involvesknowledge from a variety of disciplines. The basisfor this relationship is the development of latticepreferred orientation (LPO) in upper mantle rockscontaining the anisotropic mineral olivine. One i sinterested in using anisotropy to map mantledeformation as a way of testing dynamic models ofmountain building or mantle flow characteristicsassociated with the past and present motion ofplates. To go from the deformation generated by aparticular tectonic process to the prediction ofsplitting parameters, one needs to: i) presume thedeformation field that is developed by that tectonicprocess (e.g., mountain building), ii) determine theresulting LPO of upper mantle aggregates from finitestrain and calculate the aggre g ate elastic constants,and iii) calculate the seismological manifestation ofanisotropy for this medium, incorporating theappropriate geometry.
With these relationships in place, it is possibleto predict the characteristics of seismic anisotropyfor a particular tectonic process. (iii) is the realm ofseismology, and within it are the variousseismological manifestations of a specifiedanisotropic medium. (ii) is the domain ofpetrophysics/mineral physics and rock mechanics,and involves such issues as the single-crystal

80 P. Silver et al.
properties of upper mantle minerals, the rheologicalbehavior of mineral aggregates under finite strain(including recrystallization), and the quantificationof strain indicators, such as those based onmicrotexture. One of the most important sources ofinformation concerning the petrophysicalconstraints is the suite of kimberlitic mantlenodules; as we will see, these mantle samples play acrucial role in the interpretation of seismicanisotropy. The linking together of seismicanisotropy and LPO constitutes the forward problemof determining the anisotropic properties of uppermantle deformation. We next seek to ascribe aphysical process to the observed anisotropy, inwhich case it is necessary to predict the deformationfield that the process creates, and this corresponds to(i) above. The generation of this deformation or flowfield has been traditionally the domain of mantledynamics, applied both to mantle convection andplate (usually continental) deformation. There hasrecently been renewed interest amonggeodynamicists in making anisotropic predictionsof mantle flow models as an important way oftesting such models (BUTTLES and OLSON, 1998;CHASTEL et al. 1993; BLACKMAN et al., 1996;BLACKMAN and KENDALL,1997; FOUCH et al., 1999;KINCAID and SILVER, 1996; DAVIS et al., 1997;TOMMASI et al., 1996; TOMMASI, 1998). This is ahealthy trend that will make the maximum use of theconstraints that anisotropy provides. We willconsider later two simple physical processes thathave straightforward anisotropic characteristics.
CONTINENTAL ANISOTROPY: SUMMARY OFSHEAR WAVE SPLITTING OBSERVATIONS.
In an isotropic, homogeneous medium there aretwo types of body waves, a P and an S wave; in ananisotropic medium, there are three, a quasi-P waveand two quasi-shear waves. For weak anisotropy(the case encountered in the Earth), the P and S wavedisplacement directions are still, in most cases,nearly parallel and perpendicular, respectively, tothe propagation direction, as for an isotropicmedium. Shear-wave splitting refers to the fact thatthe two shear waves have polarizations that areorthogonal to each other and propagate at differentvelocities. For a homogeneous medium, thevelocities (V) and displacement directions of thethree waves are given by the eigenvalues andeigenvectors of the second order tensor velocitymatrix Til defined by the Christoffel equation:
Til - ρV2 δil = 0, Til =Cijklnjnk (1)
where δil is the Kronecker delta, Cijkl is theelasticity tensor for the medium, n is a unit vectorthat defines the propagation direction, and ρ i sdensity. The two splitting parameters obtained fromseismic data are the polarization direction of the fast
shear wave φ and the delay time δt between thearrival time of the fast and slow shear waves (Fig. 1).From (1) it is found that δt is proportional to pathlength L according to the approximate expressionfor small anisotropy: δt=LδVs/<Vs> where <Vs> i sthe isotropically averaged shear velocity and δVs i sthe dimensionless intrinsic anisotropy, which is afunction of n (SILVER and CHAN, 1991). As we willsee, φ is related to the orientation of the mantlestrain field. Splitting in teleseismic shear wavessuch as SKS and S (See Fig. 1) is particularly usefulin assessing the mantle’s role in geologicalprocesses, because of the excellent lateral resolution(about 50km) for the periods typically used insplitting analyses. Thus small geologic domains,and the boundaries between domains can be carefullysampled. The vertical resolution is not good, sincethe anisotropy could, in principle, reside anywherebetween the core-mantle boundary (CMB) and thesurface in the case of SKS (Fig. 1). As shown below,however, the dominant source of anisotropy inshear-wave splitting is most probably in the uppermantle beneath the recording station.
There are presently over 400 observations ofsplitting in teleseismic shear waves (SAVAGE,1999). These represent a combination of permanentstations as well as a large number of portableexperiments where splitting parameters have beenobtained in areas of specific geologic interest.There have been two recent reviews (SILVER, 1996;SAVAGE, 1999) that will provide the reader with ageneral overview of the shear wave splitting dataset. The highlights are given here. There aresplitting observations from essentially allcontinents, although the two with the mostobservations are North America and Eurasia. Themean value of splitting delay times is about 1 s(SILVER, 1996). Assuming about 4% intrinsicanisotropy, this corresponds to about a 100 kmthick layer of anisotropic mantle. The range is frombarely detectable (less than 0.5 s) to 2.4 s. There areonly a few measurements above δt=2 s. There arealso about 10% of the data set where splitting wasnot detected. This means that anisotropy is a near-ubiquitous feature of the subcontinental region.
The dominant contribution to the splitting i sfrom the upper mantle. There is a crustalcontribution, but it is small A variety of studies havefocused on crustal splitting (see SILVER, 1996;SAVAGE, 1999, and references therein). Crustalanisotropy values are obtained from: 1) therecording of crustal earthquakes just below thestation, 2) shear waves from events occurring in asubducting slab that pass only through the crust ofthe overlying plate, and 3) the analysis of splittingin P to S conversions at the Moho, which isolate thecrustal component of splitting. Each of thesemethods point to a range in splitting parameters of0.1 to 0.3s, with occasional values up to 0.5 s, and

Mantle structure from seismic anisotropy 81
an average of about 0.2 s. The delay time does notappear to be a function of crustal thickness. Forexample, crustal delay times on the Tibetan Plateau(MCNAMARA et al., 1994), with an average crustalthickness of 70 km also fall within the normal rangeof 0.1 to 0.3s. This suggests that the crustalanisotropy is dominated by cracks in the top 10-15km of the crust.
The long path through the transition zone andlower mantle could also contribute to the splittingrecorded at continental stations. Yet, thiscontribution appears to be small as well, for thefollowing reasons: (i) Significant variations in SKSsplitting parameters are frequently observed forstations that are separated by 50-100 km (e.g.,
SILVER and KANESHIMA, 1993). This requires that theregions of the mantle that the wave samples, thefirst Fresnel zone, are independent of each other.This generally restricts the anisotropic zones to bein the upper mantle, for stations that are separatedby about one hundred kilometers. (ii) For a givenstation, the splitting parameters for SKS at differentbackazimuths, as well as direct S waves from deepfocus events (where there is probably nocontribution from the source-side upper mantle) areusually compatible with each other (see MCNAMARA
et al., 1994; KANESHIMA and SILVER, 1995), althoughthe paths through the lower mantle are verydifferent. (iii) Using the special geometry affordedby locally recorded subduction zone events, it i s
Shear Wave Splitting
Length(L)
{δt φdelay time
δt = aLφ = flow direction
fast polarization direction
❊ SKS(S) (P) (S)
❊
S
Mantle
Outer Core
InnerCore
(fluid)
Anisotropic zone
FIG. 1. (a) Schematic of shear wave splitting. A shear wave entering an anisotropic medium is split intotwo shear waves with different velocities and orthogonal polarizations. The two splitting parameters thatcan be obtained from data are the fast polarization direction φ and delay time δt. between the two arrivals.Teleseismic shear waves SKS and S are most commonly used.

82 P. Silver et al.
possible to compare directly the splittingparameters of upward propagating S waves fromintermediate and deep focus events that sampleexclusively the upper mantle, with those for SKS andScS at close distance that sample the lower mantle(once for SKS, twice for ScS) as well as nearly thesame upper mantle path (KANESHIMA and SILVER,1995; MEADE et al., 1995; SAVAGE, 1999). Nosignificant difference in delay time is observed,restricting the lower mantle contribution to underabout 0.2 s. There have recently been observationsof splitting from S waves traveling nearlyhorizontally near the core-mantle boundary (e.g.,see KENDALL and SILVER, 1996; 1998), although thisappears to be dominantly transverse isotropy with avertical symmetry axis, which would not affect theSKS observations because SKS is radially polarizedas it leaves the core-mantle boundary.
As noted in Fig. 1b, one of the significantfeatures of the splitting data set is that the largestdelay times, corresponding to the largestanisotropic effect, are often found in regions ofpresent day transpressional zones, such as theAlpine-Himalayan chain or ancient ones, such as theWestern Superior Province of the Canadian Shield.As we will see, these zones are central tounderstanding the physical basis for the observedanisotropy.
INTERPRETING THE SEISMIC ANISOTROPYDATA SET: PETROPHYSICAL
CONSIDERATIONS
In order to correctly interpret seismic anisotropyas a constraint on mantle deformation, it i snecessary to know: (i) the minerals present and theirvolume fractions in the upper mantle as a function ofdepth, (ii) the single-crystal elastic constants of theminerals at the temperatures and pressures of theupper mantle, (iii) how the crystal orientations(LPO) evolves during plastic deformation in the flowfield of the upper mantle, and (iv) the orientation ofthe structural frame or flow field in the mantle. (i)can be determined by direct observations on mantlenodules from the top 220 km of the upper mantle(BOYD, 1973) and ophiolite massifs for the topsection of the oceanic upper mantle (NICOLAS,1989), from experimental petrology (BOYD andENGLAND, 1960, RINGWOOD, 1991), or frompetrological models such as pyrolite and piclogite(e.g., ITA and STRIXRUDE, 1992) derived fromexperimental studies. (ii) can be determined in astraightforward manner from laboratorymeasurements (see compilation by BASS, 1995). Wewill briefly review the situation for the upper mantlebecause of the large number of single crystal elastic
-150˚ -120˚ -90˚ -60˚ -30˚ 0˚ 30˚ 60˚ 90˚ 120˚ 150˚ 180˚-60˚
-30˚
0˚
30˚
60˚
0.5 s
1.0 s
1.5 s
2.0 s
FIG. 1. (b) Map of world with data set of splitting parameters from SILVER (1996). Orientation of linegives fast polarization direction and length of line is proportional to delay time according to the legend.Black symbols correspond to delay times in excess of 1.5 s. Note that most of the large delay times arefound either in present-day transpressional zones (Alpine-Himalayan chain, Australian/Pacific plateboundary at New Zealand, South American/Caribbean plate boundary in Venezuela, Alaskan Cordillera)or Archean transpressional zones, such as the western Superior province of the Canadian Shield. Most ofthe measurements are concentrated in the Northern Hemisphere, in North America and Eurasia.

Mantle structure from seismic anisotropy 83
constant determinations since 1995. The propertiesof deformation in upper mantle aggregates (iii) i sless well characterized, and consequently has been anactive area of research over the last few years. (iv)involves the much broader issue of how the mantledeforms during orogeny. We focus on the last threeissues below.
Single crystal anisotropic seismic properties.
To understand the anisotropic seismic behaviorof polyphase rocks in the Earth’s mantle it i sinstructive to first consider the properties of thecomponent single crystals. We will emphasize theanisotropy of individual minerals rather than themagnitude of velocity. The percentage anisotropy(A) is defined here as A=200 (Vmax - Vmin) /(Vmax +Vmin). For P-wave velocities A is defined by themaximum and minimum velocities found by a searchof all possible propagation directions. For S-wavesin an anisotropic medium there are two orthogonallypolarized S-waves with different velocities for eachpropagation direction. Hence S-wave anisotropy i sdefined for each direction and A is defined as themaximum anisotropy for all propagation directions.
The upper mantle (down to 410 km) is composedof three anisotropic and volumetrically importantphases: olivine, enstatite (orthopyroxene), anddiopside (clinopyroxene). The other volumetricallyimportant phase is garnet, which is nearly isotropicand hence not of great significance to ourdiscussion.
Olivine. A number of accurate determinations ofthe elastic constants of olivine are now availablewhich all agree that the maximum anisotropy of Vp
is 25% and the maximum anisotropy of Vs is 18% atambient conditions and for a mantle composition ofabout Fo90. The first order temperature derivativeshave been determined between 295-1500oK (ISSAK,1992). The first and second order pressurederivatives for olivine were first determined to 3 GPaby WEBB (1989). However, a more recentdetermination to 17 GPa by ABRAMSON et al. (1997)has shown that the second order derivative is onlynecessary for elastic stiffness modulus C55. The firstorder derivatives are in good agreement betweenthese two studies. The anisotropy of the olivinesingle crystal increases slightly with temperature(2%) using the data of ISSAK (1992) and decreasesslightly with increasing pressure using the data ofABRAMSON et al. (1997). One would thus expect thesingle crystal anisotropy to be approximatelyconstant along a geotherm.
Orthopyroxene. The elastic properties oforthopyroxene (Enstatite or Bronzite) with amagnesium number (Mg/Mg+Fe) near the expectedupper mantle value of 0.9, has also beenextensively studied. The Vp anisotropy variesbetween 15.1% (En80 Bronzite, FRISILLO and
BARSCH, 1972) and 12.0% (En100 Enstatite,WEIDNER et al., 1978) and the maximum Vs
anisotropy ranges between 11.0% (En100 Enstatite,WEIDNER et al., 1978) and 15.1% (En80 Bronzite,WEBB and JACKSON, 1993). Some of the variation inthe elastic constants and anisotropy may be relatedto composition and structure in the orthopyroxenes(DUFFY and VAUGHAN, 1988). The first ordertemperature derivatives have been determined over alimited range between 298o-623o K (FRISILLO andBARSCH, 1972). The first and second order pressurederivatives for Enstatite have been recentlydetermined up to 12.5 GPa by CHAI et al. (1997)confirming an earlier study of WEBB and JACKSON
(1993) to 3 GPa that showed that first and secondorder pressure derivatives are needed to describe theelastic constants at mantle pressures. Theanisotropy of Vp and Vs does not vary significantlywith pressure using the data of CHAI et al. (1997) to12.5 GPa. It does increase by about 3% whenextrapolating to 1000° C using the first ordertemperature derivatives of FRISILLO and BARSCH
(1972).
Clinopyroxene. The elastic constants ofclinopyroxene (Diopside) of mantle compositionhave only been experimentally measured at ambientconditions (LEVIEN et al., 1979; COLLINS and BROWN,1998); both studies show that Vp anisotropy is 29%and Vs anisotropy is between 20 to 24%. There areno measured single crystal pressure derivatives. Inone of the first calculations of the elastic constantsof a complex silicate at high pressure, MATSUI andBUSING (1984) predicted the first order pressurederivatives of diopside from 0 to 5 GPa. Thecalculated elastic constants at ambient conditionsare in good agreement with the experimental valuesand the predicted anisotropy for Vp and Vs of 35.4%and 21.0% respectively is also in reasonableagreement. The predicted bulk modulus of 105 GPa i sclose to the experimental value of 108 GPa given byLEVIEN et al. (1979). The pressure derivative of thebulk modulus 6.2 is slightly lower than the value of7.8±0.6 given by BASS et al. (1981). Using theelastic constants of MATSUI and BUSING (1984), theVp anisotropy decreases from 35.4% to 27.7% and Vs
anisotropy increases from 21.0% to 25.5% withincreasing pressure from ambient to 5 GPa. To allowcalculations of seismic properties at mantlepressures, ESTEY and DOUGLAS (1986) have proposedusing the orthopyroxene pressure derivative valuesof FRISILLO and BARSCH (1972) but scaled down by20%. However, comparison of the most recentorthopyroxene pressure derivatives of CHAI et al.(1997) with the calculated values for clinopyroxeneof MATSUI and BUSING (1984) shows that they differby 200% for C11, C33 and C44 suggesting largeerrors would occur in using the method proposed byESTEY and DOUGLAS (1986). We would recommendusing the values given by MATSUI and BUSING (1984)

84 P. Silver et al.
until an experimental determination has been made.A major problem still remains as no clinopyroxenetemperature derivatives are available. ESTEY andDOUGLAS (1986) proposed using the orthopyroxenetemperature derivatives of FRISILLO and BARSCH
(1972).In summary, the general trend favors an
anisotropy decrease with increasing pressure andincrease with increasing temperature. Olivine is agood example of this behavior. The changes arelimited to a few percent in most cases and theprimary cause of the anisotropy change is minorcrystal structural rearrangements. The effect oftemperature is essentially linear in all cases for theupper mantle. To illustrate the variation ofanisotropy as a function of upper mantle conditionsof temperature and pressure, we have calculated theseismic properties along a mantle geotherm (Fig. 2).The minerals olivine (Vp,Vs) and enstatite (Vp) showonly slight increases in anisotropy in the first 100km, so that anisotropy is expected to be roughlyconstant through the upper mantle.
Experiments on LPO development in olivine inaggregates.
There are surprisingly few experimental studies ofLPO development in upper mantle. Two studiesstand out for their contribution to our understandingof LPO development in olivine. The axialcompression and simple shear experiments onsynthetic olivine polycrystals at high-temperature(1200-1300°C), high strain rates (ca. 10
-5 s
-1) of
NICOLAS et al. (1973) and ZHANG and KARATO (1995)respectively. There have recently been attempts tosimulate the behavior of olivine aggregatesobserved in the laboratory with numericalexperiments. In the discussion of theseexperiments, it is convenient to identify a structuralcoordinate system, namely a foliation plane,corresponding to the maximum flattening plane, anda lineation or stretching direction that is containedwithin the foliation plane. It is conventional todefine three structural axes as the lineation direction,X, the normal to the foliation plane, Z, and the
10 15 20 25 30 35
0
100
200
300
400
Single crystal anisotropy
Maximum anisotropy (%)
Dep
th (
km)
Vs Cpx
Vp Cpx
Vp Ol
Vs Opx
Vp Opx
Vs Ol
FIG. 2. The maximum seismic anisotropy of single crystals for upper mantle minerals as a function ofdepth along a mantle geotherm (see text for details).
Mantle structure from seismic anisotropy 85
direction normal to X in the foliation plane, Y. Thisallows the elasticity matrix inferred from thecrystallographic orientation to be placed in astructural frame.
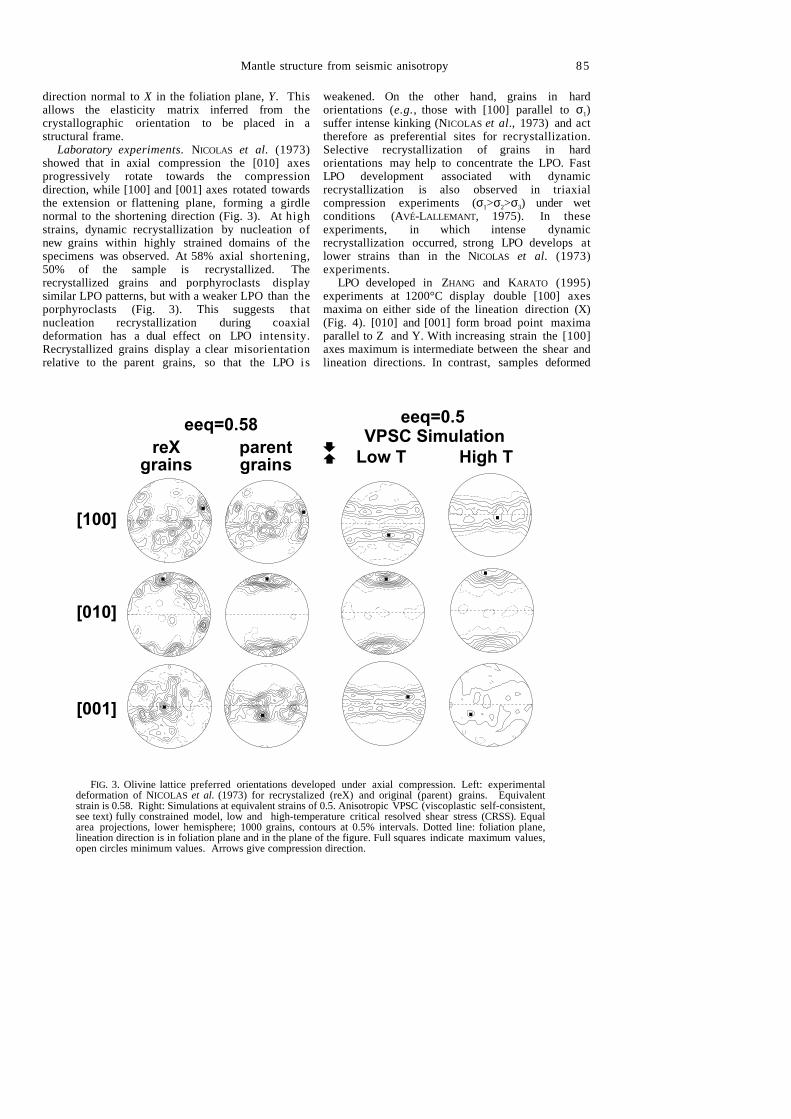
Laboratory experiments. NICOLAS et al. (1973)showed that in axial compression the [010] axesprogressively rotate towards the compressiondirection, while [100] and [001] axes rotated towardsthe extension or flattening plane, forming a girdlenormal to the shortening direction (Fig. 3). At highstrains, dynamic recrystallization by nucleation ofnew grains within highly strained domains of thespecimens was observed. At 58% axial shortening,50% of the sample is recrystallized. Therecrystallized grains and porphyroclasts displaysimilar LPO patterns, but with a weaker LPO than theporphyroclasts (Fig. 3). This suggests thatnucleation recrystallization during coaxialdeformation has a dual effect on LPO intensity.Recrystallized grains display a clear misorientationrelative to the parent grains, so that the LPO is
weakened. On the other hand, grains in hardorientations (e.g., those with [100] parallel to σ1)suffer intense kinking (NICOLAS et al., 1973) and acttherefore as preferential sites for recrystallization.Selective recrystallization of grains in hardorientations may help to concentrate the LPO. FastLPO development associated with dynamicrecrystallization is also observed in triaxialcompression experiments (σ1>σ2>σ3) under wetconditions (AVÉ-LALLEMANT, 1975). In theseexperiments, in which intense dynamicrecrystallization occurred, strong LPO develops atlower strains than in the NICOLAS et al. (1973)experiments.
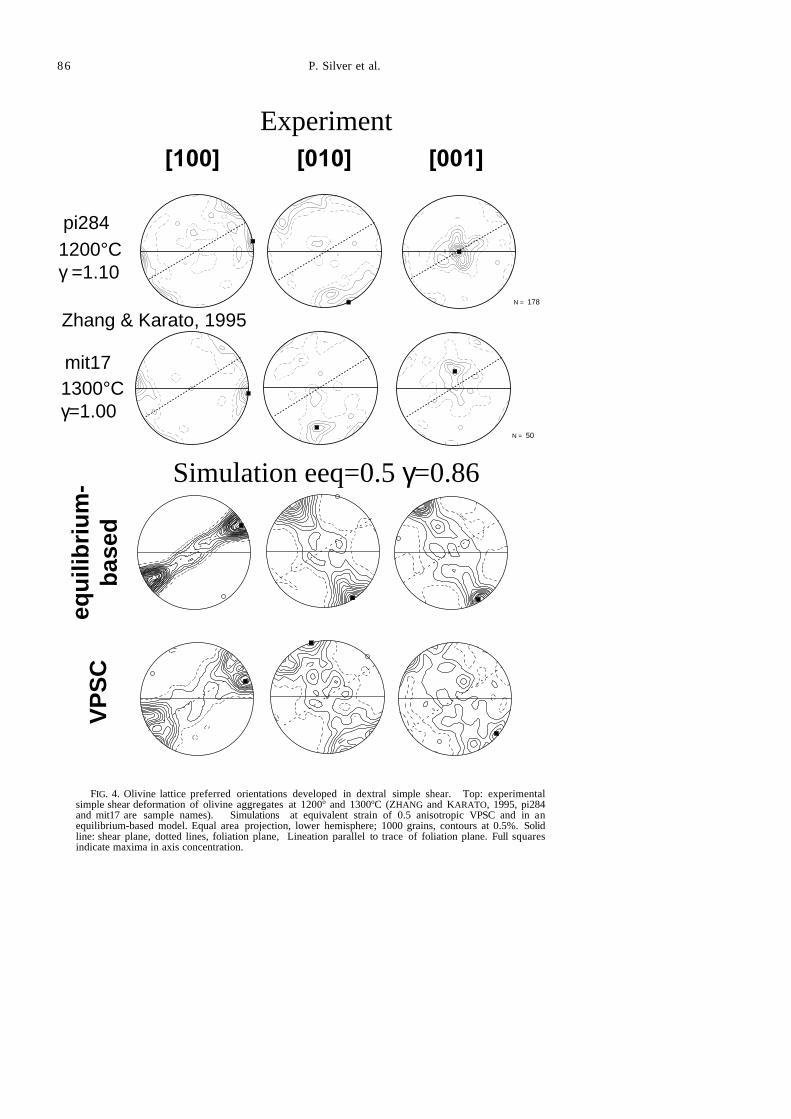
LPO developed in ZHANG and KARATO (1995)experiments at 1200°C display double [100] axesmaxima on either side of the lineation direction (X)(Fig. 4). [010] and [001] form broad point maximaparallel to Z and Y. With increasing strain the [100]axes maximum is intermediate between the shear andlineation directions. In contrast, samples deformed
eeq=0.58reX
grainsparentgrains
[100]
[010]
[001]
VPSC SimulationLow T High T
eeq=0.5
FIG. 3. Olivine lattice preferred orientations developed under axial compression. Left: experimentaldeformation of NICOLAS et al. (1973) for recrystalized (reX) and original (parent) grains. Equivalentstrain is 0.58. Right: Simulations at equivalent strains of 0.5. Anisotropic VPSC (viscoplastic self-consistent,see text) fully constrained model, low and high-temperature critical resolved shear stress (CRSS). Equalarea projections, lower hemisphere; 1000 grains, contours at 0.5% intervals. Dotted line: foliation plane,lineation direction is in foliation plane and in the plane of the figure. Full squares indicate maximum values,open circles minimum values. Arrows give compression direction.
86 P. Silver et al.
Zhang & Karato, 1995N = 178
1200°Cγ =1.10
mit17
N = 50
1300°Cγ=1.00
[100] [010] [001]
VP
SC
equ
ilib
riu
m-
bas
edExperiment
Simulation eeq=0.5 γ=0.86
pi284
FIG. 4. Olivine lattice preferred orientations developed in dextral simple shear. Top: experimentalsimple shear deformation of olivine aggregates at 1200o and 1300oC (ZHANG and KARATO, 1995, pi284and mit17 are sample names). Simulations at equivalent strain of 0.5 anisotropic VPSC and in anequilibrium-based model. Equal area projection, lower hemisphere; 1000 grains, contours at 0.5%. Solidline: shear plane, dotted lines, foliation plane, Lineation parallel to trace of foliation plane. Full squaresindicate maxima in axis concentration.

Mantle structure from seismic anisotropy 87
at 1300°C display an LPO pattern characterizedby a much faster rotation of [100] and [010] intoparallelism with the shear direction and the normalto the shear plane respectively (Fig. 4). Thesesamples differ from those deformed at 1200°C by ahigher degree of dynamic recrystallization bysubgrain rotation and grain boundary migration(>80% for a specimen submitted to a shear strain of1.5). This suggests that in simple shear, dynamicrecrystallization processes not only affect LPOintensity, but also modify the pattern, leading to asingle LPO maximum in which the main slip systemparallels the macroscopic shear.
Numerical experiments. The evolution of LPO indeforming olivine polycrystals has been studied bynumerical methods, using several differentapproaches. The first is the purely kinematic methodwhich only accounts for the geometrical aspects ofglide and crystal rotation (ETCHECOPAR, 1977;ETCHECOPAR and VASSEUR, 1987; RIBE, 1989). Othermethods take into account both the geometrical andmechanical aspects of the problem. There are aspectrum of possible mechanical solutionsinvolving the compatibility of stress and strainfields in the aggregate. There is the homogeneousstrain solution of TAYLOR (1938), which requires 5independent glide systems, and consequentlyrepresents the upper bound of mechanical strength.The homogeneous stress solution with no straincompatibility of CHASTEL et al. (1993) constitutesthe lower bound. Olivine has only 3 independentglide systems so that the Taylor model is not strictlyapplicable, but a Taylor model with relaxedconstraints has been used in which particularcomponents of the single-crystal strain tensor areallowed to differ from the aggregate strain tensor(TAKESHITA, 1989; TAKESHITA et al., 1990).Equilibrium-based methods (CHASTEL et al., 1993;BLACKMAN et al., 1996) make a stress-equilibriumassumption with relaxed strain compatibility. Theisotropic (TAKESHITA et al., 1990; WENK et al.,1991) and anisotropic (TOMMASI et al., 1999)viscoplastic self-consistent (VPSC) approaches usethe Eshelby inclusion method to take into accountgrain interaction, an important factor in theelasticity and plasticity of polycrystals. This self-consistent approach represents a compromisebetween stress and strain compatibility and hence i sbetween the upper bound and lower bounds inmechanical strength. In practice, this approach i scloser to the lower bound, implying that stressequilibrium is favored over strain compatibility. Themechanically based models of CHASTEL et al. (1993),BLACKMAN et al. (1996), TAKESHITA et al. (1990),WENK et al. (1991), and TOMMASI et al. (1999)assume a viscoplastic macroscopic response (termedviscoplastic selfconsistent or VPSC models) orwhere the crystals obey a power law between strain
rate and stress, which is more appropriate forsilicates deforming at high temperature than theelasto-plasticity of Taylor type models.
The LPO predicted by different polycrystallineplasticity models agrees, to first order, withexperiments. However, simulated and measured LPOpatterns differ in their relative organization of the[100] and [001] axes. In the case of the axialcompression experiments, [001] axes form a girdlealmost normal to the shortening direction, whereasthe [100] axis distribution is more diffuse (Fig. 3).In simulations, [100] orientations are concentratedin a girdle normal to the compression direction and[001] orientations show a more diffuse distribution.This discrepancy between observed and modeled LPOmay be explained by activation of different slipsystems in models and experiments due to the highstresses involved in the experimental deformation.
LPO formed in simple shear at 1200°C exhibitsgood agreement with model predictions; both yieldan orthorhombic pattern that results from dominantslip on (010)[100] (Fig. 4). The anisotropic VPSCmodel predicts a clear bimodal LPO pattern with the[100] peak intermediate between the shear directionand the finite elongation direction (X). Equilibrium-based models are less effective in reproducing theexperimental results; they predict a single [100]maximum parallel to the lineation. Yet, even in thebest models a few differences persist. Simulationspredict a clear bimodal LPO pattern whereas LPO ofexperimentally sheared dunites display a dispersionof both [100] and [010] within the XZ plane. Thisdispersion may result from the activation of dynamicrecrystallization by subgrain rotation which is notsimulated. At a given strain, experimental samplesdisplay a greater concentration of [001] thanpredicted by anisotropic VPSC models. This could beexplained by a lower activation of slip on (001)planes in the experiments.
The experimental work and numerical modelshave established that strength of LPO is a functionof finite strain, and hence the seismic anisotropyshould evolve with deformation history. To quantifythe degree of LPO MAINPRICE and SILVER (1993) usedthe J index, which is defined as
J = ∫ f(g)2 dg
where g is the crystal orientation and f(g) thedistribution of orientations. The J index has a valueof unity for random LPOs. MAINPRICE and SILVER
(1993) showed that the J index and the seismicanisotropy increased with increasing axialshortening of olivine aggregates by using theexperimental data of NICOLAS et al. (1973).Numerical models of LPO (TOMMASI et al., 1999) aswell as the analysis of ZHANG and KARATO (1995)
88 P. Silver et al.
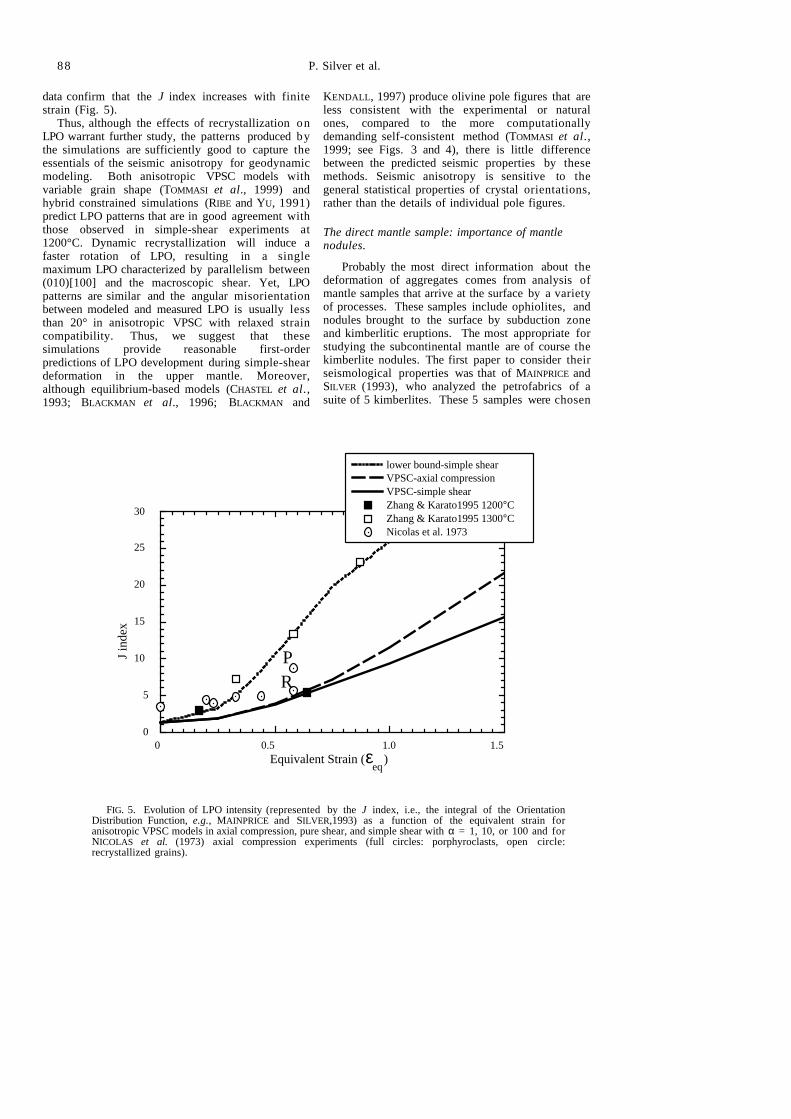
data confirm that the J index increases with finitestrain (Fig. 5).
Thus, although the effects of recrystallization onLPO warrant further study, the patterns produced bythe simulations are sufficiently good to capture theessentials of the seismic anisotropy for geodynamicmodeling. Both anisotropic VPSC models withvariable grain shape (TOMMASI et al., 1999) andhybrid constrained simulations (RIBE and YU, 1991)predict LPO patterns that are in good agreement withthose observed in simple-shear experiments at1200°C. Dynamic recrystallization will induce afaster rotation of LPO, resulting in a singlemaximum LPO characterized by parallelism between(010)[100] and the macroscopic shear. Yet, LPOpatterns are similar and the angular misorientationbetween modeled and measured LPO is usually lessthan 20° in anisotropic VPSC with relaxed straincompatibility. Thus, we suggest that thesesimulations provide reasonable first-orderpredictions of LPO development during simple-sheardeformation in the upper mantle. Moreover,although equilibrium-based models (CHASTEL et al.,1993; BLACKMAN et al., 1996; BLACKMAN and
KENDALL, 1997) produce olivine pole figures that areless consistent with the experimental or naturalones, compared to the more computationallydemanding self-consistent method (TOMMASI et al.,1999; see Figs. 3 and 4), there is little differencebetween the predicted seismic properties by thesemethods. Seismic anisotropy is sensitive to thegeneral statistical properties of crystal orientations,rather than the details of individual pole figures.
The direct mantle sample: importance of mantlenodules.
Probably the most direct information about thedeformation of aggregates comes from analysis ofmantle samples that arrive at the surface by a varietyof processes. These samples include ophiolites, andnodules brought to the surface by subduction zoneand kimberlitic eruptions. The most appropriate forstudying the subcontinental mantle are of course thekimberlite nodules. The first paper to consider theirseismological properties was that of MAINPRICE andSILVER (1993), who analyzed the petrofabrics of asuite of 5 kimberlites. These 5 samples were chosen
0
5
10
15
20
25
30
0 0.5 1.0 1.5
Nicolas et al. 1973
VPSC-axial compressionVPSC-simple shearZhang & Karato1995 1200°CZhang & Karato1995 1300°C
lower bound-simple shear
J in
dex
PR
Equivalent Strain ( )eq
ε
FIG. 5. Evolution of LPO intensity (represented by the J index, i.e., the integral of the OrientationDistribution Function, e.g., MAINPRICE and SILVER,1993) as a function of the equivalent strain foranisotropic VPSC models in axial compression, pure shear, and simple shear with α = 1, 10, or 100 and forNICOLAS et al. (1973) axial compression experiments (full circles: porphyroclasts, open circle:recrystallized grains).

Mantle structure from seismic anisotropy 89
as representative of the lithosphere in the depthrange of 120-170 km based on geobarometry. Theyappear to be undisturbed by the eruption process (incontrast to the sheared nodules). The elasticproperties of the aggregates were determined bypetrofabric analysis of the samples, knowledge ofthe single-crystal elastic constants and theirtemperature and pressure derivatives. The analysis ofthese samples allows the aggregate elasticity matrixto be placed in a structural frame. Thischaracterization of the elasticity matrix and itsplacement in the structural frame is perhaps the mostimportant step in the interpretation of seismicanisotropy, as it provides the critical link betweenorientation of deformation and orientation ofanisotropy. In this initial study, 5 such sampleswere averaged in the structural frame. Such anaverage would be appropriate for seismic waves aslong as the deformation is spatially coherent. It i sthus an upper bound on the actual detectableanisotropy. In that study it was found that themaximum shear-wave anisotropy was 3.7%, whileanisotropy for propagation along the three structuraldirections yielded 1.7%, 3.1%, and 1.6% for the X ,Y , and Z directions, respectively. For verticalpropagation, if the foliation is plane horizontal, aswould be the case for asthenospheric flow, then theexpected anisotropy is 1.6%, while a verticalfoliation plane and horizontal lineation direction
would yield 3.1%.Recently, there has been an intense effort, in
conjunction with the Kaapvaal Craton Experiment(CARLSON et al., 1996) to examine a much largergroup of mantle nodules, in order to assess themagnitude and orientation of the macroscopicseismic anisotropy, and to look for both lateral andvertical variations in anisotropy beneath theKaapvaal craton and surrounding areas. Thus far, anorder of magnitude more samples have beenexamined. The majority of them possess a fabric andintensity of anisotropy consistent with theMainprice and Silver study (e.g., sample FRB1309Premier Mine, from JOE BOYD's collection, Figs. 6and 7). There is, however, a second class of fabrics,making up roughly 25% of the data set withcompletely different characteristics, namely a strongconcentration of [001]-axes parallel to the Ydirection, i.e., the direction normal to both to thelineation direction and the normal to the foliationplane (e.g., sample PHN4254, from PETER NIXON'scollection, Figs. 6 and 7). The LPOs like PHN4254produce a Vp maximum parallel to the lineation (X)and Vp minimum parallel to the foliation normal (Z),like the patterns previously reported by MAINPRICE
and SILVER (1993). However, the Vs distribution i svery different (Fig. 7), with a maximum shear wavesplitting anisotropy of 0.16 km/s (A=3.2 %),parallel to the foliation normal (Z) rather than
Contours (%)[100]
Contours (%)[010]
Contours (%)
[001]
[100] [010] [001]
[001] // Y (PHN4254 LOUWRENCIA)
[100] // to X (FRB1309 PREMIER MINE)
1.00 2.00 3.00 4.00
N = 186
1.00 2.00 3.00 4.00 5.00 6.00 7.00 8.00 9.00
0.50 1.00 1.50 2.00 2.50 3.00
1.00 2.00 3.00 4.00 5.00
N = 92
1.00 2.00 3.00 4.00 5.00 6.00
2.00 4.00 6.00 8.00 10.00 12.00 Y
Z
X
Z
XY
Contours (%) Contours (%) Contours (%)
FIG. 6. Olivine pole figures for [100], [010] and [001], for two mantle nodules from lithosphere beneathKaapvaal craton in Africa. Such diagrams illustrate the degree to which crystalographic axes areconcentrated in particular directions. Contours of concentration, expressed as percent greater than a uniformdistribution, are shown the the structural frame, defined by X=lineation direction Z=normal to the foliationplane (horizontal line is trace of foliation plane) and Y= normal to X in foliation plate.

90 P. Silver et al.
parallel to Y . For most propagation directions, thefast polarization direction is still parallel to thefoliation plane as for the average sample ofMAINPRICE and SILVER (1993), but for wavespropagating parallel to the lineation direction, thefast polarization direction is normal to the foliationplane (Fig. 7). If an average of 33 Kaapvaal Cratonsamples is taken, using the LPO of olivine andenstatite (orthopyroxene), the resulting anisotropyis somewhat weaker than that reported by MAINPRICE
and SILVER (1993) (Fig. 8). In the case ofpropagation along the Y structural direction,appropriate for vertical propagation with verticalfoliation direction and horizontal lineation (theprobable structural orientation for transpressionaldeformation, see next section), then the polarizationis still parallel to the X direction, but the splittinganisotropy is reduced to about 2.2% (δVs=0.12km/s), or about 2/3 of the 3.1% value estimated byMAINPRICE and SILVER (1993) for the same direction.If we use this value, in conjunction with theestimated 0.65 s average splitting delay time for theKaapvaal craton (GAO et al., 1998), then i tcorresponds to a layer thickness of about 130 km.
Allowing 40 km of crust (assumed isotropic), thisbrings the bottom of this layer to a depth of 170 km.
An interesting feature of the average elasticitymatrix is that it predicts a much larger anisotropy,about 3.2% to 4.0% (δVs = 0.16 - 0.20 km/s) forpropagation along Z. This would correspond tohorizontally propagating waves, like surface waves,as long as the structural frame is that expected fortranspressional deformation, namely verticalfoliation plane and horizontal lineation direction(Fig. 8). We note that constraints on S-waveanisotropy based on polarization anisotropy inhorizontally propagating waves (SALTZER et al.,1998) for the Southern African seismic experimentare in the range of 4-5% down to a depth of about200 km and thus much larger than that inferred fromthe SKS splitting, assuming the previous estimatesof continental anisotropy. This apparentdiscrepancy has been attributed to verticalheterogeneity (layers with [100] directionsrandomly distributed in the horizontal plane,SALTZER et al., 1998), although the amount ofvertical heterogeneity required is extreme (roughly10 independent layers, see RUMPKER and SILVER,
[001] // Y (PHN4254 LOUWRENCIA)
[100] // to X (FRB1309 PREMIER MINE)
8.30 8.40 8.50 8.60 8.70 8.80 8.90
0.10 0.15 0.20 0.25 0.30
Vp Contours (km/s)8.48 8.56 8.64 8.72 8.80 8.88 8.96
Anisotropy = 8.5
Anisotropy = 10.3 %
dVs Contours (km/s)
0.15 0.20 0.25 0.30
Vs1 Polarisation PlanesVp dVs
Vs1 Polarisation PlanesVp dVs
Z
XY
Z
XY
FIG. 7. Olivine seismic anisotropy corresponding to the LPO given in Fig. 6. Contours for Vp and dVsin km/s. Trace of the Vs1 polarization planes shown (right) as well as 0.3km/s anisotropy contour.

Mantle structure from seismic anisotropy 91
1998), and such heterogeneity is in marked contrastto the close correspondence between the splittingfast polarization directions and the surface geology(GAO et al., 1998). The average elasticity matrixprovides a simpler means of reconciling the two datasets, as long as the transpressional structural frame(foliation plane vertical, lineation directionhorizontal) is the correct one. Since there appearsto be no specific spatial distribution of this [001]concentration in the Kaapvaal data thus far (found atall depths and nearly all locations), then on the scaleof seismic waves, the mantle beneath the Kaapvaalcraton should appear as the average elasticity matrix
calculated from the suite of samples.BEN ISMAÏL and MAINPRICE (1998) have recently
published a database for olivine LPOs that provides ameans of comparing kimberlite nodules to mantlesamples from other tectonic environments. Whenwe compare the average seismic properties forolivine calculated for samples from fast spreadingridges (ophilolites) and xenoliths from subductionzone volcanism (BEN ISMAÏL and MAINPRICE, 1998)with South African kimberlite nodules (Fig. 9), wefind that the P-wave anisotropy pattern is the samein all three cases. The S-wave pattern is the same for
Contours (km/s)7.85 7.90 7.95 8.00 8.05 8.10 8.15 8.20 8.25
Max.Velocity = 8.32 Min.Velocity = 7.79 Anisotropy = 6.6 %
Contours (km/s)
0.04 0.08 0.12 0.18
Max.Velocity = 0.21 Min.Velocity = 0.00
Vs1 Polarisation PlanesVp Contours (km/s)
8.25 8.30 8.35 8.40 8.45
Max.Velocity = 8.54 Min.Velocity = 8.19 Anisotropy = 4.2 %
dVs Contours (km/s)0.04 0.08 0.12 0.16
Max.Velocity = 0.20 Min.Velocity = 0.00
AVERAGE OF 110 UPPER MANTLE SAMPLES (70 % olivine, 30 % enstatite)
AVERAGE OF 33 LITHOSPHERIC UPPER MANTLE SAMPLES
FROM THE KAPVAAL CRATON
(70 % olivine,30 % enstatite)
Vp dVs
Vs1 Polarisation PlanesVp dVs
dVs = 0.12 km/s
dVs = 0.12 km/s
Y
Z
X
Y
Z
X
FIG. 8. Seismic anisotropy corresponding to the LPO given by the database of Ben Ismaïl andMainprice (1998) for 110 upper mantle samples (top) and 33 samples from the Kaapvaal Craton(bottom, this work) for equivalent compositions of 70% olivine and 30% enstatite. Contours for Vp in km/s(left), δVs in km/s anisotropy (center). Right, orientation of polarization planes for fast shear wave (Vs1),along with δVs=0.12km/s contour line. Top figure does not include Kaapvaal samples.

92 P. Silver et al.
fast ridge and subduction zone environments, butdifferent for the kimberlite suite. The Vp anisotropyis 9.5%, 9.6% and 5.7% for fast ridge, subductionzone, and kimberlite environments, respectively.
The maximum Vs anisotropy is 6.6%, 6.6%, and5.8% for fast ridge, subduction zone and kimberliteenvironments, respectively. The anisotropy patternand magnitude show that the sub-continental mantle
Average of 33 olivine aggregates from xenolith of kimberlites
Average of 13 olivine aggregates from xenolith of subduction volcanism
Vs1 Polarisation PlanesVp AVs
Vs1 Polarisation PlanesVp AVs
Vs1 Polarisation PlanesVp AVs
Average of 72 olivine aggregates from fast ridges(A)
(B)
Vp Contours (km/s)7.84 7.92 8.00 8.08 8.16 8.24 8.32
Max.Velocity = 8.47 Min.Velocity = 7.70 Anisotropy = 9.5 %
AVs Contours (%)1.00 2.00 3.00 4.00 5.00
Max.Anisotropy = 6.61 Min.Velocity = 0.00
Vp Contours (km/s)7.76 7.84 7.92 8.00 8.08 8.16 8.24 8.32
Max.Velocity = 8.43 Min.Velocity = 7.66 Anisotropy = 9.6 %
AVs Contours (%)2.00 3.00 4.00 5.00
Max.Anisotropy = 6.61 Min.Velocity = 0.43
Vp Contours (km/s)8.35 8.40 8.45 8.50 8.55 8.60 8.65 8.70
Max.Velocity = 8.77 Min.Velocity = 8.28 Anisotropy = 5.7 %
AVs Contours (%)1.00 2.00 3.00 4.00
Max.Anisotropy = 5.77 Min.Velocity = 0.00
(C)
FIG. 9. Seismic anisotropy corresponding to the olivine LPO given by the database of BEN ISMAÏL andMAINPRICE (1998) for (a) fast ridges , (b) subduction zone samples and (c) Kaapvaal Craton (this work). Contoursfor Vp in km/s, δVs in % anisotropy and trace of the Vs1 polarization plane.

Mantle structure from seismic anisotropy 93
suite from South Africa is significantly differentfrom the oceanic environment represented by fastridge and subduction zone samples.
BEN ISMAÏL and MAINPRICE (1999) have recentlyestablished an orthopyroxene LPO database as well.Although for olivine it is straightforward to measure100 or more crystals in a thin section to obtain areliable measure of LPO, the low volume fraction(typically 30%) of orthopyroxene makes this oftenimpossible. BEN ISMAÏL and MAINPRICE (1999) havedeveloped a method to weight the LPO so that it i sindependent of the number of grains measured. Usingthis method, the orientations from the olivine andorthopyroxene databases were used to calculate thevariation of seismic anisotropy with LPO strength(Fig. 10). The relation between LPO strength andseismic anisotropy is non-linear for both olivineand orthopyroxene, with a steep increase inanisotropy at low J index followed by a slower
increase above a J index of about 12. We note thatolivine is two to three times more anisotropic thanorthopyroxene for a given value of LPO strength.Much of this difference is due to the weaker single-crystal elastic anisotropy of pyroxene. In addition,olivine polycrystals can develop very strong LPOthat have nearly single crystal anisotropy.Orthopyroxene polycrystals, on the other hand,never exhibit more than half the single crystalanisotropy and in general are characterized byweaker LPO (J = 1 to 10). In the database, theweakest olivine LPO has about J=4. There is a groupof olivine fabrics from South African kimberliteswith fabrics like PHN4254 (Fig. 6) which have analmost constant seismic anisotropy (ca. 9% for Vp)despite a J index that varies from 12 to 20. Innaturally deformed peridotites there are no reliablemarkers of finite strain. If we take the J values of theolivine samples (about 5-25) and compare that with
Opx Vp anisotropy Olivine Vp anisotropy
75 Opx130 Olivine samples
0
5
10
15
20
25
0 5 10 15 20 25 30
Vp
anis
otro
py (
%)
Fabric Strength - J index
olivine
opx
[001] // YOlivine LPOs
FIG. 10. seismic Vp anisotropy (%) for the olivine and orthopyroxene databases as a function of LPOintensity (defined by the J index). The olivine values in the black box are fabrics with a strong c-axesmaximum parallel to Y such as PHN4254 in Fig. 6. Trend lines are there to indicate tendencies and are notfitted functions.

94 P. Silver et al.
the LPO evolution in numerical simulations orexperiments in simple shear (Fig. 5), thenapparently the LPO of naturally deformed peridotitesis recording a shear strain of γ between 0.8 and 2.5with the majority being close to 1.7. One wouldexpect that these rocks have suffered much highershear strains than 2.5 (especially for asthenosphericflow) and the most plausible reason for the lowvalues is that dynamic recrystallization reduces LPOintensity, leading to constant J values duringdeformation. Indeed, the recrystallized grains in theexperiments of NICOLAS et al. (1973) have weakerLPO than porphyroclasts (Fig. 5). However, effectssuch as grain boundary migration may increase theLPO strength; for example, the strongest fabrics inthe olivine database come from dunite samples withstrong grain growth microstructures. The strongestfabrics from ZHANG and KARATO’s (1995) simpleshear experiments on pure olivine aggregates at1300°C also show evidence of grain boundarymigration. In most natural samples, the presence ofother minerals (orthopyroxene, garnet,clinopyroxene, etc.) will inhibit extensive grainboundary migration. It would thus seem likely thatdynamic recrystallization by a mechanism such assub-grain rotation would cause the LPO intensity andhence, the seismic anisotropy to saturate. Numericalsimulation models that take into accountrecrystallization (e.g., WENK et al., 1997) need to beapplied to olivine. If we take the value of anisotropyat the change in slope of anisotropy versus J indexas the stabilized or saturated value, then the databaseindicates that this occurs at about 0.6 of theanisotropy of the single crystal value for olivine and0.35 for orthopyroxene.
The trend of anisotropy versus LPO strengthshown is Figure 10 for olivine and is essentiallydefined by the oceanic samples. The LPO pattern inoceanic samples agrees well with deformationexperiments and numerical simulations in simpleshear (Fig. 4), indicating that these oceanic LPOpatterns are essentially due to simple sheardeformation at moderate to high temperature. Thesub-continental mantle LPOs from South Africa,however, show a strong deviation from this trend,particularly the patterns in samples like PHN4254.The most probable explanation for this difference i sthat these sub-continental mantle samples have hada long period of residence within the lithosphereafter deformation, perhaps hundreds of millions ofyears, at mantle conditions of 100 to 150 km depthand 1000°C (BOYD, 1973), during which timeprocesses like abnormal grain growth (HUMPHREYS
and HATHERLY, 1995) have altered the LPO pattern.Abnormal grain growth occurs when there is a localdestabilization of the grain structure by the removalof a pinning point (e.g., a small grain or fluidinclusion on a grain boundary, say 5 times smallerthan the average grain size), leading to
inhomogeneous growth with a few grains growingexcessively at high temperature. All of thesesamples are characterized by large grain sizes,probably their only common feature.
Some basic conclusions can be drawn from thisstatistical approach to mantle LPO and seismicanisotropy: (i) A significant difference inanisotropy and LPO pattern exists between the sub-continental mantle of South Africa and oceanicmantle. In part, this difference may be due to itsArchean age, a period with a very differentgeothermal regime. (ii) Oceanic mantle has astronger anisotropy than sub-continental mantle.(iii) The strain recorded by LPO in upper mantlesamples (and hence observable seismically)corresponds to a shear strain of less than γ =2 andhence only the last increment of mantle deformationis observable. (iv) The South African sub-continental samples are characterized by larger grainsize, and weaker LPO and anisotropy than oceanicsamples. The long period of residence afterdeformation of sub-continental samples at 1000°Chas apparently allowed a weakening of LPO, mostprobably by abnormal grain growth.
PREDICTING THE DEFORMATION FIELD FORVARIOUS TECTONIC PROCESSES
In order to ultimately relate observations ofseismic anisotropy to the various tectonic processesthat deform the mantle, it is necessary to predict thedeformation field that the process will create. Withthis relationship in place, it is then possible toperform tests of dynamic models, based onanisotropic observations. Rather than treat thisproblem in general, we consider two sources ofmantle deformation that would be expected to bepresent in the subcontinental mantle. The first,simple asthenospheric flow (SAF) (Fig. 11) is basedon the idea, developed first for oceanic plates, thatthe velocities of the surface plates are much greaterthan that of the deeper mantle, and that there exists amechanical decoupling zone (decoupling the platesfrom the mantle below) usually referred to as theasthenosphere, that concentrates strain. The secondis vertically coherent deformation (VCD) (Fig. 11),which simply assumes that the crustal and mantleportions of plates deform coherently.
In the case of simple asthenospheric flow, theflow field and corresponding anisotropic propertiesare straightforward to predict. We assume that thefoliation plane and lineation direction are bothhorizontal and that the lineation direction followsthe flow line, which in turn is parallel to theabsolute plate motion (APM) direction of the plate.We furthermore assume, based on the discussion inthe previous section, that the memory ofasthenospheric flow direction is short, only a fewmillion years, since strains of order unity, enough to

Mantle structure from seismic anisotropy 95
completely reorient olivine aggregates (NICOLAS etal., 1973, see also MAINPRICE and SILVER, 1993;CHASTEL et al., 1993), will be generated in thatamount of time for the range of plate speeds (1-10cm/yr), and an asthenospheric thickness of order100 km (Fig. 11). For vertically propagating shearwaves, the predicted direction of φ, φapm, is thenparallel to the APM direction. Even if the APMdirection is poorly known, as in the case of Eurasia,(MINSTER and JORDAN, 1978; GRIPP and GORDON,1990), the dominance of asthenospheric flow wouldreveal itself as coherent directions that could becharacterized by a single pole of rotation. Thus, for
plates with well known APM directions, one cansimply compare observed with predicted values or,more generally, test for large-scale coherence of fastpolarization directions. This may be done on apoint-wise basis over the plate, or by testing forvariations in splitting parameters on regionallength scales (less than 1000 kilometers) where theSAF component should be constant. Significantvariations in φ on a regional scale constitute a basisfor rejecting the SAF hypothesis as the dominantsource of mantle anisotropy. Of course, there is thepossibility of more complex asthenospheric flowpatterns. For example, significant relief in thelithosphere-asthenosphere boundary could inducelocal variations in the asthenospheric flow direction(BORMANN et al., 1996; BARRUOL et al., 1997;FOUCH et al., 1999), or alternatively, small-scaleconvection may be present. It is, however, useful todistinguish between simple asthenospheric flow, theidealized form of asthenosphere beneath oceaniclithosphere, and these more complex flow models.
The hypothesis of vertically coherentdeformation (SILVER and CHAN, 1988; 1991; SILVER,1996), states that continental plates deformcoherently over their depth extent. It is additionallyhypothesized that the last significant penetrativeepisode of orogenic deformation controls the mantleanisotropy (consistent with the results of theprevious section), whether the event is occurringtoday or occurred in the Archean. This hypothesispredicts that spatial variations in splittingparameters should track variations in crustaldeformation, based on structural geological ortectonic studies (Fig. 11).
In principle, there are three major categories ofdeformation that would be encountered: transcurrent,collisional, and extensional regimes. In fact, purecollisions are rarely observed, and there is almostalways a significant transcurrent component(VAUCHEZ and NICOLAS, 1991), usually referred to astranspression. For transcurrent deformation, weassume that the foliation plane is vertical and thelineation direction is horizontal and parallel to thetranscurrent structure (approximate for large strain),in which case φ is also parallel to the transcurrentstructure. For transpression, we again assume thatthe foliation plane is vertical, but that the lineationdirection may be significantly different fromhorizontal. As long as it is not vertical, however, φwill, like transcurrent motion, still be parallel totranspressional features. Even for non-verticalpropagation directions within the foliation plane, φis still approximately parallel to the lineationdirection, as indicated by Fig. 7. Becauseextensional regions make up a much smallercomponent of the splitting data set, and becausethey are more difficult to interpret (SILVER, 1996),we will focus our attention on the transpressionalenvironments.
Mesosphere
Asthenosphere
LithosphereAbsolute Plate Motion
a-axis
Simple Asthenospheric Flow
φ
SKS
(anisotropic layer)
Vertically Coherent Deformation
φ
FIG. 11. Hypotheses for the development ofseismic anisotropy: (top) Simple Asthenospheric Flow(SAF) and (bottom) Vertically Coherent Deformation(VCD).

96 P. Silver et al.
INTERPRETATION OF THE SPLITTINGDATA SET
After more than a decade of accumulating over400 shear-wave splitting observations, it hasbecome increasingly clear that for transpressionalzones, the dominant source of mantle anisotropy i svertically coherent deformation of the continentalplate (SILVER, 1996). This basic conclusion allowsus to use seismic anisotropy to extend ourunderstanding of the geology of surface tectonicprocesses, especially structural geology, into themantle. The mantle’s role in orogenies in particular,and the evolution of continents in general, can thusbe assessed. Equally important for ancient orogenicepisodes is that the anisotropy, and henceinformation about mantle deformation, is preserved,as long as it is not overprinted by a subsequentepisode. Vertically coherent deformation is observedin most stable continental areas of all ages, and i salso seen in presently active regions. There arezones that deviate from this general conclusion,however. Tectonic North America (from the Rockymountains to the west coast) in particular reveals acomplex pattern of anisotropy that cannot be easilyrelated to the surface geology or to simpleasthenospheric flow that would be created by theNorth American plate passing over a slowly movingmantle. Stable North America (east of the Rockymountains) possesses values of φ that are parallel toAPM as well as local geology. This presents anambiguity that is difficult to assess. It has recentlybeen argued, in fact, that the splitting pattern forstable North American can be partially explained byflow around a continental keel (BARRUOL et al.,1997; FOUCH et al., 1999). The only difficulty withthis model is that the largest values of splitting areobserved where the lithosphere is thickest,suggesting that a large portion of the anisotropy i sin the lithosphere. It still may be that present-dayshear deformation of the root is responsible forsome of the fabric. The general conclusion remains,however, that vertically coherent deformation is thedominant contribution. We give three examplesfrom different geological periods that illustrate thisconclusion, from the Paleozoic, the Archean, and thepresent.
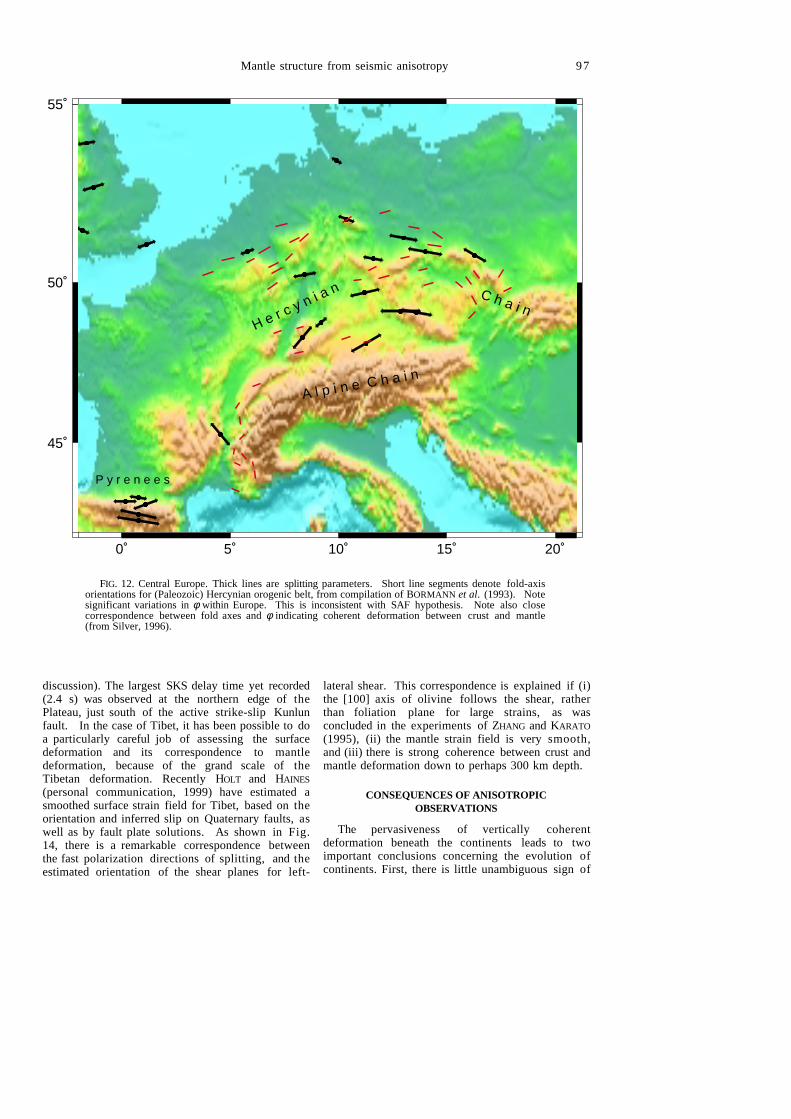
Eurasia is by far the largest continental land massand has large stable regions that are ideal forhypothesis testing. One such region is centralEurope. As shown in Fig. 12 there is a systematicvariation in fast polarization directions on aregional scale. In particular, north of the Alpinedeformation, stations show a systematic variationfrom roughly NE-SW in the west, to NW-SE in theeast: a rotation of nearly 90o over 500 km (BORMANN
et al., 1993 and VINNIK et al., 1994). This variationis unlikely to be caused by simple asthenospheric
flow, because of the small spatial scales ofdeformation. We can furthermore test for possiblecoherence between splitting parameters and surfacegeology, since the structural geology is particularlywell characterized. As noted by BORMANN et al.(1993), and as is clear from Fig. 12, this patternfollows the general trends of the PaleozoicHercynian orogenic belt in this zone, as indicated bythe orientation of fold axes (taken from BORMANN etal., 1993).
A second example is provided by data from arecent seismic experiment (Southern African SeismicExperiment) that has been conducted in part tomeasure the anisotropy beneath the early ArcheanKaapvaal craton. This is a unique locale, since wealso have additionally petrofabric control from thekimberlite nodules, as discussed above. Thepreliminary results from the analysis of splitting(GAO et al., 1998) is shown in Fig. 13, along with astructural map from DEWIT et al. (1992) giving thelarge-scale geological structures of the craton.Splitting has been detected at most stations, andthere are systematic spatial variations in φ . The datamay be separated into three geologic regions. First,there is the southern Kaapvaal group with values ofφ trending NE-SW, a second group further northwithin the Limpopo belt with directions more nearlyEW, and group of stations on the Zimbabwe cratonwith directions ranging from NE-SW to NNE-SSW.In all three regions, values of φ follow closely theorientation of Archean orogenic structures, a resultthat is consistent with vertically coherentdeformation. Splitting delay times are small,averaging 0.65 s, compared to a global average ofabout 1s for continents worldwide. As notedpreviously, if we take the value of intrinsicanisotropy δVs equal to 2.2%, assuming thestructural frame is in the orientation appropriate fortranspressional deformation, then the averagethickness of the anisotropic region is inferred to beabout 130 km. Assuming the crust does notcontribute to the splitting, this places the base ofthe anisotropic zone near 170 km depth beneathsouthern Africa, an estimate that is close to theestimates of lithospheric thickness from theboundary between high-temperature and lowtemperature nodules.
A third example comes from Tibet, a plateau thatwas formed by the collision between the Indian andEurasian plates. The results from an experimentalong a north-south line in eastern Tibet(MCNAMARA et al., 1994), are shown in Fig. 14. Formost of the line, especially the northern stationswhere the delay times are largest, there is a closecorrespondence between the orientation of the large-scale surface deformation and the orientation of φ.In particular, the anisotropy appears to record in themantle both the shortening and extrusion of Tibettowards the east (see MCNAMARA et al., 1994 for
Mantle structure from seismic anisotropy 97
discussion). The largest SKS delay time yet recorded(2.4 s) was observed at the northern edge of thePlateau, just south of the active strike-slip Kunlunfault. In the case of Tibet, it has been possible to doa particularly careful job of assessing the surfacedeformation and its correspondence to mantledeformation, because of the grand scale of theTibetan deformation. Recently HOLT and HAINES
(personal communication, 1999) have estimated asmoothed surface strain field for Tibet, based on theorientation and inferred slip on Quaternary faults, aswell as by fault plate solutions. As shown in Fig.14, there is a remarkable correspondence betweenthe fast polarization directions of splitting, and theestimated orientation of the shear planes for left-
lateral shear. This correspondence is explained if (i)the [100] axis of olivine follows the shear, ratherthan foliation plane for large strains, as wasconcluded in the experiments of ZHANG and KARATO
(1995), (ii) the mantle strain field is very smooth,and (iii) there is strong coherence between crust andmantle deformation down to perhaps 300 km depth.
CONSEQUENCES OF ANISOTROPICOBSERVATIONS
The pervasiveness of vertically coherentdeformation beneath the continents leads to twoimportant conclusions concerning the evolution ofcontinents. First, there is little unambiguous sign of
0˚ 5˚ 10˚ 15˚ 20˚
45˚
50˚
55˚
H e r c y n i a n C h a i n
A l p i n e C h a i n
P y r e n e e s
FIG. 12. Central Europe. Thick lines are splitting parameters. Short line segments denote fold-axisorientations for (Paleozoic) Hercynian orogenic belt, from compilation of BORMANN et al. (1993). Notesignificant variations in φ within Europe. This is inconsistent with SAF hypothesis. Note also closecorrespondence between fold axes and φ indicating coherent deformation between crust and mantle(from Silver, 1996).

98 P. Silver et al.
a continental asthenosphere that decouples theplate from the mantle below. This is a general featureof the stable regions of continents that have thus farbeen examined. Second, the dominance of verticallycoherent deformation throughout Earth’s history
suggests that the orogenic process involves thedeformation of the entire plate, a process that forcollisions is expected to produce thickened mantleroots. Such a model accounts for the usuallythickened crust, but, as we will see, does not easily
16˚ 18˚ 20˚ 22˚ 24˚ 26˚ 28˚ 30˚ 32˚ 34˚-34˚
-32˚
-30˚
-28˚
-26˚
-24˚
-22˚
-20˚
-18˚
-16˚
-14˚
SLR
bosa
lbtb
lsza
sa07
sa11 sa12 sa13
sa16 sa17sa18
sa22 sa23 sa24 sa25
sa30 sa31 sa32
sa37 sa38 sa39 sa40
sa45 sa46 sa47
sa50 sa51sa52
sa55sa56 sa57
sa59
sa60sa61
sa62
sa63
sa64 sa65
sa66 sa67 sa68sa69
sa70sa71
sa72
sa73sa74
sa76 sa77
sa78
sa79 sa80
sa81 sa82
sura
tsum
With clear splitting 0.4 0.8 1.2
No splitting from two or more events with different azimuths
No splitting from one or more events with similar azimuths
Phi=44+-7
Phi=60+-5
Phi=16+-13Phi=53+-4
SOUTH 0.5
EASTWEST
NORTH
SOUTH 0.5
EASTWEST
NORTH
SOUTH 0.5
EASTWEST
NORTH
SOUTH 0.5
EASTWEST
NORTH
SOUTH 0.5
EASTWEST
NORTH
SOUTH 0.5
EASTWEST
NORTH
SOUTH 0.5
EASTWEST
NORTH
SOUTH 0.5
EASTWEST
NORTH
FIG. 13. Shear-wave splitting results from the Southern African Seismic Experiment (From GAO et al.,1998). Numbers give the average values of φ for geologic subregions. Grey area denoted Bushveld igneousprovince. See text for details.

Mantle structure from seismic anisotropy 99
account for the high temperatures usually associatedwith orogenic crust and mantle.
Is there a continental asthenosphere?
There are three possible explanations for theapparently small contribution of a continentalasthenosphere. First, the continental asthenospherecould be very thin, of order 10 km, and not produce ameasurable anisotropic signal. Second, it may bethat under the conditions found within thecontinental asthenosphere, anisotropy (namelyLPO) is not developed. This would be the case, forexample, if deformation took place by diffusioncreep, rather than dislocation creep (e.g., KARATO,1992; 1993). The third explanation is that a
continental asthenosphere is not present beneathcontinents. We take these possibilities in order. Avery thin layer seems improbable, given thegeometrical difficulties introduced by large (or order100 km) variations in the depth to the base of thelithosphere. At a minimum such an asthenospherewould still permit strong coupling to occur,especially where there are abrupt changes inlithospheric thickness. The second possibility is achange in deformation mechanism from dislocationto diffusion creep at conditions where a continentalasthenosphere is present. This problem iscomplicated in general, because the deformationmechanism depends on several physical variables,such as pressure, temperature, stress, grain size andconcentration of contaminants, such as water. The
84˚ 86˚ 88˚ 90˚ 92˚ 94˚ 96˚ 98˚ 100˚ 102˚ 104˚24˚
26˚
28˚
30˚
32˚
34˚
36˚
38˚
40˚
84˚ 86˚ 88˚ 90˚ 92˚ 94˚ 96˚ 98˚ 100˚ 102˚ 104˚24˚
26˚
28˚
30˚
32˚
34˚
36˚
38˚
40˚
84˚ 86˚ 88˚ 90˚ 92˚ 94˚ 96˚ 98˚ 100˚ 102˚ 104˚24˚
26˚
28˚
30˚
32˚
34˚
36˚
38˚
40˚
84˚
84˚
86˚
86˚
88˚
88˚
90˚
90˚
92˚
92˚
94˚
94˚
96˚
96˚
98˚
98˚
100˚
100˚
102˚
102˚
104˚
104˚
24˚ 24˚
26˚ 26˚
28˚ 28˚
30˚ 30˚
32˚ 32˚
34˚ 34˚
36˚ 36˚
38˚ 38˚
40˚ 40˚
84˚
84˚
86˚
86˚
88˚
88˚
90˚
90˚
92˚
92˚
94˚
94˚
96˚
96˚
98˚
98˚
100˚
100˚
102˚
102˚
104˚
104˚
24˚ 24˚
26˚ 26˚
28˚ 28˚
30˚ 30˚
32˚ 32˚
34˚ 34˚
36˚ 36˚
38˚ 38˚
40˚ 40˚
84˚
84˚
86˚
86˚
88˚
88˚
90˚
90˚
92˚
92˚
94˚
94˚
96˚
96˚
98˚
98˚
100˚
100˚
102˚
102˚
104˚
104˚
24˚ 24˚
26˚ 26˚
28˚ 28˚
30˚ 30˚
32˚ 32˚
34˚ 34˚
36˚ 36˚
38˚ 38˚
40˚ 40˚
84˚
84˚
86˚
86˚
88˚
88˚
90˚
90˚
92˚
92˚
94˚
94˚
96˚
96˚
98˚
98˚
100˚
100˚
102˚
102˚
104˚
104˚
24˚ 24˚
26˚ 26˚
28˚ 28˚
30˚ 30˚
32˚ 32˚
34˚ 34˚
36˚ 36˚
38˚ 38˚
40˚ 40˚
84˚
84˚
86˚
86˚
88˚
88˚
90˚
90˚
92˚
92˚
94˚
94˚
96˚
96˚
98˚
98˚
100˚
100˚
102˚
102˚
104˚
104˚
24˚ 24˚
26˚ 26˚
28˚ 28˚
30˚ 30˚
32˚ 32˚
34˚ 34˚
36˚ 36˚
38˚ 38˚
40˚ 40˚
1s - Shear Wave Splitting
84˚
84˚
86˚
86˚
88˚
88˚
90˚
90˚
92˚
92˚
94˚
94˚
96˚
96˚
98˚
98˚
100˚
100˚
102˚
102˚
104˚
104˚
24˚ 24˚
26˚ 26˚
28˚ 28˚
30˚ 30˚
32˚ 32˚
34˚ 34˚
36˚ 36˚
38˚ 38˚
40˚ 40˚
FIG. 14. Shear-wave splitting from Tibet. Black lines give shear-wave splitting parameters fromMCNAMARA et al. (1994). Also shown, zero-length lines of finite strain ellipsoid from smoothed strain map ofTibet derived from slip on Quaternary faults (HOLT and HAINES, 1999, personal comm.). Solid gray and dashedblack lines correspond to left- and right-lateral shear directions, respectively. Note the remarkablecorrespondence between orientations of fast polarization direction φ and left-lateral shear directions, consistentwith the hypothesis of vertically coherent deformation between the crust and mantle during the formation ofTibet.
100 P. Silver et al.
problem of asthenospheric conditions, however, i srelatively well constrained. We have reasonablygood evidence that lattice preferred orientationoccurs in the oceanic asthenosphere. One line ofevidence is from ophiolites, where the thermalproperties, such as evidence of melt, suggestasthenospheric conditions near a spreading ridge (A.NICOLAS, personal comm.). Another data source i sthe shear wave splitting near mid-ocean ridges. TheMELT experiment (WOLFE and SOLOMON, 1998)provided evidence for significant splitting for near-ridge sites. The observed orientation of φ parallel tospreading, strongly suggests that LPO in olivine i sthe mechanism for the splitting. The physicalconditions for a continental asthenosphere would bevery similar to the more shallow oceanic one:specifically, a similar temperature, defined by thebase of the lithosphere and a similar strain rate,defined by plate velocity. The main difference i spressure, and this has two potentially importanteffects. First, according to KARATO (1992), diffusioncreep should have a lower activation volume thandislocation creep, and should therefore be favored athigher pressure. On the other hand, viscosity, andhence stress should also increase with pressure (atconstant temperature), which favors dislocationcreep. If these two effects cancel each other out,then we would expect LPO to develop because it i sobserved at lower pressures. The absence of LPOrequires then requires that diffusion creep possess amuch smaller activation volume. The last of thethree explanations is that an asthenospheric layerdoes not exist beneath stable continents. We regardthis as the most likely of the three options at thisstage, although more work needs to be done. If true,it implies that continents are strongly coupled togeneral mantle circulation. This conclusion i ssupported, in the case of the South American plate,by the evidence for a fossil plume beneath Brazil(VANDECAR et al., 1995) that appears to have movedwith the continent. It appears that the uniquestructure of stable continents, particularly theirstable roots, serve to suppress the development of amechanical asthensphere (JORDAN, 1978). .Thiscoupling has implications for the forces thatultimately drive the plates and drive orogeny (RUSSO
and SILVER, 1996), the interactions between theplates themselves mediated by mantle circulation(SILVER et al., 1998), and finally the possibility thatupwelling from the core-mantle boundary can have asignificant effect on the motions of the plates(LITHGOW-BERTELLONI and SILVER, 1998).
The orogeny paradox: where does the heat comefrom?
The second important implication of verticallycoherent deformation is that it leads to the orogenyparadox (SILVER and CHAN, 1991; SILVER, 1996;
KINCAID and SILVER, 1996), namely that thedeformational and thermal properties of manyorogenies are apparently inconsistent with thesimplest models of mountain building as thecollision between plates. On the one hand, the ideaof vertically coherent deformation simply requiresthat plates deform as a whole, and that the chemicaldistinction between the crust and mantle is ofsecondary importance. The shortening that is themost direct result of a continental collision shouldalso lead to thickening of the plate. The thickenedplate will then have distinct mechanical and thermalproperties, namely, a doubly thickened crust and ahigher-velocity mantle as geotherms are advecteddownward. This process has been invoked, forexample, to account for the deep roots of Archeancratons (JORDAN, 1978).
This model, however, does not easily explainsome of the basic thermal characteristics oforogenies. It predicts that orogenies should becooling events while it appears that they are oftenheating events. Perhaps the clearest modern exampleof this paradox is northern Tibet. The deformedplateau extends some 1000 km north of the suture,so that the northern part of the plateau has mostprobably not been subjected to subduction-relatedprocesses. Yet, northern Tibet is characterized bypervasive surface volcanism, including basalticvolcanism, implying that the lower crust anduppermost mantle are melting. There is alsoseismological evidence for a hot upper mantle (seeSILVER, 1996 and references therein). At the sametime, there is excellent evidence for verticallycoherent deformation, as noted above. Thiscorrespondence between crustal and mantledeformation places a strong constraint onmechanical models. In particular, it is difficult toreconcile this result with convective removalmodels, where the thickened lithosphere becomesconvectively unstable and is replaced by warmasthenosphere (HOUSEMAN et al., 1981; MOLNAR etal., 1993; CONRAD and MOLNAR, 1999). It should befurther noted that the basaltic magmas appear to bederived from a lithospheric, rather thanasthenospheric, source (MOLNAR et al., 1993), alsoconsistent with the idea that the lithosphere i sintact.
One way of explaining the heat without removalof the mantle lithosphere is radioactive heatproduction. However, this model will not createenough heat in short enough time if the heat-producing elements are concentrated in the uppercrust, as is usually assumed. In addition, thisprocess does not account for a hot upper mantle (seeKINCAID and SILVER, 1996).
An alternative source of heat that satisfies boththe shear wave splitting data and the thermalproperties of the mantle, is that the deformationitself is the source of heat (SILVER and CHAN, 1991;

Mantle structure from seismic anisotropy 101
SILVER, 1996; KINCAID and SILVER, 1996). It hasbeen proposed that the strain energy of thedeformation is dissipated as heat, and that this heatis sufficient to account for the elevated temperaturesinferred for both the crust and the mantle. In orderfor this to be a significant process, the orogenicstresses have to be high, several kilobars. Thelargest thermal anomaly will be concentrated wherethe plate is the strongest, at the very top of themantle. This strain energy will be very effective ingenerating lower crustal melts and may also becapable of melting some of the mantle itself,especially if there are volatiles that serve tosignificantly lower the melting temperature ofperidotites. Numerical modeling of this process(KINCAID and SILVER, 1996) predicts a thermal profilethat possesses anomalously high temperatures justbelow the Moho but with anomalously lowtemperatures at greater depth as would be expectedfrom the advective thickening of the Eurasian plate.Recent tomography from this region (GRIOT et al.,1998), reveals a seismic structure very similar towhat would be predicted from viscous heating.
If viscous dissipation indeed plays a role indetermining the thermal characteristics of the mantletoday, it probably played a more significant role inthe Archean. Higher geotherms would have broughtdeformed mantle material closer to melting (KINCAID
and SILVER, 1996), so that viscous dissipation couldhave been a significant heat source for crustformation. The manner in which early Archean crustformed is still highly controversial, especially theissue of whether or not a plate-tectonic process wasinvolved. Could viscous dissipation, operating on apervasively deformed oceanic plate, be a viable wayto make the first continents? We think thishypothesis is worthy of serious consideration.
Acknowledgments--We take great pleasure in dedicatingthis article to F. R. "Joe" Boyd who has opened the field ofsubcontinental mantle geology to the world. We thank Joefor the time he has generously spent with us discussing hisideas about the Archean mantle, and for allowing us toanalyze his unique collection of mantle nodules. We alsothank Peter Nixon for providing his valuable samples as well.We thank Françoise Boudier and Adolphe Nicolas for theircontinued encouragement to make a more quantitativeapproach to upper mantle LPO development and seismicanisotropy. Finally, we acknowledge the effort of theKaapvaal Craton Project and the menbers of the KaapvaalSeismic Working Group for making the southern Africanseismic experiment possible. This work was supported by theCarnegie Institution of Washington. University ofMontpellier II and NSF grant # EAR - 9526840.
REFERENCES
ABRAMSON E. H., BROWN J. M., SLUTSKY L. J., and ZANGJ. (1997) The elastic constants of San Carlos olivine to 17GPa. J. Geophys. Res. 102, 12253-12263.
AVÉ-LALLEMANT H. G. (1975) Mechanisms of preferredorientations of olivine in tectonite peridotite. Geology 3,653-656.
BARRUOL G., SILVER P. G., and VAUCHEZ A. (1997)
Seismic anisotropy in the Eastern United States; deepstructure of a complex continental plate. J. Geophys.Res. 102, 8329-8348.
BASS J. D., LIEBERMANN R. C., WEIDNER D. J., and FINCHS. J. (1981) Elastic properties from acoustic and volumecompression experiments. Phys. Earth Planet. Inter. 25,140-158.
BASS J. D. (1995) Elasticity of minerals, glasses and melts.In Minerals Physics and Crystallography: a Handbook ofPhysical Constants (ed. T. J. AHRENS), pp. 45-63,American Geophysical Union.
BEN ISMAÏL W. and MAINPRICE D. (1998) An olivine fabricdatabase: an overview of upper mantle fabrics andseismic anisotropy. Tectonophysics 296, 145-157.
BEN ISMAÏL W. and MAINPRICE D. (1999) Anorthopyroxene fabric database: implications for seismicanisotropy. Tectonophysics submitted.
BLACKMAN D. K., KENDALL J.-M., DAWSON P. R., WENKH.-R., BOYCE D., and PHIPPS-MORGAN J. (1996)Teleseismic imaging of subaxial flow at mid-oceanridges: travel-time effects of anisotropic mineral texturein the mantle. Geophys. J. Int. 127, 415-426.
BLACKMAN D. K. and KENDALL J.-M. (1997) Sensitivity ofteleseismic body waves to mineral texture and melt in themantle beneath a mid-ocean ridge. Phil. Trans. R. Soc.Lond. A 355, 217-231.
BORMANN P., BURGHARDT P. T., MAKEYEVA L. I., andVINNIK L. P. (1993) Teleseismic shear-wave splittingand deformations in Central Europe. In Dynamics of theSubcontinental Mantle; from Seismic Anisotropy toMountain Building., Vol. 78 (ed. D. MAINPRICE, A.VAUCHEZ, and J. P. MONTAGNER), pp. 157-166.Elsevier.
BORMANN P., GRUENTHAL G., KIND R., and MONTAG H.(1996) Upper mantle anisotropy beneath Central Europefrom SKS wave splitting; effects of absolute plate motionand lithosphere-asthenosphere boundary topography? J.Geodynamics 22, 11-32.
BOYD F. R. and ENGLAND J. L. (1960) Apparatus for phaseequilibrium measurements at pressures up to 50 kilobarsand temperatures up to 1750°C. J. Geophys. Res. 65,741-748.
BOYD F. R. (1973) A pyroxene geotherm. Geochim.Cosmochem. Acta 37, 2533-2533.
BUTTLES J. and OLSON P. (1998) A laboratory model ofsubduction zone anisotropy. Earth Planet. Sci. Lett. 164,245-262.
CARLSON R. W., GROVE T. L., DEWIT M. J., and GURNEYJ. J. (1996) Program to study crust and mantle of theArchean Craton in Southern Africa. Eos, Transactions,American Geophysical Union 77, 273.
CHAI M., BROWN J. M., and SLUTSKY L. J. (1997) Theelastic constants of an aluminous orthopyroxene to 12.5GPa. J. Geophys. Res. 102, 14779-14785.
CHASTEL Y. B., DAWSON P. R., WENK H.-R., and BENNETK. (1993) Anisotropic convection with implications forthe upper mantle. J. Geophys. Res. 98, 17757-17771.
COLLINS M. D. and BROWN J. M. (1998) Elasticity of anupper mantle clinopyroxene. Phys. Chem. Minerals 26,7-13.
CONRAD C. and MOLNAR P. (1999) Convective instability ofa boundary layer with temperature and strain ratedependent viscosity in terms of "available buoyancy".Geophys. J. Int. submitted.
DAVIS P., ENGLAND P., and HOUSEMAN G. (1997)Comparison of shear wave splitting and finite strain fromthe India-Asia collision zone. J. Geophys. Res. 102,27511-27522.
DEWIT M. J., ROERING C., HART R. J., ARMSTRONG R.,RONDE C., GREEN R., TREDOUX M., PEBERDY E., andHART R. A. (1992) Formation of an Archean continent.Nature 357, 553-562.
DUFFY T. S. and VAUGHAN M. T. (1988) Elasticity and itsrelationship to crystal structure. J. Geophys. Res. 93,

102 P. Silver et al.
383-391.ESTEY L. H. and DOUGLAS B. J. (1986) Upper mantle
anisotropy: A preliminary model. J. Geophys. Res. 91,11393-11406.
ETCHECOPAR A. (1977) A plane kinematic model ofprogressive deformation in a polycrystalline aggregate.Tectonophysics 39, 121-139.
ETCHECOPAR A. and VASSEUR G. (1987) A 3-D kinematicmodel of fabric development in polycrystallineaggregates: comparison with experimental and naturalexamples. J. Struct. Geol. 9, 705-717.
FOUCH M. J., FISCHER K. M., PARMENTIER E. M.,WYSESSION M. W., and CLARKE T. J. (1999) Shearwave splitting, continental keels and patterns of mantleflow. J. Geophys. Res. submitted.
FRISILLO A. L. and BARSCH G. R. (1972) Measurement ofsingle-crystal elastic constants of bronzite as a functionof pressure and temperature. J. Geophys. Res. 77, 6360-6384.
GAO S. S., SILVER P. G., JAMES D. E., and GROUP K. S.(1998) Seismic structure and tectonics of southernAfrica-progress report. EOS Trans. Am. Geophys. Un.79, 574.
GRIOT D. A., MONTAGNER J. P., and TAPPONNIER P. (1998)Phase velocity structure from Rayleigh and Love wavesin Tibet and its neighboring regions. J. Geophys. Res.103, 21215- 21232.
GRIPP A. E. and GORDON R. G. (1990) Current platevelocities relative to the hotspots incorporating theNuvel-1 global plate motion model. Geophys. Res. Lett.17, 1109-1112.
HOUSEMAN G. A., MCKENZIE D. P., and MOLNAR P. (1981)Convective instability of a thickened boundary layer andits relevance for the thermal evolution of continentalconvergent belts. J. Geophys. Res. 86, 6115-6132.
HUMPHREYS F. J. and HATHERLY M. (1995)Recrystallization and Related Annealing Phenomena.Pergamon.
ISSAK D. G. (1992) High-temperature elasticity of iron-bearing olivine. J. Geophys. Res. 97, 1871-1885.
ITA J. and STRIXRUDE L. (1992) Petrology, elasticity andcomposition of the mantle transition zone. J. Geophys.Res. 97, 6849-6866.
JORDAN T. H. (1978) Composition and development of thecontinental tectosphere. Nature 274, 544-548.
KANESHIMA S. and SILVER P. G. (1995) Anisotropic Loci inthe mantle beneath central Peru. Phys. Earth Planet.Inter. 88, 257-272.
KARATO S. (1992) On the Lehmann Discontinuity. Geophys.Res. Lett. 19, 2255-2258.
KARATO S. (1993) Dislocation recovery in olivine underdeep upper mantle conditions: implications for creep anddiffusion. J. Geophys. Res. 98, 9761-9768.
KENDALL J. M. and SILVER P. G. (1996) Constraints fromseismic anisotropy on the nature of the lowermost mantle.Nature 381, 409-412.
KENDALL J. M. and SILVER P. G. (1998) Investigatingcauses of D" anisotropy. In The Core-Mantle BoundaryRegion, Vol. Geodynamics 28 (eds. M. GURNIS, M.WYSESSION, E. KNITTLE, and B. BUFFET), pp. 409-412.American Geophysical Union.
KINCAID C. and SILVER P. G. (1996) The role of viscousdissipation in the orogenic process. Earth Planet. Sci.Lett. 142, 271-288.
LEVIEN L., WEIDNER D. J., and PREWITT C. T. (1979)Elasticity of diopside. Phys. Chem. Minerals 4, 105-113.
LITHGOW-BERTELLONI C., and SILVER P. G. (1998)Dynamic topography, plate driving forces and theAfrican superswell. Nature 395, 269-272.
MAINPRICE D. and SILVER P. G. (1993) Interpretation ofSKS waves using samples from the subcontinentallithosphere. Phys. Earth Planet. Inter. 78, 257-80.
MATSUI M. and BUSING W. R. (1984) Calculation of theelastic constants and high-pressure properties of
diopside, CaMgSi2O6. Amer. Mineral. 69, 1090-1095.MCNAMARA D. E., OWENS T. J., SILVER P. G., and WU F.
T. (1994) Shear wave anisotropy beneath the TibetanPlateau. J. Geophys. Res. 99, 13655-13665.
MEADE C., SILVER P. G., and KANESHIMA S. (1995)Laboratory and seismological observations of lowermantle isotropy. Geophys. Res. Lett. 22, 1293-1296.
MINSTER J. B. and JORDAN T. H. (1978) Present-day platemotions. J. Geophys. Res. 85, 5331-5354.
MOLNAR P., ENGLAND P., and MARTINOD J. (1993) Mantledynamics, uplift of the Tibetan Plateau, and the Indianmonsoon. Rev. Geophys. 31, 357-396.
NICOLAS A., BOUDIER F., and BOULLIER A. M. (1973)Mechanism of flow in naturally and experimentallydeformed peridotites. Amer. J. Sci. 273, 853-876.
NICOLAS A. (1989) Structures of Ophiolites and Dynamics ofOceanic Lithosphere. Kluwer Academic Publishers.
RIBE N. M. (1989) A continuum theory for lattice preferredorientations. Geophys. J. 97, 199-207.
RIBE N. M. and YU Y. (1991) A theory for plasticdeformation and textural evolution of olivinepolycrystals. J. Geophys. Res. 96, 8325-8335.
RINGWOOD A. E. (1991) Phase transitions and their bearingon the constitution and dynamics of the mantle. Geochim.Cosmochim. Acta 55, 2083-2110.
RUMPKER G. and SILVER P. G. (1998) Apparent shear-wavesplitting parameters in the presence of vertically-varyinganisotropy. Geophys J. Int. 135, 790-800.
RUSSO R. and SILVER P. G. (1996) Cordillera orogenesis,mantle dynamics, and the Wilson Cycle. Geology 24,511-514.
SALTZER R., JORDAN T. H., GAHERTY J. B., ZHAO L., andGROUP K. W. (1998) Anisotropic structure of theKaapvaal craton from surface wave analysis. EOSTrans. Amer. Geophys. Union 79, 574.
SAVAGE M. K. (1999) Seismic anisotropy and mantledeformation: what have we learned from shear wavesplitting? Rev. Geophys. 37, 65-106.
SILVER P. G. and CHAN W. W. (1988) Implications forcontinental structure and evolution from seismicanisotropy. Nature 335, 34-39.
SILVER P. G. and CHAN W. W. (1991) Shear-wave splittingand subcontinental mantle deformation. J. Geophys. Res.96, 16429-16454.
SILVER P. G. and KANESHIMA S. (1993) Constraints onmantle anisotropy beneath Precambrian North Americafrom a transportable teleseismic experiment. Geophys.Res. Lett. 20, 1127-1130.
SILVER P. G. (1996) Seismic anisotropy beneath thecontinents: Probing the depths of geology. Ann. Rev.Earth Planet. Sci. 24, 385-432.
SILVER P. G., RUSSO R. M., and LITHGOW-BERTELLONI C.(1998) The coupling of plate motion and platedeformation. Science 279, 60-63.
TAKESHITA T. (1989) Plastic anisotropy in textured mineralaggregates: theories and geological implications. InRheology of Solids and of the Earth (eds. S. KARATO andM. TORIUMI), pp. 237-283. Oxford University Press.
TAKESHITA T., WENK H.-R., MOLINARI A., and CANOVAG. (1990) Simulation of dislocation-assisted plastic flowin olivine polycrystals. In Deformation Processes inMinerals, Ceramics, and Rocks (eds. J. D. BARBER andP. G. MEREDITH), pp. 365-377. Hyman Ltd.
TAYLOR G. I. (1938) Plastic strain in metals. J. Inst. Metals62, 301-324.
TOMMASI A., VAUCHEZ A., and RUSSO R. M. (1996)Seismic anisotropy in ocean basins; resistive drag of thesublithospheric mantle? Geophys. Res. Lett. 23, 2991-2994.
TOMMASI A. (1998) Forward modeling of the developmentof seismic anisotropy in the upper mantle. Earth Planet.Sci. Lett. 160, 1-13.
TOMMASI A., MAINPRICE D., CANOVA G., and CHASTEL Y.(2000) Viscoplastic self-consistent and equilibrium-based

Mantle structure from seismic anisotropy 103
modeling of olivine lattice preferred orientations.1.Implications for the upper mantle seismic anisotropy. J. Geophys. Res. 105 : 7893-7908
VANDECAR J. C., JAMES D. E., and ASSUMPCAO M. (1995)Seismic evidence for a fossil mantle plume beneath SouthAmerica and implications for plate driving forces. Nature378, 25-31.
VAUCHEZ A. and NICOLAS A. (1991) Mountain building:strike-parallel motion and mantle anisotropy.Tectonophysics 186, 183-201.
VINNIK L. P., KRISHNA V. G., KIND R., BORMANN P., andSTAMMLER K. (1994) Shear wave splitting in the recordsof the German Regional Seismic Network. Geophys. Res.Lett. 21, 457-460.
WEBB S. L. (1989) The elasticity of the upper mantleorthosilicates olivine and garnet to 3 GPa. Phys. Chem.Minerals 16, 684-692.
WEBB S. L. and JACKSON I. (1993) The pressuredependence of the elastic moduli of single-crystalorthopyroxene (Mg0.8Fe0.2)SiO3. European J. Mineral. 5,1111-1119.
WEIDNER D. J., WANG H., and ITO J. (1978) Elasticity oforthoenstatite. Phys. Earth Planet. Inter. 17, 7-13.
WENK H.-R., BENNET K., CANOVA G. R., and MOLINARI A.(1991) Modelling plastic deformation of peridotite withthe self-consistent theory. J. Geophys. Res. 96, 8337-8349.
WENK H.-R., CANOVA G. R., BRECHET Y., and FLANDIN L.(1997) A deformation-based model for recrystallizationof anisotropic materials. Acta Metall. Mat. 45, 3283-3296.
WOLFE C. J. and SOLOMON S. C. (1998) Shear-wavesplitting and implications for mantle flow beneath theMELT region of the East Pacific Rise. Science 280,1230-1232.
ZHANG S. and KARATO S. (1995) Lattice preferredorientation of olivine aggregates in simple shear. Nature375, 774-777.
Copyright © 2022 FDOKUMEN