Subduction and volatile recycling in Earth's mantle(Abstract Only)

Journal of Geodynamics 46 (2008) 21–37
Contents lists available at ScienceDirect
Journal of Geodynamics
journa l homepage: ht tp : / /www.e lsev ier .com/ locate / jog
Upper mantle anisotropy beneath central and southwest Japan:An insight into subduction-induced mantle flow
Mohamed K. Salaha,∗, T. Senob, T. Iidakab
a Geology Department, Faculty of Science, Tanta University, Tanta 31527, Egyptb Earthquake Research Institute, University of Tokyo, Tokyo 113-0032, Japan
a r t i c l e i n f o a b s t r a c t
Article history:Received 6 August 2007Received in revised form 3 April 2008Accepted 4 April 2008
Analysis of seismic anisotropy in the crust and mantle wedge above subduction zones gives much informa-tion about the dynamic processes inside the Earth. For this reason, we measure shear wave polarizationanisotropy in the crust and upper mantle beneath central and southwestern Japan from local shallow,intermediate, and deep earthquakes occurring in the subducting Pacific slab. We analyze S phases from
at 42airs ft mostion
direcrther
distriNW–y tim
nisotrsotrodirecorph. This
Keywords:Shear wave splittingPolarization directionSeismic anisotropyCentral JapanSouthwest Japan
198 earthquakes recorded980 splitting parameter pof shear waves obtained asub-parallel to the subducare oriented in NNE–SSWof Izu Peninsula and the noPeninsula and the Chubusome fast directions haveshu are oriented N–S. Deladepth and the degree of agest that the nature of aniobserved WNW–ESE fastflow. However, the slab moverriding the Pacific slab
stress state of the mantle wedgENE–WSW fast directions in Kinduced by the subduction of thmight be produced by the trenjunction.1. Introduction
Seismic anisotropy within the crust and upper mantle has beendocumented in a number of different tectonic settings world-wide, including subduction zones, spreading centers and stablecratons. Crustal anisotropy is caused mainly by the preferredalignment of stress-induced microcracks (e.g. Kaneshima, 1990),while mantle anisotropy is generally attributed to deformationor stress, which results in a lattice-preferred orientation (LPO) ofanisotropic mantle minerals, primarily olivine (e.g., Karato, 1987;Nicolas and Christensen, 1987; Silver and Chan, 1991; Zhang andKarato, 1995). Laboratory studies show that under moderate to
∗ Corresponding author. Tel.: +20 18 6268576; fax: +20 40 3350804.E-mail address: [email protected] (M.K. Salah).
0264-3707/$ – see front matter © 2008 Elsevier Ltd. All rights reserved.doi:10.1016/j.jog.2008.04.002
Japanese F-net broadband seismic stations. This data set yields a total ofor central and southwestern Japan. Dominant fast polarization directionst stations in the Kanto–Izu–Tokai areas are oriented WNW–ESE, which aredirection of the Pacific plate. However, minor fast polarization directionstions being parallel to the strike of the Japan Trench, especially in the northn Tokai district. Generally, fast directions obtained at stations located in Kii
ct are oriented ENE–WSW, almost parallel to the Nankai Trough, althoughSE trends. The fast directions obtained at stations in northern central Hon-es vary considerably and range from 0.1 to 1.25 s depending on the sourceopy along the ray path. These lateral variations in splitting character sug-py is quite different between the studied areas. Beneath Kanto–Tokai, thetions are probably caused by the olivine A-fabric induced by the cornerology in this region is relatively complicated as the Philippine Sea slab iscomplex tectonic setting may induce lateral heterogeneity in the flow ande, and may have produced NNE–SSW orientations of fast directions. The
ii Peninsula and the Chubu district are more coherent and may be partlye Philippine Sea plate. The N–S fast directions in northern central Honshu
ch-parallel stretching of the wedge due to the curved slab at the arc–arc© 2008 Elsevier Ltd. All rights reserved.
large strains, the a-axis of olivine becomes aligned in the sheardirection of the mantle flow (Nicolas and Christensen, 1987; Zhangand Karato, 1995). This alignment is only produced when disloca-tion creep is the dominant deformation mechanism and is called“A-type” olivine fabric (Zhang and Karato, 1995). However, newlaboratory results have shown that when olivine aggregates aredeformed under high-stress, low-temperature, and water-rich con-ditions, the fast axes of individual olivine crystals tend to align 90◦
from the flow direction (Jung and Karato, 2001), producing whatis called “B-type” olivine fabric. These B-type olivine fabrics, inconjunction with trench-normal flow in the mantle wedge, mayexplain the trench-parallel fast directions in some regions (Karato,2003; Kneller et al., 2005). It is not clear, however, if the stresses,temperatures, and volatile concentrations needed to produce B-type olivine fabrics are relevant to a large volume of the mantlewedge.

f Geod
22 M.K. Salah et al. / Journal oOne of the key factors controlling the development of LPO istemperature (see Savage, 1999 and references therein). At tem-peratures greater than 900 ◦C, mantle minerals will develop a LPOunder moderate shear strain, and thus anisotropy can be activelyproduced by present-day mantle deformation. If the temperatureis then decreased to less than 900 ◦C causing little or no deforma-tion, anisotropy may become ‘frozen in’, leading to fossil anisotropy(Currie et al., 2004). Present-day mantle deformation has beeninvoked to explain anisotropy in tectonically active regions, such assubduction zones and spreading centers (e.g. Vinnik et al., 1992). Onthe other hand, anisotropy over stable cratons has been explainedby fossil anisotropy within the lithosphere produced by the mostrecent tectonic event (Silver and Chan, 1991), sublithospheric man-tle flow (Fouch et al., 2000), or a combination of both (Vinnik et al.,1992; Levin et al., 1999; Fouch et al., 2000).
Seismic anisotropy can be observed through the splitting of var-ious S-wave phases including direct S waveforms. When a shearwave passes through an anisotropic medium, it splits into twoorthogonal components which travel at different speeds. Shearwave splitting is characterized by two parameters: the polariza-tion direction of the first arriving shear wave at the Earth’s surface(ϕ, the fast direction, in degrees), and the time lag between the twoshear waves (�, the delay time, in seconds). Basically, the fast direc-tion of shear wave splitting in the mantle is generally assumed to bethe horizontal projection of the olivine a-axis. Thus, observations ofseismic anisotropy can be used to constrain the orientation of thelocal strain field within the mantle. The delay time depends on thethickness of the anisotropic layer and the magnitude of anisotropywithin the layer.
There are many processes that can contribute to subductionzone anisotropy, including corner flow in the mantle wedge, flowbeneath the slab of subducted lithosphere, flow around the slabedge, the generation and migration of melt, and anisotropic struc-ture in the slab itself or in the overriding plate (for a review, see Parkand Levin, 2002). Because of the ambiguity of which processes arecontributing to the observed anisotropy, and because shear wavesplitting is a path-integrated measurement with generally poordepth resolution, interpretation of shear wave splitting measure-ments in subduction zones is still under controversy. In particular,the interpretation of fast splitting directions that are parallel to thetrench (that is, perpendicular or at a large angle to the convergencedirection) is a matter of debate.
The shear wave polarization anisotropy in the mantle wedgeportion has been investigated by many researchers in various sub-
duction zones worldwide (e.g., Nakajima and Hasegawa, 2004).The leading shear wave polarization direction varies among dif-ferent subduction zones. Fast directions that are oriented nearlynormal to the trench have been reported, for example, in subduc-tion zones of Tonga (Fischer and Wiens, 1996), Izu–Bonin (Fouchand Fischer, 1996) and Mariana (Fouch and Fischer, 1998). Thosethat are sub-parallel to the trench have also been reported in NewZealand (Audoine et al., 2000) and the Shumagin Island section ofthe Aleutian (Yang et al., 1995). In addition, complex patterns of fastdirections have been observed in northeastern (NE) Japan (Okadaet al., 1995; Nakajima and Hasegawa, 2004), central Japan and theKanto area (Fouch and Fischer, 1996; Hiramatsu et al., 1998; Salahet al., 2008), central South America (Polet et al., 2000), south centralAlaska (Wiemer et al., 1999), the Lau backarc (Smith et al., 2001),Kamchatka (Levin et al., 2004) and in the north of New Zealand(Morley et al., 2006).Many researchers studied the seismic anisotropy structurebeneath central-southwest Japan and found different orientationsof the fast polarization directions (e.g. Ando et al., 1983; Iidakaand Obara, 1994, 1995; Fouch and Fischer, 1996; Hiramatsu etal., 1998; Long and van der Hilst, 2005). Major features of these
ynamics 46 (2008) 21–37
previous studies will be briefly explained in Section 4.3 to com-pare them with the main findings in this study. Recently, Salah etal. (2008) conducted shear wave splitting measurements beneathcentral and southwest Japan from local shallow- and intermediate-depth earthquakes occurring in the subducting Philippine Sea (PHS)slab. The study also includes shallow events in the Pacific slabbeneath Kanto. The crustal anisotropy from the shallow events intheir study shows fast directions which are more or less alignedin the �Hmax directions, implying that the anisotropy is producedby the alignment of the vertical cracks in the crust induced by thecompressive stresses. Results from the intermediate-depth events,on the other hand, show a noticeable contribution from the uppermantle anisotropy and are characterized by a complex pattern hav-ing NW, NE and EW fast directions beneath Kanto, which mightbe produced by complex corner flows induced by both the WNWPacific plate subduction and the oblique NNW PHS slab subduction,with the associated olivine LPO. These various results encourage usto re-examine the seismic anisotropy structure beneath the centraland southwestern Japan subduction zone from local earthquakesoccurring in the Pacific slab.
In this study, we use direct S-wave splitting observationsfrom earthquakes that originate in the subducting Pacific plateto constrain crustal and upper mantle anisotropy beneath cen-tral and southwest Japan (Fig. 1). The Pacific plate is subductingbeneath central and northeastern Japan along the Japan–Izu–Bonintrenches, while the young PHS plate is subducting to the north-west beneath southwest Japan along the Nankai Trough (Seno etal., 1993, 1996). The Izu Peninsula on the PHS plate is colliding withcentral Japan (Matsuda, 1978). Active arc volcanoes form a distinctvolcanic front in Hokkaido–northern Honshu and Kyushu, and areassociated with the subduction of the Pacific and the PHS plates(Fig. 1). Quaternary volcanoes also exist along the coast of the Seaof Japan of southwest Honshu (Yokoyama et al., 1987). This regionoffers a good opportunity to investigate seismic anisotropy withinan active convergent margin, upon which patterns of mantle straincan be inferred and constraints on mantle dynamics can be placed.
2. Data and methods
We utilize data from the F-net (Fig. 2); a network of 82broadband seismic stations that is administered by the JapaneseNational Research Institute for Earth Sciences and Disaster Preven-tion (NIED). This seismic network was installed in or before 2001and was collectively known as the FREESIA array (e.g., Fukuyama et
al., 1998; Okada et al., 2004). We have processed data for a subsetof 42 stations of the F-net array which are located in the presentstudy area. F-net data are made available at the website by NIED(www.fnet.bosai.go.jp). Despite relatively high levels of culturalnoise in Japan and the proximity of many F-net stations to the ocean,the data quality of F-net stations is generally very high. Coverage ofF-net seismic stations is particularly good in Kanto, Izu–Tokai, andKii Peninsula regions, but relatively sparse near the Japan Sea coastand in the westernmost part of the study area (Fig. 2). We analyzelocal S phases from shallow, intermediate, and deep slab earth-quakes with M ≥ 3.0 that occurred from January 2000 to September2006 in the subducting Pacific plate beneath central and south-west Japan. A map of the 198 events used in this study both inplan view and in a cross-section is shown in Fig. 3. There is abun-dant intermediate-depth seismicity beneath the Kanto–Izu, andthe Tokai–Kii Peninsula regions. Because both the Pacific and PHSplates subduct underneath the Kanto region, causing complex seis-mic activities in the upper mantle (e.g., Noguchi, 1998; Hori, 2006),some shallow events in this region might also occur in the subduct-ing PHS slab (Hori, 2006; see also Salah et al., 2008). These possibleevents are excluded from the present analysis.
M.K. Salah et al. / Journal of Geodynamics 46 (2008) 21–37 23
Fig. 2. Geographical distribution of the 42 F-net seismic stations (solid circles) usedin the present study. Three capital letters beside each symbol denote the stationcode.
splitting parameter pairs (fast polarization direction and delaytime).
In order to determine the shear wave splitting parameters ϕ and� (the polarization direction of the fast shear wave arrival in degreesand the time separation between the two orthogonal componentsin seconds, respectively), we use the cross-correlation method (e.g.,
Fig. 1. (a) Distribution of the active and Quaternary volcanoes (solid and open tri-angles, respectively) on the Japan islands. Curved lines show the trenches, whichrepresent the major plate boundaries around the Japanese region with triangles inthe side of the subducting plate. Names of major districts are shown. (b) Index mapof the Japanese islands showing the relative plate motions (Seno et al., 1993, 1996).
We apply a four-pole Butterworth band-pass filter with cornerfrequencies at 0.01 and 1.00 Hz to the waveform data, and win-dow around the direct S phase. Records were visually inspected forhigh signal/noise ratio and waveform clarity. We restrict our anal-ysis to ray paths with free surface incident angles of 35◦ or lessto avoid contamination of particle motions by converted phases(Nuttli, 1961; Evans, 1984). This is a serious restriction in obtain-ing a complete coverage for the shear wave analysis. Nevertheless,we could obtain quite good data coverage in many regions suchas Kanto, Izu, Tokai, and Kii Peninsula owing to the presence ofmany seismic stations and the intense seismic activity. Throughoutthe analysis scheme, we examine more than 6000 seismograms,and exclude those which do not meet the above criteria. Thisprocess limits the number of measurements to 980 good-quality
Fig. 3. (a) Epicentral distribution of the 198 events used in this study shown ascircles. Event symbols vary in color according to focal depth and in size according tomagnitude. (b) Cross-sectional view of the used events along the longitude direction.

24 M.K. Salah et al. / Journal of Geodynamics 46 (2008) 21–37
Fig. 4. An example of seismograms of a deep earthquake observed at station SGNin the north of Izu Peninsula. Hypocentral parameters are shown above the seismo-grams. (a) and (b) are the observed NS and EW components, respectively. (c) and(d) are the N115◦E slow component and the N205◦E fast components, respectively.Note how this rotation angle along with a time shift of 0.25 s (delay time) producessimilar waveforms in (c) and (d) compared to those at (a) and (b). (e) Original par-ticle motion for the time window shown in (a) and (b). (f) Particle motion for thetime window in (c) and (d) corrected by removing the splitting effects. Obtained fastdirection and delay time in this example are N25◦E and 0.25 s, respectively.
Fukao, 1984; Okada et al., 1995; Nakajima and Hasegawa, 2004, andothers). This simple method yields an estimate of ϕ and � from thetwo horizontal components of a single seismogram. Two horizon-tal components of observed seismograms of shear wave arrivals arerotated stepwise in a horizontal plane with angles from 1◦ to 178◦
with an interval of 3◦ for a specific time window centered on the S-wave arrival. The time window selected is taken to be nearly equalto 1–2 cycles of the wave (Okada et al., 1995). The delay time �and the fast polarization azimuth ϕ which yield the maximum cor-relation are taken to be the best measurements of the time delayand the axis of symmetry (fast axis) of the anisotropic medium,respectively. The obtained polarization direction and delay timefor each seismogram are checked as follow. Anisotropy-correctedseismograms are obtained by a clockwise rotation ϕ and a rela-tive time shift �. In the absence of anisotropy the particle orbit isexpected to be linear. After passing through an anisotropic medium,the particle motion would start with a movement along the polar-ization azimuth of the maximum velocity phase and end with amovement along the azimuth of the minimum velocity phase. Theparticle motion in that case is expected to be approximately ellipti-
Fig. 5. An example of seismograms of a deep event observed at station ISI in easternShikoku. Hypocentral parameters are shown above the seismograms. (a) and (b)are the observed NS and EW components, respectively. (c) and (d) are the N1◦E slowand the N91◦E fast components, respectively. Note also how this rotation angle alongwith a time shift of 0.35 s (delay time) produces similar waveforms in (c) and (d)compared to those at (a) and (b). (e) Original particle motion for the time windowshown in (a) and (b). (f) Particle motion for the time window in (c) and (d) correctedby removing the splitting effects. Obtained fast direction and delay time are N91◦Eand 0.35 s, respectively.
cal for a long-lasting signal. Appropriate rotation and time shift willresolve the S-wave into two orthogonally polarized phases whosewaveforms are similar to each other, and hence would show a linearorbit, which is expected from the source mechanism, in the resul-tant particle motion diagram (Figs. 4 and 5). The data showing linearorbits obtained from anisotropy-corrected seismograms are used toexclude artificial results of waveforms contaminated by noise.
3. Splitting results
3.1. Splitting patterns at selected stations
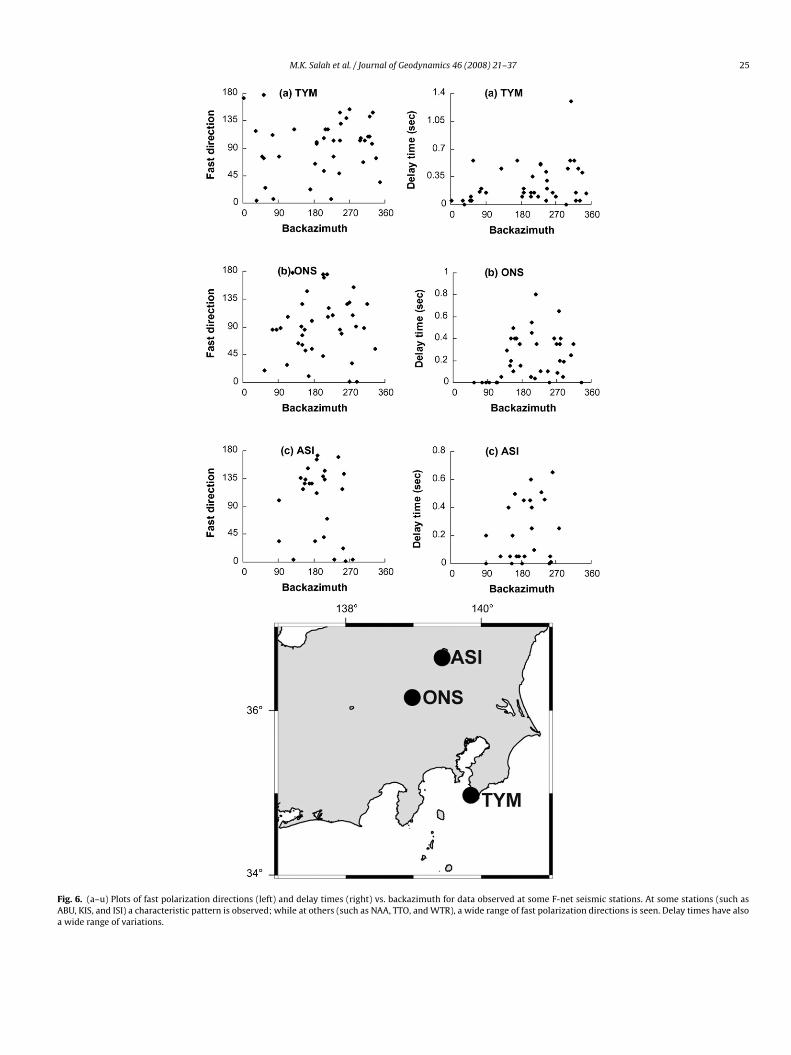
In Fig. 6, in an attempt to detect any tendency for events froma specific region around each station to have particular fast direc-tions, we plot the splitting data (the fast polarization directionsand delay times) against the backazimuth (the horizontal direc-tion measured from north from a receiver to the epicenter of anearthquake) for 21 representative seismic stations in Kanto, IzuPeninsula, Tokai, Chubu, Kii Peninsula, and the eastern part ofShikoku. Fig. 7 shows the rose diagrams of the data obtained at 24
M.K. Salah et al. / Journal of Geodynamics 46 (2008) 21–37 25
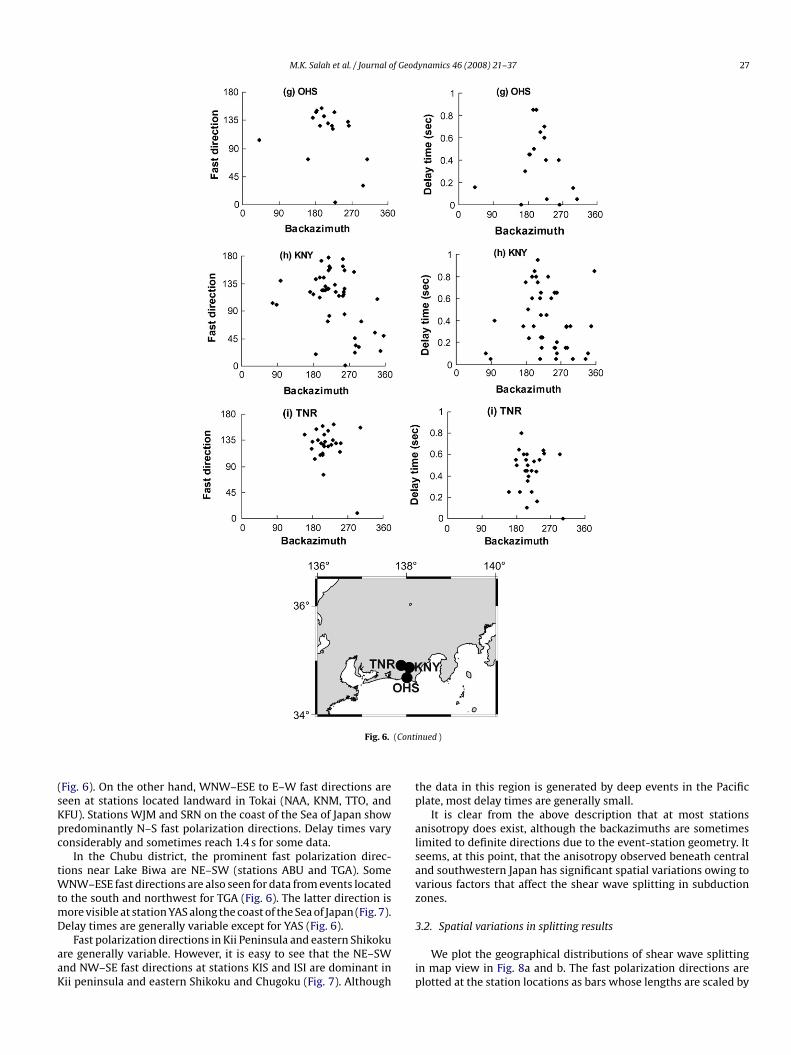
Fig. 6. (a–u) Plots of fast polarization directions (left) and delay times (right) vs. backazimuth for data observed at some F-net seismic stations. At some stations (such asABU, KIS, and ISI) a characteristic pattern is observed; while at others (such as NAA, TTO, and WTR), a wide range of fast polarization directions is seen. Delay times have alsoa wide range of variations.

26 M.K. Salah et al. / Journal of Geodynamics 46 (2008) 21–37
Fig. 6. (Cont
stations. Because of the intense seismic activity in Kanto–Izu and inTokai–Kii Peninsula as well as the relatively dense seismic stationsin these areas, we are able to characterize the splitting pattern ingood detail. It is obvious from a visual inspection of Figs. 6 and 7,that a wide range of splitting behavior is observed at F-net stations.
At stations TYM, ONS, and ASI which are located in the Kantodistrict (inset maps in Fig. 6), there is no clear systematic patternin the fast polarization directions with respect to the backazimuth.However, the dominant direction is NW–SE especially from eventslocated to the south and the southwest. NNE–SSW fast polarizationdirections are also observed at station ONS which are located in thecenter of the land area near the volcanic front. Delay times at these
inued )
stations are intermediate and do not exceed 0.7 s for the majorityof the data.
In Izu Peninsula, the dominant fast directions at station FUJare NW–SE, although minor NE–SW fast directions are also seen(Figs. 6 and 7). At JIZ, fast directions are diverse from E–W to N–S,with some NE–SW fast directions. Further inland, station SGN alsoshows dominantly NW–SE fast polarization directions. Delay timesare generally variable and sometimes reach more than 1.0 s, espe-cially for the data from events located to the southwest (Fig. 6). Inthe Tokai region, we see a predominance of the NW–SE fast polar-ization directions at stations located in the southern part (OHS, KNY,and TNR) for data from events located to the south and southwest
M.K. Salah et al. / Journal of Geodynamics 46 (2008) 21–37 27
Fig. 6. (Cont
(Fig. 6). On the other hand, WNW–ESE to E–W fast directions areseen at stations located landward in Tokai (NAA, KNM, TTO, andKFU). Stations WJM and SRN on the coast of the Sea of Japan showpredominantly N–S fast polarization directions. Delay times varyconsiderably and sometimes reach 1.4 s for some data.
In the Chubu district, the prominent fast polarization direc-tions near Lake Biwa are NE–SW (stations ABU and TGA). SomeWNW–ESE fast directions are also seen for data from events locatedto the south and northwest for TGA (Fig. 6). The latter direction ismore visible at station YAS along the coast of the Sea of Japan (Fig. 7).Delay times are generally variable except for YAS (Fig. 6).
Fast polarization directions in Kii Peninsula and eastern Shikokuare generally variable. However, it is easy to see that the NE–SWand NW–SE fast directions at stations KIS and ISI are dominant inKii peninsula and eastern Shikoku and Chugoku (Fig. 7). Although
inued )
the data in this region is generated by deep events in the Pacificplate, most delay times are generally small.
It is clear from the above description that at most stationsanisotropy does exist, although the backazimuths are sometimeslimited to definite directions due to the event-station geometry. Itseems, at this point, that the anisotropy observed beneath centraland southwestern Japan has significant spatial variations owing tovarious factors that affect the shear wave splitting in subductionzones.
3.2. Spatial variations in splitting results
We plot the geographical distributions of shear wave splittingin map view in Fig. 8a and b. The fast polarization directions areplotted at the station locations as bars whose lengths are scaled by

28 M.K. Salah et al. / Journal of Geodynamics 46 (2008) 21–37
Fig. 6. (Cont
the delay time. In these maps, we notice significant variations inthe character of splitting behavior from station to station imply-ing that at least some of the observed splitting has a shalloworigin.
The stations in Kanto, Izu, and eastern Tokai show prominentlytwo fast polarization directions: NW–SE and NE–SW. The former is,however, more developed than the latter especially in Izu Peninsulaand Tokai regions (Fig. 8a). Moving westward to Kii Peninsula andLake Biwa regions, the predominant fast polarization direction isNE–SW (Fig. 8b). In Shikoku and Chugoku regions, the number ofstations having reliable observations is too few to judge any majororientation of the fast polarization directions. This larger variationin splitting behavior in Kanto–Tokai regions could be due to thecomplex tectonic setting in these regions as both the Pacific and
inued )
PHS plates overlap each other and subduct beneath this region (e.g.,Noguchi, 1998; Hori, 2006).
In order to get more consistent fast polarization directions fora proper interpretation, we define the main- and sub-fast direc-tions (MFD) and (SFD) for each rose diagram (like those of Fig. 7) inthe same way as Nakajima and Hasegawa (2004). A window withan angle of 30◦ is set in a rose diagram and is gradually shiftedby an interval of 15◦. The frequency of fast directions in each win-dow is calculated, and the central direction of the window with themaximum frequency of fast directions is selected as an MFD at thestation. An SFD at each station is also calculated in the same manner,but a central direction of the window with the second maximumfrequency of fast directions is selected. The obtained MFD and SFDare, respectively, indicated by thick and thin black lines in Fig. 9.

M.K. Salah et al. / Journal of Geodynamics 46 (2008) 21–37 29
Fig. 6. (Cont
Except at a few locations near the volcanic front and in Shikoku,the MFD and SFD for the majority of stations show approximatelysimilar trends. In the Kanto–Izu–Tokai area, the major fast polar-ization direction is NW–SE with some scatters in the central partof the land area. In the southwestern part of Japan, the distribu-tion of MFD and SFD, however, show less scatter and mainly haveNE–SW fast directions. A striking feature in Fig. 9 is the consistentNW–SE fast polarization direction in the Tokai area along the coastof the Pacific Ocean. In general, these results are consistent withthose obtained by Long and van der Hilst (2005), although theyused different data set such as the teleseismic S, SKS, and SKKSphases.
inued )
4. Discussion
4.1. Observed splitting in the Kanto area
The majority of the selected events in the Kanto area east of lon-gitude ∼139.5–140◦ E are shallower than 70 km. Therefore, pathsfrom events in this region travel primarily through the subductingslabs and the overlying crust and largely miss the mantle wedge(Fig. 3b). Observed splitting times are generally low, being around0.1–0.2 s. Consequently, the observed weak splitting in this regionis mainly of crustal origin with probably minor contributions fromslab anisotropy.

30 M.K. Salah et al. / Journal of Geodynamics 46 (2008) 21–37
Fig. 6. (Cont
Many fast polarization directions in the Kanto area are orientedmore or less WNW–ESE which are sub-parallel to the subduc-tion direction of the Pacific plate. In addition, some fast directionsare oriented NNE–SSW, which are parallel to the Japan Trench.Hence, both convergence-parallel and convergence-perpendicularfast directions are simultaneously observed. Iidaka and Obara(1995) detected a weak seismic anisotropy in this region (east ofthe volcanic front) from a large deep earthquake beneath SakhalinIsland with NE–SW and NW–SE main fast directions.
Salah et al. (2008) in their study of the mantle wedge anisotropyabove the subducting PHS slab, observed NE–SW, NW–SE, and E–Wfast polarization directions from shallow and intermediate-depthevents occurring in the PHS and Pacific slabs in the Kanto arearecorded at the Hi-net seismic stations. The area they studied cor-
inued )
responds to the shallower portion of the wedge above the PHSand Pacific slabs. The pattern of the fast polarization directions issimilar, however, to that shown in Fig. 8a. On the other hand, thesplitting times they obtained fall in the range 0.1–0.3 s, which aresmall compared to those observed in this study.
4.2. Observed splitting in southwest Japan
Fast polarization directions in southwest Japan are mainly ori-ented NW–SE in Izu–Tokai and ENE–WSW in the Kii Peninsulaand the Chubu districts. The former is sub-parallel to the subduc-tion direction of the Pacific plate, whereas the latter is oblique tothe subduction direction and may even be closer to the directionperpendicular to the subduction direction. Moreover, it is rather

M.K. Salah et al. / Journal of Geodynamics 46 (2008) 21–37 31
Fig. 6. (Conti
close to the strike of the Nankai Trough. Fouch and Fischer (1996)detected a similar pattern in central Honshu, where WNW–ESE fastpolarization directions in the Tokai region are clearly recognized(Fig. 10). Similar splitting patterns in southwest Japan have alsobeen reported by Long and van der Hilst (2005) using teleseismicdata. Salah et al. (2008) observed NW–SE and NE–SW fast direc-tions in the wedge above the PHS slab. The splitting times are lessthan 0.4 s, which are smaller than those observed in this study.
nued ).
4.3. Interpretation
In subduction zones, anisotropy may occur in the crust, thedown-going slab, or the region between the upper slab surfaceand the Moho, which is called the mantle wedge. Fig. 11 illustratesthe relation between splitting times and focal depths of the stud-ied events. There is a slight tendency of increased splitting timesfor the deep (350–400-km depth) events. However, the correlation

32 M.K. Salah et al. / Journal of Geodynamics 46 (2008) 21–37
Fig. 7. Examples of rose diagrams of the observed fast polarization directions at some selected F-net seismic stations in central and southwest Japan. Three capital lettersabove each rose diagram denote the station code. Two digits to the lower right indicate the number of observations, and the average delay time in seconds, respectively.

M.K. Salah et al. / Journal of Geodynamics 46 (2008) 21–37 33
Fig. 7. (Continued ).

34 M.K. Salah et al. / Journal of Geodynamics 46 (2008) 21–37
Fig. 8. Splitting vectors for all observed data plotted at the station locations (smallopen circles) in Kanto–Izu-E. Tokai (a) and in W. Tokai and SW Japan (b). The majorplate boundaries and the distribution of active and Quaternary volcanoes are shown.The direction of a bar indicates the fast polarization direction and its length is scaledto the delay time. A bar with a delay time of 0.50 s is shown to the upper right in (a)and in the lower right in (b).
Fig. 9. Distribution of main- and sub-fast directions (MFD and SFD) at each stationshown by thick and thin black bars, respectively (see text for details). Length of eachthin bar is normalized relative to the frequency of MFD. Solid and open trianglesdenote active and Quaternary volcanoes. Thin and thick curved lines show majorplate boundaries around Japan, and the volcanic front, respectively.
Fig. 10. Observed fast directions (ϕ) and splitting times (�) of Fouch and Fischer(1996) around Japan from local S phases generated by events with focal depths of150–430 km plotted at the midpoint of the source-receiver path. Dark and light linesbisected by arrows represent the 95% confidence limits for both ϕ and �. Crossesshow hypocenters and the black symbols denote station locations. Large vectordenotes the direction of absolute Pacific plate motion (Gripp and Jordon, 1990). Notethat some fast directions are parallel to the Japan Trench, while others are parallelto the Pacific plate subduction direction.

M.K. Salah et al. / Journal of Geod
Fig. 11. Average delay times (s) plotted against source depth (km) for all events. Ageneral tendency of increasing delay times with the increase of source depth can beseen.
coefficient between depth and delay time is small (R = 0.55), andnot significant. Rather, the results seem to indicate that most split-ting times are produced at a shallow depth range (0–200 km). Theresults also indicate that not much splitting is produced by crustalanisotropy, because anisotropy located solely in the crust wouldproduce a uniform � for events deeper than 50 km at the sameincidence angle (Yang et al., 1995). Additionally, splitting timesattributed to crustal anisotropy are typically much smaller thanthose attributed to upper mantle anisotropy (Silver, 1996; Savage,1999) due to the much shorter path lengths in the crust comparedto those in the upper mantle. On the basis of the splitting timesfor the shallow events in the Kanto area, we estimate that crustalanisotropy can account for as much as 0.1–0.2 s of the observedsplitting, and may even be smaller (Kaneshima, 1990; Salah et al.,2008). Consequently, we assign the observed splitting at F-net sta-tions beneath Kanto–Tokai–southwest Japan to the mantle wedgeanisotropy.
From the splitting maps (Figs. 8 and 9), we have seen that fastdirections in Kanto area are oriented either parallel to the Pacificplate subduction direction or sub-parallel to the Japan Trench. TheNW–SE fast directions seen in the Kanto region are consistent withthe flow induced by the subduction of the Pacific slab, if the olivineA-fabric is aligned in the flow direction. However, the NE–SW andE–W fast directions are simultaneously observed. This indicates
that the flow beneath this region is more complex, which may bedue to the oblique subduction of the PHS slab in the NNW direction,as discussed by Salah et al. (2008). For example, the corner flow pre-dicted due to this oblique subduction is trench-normal (i.e., NE) inthe shallow portion of the wedge and trench-parallel (i.e., NW) inthe deeper portion.The observed ENE fast directions beneath Kii Peninsula andsouthwest Japan are difficult to explain by the flow induced bythe Pacific plate subduction (Fig. 1b). They are neither parallelnor perpendicular to the subduction direction. Long and van derHilst (2005) also found similar directions in this area. They arerather parallel to the Nankai Trough, and similar to that observedin the wedge above the PHS slab (Salah et al., 2008), suggestingthat this is partly caused by the B-type olivine fabric induced bythe subduction of the PHS slab. However, the splitting times ofSalah et al. (2008) are only around 30–50% of those observed inthe present study, thus not all the anisotropy can be explainedby the subduction of the PHS slab. These may originate fromflow below the PHS slab, but the pattern of such flow inducedby the WNW Pacific slab subduction would not be a simpleone.
ynamics 46 (2008) 21–37 35
The present study shows the N–S, E–W and NW fast directionsin the northern, central and Tokai regions of central Honshu. Andoet al. (1983), using data from intermediate-depth and deep earth-quakes, detected north and east fast polarization directions in thewedge portion of the upper mantle in the northern and centralparts of central Honshu, respectively. A similar pattern of ∼N–Sfast directions in the northern region and ∼E–W fast directions inthe central region of central Honshu, have also been detected byHiramatsu et al. (1998) using waveforms generated from local deepearthquakes in the region. Fouch and Fischer (1996) also found asimilar pattern in central Honshu. Moreover, they found WNW–ESEfast polarization directions in the Tokai region (Fig. 10). We foundmany similarities between these studies and our results. The pat-tern of the fast directions in Tokai in central Honshu is more or lessparallel to the Pacific plate subduction direction (Fig. 1b). On theother hand, the N–S fast direction in the northern part of centralHonshu is perpendicular to this direction. Even if the NW–SE fastdirections in Tokai are consistent with the Olivine A-fabric asso-ciated with the flow induced by the Pacific plate subduction, it isobviously difficult to interpret the N–S fast directions by the OlivineB-fabric because in such a deep portion of the mantle wedge thetemperature is higher and the stress is lower.
Another way to explain the trench-parallel fast directions innorthern central Honshu might be flow in the wedge turned aroundfrom the slab edge due to slab rollback, which has been proposedin other regions and on the basis of laboratory or numerical experi-ments (Russo and Silver, 1994; Buttles and Olsen, 1998; Kincaid andGriffiths, 2003; Schellart, 2004; Stegman et al., 2006). However, inthe Japan–Bonin trench system, the lateral length of the Pacific slabis very large and, accordingly, no flow would be expected to turnaround. Furthermore, the Pacific slab is not retreating but advanc-ing (e.g., Schellart et al., 2007). The advancing slab would producea flow in the wedge directed SE along the Bonin Trench trend, how-ever, which is not consistent with the N–S fast directions. Recently,it has been observed that curved 3D geometry of the slab with fixedtrench shows stretching of the wedge in the direction parallel tothe trench, resulting in fast polarization directions in this direction(Kneller and van Keken, 2007). Because the slab subducting beneaththe junction between the Japan and Bonin Trenches has a curvedshape, this could be a possible mechanism for the trench-parallelfast direction beneath northern central Japan. However, we have toawait future more detailed studies to conclude this.
5. Conclusions
We investigate shear wave splitting in direct S phases from localevents recorded by the Japanese broadband F-net seismic stations.We obtain 980 splitting parameter pairs (fast polarization directionand delay time) for central and southwestern Japan. The measuredsplitting pattern is generally complicated beneath Kanto. However,dominant fast polarization directions of shear waves obtained atmost stations in the Kanto area are oriented WNW–ESE, which aresub-parallel to the subduction direction of the Pacific plate. Fastdirections are also seen in the NE–SE and E–W directions. BeneathKanto, the slab morphology is relatively complicated as the PHSplate is subducting obliquely and is overriding the Pacific slab. Thiscomplex tectonic setting may induce complex patterns of the flowin the mantle wedge, probably causing multiple fast directions.
Fast directions obtained at stations located in Kii Peninsula andthe Chugoku district are generally oriented ENE–WSW, neither par-allel to or perpendicular to the subduction direction of the Pacificplate. These are rather parallel to the Nankai Trough, and may beinduced partly by the olivine B-fabric induced by the subductionof the PHS plate. However, the anisotropy above the PHS slab canexplain 30–50%, at most, of the observed anisotropy (Salah et al.,

f Geod
36 M.K. Salah et al. / Journal o2008), and the remaining would be due to the flow beneath the PHSslab and above the Pacific slab. The nature of this flow might not beas simple as expected from the corner flow induced by the Pacificplate subduction.
The N–S, E–W, and NW fast directions seen in northern, cen-tral, and southern (Tokai) regions of central Honshu are consistentwith the previous studies. Although the NW fast directions in Tokaimight be explained by the olivine A-fabric induced by the cornerflow of the Pacific plate subduction, as in Kanto, it is difficult toexplain the N–S direction in central Honshu by a simple flow pat-tern in the mantle wedge. The lateral flow in the wedge due toslab migration (e.g., Schellart, 2004) seems unlikely to explain theobserved fast directions. The effect of the curved slab to the stretch-ing of the wedge (Kneller, 2007) is one possibility to explain theanisotropy because the slab is curved at the Japan–Bonin Trenchjunction. Further detailed shear wave splitting observations atmuch denser seismic networks beneath central and southwestJapan are necessary for a better understanding of the anisotropystructure and its relation with tectonics and the stress state andinduced mantle flow of the wedge.
Acknowledgements
The authors thank the Japanese National Research Institute forEarth Science and Disaster Prevention (NIED) for making F-netdata available and easily accessible on the web. Critical reviewsby W.P. Schellart and J. Conder greatly improved the manuscript.Most figures in this paper were produced using Generic MappingTools (GMTs) software written by Wessel and Smith (1998). M.K.Salah thanks the Japan Society for the Promotion of Science (JSPS)for a Postdoctoral Fellowship (2005/2007) to conduct research atthe Earthquake Research Institute, University of Tokyo, where thisresearch work was achieved.
References
Ando, M., Ishikawa, Y., Yamazaki, F., 1983. Shear wave polarization anisotropyin the upper mantle beneath Honshu, Japan. J. Geophys. Res. 88,5850–5864.
Audoine, E., Savage, M.K., Gledhill, K., 2000. Seismic anisotropy from local earth-quakes in the transition region from a subduction to a strike-slip plate boundary,New Zealand. J. Geophys. Res. 105, 8013–8033.
Buttles, J., Olsen, P., 1998. A laboratory model of subduction zone anisotropy. EarthPlanet Sci. Lett. 164, 245–262.
Currie, C.A., Cassidy, J.F., Hyndman, R.D., Bostock, M.G., 2004. Shear wave anisotropybeneath the Cascadia subduction zone and western North American craton.
Geophys. J. Int. 157, 341–353.Evans, R., 1984. Effects of the free surface on shear-wave trains. Geophys. J. R. Astron.Soc. 76, 165–172.
Fischer, K.M., Wiens, D.A., 1996. The depth distribution of mantle anisotropy beneaththe Tonga subduction zone. Earth Planet Sci. Lett. 164, 245–262.
Fouch, M.J., Fischer, K.M., 1996. Mantle anisotropy beneath northwest Pacific sub-duction zones. J. Geophys. Res. 101, 15987–16002.
Fouch, M.J., Fischer, K.M., 1998. Shear wave anisotropy in the Mariana subductionzone. Geophys. Res. Lett. 25, 1221–1224.
Fouch, M.J., Fischer, K.M., Parmentier, E.M., Wysession, M.E., Clarke, T.J., 2000. Shearwave splitting, continental keels, and patterns of mantle flow. J. Geophys. Res.105, 6255–6275.
Fukao, Y., 1984. Evidence from core-reflected shear waves for anisotropy in theEarth’s mantle. Nature 309, 695–698.
Fukuyama, E., Ishida, S., Dreger, D.S., Kawai, H., 1998. Automated seismic momenttensor determination by using online broadband seismic waveforms. Zisin 51,149–156.
Gripp, A.E., Jordon, R.G., 1990. Current plate velocities relative to the hotspotsincorporating the NUVEL-1 global plate motion model. Geophys. Res. Lett. 17,1109–1112.
Hiramatsu, Y., Ando, M., Tsukuda, T., Ooida, T., 1998. Three-dimensional imageof anisotropic bodies beneath central Honshu, Japan. Geophys. J. Int. 135,801–816.
Hori, S., 2006. Seismic activity associated with the subducting motion of thePhilippine Sea plate beneath the Kanto district, Japan. Tectonophysics 417,85–100.
Iidaka, T., Obara, K., 1994. Shear wave polarization anisotropy in the upper mantlefrom a deep earthquake. Phys. Earth Planet Int. 82, 19–25.
ynamics 46 (2008) 21–37
Iidaka, T., Obara, K., 1995. Shear wave polarization anisotropy in the man-tle wedge above the subducting Pacific plate. Tectonophysics 249,53–68.
Jung, H., Karato, S., 2001. Water-induced fabric transitions in olivine. Science 293,1460–1463.
Kaneshima, S., 1990. Origin of crustal anisotropy: shear wave splitting studies inJapan. J. Geophys. Res. 95, 11121–11133.
Karato, S., 1987. Seismic anisotropy due to lattice preferred orientation of miner-als: kinematic or dynamic? In: Manghnani, M.H., Syono, Y. (Eds.), High PressureResearch in Mineral Physics, AGU, Washington, DC, Geophys. Monogr. Ser., 39,455–471.
Karato, S., 2003. Mapping water content in the upper mantle, In: Eiler, J.M. (Ed.),Inside the Subduction Factory, Am. Geophys. Union, Geophys. Monogr. Ser.,138.
Kincaid, C., Griffiths, R.W., 2003. Laboratory models of the thermal evolution of themantle during rollback subduction. Nature 425, 58–62.
Kneller, E.A., van Keken, P.E., 2007. The Effects of 3-D Slab Geometry on Deformationin the Mantle Wedge. EGU General Assembly.
Kneller, E.A., van Keken, P.E., Karato, S., Park, J., 2005. B-type olivine fabric in themantle wedge: insights from high-resolution non-Newtonian subduction zonemodels. Earth Planet Sci. Lett. 237, 781–797.
Levin, V., Droznin, D., Park, J., Gordeev, E., 2004. Detailed mapping of seismicanisotropy with local shear waves in southeastern Kamchatka. Geophys. J. Int.158, 1009–1023.
Levin, V., Menke, W., Park, J., 1999. Shear wave splitting in the Appalachiansand the Urals: a case for multi-layered anisotropy. J. Geophys. Res. 104,17975–17993.
Long, M.D., van der Hilst, R.D., 2005. Upper mantle anisotropy beneath Japan fromshear wave splitting. Phys. Earth Planet Inter. 151, 206–222.
Matsuda, T., 1978. Collision of the Izu–Bonin arc with central Hon-shu: cenozoic tectonics of the Fossa Magna, Japan. J. Phys. Earth 26,409–421.
Morley, A.M., Stuart, G.W., Kendall, J.M., Reyners, M., 2006. Mantle wedge anisotropyin the Hikurangi subduction zone, central North Island, New Zealand. Geophys.Res. Lett. 33, L05301, doi:10.1029/2005GL024569.
Nakajima, J., Hasegawa, A., 2004. Shear wave polarization anisotropy andsubduction-induced flow in the mantle wedge of northern Japan. Earth PlanetSci. Lett. 225, 365–377.
Nicolas, A., Christensen, N.I., 1987. Formation of anisotropy in upper mantle peri-dotite: a review. In: Fuchs, K., Froidevaux, C. (Eds.), Composition, Structure,and Dynamics of the Lithosphere–Asthenosphere System, Am. Geophys. Union,Geodyn. Ser., 16, 111–123.
Noguchi, S., 1998. Seismicity, focal mechanisms and location of volcanic front asso-ciated with the subducting Philippine Sea and Pacific plates beneath the Kantodistrict. Bull. Earthq. Res. Inst. 73, 73–103.
Nuttli, O., 1961. The effect of the Earth’s surface on the S wave particle motion. Bull.Seismol. Soc. Am. 51, 237–246.
Okada, T., Matsuzawa, T., Hasegawa, A., 1995. Shear wave polarization anisotropybeneath the northeastern part of Honshu, Japan. Geophys. J. Int. 123,781–797.
Okada, Y., Kasahara, K., Hori, S., Obara, K., Sekiguchi, S., Fujiwara, H., Yamamoto, A.,2004. Recent progress of seismic observation networks in Japan Hi-net, F-net,K-net and KiK-net. Earth Planets Space 56, 15–28.
Park, J., Levin, V., 2002. Seismic anisotropy: tracing plate dynamics in the mantle.Science 296, 485–489.
Polet, J., Silver, P.G., Beck, S., Wallace, T., Zandt, G., Ruppert, R., Kind, R., Rudloff, A.,2000. Shear wave anisotropy beneath the Andes from the BANJO, SEDA, and
PISCO experiments. J. Geophys. Res. 105, 6287–6304.Russo, R.M., Silver, P.G., 1994. Trench-parallel flow beneath the Nazca plate fromseismic anisotropy. Science 263, 1105–1111.
Salah, M.K., Seno, T., Iidaka, T., 2008. Seismic anisotropy in the wedge above thePhilippine Sea slab beneath Kanto and southwest Japan derived from shear wavesplitting. J. Asi. Earth Sci., doi:10.1016/j.jseaes.2008.04.004.
Savage, M.K., 1999. Seismic anisotropy and mantle deformation: what have welearned from shear wave splitting? Rev. Geophys. 37, 65–106.
Schellart, W.P., 2004. Kinematics of subduction and subduction-induced flow in theupper mantle. J. Geophys. Res. 109, B07401, doi:10.1029/2004JB002970.
Schellart, W.P., Freeman, J., Stegman, D.R., Moresi, L., May, D., 2007. Evolution anddiversity of subduction zones controlled by slab width. Nature 446, 308–311,doi:10.1038/nature05615.
Seno, T., Sakurai, T., Stein, S., 1996. Can the Okhotsk plate be discriminated from theNorth American plate? J. Geophys. Res. 101, 11305–11315.
Seno, T., Stein, S., Gripp, A., 1993. A model for the motion of the PhilippineSea plate consistent with NUVEL-1 and geological data. J. Geophys. Res. 98,17941–17948.
Silver, P.G., 1996. Seismic anisotropy beneath the continents: probing the depths ofgeology. Annu. Rev. Earth Planet Sci. 24, 385–432.
Silver, P.G., Chan, W.W., 1991. Shear wave splitting and subcontinental mantle defor-mation. J. Geophys. Res. 96, 16429–16454.
Smith, G.P., Wiens, D.A., Fischer, K.M., Dorman, L.M., Webb, S.C., Hildebrand, J.A.,2001. A complex pattern of mantle flow in the Lau backarc. Science 292,713–716.
Stegman, D.R., Freeman, J., Schellart, W.P., Moresi, L., May, D., 2006. Influence oftrench width on subduction hinge retreat rates in 3-D models of slab rollback.Geochem. Geophys. Geosyst. 7, Q03012, doi:10.1029/2005GC001056.

M.K. Salah et al. / Journal of Geod
Vinnik, L.P., Makeyeva, L.I., Milev, A., Usenko, A.Y., 1992. Global patterns of azimuthalanisotropy and deformations in the continental mantle. Geophys. J. Int. 111,433–447.
Wessel, P., Smith, W.H.F., 1998. New improved version of generic mapping toolsreleased. EOS Trans. Am. Geophys. Union 79, 579.
Wiemer, S., Tytgat, G., Wyss, M., Duenkel, U., 1999. Evidence for shear waveanisotropy in the mantle wedge beneath south central Alaska. Bull. Seismol.Soc. Am. 89, 1313–1322.
ynamics 46 (2008) 21–37 37
Yang, X., Fischer, K.M., Abers, G.A., 1995. Seismic anisotropy beneath the ShumaginIsland segment of the Aleutian-Alaska subduction zone. J. Geophys. Res. 100,18615–18677.
Yokoyama, I., Aramaki, S., Nakamura, K., 1987. Volcanoes. Iwanami Press, Tokyo, 294pp.
Zhang, S., Karato, S., 1995. Lattice preferred orientation of olivine aggregatesdeformed in simple shear. Nature 415, 777–780.
Copyright © 2022 FDOKUMEN