CORPORATE PRESENTATION - Arca Continental
43
CORPORATE PRESENTATION
-
Upload
khangminh22 -
Category
Documents
-
view
5 -
download
0
Transcript of CORPORATE PRESENTATION - Arca Continental
C O R P O R AT E
P R E S E N TAT I O N
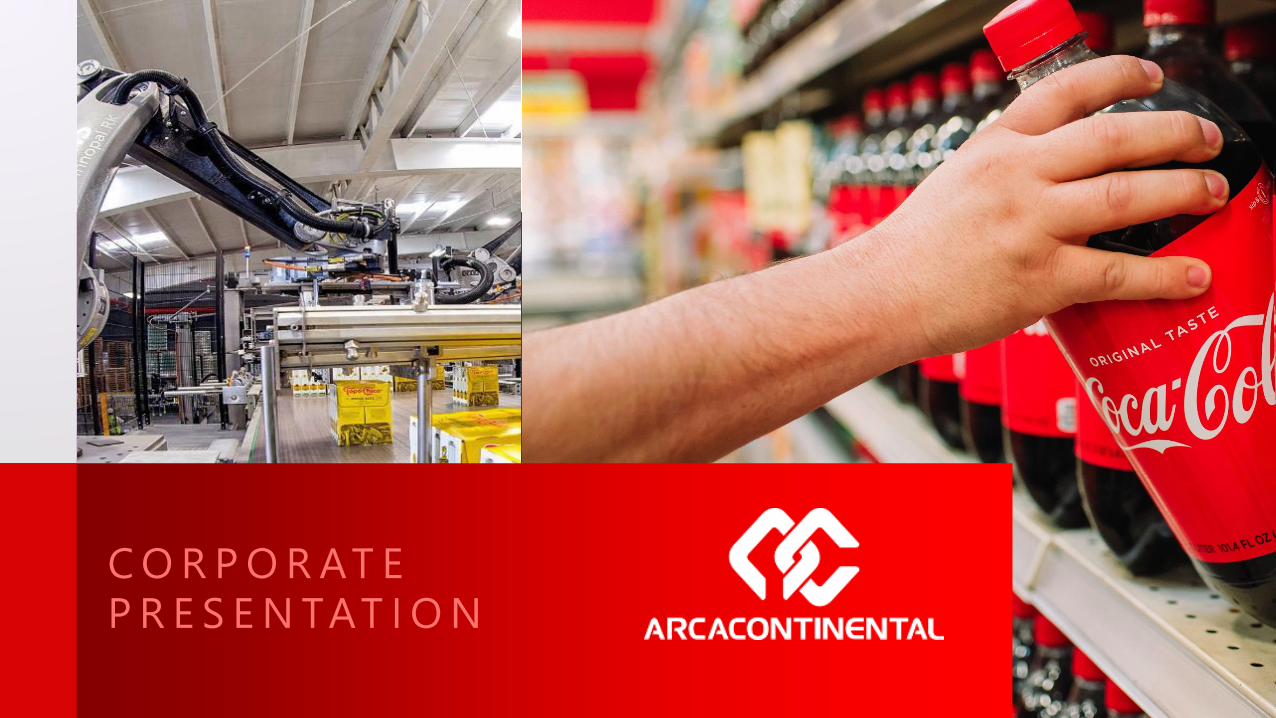
Coca-Cola pioneers in Mexico
125 YEARS
2
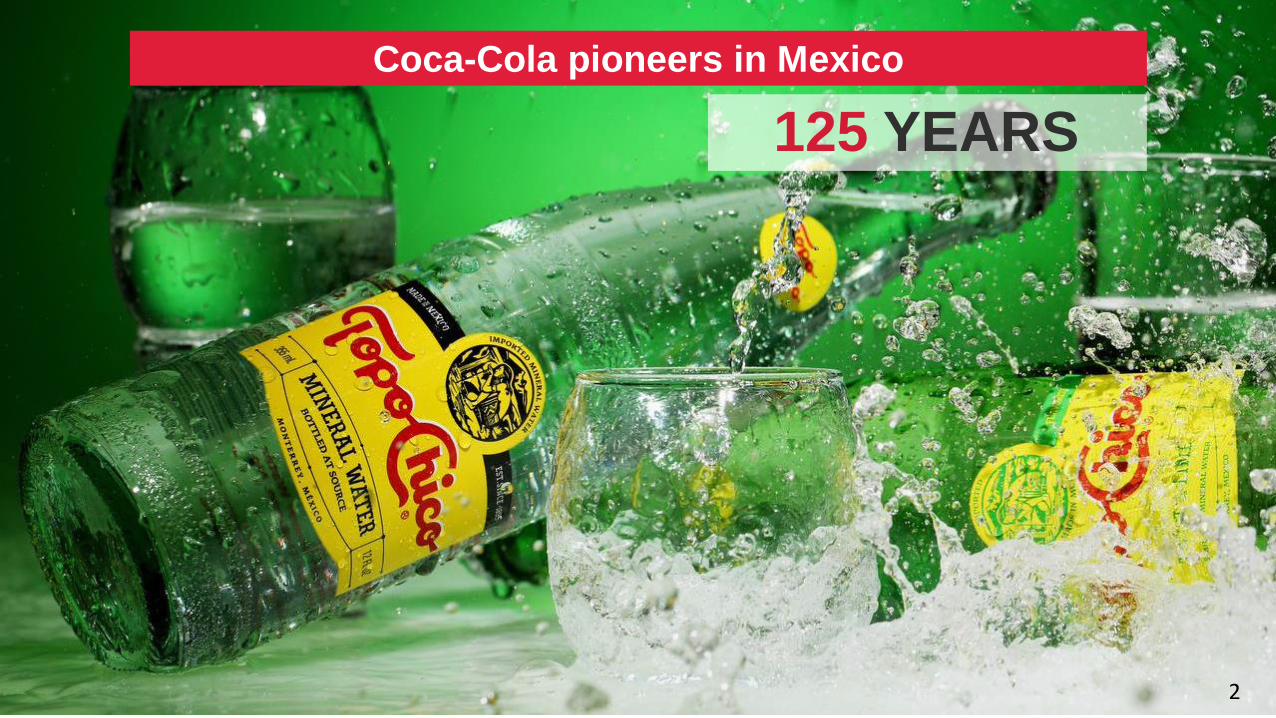
95 YEARSStrong partnership with
3
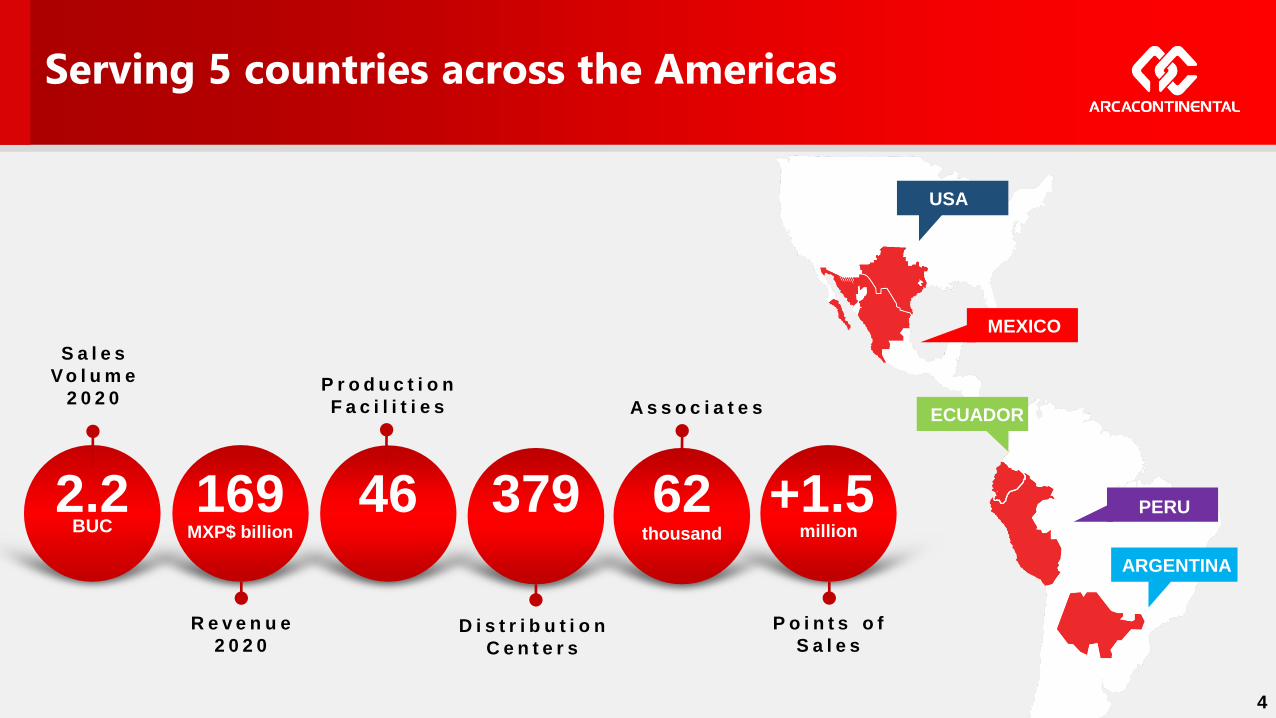
Serving 5 countries across the Americas
2.2BUC
S a l e s
V o l u m e
2 0 2 0
169MXP$ billion
R e v e n u e
2 0 2 0
46
P r o d u c t i o n
F a c i l i t i e s
379
D i s t r i b u t i o n
C e n t e r s
62thousand
A s s o c i a t e s
+1.5million
P o i n t s o f
S a l e s
USA
MEXICO
ECUADOR
PERU
ARGENTINA
4
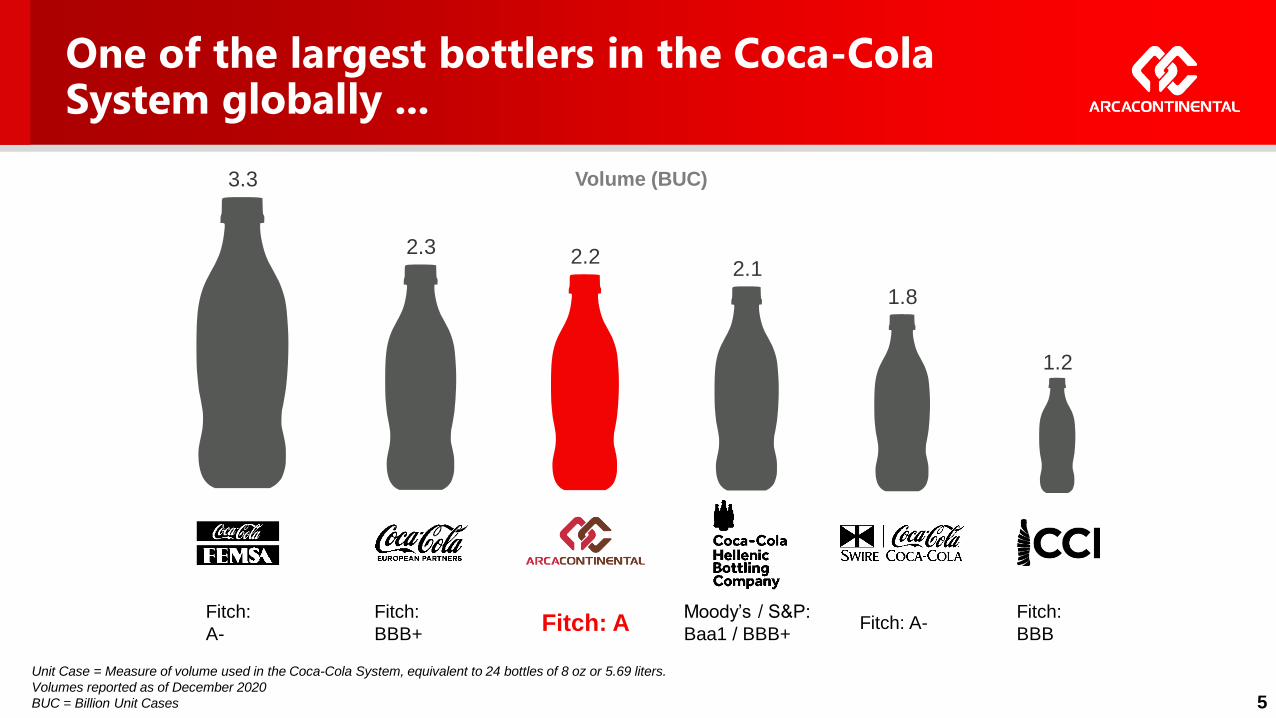
One of the largest bottlers in the Coca-Cola System globally ...
Unit Case = Measure of volume used in the Coca-Cola System, equivalent to 24 bottles of 8 oz or 5.69 liters.
Volumes reported as of December 2020
BUC = Billion Unit Cases
3.3
2.3 2.22.1
1.8
1.2
Fitch:
A-
Fitch:
BBB+
Fitch:
BBBFitch: A-Fitch: A
Moody’s / S&P:
Baa1 / BBB+
Volume (BUC)
5
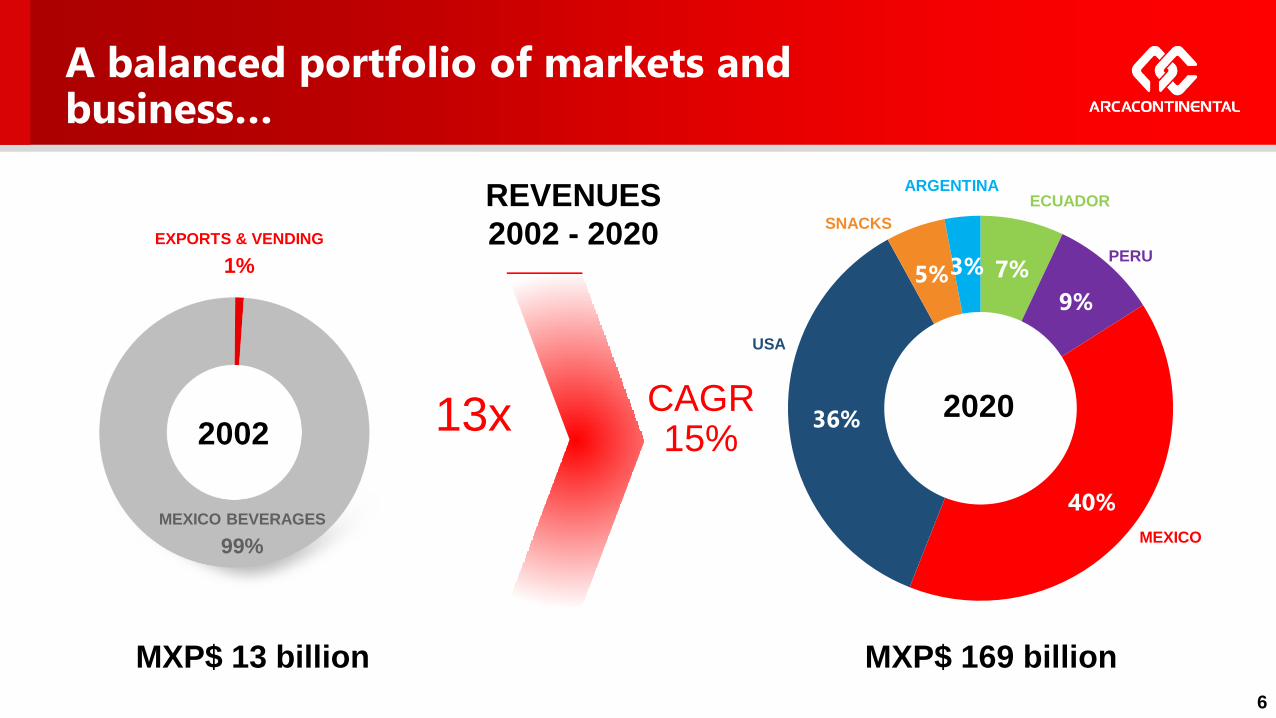
A balanced portfolio of markets and business…
MXP$ 13 billion
EXPORTS & VENDING
1%
MEXICO BEVERAGES
99%
2002CAGR15%
13x
REVENUES
2002 - 2020
6
MXP$ 169 billion
7%
9%
40%
36%
5%3%
2020
USA
MEXICO
PERU
ECUADORARGENTINA
SNACKS
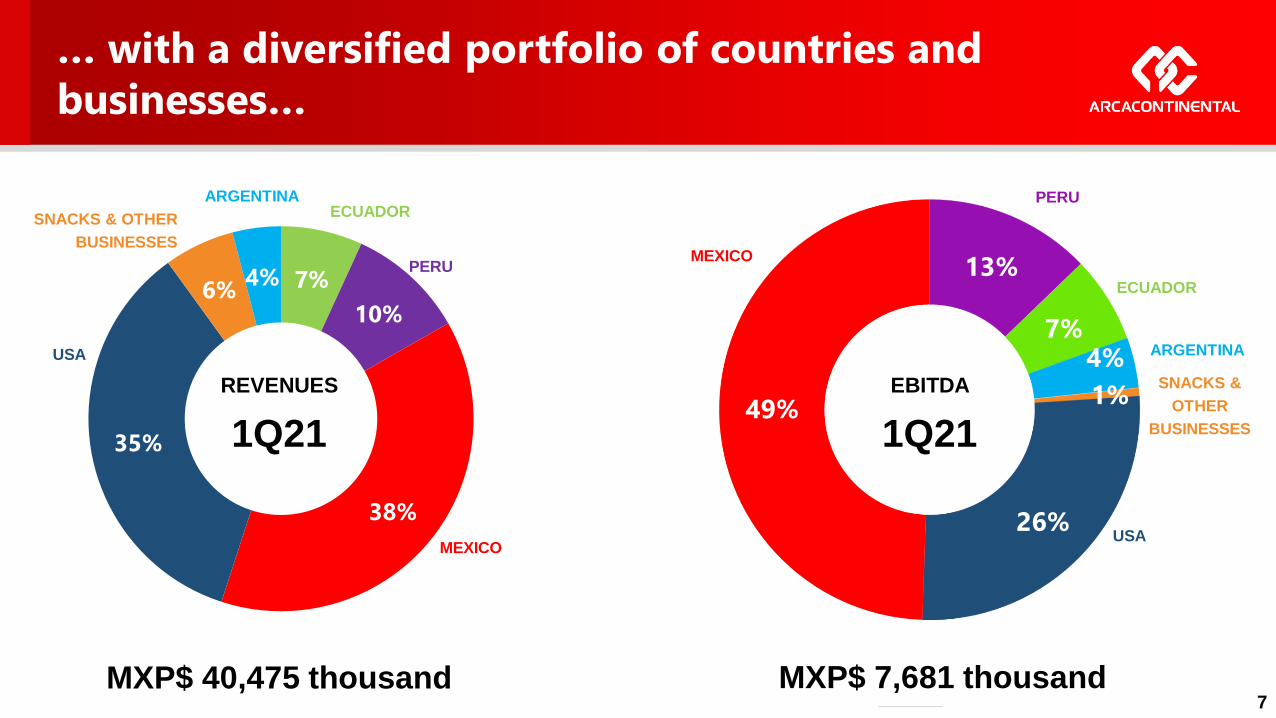
… with a diversified portfolio of countries and
businesses…
13%
7%4%
1%
26%
49%
PERU
ECUADOR
ARGENTINA
MXP$ 7,681 thousand
MEXICO
SNACKS &
OTHER
BUSINESSES
USA
MXP$ 40,475 thousand
EBITDA
1Q21
7
7%
10%
38%
35%
6%4%
USA
MEXICO
PERU
ECUADORARGENTINA
SNACKS & OTHER
BUSINESSES
REVENUES
1Q21
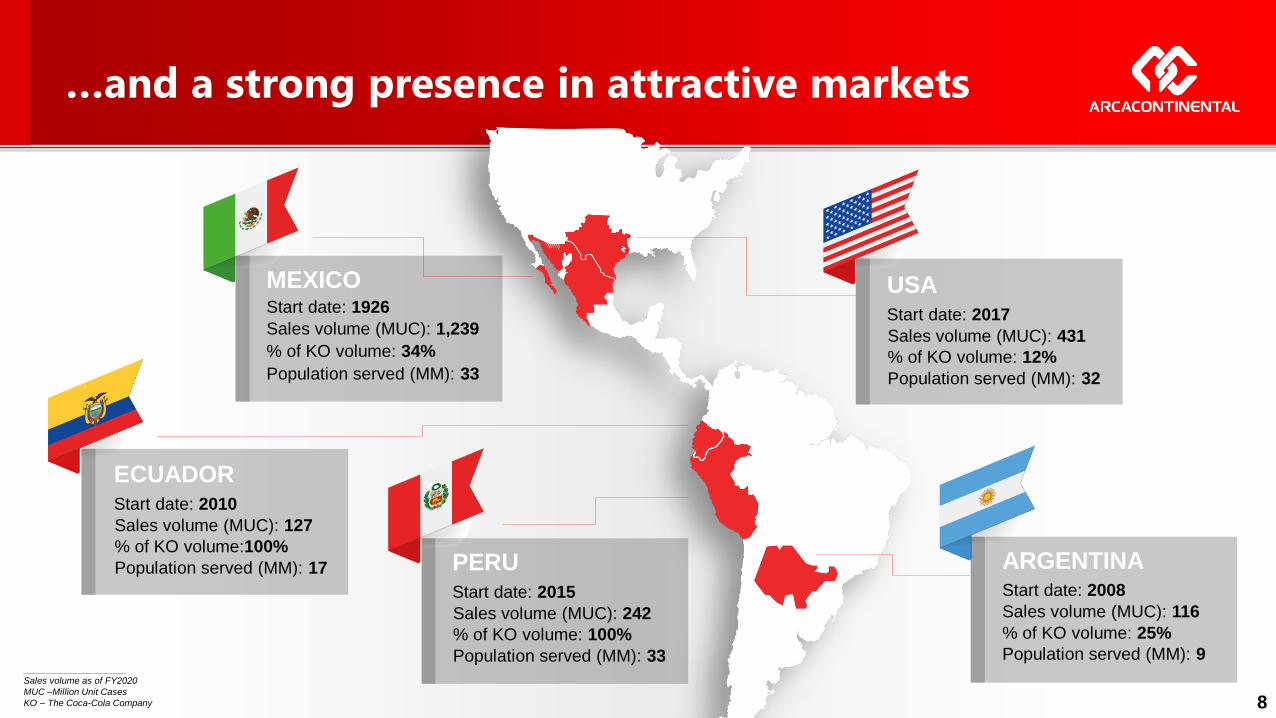
…and a strong presence in attractive markets
MEXICOStart date: 1926
Sales volume (MUC): 1,239
% of KO volume: 34%
Population served (MM): 33
PERUStart date: 2015
Sales volume (MUC): 242
% of KO volume: 100%
Population served (MM): 33
ECUADORStart date: 2010
Sales volume (MUC): 127
% of KO volume:100%
Population served (MM): 17
USAStart date: 2017
Sales volume (MUC): 431
% of KO volume: 12%
Population served (MM): 32
ARGENTINAStart date: 2008
Sales volume (MUC): 116
% of KO volume: 25%
Population served (MM): 9____________________
Sales volume as of FY2020
MUC –Million Unit Cases
KO – The Coca-Cola Company 8
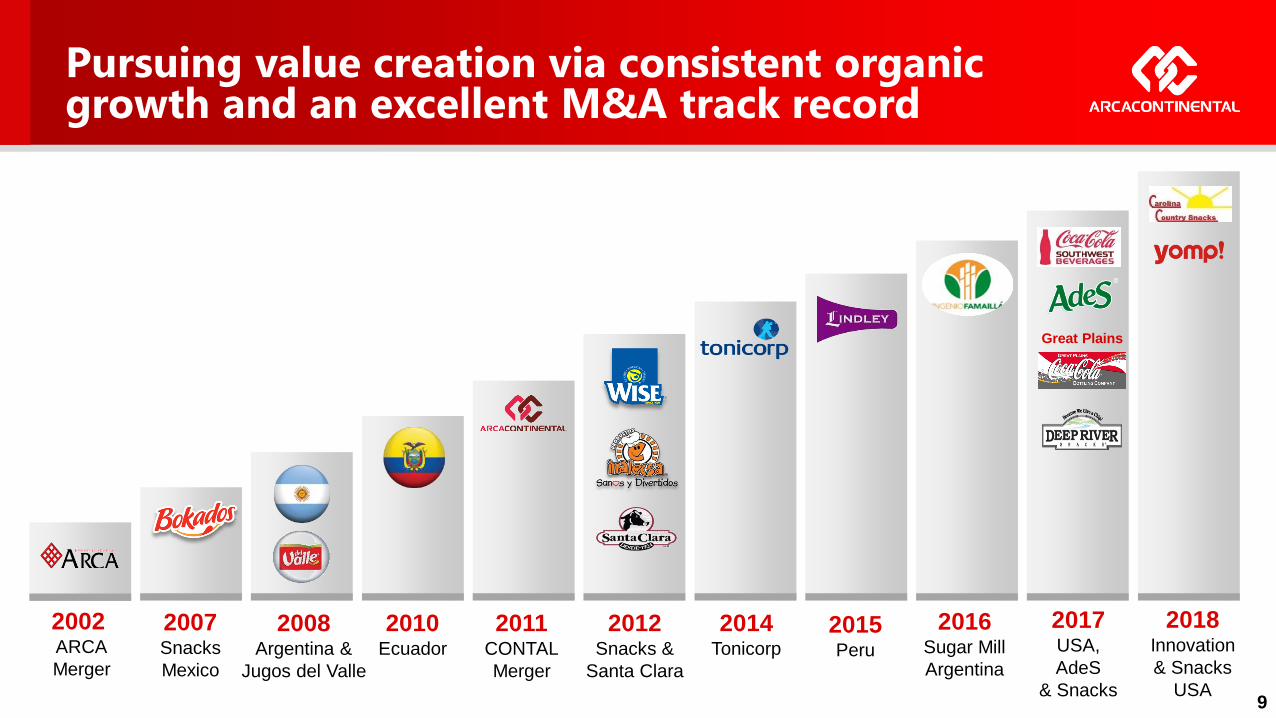
2002ARCA
Merger
2007Snacks
Mexico
2008Argentina &
Jugos del Valle
2010Ecuador
2011CONTAL
Merger
2012Snacks &
Santa Clara
2014Tonicorp
2015Peru
2016Sugar Mill
Argentina
2017USA,
AdeS
& Snacks
2018Innovation
& Snacks
USA
Great Plains
Pursuing value creation via consistent organic growth and an excellent M&A track record
9
1
0
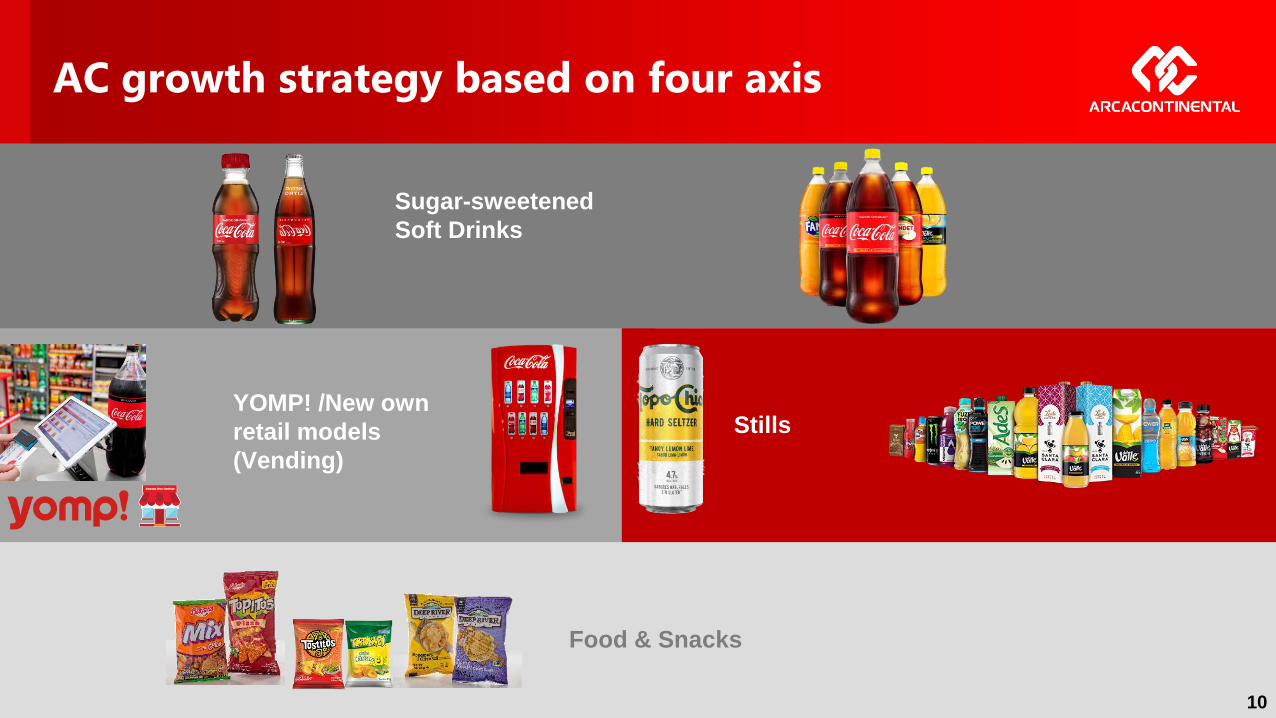
AC growth strategy based on four axis
StillsYOMP! /New own
retail models
(Vending)
Food & Snacks
Sugar-sweetened
Soft Drinks
10
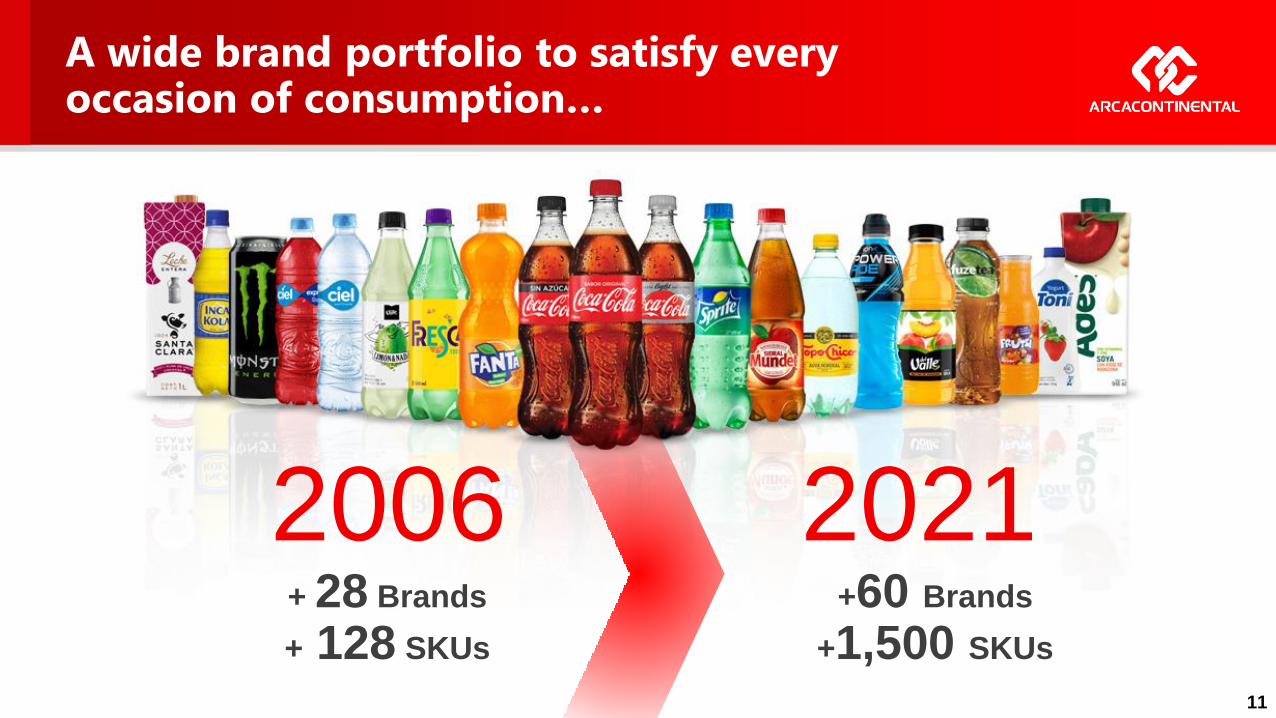
A wide brand portfolio to satisfy every occasion of consumption…
+ 28 Brands
+ 128 SKUs
+60 Brands
+1,500 SKUs
2006 2021
11
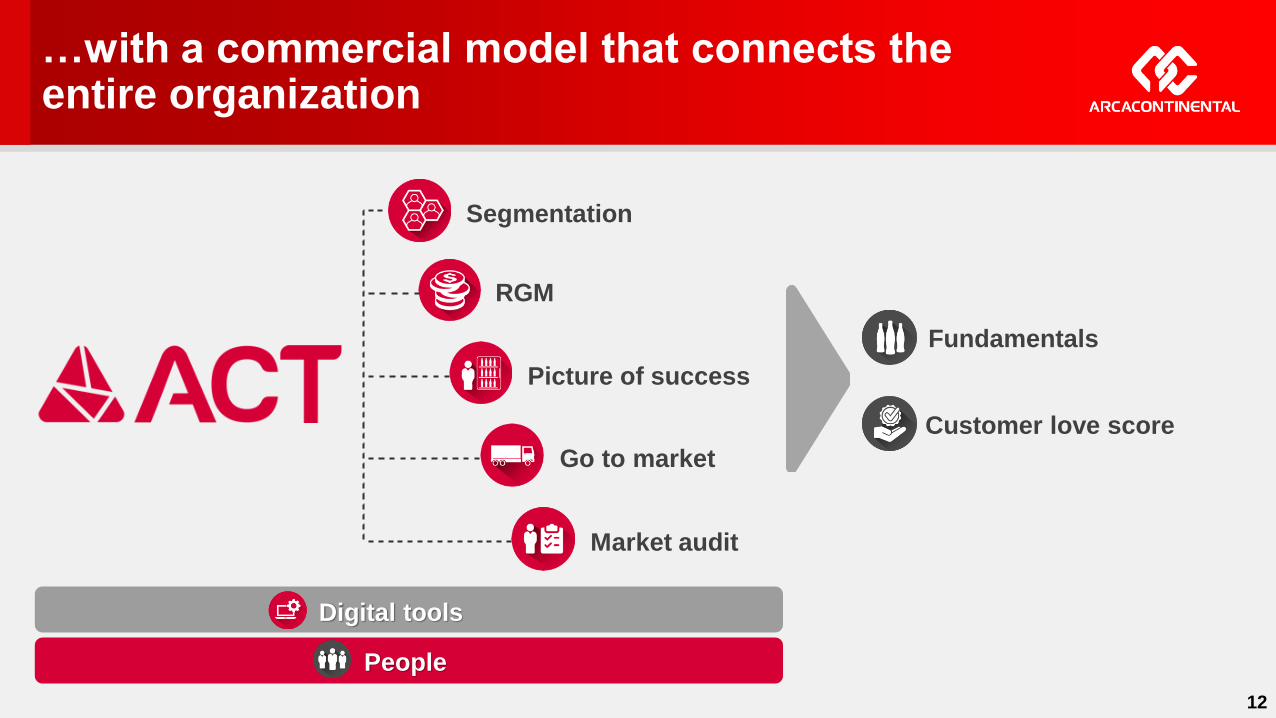
…with a commercial model that connects the entire organization
Fundamentals
Segmentation
RGM
Picture of success
Go to market
Market audit
Digital tools
People
Customer love score
12
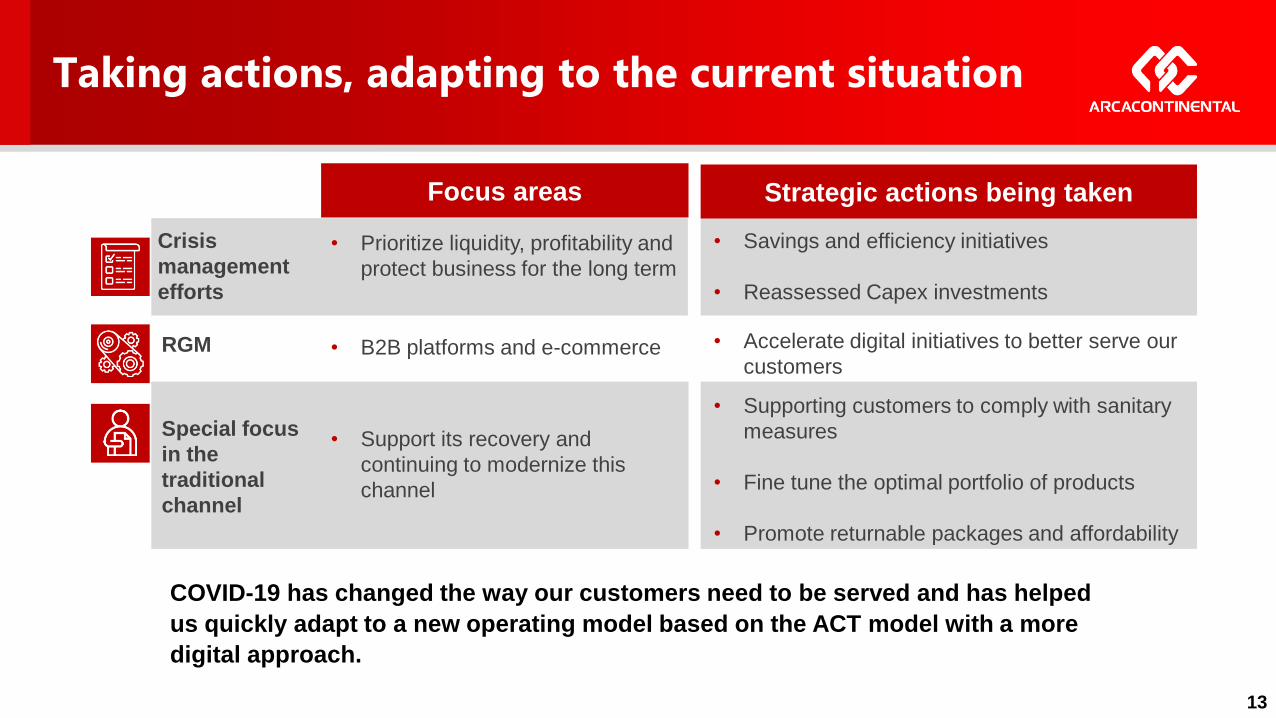
Taking actions, adapting to the current situation
13
Strategic actions being takenFocus areas
Crisis
management
efforts
• Savings and efficiency initiatives
• Reassessed Capex investments
• Prioritize liquidity, profitability and
protect business for the long term
Special focus
in the
traditional
channel
RGM • B2B platforms and e-commerce • Accelerate digital initiatives to better serve our
customers
• Support its recovery and
continuing to modernize this
channel
COVID-19 has changed the way our customers need to be served and has helped
us quickly adapt to a new operating model based on the ACT model with a more
digital approach.
• Supporting customers to comply with sanitary
measures
• Fine tune the optimal portfolio of products
• Promote returnable packages and affordability
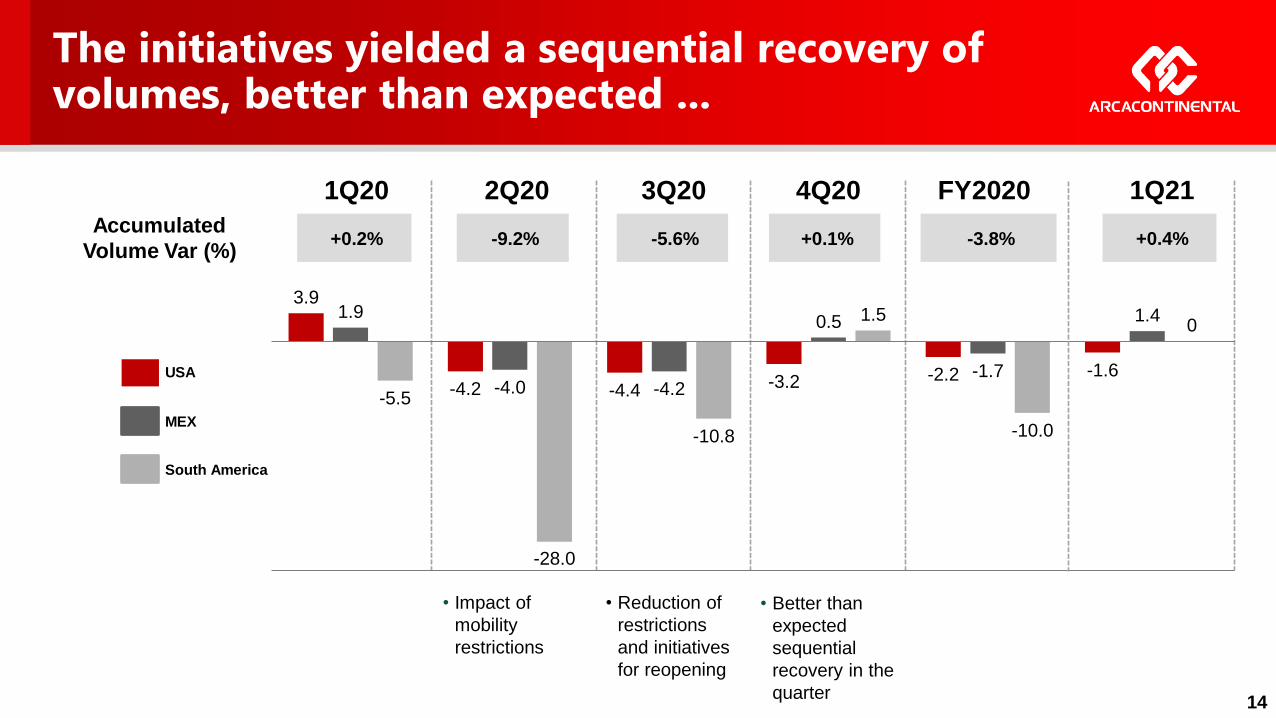
The initiatives yielded a sequential recovery of volumes, better than expected ...
FY20201Q20
+0.2%Accumulated
Volume Var (%)
2Q20
-9.2% -5.6%
3Q20
+0.1%
4Q20
-3.8%
3.9
-4.2 -4.4 -3.2 -2.2 -1.6
1.9
-4.0 -4.2
0.5
-1.7
1.4
-5.5
-28.0
-10.8
1.5
-10.0
0
• Impact of
mobility
restrictions
• Reduction of
restrictions
and initiatives
for reopening
• Better than
expected
sequential
recovery in the
quarter
USA
MEX
South America
14
1Q21
+0.4%
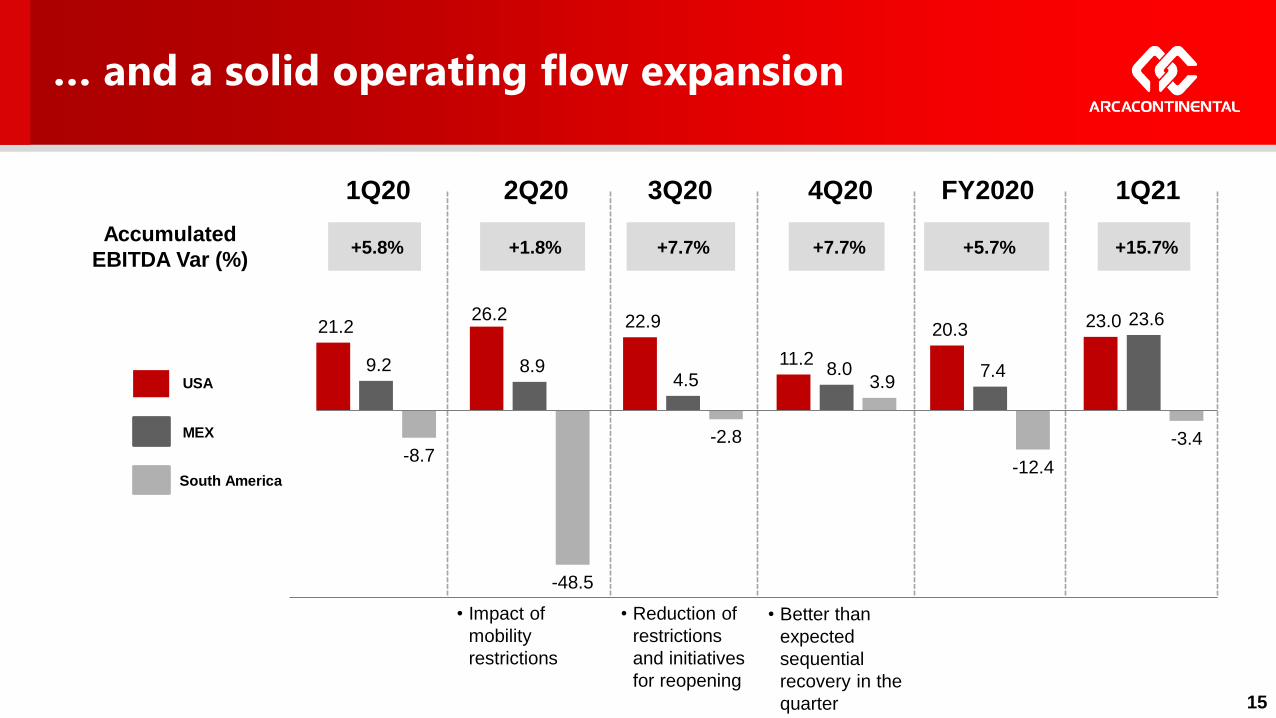
… and a solid operating flow expansion
15
+5.8%Accumulated
EBITDA Var (%)+1.8% +7.7% +7.7% +5.7%
21.2 26.2 22.9
11.2
20.3 23.0
9.2 8.9 4.5
8.0 7.4
23.6
-8.7
-48.5
-2.8
3.9
-12.4
-3.4
• Impact of
mobility
restrictions
• Reduction of
restrictions
and initiatives
for reopening
• Better than
expected
sequential
recovery in the
quarter
USA
MEX
South America
FY20201Q20 2Q20 3Q20 4Q20
+15.7%
1Q21
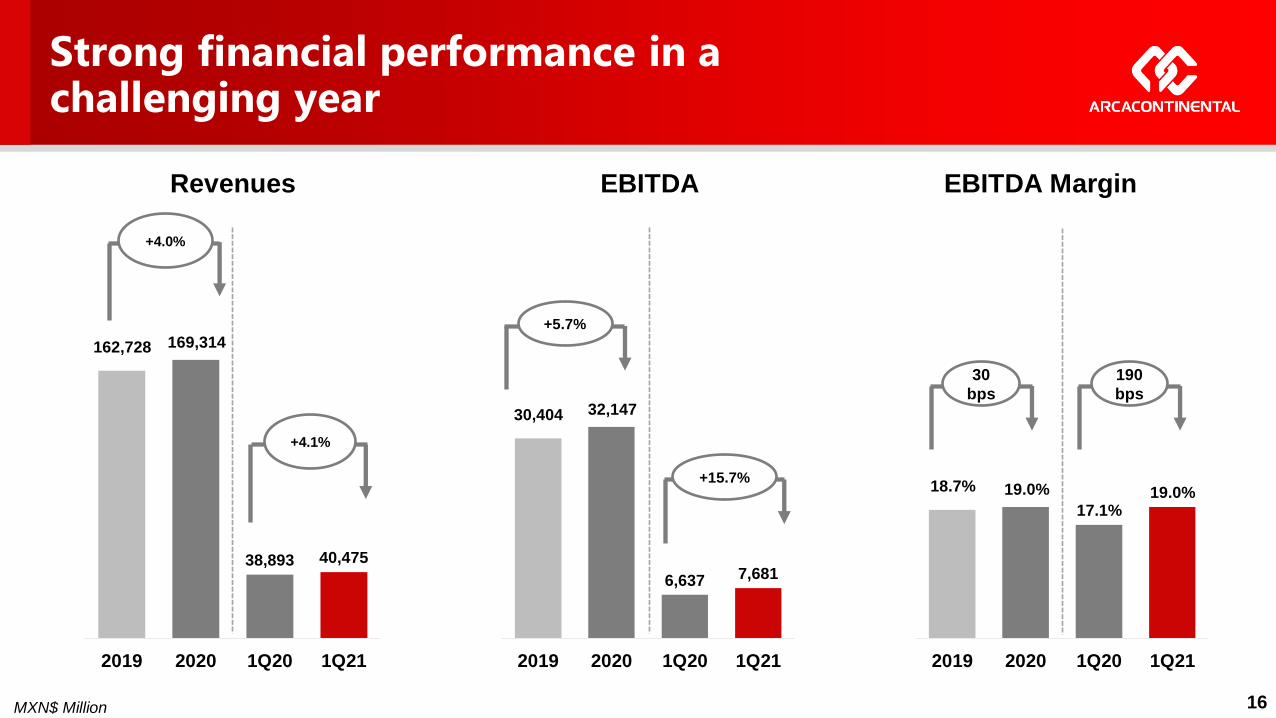
Strong financial performance in a challenging year
MXN$ Million 16
162,728 169,314
38,893 40,475
2019 2020 1Q20 1Q21
30,404 32,147
6,637 7,681
2019 2020 1Q20 1Q21
18.7% 19.0%
17.1%19.0%
2019 2020 1Q20 1Q21
Revenues EBITDA EBITDA Margin
+4.0%
+5.7%
30
bps
+4.1%
+15.7%
190
bps
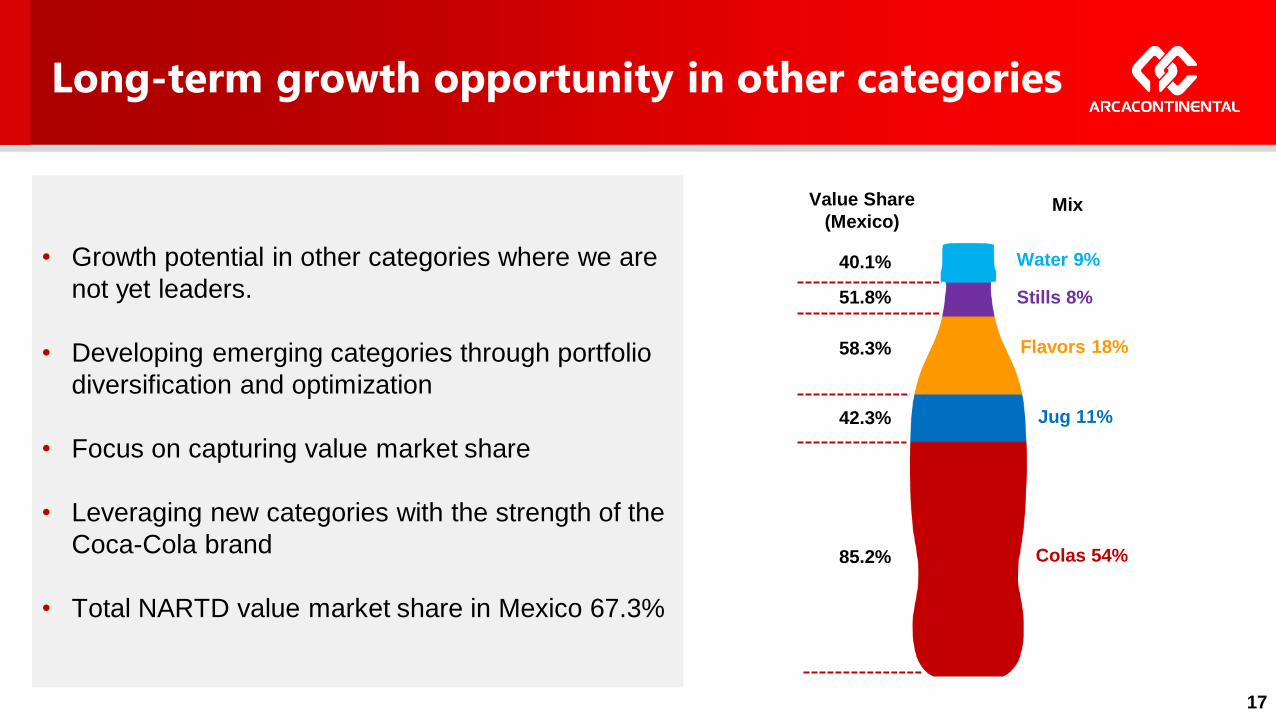
Long-term growth opportunity in other categories
• Growth potential in other categories where we are
not yet leaders.
• Developing emerging categories through portfolio
diversification and optimization
• Focus on capturing value market share
• Leveraging new categories with the strength of the
Coca-Cola brand
• Total NARTD value market share in Mexico 67.3%
Colas 54%
Jug 11%
Flavors 18%
Stills 8%
Water 9%
Value Share
(Mexico)
40.1%
51.8%
58.3%
42.3%
85.2%
17
Mix
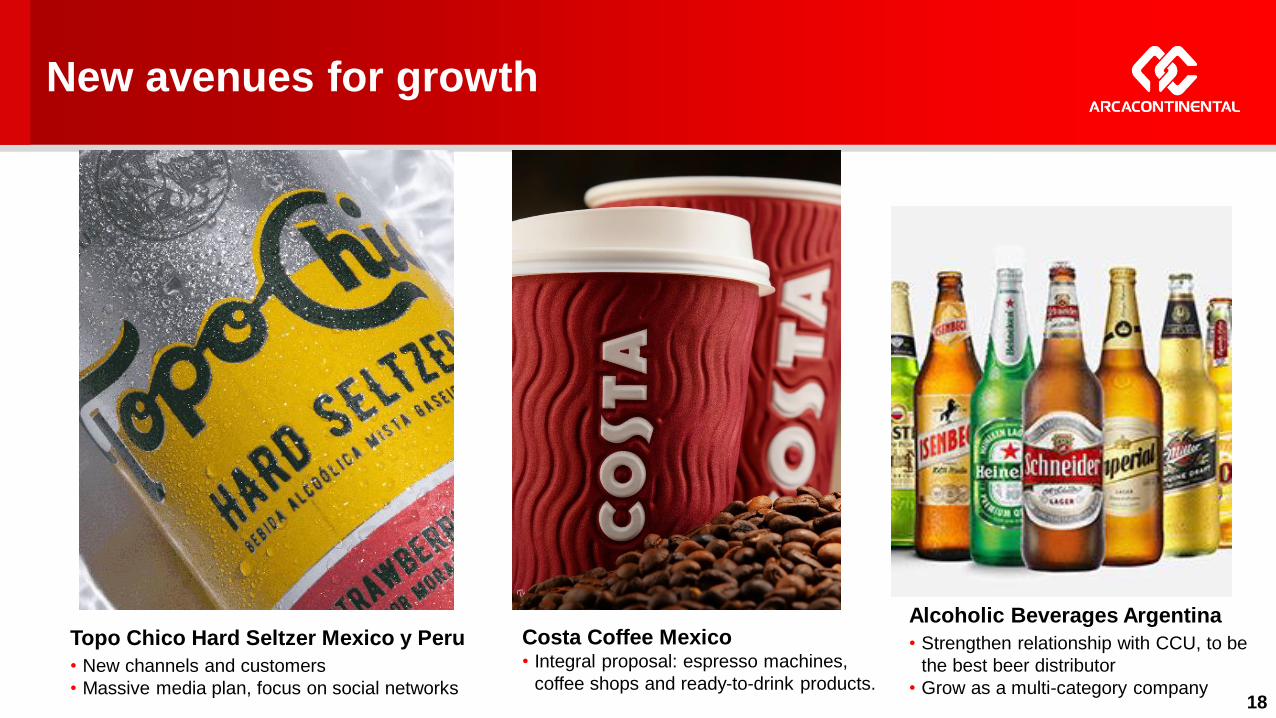
New avenues for growth
18
Topo Chico Hard Seltzer Mexico y Peru
• New channels and customers
• Massive media plan, focus on social networks
Costa Coffee Mexico• Integral proposal: espresso machines,
coffee shops and ready-to-drink products.
Alcoholic Beverages Argentina
• Strengthen relationship with CCU, to be
the best beer distributor
• Grow as a multi-category company
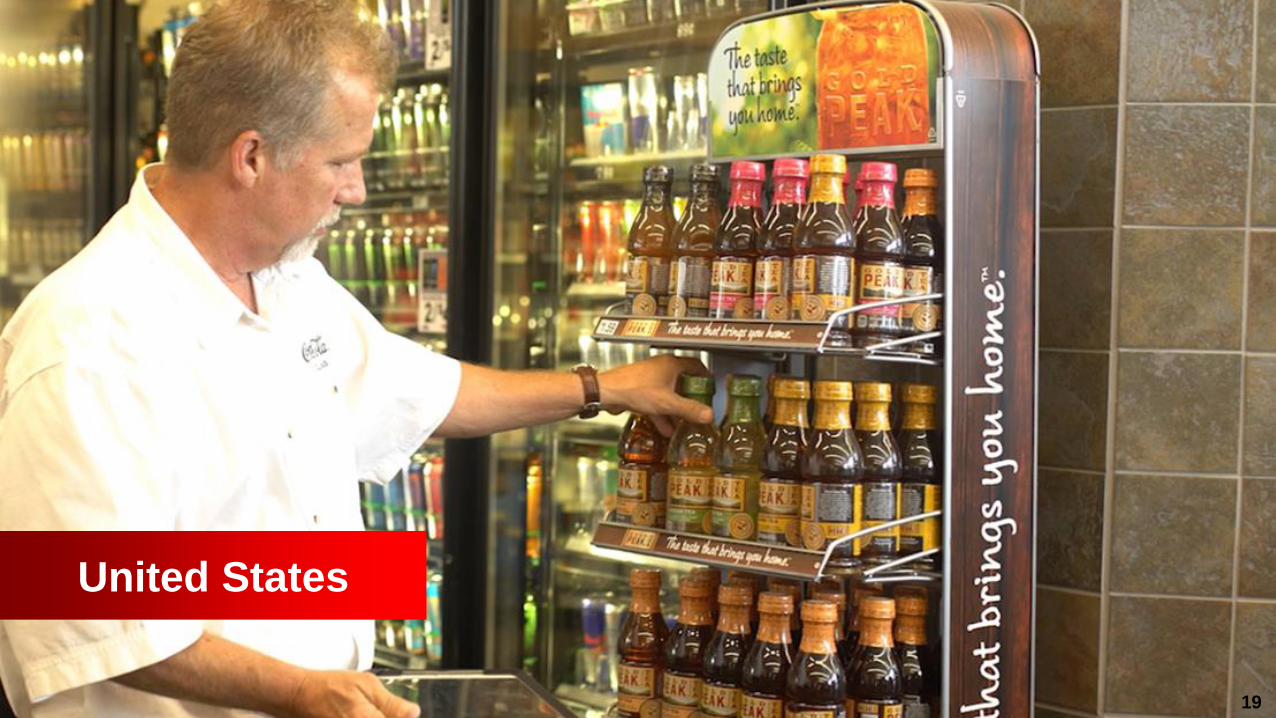
United States
19
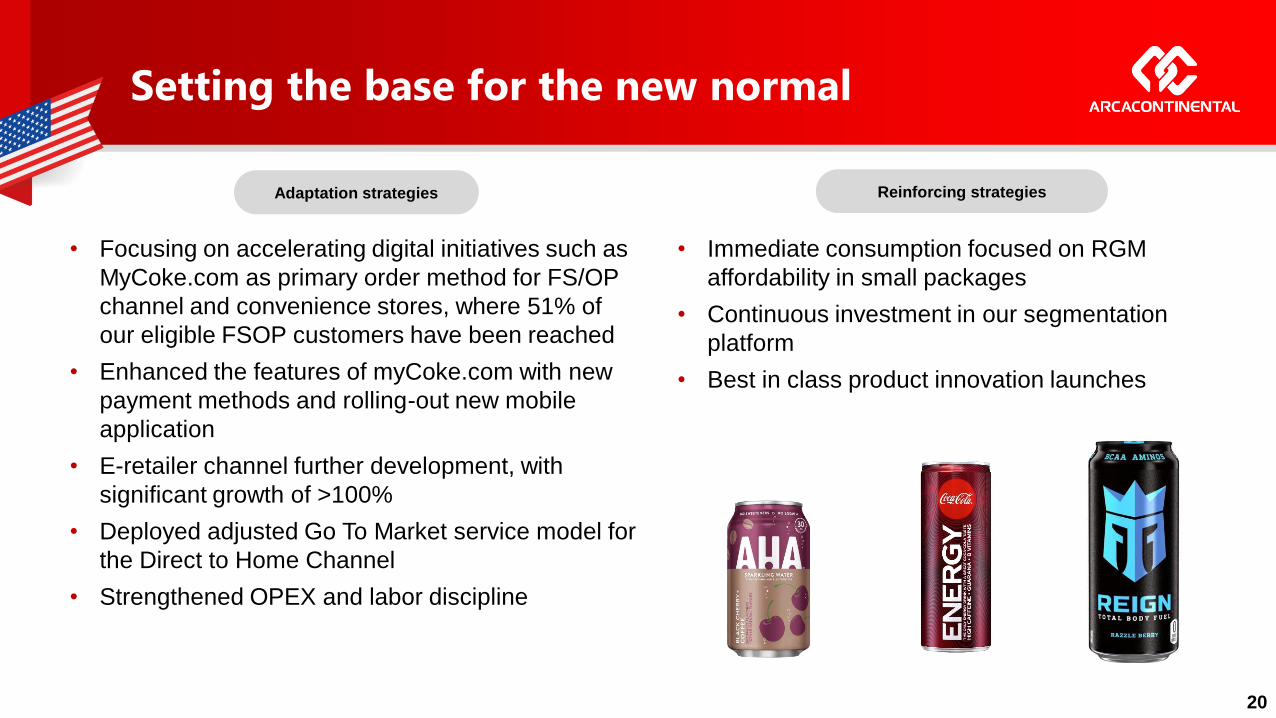
Setting the base for the new normal
20
• Immediate consumption focused on RGM
affordability in small packages
• Continuous investment in our segmentation
platform
• Best in class product innovation launches
• Focusing on accelerating digital initiatives such as
MyCoke.com as primary order method for FS/OP
channel and convenience stores, where 51% of
our eligible FSOP customers have been reached
• Enhanced the features of myCoke.com with new
payment methods and rolling-out new mobile
application
• E-retailer channel further development, with
significant growth of >100%
• Deployed adjusted Go To Market service model for
the Direct to Home Channel
• Strengthened OPEX and labor discipline
Adaptation strategies Reinforcing strategies
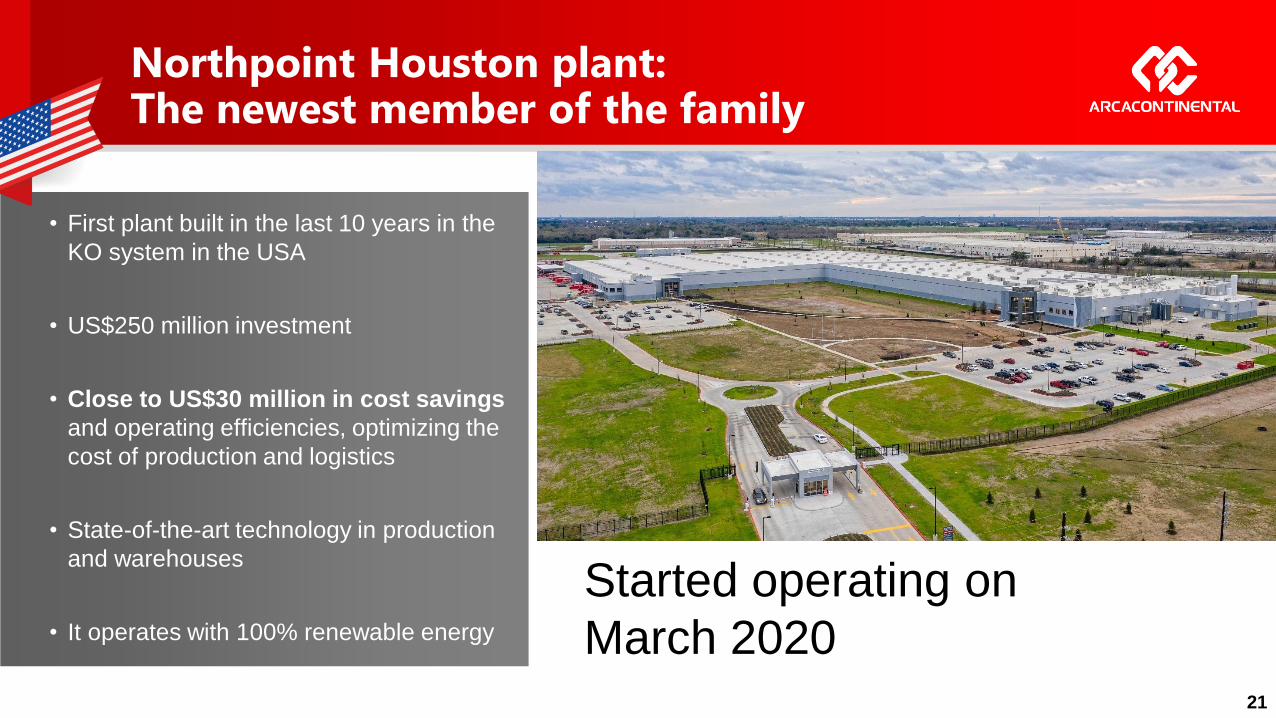
Northpoint Houston plant:The newest member of the family
• First plant built in the last 10 years in the
KO system in the USA
• US$250 million investment
• Close to US$30 million in cost savings
and operating efficiencies, optimizing the
cost of production and logistics
• State-of-the-art technology in production
and warehouses
• It operates with 100% renewable energy
Started operating on
March 202021
22
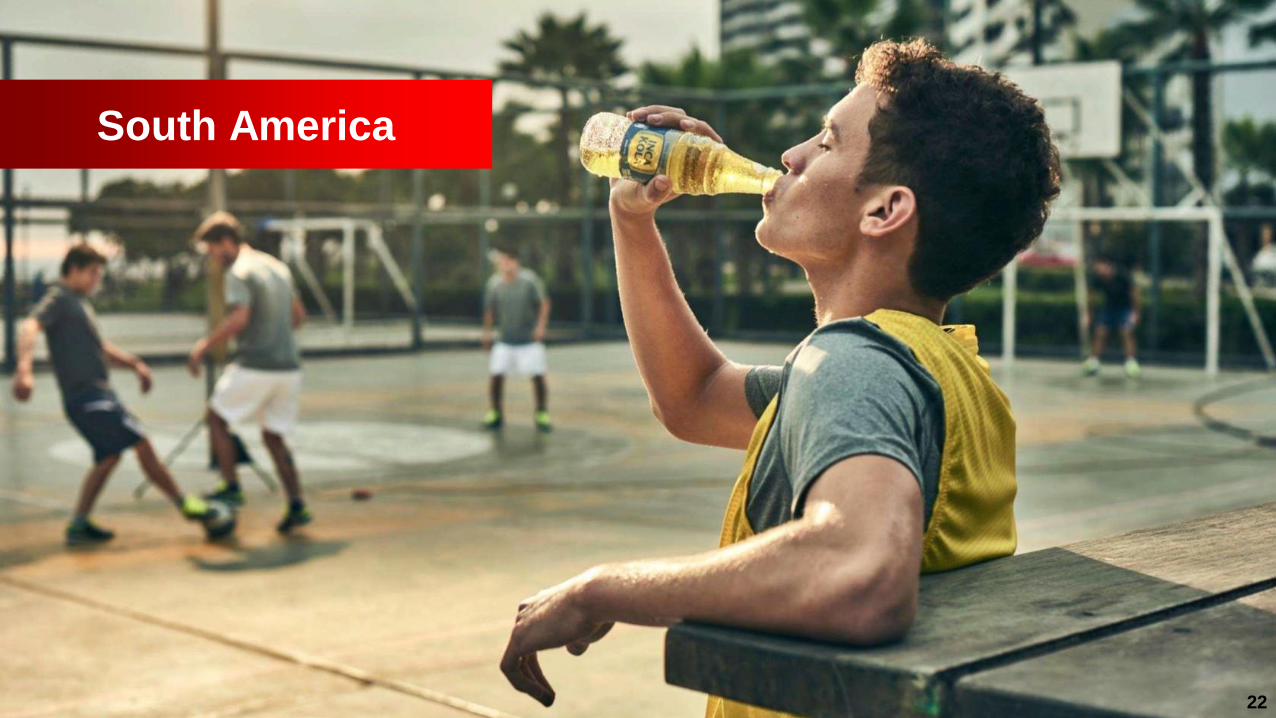
South America
Slower recovery amid second wave
23
• Ecuador was affected by the second
wave of the pandemic and along
South America, restrictions and
curfew were reinstated by local
governments.
• On-premise channel continues to be
the most impacted showing a slow
recovery due to reinstatement of
restrictions and decrease in mobility,
however by the end of the quarter
volumes show a gradual recovery.
• During 1Q21, the On-Premise channels
were still affected by capacity restrictions
and consumer sentiment, however, March
saw a strong recovery in these channels.
• A significant increase of cases by the end
of March could lead to a new set of
restrictions during Q2 2021.
• In terms of mix, multi-serve packs
continue to grow their share of the
sales mix as a result of the changes
in consumer patterns while single-
serve packs continue to be affected
by the drop-in consumption of the
on-premise channel.
• Digital strategy and new service
models have been consolidated at
different channels.
ArgentinaEcuadorPeru
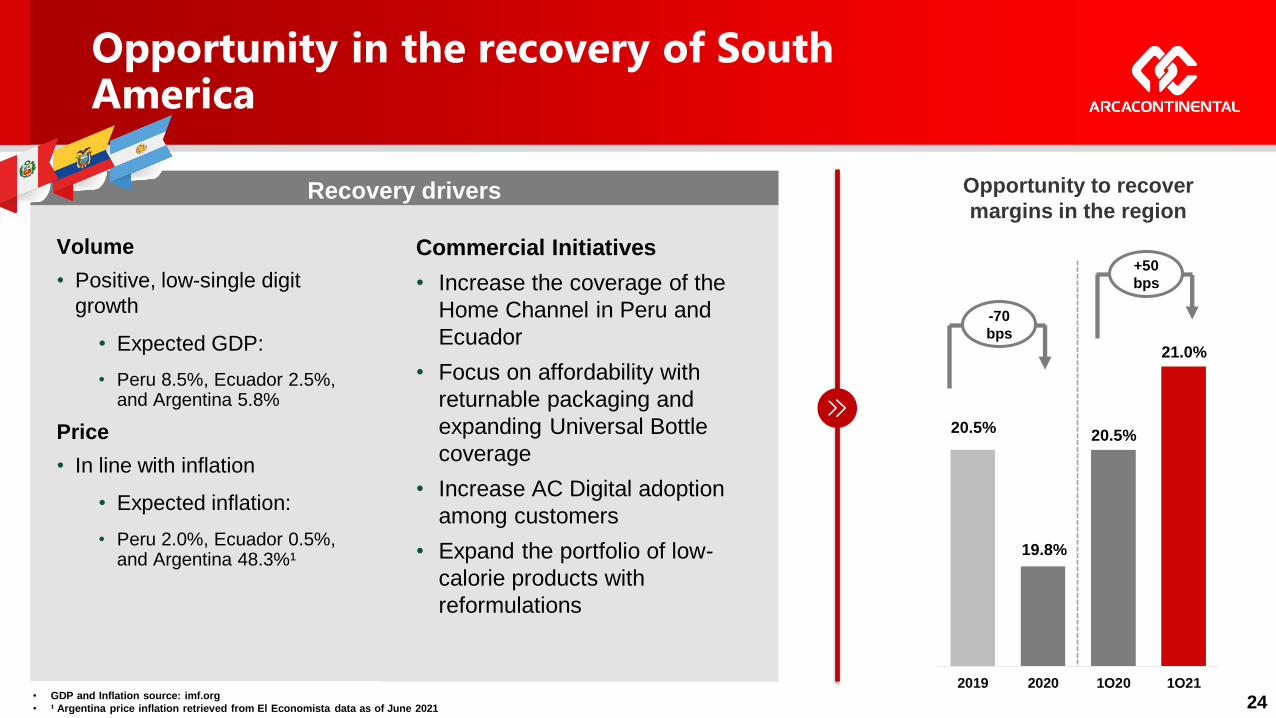
Opportunity in the recovery of South America
24
Volume
• Positive, low-single digit
growth
• Expected GDP:
• Peru 8.5%, Ecuador 2.5%, and Argentina 5.8%
Price
• In line with inflation
• Expected inflation:
• Peru 2.0%, Ecuador 0.5%, and Argentina 48.3%¹
Commercial Initiatives
• Increase the coverage of the
Home Channel in Peru and
Ecuador
• Focus on affordability with
returnable packaging and
expanding Universal Bottle
coverage
• Increase AC Digital adoption
among customers
• Expand the portfolio of low-
calorie products with
reformulations
• GDP and Inflation source: imf.org
• ¹ Argentina price inflation retrieved from El Economista data as of June 2021
Recovery drivers
20.5%
19.8%
20.5%
21.0%
2019 2020 1Q20 1Q21
-70
bps
Opportunity to recover
margins in the region
+50
bps
25
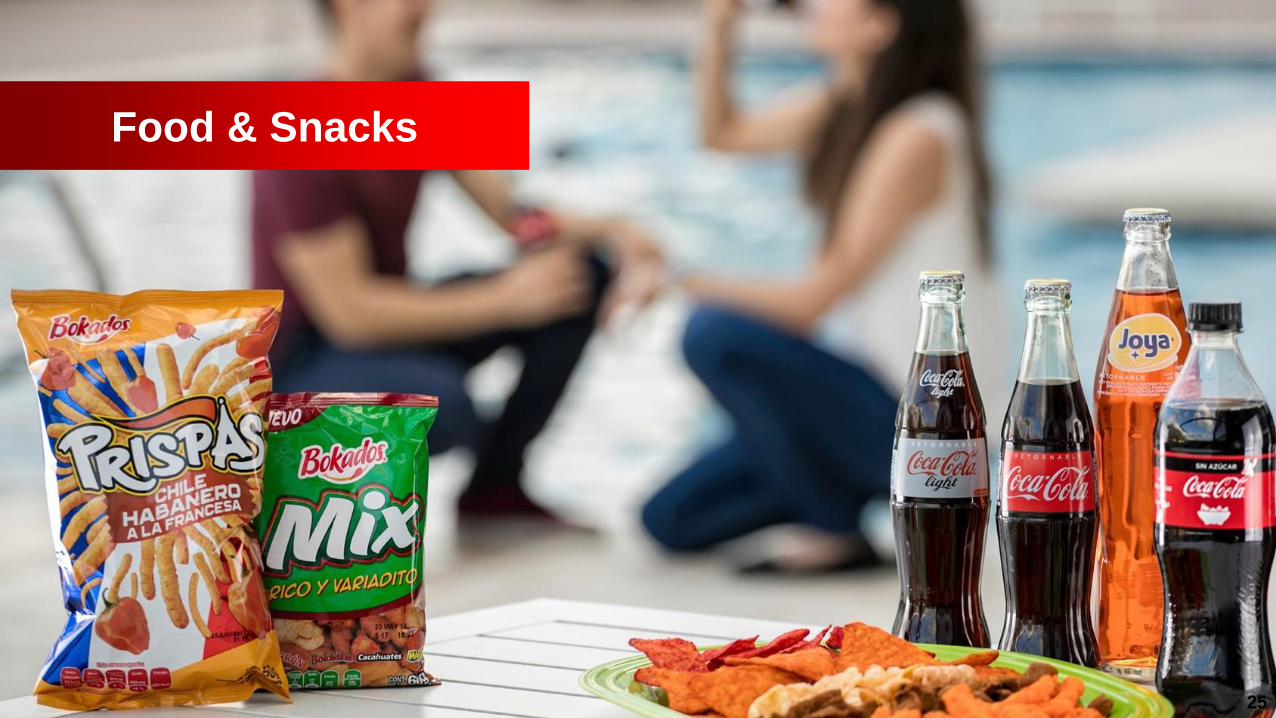
Food & Snacks
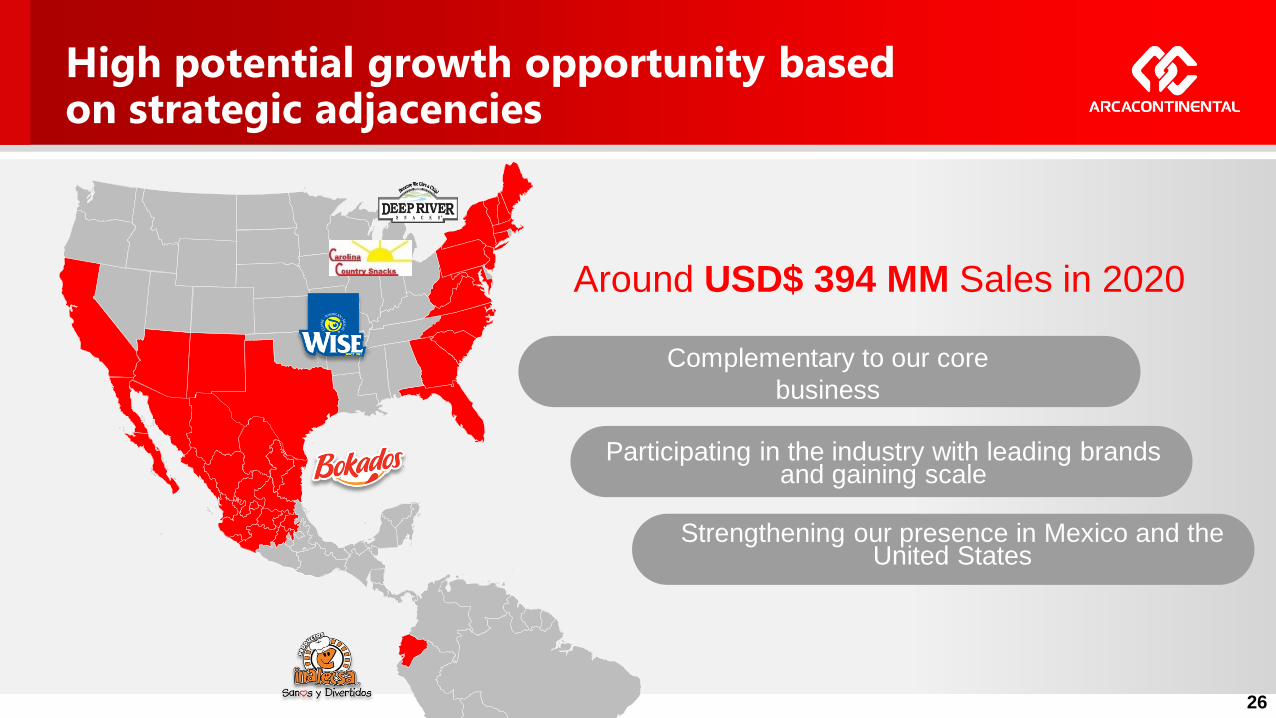
High potential growth opportunity based on strategic adjacencies
Mejorar constantemente el uso y el abastecimiento de agua mientras se promueve el
acceso al agua segura 26
Around USD$ 394 MM Sales in 2020
Complementary to our core
business
Strengthening our presence in Mexico and the United States
Participating in the industry with leading brands and gaining scale
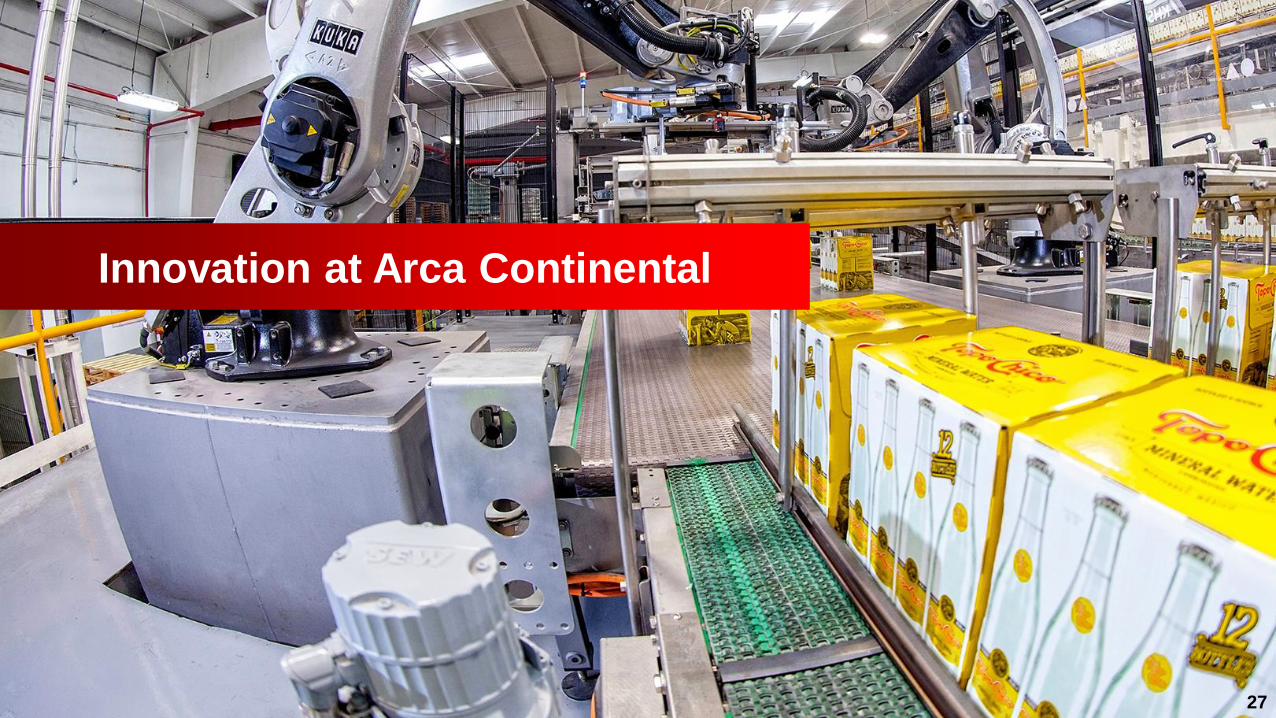
Innovation at Arca Continental
27
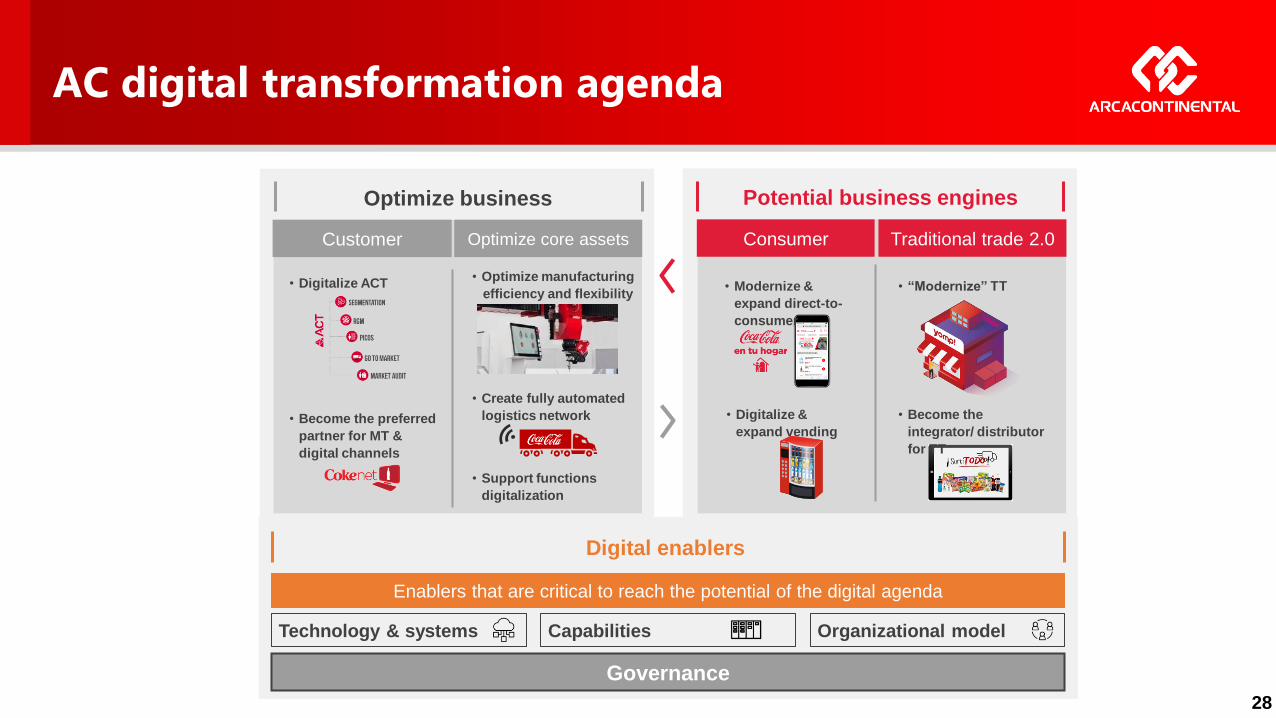
AC digital transformation agenda
28
Digital enablers
Traditional trade 2.0Consumer
Potential business engines
• Modernize &
expand direct-to-
consumer
• Digitalize &
expand vending
• “Modernize” TT
• Become the
integrator/ distributor
for TT
Optimize core assetsCustomer
Optimize business
• Digitalize ACT
• Become the preferred
partner for MT &
digital channels
• Optimize manufacturing
efficiency and flexibility
• Create fully automated
logistics network
• Support functions
digitalization
Enablers that are critical to reach the potential of the digital agenda
Governance
Technology & systems Capabilities Organizational model
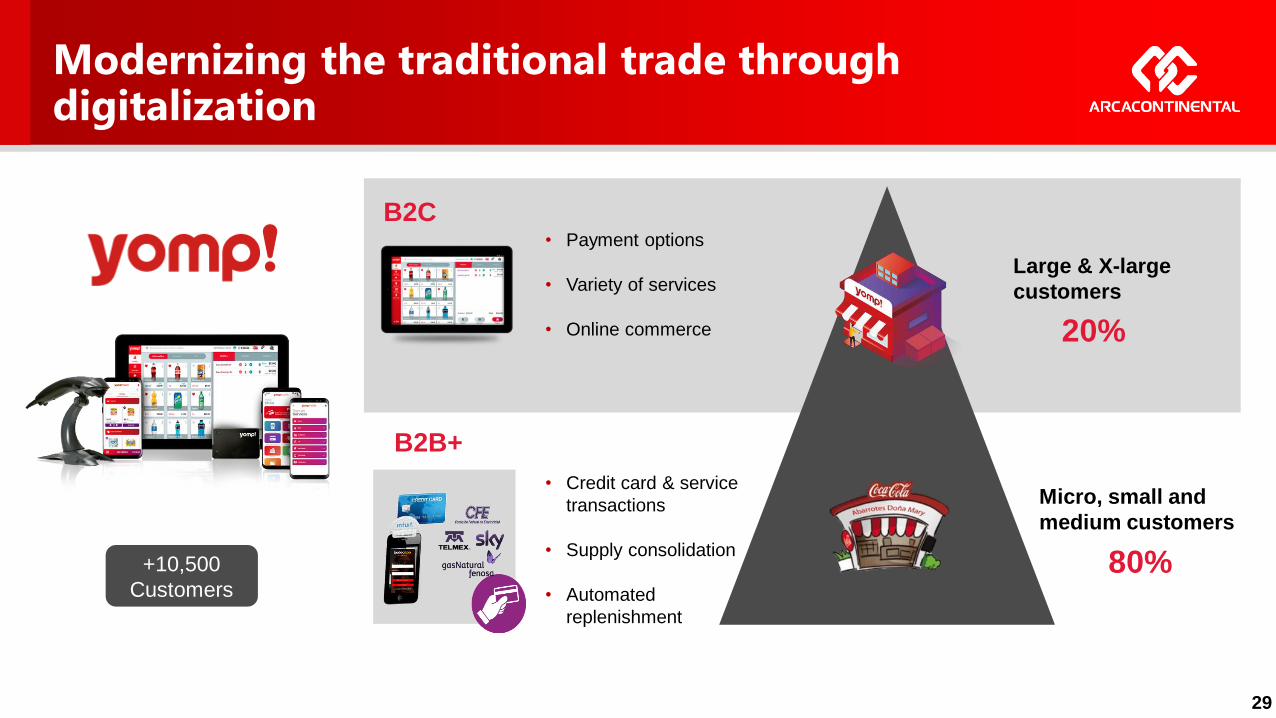
Modernizing the traditional trade through digitalization
29
1
Large & X-large
customers
Micro, small and
medium customers
B2B+
20%
80%
• Credit card & service
transactions
• Supply consolidation
• Automated
replenishment
B2C• Payment options
• Variety of services
• Online commerce
+10,500
Customers
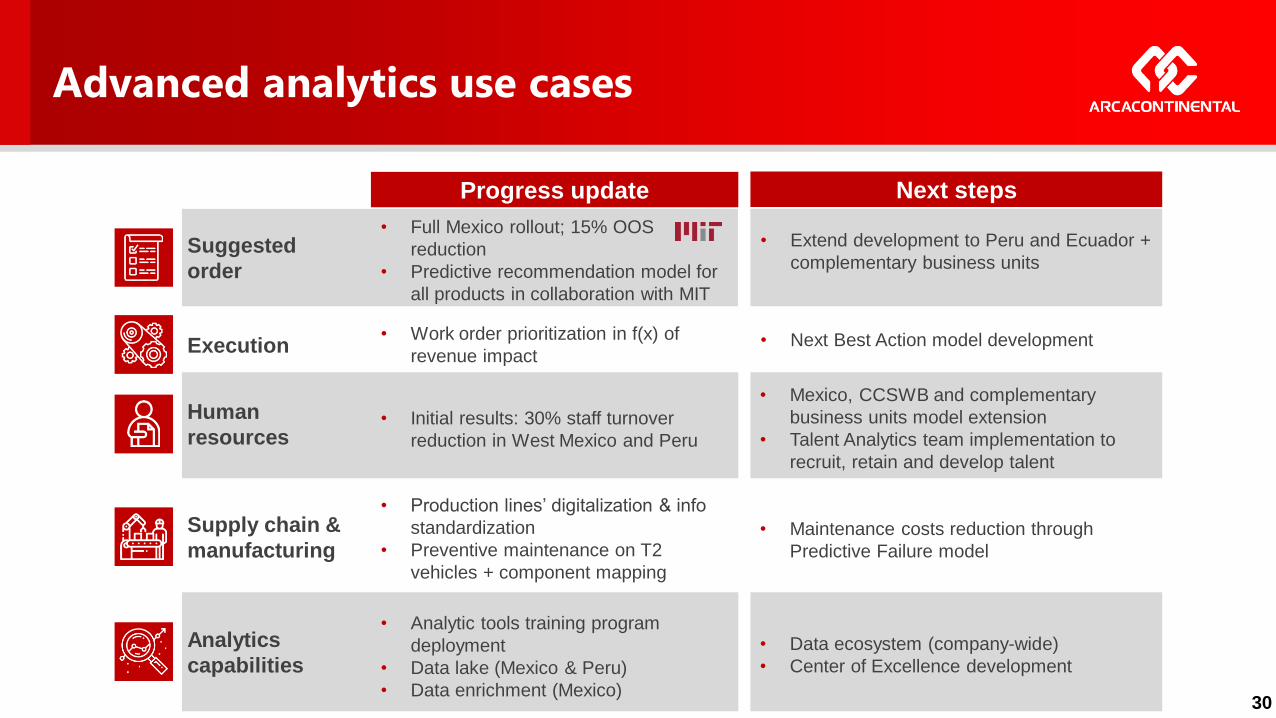
Advanced analytics use cases
30
Next stepsProgress update
Suggested
order
• Full Mexico rollout; 15% OOS
reduction
• Predictive recommendation model for
all products in collaboration with MIT
• Extend development to Peru and Ecuador +
complementary business units
Execution
Human
resources
Supply chain &
manufacturing
Analytics
capabilities
• Work order prioritization in f(x) of
revenue impact• Next Best Action model development
• Initial results: 30% staff turnover
reduction in West Mexico and Peru
• Mexico, CCSWB and complementary
business units model extension
• Talent Analytics team implementation to
recruit, retain and develop talent
• Production lines’ digitalization & info
standardization
• Preventive maintenance on T2
vehicles + component mapping
• Maintenance costs reduction through
Predictive Failure model
• Analytic tools training program
deployment
• Data lake (Mexico & Peru)
• Data enrichment (Mexico)
• Data ecosystem (company-wide)
• Center of Excellence development
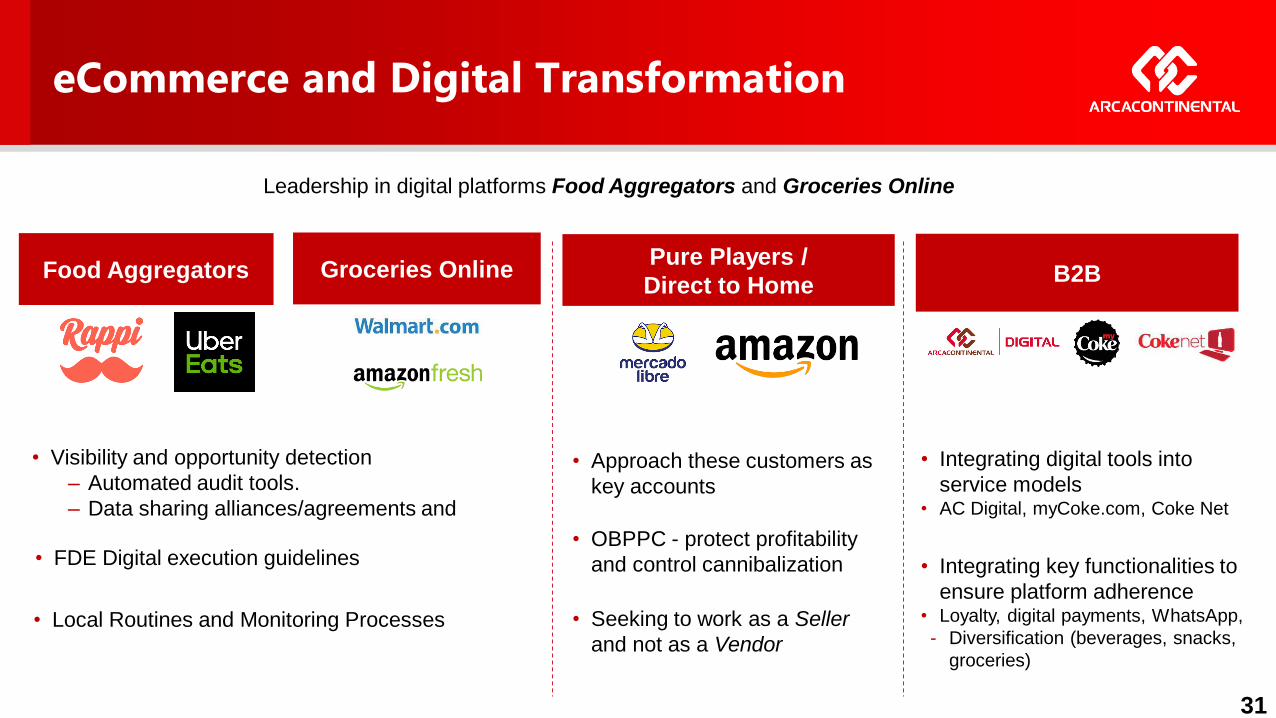
eCommerce and Digital Transformation
Food Aggregators
• Visibility and opportunity detection
– Automated audit tools.
– Data sharing alliances/agreements and
• FDE Digital execution guidelines
• Local Routines and Monitoring Processes
Groceries OnlinePure Players /
Direct to Home
• Approach these customers as
key accounts
• Seeking to work as a Seller
and not as a Vendor
B2B
• Integrating digital tools into
service models• AC Digital, myCoke.com, Coke Net
• Integrating key functionalities to
ensure platform adherence• Loyalty, digital payments, WhatsApp,
- Diversification (beverages, snacks,
groceries)
• OBPPC - protect profitability
and control cannibalization
Leadership in digital platforms Food Aggregators and Groceries Online
31
Financial Performance
32
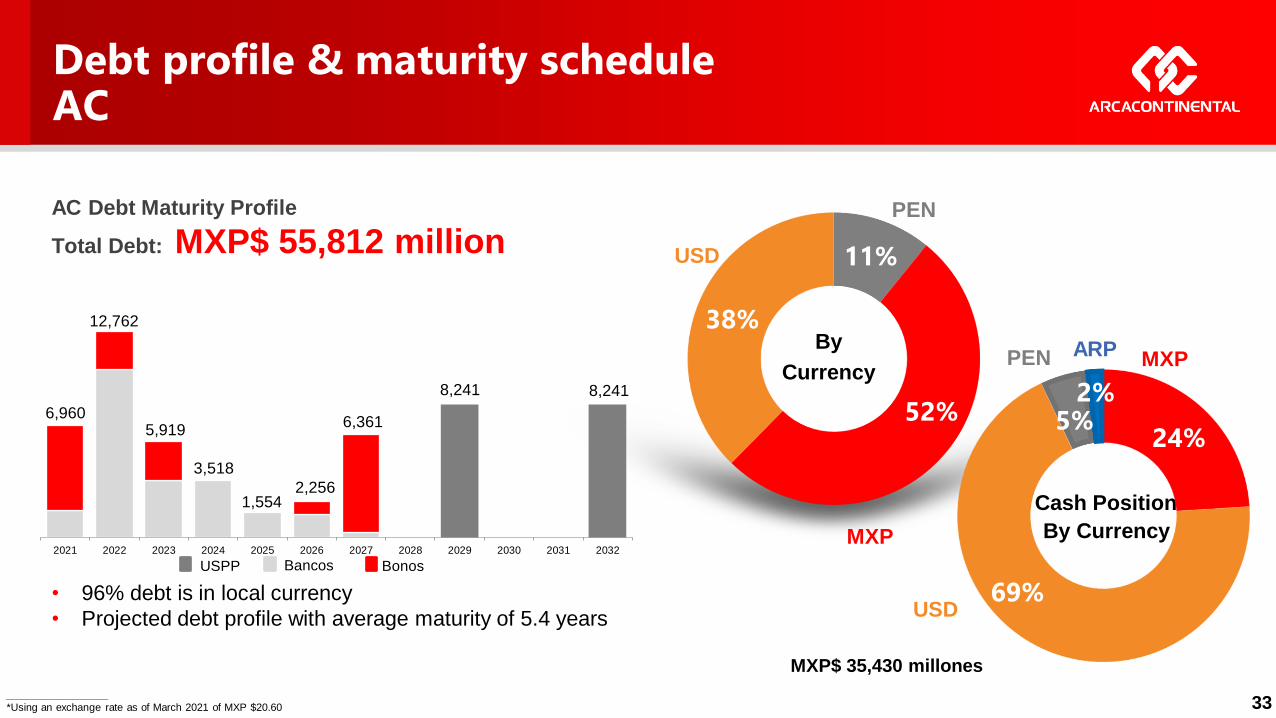
Debt profile & maturity scheduleAC
• 96% debt is in local currency
• Projected debt profile with average maturity of 5.4 years
AC Debt Maturity Profile
Total Debt: MXP$ 55,812 million
____________________
*Using an exchange rate as of March 2021 of MXP $20.60
Cash Position
By Currency
By
CurrencyMXP
USD
USD
MXP
PEN
MXP$ 35,430 millones
PEN ARP
USPP Bancos Bonos
11%
52%
38%
24%
69%
5%2%
33
2021 2022 2023 2024 2025 2026 2027 2028 2029 2030 2031 2032
6,960
12,762
5,919
3,518
1,5542,256
6,361
8,241 8,241
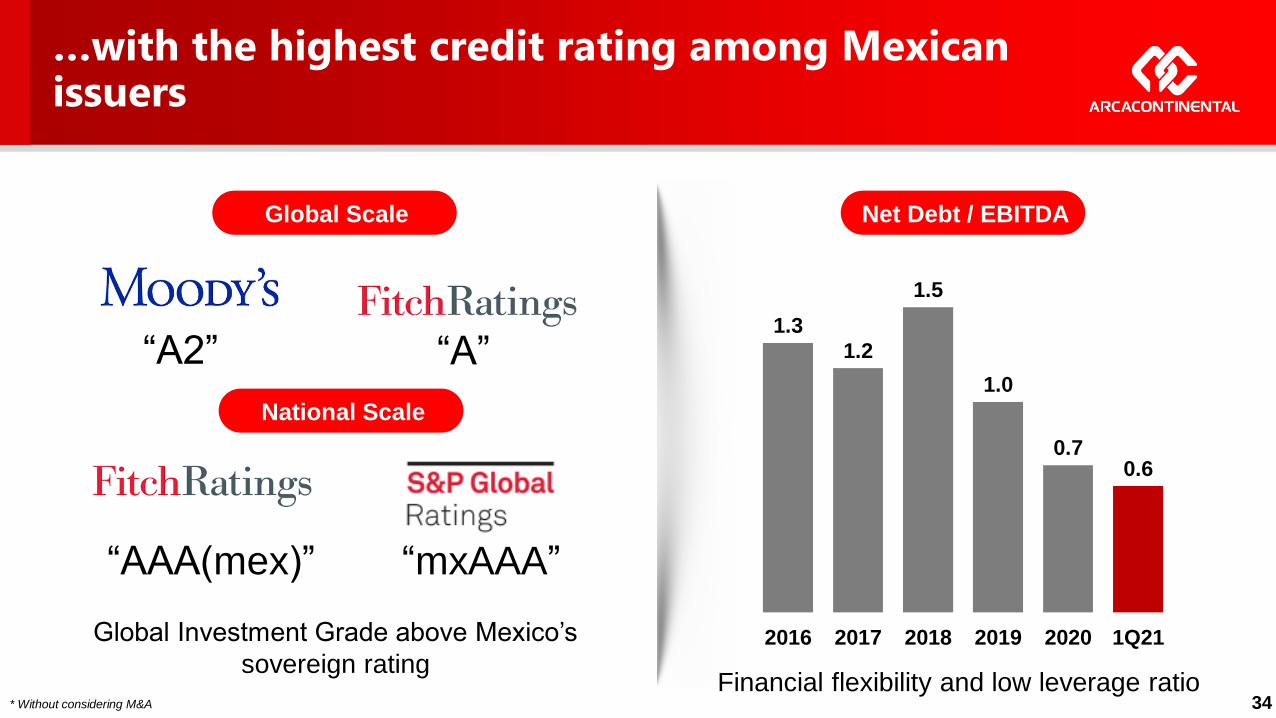
…with the highest credit rating among Mexican issuers
Financial flexibility and low leverage ratio
“A2”
Global Investment Grade above Mexico’s
sovereign rating
“AAA(mex)”
“A”
“mxAAA”
Global Scale
National Scale
Net Debt / EBITDA
* Without considering M&A
1.3
1.2
1.5
1.0
0.70.6
2016 2017 2018 2019 2020 1Q21
34
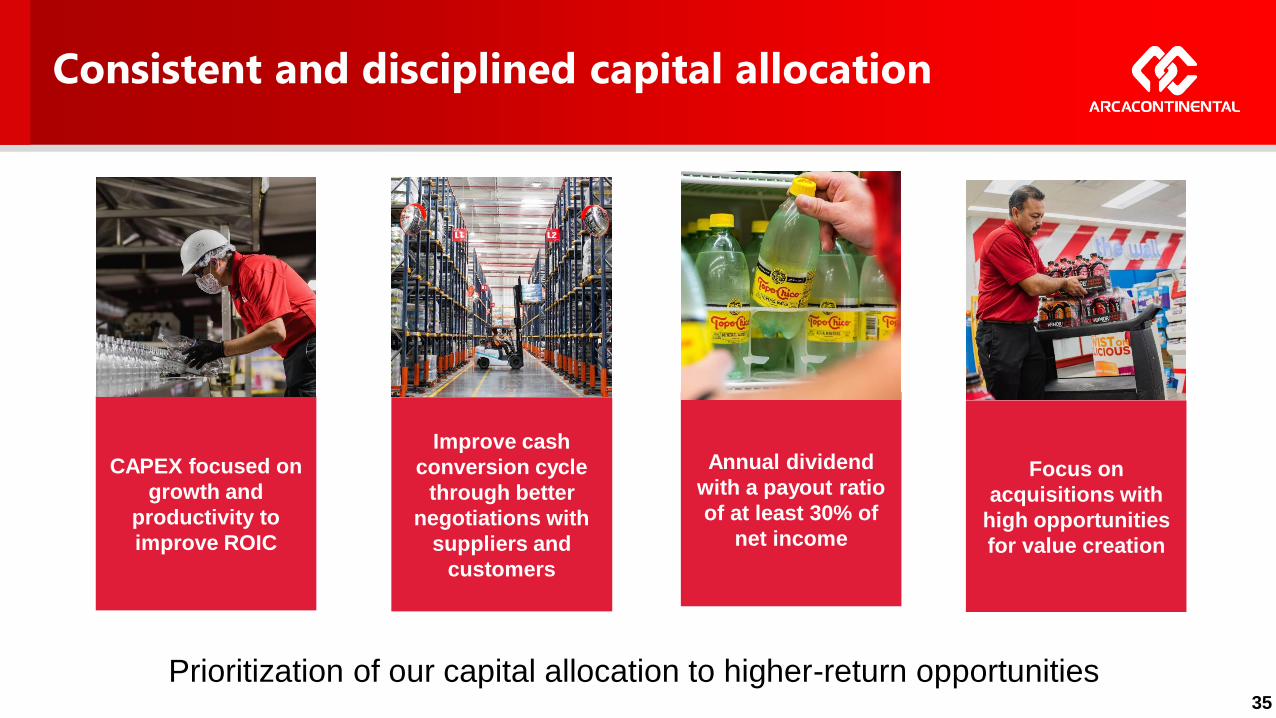
Consistent and disciplined capital allocation
35
CAPEX focused on
growth and
productivity to
improve ROIC
Annual dividend
with a payout ratio
of at least 30% of
net income
Improve cash
conversion cycle
through better
negotiations with
suppliers and
customers
Focus on
acquisitions with
high opportunities
for value creation
Prioritization of our capital allocation to higher-return opportunities
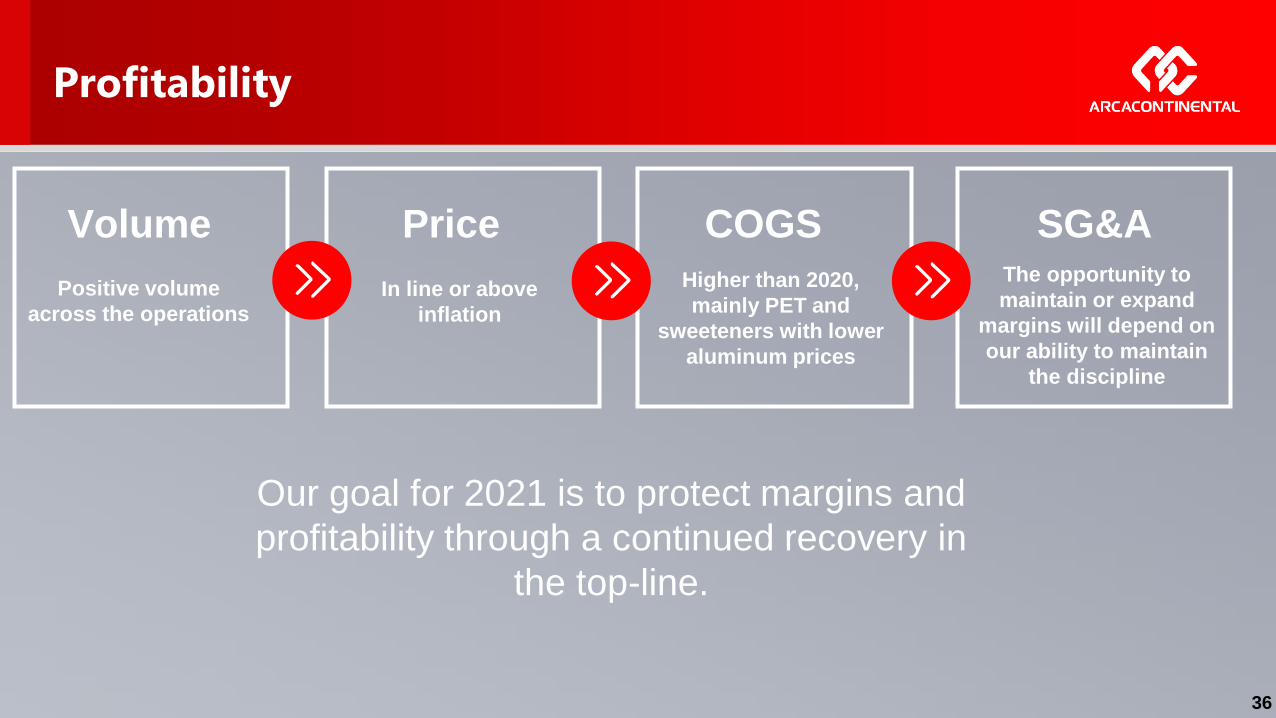
Positive volume
across the operations
Volume
Profitability
In line or above
inflation
Price
Higher than 2020,
mainly PET and
sweeteners with lower
aluminum prices
COGS SG&AThe opportunity to
maintain or expand
margins will depend on
our ability to maintain
the discipline
Our goal for 2021 is to protect margins and
profitability through a continued recovery in
the top-line.
36
Sustainability
37
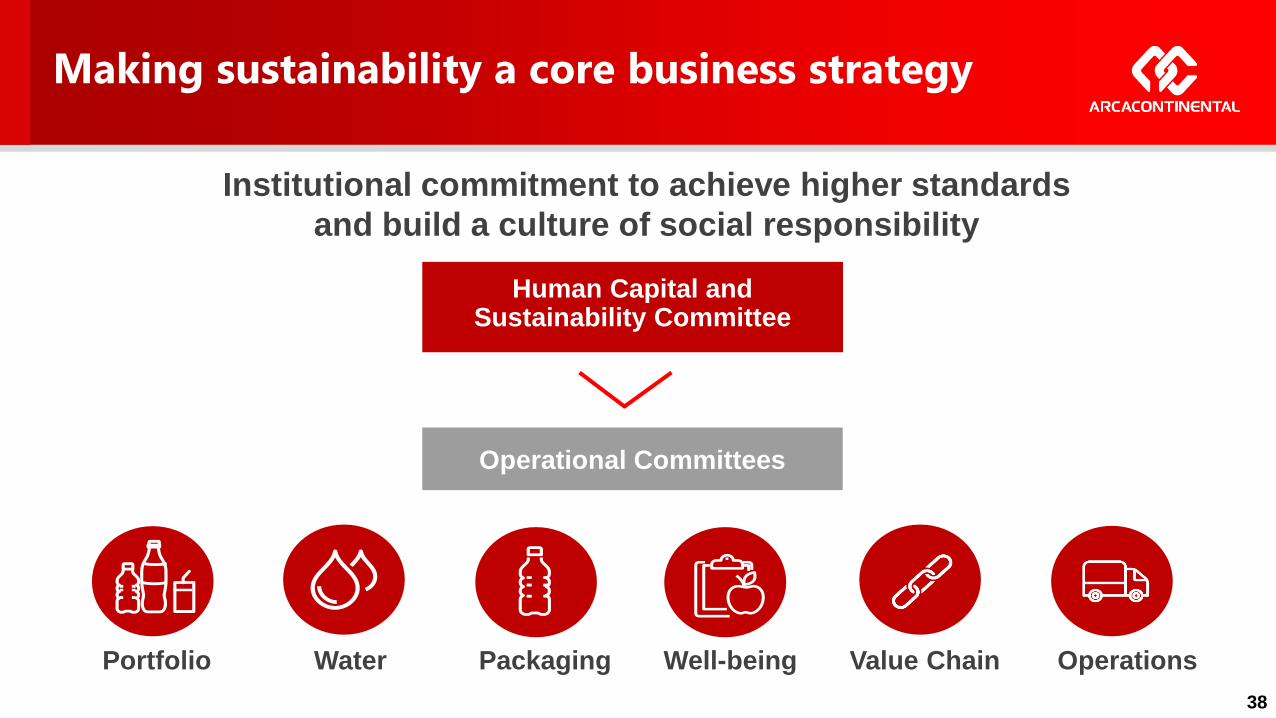
Making sustainability a core business strategy
Human Capital and Sustainability Committee
Operational Committees
Portfolio Water Packaging Well-being Value Chain Operations
Institutional commitment to achieve higher standards
and build a culture of social responsibility
38
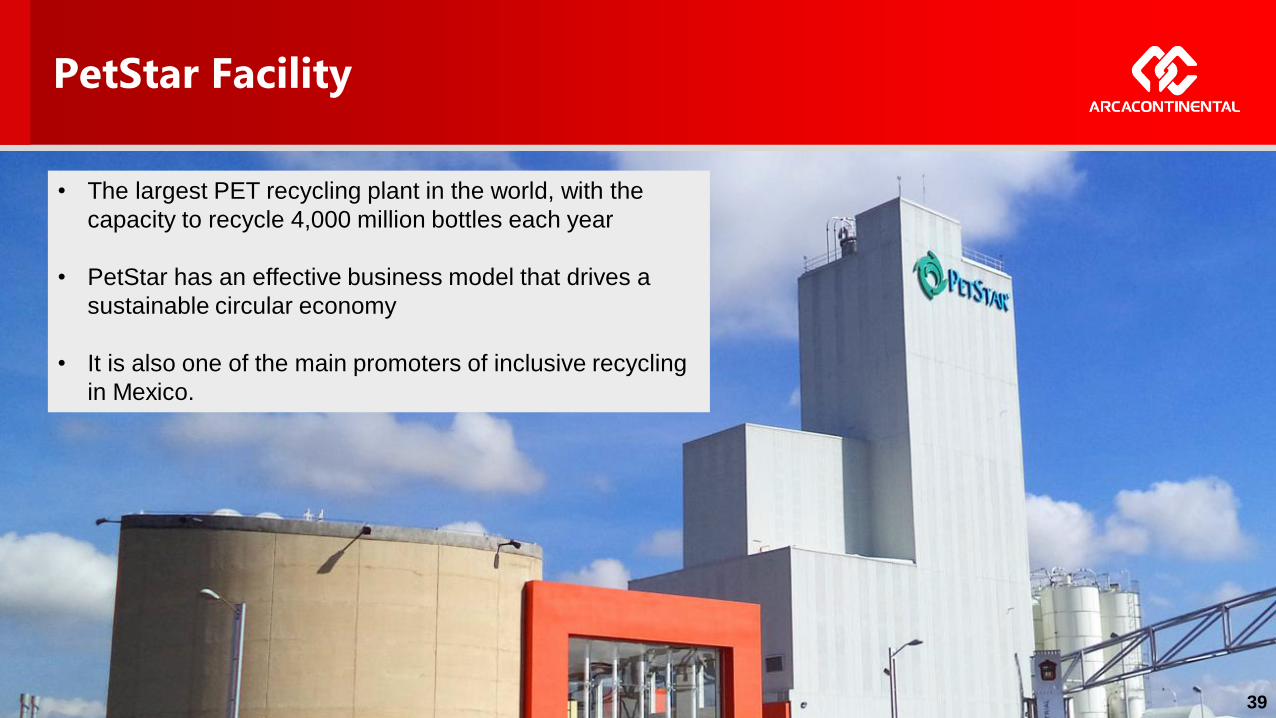
PetStar Facility
• The largest PET recycling plant in the world, with the
capacity to recycle 4,000 million bottles each year
• PetStar has an effective business model that drives a
sustainable circular economy
• It is also one of the main promoters of inclusive recycling
in Mexico.
39
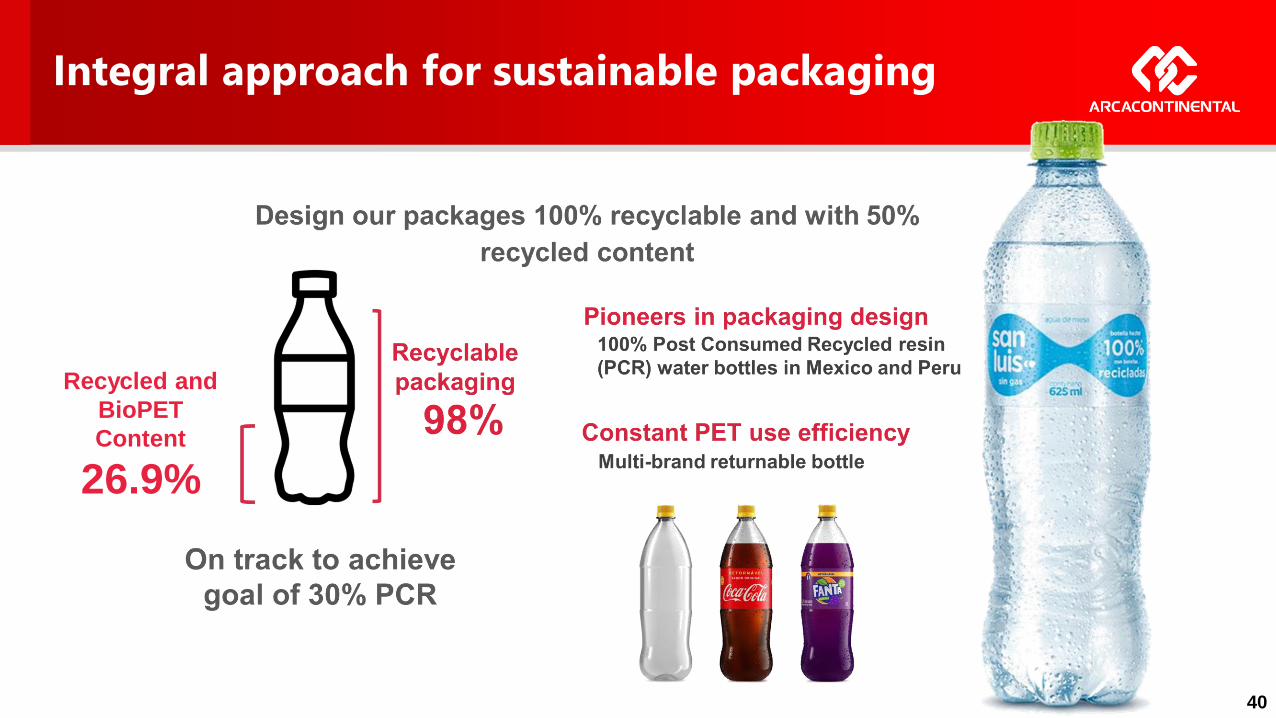
Integral approach for sustainable packaging
40
Recycled and
BioPET
Content
26.9%
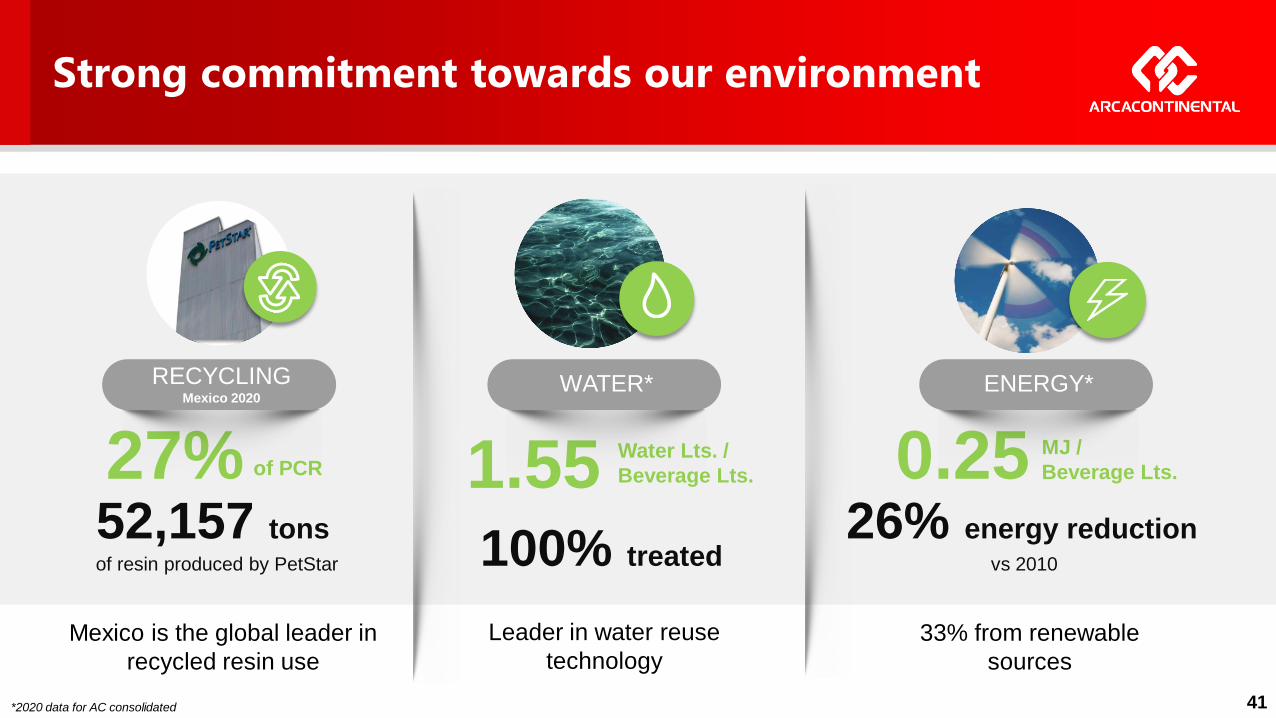
Strong commitment towards our environment
41*2020 data for AC consolidated
of resin produced by PetStar
27% of PCR
52,157 tons
1.55 Water Lts. /
Beverage Lts.
100% treated
0.25 MJ /
Beverage Lts.
26% energy reductionvs 2010
33% from renewable
sources
Leader in water reuse
technology Mexico is the global leader in
recycled resin use
WATER* ENERGY*RECYCLINGMexico 2020
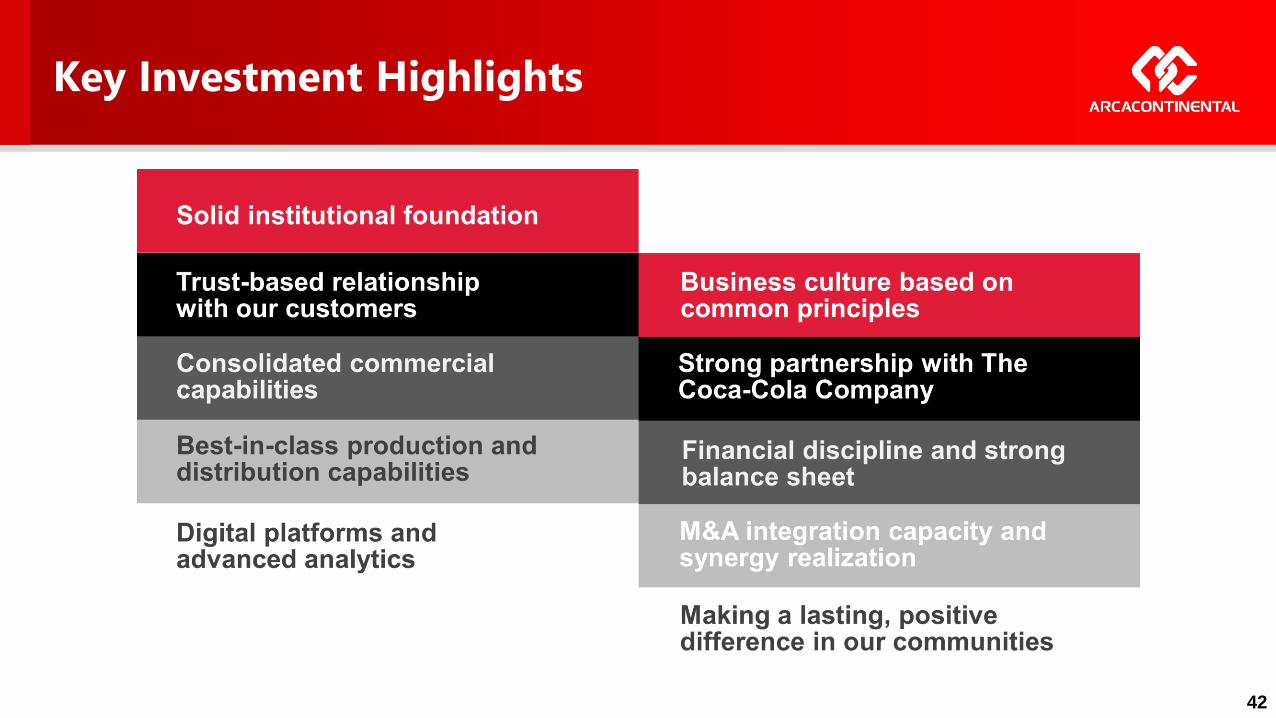
Key Investment Highlights
42
Investor Relations Contact Information
Ulises Fernandez [email protected]
Felipe Barquin [email protected]
Pamela Ortiz [email protected]
Diego Alvarez [email protected]
WEBSITE
www.arcacontal.com
THANK YOU!
43