MAKALAH PENANGGULANGAN BENCANA H2-Kebijakan Publik INSTITUT PEMERINTAHAN DALAM NEGERI

Radiolytic H2 in continental crust: Nuclear power for deepsubsurface microbial communities
Li-Hung Lin and James HallDepartment of Geosciences, Princeton University, Princeton, New Jersey 08540, USA ([email protected])
Geophysical Laboratory, Carnegie Institution of Washington, 5251 Broad Branch Road, N.W, Washington, DC 20015,USA
Johanna Lippmann-PipkeLamont-Doherty Earth Observatory of Columbia University, 61 Route 9W, Palisades, New York 10964, USA
GeoForschungsZentrum Potsdam, Telegraphenberg, Haus B, 320, D-14473 Potsdam, Germany
Julie A. Ward and Barbara Sherwood LollarStable Isotope Laboratory, Department of Geology and Geophysics, University of Toronto, Toronto, 22 Russel Street,
Toronto, Ontario, Canada M5S 3D1
Mary DeFlaunGeoSyntec Consultants, 1 Airport Place, Suite 3, Princeton, New Jersey 08540, USA
Randi RothmelShaw Group, 4100 Quakerbridge Road, Lawrenceville, New Jersey 08648, USA
Duane Moser and Thomas M. GihringPacific Northwest National Laboratory, 902 Battelle Boulevard, Mailstop P7-50, P.O. Box 999, Richland, Washington99352, USA
Bianca Mislowack and T. C. OnstottDepartment of Geosciences, Princeton, New Jersey 08540, USA
[1] H2 is probably the most important substrate for terrestrial subsurface lithoautotrophic microbialcommunities. Abiotic H2 generation is an essential component of subsurface ecosystems truly independentof surface photosynthesis. Here we report that H2 concentrations in fracture water collected from deepsiliclastic and volcanic rock units in the Witwatersrand Basin, South Africa, ranged up to two molar, avalue far greater than observed in shallow aquifers or marine sediments. The high H2 concentrations areconsistent with that predicted by radiolytic dissociation of H2O during radioactive decay of U, Th, and K inthe host rock and the observed He concentrations. None of the other known H2-generating mechanisms canaccount for such high H2 abundance either because of the positive free energy imposed by the high H2
concentration or pH or because of the absence of required mineral phases. The radiolytic H2 is consumedby methanogens and abiotic hydrocarbon synthesis. Our calculations indicate that radiolytic H2 productionis a ubiquitous and virtually limitless source of energy for deep crustal chemolithoautotrophic ecosystems.
Components: 8658 words, 2 figures, 4 tables.
Keywords: continental crust; hydrogen; radiolysis; subsurface ecosystems.
Index Terms: 0448 Biogeosciences: Geomicrobiology; 0456 Biogeosciences: Life in extreme environments.
Received 26 December 2004; Revised 6 February 2005; Accepted 29 April 2005; Published 12 July 2005.
G3G3GeochemistryGeophysics
Geosystems
Published by AGU and the Geochemical Society
AN ELECTRONIC JOURNAL OF THE EARTH SCIENCES
GeochemistryGeophysics
Geosystems
Article
Volume 6, Number 7
12 July 2005
Q07003, doi:10.1029/2004GC000907
ISSN: 1525-2027
Copyright 2005 by the American Geophysical Union 1 of 13

Lin, L.-H., et al. (2005), Radiolytic H2 in continental crust: Nuclear power for deep subsurface microbial communities,
Geochem. Geophys. Geosyst., 6, Q07003, doi:10.1029/2004GC000907.
1. Introduction
[2] One constraint on the extent of subsurfacemicrobial life is whether sufficient energy existsto sustain a minimal metabolism [McKay, 2001].Pedersen [2001] and Stevens and McKinley [1995]have proposed that some subsurface microbialcommunities rely on substrates derived from geo-chemical processes rather than from photosyntheti-cally derived organic carbon. These lithoautotrophicecosystems necessitate abiogenically produced H2.H2 generates substantial energy for various electronacceptors [Amend and Shock, 2001] and its highdiffusivity makes it readily available to microorgan-isms in confined pore spaces. H2 is also crucial forFischer-Tropsch (F-T) synthesis of organic com-pounds [Cody et al., 2000; Rushdi and Simoneit,2001; Sherwood Lollar et al., 2002] where H2,catalyzed by metallic phases, reacts with CO/CO2. The C and H isotopic signatures of thesehydrocarbons are distinct from those of thermo-genic hydrocarbons and microbial CH4 [SherwoodLollar et al., 2002]. Microorganisms utilizing F-Tsynthesized organics as substrates would beindependent of photosynthetically derived organicmatter.
[3] The few dissolved H2 analyses for deep sub-surface environments vary dramatically from <1nM to mM [Haveman and Pedersen, 1999;Marine, 1979; Stevens and McKinley, 1995; Vovk,1987]. These data when combined with the lowabundance of dissolved organic compounds andevidence from microcosm experiments suggest thatautotrophic assimilation dominates over heterotro-phic metabolisms in these environments [Pedersen,2001; Stevens and McKinley, 1995] and that fer-mentation is not the source of the H2. Abiotic H2
production by water-rock interaction and/or tectonicactivity have been proposed [Chapelle et al., 2002;Stevens and McKinley, 1995], but whether theseprocesses can sustain the observed microbial eco-systems remains uncertain. Vovk [1987] proposedthat radiolysis of water explains high subsurface H2
concentrations. His theory is consistent with ob-servation of H2-rich fluid inclusions from a naturalfission reactor at Oklo, Gabon [Savary and Pagel,1997]. Other abiotic H2 generation processes havebeen published, but a systematic comparison of
them for one subsurface environment has not beenundertaken until this study.
[4] To investigate the origins of high H2 concen-trations in the deep subsurface and to determinewhether water radiolysis plays a role in H2 gener-ation, we analyzed the radiolytic and radiogenicproducts, dissolved H2 and He, in 24 groundwatersamples collected from 6 Au and coal mines of theWitwatersrand Basin, South Africa. We evaluatedthe thermodynamic potential of each candidate H2
generation reaction under the in situ conditions toaccount for the observed H2 concentrations.
2. Geological Background andAnalytical Methods
[5] Witwatersrand Basin stratigraphy consists ofthe 2.9 Ga Witwatersrand Supergroup (mainlyquartzite), overlain by the 2.7 Ga VentersdorpSupergroup volcanic sequence and either the 2.5Ga Transvaal Supergroup dolomite or the Permo-Carboniferous Karoo sandstone and shale [Robband Meyer, 1995]. Subvertical dykes and fracturescompartmentalize the hydrological system [Omaret al., 2003]. Au mining operations depressurizethis system and release dissolved gases associatedwith either brines or relatively fresh fracture waterrecharged from the overlying aquifers. High H2
concentrations (up to 33% volume) have beendetected in fracture water [Cook, 1998] and withinmineral fluid inclusions (2–5% volume) [Drennanet al., 1998].
[6] Twenty-four fracture water samples were col-lected from exploration boreholes in five Au minesand one coal mine, Beatrix, Kloof, Driefontein,Mponeng, Evander and Sasol, at depths of 700 to3300 m. The boreholes were isolated from themining environment by a stainless steel telescopingpacker (some internally lined with nylon tubing)attached with a valve-control manifold. Dissolvedgases were stripped into an overturned funnel andcaptured in preevacuated sealed serum vials, whichwere subsequently over-pressurized by several mLof fracture water to prevent air contamination.Noble gas samples were collected in Cu tubes[Lippmann et al., 2003]. Samples for aqueousgeochemistry were collected by filtering (0.2 mm)
GeochemistryGeophysicsGeosystems G3G3
lin et al.: radiolytic h2
in continental crust 10.1029/2004GC000907
2 of 13

and diverting fracture water to serum vials with orwithout preservatives added. The samples werestored in a �20�C freezer or 4�C refrigerator inthe field lab, and later transported back to USA ondry ice for analyses.
[7] H2 and CH4 were analyzed by a Kappa-5 Re-duced Gas Analyzer (RGA 5, Trace Analytical,Sparks, MD) equipped with a Hg vapor detector(reduced gas detector; RGD) for H2 and a flameionization detector (FID) for CH4. Gases wereextracted from sample bottle using a gas tightsyringe and diluted to a concentration less than10 ppm. A total volume of 5 ml diluted samplewas injected through an injection port and dividedevenly into two streamlines for FID and RGDwhereHgO was converted to Hg vapor. Compositionalanalyses of gas samples were also performed atthe Stable Isotope Laboratory of the University ofToronto. A Varian 3400 gas chromatograph (GC)equipped with a FID was used to determine theconcentrations of CH4, C2H6, C3H8 and C4H10.The hydrocarbons were separated on a J&W Scien-tific (Folsom, CA) GS-Q column (30 m � 0.32 mmID) with a He gas flow and the following tempera-ture program: initial 60�Chold 2.5minutes, increaseto 120�C at 5�Cmin�1. AVarian 3800GC, equippedwith a micro-thermal conductivity detector (mTCD)and a Varian Molecular Sieve 5A PLOT fused silicacolumn (25m� 0.53mm ID),was used to determinethe concentrations of the inorganic gas components(H2, He, Ar, O2, CO2 and N2). To determine theconcentrations of Ar, O2 and N2, the He carrier gasflow rate was 3 mL min�1 and the temperatureprogram was: initial 30�C hold 6 minutes, increaseto 80�Cat 15�Cmin�1, hold 4minutes. To determinethe CO2 concentration, the He carrier gas flow ratewas 50mLmin�1 and the temperature programwas:initial 60�C, increase to 250�Cat 20�Cmin�1, hold 6minutes. To determine the concentrations of H2 andHe, the Ar carrier gas flow rate was 2 mLmin�1 andtemperature program was: initial 10�C hold 10minutes, increase to 80�C at 25�C min�1, hold 7minutes. For water samples with >1% H2 the RGAand Varian 3400 GC analyses agreed to within afactor of 2 despite the 1000 times dilution for theRGA analyses. All analyses were run in triplicateand mean values are reported. Reproducibility fortriplicate analyses was ±5% relative error. Noble gasanalyses, including He, were performed on Cu tubesamples using the procedures of Lippmann et al.[2003].
[8] The measured H2 and He concentrations werecorrected for loss through diffusion to the fracture
headspace that is created behind the tunnel face asthe fracture is dewatered [Lippmann et al., 2003].The correction was based on the observationthat the concentration of the dissolved atmosphericnoble gases, 20Ne, 36Ar, 84Kr, 132Xe, progressivelyincreased with increasing atomic mass in a mannerconsistent with diffusive loss at in situ temper-atures from initial concentrations that were inequilibrium with the atmosphere during recharge[Lippmann et al., 2003]. The deficiency of otherdissolved gases can be adjusted according to thedifferences between their diffusion coefficientsand that of 20Ne and the following relationship[Lippmann et al., 2003]:
Ci
C0i
¼ CNe
C0Ne
� � ffiffiffiffiffiffiffiffiffiffiDi Tsð ÞDNe Tsð Þ
q; ð1Þ
where Ci is the measured concentration of specificgas i, Ci
o is the concentration of specific gas i inequilibrium with atmosphere composition, and Di
is the diffusion coefficient [Jaehne et al., 1987] ofspecific gas i at the in situ temperature Ts.
[9] The corrected values were converted to thedissolved concentrations following the procedureof Andrews and Wilson [1987]. Flow rate measuredduring sampling varied by less than 10%. Theuncertainty for the correction for diffusion loss is±10%. Error propagation yielded an uncertaintyless than ±20% for the reported values (after thecorrection for diffusive loss).
[10] The cations were measured by an Optima4300 DV inductively coupled plasma-atomic emis-sion spectrometer (Perkin-Elmer, Wellesley, MA).Anions were measured with a DX-320 ion chro-matograph (Dionex, Sunnyvale, CA). Dissolvedinorganic carbon was determined by an infraredspectrometer (Licor 6352, Lincoln, NE). The totalorganic carbon (TOC) was measured from acidifiedsamples as CO2 generated by catalytic combustionusing an infrared detector (Tekmar Dohrman DC-190, Perkin-Elmer, Wellesley, MA) and repre-sented nonpurgeable organic fraction. The pHand Eh of the fracture water were measured inthe field. The uncertainty for aqueous chemistry is±5%.
[11] The microcosm experiment for H2-utilzingmetabolisms was carried out by supplying theheadspace with 80% of H2 and 20% of CO2, and0.05% (final concentration) of Na2S as a reducingagent. The control sample was prepared in thesame way but autoclaved right after the purging
GeochemistryGeophysicsGeosystems G3G3
lin et al.: radiolytic h2
in continental crust 10.1029/2004GC000907lin et al.: radiolytic h2
in continental crust 10.1029/2004GC000907
3 of 13

of headspace gases. The samples were incubated atthe in situ temperature and the abundances ofheadspace gases were measured by a RGA 5 andcompared to those of the control.
3. Dissolved H2 and He Abundances
[12] H2 abundances ranged up to 27% of thecombustible gases, and the measured concentra-tions spanned over five orders of magnitude with amaximum of 7.41 mM (Table 1). The sample withthe second highest measured H2 concentration(4.98 mM for sample 12) was collected from a 3-day-old, tens of meters long, diamond-drilled bore-hole into metavolcanic rocks at 3.0 kilometersbelow land surface (kmbls). The �10 L min�1
flow rates for the high-salinity (0.23 M Cl�),nonmeteoric fracture water and gas (mostly CH4,H2 and He) indicate that the borehole had beenflushed by >2000 borehole volumes of water(Table 1) prior to sampling. By contrast the lowestmeasured H2 concentration (16 nM for sample 4)was collected from a one-week-old borehole inter-secting the contact between quartzite and a diabasedyke at 1.29 kmbls where the flow rates of low-salinity (0.04 M of Cl�) meteoric fracture waterand gas (mostly CH4, N2 and He) [Ward et al.,2004] were 37.5 and 0.04 L min�1, respectively.The H2 concentrations were not correlated withdepth, salinity, pH, rock type, borehole age, frac-ture water age or any other measurement (correla-tion coefficients were all < 0.5), but the highestconcentrations were typically found in the deeper,highly saline, nonmeteoric, older fracture water[Lippmann et al., 2003].
[13] The measured He concentrations (mostly 4He)(Table 1) ranged over three orders of magnitudeand were not correlated with the H2 data, but werecorrelated with Cl� (correlation coefficient = 0.98).Depending on the assumptions regarding crustalfluxes of 4He, 40Ar and 134,136Xe, the He concen-trations correspond to subsurface residence timesof 1.5 to �20 Myr [Lippmann et al., 2003] duringwhich time the Witwatersrand Basin was at presentpressure and temperature conditions [Omar et al.,2003].
[14] Nine samples were corrected for degassinginto the fracture headspace as the fracture wasdewatered using noble gas analyses [Lippmann etal., 2003]. The corrections increased H2 and Heconcentrations by �10� (Table 1) but did notimpact the H2 to He ratios due to their comparablediffusion coefficients [Jaehne et al., 1987]. Our
data overlap published dissolved H2 and He con-centrations for groundwater from PrecambrianRussian [Vovk, 1987] and Fennoscandian Shields[Haveman and Pedersen, 1999] and the TriassicDunbarton Basin [Marine, 1979] (Figure 1).
[15] Although anomalously high H2 concentrationsthat have been reported for shallow sedimentaryboreholes are artifacts of the drilling process [Bjerget al., 1997; Bjornstad et al., 1994], the H2 con-centrations reported herein are not due to drillingfor the following reasons:
[16] 1. Bjornstad et al. [1994] and Bjerg et al.[1997] used percussion drilling into shallowunconsolidated sands with no drilling fluid circu-lation, whereas mine boreholes are drilled withhigh-rpm diamond bits cooled by mine watercirculating at a rate of L min�1.
[17] 2. Bjornstad et al. [1994] reported that tinyfragments of metal casing generated by pulveriza-tion of the rock during percussion drilling created aslurry that reacted with static groundwater to pro-duce H2 at a rate of �1–10 nM s�1, but thatflushing the borehole with groundwater removedthis effect within �12 hours. In mine drilling thecirculating water removes cuttings and bit frag-ments from the borehole before they have time toreact. Furthermore, mine boreholes are drilledunder pressure so that upon intersection of afluid-filled fracture (at least several MPa) residualmine water and cuttings are removed by the flush-ing of thousands of borehole volumes of fracturewater (Table 1).
[18] 3. Bjerg et al. [1997] reported H2 concentra-tions of �50 mM during drilling and a slow declineover days, whereas H2 concentrations in mineboreholes are observed to slowly increase overdays after drilling (Table 1). Four samples ofsample 14 over 54 days (�2700 to 5700 boreholevolumes) documented increasing H2 concentra-tions (0.3 to 3.7 mM) with increasing gas/waterflow rate ratios and constant gas composition (H2
ranged from 10–12 mole%). The H2 concentrationof sample 8c immediately after fracture intersection(�10 borehole volumes) was �9 times less thanthat 2 weeks later (sample 8d; �5000 boreholevolumes). The increasing gas/water flow ratesprobably represent degassing of water within thefracture as the fracture is drained as inferred fromatmospheric noble gas analyses [Lippmann et al.,2003].
[19] 4. Bjerg et al. [1997] observed <5 nM H2 inadjacent boreholes at <4 m distance, indicating that
GeochemistryGeophysicsGeosystems G3G3
lin et al.: radiolytic h2
in continental crust 10.1029/2004GC000907
4 of 13

Table
1.
CharacteristicsofGroundwater
Sam
plesFrom
theWitwatersrandBasin
Sam
ple
Sam
ple
Nam
eGeological
Form
ation
Borehole
Volumes
aDepth,
kmbls
T,�C
pH
Measured
H2,mM
Diffusion
Corrected
H2,mM
Measured
GC
He,b
mM
Measured
MS
4He,c
mM
Diffusion
Corrected
MS
4He,cmM
Corrected
H2,dmM
d13Cand
d2H
of
CH42
16S
rDNAe
1BE16FW031601
Witwatersrand
�300
0.866
34
8.3
0.119
3.09
43.0
26.3
1,430
NAf
BMBMSar
2BE23FW031301
Witwatersrand
�40,000
0.718
34
8.4
3.70
27
636
57.7
578
NA
BND
3BE24FW032601
Witwatersrand
�10,000
0.768
33
8.0
4.44
104
870
16.3
634
NA
BND
4BE325FW032701
Witwatersrand
�18,000
1.290
39
9.2
0.016
0.381
49.7
56.3
2,040
NA
BND
5BE16FW031401ID
WWitwatersrand
�1000
0.866
34
8.3
0.097
NA
11.0
NA
NA
NA
BND
MB
6EV219FW030901
Ventersdorp
�5�
1011
1.474
32
8.0
0.774
NA
46.9
NA
NA
NA
BMSar
7EV522FW041801
Ventersdorp
�1�
106
1.694
37
7.2
0.025
NA
212
NA
NA
20,200
B+A
NA
MSae
8a
EV818FW030601
Witwatersrand
�2000
1.950
45
8.6
1.28
32
2,670
35.8
2,710
53,800
B+A
MLMSar
8b
EV818BH5-102702
Witwatersrand
�55
1.890
42
7.3
10.2
NA
398
NA
NA
11,000
B+A
Mspir
8c
EV818BH6-102702
Witwatersrand
�10
1.890
46
NA
0.608
NA
3,712
NA
NA
44,000
B+A
NA
8d
EV818BH6-111502
Witwatersrand
�5000
1.890
47
8.0
5.21
NA
3,126
NA
NA
43,800
B+A
NA
9KL441FW050201HWDS
Ventersdorp
�2�
106
3.100
56
8.4
0.455
NA
84.4
NA
NA
1,980
AND
10
KL443FW030501HWDN
Ventersdorp
�900
3.200
52
NA
25.0
NA
5,160
NA
NA
13,600
ANA
11
KL443FW050801HWDN
Ventersdorp
�14,000
3.200
59
8.2
47.3
NA
1,090
NA
NA
12,900
AND
12
KL739062901
Ventersdorp
�2000
3.000
54
8.4
4,980
217,000
2,255
50.3
6,920
1,500,000
AND
13
DR548FW090901
Witwatersrand
�10,000
3.200
42
7.0
7,410
NA
2,090
NA
NA
14,100
ANA
14a
MP104XC56091602
Ventersdorp
�2700
2.825
>60
9.3
259
8,630
336
73.2
1,790
54,000
AMB
14b
MP104XC56091902
Ventersdorp
�3300
2.825
52
9.3
336
11,700
374
66.7
2,520
72,400
AND
14c
MP104XC56092702
Ventersdorp
�4200
2.825
52
9.3
712
11,626
912
122
2,200
91,500
AMB
14d
MP104XC56110902
Ventersdorp
�5700
2.825
52
9.2
3,714
NA
4,021
NA
NA
70,800
AMB
15a
DR938H3110701
Witwatersrand
�10,000
2.716
43
9.0
165
NA
1,332
NA
NA
70,100
AMB
15b
DR938H3071202
Witwatersrand
�11,000
2.716
43
9.1
12.0
NA
63.2
NA
NA
5,270
B+A
MB
16
MBNWFW040301Sec49
Karoo
NA
0.850
26
10.2
0.014
NA
<3
NA
NA
NA
BMSae
17g
DR4IPC
Transvaal
NA
0.945
25
7.5
0.090
20.9
1.22
NA
ND
aBorehole
volumes
flushingborehole
priorto
samplingareminim
um
estimates
based
ontimesince
intersection,borehole
volume,andflow
rate
atthetimeofsampling,whichistypically
much
less
than
initialflow
rate.
bDatafrom
Ward
etal.[2004];d1
3Candd2H
ofCH4formethaneorigin:B,biogenic
origin;A,abiogenic
origin.
cDataforsamples1–4,8a,
and12from
Lippmannet
al.[2003].
dAllanalyseswererunin
triplicate,andmeanvalues
arereported.Reproducibilityfortriplicate
analyseswas
±5%
relativeerror.Themeasuredvalues
wereconvertedto
thedissolved
concentrations
followingtheprocedure
ofAndrewsandWilson[1987].Flowratesmeasuredduringsamplingvariedbyless
than
10%.Theuncertainty
forthecorrectionfordiffusiveloss
is±10%.Errorpropagationyielded
anuncertainty
less
than
±20%
forthereported
values.CorrectedH2concentrationswerereferred
totheoriginalH2abundancescorrectedforconsumptionbyabiogenicCH4form
ationand/ordiffusiveloss.The
calculationswereonly
restricted
tothesampleswithabiogenically
isotopic
signaturesdueto
theuncertainties
whether
H2-consumingmethanogensweresolely
responsible
formicrobialH2utilization.
eDataforsamples1–8a,9–11
and16from
Ward
etal.[2004].MB,Methanobacterium;MSae,Methanosaeta;ML,Methanolobus;MSar,Methanosarcina;MSpir,Methanospirrillum;ND,Archaeawerenot
detected.MBforsample
14was
justabovedetectionlimit.
fNA,notavailable.
gNodiffusioncorrectionrequired
from
noble
gas
analyses.
GeochemistryGeophysicsGeosystems G3G3
lin et al.: radiolytic h2
in continental crust 10.1029/2004GC000907
5 of 13
H2 migrated through permeable aquifer to adjacentwells, whereas the boreholes reported herein areseparated from other boreholes by hundreds ofmeters of low-permeability (<mDarcy) rock andbecause all drilling is below formation pressureany drilling-produced H2 migrates out of the bore-hole with the drilling fluid, not into and through therock formation.
[20] 5. Bjerg et al. [1997] observed a longer term,anomalously high H2 concentration (�100 nM)created by slowly pumping groundwater(100 mL min�1) through 10 m of 2-cm diameterBlack Iron casing (�2000 seconds of reaction time)and no anomalously high H2 for stainless steelcasing. The boreholes used in this study had eithera 1 m long steel casing at the outlet or no casing atall and for the observed flow rates water would have
only 1 to 30 seconds to interact with the steel toproduce H2. H2 concentrations and gas compositionexhibited no correlation with water flow rates or thepresence or absence of steel casing.
4. Assessment of H2 Production
[21] Proposed H2 production mechanisms include(1) organic fermentation [Boone et al., 1989], (2)serpentinization [Coveney et al., 1987], (3) oxida-tion of Fe2+-bearing minerals [Stevens andMcKinley, 2000], (4) formation of FeS2 from FeS[Drobner et al., 1990], (5) thermodecomposition ofalkanes and carboxylic acids [Seewald, 2001], (6)fracture-induced reduction of water [Kita et al.,1982], and (7) radiolysis of water [Spinks andWoods, 1990]. Other mechanisms, such as the
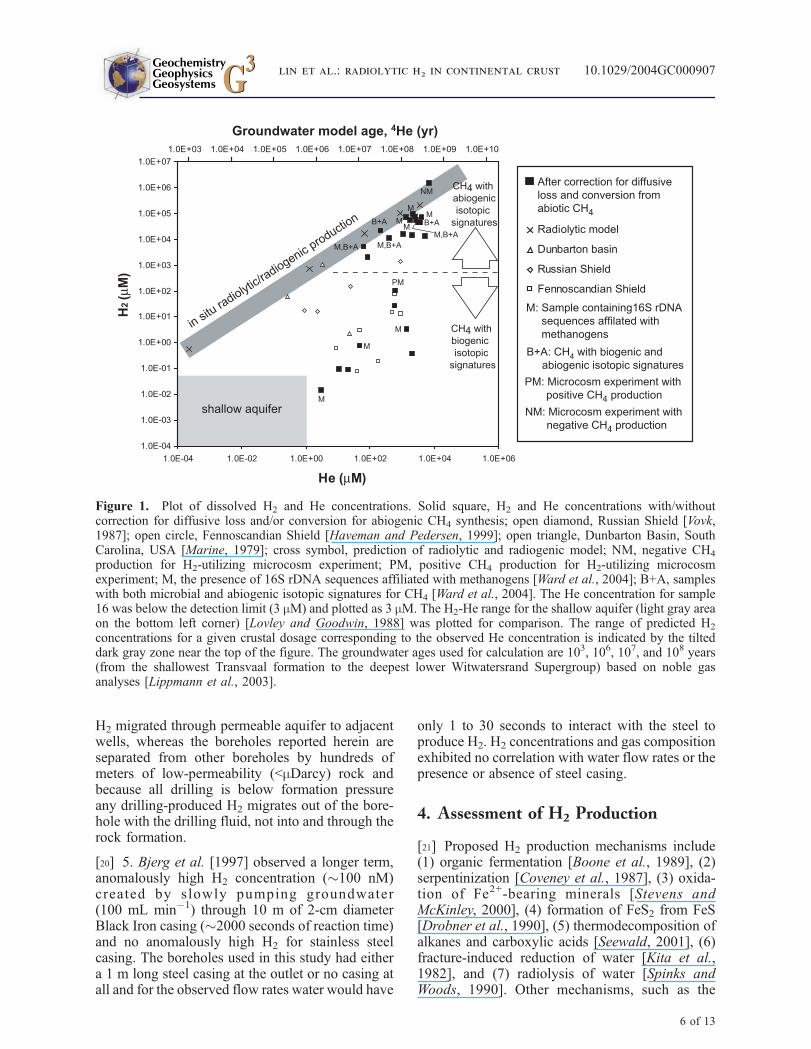
Figure 1. Plot of dissolved H2 and He concentrations. Solid square, H2 and He concentrations with/withoutcorrection for diffusive loss and/or conversion for abiogenic CH4 synthesis; open diamond, Russian Shield [Vovk,1987]; open circle, Fennoscandian Shield [Haveman and Pedersen, 1999]; open triangle, Dunbarton Basin, SouthCarolina, USA [Marine, 1979]; cross symbol, prediction of radiolytic and radiogenic model; NM, negative CH4
production for H2-utilizing microcosm experiment; PM, positive CH4 production for H2-utilizing microcosmexperiment; M, the presence of 16S rDNA sequences affiliated with methanogens [Ward et al., 2004]; B+A, sampleswith both microbial and abiogenic isotopic signatures for CH4 [Ward et al., 2004]. The He concentration for sample16 was below the detection limit (3 mM) and plotted as 3 mM. The H2-He range for the shallow aquifer (light gray areaon the bottom left corner) [Lovley and Goodwin, 1988] was plotted for comparison. The range of predicted H2
concentrations for a given crustal dosage corresponding to the observed He concentration is indicated by the tilteddark gray zone near the top of the figure. The groundwater ages used for calculation are 103, 106, 107, and 108 years(from the shallowest Transvaal formation to the deepest lower Witwatersrand Supergroup) based on noble gasanalyses [Lippmann et al., 2003].
GeochemistryGeophysicsGeosystems G3G3
lin et al.: radiolytic h2
in continental crust 10.1029/2004GC000907
6 of 13

equilibrium in the C-H-O-S system in magmas andthe decomposition of CH4 to H2 and graphite attemperatures above 600�C [Apps and van deKamp, 1994], were not considered because theHe and Xe isotopes indicate a local, crustal originfor the dissolved gases [Lippmann et al., 2003].
4.1. Potentials for Mechanisms1 Through 6
[22] The potential for H2 and acetate productionfrom decomposition of complex organic com-pounds by fermentative microorganisms (mecha-nism 1) [Boone et al., 1989] was evaluated bycalculating the Gibbs free energy of fermentationreaction for propionate under the in situ conditions:
Propionate� þ 3H2O $ acetate� þ HCO�3 þ Hþ þ 3H2:
ð2Þ
The concentrations of reactants and products werederived from field and laboratory measurements(Table 2). The calculation yielded positive freeenergies for all the samples except samples 7, 8cand 9 (Table 3) and indicated that fermentation isprohibited in most samples because of the highconcentrations of dissolved H2. In addition topropionate, the uncharacterized carbon in the TOCpool can also be the potential substrate for
fermentation. One extreme scenario is to assumethat the residual TOC after subtraction of acetate,formate, propionate, and cell biomass is equivalentto butyrate. This is the maximum amount oforganic matter available for fermentation. Thefermentation of the hypothetical butyrate wasassumed to produce acetate, H2, and bicarbonate(reaction 2 in Table 3). The free energies werepositive for most samples with the exception ofsamples 4, 6, 7 and 8d (Table 3). Of the otherinvestigated potential substrates, including long-chain carboxylic acid (C5 to C12), benzoate,malonate, benzene and toluene, the fermentationreaction yielded positive free energies for mostsamples. The failure of microbial fermentation toexplain the high H2 concentrations in the Witwa-tersrand Basin therefore is not dependent on theassumed organic substrate.
[23] H2 production can also occur by oxidation ofFe2+-bearing silicates (e.g., olivine and augite) withreduction of water (mechanisms 2 and 3) [Coveneyet al., 1987; Stevens and McKinley, 2000]. Theseminerals are absent in the strata of theWitwatersrandBasin because of the low-grade greenschist faciesmetamorphism during the early Proterozoic. TheWitwatersrand Supergroup contains chlorite- andchloritoid-bearing shales, whereas the VentersdorpSupergroup volcanic units are composed of horn-
Table 2. Geochemical Compositions of Groundwater Samples Used in the Free Energy Estimationa
SampleCl�,mM
TOC,mM
Acetate,mM
Formate,mM
Pro-pionate,mM
HS�,mM
Ca2+,mM
CH4,mMb
C2H6,mMb
C3H8,mMb
C4H9,mMb
DIC,mM
1 34.3 0.14 7.00 3.20 0.42 <3 1.0 2755 5.7 0.3 ND 711.42 35.1 0.16 8.04 7.90 ND <3 1.7 11931 ND ND ND 636.43 38.9 0.18 18.5 4.31 ND <3 1.9 35166 ND ND ND 600.04 40.4 0.18 7.32 3.63 ND 1212 2.9 752 1.8 0.2 ND 375.05 38.5 0.17 6.94 5.91 0.31 <3 1.8 520 ND ND ND 622.76 17.6 0.38 12.5 5.46 ND 303 0.3 7762 ND ND ND 993.47 64.9 0.29 11.3 10.9 0.16 242 7.2 6314 278 26.3 2.5 1094.18a 161.5 0.22 7.69 0.29 ND 21 35.5 15800 617 37.5 2.1 71.88b 173.9 NA 10.0 4.02 ND 404 39.5 3250 99.3 6.2 0.1 95.78c 162.2 NA 47.8 1.57 ND 787 37.3 13070 466 ND ND 48.48d 172.1 0.61 10.2 0.22 ND 771 38.8 12980 476 30.2 ND 37.89 44.0 0.46 3.23 6.40 0.13 <3 11.5 495 11.7 0.9 ND ND10 NA NA NA NA NA NA NA 3389 124 15.9 2.1 NA11 351.9 1.67 102 182 3.83 606 82.0 3988 142 14.5 1.7 16.512 230.6 0.49 60.8 23.47 ND 3393 70.0 320400 917 91.2 9.1 18.913 1801.5 1.83 6.54 88.5 31.9 16 271.3 1679 88.6 6.2 0.5 8.014a 55.0 NA 24.9 7.67 0.25 1415 23.5 11350 776 89.3 10.1 35.314b NA NA NA NA NA NA NA 15176 1024 117 12 NA14c 72.7 NA 22.8 7.14 0.06 1231 23.9 19969 1414 178 21.2 5.614d 79.9 0.43 36.1 0.90 0.24 1068 20.0 16760 1359 194 30.3 72.715a 29.4 0.40 29.4 1.58 0.70 438 2.1 17490 744 74.2 8.67 171.315b 28.3 NA 40.7 0.89 0.27 38 2.0 1462 65.8 5.85 0.57 128.1
aND, below detection limit; NA, not available. Samples 16 and 17 are not included because the origin of their H2 in not in question.
bData from Ward et al. [2004].
GeochemistryGeophysicsGeosystems G3G3
lin et al.: radiolytic h2
in continental crust 10.1029/2004GC000907
7 of 13

blende replacing clinopyroxene phenocrysts withchlorite, epidote and minor clinozoisite, tremoliteand actinolite present in the matrix [Schweitzer andKroener, 1985]. Minor ultramafic intrusives arecomposed of hornblende pseudomorphs of clinopyr-oxene with chloritic groundmass. The greatest po-tential for H2 production by these two mechanismstherefore arises from the 1.4Ga Pilanesberg dolerite/syenite composite dykes and the 200 Ma Karoodolerite dykes, respectively. The Pilanesberg dykescontain mafic phenocrysts of augite partially alteredto hornblende and encompassed by biotite andmagnetite, and minor chlorite and actinolite arepresent [Ferguson, 1973; Van Niekerk, 1962]. TheKaroo dolerites are composed of similar maficmineral assemblage with fewer hydrous phases. Inorder to assess the potential of these mechanisms,equilibrium H2 concentrations were calculated foroxidation of these Fe-bearing assemblages. Thecalculations were based on the assumption that theFe-bearing products for the reaction were eithermagnetite or goethite and quartz. Our calculationsindicated that equilibrium H2 concentrations formagnetite and hydrous Fe-bearing phases, such ashornblende and greenalite, can only yield sub-nM
H2 at the in situ pH and pe. Fayalite and ferrosilitecan generate H2 concentrations ranging from mM totens of mM, but they are absent in these geo-logical formations. The equilibrium H2 concen-tration derived from oxidation of the Fe-bearingclinopyroxene end-member, hedenbergite, is in-versely related to the pH and Ca2+ activity(Figure 2). In the deep, highly saline fracturewater where mM H2 was found, this equilibriumH2 concentration falls well below the observedconcentrations (line c in Figure 2). In the low-salinity, circum neutral fracture water that typifiesshallower fracture zones, the equilibrium H2
concentration falls well above the mM H2 ob-served (line d in Figure 2). From a strictlythermodynamic perspective, the oxidation of Fe-bearing clinopyroxene associated with the sparsemafic intrusions can account for some of theobserved H2 concentrations in the shallowerfracture zone, but not the extremely high H2
concentrations found in the deepest, Ca-rich,saline fracture water.
[24] The equilibrium H2 concentration from oxida-tion of FeS to FeS2 (mechanism 4) is inversely
Table 3. Gibbs Free Energy for Fermentation and Thermodecomposition of Alkanes and Carboxylic Acidsa
Sample Sample Name
DG,b kJ/mol
(1) (2) (3) (4) (5) (6) (7) (8)
1 BE16FW031601GDW hole 1 11 8 43 51 60 69 20 312 BE23FW031301A4RD 74 38 65 135 156 176 50 1133 BE24FW032601C18W17 78 66 79 164 198 231 64 1424 BE325FW032701CTS hole 1 23 �47 19 3 �12 �2 �5 175 BE16FW031401 IDW 9 53 16 �3 20 40 �8 206 EV219FW030901ED hole 5 41 �8 35 81 79 76 19 607 EV522FW041801CTS hole 1 �11 �50 6 �20 �37 �54 �11 �228a EV818FW030601NEPD 6 91 38 31 32 33 4 118b EV818BH5-102702 12 NA 44 42 48 57 18 318c EV818BH6-102702 �5 NA 11 �13 �13 �35 �16 �238d EV818BH6-111502 8 �17 34 27 29 38 10 189 KL441FW050201XC56HWDS hole 2 �25 66 4 �32 �60 �85 �27 �5211 KL443FW050801XC43HWDN 10 84 44 46 42 51 10 2012 KL739062901 92 193 133 208 288 368 110 8813 DR548FW090901 80 150 153 231 319 406 121 19914a MP104XC56091602 49 NA 94 126 167 207 62 11114c MP104XC56092702 48 NA 95 128 170 212 61 11314d MP104XC56110902 52 71 93 126 167 208 64 11915a DR938 H3 110701 38 36 68 88 115 142 46 8315b DR938 H3 071202 15 NA 38 40 46 51 17 34
aNA, not available.
bReactions used for calculation of free energy:
Propionate� + 3 H2O $ acetate� + HCO3� + H+ + 3 H2 (1)
Butyrate� + 6 H2O $ 6 H2 + acetate� + 2 HCO3� + 2 H+ (2)
Methane + 3 H2O $ 4 H2 + H+ + HCO3� (3)
Ethane + 6 H2O $ 7 H2 + 2 H+ + 2 HCO3� (4)
Propane + 9 H2O $ 10 H2 + 3 H+ + 3 HCO3� (5)
n-butane + 12 H2O $ 13 H2 + 4 H+ + 4 HCO3� (6)
Acetate� + 4 H2O $ 4 H2 + H+ + 2 HCO3� (7)
Propionate� + 7 H2O $ 7 H2 + 3 HCO3� + 2 H+ (8)
GeochemistryGeophysicsGeosystems G3G3
lin et al.: radiolytic h2
in continental crust 10.1029/2004GC000907
8 of 13

related to the dissolved HS� and depends on the pHwith a constant H2 concentration for pH < 7 anddiminishing H2 concentration with increasing pHabove 7 (line a versus b in Figure 2). For sulfidic,saline, deep fracture water, the H2 concentration inequilibrium with this reaction falls well below theobserved mMH2 concentrations (line a in Figure 2).For shallow, low-salinity fracture water, the H2
concentration in equilibrium with this reaction liesabove the observed mM H2 concentrations despitethe low sulfide concentrations (line b in Figure 2).The pyrite precipitation reaction can account forsome of the low H2 concentrations, but it cannotproduce tens of mM H2 concentrations observed inthe deeper, alkaline fracture water.
[25] H2 can be generated by the thermal decom-position of long-chain hydrocarbons and smallcarboxylic acids (acetate and propionate) in thepresence of metallic sulfide or metals as catalystsunder the hydrothermal conditions (above 200�Cand 350 bars) (mechanism 5) [Seewald, 2001].The free energy for organic dehydrogenationreactions were positive for samples with H2 concen-
trations >1 mM (Table 3), precluding a thermogenicorigin of the H2 in these samples. Although thermo-genic H2 is compatible with the free energy calcu-lations for the samples with <1 mMH2 (samples 4, 5,7, 8c and 9 in Table 3), it is not consistent with theisotopic analyses of the C1–4 hydrocarbon com-pounds [Ward et al., 2004]. This suggests thatthermodecomposition of hydrocarbons and carbox-ylic acids can account for nM H2 concentrations, ifthe reaction rates are not too sluggish at temperatures<60�C. H2 production by this mechanism, however,cannot account for the observed mM to mM H2
concentrations. Nor is the thermodecomposition ofthe alkanes consistent with the observed C and Hisotopic compositions [Ward et al., 2004].
[26] H2 generation from reduction of H2O bybroken Si-O bonds has been proposed as a mech-anism to explain H2 anomalies associated withactive fault zones (mechanism 6) [Kita et al.,1982]. On the basis of the experimental data ofKita et al. [1982], quartzite or granite with 1%porosity that are completely crushed to less than0.5 mm in a fault zone will produce�1 to 10 mMH2.
Figure 2. Plot of H2 concentrations versus pH. Solid squares, corrected H2 concentrations. Lines a and b bound therange of theoretical equilibrium H2 concentrations derived for FeS2 formation (mechanism 4), whereas lines c and dare for CaFeSi2O6 oxidation (mechanism 3). Each line was calculated according to the groundwater chemistry fromthe sample listed in the legend (Table 1 and Table 2). The reaction for lines a and b is FeS + H+ + HS� $ FeS2 + H2,whereas for lines c and d the reaction is CaFeSi2O6 + 2 H+ $ 1/3 Fe3O4 + 2 SiO2 + Ca2+ + 1/3 H2 + 2/3 H2O. Thesmall dashed lines with arrows represent the deviation of the measured H2 concentrations from the theoreticalequilibrium H2 concentrations. Sample/depth are provided next to the data point.
GeochemistryGeophysicsGeosystems G3G3
lin et al.: radiolytic h2
in continental crust 10.1029/2004GC000907
9 of 13

This does not explain the mM H2 concentrationsobserved in our fracture zones even if they weretectonically active fault zones, which they are not.
4.2. Radiolytic Model
[27] Radiolytic H2 is produced through dissociationof water by a, b and g particles released duringradiogenic decay of U, Th andK [Spinks andWoods,1990]. These particles dissociate H2O into e�, H+,H. andOH. radicals, H2 andH2O2,which then reactwithin ms to yield H2, O2, and H2O2. The
4Heconcentration is the sum of the a dose and the 4Hethat is diffused from the solid matrix into the water.The H2 and He generation rates depend primarily onthe U, Th and K concentrations of the strata and noton environmental conditions (e.g., pH or pe), andthey increase only slightly with decreasing porositybecause of the complementary increase in bulkU,Thand K concentrations [Hoffmann, 1992].
[28] H2 and 4He generation rates were estimatedfor the Witwatersrand sequences and the underly-ing continental crust using published U, Th, and Kdata (Table 4) [Nicolaysen et al., 1981]. H2 and4He production rates along a crustal profile werecalculated to the depth of 20 km according toequations (3) [Hoffmann, 1992] and (4) [Spinksand Woods, 1990]:
Enet;i ¼Ei �W � Si
1þW þ Si; ð3Þ
Y ¼X
Enet;i � Gi; ð4Þ
where i represents an a, b, or g irradiation, Enet (Jkg�1 sec�1) is the net absorbed dose rate of pore
water, W is the weight ratio of pore water to rock(3.7 � 10�4 for a porosity of 0.1% and rockdensity of 2.7 g cm�3), Ei (J kg�1 sec�1) is theapparent dose rate from decay of U, Th, and K, Siis the stopping power of silicate matrix (Sa: 1.5, Sb:1.25, Sg: 1.14) [Hoffmann, 1992], Gi (mole J�1) isH2 yield per unit of absorbed energy (0.96, 0.6 and0.4 molecules (100 eV)�1 for a, b, and g radiation,respectively) [Harris and Pimblott, 2002; Spinksand Woods, 1990], and Y (mole kg�1 sec�1) is theH2 production rate. We calculated the apparentdosage rate for a specific particle and correctedthe effect of stopping power for silicates usingequation (3) to obtain the net dosage rate (Table 4).H2 production rates for a specific particle werederived from the product of the net dosage rate andH2 yield and were summed together to obtain thebulk H2 production rate using equation (4).Diminishing radiogenic U, Th and K concentra-tions by decay were not considered because thenoble gas analyses indicated that the waterresidence time was less than 100 Ma [Lippmannet al., 2003]. 4He production rate was calculated onthe basis of the same rock chemistry used for H2
production.
[29] The calculation yields H2 and4He generation
rates ranging from 10�1 to �1 nM yr�1 and 10�4
to 10�2 nM yr�1, respectively. For the U concen-trations estimated from Xe isotope analyses of thefracture water [Lippmann et al., 2003], the H2
and 4He production rates are 102 nM yr�1 and1 nM yr�1, respectively. Although the high Uconcentrations of the ore zones elevate the produc-tion rates of H2 and 4He, their minor volumetricabundance limits their contribution to <10% of thetotal H2 and 4He production rates for the Witwa-
Table 4. Parameters and Results for Calculations of Model H2 and He Productionsa
FormationU,ppm
Th,ppm K, % Porosity, %
Enet-a,ev s�1 g�1
Enet-b,ev s�1 g�1
Enet-g,ev s�1 g�1
H2 Rate,nM yr�1
He Rate,nM yr�1
Transvaaldolomite
0.60 5.00 0.56 5.00 7.25E+05 6.58E+04 4.00E+04 5.88E-01 2.29E-04
VentersdorpSupergroup
0.83 5.20 1.45 2.00 8.52E+05 1.72E+05 8.91E+04 7.53E-01 1.27E-03
Up. WitsSupergroup
2.33 10.90 1.91 1.00 2.05E+06 2.28E+05 1.32E+05 1.72E+00 6.60E-03
Lw. WitsSupergroup
1.30 7.30 1.47 0.50 1.26E+06 1.76E+05 9.68E+04 1.08E+00 8.53E-03
Up. VredefortCrust
2.43 15.65 3.57 0.25 2.55E+06 4.27E+05 2.27E+05 1.09E+00 3.50E-02
Lw. VredefortCrust
0.40 7.05 3.43 0.12 8.50E+05 4.11E+05 1.95E+05 4.74E-01 2.51E-02
Lw. Crust 0.20 3.52 3.00 0.07 4.25E+05 3.60E+05 1.65E+05 3.01E-01 2.23E-02
aEnet, net dosage for a, b, or g irradiation.
GeochemistryGeophysicsGeosystems G3G3
lin et al.: radiolytic h2
in continental crust 10.1029/2004GC000907
10 of 13
tersrand strata. The predicted radiolytic H2 concen-tration for each stratigraphic unit (cross symbols inFigure 1) was calculated by multiplying the mea-sured He concentration by the theoretical H2/Heproduction ratio.
4.3. Comparison of Modeling ResultsWith Analytical Data
[30] The predicted H2-He relationship bounds thefive high H2 concentrations (samples 7, 12, 14c,15a and 15b in Figure 1), while nine other samples(8a–d, 9, 11, 14a–b and 14d) with similar H2
concentrations but more He lie slightly below thepredicted line. Given that the predicted radiolyticH2 concentrations are well constrained by themeasured He, U, Th, and K concentrations andradiolysis theory and that the diffusivities of H2
and He are similar, the most logical explanation forH2 data that are less than that predicted by radiol-ysis is H2 consumption by abiotic reactions and/ormicrobial H2 oxidation.
[31] The C and H isotopic compositions of C1–4
hydrocarbons were used to infer the presence orabsence of H2-consuming processes. Samples 9–15a (Figure 1 and Table 1) yielded C1–4 isotopiccompositions indicative of abiogenic processes[Ward et al., 2004]. Six samples (samples 7, 8a–d and 15b in Table 1) yielded CH4 isotopic valuesconsistent with a mixture of 80–85% abiogenicCH4 and 15–20% of microbial CH4 [Ward et al.,2004]. In the 15 abiogenic CH4-bearing samples,the amount of H2 consumed by the abiotic CH4
formation (4H2 + CO2 $ CH4 + 2H2O) wascalculated using a H2:CH4 stoichiometric ratio of4:1. This H2 concentration was added to themeasured H2 concentration (w/o correction fordiffusive loss) to obtain initial H2 concentrationsranging from 1.9 mM to 1.6 M (Figure 1 andTable 1). Correction of the H2 concentration for theH2 consumed by the measured abiogenic CH4
shifts samples 9–15a closer to the predicted radio-lytic H2 concentration (Table 1). These slightlyhigher H2 concentrations are still consistent withthe predictions of radiolysis. A similar correction tothe H2 concentrations from methanogen-bearingfracture water cannot be performed as some or allof the CH4 could have originated from acetoclasticmethanogenesis.
[32] Samples 1–8, 15b and 16 (Figure 1 and Table 1)possessed CH4 isotopic compositions indicative ofmethanogenesis [Ward et al., 2004]. This inferencewas consistent with the results derived from culti-
vation, microcosm experiments and 16S rDNAsequence analyses (Table 1). One H2-utilizingmethanogen has been isolated from a 2 kmblsfracture zone near to the location of samples 1–5[Bonin and Boone, 2004]. Microcosm experimentsshowed that sample 3 produced CH4 during a two-month incubation at the in situ temperature with H2
in the headspace, whereas sample 12 did not(Figure 1). 16S rDNA sequences affiliated withmethanogens were detected for samples 1, 6, 8a,8b, 14a, 14c, 14d, 15a, 15b, and 16 (Table 1). Theabiogenic H2 consumption process appears to dom-inate in fracture zones >2 kmbls, whereas biogenicH2 consumption is more prevalent in fracture zones<2 kmbls.
[33] Although the H2O2 produced during radioly-sis has not been detected in the fracture watersamples, 5 to 500 mM of SO4
2� has been mea-sured in the rock pore water (T. C. Onstott et al.,unpublished data, 2004). These concentrations arehigher than observed in the fracture water andlikely represents the oxidation product of sulfidein the rock by radiolytically produced O2, OH.and H2O2. The S2� and Fe2+ derived fromanaerobic microbial metabolisms (sulfate reduc-tion and iron reduction) could also be convertedby these oxidants to their oxidized equivalents,providing a cycling mechanism that would re-move the deleterious oxidants while sustaininganaerobic metabolism.
5. Subsurface H2 Flux
[34] Steady state diffusive crustal H2 fluxesproduced by water radiolysis in the Witwaters-rand Basin were estimated from equations (5)and (6):
Dd2c
dz2þ R ¼ 0; ð5Þ
J ¼ �jDd C
dz; ð6Þ
where R (mM yr�1) is the net production rate of H2,J (mmoles m�2 yr�1) is the H2 flux, D (m2 yr�1) isthe diffusion coefficient [Jaehne et al., 1987], dC/dz(mMm�1) is the concentration gradient, and f is theeffective porosity of rocks (�1%). Calculated H2
fluxes for the top 20 km of the Witwatersrand Basinare �8 mmoles m�2 yr�1 assuming no H2
consumption. This is less than an H2 flux of�50 mmoles m�2 yr�1 calculated for a shallowaquifer at Lake City, South Carolina based onacetate and formate fluxes reported for a shale-
GeochemistryGeophysicsGeosystems G3G3
lin et al.: radiolytic h2
in continental crust 10.1029/2004GC000907
11 of 13

sandstone transition [McMahon and Chapelle,1991] and a hypothetical fermentation reaction:
Glucose þ 4 H2O ! acetic acidþ 2 formic acid
þ 6 H2 þ 2 CO2: ð7Þ
[35] Both fluxes are substantially less than the 104
to 106 mmoles m�2 yr�1 H2 fluxes reported forintertidal and subtidal microbial mats [Hoehler etal., 2002]. H2 fluxes and turn over rates increasedramatically from the less productive lithoautotro-phic to highly productive, solar powered, photo-synthetic ecosystems. In surface microbial mats,the flux of fixed organic carbon from photosyn-thetic microorganisms fuels fermentative bacteria,thereby enhancing H2 production and H2 concen-trations are controlled either by diffusion to theatmosphere or H2-utilizing microorganisms. Inshallow aquifers, fermentative microorganisms ca-pable of utilizing dead, photosynthetically fixedorganic carbon generate a lower biogenic H2 flux.The H2 concentrations controlled by H2-utilizinganaerobes remain at levels sufficient to keep thefermentation reaction exergonic and capable ofsustaining the fermentative microorganisms. Theestimated radiolytic H2 flux from the shale aquitardto sandstone aquifer would contribute only �1%(�0.5 mmoles m�2 yr�1) to this total H2 flux[Onstott et al., 1998], indicating that biogenic H2
still dominates over abiotic H2 production in shal-low aquifer ecosystems.
6. Conclusions and Implications
[36] In deep subsurface environments like the Wit-watersrand Basin where the fracture water flow isvery slow and organic carbon is scarce, the influ-ence of fermentative production would be muchless than in shallow environments and H2 concen-trations arewell above the threshold for fermentativereactions, indicating that biogenic contributions arenegligible. Although other abiotic mechanismscould be contributing to the total H2 production inthe Witwatersrand Basin, they are not required asradiolytic H2 production more than suffices to ex-plain the observed H2 concentrations (up to 2 molar)and to support the lithoautotrophic communitiesdetected in the fracture water. Unlike all the othermechanisms which depend on a combination ofgeochemical and mineralogical species, the radiol-ysis of water only requires water and K (or otherradioactive elements) and will diminish with theslow decay of the radiogenic elements. A radiolyti-cally driven power source therefore seems a plausi-
ble alternative for subsurface life on other planetsand satellites where surface conditions prohibitphotosynthesis, such as Mars and Europa [McKay,2001].
Acknowledgments
[37] This work is supported by NSF grants (EAR-9978267)
for the LExEn (Life in Extreme Environments) Program. We
thank the team members of the Witwatersrand Microbiology
project and geologists of Driefontein, Evander, Mponeng,
Kloof, Beatrix, and Sasol mines for their assistance in field
sampling and coordination of logistical supply. We also
acknowledge E. Van Heerden and D. Litthauer (Univ. of Free
State) for providing laboratory space and assisting with sample
collection and R. Wilson (SRK-Turgis Tech.) for setup of the
field laboratory and logistical assistance. We thank L. D.
Labeyrie and two anonymous reviewers for their critical
reviews and helpful comments.
References
Amend, J. P., and E. L. Shock (2001), Energetics of overallmetabolic reactions of thermophilic and hyperthermophilicArchaea and Bacteria, FEMS Microbiol. Rev., 25, 175–243.
Andrews, J. N., and G. B. Wilson (1987), The composition ofdissolved gases in deep groundwaters and groundwater de-gassing, in Saline Water and Gases in Crystalline Rocks,edited by P. Fritz and S. K. Frape, Geol. Assoc. Can. Spec.Pap., 33, 245–252.
Apps, J. A., and P. C. van de Kamp (1994), Energy gases ofabiogenic origin in the Earth’s crust, in The Future of EnergyGases, edited by D. G. Howell, pp. 81–132, U.S. Geol. Surv.Prof. Pap. 1570.
Bjerg, P. L., R. Jakobsen, H. Bay, M. Rasmussen, H.-J.Albrechtsen, and T. H. Christensen (1997), Effects ofsampling well construction on H2 measurements made forcharacterization of redox conditions in a contaminatedaquifer, Environ. Sci. Technol., 31, 3029–3031.
Bjornstad, B. N., J. P. McKinley, T. O. Stevens, S. A. Rawson,and J. K. Fredrickson (1994), Generation of hydrogen gas asa result of drilling within the saturated zone, Ground WaterMonit. Rem., 14, 140–147.
Bonin, A., and D. R. Boone (2004), Microbial isolations andcharacterizations from the deep terrestrial subsurface of theSouth African gold mines, paper presented at 104th GeneralMeeting of the American Society of Microbiology, NewOrleans, La.
Boone, D. R., R. L. Johnson, and Y. Liu (1989), Diffusion ofthe interspecies electron carrier H2 and formate in methano-genic ecosystems and its implications in the measurement ofKm for H2 or formate uptake, Appl. Environ. Microbiol., 55,1735–1741.
Chapelle, F. H., K. O’Neill, P. M. Bradley, B. A. Methe, S. A.Ciufo, L. L. Knobel, and D. R. Lovley (2002), A hydrogen-based subsurface microbial community dominated by metha-nogens, Nature, 415, 312–315.
Cody, G. D., N. Boctor, J. Blank, J. Brandes, N. Boctor,T. Filley, R. Hazen, and H. J. Yoder (2000), Experimentalinvestigations into dynamic organic reaction networks athigh T and P in aqueous media, Orig. Life Evol. Biosphere,30, 187.
GeochemistryGeophysicsGeosystems G3G3
lin et al.: radiolytic h2
in continental crust 10.1029/2004GC000907
12 of 13

Cook, A. P. (1998), The occurrence, emission and ignition ofcombustible strata gases in Witwatersrand gold mines andBushveld platinum mines and means of ameliorating relatedignition and explosion hazards. Part 1: Literature and tech-nical review, GAP504 Proj. Rep., 88 pp., Itasca Africa (Pty)Ltd., Booysens, South Africa.
Coveney, R. M.Jr., E. D. Goebel, E. J. Zeller, and E. E. Angino(1987), Serpentinization and the origin of hydrogen gas inKansas, AAPG Bull., 71, 39–48.
Drennan, G. R., M. C. Boiron, M. Cathelineau, and L. J. Robb(1998), Characteristics of post-depositional fluids in the Wit-watersrand Basin, Mineral. Petrol., 66, 82–109.
Drobner, E., H. Huber, G. Wachtershauser, D. Rose, and K. O.Stetter (1990), Pyrite formation linked with hydrogen evolu-tion under anaerobic conditions, Nature, 346, 742–744.
Ferguson, J. (1973), The Pilanesberg alkaline province, South-ern Africa, Trans. Geol. Soc. S. Afr., 76, 249–270.
Harris, R. E., and S. M. Pimblott (2002), On 3H b- particle and60Co g irradiation of aqueous systemsRadiat. Res., 158,493–504.
Haveman, S. A., and K. Pedersen (1999), Distribution andmetabolic diversity of microorganisms in deep igneous rockaquifers of Finland, Geomicrobiol. J., 16, 277–294.
Hoehler, T. M., B. M. Bebout, and D. J. Des Marais (2002),The role of microbial mats in the production of reducedgases on the early Earth, Nature, 412, 324–327.
Hoffmann, B. A. (1992), Isolated reduction phenomenon in redbeds: A result of porewater radiolysis, in Water-Rock Inter-action, edited by Y. K. Kharaka and A. S. Maest, pp. 503–506, A. A. Balkema, Brookfield, Vt.
Jaehne, B., G. Heinz, and W. Dietrich (1987), Measurement ofthe diffusion coefficients of sparingly soluble gases in water,J. Geophys. Res., 92, 10,767–10,776.
Kita, I., S. Matsuo, and H. Wakita (1982), H2 generation byreaction between H2O and crushed rock: An experimentalstudy on H2 degassing from the active fault zone, J. Geo-phys. Res., 87, 10,789–10,795.
Lippmann, J., M. Stute, T. Torgersen, D. P. Moser, J. Hall,L. Lin, M. Borcsik, R. E. S. Bellamy, and T. C. Onstott(2003), Dating ultra-deep mine waters with noble gasesand 36Cl, Witwatersrand Basin, South Africa, Geochim.Cosmochim. Acta, 67, 4597–4619.
Lovley, D. R., and S. Goodwin (1988), Hydrogen concen-trations as an indicator of the predominant terminal elec-tron-accepting reaction in aquatic sediments, Geochim.Cosmochim. Acta, 52, 2993–3003.
Marine, I. W. (1979), The use of naturally occurring Heliumto estimate groundwater velocities for studies of geologicstorage of radioactive waste, Water Resour. Res., 15,1130–1136.
McKay, C. P. (2001), The deep biosphere; lessons for plane-tary exploration, in Subsurface Microbiology and Biogeo-chemistry, edited by J. K. Fredrickson and M. Fletcher, pp.315–327, John Wiley, New York.
McMahon, P. B., and F. H. Chapelle (1991), Microbial produc-tion of organic acids in aquitard sediments and its role inaquifer geochemistry, Nature, 349, 233–235.
Nicolaysen, L. O., R. J. Hart, and N. H. Gale (1981), TheVredefort radioelement profile extended to supracrustal strata
at Carletonville, with implications for continental heat flow,J. Geophys. Res., 86, 10,653–10,661.
Omar, G. I., T. C. Onstott, and J. Hoek (2003), The origin ofdeep subsurface microbial communities in the Witwatersrandbasin, South Africa as deduced from apatite fission trackanalyses, Geofluids, 3, 69–80.
Onstott, T. C., T. J. Phelps, F. S. Colwell, D. Ringeberg, D. C.White, and D. R. Boone (1998), Observations pertaining tothe origin and ecology of microorganisms recovered fromthe deep subsurface of Taylorsville basin, Virginia, Geomi-crobiol. J., 15, 353–385.
Pedersen, K. (2001), Diversity and activity of microorganismsin deep igneous rock aquifers of the Fennoscandian shield, inSubsurface Microbiology and Biogeochemistry, edited by J.K. Fredrickson and M. Fletcher, pp. 97–139, John Wiley,New York.
Robb, L. J., and F. M. Meyer (1995), The Witwatersrand Ba-sin, South Africa: Geological framework and mineralizationprocesses, Ore Geol. Rev., 10, 67–94.
Rushdi, A. I., and B. R. T. Simoneit (2001), Lipid formation byaqueous Fischer-Tropsch-type synthesis over a temperaturerange of 100 to 400�C, Orig. Life Evol. Biosphere, 31, 103–118.
Savary, V., and M. Pagel (1997), The effects of water radioly-sis on local redox conditions in the Oklo, Gabon, naturalfission reactors 10 and 16, Geochim. Cosmochim. Acta, 61,4479–4494.
Schweitzer, J., and A. Kroener (1985), Geochemistry and pet-rogenesis of early Proterozoic intracratonic volcanic rocks ofthe Ventersdorp Supergroup, South Africa, Chem. Geol., 51,265–288.
Seewald, J. S. (2001), Aqueous geochemistry of low molecularweight hydrocarbons at elevated temperatures and pressures:Constraints from mineral buffered laboratory experiments,Geochim. Cosmochim. Acta, 65, 1641–1664.
Sherwood Lollar, B., T. D. Westgate, J. A. Ward, G. F. Slater,and G. Lacrampe-Couloume (2002), Abiogenic formation ofalkanes in the Earth’s crust as a minor source for globalhydrocarbon reservoirs, Nature, 416, 522–524.
Spinks, J. W. T., and R. J. Woods (1990), An Introduction toRadiation Chemistry, 574 pp, John Wiley, New York.
Stevens, T. O., and J. P. McKinley (1995), Lithoautotrophicmicrobial ecosystems in deep basalt aquifers, Science, 270,450–454.
Stevens, T. O., and J. P. McKinley (2000), Abiotic controls onH2 production from basalt-water reactions for aquifer bio-geochemistry, Environ. Sci. Technol., 34, 826–831.
Van Niekerk, C. B. (1962), The age of the Gemspost dykefrom the Venterspost gold mine, Trans. Geol. Soc. S. Afr.,65, 105–111.
Vovk, I. F. (1987), Radiolytic salt enrichment and brine inthe crystalline basement of the east European platform, inSaline Water and Gases in Crystalline Rocks, edited by P.Fritz and S. K. Frape, Geol. Assoc. Can. Spec. Pap., 33,197–210.
Ward, J. A., et al. (2004), Microbial hydrocarbon gases inthe Witwatersrand Basin, South Africa: Implications forthe deep biosphere, Geochim. Cosmochim. Acta, 68,3239–3250.
GeochemistryGeophysicsGeosystems G3G3
lin et al.: radiolytic h2
in continental crust 10.1029/2004GC000907
13 of 13
Copyright © 2022 FDOKUMEN