
Homogeneous combustion of fuel-lean H2/O2/N2 mixtures ...
16
Homogeneous combustion of fuel-lean H 2 /O 2 /N 2 mixtures over platinum at elevated pressures and preheats Yohannes Ghermay a , John Mantzaras a,⇑ , Rolf Bombach a , Konstantinos Boulouchos b a Paul Scherrer Institute, Combustion Research, CH-5232 Villigen PSI, Switzerland b Swiss Federal Institute of Technology, Laboratory of Aerothermochemistry and Combustion Systems, CH-8092 Zurich, Switzerland article info Article history: Received 19 October 2010 Received in revised form 8 December 2010 Accepted 21 December 2010 Available online 20 January 2011 Keywords: Homogeneous combustion of hydrogen over platinum High pressure and high preheat combustion of hydrogen In situ Raman and LIF measurements Channel flow combustion abstract The gas-phase combustion of H 2 /O 2 /N 2 mixtures over platinum was investigated experimentally and numerically at fuel-lean equivalence ratios up to 0.30, pressures up to 15 bar and preheats up to 790 K. In situ 1-D spontaneous Raman measurements of major species concentrations and 2-D laser induced fluorescence (LIF) of the OH radical were applied in an optically accessible channel-flow catalytic reactor, leading to the assessment of the underlying heterogeneous (catalytic) and homogeneous (gas- phase) combustion processes. Simulations were carried out with a 2-D elliptic code that included ele- mentary hetero-/homogeneous chemical reaction schemes and detailed transport. Measurements and predictions have shown that as pressure increased above 10 bar the preheat requirements for significant gas-phase hydrogen conversion raised appreciably, and for p = 15 bar (a pressure relevant for gas tur- bines) even the highest investigated preheats were inadequate to initiate considerable gas-phase conver- sion. Simulations in channels with practical geometrical confinements of 1 mm indicated that gas-phase combustion was altogether suppressed at atmospheric pressure, wall temperatures as high as 1350 K and preheats up to 773 K. While homogeneous ignition chemistry controlled gaseous combustion at atmo- spheric pressure, flame propagation characteristics dictated the strength of homogeneous combustion at the highest investigated pressures. The decrease in laminar burning rates for p P 8 bar led to a push of the gaseous reaction zone close to the channel wall, to a subsequent leakage of hydrogen through the gaseous reaction zone, and finally to catalytic conversion of the escaped fuel at the channel walls. Parametric studies delineated the operating conditions and geometrical confinements under which gas-phase conversion of hydrogen could not be ignored in numerical modeling of catalytic combustion. Ó 2010 The Combustion Institute. Published by Elsevier Inc. All rights reserved. 1. Introduction In recent years, there has been a growing interest in hydrogen and hydrogen-rich fuel combustion for large-scale power plants and also for microreactors of portable power generation systems. In the former application, hydrogen-rich gases can be produced by decarbonization of fossil fuels, eventually leading to precom- bustion capture of CO 2 [1]. Hydrogen-containing fuels are also of interest for new postcombustion CO 2 capture strategies in natu- ral-gas-fired power plants, wherein the fuel/air mixture is diluted with large exhaust gas recycle in order to increase the content of CO 2 in the flue gases and thus facilitate its subsequent capture [2]. In this case, hydrogen produced via reforming a fraction of the natural gas can be added to the main fuel stream in order to in- crease the combustion stability of the highly diluted reactive mix- ture [2,3]. Hydrogen fuels are finally of interest in microreactors used for small-scale (100 W e ) power generation [4,5]. Therein, hydrogen can be produced from methane [6–8] or higher hydro- carbons [9–11] in suitable catalytic microreformers. Even though lean premixed combustion constitutes the main- stream approach in gas-fired power plants, hybrid methodologies involving catalytic (heterogeneous) and gas-phase (homogeneous) combustion are intensively investigated in the last years as a means to reduce NO x emissions and improve combustion stability [12]. In one such hybrid concept, part of the fuel is converted cat- alytically in a honeycomb reactor and the remaining is combusted in a follow-up homogeneous burner [12], with both combustion modules operating at fuel-lean stoichiometries. While combined hetero-/homogeneous combustion is an option for the aforemen- tioned combustion technologies in large-scale power generation, it is the preferred method for microreactors. Prime reasons for this choice are the large surface-to-volume ratios of microreactors that favor catalytic surface conversion over volumetric gaseous com- bustion, the occurrence of many undesirable flame instabilities at small geometrical confinements driven by flame–wall interactions [13–16], and the efficient suppression of such instabilities by coat- ing the reactor walls with an active catalyst [17,18]. 0010-2180/$ - see front matter Ó 2010 The Combustion Institute. Published by Elsevier Inc. All rights reserved. doi:10.1016/j.combustflame.2010.12.025 ⇑ Corresponding author. Fax: +41 56 3102199. E-mail address: [email protected] (J. Mantzaras). Combustion and Flame 158 (2011) 1491–1506 Contents lists available at ScienceDirect Combustion and Flame journal homepage: www.elsevier.com/locate/combustflame
-
Upload
khangminh22 -
Category
Documents
-
view
1 -
download
0
Transcript of Homogeneous combustion of fuel-lean H2/O2/N2 mixtures ...
Combustion and Flame 158 (2011) 1491–1506
Contents lists available at ScienceDirect
Combustion and Flame
journal homepage: www.elsevier .com/locate /combustflame
Homogeneous combustion of fuel-lean H2/O2/N2 mixtures over platinumat elevated pressures and preheats
Yohannes Ghermay a, John Mantzaras a,⇑, Rolf Bombach a, Konstantinos Boulouchos b
a Paul Scherrer Institute, Combustion Research, CH-5232 Villigen PSI, Switzerlandb Swiss Federal Institute of Technology, Laboratory of Aerothermochemistry and Combustion Systems, CH-8092 Zurich, Switzerland
a r t i c l e i n f o
Article history:Received 19 October 2010Received in revised form 8 December 2010Accepted 21 December 2010Available online 20 January 2011
Keywords:Homogeneous combustion of hydrogen overplatinumHigh pressure and high preheat combustionof hydrogenIn situ Raman and LIF measurementsChannel flow combustion
0010-2180/$ - see front matter � 2010 The Combustdoi:10.1016/j.combustflame.2010.12.025
⇑ Corresponding author. Fax: +41 56 3102199.E-mail address: [email protected] (J. Mant
a b s t r a c t
The gas-phase combustion of H2/O2/N2 mixtures over platinum was investigated experimentally andnumerically at fuel-lean equivalence ratios up to 0.30, pressures up to 15 bar and preheats up to790 K. In situ 1-D spontaneous Raman measurements of major species concentrations and 2-D laserinduced fluorescence (LIF) of the OH radical were applied in an optically accessible channel-flow catalyticreactor, leading to the assessment of the underlying heterogeneous (catalytic) and homogeneous (gas-phase) combustion processes. Simulations were carried out with a 2-D elliptic code that included ele-mentary hetero-/homogeneous chemical reaction schemes and detailed transport. Measurements andpredictions have shown that as pressure increased above 10 bar the preheat requirements for significantgas-phase hydrogen conversion raised appreciably, and for p = 15 bar (a pressure relevant for gas tur-bines) even the highest investigated preheats were inadequate to initiate considerable gas-phase conver-sion. Simulations in channels with practical geometrical confinements of 1 mm indicated that gas-phasecombustion was altogether suppressed at atmospheric pressure, wall temperatures as high as 1350 K andpreheats up to 773 K. While homogeneous ignition chemistry controlled gaseous combustion at atmo-spheric pressure, flame propagation characteristics dictated the strength of homogeneous combustionat the highest investigated pressures. The decrease in laminar burning rates for p P 8 bar led to a pushof the gaseous reaction zone close to the channel wall, to a subsequent leakage of hydrogen throughthe gaseous reaction zone, and finally to catalytic conversion of the escaped fuel at the channel walls.Parametric studies delineated the operating conditions and geometrical confinements under whichgas-phase conversion of hydrogen could not be ignored in numerical modeling of catalytic combustion.
� 2010 The Combustion Institute. Published by Elsevier Inc. All rights reserved.
1. Introduction
In recent years, there has been a growing interest in hydrogenand hydrogen-rich fuel combustion for large-scale power plantsand also for microreactors of portable power generation systems.In the former application, hydrogen-rich gases can be producedby decarbonization of fossil fuels, eventually leading to precom-bustion capture of CO2 [1]. Hydrogen-containing fuels are also ofinterest for new postcombustion CO2 capture strategies in natu-ral-gas-fired power plants, wherein the fuel/air mixture is dilutedwith large exhaust gas recycle in order to increase the content ofCO2 in the flue gases and thus facilitate its subsequent capture[2]. In this case, hydrogen produced via reforming a fraction ofthe natural gas can be added to the main fuel stream in order to in-crease the combustion stability of the highly diluted reactive mix-ture [2,3]. Hydrogen fuels are finally of interest in microreactorsused for small-scale (�100 We) power generation [4,5]. Therein,
ion Institute. Published by Elsevier
zaras).
hydrogen can be produced from methane [6–8] or higher hydro-carbons [9–11] in suitable catalytic microreformers.
Even though lean premixed combustion constitutes the main-stream approach in gas-fired power plants, hybrid methodologiesinvolving catalytic (heterogeneous) and gas-phase (homogeneous)combustion are intensively investigated in the last years as ameans to reduce NOx emissions and improve combustion stability[12]. In one such hybrid concept, part of the fuel is converted cat-alytically in a honeycomb reactor and the remaining is combustedin a follow-up homogeneous burner [12], with both combustionmodules operating at fuel-lean stoichiometries. While combinedhetero-/homogeneous combustion is an option for the aforemen-tioned combustion technologies in large-scale power generation,it is the preferred method for microreactors. Prime reasons for thischoice are the large surface-to-volume ratios of microreactors thatfavor catalytic surface conversion over volumetric gaseous com-bustion, the occurrence of many undesirable flame instabilities atsmall geometrical confinements driven by flame–wall interactions[13–16], and the efficient suppression of such instabilities by coat-ing the reactor walls with an active catalyst [17,18].
Inc. All rights reserved.
Nomenclature
b channel half-height, Fig. 1cp,k specific heat at constant pressure of kth gaseous species,
Eq. (7)d channel diameterDkm mixture-average species diffusion coefficient, Eq. (6)DT
k species thermal diffusion coefficient, Eq. (6)h, ho
k total enthalpy, chemical enthalpy of the kth gaseousspecies, Eq. (3)
I unity diagonal matrix, Eq. (2)Kg total number of gaseous species, Eq. (4)L catalytic reactor length, Fig. 1Le Lewis number (thermal over mass diffusivity)_m; _M mass flux, mass flow rate
Ms total number of surface species, Eq. (5)p pressurer radial coordinateRo universal gas constant, Eq. (7)ReIN inlet Reynolds number_sk catalytic molar production rate of kth species, Eq. (8)SL laminar flame speed, Fig. 12T temperatureTo fresh mixture temperature, Fig. 12, and reference tem-
perature, Eq. (7)u, UIN streamwise velocity component, inlet streamwise veloc-
ityv transverse (�y) or radial (�r) velocity component~Vk species diffusion velocity vector, Eq. (6)
W catalytic channel width, Fig. 1Wk, W molecular weight of kth gaseous species, average molec-
ular weightXk, Yk mole fraction and mass fraction of kth gaseous speciesx, y, z streamwise, transverse and lateral Cartesian coordinates,
Fig. 1
Greek symbolsC surface site density, Eq. (5)kg thermal conductivity of gas, Eq. (3)l dynamic viscosity, Eq. (2)q, qo density, Eqs. (1) and (2), fresh mixture density, Fig. 12rm surface species site occupancy, Eq. (5)u hydrogen-to-oxygen equivalence ratio_xk homogeneous molar production rate of kth species, Eq.
(4)
SubscriptsIN inletig homogeneous ignitiong gask, m indices for gas-phase and surface speciesW wallx streamwise componenty, r transverse component in Cartesian and cylindrical coor-
dinates
1492 Y. Ghermay et al. / Combustion and Flame 158 (2011) 1491–1506
The catalytic chemistry of hydrogen oxidation over noble met-als has been investigated in a number of studies and detailedmean-field reaction mechanisms have thereafter been constructed[19–23]. Development of heterogeneous kinetics for simple fuels,such as hydrogen, is nowadays greatly aided by advancements inab initio simulations [24] and in spatially-resolved operando sur-face science measurements [25]. It terms of gas-phase chemistry,recent studies have improved the understanding of homogeneouskinetics for hydrogen and hydrogen-containing fuels at turbine rel-evant pressures [26–29]. For coupled heterogeneous and homoge-neous combustion systems, however, there are only a fewinvestigations (especially at elevated pressures) for hydrogen andhydrogen-containing fuels.
The homogeneous ignition of fuel-lean and fuel-rich H2/air mix-tures over Pt-coated stagnation flow surfaces has been investigatedat atmospheric pressure in Bui et al. [30], establishing the impact ofequivalence ratio on the ignition temperature. In situ laser-basedmeasurements of major and minor species concentrations acrossthe boundary layer of a Pt-coated channel-flow reactor at atmo-spheric pressure were reported in Appel et al. [31], providing val-idated hetero-/homogeneous reaction schemes for fuel-lean H2/air mixtures and further addressing the catalytic and gas-phasechemistry interactions as well as the chemistry/transport coupling.Maestri et al. [21,32] investigated the hetero-/homogeneous com-bustion of fuel-rich H2/air mixtures over Rh-based catalysts atatmospheric pressure in a nearly isothermal annular reactor witha channel gap of 2.1 mm; they reported that gas-phase chemistrywas significant at temperatures above ca. 820 K. Mantzaras et al.[33] extended the work of Appel et al. [31] for pressures up to10 bar; therein, experiments and simulations have shown thatthe intricate pressure and temperature dependence of hydrogenhomogeneous ignition kinetics resulted in suppression of gaseouscombustion for pressures above 4 bar, for non-preheated fuel-leanH2/air mixtures, and for catalyst surface temperatures as high as1200 K. More recently, Ghermay et al. [34] investigated
experimentally and numerically the effect of fractional hydrogenpreconversion on the subsequent homogeneous ignition character-istics of fuel-lean H2/air mixtures over Pt at pressures up to 8 bar.Literature studies for hetero-/homogeneous combustion of hydro-gen at turbine-relevant pressures (ca. 15 bar) and mixture preheats(up to 800 K) are still lacking. Moreover, it will be shown that forthe upper range of examined pressures, p P 12 bar, the mecha-nisms controlling gas-phase combustion are markedly differentthan those at lower pressures. Finally, it is essential to ascertainthe operating conditions (pressure, mixture preheat, catalytic walltemperature, reactor geometrical confinement and residence time)under which gas-phase chemistry plays a role, given the growinginterest for catalytic combustion systems using either hydrogenor hydrogen-enriched fuels [5,23,35–38].
The present work undertakes an experimental and numericalinvestigation of the hetero-/homogenous combustion of fuel-lean(equivalence ratios up to 0.30) H2/air mixtures over Pt, at pressuresup to 15 bar and mixture preheats up to 790 K. Experiments wereperformed in an optically accessible, channel-flow catalytic reactorwith a height of 7 mm. One-dimensional spontaneous Raman mea-surements provided the boundary layer profiles of major speciesover the catalyst surface and planar laser induced fluorescence(LIF) of the OH radical monitored homogeneous combustion. Com-putations were carried out with an elliptic 2-D code that includedelementary catalytic and gaseous chemical reaction schemes anddetailed transport. The main objectives were to assess the impactof pressure and mixture preheat on the homogeneous combustioncharacteristics of hydrogen over Pt surfaces and to provide vali-dated hetero-/homogeneous chemical reaction schemes at tur-bine-pertinent conditions. Specific objectives were to identify theunderlying physicochemical processes (gas-phase ignition chemis-try, flame propagation characteristics, interaction of transport andchemistry) that control the importance of gaseous chemistry inpractical catalytic reactor geometries. The regimes of significancefor gas-phase chemistry in hydrogen-fueled hetero-/homogeneous
Y. Ghermay et al. / Combustion and Flame 158 (2011) 1491–1506 1493
combustion systems have finally been delineated as a function ofgeometrical confinement and operating conditions relevant toeither large-scale power generation systems or to microreactors.
This article is organized as follows. The experimental andnumerical methodologies are presented in Sections 2 and 3,respectively. In Section 4.1, comparisons between measurementsand predictions are used to assess the aptness of the employedreaction schemes and to illustrate the impact of high pressureand preheat on homogeneous combustion. The effects of gas-phaseignition chemistry and flame propagation characteristics on theensuing homogeneous combustion are discussed in Section 4.2. Fi-nally, delineation of the operating conditions under which gas-phase combustion cannot be ignored is undertaken in Section 4.3for various practical geometrical confinements.
2. Experimental
2.1. High pressure test rig
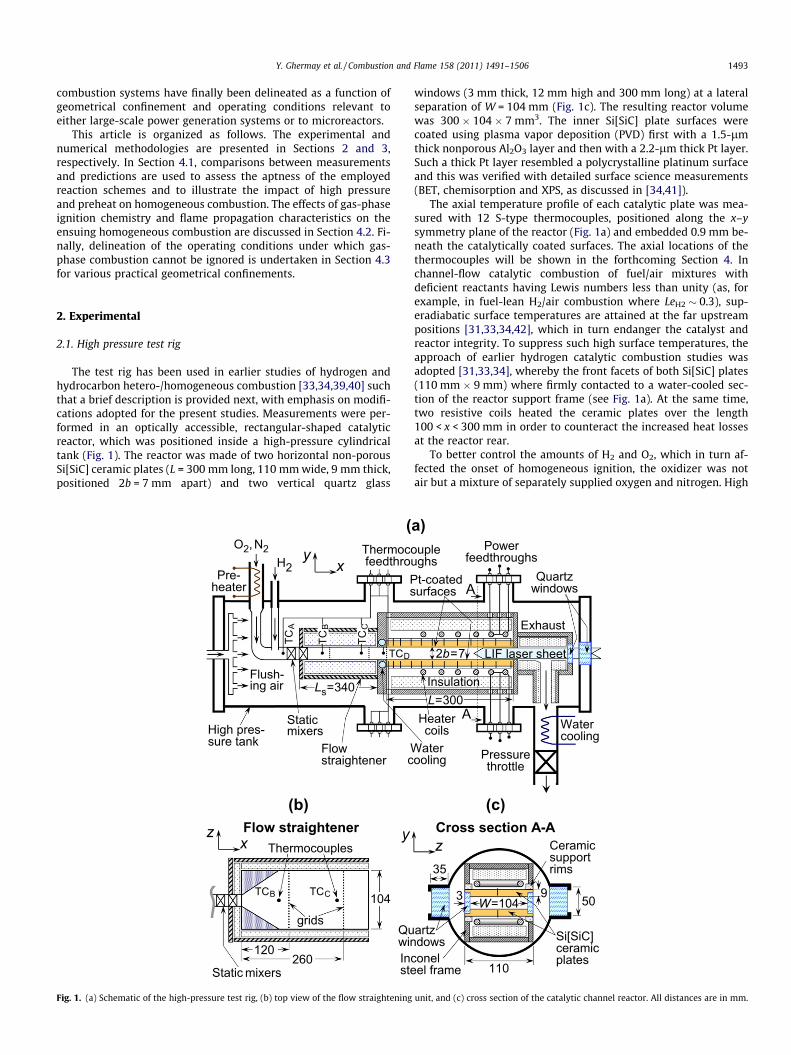
The test rig has been used in earlier studies of hydrogen andhydrocarbon hetero-/homogeneous combustion [33,34,39,40] suchthat a brief description is provided next, with emphasis on modifi-cations adopted for the present studies. Measurements were per-formed in an optically accessible, rectangular-shaped catalyticreactor, which was positioned inside a high-pressure cylindricaltank (Fig. 1). The reactor was made of two horizontal non-porousSi[SiC] ceramic plates (L = 300 mm long, 110 mm wide, 9 mm thick,positioned 2b = 7 mm apart) and two vertical quartz glass
O2,N2H2
Thermocofeedthrou
Ps
High pres-sure tank Flow
straightener
xy
y
QuwinIncste
Wc
Flush-ing air
TCA
TCD
(
Pre-heater
TCB
TCC
Static mixers
(b)
grids
TCB
Flow straightener
Staticmixers
xz
104
Thermocouples
Ls=340
120260
TCC
Fig. 1. (a) Schematic of the high-pressure test rig, (b) top view of the flow straightening
windows (3 mm thick, 12 mm high and 300 mm long) at a lateralseparation of W = 104 mm (Fig. 1c). The resulting reactor volumewas 300 � 104 � 7 mm3. The inner Si[SiC] plate surfaces werecoated using plasma vapor deposition (PVD) first with a 1.5-lmthick nonporous Al2O3 layer and then with a 2.2-lm thick Pt layer.Such a thick Pt layer resembled a polycrystalline platinum surfaceand this was verified with detailed surface science measurements(BET, chemisorption and XPS, as discussed in [34,41]).
The axial temperature profile of each catalytic plate was mea-sured with 12 S-type thermocouples, positioned along the x–ysymmetry plane of the reactor (Fig. 1a) and embedded 0.9 mm be-neath the catalytically coated surfaces. The axial locations of thethermocouples will be shown in the forthcoming Section 4. Inchannel-flow catalytic combustion of fuel/air mixtures withdeficient reactants having Lewis numbers less than unity (as, forexample, in fuel-lean H2/air combustion where LeH2 � 0.3), sup-eradiabatic surface temperatures are attained at the far upstreampositions [31,33,34,42], which in turn endanger the catalyst andreactor integrity. To suppress such high surface temperatures, theapproach of earlier hydrogen catalytic combustion studies wasadopted [31,33,34], whereby the front facets of both Si[SiC] plates(110 mm � 9 mm) where firmly contacted to a water-cooled sec-tion of the reactor support frame (see Fig. 1a). At the same time,two resistive coils heated the ceramic plates over the length100 < x < 300 mm in order to counteract the increased heat lossesat the reactor rear.
To better control the amounts of H2 and O2, which in turn af-fected the onset of homogeneous ignition, the oxidizer was notair but a mixture of separately supplied oxygen and nitrogen. High
Powerfeedthroughs
Heatercoils
Pressurethrottle
LIF laser sheet
upleghs
Watercooling
t-coatedurfaces
Exhaust
2b=7
Quartzwindows
L=300Insulation
Cross section A-Az
Si[SiC]ceramicplates
W=104
artzdows
35
onelel frame
3 50
Ceramicsupportrims
A
A
ater ooling
110
9
a)
(c)
unit, and (c) cross section of the catalytic channel reactor. All distances are in mm.

1494 Y. Ghermay et al. / Combustion and Flame 158 (2011) 1491–1506
pressure bottles provided H2, O2 and N2. The flows of these gaseswere regulated and measured by three dedicated Brooks mass-flow controllers with accuracies better than ±0.2%. The O2 and N2
flows were mixed and preheated with an electric heater, and thenhydrogen was injected to the O2/N2 mixture 400 mm upstream ofthe reactor. Complete mixing of the fuel and oxidizer streams wasachieved in two sequential static mixers. Experiments with pre-heated H2/O2/N2 at high pressures were particularly demandingdue to the resulting high mixture reactivity. A specifically designedflow-straightening section (Fig. 1b) equipped with cross-flow gridsmitigated autoignition of the preheated reactive mixture and at thesame time provided a uniform flow at the reactor entry. Autoigni-tion mitigation was verified with a series of four sheathed K-typethermocouples (TCA to TCD, Fig. 1a), which monitored the mixturetemperature from the point of hydrogen injection down to thereactor entry, while flow uniformity was assessed by hot-wirevelocimetry measurements at the exit of the stand-alone flowstraightening unit. Thermocouple TCD, positioned 2 mm upstreamof the reactor entry, also provided the inlet temperature neededfor the numerical simulations. The high pressure tank wasequipped with two 350-mm long, 50-mm high and 35-mm thickquartz glass windows, allowing optical access from both reactorsides (Figs. 1c and 2). Two additional quartz windows at the reactorexhaust and at the rear flange of the tank (Fig. 1a) provided astreamwise optical access. Finally, a continuous flow of air flushedany undesired combustion products from the free volume betweenthe tank and the reactor assembly.
2.2. Laser diagnostics
The Raman and LIF techniques have been used in previous cat-alytic combustion works [31,34,40] and are thus concisely de-scribed below. In the LIF experiments (see Fig. 2), the 532 nmsecond harmonic beam of a pulsed Nd:YAG laser (Quantel TDL90NBP2UVT3) pumped a tunable dye laser (Quantel TDL90). The
Fig. 2. OH-LIF and Raman optical setup arrangement in th
dye output beam was frequency-doubled to 285 nm with a pulseenergy of 0.5 mJ, low enough to avoid saturation of theA(v = 1) X(v0 = 0) OH transition. A cylindrical lens telescope anda 1-mm slit mask transformed this beam into a thin light sheet,which propagated counterflow along the x–y symmetry plane ofthe reactor (Figs. 1a and 2). Fluorescence from both (1–1) and(0–0) OH transitions at 308 and 314 nm, respectively, was col-lected at 90� through the reactor and side tank windows with anICCD camera (LaVision Imager Compact HiRes IRO, 1392 � 1024pixels). Channel areas of 100 mm � 7 mm were acquired on a628 � 44 pixel area of the ICCD detector chip and the camerawas traversed axially to record the entire 300 mm reactor length.To increase the signal-to-noise ratio, 400 images were averagedat each measuring position. The LIF signal was calibrated withabsorption measurements performed with the 285 nm beam cross-ing the reactor laterally (z-direction) through all 4 reactor and tankside windows, as in [31,39].
For the Raman measurements, a frequency-doubled Nd:YLFhigh repetition rate pulsed laser (Quantronix Darwin Duo) wasused, with output radiation at 526.5 nm. The laser was operatedat 1.5 kHz with a pulse duration and energy of 130 ns and 43 mJ,respectively. The Raman beam was focused through the tank andreactor side-windows into a vertical line (�0.3 mm thick) by anf = 150 mm cylindrical lens (Fig. 2). The focal line spanned the7 mm channel separation and was offset laterally (z = 15 mm) toincrease the collection angle and minimize thermal beam steering[31,34]. Two f = 300 mm lenses collected the scattered light and fo-cused it on a 25 cm imaging spectrograph (Chromex-250i)equipped with an ICCD camera (Princeton Instruments PI-MAX1024GIII). Up to 20,000 pulses were integrated on the detectorchip when acquiring an image. Raman data were recorded at differ-ent axial positions by traversing a table supporting the sending andcollecting optics as well as the Nd:YLF laser and the spectrograph(Fig. 2). The measurement accuracy was �8% for species concentra-tions as low as 0.5 vol.% For concentrations lower than 0.5 vol.%,
e high-pressure test rig. All focal lengths are in mm.

Y. Ghermay et al. / Combustion and Flame 158 (2011) 1491–1506 1495
larger uncertainties were present. Raman data closer than 0.7 mmto both walls were discarded due to low signal-to-noise ratios. It isfinally clarified that the Raman data could not assess the catalyticreactivity, since the high reactivity of hydrogen on Pt alwaysyielded transport-limited conversion for the present walltemperatures.
3. Numerical
The governing equations (in their full elliptic form) were solvedfor a steady laminar reactive flow in 2-D Cartesian coordinates,simulating the 300 mm � 7 mm (x–y) channel domain (Fig. 1a).To further investigate the effect of confinement type (planar versustubular channels, Section 4.3) on homogeneous combustion, addi-tional simulations were carried out in cylindrical coordinates. Thegeneral form of the equations was the following:
Continuity equation:
r � ðq~uÞ ¼ 0: ð1Þ
Momentum equations:
r � ðq~u~uÞ þ rp�r � l r~uþ ðr~uÞT � 23ðr �~uÞI
� �¼ 0: ð2Þ
Total enthalpy equation:
r � ðq~uhÞ þ r �XKg
k¼1
qYkhk~Vk � kgrT
!¼ 0: ð3Þ
Gas-phase species equations:
r � qYkð~uþ ~VkÞ � _xkWk ¼ 0; k ¼ 1; . . . ; Kg : ð4Þ
Surface species coverage equations:
rm_sm
C¼ 0; m ¼ 1; . . . ;Ms: ð5Þ
For the present high Reynolds numbers (see Section 4.1) and the7-mm narrow vertical channel gap, buoyancy was insignificant.The diffusion velocities ~Vk in Eqs. (3) and (4) were computed usingmixture average diffusion, including thermal diffusion for the lightspecies H and H2 [43]:
~Vk ¼ �Dkmr½lnðYkW=WkÞ� þ DTk Wk=ðqYkWÞ
h irðln TÞ: ð6Þ
The ideal gas and caloric state laws were finally used:
p ¼ qRoTW
; hk ¼ hokðToÞ þ
Z T
To
cp;kdT k ¼ 1; . . . ;Kg : ð7Þ
The interfacial boundary conditions for the gas-phase speciesand energy at the lower and upper catalytic walls (y = 0 andy = 2b, respectively) were:
ðqYkVk;yÞy¼0 ¼Wkð_skÞy¼0; �ðqYkVk;yÞy¼2b ¼Wkð_skÞy¼2b ð8Þ
and
Tðx; y ¼ 0Þ ¼ TW;LðxÞ; Tðx; y ¼ 2bÞ ¼ TW;UðxÞ; ð9Þ
with TW,U(x) and TW,L(x) the temperature profiles of the upper andlower wall, respectively, fitted through the 12 thermocouple mea-surements of each plate. No-slip was applied for both velocity com-ponents at the gas–wall interfaces. At the inlet, uniform profileswere used for the temperature TIN (measured at TCD, Fig. 1a), the ax-ial velocity UIN and the species mass fractions. At the outflow, v = 0was used for the transverse velocity and zero-Neumann conditionsfor all other scalars. A staggered grid of 420 � 100 points (x and y,respectively) was employed, with finer x-spacing closer to the en-trance and y-spacing closer to both catalytic walls. The solutionalgorithm has been described elsewhere [31].
The detailed mean-field heterogeneous reaction scheme for theoxidation of H2 over Pt from Deutschmann et al. [23] (11 irrevers-ible and three reversible reactions, five surface and six gaseousspecies) was employed, with a platinum surface site densityC = 2.7 � 10�9 mol/cm2. Surface thermodynamic data for thereversible reactions were taken from [44]. For homogeneous chem-istry, the mechanism of Li et al. [26] was used (21 reversible reac-tions and nine species) with its accompanying gas-phasethermodynamic data. This mechanism has been tested againstshock tube, flow-reactor, and laminar flame speed measurementsat pressures up to 87 bar. Gas-phase and surface reaction rateswere evaluated with CHEMKIN [45] and Surface-CHEMKIN [46],respectively, while all transport properties were calculated fromthe CHEMKIN transport database [43].
4. Results and discussion
4.1. Homogeneous ignition measurements and predictions
Table 1 summarizes all experimental conditions. Measurementshave been performed at pressures 1, 2, 6, 8, 10, 12 and 15 bar withmixture preheats (TIN) ranging from 390 K to 790 K. With increas-ing mixture preheat, the hydrogen-to-oxygen equivalence ratioswere reduced in order to avoid autoignition in the mixing or flowstraightening sections upstream of the reactor (Fig. 1a and b). Tothis direction, equivalence ratios in the range 0.08 6 u 6 0.30 wereused. Moreover, for a given pressure, the mass throughput ( _M inTable 1) was not kept constant but it generally increased with ris-ing preheat to eliminate the risk of flame flashback. The inlet Rey-nolds numbers (ReIN in Table 1), calculated from the uniform inletproperties and the channel hydraulic diameter (=13.1 mm), rangedfrom 1948 to 3330. It is clarified, however, that all cases could betreated with a laminar flow model: earlier turbulent catalytic com-bustion studies [47] have shown that the strong flow laminariza-tion induced by the hot catalytic walls guaranteed laminarconditions at ReIN higher than 8000 for channel wall temperaturesabove 1000 K.
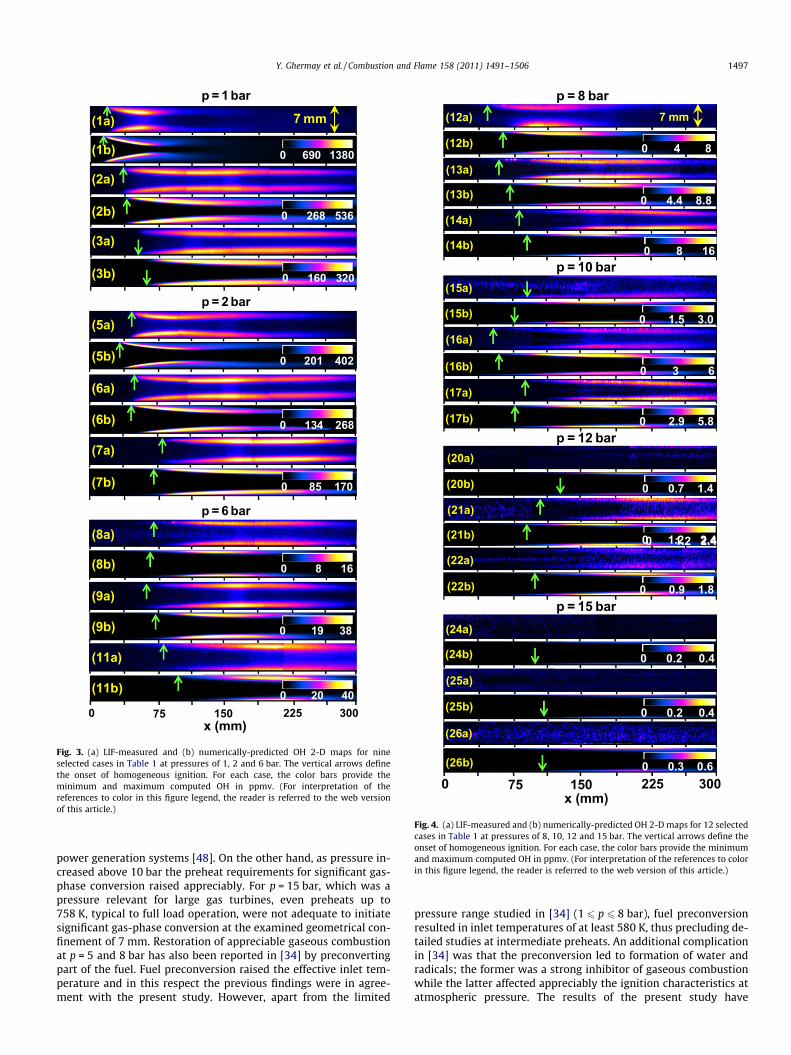
Measured and predicted 2-D distributions of the OH radicalover the entire channel length are provided in Fig. 3 (1 6 p 6 6 bar)and Fig. 4 (8 6 p 6 15 bar) for 21 of the total 26 cases in Table 1. Asstated in Section 2.2, the measured OH maps in Figs. 3 and 4 havebeen constructed by connecting 100-mm-long, partially overlap-ping LIF images. Small temperature differences between the upperand lower catalytic walls led to a slight asymmetry in the flameshapes (see Figs. 3 and 4). Maximum temperature differences be-tween the upper and lower walls ranged from 15 K (Case 7) to40 K (Case 26), as indicated from the thermocouple measurementsin Figs. 5 and 6. The axial location of homogeneous ignition (xig) isdenoted with vertical arrows in Figs. 3 and 4; xig has been definedin both measurements and predictions as the far-upstream loca-tion whereby OH reached 5% of its maximum value inside thechannel. Homogeneous ignition at pressures p P 12 bar could notbe accurately determined with the LIF data. Most of the cases at12 and 15 bar referred to OH concentrations less than 2 ppmv(see Fig. 4) and such low levels were not amenable to a planar mea-surement fluorescence technique. Nonetheless, qualitative agree-ment has been established between measurements andpredictions in terms of the very narrow extent of the gaseous com-bustion zone away from both walls (see, for example, in Fig. 4 theflames of Cases 20, 22 and 24–26). Moreover, quantitative agree-ment for these high pressure cases was not of great concern sincegas-phase combustion was altogether very weak as will be dis-cussed later on in the context of Fig. 6.
The onset of homogeneous ignition was well predicted by themodel, with the difference between measured and predicted
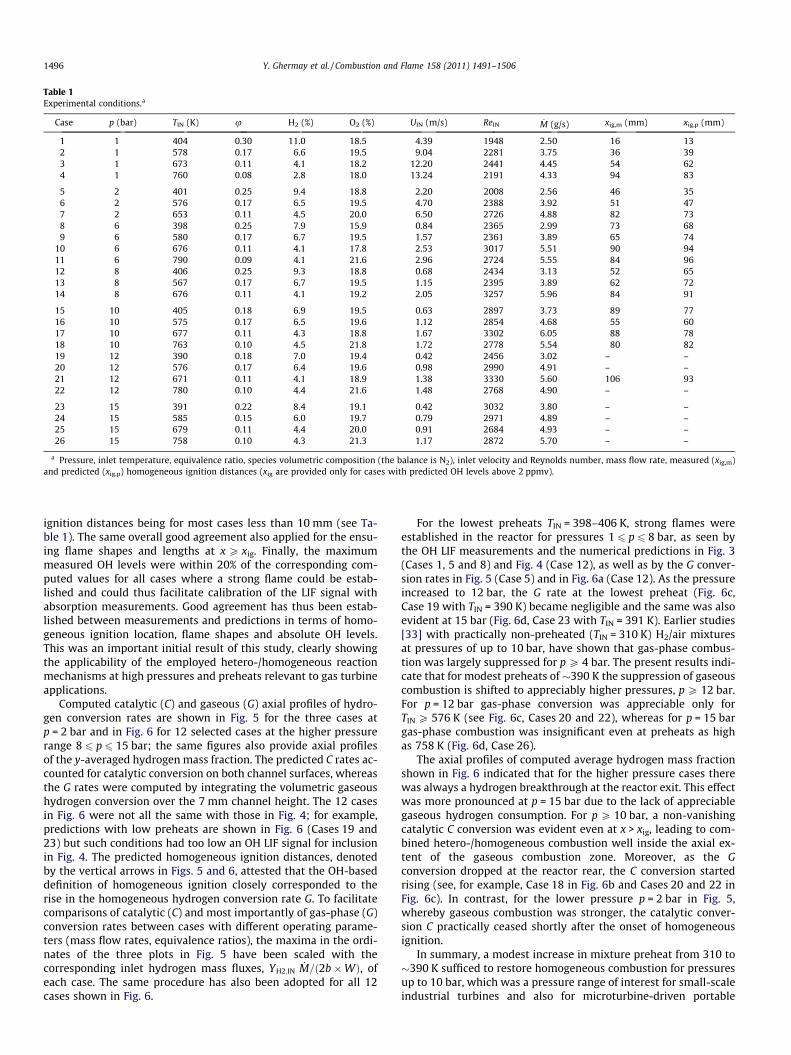
Table 1Experimental conditions.a
Case p (bar) TIN (K) u H2 (%) O2 (%) UIN (m/s) ReIN _M (g/s) xig,m (mm) xig,p (mm)
1 1 404 0.30 11.0 18.5 4.39 1948 2.50 16 132 1 578 0.17 6.6 19.5 9.04 2281 3.75 36 393 1 673 0.11 4.1 18.2 12.20 2441 4.45 54 624 1 760 0.08 2.8 18.0 13.24 2191 4.33 94 83
5 2 401 0.25 9.4 18.8 2.20 2008 2.56 46 356 2 576 0.17 6.5 19.5 4.70 2388 3.92 51 477 2 653 0.11 4.5 20.0 6.50 2726 4.88 82 738 6 398 0.25 7.9 15.9 0.84 2365 2.99 73 689 6 580 0.17 6.7 19.5 1.57 2361 3.89 65 74
10 6 676 0.11 4.1 17.8 2.53 3017 5.51 90 9411 6 790 0.09 4.1 21.6 2.96 2724 5.55 84 9612 8 406 0.25 9.3 18.8 0.68 2434 3.13 52 6513 8 567 0.17 6.7 19.5 1.15 2395 3.89 62 7214 8 676 0.11 4.1 19.2 2.05 3257 5.96 84 91
15 10 405 0.18 6.9 19.5 0.63 2897 3.73 89 7716 10 575 0.17 6.5 19.6 1.12 2854 4.68 55 6017 10 677 0.11 4.3 18.8 1.67 3302 6.05 88 7818 10 763 0.10 4.5 21.8 1.72 2778 5.54 80 8219 12 390 0.18 7.0 19.4 0.42 2456 3.02 – –20 12 576 0.17 6.4 19.6 0.98 2990 4.91 – –21 12 671 0.11 4.1 18.9 1.38 3330 5.60 106 9322 12 780 0.10 4.4 21.6 1.48 2768 4.90 – –
23 15 391 0.22 8.4 19.1 0.42 3032 3.80 – –24 15 585 0.15 6.0 19.7 0.79 2971 4.89 – –25 15 679 0.11 4.4 20.0 0.91 2684 4.93 – –26 15 758 0.10 4.3 21.3 1.17 2872 5.70 – –
a Pressure, inlet temperature, equivalence ratio, species volumetric composition (the balance is N2), inlet velocity and Reynolds number, mass flow rate, measured (xig,m)and predicted (xig,p) homogeneous ignition distances (xig are provided only for cases with predicted OH levels above 2 ppmv).
1496 Y. Ghermay et al. / Combustion and Flame 158 (2011) 1491–1506
ignition distances being for most cases less than 10 mm (see Ta-ble 1). The same overall good agreement also applied for the ensu-ing flame shapes and lengths at x P xig. Finally, the maximummeasured OH levels were within 20% of the corresponding com-puted values for all cases where a strong flame could be estab-lished and could thus facilitate calibration of the LIF signal withabsorption measurements. Good agreement has thus been estab-lished between measurements and predictions in terms of homo-geneous ignition location, flame shapes and absolute OH levels.This was an important initial result of this study, clearly showingthe applicability of the employed hetero-/homogeneous reactionmechanisms at high pressures and preheats relevant to gas turbineapplications.
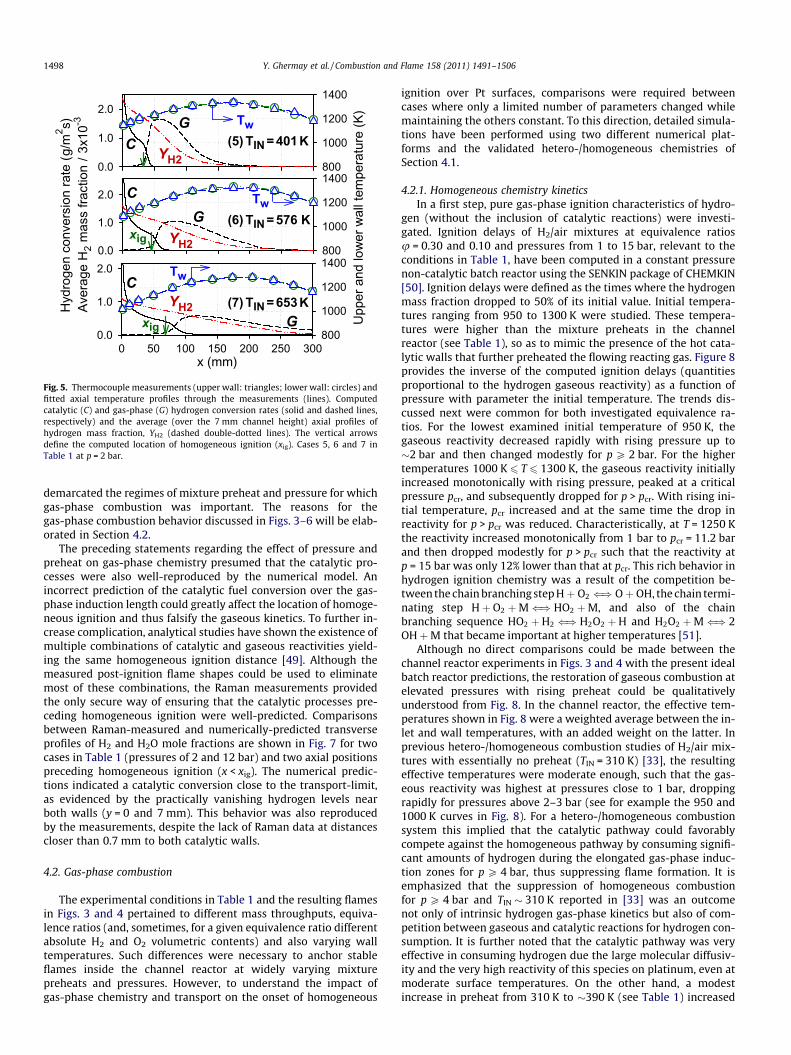
Computed catalytic (C) and gaseous (G) axial profiles of hydro-gen conversion rates are shown in Fig. 5 for the three cases atp = 2 bar and in Fig. 6 for 12 selected cases at the higher pressurerange 8 6 p 6 15 bar; the same figures also provide axial profilesof the y-averaged hydrogen mass fraction. The predicted C rates ac-counted for catalytic conversion on both channel surfaces, whereasthe G rates were computed by integrating the volumetric gaseoushydrogen conversion over the 7 mm channel height. The 12 casesin Fig. 6 were not all the same with those in Fig. 4; for example,predictions with low preheats are shown in Fig. 6 (Cases 19 and23) but such conditions had too low an OH LIF signal for inclusionin Fig. 4. The predicted homogeneous ignition distances, denotedby the vertical arrows in Figs. 5 and 6, attested that the OH-baseddefinition of homogeneous ignition closely corresponded to therise in the homogeneous hydrogen conversion rate G. To facilitatecomparisons of catalytic (C) and most importantly of gas-phase (G)conversion rates between cases with different operating parame-ters (mass flow rates, equivalence ratios), the maxima in the ordi-nates of the three plots in Fig. 5 have been scaled with thecorresponding inlet hydrogen mass fluxes, YH2;IN
_M=ð2b�WÞ, ofeach case. The same procedure has also been adopted for all 12cases shown in Fig. 6.
For the lowest preheats TIN = 398–406 K, strong flames wereestablished in the reactor for pressures 1 6 p 6 8 bar, as seen bythe OH LIF measurements and the numerical predictions in Fig. 3(Cases 1, 5 and 8) and Fig. 4 (Case 12), as well as by the G conver-sion rates in Fig. 5 (Case 5) and in Fig. 6a (Case 12). As the pressureincreased to 12 bar, the G rate at the lowest preheat (Fig. 6c,Case 19 with TIN = 390 K) became negligible and the same was alsoevident at 15 bar (Fig. 6d, Case 23 with TIN = 391 K). Earlier studies[33] with practically non-preheated (TIN = 310 K) H2/air mixturesat pressures of up to 10 bar, have shown that gas-phase combus-tion was largely suppressed for p P 4 bar. The present results indi-cate that for modest preheats of �390 K the suppression of gaseouscombustion is shifted to appreciably higher pressures, p P 12 bar.For p = 12 bar gas-phase conversion was appreciable only forTIN P 576 K (see Fig. 6c, Cases 20 and 22), whereas for p = 15 bargas-phase combustion was insignificant even at preheats as highas 758 K (Fig. 6d, Case 26).
The axial profiles of computed average hydrogen mass fractionshown in Fig. 6 indicated that for the higher pressure cases therewas always a hydrogen breakthrough at the reactor exit. This effectwas more pronounced at p = 15 bar due to the lack of appreciablegaseous hydrogen consumption. For p P 10 bar, a non-vanishingcatalytic C conversion was evident even at x > xig, leading to com-bined hetero-/homogeneous combustion well inside the axial ex-tent of the gaseous combustion zone. Moreover, as the Gconversion dropped at the reactor rear, the C conversion startedrising (see, for example, Case 18 in Fig. 6b and Cases 20 and 22 inFig. 6c). In contrast, for the lower pressure p = 2 bar in Fig. 5,whereby gaseous combustion was stronger, the catalytic conver-sion C practically ceased shortly after the onset of homogeneousignition.
In summary, a modest increase in mixture preheat from 310 to�390 K sufficed to restore homogeneous combustion for pressuresup to 10 bar, which was a pressure range of interest for small-scaleindustrial turbines and also for microturbine-driven portable
p = 1 bar
0 690 1380
0 268 536
0 160 320
0 201 402
0 85 170
0 8 16
0 19 38
(1a)
(2a)
(2b)
(3b)
(3a)
(5a)
(6b)
(7a)
(6a)
(7b)
(8a)
(8b)
(9b)
(11a)
(9a)
(11b)
7 mm
(1b)
p = 2 bar
0 134 268
p = 6 bar
(5b)
0 20 40150 30022575
x (mm)0
Fig. 3. (a) LIF-measured and (b) numerically-predicted OH 2-D maps for nineselected cases in Table 1 at pressures of 1, 2 and 6 bar. The vertical arrows definethe onset of homogeneous ignition. For each case, the color bars provide theminimum and maximum computed OH in ppmv. (For interpretation of thereferences to color in this figure legend, the reader is referred to the web versionof this article.)
0 4.4 8.8
0 8 16
p = 8 bar
0 2.9 5.8
0 3 6
0 1.5 3.0
0 0.7 1.4
0 0.9 1.8
0 1.2 2.4
0 150 30022575x (mm)
0 0.2 0.4
0 0.2 0.4
0 0.3 0.6
0 1.2 2.4
(12a)
(13b)
(14b)
(14a)
(15a)
(15b)
(16a)
(16b)
(17b)
(17a)
(20a)
(20b)
(21a)
(21b)
(22b)
(22a)
(24a)
(24b)
(25a)
(25b)
(26b)
(26a)
(13a)
p = 10 bar
p = 12 bar
p = 15 bar
7 mm
(12b) 0 4 8
Fig. 4. (a) LIF-measured and (b) numerically-predicted OH 2-D maps for 12 selectedcases in Table 1 at pressures of 8, 10, 12 and 15 bar. The vertical arrows define theonset of homogeneous ignition. For each case, the color bars provide the minimumand maximum computed OH in ppmv. (For interpretation of the references to colorin this figure legend, the reader is referred to the web version of this article.)
Y. Ghermay et al. / Combustion and Flame 158 (2011) 1491–1506 1497
power generation systems [48]. On the other hand, as pressure in-creased above 10 bar the preheat requirements for significant gas-phase conversion raised appreciably. For p = 15 bar, which was apressure relevant for large gas turbines, even preheats up to758 K, typical to full load operation, were not adequate to initiatesignificant gas-phase conversion at the examined geometrical con-finement of 7 mm. Restoration of appreciable gaseous combustionat p = 5 and 8 bar has also been reported in [34] by preconvertingpart of the fuel. Fuel preconversion raised the effective inlet tem-perature and in this respect the previous findings were in agree-ment with the present study. However, apart from the limited
pressure range studied in [34] (1 6 p 6 8 bar), fuel preconversionresulted in inlet temperatures of at least 580 K, thus precluding de-tailed studies at intermediate preheats. An additional complicationin [34] was that the preconversion led to formation of water andradicals; the former was a strong inhibitor of gaseous combustionwhile the latter affected appreciably the ignition characteristics atatmospheric pressure. The results of the present study have
0 50 100 150 200 250 3000.0
1.0
2.0
800
1000
1200
1400
p=5bar
0.0
1.0
2.0
800
1000
1200
1400
0.0
1.0
2.0
800
1000
1200
1400
G
G
C
C
(5) TIN = 401 KTw
C
G
Hyd
roge
n co
nver
sion
rate
(g/m
2 s)Av
erag
e H
2 m
ass
fract
ion
/3x1
0-3
x (mm)
Tw
Tw
xig
xig(6) TIN = 576 K
(7) TIN = 653 K
Upp
er a
nd lo
wer
wal
l tem
pera
ture
(K)
YH2
YH2
YH2
Fig. 5. Thermocouple measurements (upper wall: triangles; lower wall: circles) andfitted axial temperature profiles through the measurements (lines). Computedcatalytic (C) and gas-phase (G) hydrogen conversion rates (solid and dashed lines,respectively) and the average (over the 7 mm channel height) axial profiles ofhydrogen mass fraction, YH2 (dashed double-dotted lines). The vertical arrowsdefine the computed location of homogeneous ignition (xig). Cases 5, 6 and 7 inTable 1 at p = 2 bar.
1498 Y. Ghermay et al. / Combustion and Flame 158 (2011) 1491–1506
demarcated the regimes of mixture preheat and pressure for whichgas-phase combustion was important. The reasons for thegas-phase combustion behavior discussed in Figs. 3–6 will be elab-orated in Section 4.2.
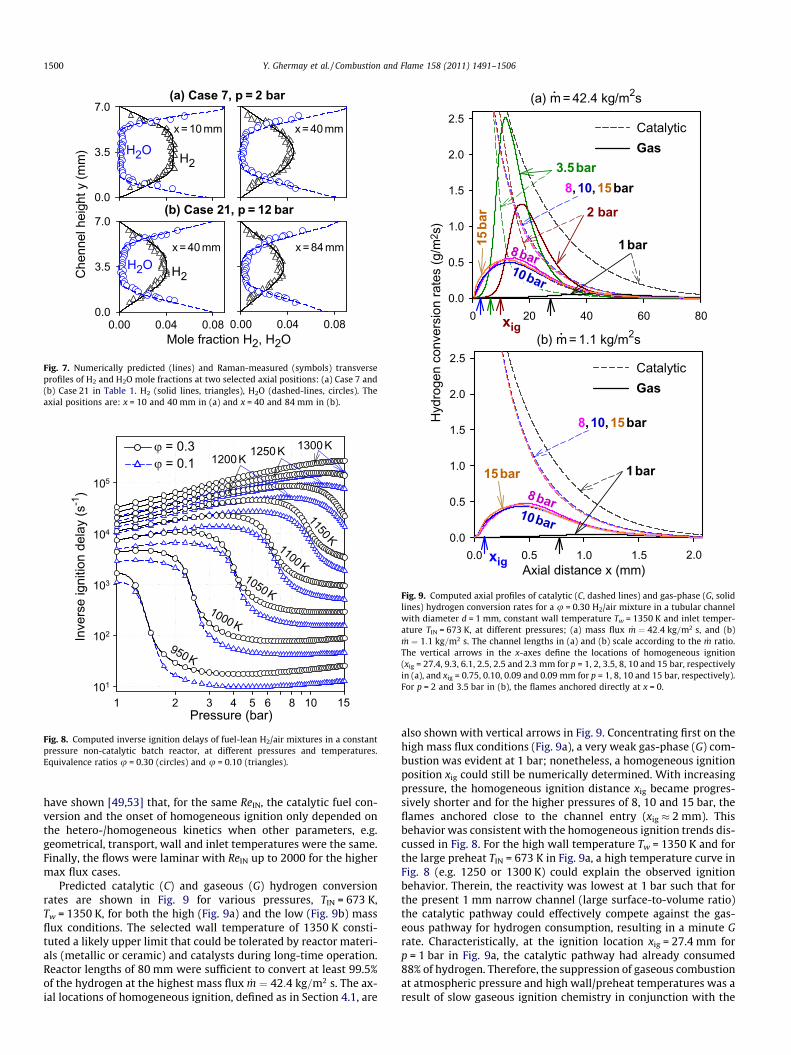
The preceding statements regarding the effect of pressure andpreheat on gas-phase chemistry presumed that the catalytic pro-cesses were also well-reproduced by the numerical model. Anincorrect prediction of the catalytic fuel conversion over the gas-phase induction length could greatly affect the location of homoge-neous ignition and thus falsify the gaseous kinetics. To further in-crease complication, analytical studies have shown the existence ofmultiple combinations of catalytic and gaseous reactivities yield-ing the same homogeneous ignition distance [49]. Although themeasured post-ignition flame shapes could be used to eliminatemost of these combinations, the Raman measurements providedthe only secure way of ensuring that the catalytic processes pre-ceding homogeneous ignition were well-predicted. Comparisonsbetween Raman-measured and numerically-predicted transverseprofiles of H2 and H2O mole fractions are shown in Fig. 7 for twocases in Table 1 (pressures of 2 and 12 bar) and two axial positionspreceding homogeneous ignition (x < xig). The numerical predic-tions indicated a catalytic conversion close to the transport-limit,as evidenced by the practically vanishing hydrogen levels nearboth walls (y = 0 and 7 mm). This behavior was also reproducedby the measurements, despite the lack of Raman data at distancescloser than 0.7 mm to both catalytic walls.
4.2. Gas-phase combustion
The experimental conditions in Table 1 and the resulting flamesin Figs. 3 and 4 pertained to different mass throughputs, equiva-lence ratios (and, sometimes, for a given equivalence ratio differentabsolute H2 and O2 volumetric contents) and also varying walltemperatures. Such differences were necessary to anchor stableflames inside the channel reactor at widely varying mixturepreheats and pressures. However, to understand the impact ofgas-phase chemistry and transport on the onset of homogeneous
ignition over Pt surfaces, comparisons were required betweencases where only a limited number of parameters changed whilemaintaining the others constant. To this direction, detailed simula-tions have been performed using two different numerical plat-forms and the validated hetero-/homogeneous chemistries ofSection 4.1.
4.2.1. Homogeneous chemistry kineticsIn a first step, pure gas-phase ignition characteristics of hydro-
gen (without the inclusion of catalytic reactions) were investi-gated. Ignition delays of H2/air mixtures at equivalence ratiosu = 0.30 and 0.10 and pressures from 1 to 15 bar, relevant to theconditions in Table 1, have been computed in a constant pressurenon-catalytic batch reactor using the SENKIN package of CHEMKIN[50]. Ignition delays were defined as the times where the hydrogenmass fraction dropped to 50% of its initial value. Initial tempera-tures ranging from 950 to 1300 K were studied. These tempera-tures were higher than the mixture preheats in the channelreactor (see Table 1), so as to mimic the presence of the hot cata-lytic walls that further preheated the flowing reacting gas. Figure 8provides the inverse of the computed ignition delays (quantitiesproportional to the hydrogen gaseous reactivity) as a function ofpressure with parameter the initial temperature. The trends dis-cussed next were common for both investigated equivalence ra-tios. For the lowest examined initial temperature of 950 K, thegaseous reactivity decreased rapidly with rising pressure up to�2 bar and then changed modestly for p P 2 bar. For the highertemperatures 1000 K 6 T 6 1300 K, the gaseous reactivity initiallyincreased monotonically with rising pressure, peaked at a criticalpressure pcr, and subsequently dropped for p > pcr. With rising ini-tial temperature, pcr increased and at the same time the drop inreactivity for p > pcr was reduced. Characteristically, at T = 1250 Kthe reactivity increased monotonically from 1 bar to pcr = 11.2 barand then dropped modestly for p > pcr such that the reactivity atp = 15 bar was only 12% lower than that at pcr. This rich behavior inhydrogen ignition chemistry was a result of the competition be-tween the chain branching step Hþ O2 () Oþ OH, the chain termi-nating step Hþ O2 þM() HO2 þM, and also of the chainbranching sequence HO2 þH2 () H2O2 þH and H2O2 þM() 2OHþM that became important at higher temperatures [51].
Although no direct comparisons could be made between thechannel reactor experiments in Figs. 3 and 4 with the present idealbatch reactor predictions, the restoration of gaseous combustion atelevated pressures with rising preheat could be qualitativelyunderstood from Fig. 8. In the channel reactor, the effective tem-peratures shown in Fig. 8 were a weighted average between the in-let and wall temperatures, with an added weight on the latter. Inprevious hetero-/homogeneous combustion studies of H2/air mix-tures with essentially no preheat (TIN = 310 K) [33], the resultingeffective temperatures were moderate enough, such that the gas-eous reactivity was highest at pressures close to 1 bar, droppingrapidly for pressures above 2–3 bar (see for example the 950 and1000 K curves in Fig. 8). For a hetero-/homogeneous combustionsystem this implied that the catalytic pathway could favorablycompete against the homogeneous pathway by consuming signifi-cant amounts of hydrogen during the elongated gas-phase induc-tion zones for p P 4 bar, thus suppressing flame formation. It isemphasized that the suppression of homogeneous combustionfor p P 4 bar and TIN � 310 K reported in [33] was an outcomenot only of intrinsic hydrogen gas-phase kinetics but also of com-petition between gaseous and catalytic reactions for hydrogen con-sumption. It is further noted that the catalytic pathway was veryeffective in consuming hydrogen due the large molecular diffusiv-ity and the very high reactivity of this species on platinum, even atmoderate surface temperatures. On the other hand, a modestincrease in preheat from 310 K to �390 K (see Table 1) increased

0.0
0.6
1.2
GC
(a) p = 8 bar
0.0
0.5
1.0
0 50 100 150 200 250 3000.0
0.4
0.8
GC
G
C
0.0
0.5
1.0
800
1000
1200
1400
G
C
0.0
0.6
1.2
800
1000
1200
1400
0 50 100 150 200 250 3000.0
0.4
0.8
800
1000
1200
1400
GC
GC
TIN=406K
TIN=567K
TIN=676K
TIN =405K
TIN=763K
xig
YH2
(13)
Tw
Tw
(b) p= 10 bar
YH2
TIN=575K
Tw
YH2
(14)
(12) (15)
(16)
(18)
0.0
0.4
0.8
0.0
0.6
1.2
0 50 100 150 200 250 3000.0
0.4
0.8
GC
0.0
0.6
1.2
8009001000110012001300
G
C
0.0
0.5
1.0
8009001000110012001300
0 50 100 150 200 250 3000.0
0.4
0.8
8009001000110012001300
G
C
G
C
Axial distance x (mm)
(c) p = 12 bar (d) p= 15 bar
TIN=390K
(19)
G
C
YH2
Tw
TIN=576K
(20)
TIN=780K
(22)
Tw
(23)
(24)
(26)
TIN=391K
TIN=585K
TIN=758K
G
C
YH2
YH2
YH2
YH2
YH2
Tw
Tw
Upp
er a
nd lo
wer
wal
l tem
pera
ture
(K)
TwHyd
roge
n co
nver
sion
rate
(g/m
2 s), A
vera
ge H
2 m
ass
fract
ion
/6x1
0-3
xig
YH2
YH2 YH2
8001400
8001300
8001300
8001400
Fig. 6. Thermocouple measurements (upper wall: triangles; lower wall: circles) and fitted axial temperature profiles through the measurements (lines). Computed catalytic(C) and gas-phase (G) hydrogen conversion rates (solid and dashed lines, respectively) and the average (over the 7 mm channel height) axial profiles of hydrogen massfraction, YH2 (dashed double-dotted lines). The vertical arrows define the computed location of homogeneous ignition (xig); (a) Cases 12, 13 and 14 at p = 8 bar, (b) Cases 15,16 and 18 at p = 10 bar, (c) Cases 19, 20 and 22 at p = 12 bar, and (d) Cases 23, 24 and 26 at p = 15 bar.
Y. Ghermay et al. / Combustion and Flame 158 (2011) 1491–1506 1499
the value of pcr and further reduced the disparity in reactivitiesbetween the lower (p < pcr) and higher pressure regimes (p > pcr).This extended the upper pressure limit for the existence of appre-ciable gaseous combustion to 10 bar (see Fig. 4).
The previous qualitative analysis, based mainly on gas-phaseignition chemistry arguments and consideration of the competi-tion between the heterogeneous and homogeneous pathways,could account for the observed re-establishment of gaseous com-bustion at pressures up to 10 bar when increasing the preheat from310 to �390 K. However, it failed to explain the observed lack ofstrong gaseous combustion at p > 10 bar and high preheats. In thispressure range, the gaseous reactivity either increased modestlywith rising pressure (T < 1050 K) or it dropped modestly withincreasing pressure (e.g., T = 1050, 1100, 1250, and 1300 K inFig. 8). It will be shown in the next section that at high pressuresthe presence of gaseous combustion was dictated not only byhomogeneous ignition chemistry but also by flame propagationcharacteristics.
4.2.2. Flame propagation characteristicsDetailed simulations have been performed using as numerical
platform tubular catalytic channels with diameter d = 1.0 mmand lengths sufficient to achieve at least 99.5% hydrogen conver-sion. The adopted geometry was more typical to that encounteredin individual channels of practical honeycomb catalytic burners[52] compared to the larger, 7 mm gap, optically accessible reactorused in the experiments. Uniform wall temperatures, Tw, were im-posed and the pressure was varied between 1 and 15 bar. Hydro-gen/air mixtures with u = 0.30 were investigated at two differenttotal mass fluxes. The larger one, _m ¼ 42:4 kg=m2 s, referred togas-turbine applications (resulting in a reference inlet velocityUIN = 18 m/s at p = 5 bar and TIN = 673 K) while the smaller one,_m = 1.1 kg/m2 s, pertained to microreactors (UIN = 0.48 m/s at
p = 5 bar and TIN = 673 K). This approach facilitated comparisonsbetween cases having the same _m and mixture preheat but differ-ent pressures, by maintaining a constant inlet Reynolds number.This was because analytical studies in channel-flow geometries
0.0
3.5
7.0
x = 10 mm
(a) Case 7, p = 2 bar
Mole fraction H2, H2O0.00 0.04 0.08
Che
nnel
hei
ght y
(mm
)
0.0
3.5
7.0
0.00 0.04 0.08
(b) Case 21, p = 12 bar
x= 40 mm
x = 40 mm x = 84 mm
H2
H2
H2O
H2O
Fig. 7. Numerically predicted (lines) and Raman-measured (symbols) transverseprofiles of H2 and H2O mole fractions at two selected axial positions: (a) Case 7 and(b) Case 21 in Table 1. H2 (solid lines, triangles), H2O (dashed-lines, circles). Theaxial positions are: x = 10 and 40 mm in (a) and x = 40 and 84 mm in (b).
Fig. 8. Computed inverse ignition delays of fuel-lean H2/air mixtures in a constantpressure non-catalytic batch reactor, at different pressures and temperatures.Equivalence ratios u = 0.30 (circles) and u = 0.10 (triangles).
0 20 40 60 800.0
0.5
1.0
1.5
2.0
2.5
1bar
2 bar
3.5bar8,10,15bar
8bar10bar
15ba
r
0.0 0.5 1.0 1.5 2.0
Hyd
roge
n co
nver
sion
rate
s (g
/m2 s
)
0.0
0.5
1.0
1.5
2.0
2.5
1bar
8,10,15bar
8bar10bar
15bar
CatalyticGas
Axial distance x (mm)
xig
xig
CatalyticGas
Fig. 9. Computed axial profiles of catalytic (C, dashed lines) and gas-phase (G, solidlines) hydrogen conversion rates for a u = 0.30 H2/air mixture in a tubular channelwith diameter d = 1 mm, constant wall temperature Tw = 1350 K and inlet temper-ature TIN = 673 K, at different pressures; (a) mass flux _m ¼ 42:4 kg=m2 s, and (b)_m ¼ 1:1 kg=m2 s. The channel lengths in (a) and (b) scale according to the _m ratio.
The vertical arrows in the x-axes define the locations of homogeneous ignition(xig = 27.4, 9.3, 6.1, 2.5, 2.5 and 2.3 mm for p = 1, 2, 3.5, 8, 10 and 15 bar, respectivelyin (a), and xig = 0.75, 0.10, 0.09 and 0.09 mm for p = 1, 8, 10 and 15 bar, respectively).For p = 2 and 3.5 bar in (b), the flames anchored directly at x = 0.
1500 Y. Ghermay et al. / Combustion and Flame 158 (2011) 1491–1506
have shown [49,53] that, for the same ReIN, the catalytic fuel con-version and the onset of homogeneous ignition only depended onthe hetero-/homogeneous kinetics when other parameters, e.g.geometrical, transport, wall and inlet temperatures were the same.Finally, the flows were laminar with ReIN up to 2000 for the highermax flux cases.
Predicted catalytic (C) and gaseous (G) hydrogen conversionrates are shown in Fig. 9 for various pressures, TIN = 673 K,Tw = 1350 K, for both the high (Fig. 9a) and the low (Fig. 9b) massflux conditions. The selected wall temperature of 1350 K consti-tuted a likely upper limit that could be tolerated by reactor materi-als (metallic or ceramic) and catalysts during long-time operation.Reactor lengths of 80 mm were sufficient to convert at least 99.5%of the hydrogen at the highest mass flux _m ¼ 42:4 kg=m2 s. The ax-ial locations of homogeneous ignition, defined as in Section 4.1, are
also shown with vertical arrows in Fig. 9. Concentrating first on thehigh mass flux conditions (Fig. 9a), a very weak gas-phase (G) com-bustion was evident at 1 bar; nonetheless, a homogeneous ignitionposition xig could still be numerically determined. With increasingpressure, the homogeneous ignition distance xig became progres-sively shorter and for the higher pressures of 8, 10 and 15 bar, theflames anchored close to the channel entry (xig � 2 mm). Thisbehavior was consistent with the homogeneous ignition trends dis-cussed in Fig. 8. For the high wall temperature Tw = 1350 K and forthe large preheat TIN = 673 K in Fig. 9a, a high temperature curve inFig. 8 (e.g. 1250 or 1300 K) could explain the observed ignitionbehavior. Therein, the reactivity was lowest at 1 bar such that forthe present 1 mm narrow channel (large surface-to-volume ratio)the catalytic pathway could effectively compete against the gas-eous pathway for hydrogen consumption, resulting in a minute Grate. Characteristically, at the ignition location xig = 27.4 mm forp = 1 bar in Fig. 9a, the catalytic pathway had already consumed88% of hydrogen. Therefore, the suppression of gaseous combustionat atmospheric pressure and high wall/preheat temperatures was aresult of slow gaseous ignition chemistry in conjunction with the

Y. Ghermay et al. / Combustion and Flame 158 (2011) 1491–1506 1501
increased hydrogen consumption from the catalytic pathway atlarge geometrical confinements (small channel diameters). The ef-fect of confinement, in particular, should not be understated; itcould account for strong gas-phase combustion at 1 bar for largerhydraulic diameter channels (as the 7-mm height channel used inthe experiments, see Fig. 3).
As pressure increased in Fig. 9a, the gaseous reactivity also in-creased (at least for pressures up to 10 bar (see Fig. 8 for tempera-tures of 1250 or 1300 K), and thus xig was accordingly reduced. Atp > 10 bar, the reactivity could either increase (T = 1300 K in Fig. 8)or drop modestly (T = 1250 K in Fig. 8) but xig was not affected asmuch, since ignition was already achieved close to the channel en-try. It was surprising, however, that although the higher pressurecases p P 8 bar ignited farther upstream compared to the p = 2and 3.5 bar cases in Fig. 9a, their integrated G conversion rates overthe entire channel length were substantially lower. For example,the integrated G rate amounted to 38% of the total hydrogen con-version at 3.5 bar and to only 14% at 15 bar. It is further noted thatthe highest examined preheat TIN = 773 K exhibited qualitativelythe same behavior as the TIN = 673 K cases in Fig. 9a.
Figure 10a–c provides computed isocontours of the hydrogengas-phase reaction rates, 2-D distributions of the hydrogen massfraction, and the hydrogen radial fluxes qYH2(v + VH2,r) (denotedby vertical arrows at selected positions in the channel) for the highmass flux cases _m = 42.4 kg/m2 s at 2, 3.5, and 15 bar. Five hydro-gen gas-phase reaction isocontours are shown, with the outer
(a) 2.0 bar
(b) 3.5 bar
(c) 15 bar
50
0 0.0022 0.0044 0.0066 0.0087
x (mm)
0.5
0.0
0.5
0.0
0.5
0.0
r(m
m)
r(m
m)
r(m
m)
r(m
m)
6.25 g/m2s
6.25 g/m2s
6.25 g/m2s
7.20 g/m2s
xig
xig
xig
H2 mass fraction
0.5
0.0(d) 15 bar, LeH2 = 1
0 10 20 30 40
Fig. 10. (color online). Computed 2-D color maps of the hydrogen mass fraction,five isocontours of the hydrogen gas-phase reaction rates, and radial hydrogenfluxes qYH2(v + VH2,r) denoted by vertical arrows for a u = 0.30 H2/air mixture in ad = 1 mm tubular channel at a mass flux _m ¼ 42:4 kg=m2 s, constant wall temper-ature Tw = 1350 K and inlet temperature TIN = 673 K: (a) 2 bar, (b) 3.5 bar, (c) 15 bar,and (d) 15 bar but with the Lewis number of hydrogen artificially set to unity. Themaximum gas-phase hydrogen reaction rates are 10, 20, 6 and 400 kg/m3 s in (a) to(d), respectively. The color bar provides the hydrogen mass fraction levels and thearrows marked xig in (a), (b) and (c) the locations of homogeneous ignition. Thechannel centerline is located at r = 0 and the gas–wall interface at r = 0.5 mm.
one corresponding to 10% of the maximum hydrogen reaction rateof each case. Since ReIN was the same in Fig. 10a–c, the hydrogenradial fluxes at the three different pressures would have been iden-tical at the same locations provided that the catalytic hydrogenconversion was transport limited and that gaseous reactions wereabsent [53]. The nearly transport-limited catalytic conversioncould readily be attested from the hydrogen mass fraction radialprofiles in Fig. 11, pertaining to the 15 bar case in Fig. 10c (thesame behavior was also attained for the other pressure cases).Gas-phase reactions modified the radial hydrogen fluxes, but forthe cases shown in Fig. 10a–c the mass flux loading on the flameswas still largely dictated by the inlet mass flow rate (or equiva-lently ReIN) and the catalytic surface conversion, as explained next.
Following homogenous ignition, the hydrogen gaseous combus-tion zone was confined close to the catalytic walls. This has alreadybeen shown in the optically accessible reactor measurements andpredictions (see Figs. 3 and 4) and was further evident from thereaction rate isocontours in Fig. 10a–c. The confinement of the gas-eous reaction zone near the wall, which was largely an outcome ofthe low Lewis number of hydrogen (see also [31,34]), had profoundimplications for the ensuing flame stability. As the flames werealigned mostly parallel to the x-axis (for this, further consider thatthe y-axis scale in Fig. 10 has been stretched by a factor of 25 incomparison to the x-axis scale), flames with higher burning ratescould position themselves farther away from the wall, at locationsof higher radial hydrogen fluxes (dictated by the inlet flow rate andthe catalytic reactivity). Laminar burning rates computed for freelypropagating 1-D flames using the CHEMKIN package [54], havebeen plotted as a function of pressure in Fig. 12 for two H2/airequivalence ratios, u = 0.30 and 0.20, and two preheats,To = 673 K and 773 K. This was to mimic the increase in mixturepreheat and drop in hydrogen content with increasing axial dis-tance along the channel centerline (see temperature and H2 massfraction profiles in Fig. 11).
0.00 2.25e-3 4.50e-3 6.75e-3 9.00e-3
Cha
nnel
radi
us r
(mm
)
0.0
0.1
0.2
0.3
0.4
0.5
Temperature (K)650 825 1000 1175 1350
Hydrogen mass fraction
x = 1.0 mm
x = 2.3 mm
x = 4.4 mmx = 9.1 mmx=
20.0m
m
x = 1.0 mm
x = 2.3 mm
x =4.4
mm
x =9.1
mm
x =20
.0mm
Fig. 11. Computed radial profiles of hydrogen mass fraction (solid lines) andtemperature (dashed-dotted lines) in a tubular channel with diameter of 1 mm, atfive selected axial positions. Hydrogen/air mixture with u = 0.30, pressure 15 bar,wall temperature Tw = 1350 K, inlet temperature TIN = 673 K and mass flux_m ¼ 42:4 kg=m2 s (inlet velocity UIN = 6 m/s). The channel centerline is located at
r = 0 and the gas–wall interface at r = 0.5 mm.
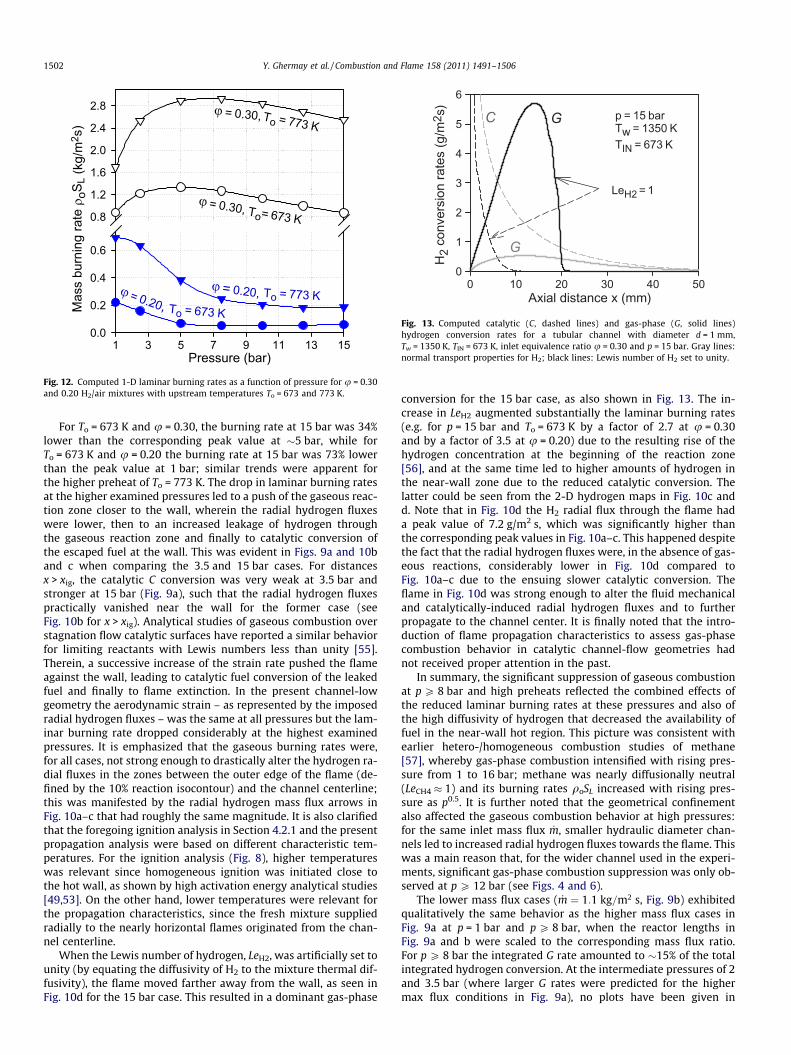
Fig. 12. Computed 1-D laminar burning rates as a function of pressure for u = 0.30and 0.20 H2/air mixtures with upstream temperatures To = 673 and 773 K.
Axial distance x (mm)0 10 20 30 40 50
H2
conv
ersi
on ra
tes
(g/m
2 s)
0
1
2
3
4
5
6
LeH2 = 1
G
G
C p = 15 bar Tw = 1350 KTIN = 673 K
Fig. 13. Computed catalytic (C, dashed lines) and gas-phase (G, solid lines)hydrogen conversion rates for a tubular channel with diameter d = 1 mm,Tw = 1350 K, TIN = 673 K, inlet equivalence ratio u = 0.30 and p = 15 bar. Gray lines:normal transport properties for H2; black lines: Lewis number of H2 set to unity.
1502 Y. Ghermay et al. / Combustion and Flame 158 (2011) 1491–1506
For To = 673 K and u = 0.30, the burning rate at 15 bar was 34%lower than the corresponding peak value at �5 bar, while forTo = 673 K and u = 0.20 the burning rate at 15 bar was 73% lowerthan the peak value at 1 bar; similar trends were apparent forthe higher preheat of To = 773 K. The drop in laminar burning ratesat the higher examined pressures led to a push of the gaseous reac-tion zone closer to the wall, wherein the radial hydrogen fluxeswere lower, then to an increased leakage of hydrogen throughthe gaseous reaction zone and finally to catalytic conversion ofthe escaped fuel at the wall. This was evident in Figs. 9a and 10band c when comparing the 3.5 and 15 bar cases. For distancesx > xig, the catalytic C conversion was very weak at 3.5 bar andstronger at 15 bar (Fig. 9a), such that the radial hydrogen fluxespractically vanished near the wall for the former case (seeFig. 10b for x > xig). Analytical studies of gaseous combustion overstagnation flow catalytic surfaces have reported a similar behaviorfor limiting reactants with Lewis numbers less than unity [55].Therein, a successive increase of the strain rate pushed the flameagainst the wall, leading to catalytic fuel conversion of the leakedfuel and finally to flame extinction. In the present channel-lowgeometry the aerodynamic strain – as represented by the imposedradial hydrogen fluxes – was the same at all pressures but the lam-inar burning rate dropped considerably at the highest examinedpressures. It is emphasized that the gaseous burning rates were,for all cases, not strong enough to drastically alter the hydrogen ra-dial fluxes in the zones between the outer edge of the flame (de-fined by the 10% reaction isocontour) and the channel centerline;this was manifested by the radial hydrogen mass flux arrows inFig. 10a–c that had roughly the same magnitude. It is also clarifiedthat the foregoing ignition analysis in Section 4.2.1 and the presentpropagation analysis were based on different characteristic tem-peratures. For the ignition analysis (Fig. 8), higher temperatureswas relevant since homogeneous ignition was initiated close tothe hot wall, as shown by high activation energy analytical studies[49,53]. On the other hand, lower temperatures were relevant forthe propagation characteristics, since the fresh mixture suppliedradially to the nearly horizontal flames originated from the chan-nel centerline.
When the Lewis number of hydrogen, LeH2, was artificially set tounity (by equating the diffusivity of H2 to the mixture thermal dif-fusivity), the flame moved farther away from the wall, as seen inFig. 10d for the 15 bar case. This resulted in a dominant gas-phase
conversion for the 15 bar case, as also shown in Fig. 13. The in-crease in LeH2 augmented substantially the laminar burning rates(e.g. for p = 15 bar and To = 673 K by a factor of 2.7 at u = 0.30and by a factor of 3.5 at u = 0.20) due to the resulting rise of thehydrogen concentration at the beginning of the reaction zone[56], and at the same time led to higher amounts of hydrogen inthe near-wall zone due to the reduced catalytic conversion. Thelatter could be seen from the 2-D hydrogen maps in Fig. 10c andd. Note that in Fig. 10d the H2 radial flux through the flame hada peak value of 7.2 g/m2 s, which was significantly higher thanthe corresponding peak values in Fig. 10a–c. This happened despitethe fact that the radial hydrogen fluxes were, in the absence of gas-eous reactions, considerably lower in Fig. 10d compared toFig. 10a–c due to the ensuing slower catalytic conversion. Theflame in Fig. 10d was strong enough to alter the fluid mechanicaland catalytically-induced radial hydrogen fluxes and to furtherpropagate to the channel center. It is finally noted that the intro-duction of flame propagation characteristics to assess gas-phasecombustion behavior in catalytic channel-flow geometries hadnot received proper attention in the past.
In summary, the significant suppression of gaseous combustionat p P 8 bar and high preheats reflected the combined effects ofthe reduced laminar burning rates at these pressures and also ofthe high diffusivity of hydrogen that decreased the availability offuel in the near-wall hot region. This picture was consistent withearlier hetero-/homogeneous combustion studies of methane[57], whereby gas-phase combustion intensified with rising pres-sure from 1 to 16 bar; methane was nearly diffusionally neutral(LeCH4 � 1) and its burning rates qoSL increased with rising pres-sure as p0.5. It is further noted that the geometrical confinementalso affected the gaseous combustion behavior at high pressures:for the same inlet mass flux _m, smaller hydraulic diameter chan-nels led to increased radial hydrogen fluxes towards the flame. Thiswas a main reason that, for the wider channel used in the experi-ments, significant gas-phase combustion suppression was only ob-served at p P 12 bar (see Figs. 4 and 6).
The lower mass flux cases ( _m ¼ 1:1 kg=m2 s, Fig. 9b) exhibitedqualitatively the same behavior as the higher mass flux cases inFig. 9a at p = 1 bar and p P 8 bar, when the reactor lengths inFig. 9a and b were scaled to the corresponding mass flux ratio.For p P 8 bar the integrated G rate amounted to �15% of the totalintegrated hydrogen conversion. At the intermediate pressures of 2and 3.5 bar (where larger G rates were predicted for the highermax flux conditions in Fig. 9a), no plots have been given in
Y. Ghermay et al. / Combustion and Flame 158 (2011) 1491–1506 1503
Fig. 9b since the resulting lower inflow velocities led to flames an-chored directly at x = 0 such that a pure gas-phase microreactorwas established. This behavior would have led to flame flashbackin a practical burner.
For non-preheated mixtures (TIN = 293 K) gas-phase conversionwas minimal for the gas-turbine mass flux of _m ¼ 42:4 kg=m2 s andTw = 1350 K. Plots similar to Fig. 9a indicated that the integrated Gconversion amounted to less than 4% of the total hydrogen conver-sion for all pressures, despite the fact that homogeneous ignitionoccurred within the first 10 mm reactor length. The reason wasthe further reduced mass burning rates at TIN = 293 K that couldnot accommodate the imposed radial hydrogen fluxes, as explainedpreviously. For the microreactor mass flux _m ¼ 1:1 kg=m2 s and forTIN = 293 K, the integrated G conversions were again minimal (lessthan 5% of the total integrated G conversions) for all pressures, ex-cept for p = 3.5 bar whereby the flame anchored at x = 0.
Finally, it is noted that the hetero-/homogeneous radical cou-pling had no appreciable impact on the aforementioned flamebehavior. It may have been thought that as the flame was pushedagainst the wall at higher pressures, loss of radicals to the catalystsurface would have led to a stronger suppression of gaseous com-bustion. However, for the high wall and preheat temperatures inFigs. 9 and 10, computations with and without the inclusion of rad-ical adsorption and desorption reactions (OH, O and H) gave prac-tically the same results in terms of G conversion at all pressures.
4.3. Impact of preheat and confinement on gaseous combustion
The observed significant suppression of gaseous combustion atcertain pressures had a significant impact on the reactor thermalmanagement. In practical reactors the wall temperature was notuniform but locally varying as a result of the complex interplay be-tween heat generation, heat redistribution mechanisms (heat con-duction in the solid wall and in-channel surface radiationexchange), and external heat losses [58]. Under such conditions,it has been shown [31,34] that the presence of the near-wallgaseous combustion zone reduced appreciably the superadiabatic
Pressure (bar)1 3 5 7 9 11 13 15
Hyd
roge
n ga
s ph
ase
conv
ersi
on (%
)
1
10
100
20
40
6080
5
TW = 1450 K
TIN = 293 K,
TW= 1350 K
TIN = 293 K, TW = 1450 K
TIN = 773 K, TW = 1350 K
TIN = 773 K,
TIN = 773 K, TW = 1300 K
T IN= 2
93K,
TW= 1300 K
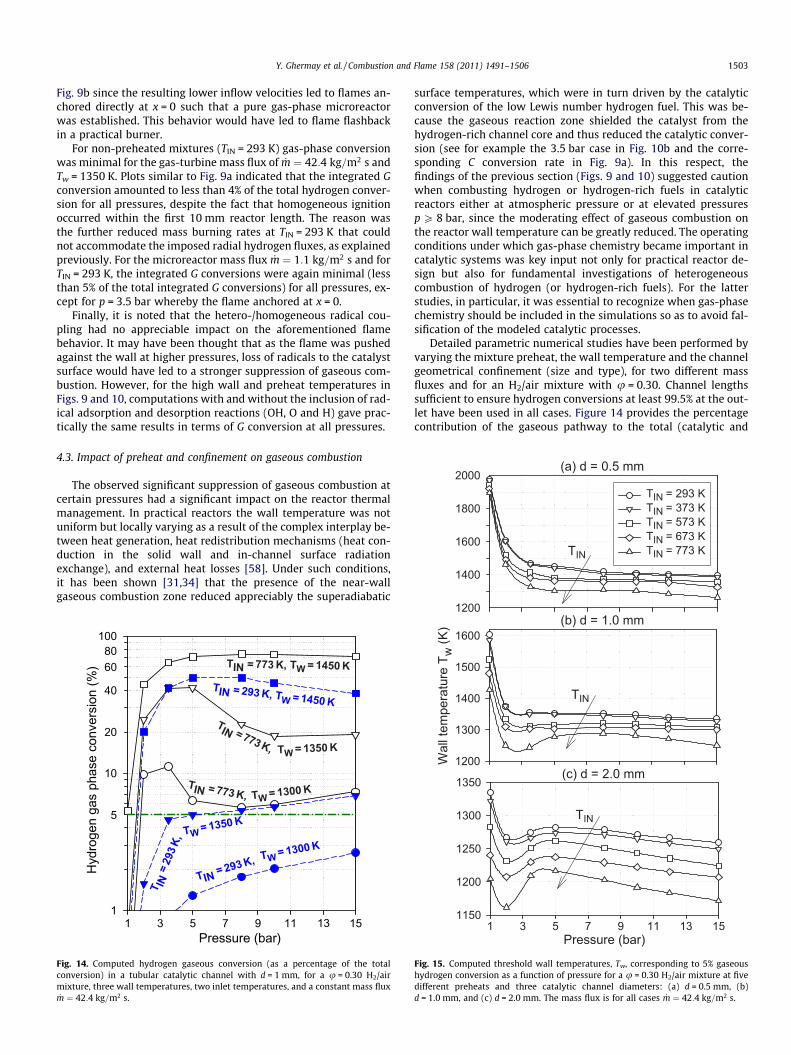
Fig. 14. Computed hydrogen gaseous conversion (as a percentage of the totalconversion) in a tubular catalytic channel with d = 1 mm, for a u = 0.30 H2/airmixture, three wall temperatures, two inlet temperatures, and a constant mass flux_m ¼ 42:4 kg=m2 s.
surface temperatures, which were in turn driven by the catalyticconversion of the low Lewis number hydrogen fuel. This was be-cause the gaseous reaction zone shielded the catalyst from thehydrogen-rich channel core and thus reduced the catalytic conver-sion (see for example the 3.5 bar case in Fig. 10b and the corre-sponding C conversion rate in Fig. 9a). In this respect, thefindings of the previous section (Figs. 9 and 10) suggested cautionwhen combusting hydrogen or hydrogen-rich fuels in catalyticreactors either at atmospheric pressure or at elevated pressuresp P 8 bar, since the moderating effect of gaseous combustion onthe reactor wall temperature can be greatly reduced. The operatingconditions under which gas-phase chemistry became important incatalytic systems was key input not only for practical reactor de-sign but also for fundamental investigations of heterogeneouscombustion of hydrogen (or hydrogen-rich fuels). For the latterstudies, in particular, it was essential to recognize when gas-phasechemistry should be included in the simulations so as to avoid fal-sification of the modeled catalytic processes.
Detailed parametric numerical studies have been performed byvarying the mixture preheat, the wall temperature and the channelgeometrical confinement (size and type), for two different massfluxes and for an H2/air mixture with u = 0.30. Channel lengthssufficient to ensure hydrogen conversions at least 99.5% at the out-let have been used in all cases. Figure 14 provides the percentagecontribution of the gaseous pathway to the total (catalytic and
Fig. 15. Computed threshold wall temperatures, Tw, corresponding to 5% gaseoushydrogen conversion as a function of pressure for a u = 0.30 H2/air mixture at fivedifferent preheats and three catalytic channel diameters: (a) d = 0.5 mm, (b)d = 1.0 mm, and (c) d = 2.0 mm. The mass flux is for all cases _m ¼ 42:4 kg=m2 s.
1504 Y. Ghermay et al. / Combustion and Flame 158 (2011) 1491–1506
gaseous) hydrogen conversion as a function of pressure for a tubu-lar channel with diameter d = 1 mm, three different wall tempera-tures, two different preheats, and the gas-turbine-relevant massflux _m ¼ 42:4 kg=m2 s. The operating conditions for which gas-phase chemistry amounted to 5% of the total (catalytic and gas-eous) hydrogen conversion have subsequently been delineated.To accurately determine these limiting envelopes, successive sim-ulations of the type shown in Fig. 14 were performed by increasingthe wall temperature at increments as fine as 5 K, while keeping allother parameters constant. Threshold wall temperatures corre-sponding to 5% gaseous hydrogen conversion are plotted inFig. 15 as a function of pressure for five different mixture preheats,three channel diameters (d = 0.5, 1.0 and 2.0 mm) and a constantmass flux _m ¼ 42:4 kg=m2 s. For the higher pressure rangep P 8 bar, the threshold wall temperature required for achieving5% gaseous conversion either remained constant or dropped withrising pressure. This was not inconsistent with the suppression ofgaseous combustion at higher pressures reported in the previoussection, since the 5% gaseous conversion limit was low enoughsuch that the controlling factor was the ignition and not the prop-agation characteristics.
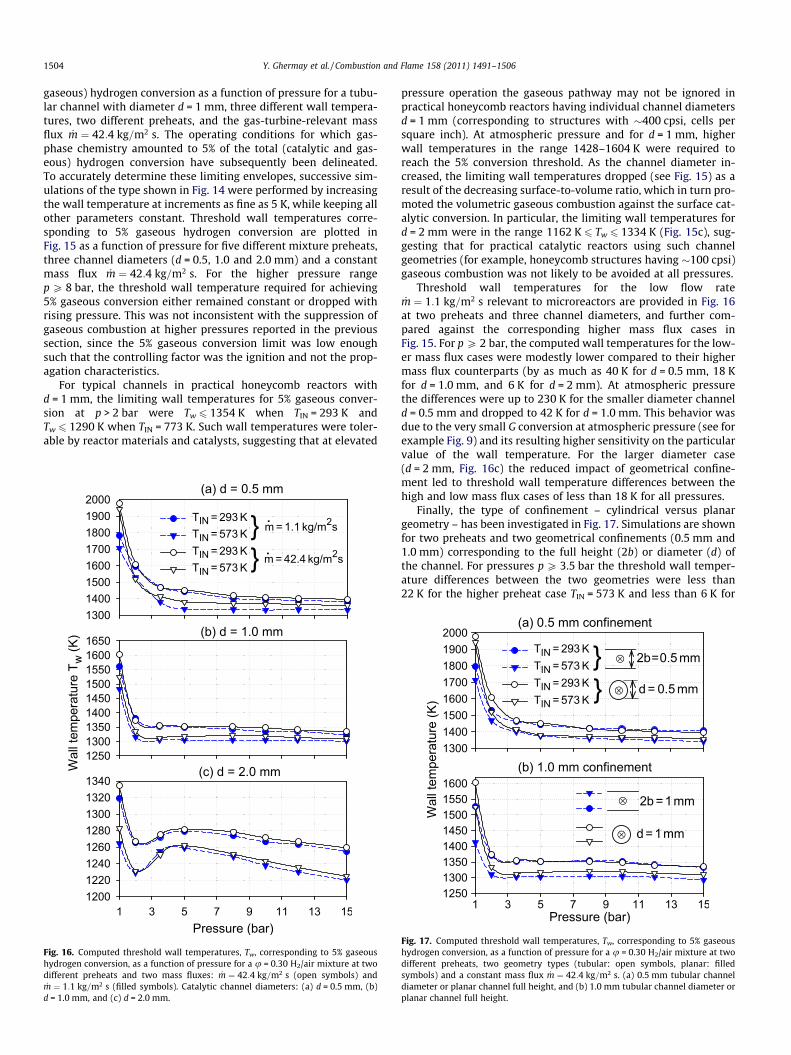
For typical channels in practical honeycomb reactors withd = 1 mm, the limiting wall temperatures for 5% gaseous conver-sion at p > 2 bar were Tw 6 1354 K when TIN = 293 K andTw 6 1290 K when TIN = 773 K. Such wall temperatures were toler-able by reactor materials and catalysts, suggesting that at elevated
Fig. 16. Computed threshold wall temperatures, Tw, corresponding to 5% gaseoushydrogen conversion, as a function of pressure for a u = 0.30 H2/air mixture at twodifferent preheats and two mass fluxes: _m ¼ 42:4 kg=m2 s (open symbols) and_m ¼ 1:1 kg=m2 s (filled symbols). Catalytic channel diameters: (a) d = 0.5 mm, (b)
d = 1.0 mm, and (c) d = 2.0 mm.
pressure operation the gaseous pathway may not be ignored inpractical honeycomb reactors having individual channel diametersd = 1 mm (corresponding to structures with �400 cpsi, cells persquare inch). At atmospheric pressure and for d = 1 mm, higherwall temperatures in the range 1428–1604 K were required toreach the 5% conversion threshold. As the channel diameter in-creased, the limiting wall temperatures dropped (see Fig. 15) as aresult of the decreasing surface-to-volume ratio, which in turn pro-moted the volumetric gaseous combustion against the surface cat-alytic conversion. In particular, the limiting wall temperatures ford = 2 mm were in the range 1162 K 6 Tw 6 1334 K (Fig. 15c), sug-gesting that for practical catalytic reactors using such channelgeometries (for example, honeycomb structures having �100 cpsi)gaseous combustion was not likely to be avoided at all pressures.
Threshold wall temperatures for the low flow rate_m ¼ 1:1 kg=m2 s relevant to microreactors are provided in Fig. 16
at two preheats and three channel diameters, and further com-pared against the corresponding higher mass flux cases inFig. 15. For p P 2 bar, the computed wall temperatures for the low-er mass flux cases were modestly lower compared to their highermass flux counterparts (by as much as 40 K for d = 0.5 mm, 18 Kfor d = 1.0 mm, and 6 K for d = 2 mm). At atmospheric pressurethe differences were up to 230 K for the smaller diameter channeld = 0.5 mm and dropped to 42 K for d = 1.0 mm. This behavior wasdue to the very small G conversion at atmospheric pressure (see forexample Fig. 9) and its resulting higher sensitivity on the particularvalue of the wall temperature. For the larger diameter case(d = 2 mm, Fig. 16c) the reduced impact of geometrical confine-ment led to threshold wall temperature differences between thehigh and low mass flux cases of less than 18 K for all pressures.
Finally, the type of confinement – cylindrical versus planargeometry – has been investigated in Fig. 17. Simulations are shownfor two preheats and two geometrical confinements (0.5 mm and1.0 mm) corresponding to the full height (2b) or diameter (d) ofthe channel. For pressures p P 3.5 bar the threshold wall temper-ature differences between the two geometries were less than22 K for the higher preheat case TIN = 573 K and less than 6 K for
Fig. 17. Computed threshold wall temperatures, Tw, corresponding to 5% gaseoushydrogen conversion, as a function of pressure for a u = 0.30 H2/air mixture at twodifferent preheats, two geometry types (tubular: open symbols, planar: filledsymbols) and a constant mass flux _m ¼ 42:4 kg=m2 s. (a) 0.5 mm tubular channeldiameter or planar channel full height, and (b) 1.0 mm tubular channel diameter orplanar channel full height.
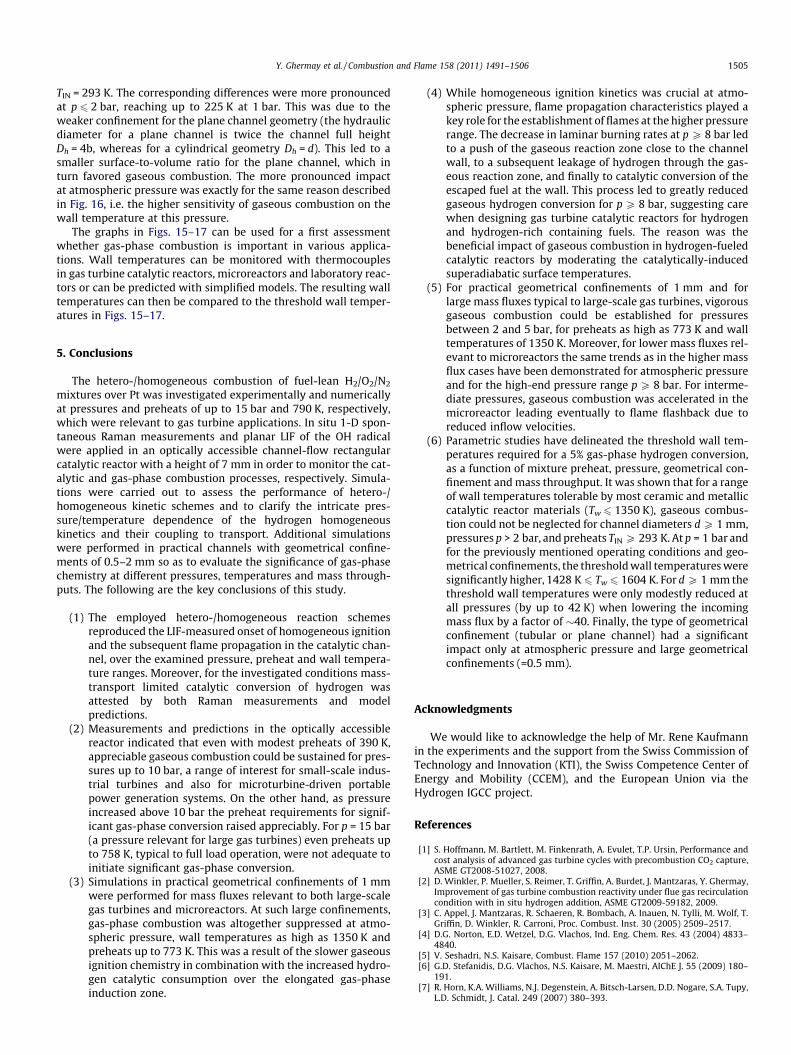
Y. Ghermay et al. / Combustion and Flame 158 (2011) 1491–1506 1505
TIN = 293 K. The corresponding differences were more pronouncedat p 6 2 bar, reaching up to 225 K at 1 bar. This was due to theweaker confinement for the plane channel geometry (the hydraulicdiameter for a plane channel is twice the channel full heightDh = 4b, whereas for a cylindrical geometry Dh = d). This led to asmaller surface-to-volume ratio for the plane channel, which inturn favored gaseous combustion. The more pronounced impactat atmospheric pressure was exactly for the same reason describedin Fig. 16, i.e. the higher sensitivity of gaseous combustion on thewall temperature at this pressure.
The graphs in Figs. 15–17 can be used for a first assessmentwhether gas-phase combustion is important in various applica-tions. Wall temperatures can be monitored with thermocouplesin gas turbine catalytic reactors, microreactors and laboratory reac-tors or can be predicted with simplified models. The resulting walltemperatures can then be compared to the threshold wall temper-atures in Figs. 15–17.
5. Conclusions
The hetero-/homogeneous combustion of fuel-lean H2/O2/N2
mixtures over Pt was investigated experimentally and numericallyat pressures and preheats of up to 15 bar and 790 K, respectively,which were relevant to gas turbine applications. In situ 1-D spon-taneous Raman measurements and planar LIF of the OH radicalwere applied in an optically accessible channel-flow rectangularcatalytic reactor with a height of 7 mm in order to monitor the cat-alytic and gas-phase combustion processes, respectively. Simula-tions were carried out to assess the performance of hetero-/homogeneous kinetic schemes and to clarify the intricate pres-sure/temperature dependence of the hydrogen homogeneouskinetics and their coupling to transport. Additional simulationswere performed in practical channels with geometrical confine-ments of 0.5–2 mm so as to evaluate the significance of gas-phasechemistry at different pressures, temperatures and mass through-puts. The following are the key conclusions of this study.
(1) The employed hetero-/homogeneous reaction schemesreproduced the LIF-measured onset of homogeneous ignitionand the subsequent flame propagation in the catalytic chan-nel, over the examined pressure, preheat and wall tempera-ture ranges. Moreover, for the investigated conditions mass-transport limited catalytic conversion of hydrogen wasattested by both Raman measurements and modelpredictions.
(2) Measurements and predictions in the optically accessiblereactor indicated that even with modest preheats of 390 K,appreciable gaseous combustion could be sustained for pres-sures up to 10 bar, a range of interest for small-scale indus-trial turbines and also for microturbine-driven portablepower generation systems. On the other hand, as pressureincreased above 10 bar the preheat requirements for signif-icant gas-phase conversion raised appreciably. For p = 15 bar(a pressure relevant for large gas turbines) even preheats upto 758 K, typical to full load operation, were not adequate toinitiate significant gas-phase conversion.
(3) Simulations in practical geometrical confinements of 1 mmwere performed for mass fluxes relevant to both large-scalegas turbines and microreactors. At such large confinements,gas-phase combustion was altogether suppressed at atmo-spheric pressure, wall temperatures as high as 1350 K andpreheats up to 773 K. This was a result of the slower gaseousignition chemistry in combination with the increased hydro-gen catalytic consumption over the elongated gas-phaseinduction zone.
(4) While homogeneous ignition kinetics was crucial at atmo-spheric pressure, flame propagation characteristics played akey role for the establishment of flames at the higher pressurerange. The decrease in laminar burning rates at p P 8 bar ledto a push of the gaseous reaction zone close to the channelwall, to a subsequent leakage of hydrogen through the gas-eous reaction zone, and finally to catalytic conversion of theescaped fuel at the wall. This process led to greatly reducedgaseous hydrogen conversion for p P 8 bar, suggesting carewhen designing gas turbine catalytic reactors for hydrogenand hydrogen-rich containing fuels. The reason was thebeneficial impact of gaseous combustion in hydrogen-fueledcatalytic reactors by moderating the catalytically-inducedsuperadiabatic surface temperatures.
(5) For practical geometrical confinements of 1 mm and forlarge mass fluxes typical to large-scale gas turbines, vigorousgaseous combustion could be established for pressuresbetween 2 and 5 bar, for preheats as high as 773 K and walltemperatures of 1350 K. Moreover, for lower mass fluxes rel-evant to microreactors the same trends as in the higher massflux cases have been demonstrated for atmospheric pressureand for the high-end pressure range p P 8 bar. For interme-diate pressures, gaseous combustion was accelerated in themicroreactor leading eventually to flame flashback due toreduced inflow velocities.
(6) Parametric studies have delineated the threshold wall tem-peratures required for a 5% gas-phase hydrogen conversion,as a function of mixture preheat, pressure, geometrical con-finement and mass throughput. It was shown that for a rangeof wall temperatures tolerable by most ceramic and metalliccatalytic reactor materials (Tw 6 1350 K), gaseous combus-tion could not be neglected for channel diameters d P 1 mm,pressures p > 2 bar, and preheats TIN P 293 K. At p = 1 bar andfor the previously mentioned operating conditions and geo-metrical confinements, the threshold wall temperatures weresignificantly higher, 1428 K 6 Tw 6 1604 K. For d P 1 mm thethreshold wall temperatures were only modestly reduced atall pressures (by up to 42 K) when lowering the incomingmass flux by a factor of �40. Finally, the type of geometricalconfinement (tubular or plane channel) had a significantimpact only at atmospheric pressure and large geometricalconfinements (=0.5 mm).
Acknowledgments
We would like to acknowledge the help of Mr. Rene Kaufmannin the experiments and the support from the Swiss Commission ofTechnology and Innovation (KTI), the Swiss Competence Center ofEnergy and Mobility (CCEM), and the European Union via theHydrogen IGCC project.
References
[1] S. Hoffmann, M. Bartlett, M. Finkenrath, A. Evulet, T.P. Ursin, Performance andcost analysis of advanced gas turbine cycles with precombustion CO2 capture,ASME GT2008-51027, 2008.
[2] D. Winkler, P. Mueller, S. Reimer, T. Griffin, A. Burdet, J. Mantzaras, Y. Ghermay,Improvement of gas turbine combustion reactivity under flue gas recirculationcondition with in situ hydrogen addition, ASME GT2009-59182, 2009.
[3] C. Appel, J. Mantzaras, R. Schaeren, R. Bombach, A. Inauen, N. Tylli, M. Wolf, T.Griffin, D. Winkler, R. Carroni, Proc. Combust. Inst. 30 (2005) 2509–2517.
[4] D.G. Norton, E.D. Wetzel, D.G. Vlachos, Ind. Eng. Chem. Res. 43 (2004) 4833–4840.
[5] V. Seshadri, N.S. Kaisare, Combust. Flame 157 (2010) 2051–2062.[6] G.D. Stefanidis, D.G. Vlachos, N.S. Kaisare, M. Maestri, AIChE J. 55 (2009) 180–
191.[7] R. Horn, K.A. Williams, N.J. Degenstein, A. Bitsch-Larsen, D.D. Nogare, S.A. Tupy,
L.D. Schmidt, J. Catal. 249 (2007) 380–393.
1506 Y. Ghermay et al. / Combustion and Flame 158 (2011) 1491–1506
[8] W.M. Budzianowski, Int. J. Hydrogen Energy 35 (2010) 7454–7469.[9] M. Hartmann, L. Maier, H.D. Minh, O. Deutschmann, Combust. Flame 157
(2010) 1771–1782.[10] N. Hotz, M.J. Stutz, S. Loher, W.J. Stark, D. Poulikakos, Appl. Catal. B – Environ.
73 (2007) 336–344.[11] C.M. Balonek, J.L. Colby, L.D. Schmidt, AIChE J. 56 (2010) 979–988.[12] R. Carroni, T. Griffin, Catal. Today 155 (2010) 2–12.[13] G. Pizza, C.E. Frouzakis, J. Mantzaras, A.G. Tomboulides, K. Boulouchos,
Combust. Flame 155 (2008) 2–20.[14] G. Pizza, C.E. Frouzakis, J. Mantzaras, A.G. Tomboulides, K. Boulouchos, J. Fluid
Mech. 658 (2010) 463–491.[15] K. Maruta, T. Kataoka, N.I. Kim, S. Minaev, R. Fursenko, Proc. Combust. Inst. 30
(2004) 2429–2436.[16] C.J. Evans, D.C. Kyritsis, Proc. Combust. Inst. 32 (2009) 3107–3114.[17] G. Pizza, J. Mantzaras, C.E. Frouzakis, A.G. Tomboulides, K. Boulouchos, Proc.
Combust. Inst. 32 (2009) 3051–3058.[18] G. Pizza, J. Mantzaras, C.E. Frouzakis, Catal. Today 155 (2010) 123–130.[19] O. Deutschmann, R. Schmidt, F. Behrendt, J. Warnatz, Proc. Combust. Inst. 26
(1996) 1747–1754.[20] M. Rinnemo, O. Deutschmann, F. Behrendt, B. Kasemo, Combust. Flame 111
(1997) 312–326.[21] M. Maestri, A. Beretta, T. Faravelli, G. Groppi, E. Tronconi, D.G. Vlachos, Chem.
Eng. Sci. 63 (2008) 2657–2669.[22] B. Hellsing, B. Kasemo, V.P. Zhdanov, J. Catal. 132 (1991) 210–228.[23] O. Deutschmann, L.I. Maier, U. Riedel, A.H. Stroemman, R.W. Dibble, Catal.
Today 59 (2000) 141–150.[24] J. Ludwig, D.G. Vlachos, J. Chem. Phys. 128 (2008) 154708.[25] J.D. Grunwaldt, B. Kimmerle, A. Baiker, P. Boye, C.G. Schroer, P. Glatzel, C.N.
Borca, F. Beckmann, Catal. Today 145 (2009) 267–278.[26] J. Li, Z. Zhao, A. Kazakov, F.L. Dryer, Int. J. Chem. Kinet. 36 (2004) 566–575.[27] M.P. Burke, F.L. Dryer, Y. Ju, Proc. Combust. Inst. 33 (2010), doi:10.1016/
j.proci.2010.05.021.[28] P. Saxena, F.A. Williams, Combust. Flame 145 (2006) 316–323.[29] J. Li, Z.W. Zhao, A. Kazakov, M. Chaos, F.L. Dryer, J.J. Scire, Int. J. Chem. Kinet. 39
(2007) 109–136.[30] P.A. Bui, D.G. Vlachos, P.R. Westmoreland, Proc. Combust. Inst. 26 (1996)
1763–1770.[31] C. Appel, J. Mantzaras, R. Schaeren, R. Bombach, A. Inauen, B. Kaeppeli, B.
Hemmerling, A. Stampanoni, Combust. Flame 128 (2002) 340–368.[32] M. Maestri, A. Beretta, T. Faravelli, G. Groppi, E. Tronconi, Chem. Eng. Sci. 62
(2007) 4992–4997.[33] J. Mantzaras, R. Bombach, R. Schaeren, Proc. Combust. Inst. 32 (2009) 1937–
1945.[34] Y. Ghermay, J. Mantzaras, R. Bombach, Combust. Flame 157 (2010) 1942–
1958.[35] J. Mantzaras, Combust. Sci. Technol. 180 (2008) 1137–1168.
[36] G. Groppi, A. Belloli, E. Tronconi, P. Forzatti, Catal. Today 29 (1996) 403–407.[37] A. Scarpa, P.S. Barbato, G. Landi, R. Pirone, G. Russo, Chem. Eng. J. 154 (2009)
315–324.[38] S. Specchia, L.D. Vella, S. Burelli, G. Saracco, V. Specchia, ChemPhysChem 10
(2009) 783–786.[39] S. Karagiannidis, J. Mantzaras, R. Bombach, S. Schenker, K. Boulouchos, Proc.
Combust. Inst. 32 (2009) 1947–1955.[40] M. Reinke, Mantzaras, R. Bombach, S. Schenker, N. Tylli, K. Boulouchos,
Combust. Sci. Technol. 179 (2007) 553–600.[41] M. Reinke, J. Mantzaras, R. Schaeren, R. Bombach, A. Inauen, S. Schenker,
Combust. Flame 136 (2004) 217–240.[42] W.C. Pfefferle, L.D. Pfefferle, Prog. Energy Combust. Sci. 12 (1986) 25–41.[43] R.J. Kee, G. Dixon-Lewis, J. Warnatz, M.E. Coltrin, J.A. Miller, A Fortran
computer code package for the evaluation of gas-phase multicomponenttransport properties, Report No. SAND86-8246, 1996.
[44] J. Warnatz, M.D. Allendorf, R.J. Kee, M.E. Coltrin, Combust. Flame 96 (1994)393–406.
[45] R.J. Kee, F.M. Rupley, J.A. Miller, Chemkin II: a Fortran chemical kineticspackage for the analysis of gas-phase chemical kinetics, Report No. SAND89-8009B, 1996.
[46] M.E. Coltrin, R.J. Kee, F.M. Rupley, Surface Chemkin: a Fortran package foranalyzing heterogeneous chemical kinetics at the solid surface–gas phaseinterface, Report No. SAND90-8003C, 1996.
[47] C. Appel, J. Mantzaras, R. Schaeren, R. Bombach, A. Inauen, Combust. Flame 140(2005) 70–92.
[48] B. Schneider, S. Karagiannidis, M. Bruderer, D. Dyntar, C. Zwyssig, Q.Guangchun, M. Diener, K. Boulouchos, R.S. Abhari, L. Guzzella, J.W. Kolar,Ultra-high-energy-density converter for portable power, Power-MEMS 2005,Tokyo, Japan, November 28–30, 2005.
[49] J. Mantzaras, C. Appel, Combust. Flame 130 (2002) 336–351.[50] A.E. Lutz, R.J. Kee, J.A. Miller, SENKIN: a Fortran program for predicting
homogeneous gas phase chemical kinetics with sensitivity analysis, Report No.SAND87-8248, 1996.
[51] I. Glassman, Combustion, Academic Press, London, 1996. p. 67.[52] R. Carroni, T. Griffin, J. Mantzaras, M. Reinke, Catal. Today 83 (2003) 157–170.[53] J. Mantzaras, P. Benz, Combust. Flame 119 (1999) 455–472.[54] F.M. Rupley, R.J. Kee, J.A. Miller, Premix: a Fortran program for modeling
steady laminar one-dimensional premixed flames, Report No. SAND85-8240,1995.
[55] C.K. Law, G.I. Sivashinsky, Combust. Sci. Technol. 29 (1982) 277–286.[56] F.A. Williams, Combustion Theory, Benjamin/Cummings, Menlo Park, CA,
1985. p. 164.[57] M. Reinke, J. Mantzaras, R. Bombach, S. Schenker, A. Inauen, Combust. Flame
141 (2005) 448–468.[58] S. Karagiannidis, J. Mantzaras, G. Jackson, K. Boulouchos, Proc. Combust. Inst.
31 (2007) 3309–3317.