Rotational Quenching Rate Coefficients for H2 in Collisions with H2 from 2 to 10,000 K
Upload
khangminh22Category
view
0download
0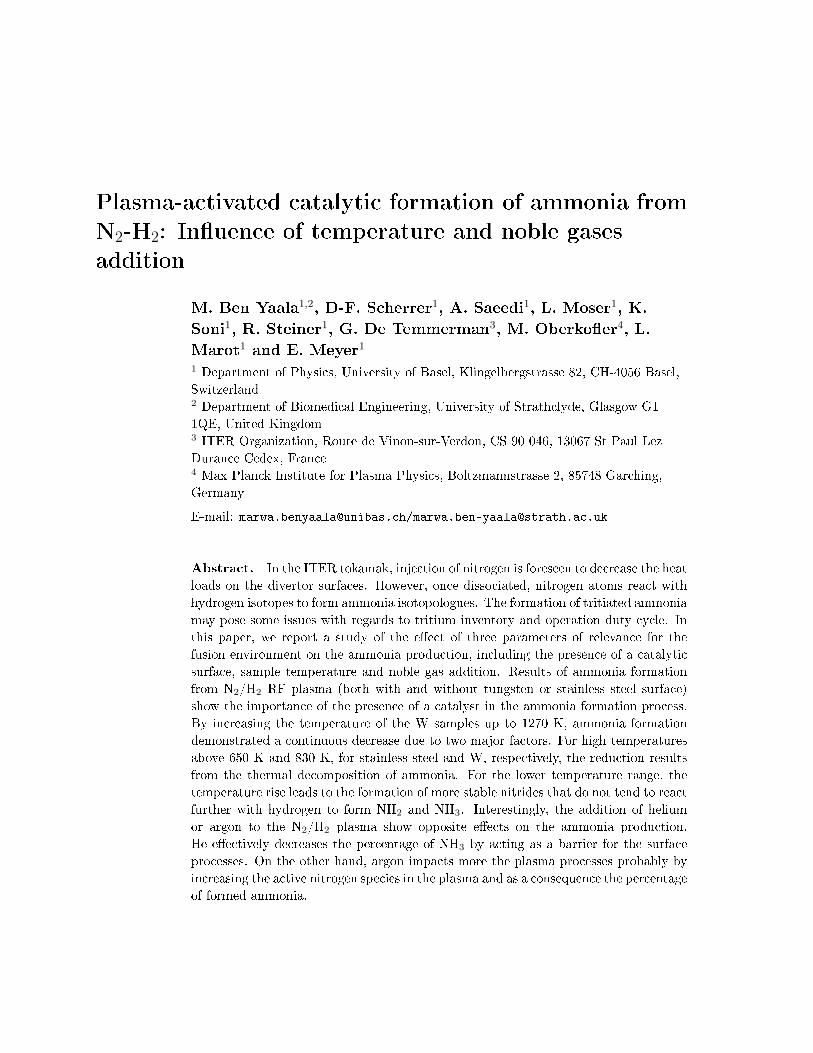
Plasma-activated catalytic formation of ammonia from
N2-H2: In�uence of temperature and noble gases
addition
M. Ben Yaala1,2, D-F. Scherrer1, A. Saeedi1, L. Moser1, K.
Soni1, R. Steiner1, G. De Temmerman3, M. Oberko�er4, L.
Marot1 and E. Meyer1
1 Department of Physics, University of Basel, Klingelbergstrasse 82, CH-4056 Basel,Switzerland2 Department of Biomedical Engineering, University of Strathclyde, Glasgow G11QE, United Kingdom3 ITER Organization, Route de Vinon-sur-Verdon, CS 90 046, 13067 St Paul LezDurance Cedex, France4 Max Planck Institute for Plasma Physics, Boltzmannstrasse 2, 85748 Garching,Germany
E-mail: [email protected]/[email protected]
Abstract. In the ITER tokamak, injection of nitrogen is foreseen to decrease the heatloads on the divertor surfaces. However, once dissociated, nitrogen atoms react withhydrogen isotopes to form ammonia isotopologues. The formation of tritiated ammoniamay pose some issues with regards to tritium inventory and operation duty cycle. Inthis paper, we report a study of the e�ect of three parameters of relevance for thefusion environment on the ammonia production, including the presence of a catalyticsurface, sample temperature and noble gas addition. Results of ammonia formationfrom N2/H2 RF plasma (both with and without tungsten or stainless steel surface)show the importance of the presence of a catalyst in the ammonia formation process.By increasing the temperature of the W samples up to 1270 K, ammonia formationdemonstrated a continuous decrease due to two major factors. For high temperaturesabove 650 K and 830 K, for stainless steel and W, respectively, the reduction resultsfrom the thermal decomposition of ammonia. For the lower temperature range, thetemperature rise leads to the formation of more stable nitrides that do not tend to reactfurther with hydrogen to form NH2 and NH3. Interestingly, the addition of heliumor argon to the N2/H2 plasma show opposite e�ects on the ammonia production.He e�ectively decreases the percentage of NH3 by acting as a barrier for the surfaceprocesses. On the other hand, argon impacts more the plasma processes probably byincreasing the active nitrogen species in the plasma and as a consequence the percentageof formed ammonia.

ii
1. Introduction
In fusion devices, extrinsic impurities are typically injected in the edge region of the
con�ned plasma to help dissipate the intense power exhausting the plasma before
it reaches nearby surfaces. In particular, for burning plasma conditions in ITER, a
high divertor radiation level will be mandatory to avoid thermal overload of divertor
components. Seeding gases that are currently under investigation for di�erent Tokamaks
are nitrogen (N2), neon (Ne) and argon (Ar). N2 is the preferred species for existing
devices because of its favorable radiative properties as well as its bene�cial e�ect
on the plasma performances [1, 2]. However, once dissociated, N atoms chemically
react with H and its isotopes (D/T) to form ammonia (NH3) isotopologues. The
assessment of ammonia formation in tokamaks is still very di�cult and subjected to
an internal debate. In ASDEX-Upgrade(Axially Symmetric Divertor Experiment),
the formation of ammonia during nitrogen-seeded discharges has been investigated by
analyzing the exhaust gases using mass spectrometers [1, 3�7]. It was found that up to
8 % of the injected N2 was converted into NH3. The interpretation of this results was
challenging due to the additional presence of water and methane and due to isotope
exchange reactions of deuterated ammonia with H in the pump ducts that lead to
the spectrometers. Indeed, the data were obtained following other experiments where
the wall loading was not controlled and identi�ed at the start of the series and the
spectrometer did not reach its optimal performance [3]. In JET (Joint European Torus),
15 % of the injected N2 was transformed into NH3 [8] and this value is also uncertain due
to the di�cult calibration of the diagnostics used to detect ammonia. The formation
of tritiated ammonia in future fusion devices such as ITER may pose some issues with
regards to tritium inventory and duty cycle. In this context, ammonia formation has
become an increasingly important subject of research for the nuclear fusion community
in the past few years [1, 2, 4, 6]. In particular, the fundamental understanding of the
impact of speci�c parameters from the fusion reactor environment on the ammonia
formation process would be the key to both predict the quantity of ammonia that might
be formed in ITER and to �nd possible ways to decrease it [9�11].
In the present article, we demonstrate the e�ect of three parameters on the ammonia
production from N2/H2 plasma including the presence of a catalytic surface, sample
temperature and He or Ar addition. Two fusion relevant materials playing the role of
catalysts for the ammonia production were investigated: tungsten (W) and stainless
steel (SS). While the W constitutes the divertor surface material in ITER, the SS is
used for the vacuum vessel, the divertor cassettes, the shield block and the Port Plug
front surface. The study was initially performed at room temperature (RT) for both
surfaces and then for increasing temperature up to 1270 K. This highest temperature
value is relevant for the ITER divertor and in particular for the divertor active areas
where the plasma impact occurs [12]. The e�ects of helium and argon on the ammonia
formation are also investigated in this paper. He will, in fact, be present in ITER as
the ash of the fusion reaction. Argon, on the other hand, was identi�ed as the best

iii
candidate for the simultaneous enhancement of core and divertor radiation [2] in the
case where an elevated main chamber radiation is desired as well. Although this gas is
not foreseen to be used in ITER to avoid high core level contamination, the use of argon
will be required in the future DEMO prototype reactor to insure a high main plasma
radiation level.
Our studies were performed in a newly built setup, with the speci�city of being a
quartz vacuum chamber (no metal) to avoid the retention of the formed ammonia on
the reactor wall [13]. In another conventional stainless steel vacuum chamber, surface
chemistry analysis were carried out in vacuo using X-ray photoelectron spectroscopy
(XPS).
2. Experimental procedure
Figure 1: Schematic and real picture (on top) of the RF plasma reactor and surrounding
equipment for gas inlet and outlet
The experiments were performed in an in-house built metal free reactor shown in
Figure 1. A detailed description of the system, as well as the calibration procedure, can
be found in [14]. Brie�y, this setup consists of a cylindrical quartz tube connected to
a waveguide surfatron plasma source. Processing gases are introduced to the reaction
chamber using mass �ow controllers and the plasma is created in the tube through a
matching network by a 13.56 MHz radio frequency generator at a typical power of 120 W.
Inside the tube a rolled catalyst foil is placed and can be heated with a furnace. The two
catalysts used in this study are W (purity 99.97 %) and SS (mass percent composition
shown in Table 1). The average roughness (Ra) of both catalysts was measured using

iv
a Tencor Alpha Step 500 Surface Pro�lometer. The SS and W Ra values are 69 nm
and 190 nm, respectively. On the other side of the quartz tube, a quadrupole mass
spectrometer (SRS Residual Gas Analyser RG A200) is connected through a 2 mm
diameter pinhole. The RGA is used for both qualitative and quantitative analyses of
gas species resulting from the plasma. In order to get a good background pressure
of around 8 × 10⁻⁹ mbar in the RGA chamber, the system is pumped from two sides
through a turbo and a primary pump. However during the plasma process, gases are
pumped only through the RGA chamber in order to detect all gas species. The resulting
typical pressure value is around of 5× 10⁻⁶ mbar which corresponds to 2× 10⁻² mbar
in the quartz reactor.
A wall conditioning step using pure Ar plasma is carried out before each experiment
to remove the contaminants adsorbed on the reactor wall. In particular, residual water
can be e�ciently removed and the measured water content was below 2 % of the total
gas mixture during the full process. The calibration of the RGA is then performed
by determining the cracking patterns (CP) and the calibration factors (CF) for species
present in the plasma (N2, H2, NH3, Ar, He and H2O). CFs represent the proportionality
factor of the measured detected current in the RGA and its known partial pressure. CPs,
on the other hand, represent the ratio between the major peak intensity and the other
fragments intensity created by electron impact ionization in the RGA.
Element Fe Cr Ni Mo Mn Si N P C S
% 69.52 16.9 10.1 2.08 1.74 0.46 0.048 0.032 0.019 0.001
Table 1: Chemical composition of the stainless steel foil
In this paper, three parameters in�uencing the ammonia production are studied
including the catalyst material, the surface temperature and the presence of helium and
argon. To investigate the catalytic surface e�ect, the experiment was conducted by
introducing N2 and H2 at di�erent ratios. The N2 initial concentration (XN2) de�ned
as the ratio between N2 initial partial pressure (PN2) and the total pressure (Ptot) was
varied from 1 to 80 % in the N2/H2 mixture and the total pressure was kept constant
(Ptot=2 × 10⁻² mbar). Prior to the plasma ignition, no ammonia was observed in the
RGA for the di�erent N2/H2 gas mixtures. The plasma was then ignited for 5 to 10
min when no catalyst was introduced in the tube and for 15 min in the presence of the
sample which represents the time needed to reach the reaction equilibrium state [14].
When Ar or He were used, a constant ratio of 1/9 of N2/H2 (XN2/XH2=1/9) was �xed
for a Ptot=2×10⁻² mbar. All experiments were repeated at least twice (later on the error
bars represent the standard deviation of the measurements) and a reference experiment
for an XN2 of 10 % is repeated after each experimental day to ensure that the status of
the catalyst surfaces does not change over time. The decomposition procedure of the
measured spectra was described in our previous paper [14].
Chemical analyses were performed in vacuo by XPS (procedure described in [14]
v
after plasma exposure in another conventional SS vacuum chamber to characterize the
surface state. Prior to the XPS measurements, a 20-nm tungsten �lm was deposited by
pulsed-DC magnetron sputtering [15] and then exposed to N2/H2 (1/9) plasma for 20
minutes at 1.2× 10⁻² mbar under the following conditions:
(i) plasma exposure on a non heated sample (RT) �rst and then on hot surfaces (406 K
and 513 K).
(ii) Ar and He were mixed with N2 and H2 at two fractions (20 and 50 %) both at RT.
For each of these XPS measurements, a new sample is loaded and a fresh W deposition
is performed.
3. Results
3.1. E�ect of the catalytic material (W, SS) on the ammonia formation
0 2 0 4 0 6 0 8 0
0
5
1 0
1 5
2 0
2 5 W i t h o u t c a t a l y s t
NH3 (%
)
X N 2 ( % )
O n W s u r f a c e O n S S s u r f a c e
Figure 2: Ammonia production without catalyst (red curve), on W (black curve) and
on SS (green) catalyst at RT for di�erent XN2
Figure 2 shows the ammonia percentage (de�ned as the ratio between its partial pressure
(PNH3) and Ptot during the plasma) against XN2 without and with catalyst (W and
SS). In the absence of catalyst, the ammonia production increases up to 6 % with
increasing XN2 up to 25% that corresponds to the stoichiometric composition of nitrogen
in ammonia. By introducing a catalytic surface, we noticed an increase of the NH3
production up to 20 and 24 % for SS and W, respectively and a shift of these values to
higher XN2 (Figure 2).
3.2. Temperature e�ect
3.2.1. Ammonia formation at high temperature
The e�ect of surface temperature (TSurf ) on the ammonia formation rate was studied
vi
in the range RT to 1273 K.
2 0 0 4 0 0 6 0 0 8 0 0 1 0 0 0 1 2 0 0 1 4 0 00
1
2
3
4
5
6
7
8
NH3 (%
)
T e m p e r a t u r e ( K )
W i t h o u t c a t a l y s t O n W O n S S
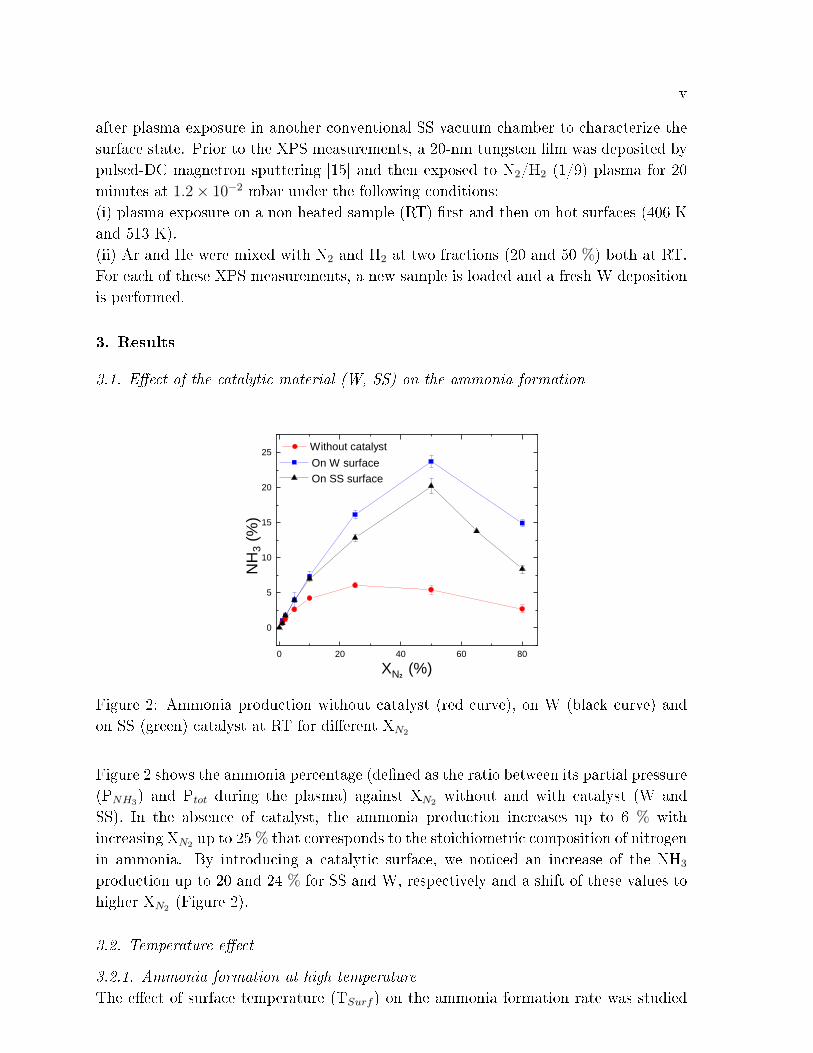
Figure 3: E�ect of TSurf on ammonia production from N2/H2 (1/9) plasma for di�erent
catalytic materials
In the absence of catalyst, the ammonia formation rate was almost constant up to
870K and then slightly decreased from 4.2 % to 2.7 % for higher temperatures. When
a catalyst is used, a strong e�ect of TSurf is observed. For both W and SS surfaces
the NH3 fraction decreases as soon as TSurf is increased. Yet a clear di�erence can
be observed between the two materials. On the SS surface, the NH3 percentage drops
drastically between 400 and 700 K and is very low for higher temperatures. For W, the
e�ect of TSurf is more gradual and the formation rate remains higher than for SS up to
1100 K, after which does not evolve anymore.
3.2.2. Thermal decomposition of the ammonia gas
The thermal decomposition of pure NH3 gas without plasma was then studied as a
function of temperature by �owing the ammonia gas at �xed pressure inside the quartz
tube for di�erent materials. The temperature was continuously increased up to 1273 K
and the resulting peaks from the decomposition were recorded by the RGA on the other
side of the tube.
vii
3 0 0 6 0 0 9 0 0 1 2 0 00 . 0
0 . 1
0 . 2
0 . 3
0 . 4
0 . 5
0 . 6
0 . 7
3 0 0 6 0 0 9 0 0 1 2 0 00 . 0
0 . 2
0 . 4
0 . 6
0 . 8
1 . 0
1 . 2
1 . 4
1 . 6
3 0 0 6 0 0 9 0 0 1 2 0 00 . 0
0 . 1
0 . 2
0 . 3
0 . 4
0 . 5
0 . 6
0 . 7
RGA p
eak in
tensity
(nAm
ps)
w i t h o u t c a t a l y s t
9 7 01 . 0 1 . 5 2 . 0 2 . 5
- 7- 6- 5- 4- 3- 2- 101
[ln (R
GA in
tensit
y)] (n
A)
1 0 0 0 / T ( K - 1 )
c )b ) N H 3 ( 1 7 a m u ) N 2 ( 2 8 a m u ) H 2 ( 2 a m u )
T e m p e r a t u r e ( K )
w i t h W c a t a l y s t
8 3 0
a )w i t h S S c a t a l y s t
6 5 0
9 0 0
1 0 5 0
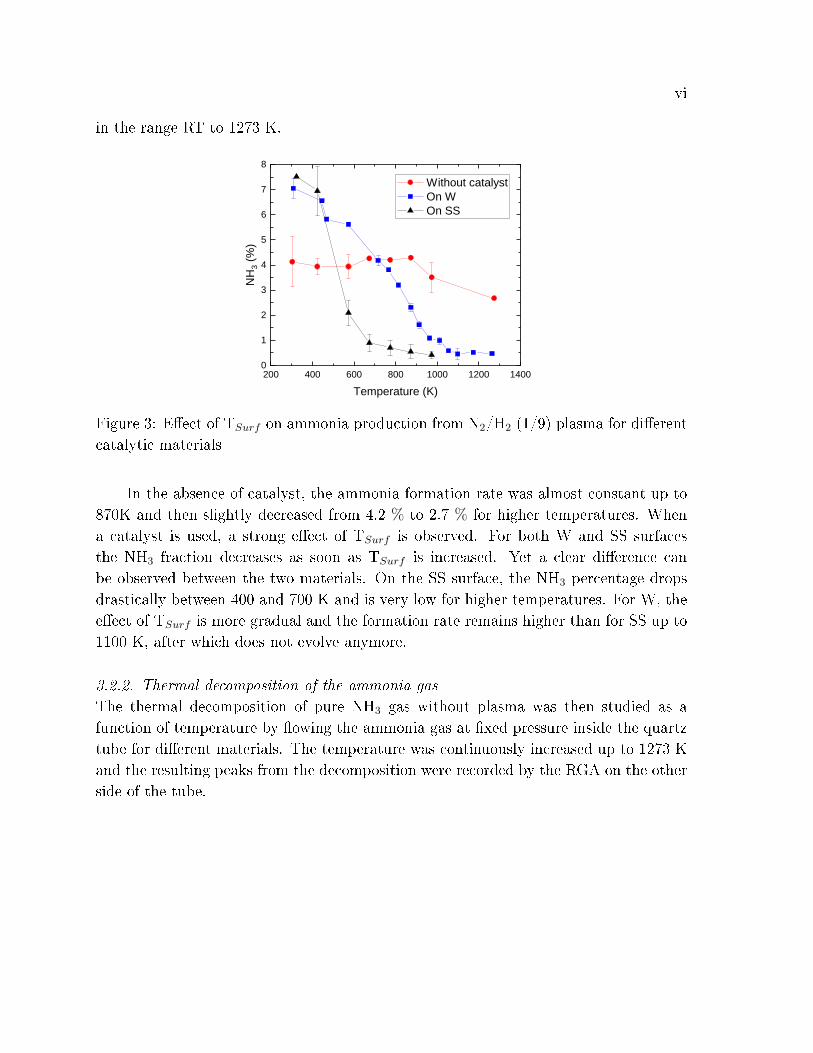
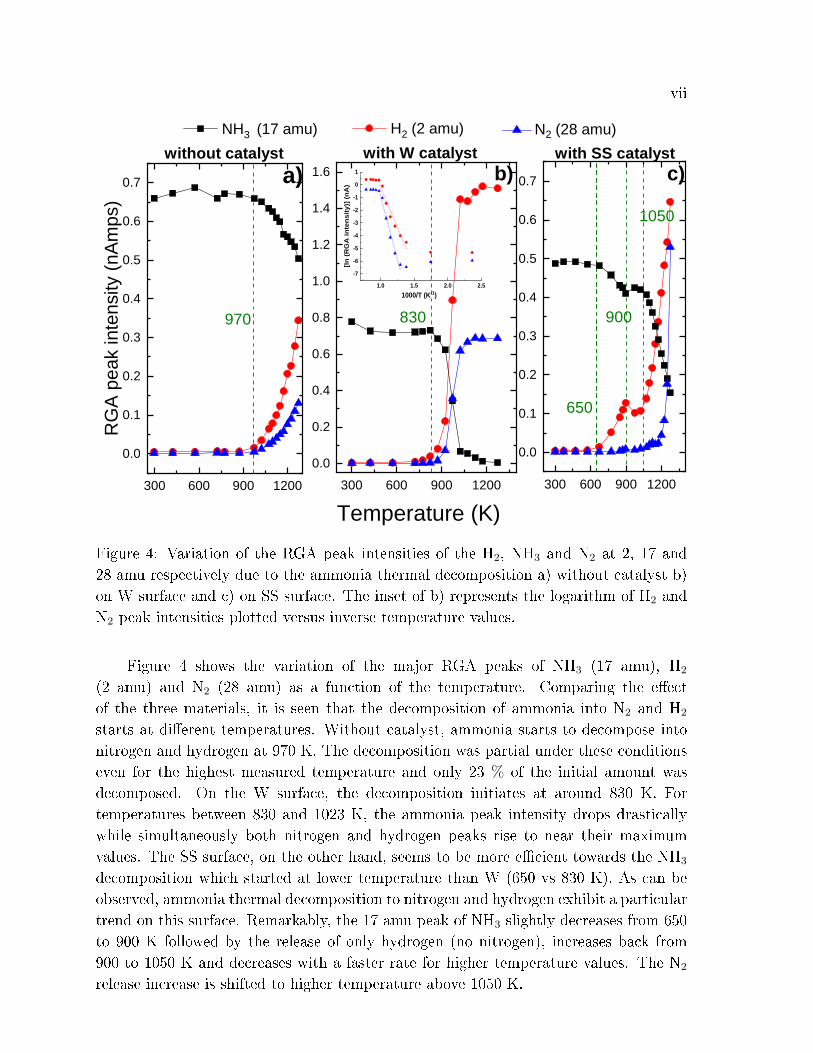
Figure 4: Variation of the RGA peak intensities of the H2, NH3 and N2 at 2, 17 and
28 amu respectively due to the ammonia thermal decomposition a) without catalyst b)
on W surface and c) on SS surface. The inset of b) represents the logarithm of H2 and
N2 peak intensities plotted versus inverse temperature values.
Figure 4 shows the variation of the major RGA peaks of NH3 (17 amu), H2
(2 amu) and N2 (28 amu) as a function of the temperature. Comparing the e�ect
of the three materials, it is seen that the decomposition of ammonia into N2 and H2
starts at di�erent temperatures. Without catalyst, ammonia starts to decompose into
nitrogen and hydrogen at 970 K. The decomposition was partial under these conditions
even for the highest measured temperature and only 23 % of the initial amount was
decomposed. On the W surface, the decomposition initiates at around 830 K. For
temperatures between 830 and 1023 K, the ammonia peak intensity drops drastically
while simultaneously both nitrogen and hydrogen peaks rise to near their maximum
values. The SS surface, on the other hand, seems to be more e�cient towards the NH3
decomposition which started at lower temperature than W (650 vs 830 K). As can be
observed, ammonia thermal decomposition to nitrogen and hydrogen exhibit a particular
trend on this surface. Remarkably, the 17 amu peak of NH3 slightly decreases from 650
to 900 K followed by the release of only hydrogen (no nitrogen), increases back from
900 to 1050 K and decreases with a faster rate for higher temperature values. The N2
release increase is shifted to higher temperature above 1050 K.

viii
3.2.3. Chemical species formed on the surface after plasma exposure: XPS studies
Four elements were identi�ed by XPS on the W plasma exposed samples: tungsten,
nitrogen as well as oxygen and carbon contaminants. Despite the use of our cold liquid
nitrogen (LN2) trap, the presence of oxygen (3 to 9 atomic percent concentration (at.%))
and carbon (around 2 at.%) could not be avoided. These species are typically adsorbed
during the time required for the transfer to the XPS chamber and/or during the cool
down of the sample (maximum 30 min).
Figure 5 represents the N1s core level spectra measured after N2/H2 plasma
exposures of the W surface at three di�erent temperatures. The total nitrogen atomic
concentration on the surface as well as its decomposition fraction into N/NH (at
397.6 eV), NH2 (at 398.5 eV) and NH3 (at 400.4 eV) are presented. The total relative
error on each concentration value was assumed to be 15% according to previous literature
report [16].
3 9 53 9 63 9 73 9 83 9 94 0 04 0 14 0 24 0 3
3 0 0 3 5 0 4 0 0 4 5 0 5 0 0 5 5 00
1 0
2 0
6 0
7 0
8 0
9 0
Atom
ic co
ncen
tratio
n (%)
T S u r f ( K )
N , N H N H 2 N H 3
3 4 % o f N i n t o t a l
2 6 % o f N i n t o t a l9 0 %9 %1 %
T S u r f = 5 1 3 K
T S u r f = 3 0 0 K
T S u r f = 4 0 6 K
6 1 %2 8 %1 1 %
N H 3 N H 2 N , N H
B i n d i n g e n e r g y ( e V )
2 %2 6 %
7 2 %
2 7 % o f N i n t o t a l
Figure 5: (Left) N1s core levels spectra recorded after N2/H2 plasma exposure of the W
surface at 300, 406 and 513 K. The red (dashdotted), green (shortly dotted) and blue
(dashed) curves are the individual chemical states. Solid black curves are the raw data
and the sum curves. (Right) Relative N, NH, NH2 and NH3 atomic concentration as a
function of TSurf
Comparing the evolution of the three peaks for increasing Tsurf , it can be observed
that both NH3 and NH2 peaks drop drastically from 11 to 1 at.% and 28 to 9 at.%,
respectively while the N/NH peak rises up to 90 at.% from the total nitrogen peak on
the surface. W4f core level spectra of the exposed W sample to N2/H2 plasma show

ix
also a nitride formation (WN and WN2). The spectrum was presented in Figure 6 of
our last paper [14].
3.3. In�uence of Ar and He addition
3.3.1. In�uence of Ar and He addition on ammonia formation
In order to investigate the e�ect of noble gases addition on the ammonia formation, He or
Ar gas was mixed with N2 and H2 at a �xed Ptot (2×10⁻² mbar) and �xed XN2/XH2 (1/9).
As Ptot of the three gases should be kept constant during the process, increasing the Ar
or He content would imply to decrease the nitrogen and hydrogen concentrations and
as a consequence the formed ammonia. One way to correct this e�ect can be achieved
by normalizing the NH3 formed amount to the initial N2+H2 content from Ptot. This
normalization is valid if the ammonia formation would only depend on XN2/XH2 and
not on their pressure. To validate this assumption, an experiment devoted to study the
in�uence of Ptot on ammonia formation was conducted by keeping the XN2/XH2 constant
and increasing their partial pressure. Figure 6a shows a nearly constant formation of
ammonia for a Ptot= PN2+PH2 varied between 1 × 10⁻² and 5 × 10⁻² mbar allowing
therefore to study the Ar and He e�ects using the above-mentioned approach.
1 . 0 x 1 0 - 2 2 . 0 x 1 0 - 2 3 . 0 x 1 0 - 2 4 . 0 x 1 0 - 2 5 . 0 x 1 0 - 24
5
6
7
8
9
0 1 0 2 0 3 0 4 0 5 0 6 04
5
6
7
8
9
0 1 0 2 0 3 0 4 0 5 0 6 04
5
6
7
8
9
NH3 (%
)
T o t a l P r e s s u r e ( m b a r )
M e a n = 7 . 3 2 1 2 9S t a n d a r d D e v i a t i o n = 0 . 1 9 9 1 1
W i t h o u t c a t a l y s t O n W s u r f a c e
c )b )
NH3 n
ormaliz
ed to
initia
l N2+H
2 ratio
(%)
H e ( % )
a )
A r ( % )Figure 6: Impact of the a) gas total pressure b) helium admixture and c) argon
admixture on the ammonia production
Ammonia production results without catalyst and on W surface are presented in
Figure 6b and Figure 6c for several He and Ar percentages up to 60 %. For instance,

x
the highest introduced argon or helium percentage (60 %) corresponds to PAr or PHe
= 1.2 × 10⁻² mbar and PN2+PH2 = 8 × 10⁻³ mbar while the lower noble gas inlet
concentration (10 %) corresponds to PN2+PH2 = 1.8× 10⁻² mbar.
Two opposite e�ects can be seen for the two noble gases. Up to 40 % of argon
addition, the ammonia production slightly increases both without and with W catalyst.
Meanwhile, it decreases by increasing the He percentage in the gas mixture and in
particular on the tungsten where a signi�cant drop can be seen.
- 1 0 0 - 8 0 - 6 0 - 4 0 - 2 0 0 2 0 4 0 6 0 8 0 1 0 0
4
6
8
1 0
1 2
H e 1 0 0 % A r 1 0 0 %
T e P u r e H 2
T e (eV
)
H 2 9 0 % - N 2 1 0 % 1 0 0 8 0 6 0 4 0 2 0
5
1 0
1 5 n e P u r e H 2
n e (io
n/1010
cm3 )
Figure 7: Electron temperature Te (blue) and density ne (red) variation with helium
and Ar percentage in the N2/H2 mixture. Plasma parameters (Te and ne) are also
represented for pure hydrogen plasma
.
The electron temperature (Te) and electron density (ne) are measured using a
Langmuir probe for pure H2, N2/H2 and several mixtures of He or Ar/N2/H2 plasmas.
The results are represented in Figure 7. While the addition of He highly increases Te
and slightly ne, the Ar increasing content impacts more the electron density than the
electron temperature.
3.3.2. In�uence of Ar and He addition on surface species
After the exposure at RT of several samples coated with W to N2/H2 + Ar or He plasma
in the metallic chamber, the samples were analyzed by XPS. Measurements revealed
the existence of three species on the samples: tungsten (63-69 % atomic concentration),

xi
nitrogen (28-33 at.%) and oxygen contaminants (less than 5 at.%). Figure 8 represents
the N1s core level spectra resulting from a pure N2/H2 as well as N2/H2/Ar or He
plasma exposure of the surface. XN2/XH2 was kept constant and 2 di�erent fractions
of the noble gases were added (20 and 50 %). In order the study the impact of lower
fraction of He and Ar on the ammonia production, further experiments are required.
3 9 63 9 84 0 04 0 2 3 9 63 9 84 0 04 0 2
N H 3 N H 2 N , N H5 0 % o f H e a d d e d
7 2 %
6 8 %
6 4 %
2 4 %
2 2 %
2 6 %
6 %
8 %
1 0 %
N 2 / H 2 o n l y
2 0 % o f H e a d d e d
B i n d i n g e n e r g y ( e V )
N 2 / H 2 o n l y
2 0 % o f A r a d d e d
5 0 % o f A r a d d e d
1 0 %2 6 % 6 4 %
6 9 %2 6 %5 %
7 %2 4 % 6 9 %
Figure 8: N1s core levels spectra recorded after pure N2/H2 as well as N2/H2/Ar or He
plasma exposure of the W surface at RT. The red (dashdotted), green (shortly dotted)
and blue (dashed) curves are the individual chemical states. Solid black curves are the
raw data and the sum curves.
N1s core level peaks were decomposed into three singulets attributed to N and NH
(at 397.6 eV), NH2 (at 398.5 eV) and NH3 (at 400.4 eV) [13]. The existence of surface
nitrides on a W exposed sample to nitrogen-hydrogen plasma was also con�rmed by the
W4f core level peaks presented in our previous paper (see WN and WN2 peaks in Figure
6 of paper [14]).
The percentages shown on the Figure 8 represent the ratio of N/NH, NH2 and NH3
from the total nitrogen atomic concentration on the surface. As can be seen, before the
addition of the noble gas ammonia presents 10 at.% from the total nitrogen peak. This
percentage decreases continuously by 40-50 % when Ar and He are added in equal ratio
than nitrogen and hydrogen (50 % of the gas mixture Ptot). On the other hand, the
N and NH ratio increased with the addition of He while NH2 concentration decreases.
However, the NH2 peak is not a�ected much by Ar addition, and N/NH is not a�ected by
further addition of Ar. It should be noted here that the nitrogen atomic concentration on
the surface is almost una�ected by the addition of He (28 to 31 at.%) and Ar admixture
(28 to 33 at.%).

xii
4. Discussion
4.1. Plasma assisted ammonia catalysis at RT
Ammonia formation was observed both in the absence and presence of a catalyst in the
chamber (Figure 2). It is still not clear if the production occurs in the plasma volume
or on the quartz wall of the vacuum chamber. Based on previous studies [17�20], Hong
et al. [21], summarized that ammonia can be produced at atmospheric pressure by
three-body reactions between NHx radicals (produced themselves by reactions between
dissociated atoms and excited molecules) in the plasma phase. In a glow discharge
microwave plasma, Uyama et al. [22,23], stated the role of the volume reaction between
NH radicals formed in the plasma volume and H2 molecules on the ammonia formation.
Recently, chemical kinetics modeling studies [17,24] revealed that the gas phase volume
reactions alone are not able to produce ammonia in detectable amounts. Taking
these results into account and our measurements, we can attribute the production of
ammonia without catalyst to either production in the plasma volume or recombination
of dissociated species in the plasma on the quartz tube.
When W and SS catalytic surfaces were loaded, the ammonia production strongly
increased (Figure 2). This was also reported in the PhD thesis of Patil [25] who
studied the e�ect of Al2O3 supported metals and metal oxide catalysts on the ammonia
formation in a DBD reactor. He showed that, with the presence of a catalytic surface,
the ammonia production is around 3 times higher compared to the blank experiment
where no surface is loaded in the quartz tube. In a more recent study, Shah et al [24]
investigated the ammonia formation in an RF quartz plasma reactor and showed that
the insertion of metal meshes catalysts in the quartz reactor highly increased the yield,
in particular, on Au surface when 300 W of RF power was applied (5 times higher
ammonia yield than without catalyst).
In our previous study [14], we showed that this increase was caused by the improvement
of both the nitrogen cracking and the species interaction on the surface. By comparing
the performance of both catalysts towards NH3 synthesis, we can see that the tungsten
surface acts as a better catalytic surface than SS for XN2 above 10 %. Even though the
SS surface contains predominantly iron (around 70 % of the total composition), known
as the best catalyst for ammonia synthesis under thermal condition (see volcano plot
in [26]), its lower production than W can be explained by the existence of other metals
such as chromium (16 %) which have lower activity than Fe [27] or the presence of a
native oxide layer. In fact, for SS, the surface is covered with a chromium oxide �lm that
passivates the surface of the steel. This Cr2O3 oxide is typically a few nm thick [28]
and it is not clear, in our case, if the argon plasma cleaning is removing the oxide
as the sample is �oating and if the hydrogen/nitrogen plasma is reducing the oxide
layer to have an iron catalyst. Another factor that could also explain this di�erence
between W and SS catalysts is the plasma e�ect on the catalytic activities of surfaces.
In fact, Mehta et al. [29] showed, experimentally and through a microkinetic model,
that the nitrogen excitation in the plasma changes the catalytic activity trends from

xiii
those known in thermal catalysis. In thermal catalysis, the best catalyst for ammonia
presents an intermediate nitrogen binding energy i.e not not high to avoid having a
strong nitrogen bond on the catalyst and consequent low reactivity and not too low to
be able to dissociate the nitrogen. The presence of the plasma in catalysis produces
excited nitrogen molecules with higher internal energy and lower dissociation barrier.
Ammonia production is therefore maximized on catalysts that bind nitrogen weaker
than those most active for thermal catalysis because they have smaller barriers for the
hydrogenation of NHx (x = 0,1,2) intermediates.
As can be seen in Figure 2, the maximum in NH3 production is reached for di�erent
XN2 depending on the presence of absence of a catalyst. Without catalyst, the maximum
production corresponds to the stoichiometric mixture of nitrogen-hydrogen (25/75 % of
N2/H2). This was also observed by Uyama and Matsumoto [30] who performed an
N2/H2 microwave discharge in a Pyrex tube and also by Amorim et al. [31] through
their DC glow discharge. When the catalyst was introduced, the maximum production
shifts from the stoichiometry to a higher nitrogen content. Although the exact reason
is still not clear, this shift was reported in several papers [29,32�35].
4.2. Plasma assisted ammonia catalysis at high temperature
Unlike on SS and W surfaces, the ammonia formed without a catalyst is almost constant
for an increasing the temperature up to 900 K(Figure 3). The decrease starts at high
temperature that corresponds to the decomposition temperature shown in Figure 4.
This would suggest that, the quartz tube is not playing a catalytic role (as discussed
in 4.1) and that most likely the ammonia formed without the catalyst is predominantly
in the plasma. The decrease of the production of NH3 on W and SS with increasing
temperature, shown in Figure 3, can be attributed to several causes: (i) increased
desorption of N2 as the temperature is increased (ii) formation of more stable nitrides
that react less with hydrogen to form ammonia (iii) ammonia thermal decomposition
(iv) nitrogen continuous di�usion in the catalyst bulk leading to its decrease in the gas
phase.
Note here that the focus is on the nitrogen (and not hydrogen) interaction with the
surface as we have shown in previous work that the ammonia is formed, under these
conditions, as a reaction between adsorbed nitrogen on the surface and hydrogen in the
gas phase.
The �rst hypothesis (i) can be disproved by the XPS results in Figure 5. Indeed,
the total nitrogen content on the surface is almost constant (in the range of 26-34 at.%)
meaning that the decrease in the ammonia peak cannot be caused by a decrease in
the nitrogen content on the surface with temperature. Previous studies have reported
that the nitrogen release from W occurs only at high temperature in the range of 850 to
970 K [5,36]. However, the decrease in the NH3 and NH2 peak and increase in the N/NH
peak suggest that a surface temperature increase leads to the formation of more stable
nitrides that react less with the hydrogen to form ammonia, con�rming hypothesis (ii).

xiv
At high temperatures (650 K for SS and 830 K for W), the decrease in the pro-
duction can be well attributed to the thermal catalytic decomposition (iii) of the
formed ammonia as shown in Figure 4. Thermal catalytic decomposition of ammo-
nia is known as the reverse reaction of the Haber-Bosch synthesis of ammonia, one of
the most extensively researched processes over the past 150 years [37]. Upon heat-
ing, ammonia decomposes to nitrogen and hydrogen through the following reaction:
2NH3 N2 + 3H2
This reaction takes place in the gas phase, but it is strongly enhanced by the presence
of a catalytic surface. Particularly over metals, the decomposition of ammonia occurs
in a stepwise sequence of dehydrogenation reactions. These reactions are initiated by
the adsorption of ammonia onto the active sites of the surface. The adsorbed molecules
undergo then successive N�H bond cleavage, releasing hydrogen atoms that can combine
to form molecular hydrogen. In the �nal step, nitrogen atoms recombine and desorb
as molecular nitrogen [38, 39]. As shown in Figure 4b the ammonia decomposes with a
fast rate to nitrogen and hydrogen on the W surface at 830 K. These observations are
slightly di�erent from the results of Markelj et al. [10] who studied the ammonia decom-
position by �owing the gas through a hot tungsten capillary. For them, the dominant
decomposition on W starts at lower temperature at about 680 K, attains the fastest in-
crease at about 910 K and terminates around 1110 K. This discrepancy from our results
could be attributed to the gas pressure di�erence. Previous studies [40, 41] performed
at high temperature and on tungsten surface showed that the ammonia decomposition
rate increases with its partial pressure. While Markelj et al. introduced the NH3 gas
at 2.7 × 10⁻¹ mbar inside the capillary, a much lower pressure of 5 × 10⁻³ mbar was
used in our setup which could explain the temperature shift where ammonia starts to
decompose. On the other hand, the complete decomposition of ammonia at high tem-
perature as well as the activation energy (Ea) of the reaction (1.05 ±0.04 eV) are in
a good agreement with their �ndings (1.07 ±0.08 eV). The Ea was calculated by plot-
ting the RGA peaks intensities in a logarithmic scale versus inverse temperature values,
known as the Arrhenius plot (presented in the inset Figure 4). The curve was then
�tted linearly and the activation energy was extracted from the slope according to the
formula R=A × exp(-Ea/kB × T) where R is the rate of the decomposition reaction,
A is the pre-exponential factor, kB is the Boltzmann constant and T is the measured
temperature (more details about this method can be found in [10]).
Concerning the SS surface (Figure 4c), the ammonia decomposition presents a
particular trend. The decomposition starts at lower temperature than on W surface
and the release of the nitrogen is shifted to higher temperature values. This shift can
be caused by the di�usion of the nitrogen and formation of stable nitrides with iron for
temperature below 650 K (when ammonia start to decompose to nitrogen and hydrogen).
This process is well known in the industry as the nitridation process where iron forms
stable nitrides after exposure to ammonia at high temperature around 870 K [39, 42].
However, it has also been reported to start from temperatures as low as 570 K [26,43].

xv
This deactivation process is reversible at high reaction temperatures where desorption of
the nitrogen takes place [39]. Note here that, the reason for ammonia peak rise between
900 K and 1050 K on the SS surface is still unknown.
The order of the activity of both catalysts (SS and W) is, therefore, reversed
from ammonia synthesis to ammonia decomposition. Interestingly, even though the
decomposition of ammonia is the reverse reaction of the synthesis, catalysts were shown
in another study by Boisen et al. not to necessarily exhibit the same activity in both
directions due to the di�erence in conditions and rate limiting steps [44].
It is also worth mentioning for the three thermal decomposition experiments without
catalyst, on W and on SS, that ratios between ammonia peaks at 17, 16, 15 and 14
amu were constant and equal to the ammonia cracking pattern indicating therefore no
release of the intermediate production of ammonia decomposition (NH2 or NH) from
the surface.
To sum up on the impact of temperature on ammonia production, we can conclude
that the decrease is due to two major e�ects. For high temperatures (TSurf> 650 K and
830 K for SS and W, respectively) the decrease in the production rate results from the
thermal decomposition of ammonia. For lower temperature the temperature increase
favor the formation of more stable nitrides that does not tend to react further with
hydrogen to form NH2 and NH3. The possibility of bulk di�usion of the nitrogen cannot
be rejected also and further thermal desorption experiments are required to quantify
the trapped nitrogen.
4.3. He and Ar e�ect
To our knowledge, only two groups [9, 11] were interested in the study of Ar and He
e�ect on ammonia formation and there is still considerable disagreement between their
results. Experiments performed in the linear plasma device (GyM), using a microwave
sustained N2/D2 plasma, show a reduction of 80 % in the ammonia production when
17 % of He was added while the addition of 3.1 % of Ar to the hydrogen nitrogen
mixture was almost not e�ective. This e�ect was attributed to a modi�cation of the
physical-chemical process on the surface where helium acts as a barrier for the ammonia
formation by occupying the catalyst active sites. On the other hand, the other group [11]
reported an increase by 45 % of the produced NH3 for only 8 % of added He. According
to them, the increased ammonia formation with the He addition does not result from
a higher adsorption of active species on the surface but rather due to an enhancement
of the N-H recombination induced by the helium bombardment. In both studies, the
authors con�rm the need for further experiments to investigate the surface state and
species in order to support their explanation. In this context, surface analysis of the
exposed surface to a N2/H2/Ar or He plasma were performed in this manuscript.
When He and Ar are added to N2/H2, XPS measurements of the W surface (Figure
8) show a drop in the ammonia peak and a rise in the N/NH peak while the total
surface nitrogen atomic concentration was constant. These observations indicate that

xvi
the presence of the two noble gases does not inhibit the adsorption of nitrogen on the
W catalyst (a key step for the ammonia formation) but is rather unfavorable for the
hydrogen and nitrogen surface recombination to form NH3 from the surface nitrides. It
should be mentioned here that conclusions from XPS are restricted to species on the
surface and do not consider what was formed and desorbed as compounds.
The slight increase in the ammonia production with argon addition can be explained
by the generation of more active nitrogen species. Hong et al. [45] investigated this
e�ect by adding 10 sccm of Ar to 30 sccm of N2 and 30 sccm of H2 feed gas stream in a
dielectric-barrier discharge reactor. They observed an increase in the discharge power,
uniformity and gas temperature, and those factors lead to higher ammonia production
rates. The optical emission spectra also indicated an increase in N+ possibly resulting
from a reaction between Ar+ and N2. This increase in nitrogen dissociated atoms
contributed therefore to the increase in NH3 production. Nakajima et al. [46] further
explained further this reaction between nitrogen and ionized argon as a charge transfer
reaction followed by dissociative recombination of nitrogen with an electron from the
plasma:
N2 + Ar+ N+2 + Ar
N+2 + e− N + N
The charge transfer reaction between nitrogen and argon is favoured by the fact that
both species have almost the same ionization energy shown in table 2. However, when
He is added to the mixture this reaction is not expected to occur due to the high ion-
ization energy of helium.
Species H2 N2 He Ar
First ionization energy (eV) 15.42 15.58 24.56 15.76
Table 2: �rst ionization energies of nitrogen, hydrogen, helium and argon
A further explanation of the argon and helium e�ects can be related to the change
of the electron temperature of electron density, key parameters in the generation of
active species for the formation of ammonia. As shown in Figure 7, both gases show
opposite e�ects on both Te and ne. These e�ects were already reported by Mansour
et al. [47] and by Pu et al. [48] for adding He and Ar in pure N2 plasma. Pu et al.
explained these results in the following way. The electron energy distribution function
in a plasma shows a tail region populated by high energy (�hot�) electrons with energies
above 30 eV. In the helium�nitrogen mixture, the tail is generated by He metastable
states and superelastic collisions and is enlarged by adding more helium in the discharge.
As a result, Te increases. However, when argon is added in the discharge, there is a sharp
increase in electron density and hence a higher electron-electron collision frequency,
which always tend to deplete electrons in the �hot tail� and decrease Te. In the case
of Ar in an H2 plasma, Sode et al. [49] show that Te decreases monotonically and they

xvii
attributed the observed decrease to the increasing e�ective ion mass with increasing Ar
fraction. As described by El-Sayed et al. [50], Ar can induce the dissociation of molecular
nitrogen and increase the production of nitrogen atoms, however it has an insigni�cant
e�ect on the nitrogen ionization mechanism. On the other hand, He addition enhances
the production of, N+ and N− atoms through ionization, ionization dissociation and
dissociative reaction, however it has a decreasing e�ect on the dissociative recombination
mechanism.
In summary, on the catalyst surface, both He and Ar were to shown unfavorable
impact on the hydrogen and nitrogen surface recombination to form NH3. This e�ect,
along with a high increase in the the electron temperature, is predominant when helium
is added resulting in a total decrease of ammonia produced from the interaction of the
plasma with the catalyst measured by RGA. Argon addition, on the other hand, was
shown to increase the active nitrogen species in the plasma and, as a consequence, the
percentage of ammonia formed. In this case, the competition between the ammonia
increase in the plasma and the decrease on the surface results in a total increase of the
production when a W catalyst is used.
5. Conclusion
In this study, we explored the formation of ammonia from an N2/H2 RF plasma
both without and with tungsten and stainless steel catalysts for di�erent XN2 . We
demonstrated that the presence of the catalytic surface highly increases the ammonia
formation rate.
An increase of the surface temperature results in a decrease in the ammonia
formation rate due to two factors. For high temperatures above 650 K and 830 K for SS
and W, respectively, the production decrease is caused by the thermal decomposition
of ammonia. At lower temperature, the temperature increase leads to the formation of
stable nitrides that do not tend to react further with hydrogen to form NH2 and NH3.
These results imply that in the tokamak, the high temperature active area of the W
divertor (where plasma impact occurs) and its surrounding will not contribute much in
the ammonia production. As the NH3 formation is favored by low temperature, a high
contribution from the plasma shaded areas is expected.
Finally, we have shown that the addition of helium and argon to the nitrogen-
hydrogen plasma have opposite e�ects on the ammonia production. While He e�ectively
decreases the percentage of NH3 by acting as a barrier for the surface processes, argon
impacts more the plasma processes by increasing the active nitrogen species in the
plasma and, as a consequence, the percentage of ammonia formed. This suggests that
the presence of He as an intrinsic impurity in the fusion plasma might help to decrease
the ammonia production and could further be used in a mixture with the nitrogen
seeding gas. In contrary, it is not a good option to mix nitrogen and argon together to
decrease the ammonia formation.

xviii
6. Acknowledgements
This work has been carried out within the framework of the EUROfusion Consortium
and has received funding from the Euratom research and training program 2014-2018
and 2019-2020 under grant agreement No 633053. The views and opinions expressed
herein do not necessarily re�ect those of the European Commission or of the ITER
Organization. ITER is the Nuclear Facility INB no. 174. This paper applies new
physics analysis related to tritiated ammonia formation which is not yet incorporated
into the ITER technical baseline. The nuclear operator is not constrained by the results
presented here. The authors would like to thank the Swiss Federal O�ce of Energy,
the Swiss Nanoscience Institute, the Swiss National Science Foundation and the Federal
O�ce for Education and Science for their �nancial support.
7. References
[1] D. Neuwirth, V. Rohde, T. Schwarz-Selinger, and A. U. Team, �Formation of ammonia duringnitrogen-seeded discharges at asdex upgrade,� Plasma Physics and Controlled Fusion, vol. 54,no. 8, p. 085008, 2012.
[2] A. Kallenbach, M. Bernert, R. Dux, L. Casali, T. Eich, L. Giannone, A. Herrmann, R. McDermott,A. Mlynek, H. Müller et al., �Impurity seeding for tokamak power exhaust: from present devicesvia iter to demo,� Plasma Physics and Controlled Fusion, vol. 55, no. 12, p. 124041, 2013.
[3] V. Rohde, M. Oberko�er et al., �Ammonia production in nitrogen seeded plasma discharges inasdex upgrade,� Journal of Nuclear Materials, vol. 463, pp. 672�675, 2015.
[4] M. Oberko�er, G. Meisl, A. Hakola, A. Drenik, D. Alegre, S. Brezinsek, R. Craven, T. Dittmar,T. Keenan, S. Romanelli et al., �Nitrogen retention mechanisms in tokamaks with beryllium andtungsten plasma-facing surfaces,� Physica Scripta, vol. 2016, no. T167, p. 014077, 2016.
[5] M. Oberko�er, D. Alegre, F. Aumayr, S. Brezinsek, T. Dittmar, K. Dobes, D. Douai, A. Drenik,M. Köppen, U. Kruezi et al., �Plasma�wall interactions with nitrogen seeding in all-metal fusiondevices: Formation of nitrides and ammonia,� Fusion engineering and design, vol. 98, pp. 1371�1374, 2015.
[6] A. Drenik, D. Alegre, S. Brezinsek, A. de Castro, U. Kruezi, G. Meisl, M. Mozetic, M. Oberko�er,M. Panjan, G. Primc et al., �Detection of ammonia by residual gas analysis in aug and jet,�Fusion Engineering and Design, vol. 124, pp. 239�243, 2017.
[7] A. Drenik, L. Laguardia, R. M. McDermott, G. Meisl, R. Neu, M. Oberko�er, E. Pawelec,R. A. Pitts, S. Potzel, T. Pütterich et al., �Evolution of nitrogen concentration and ammoniaproduction in n-2-seeded h-mode discharges at asdex upgrade,� Nuclear Fusion, vol. 59, no. 4,2019.
[8] M. Oberko�er, D. Douai, S. Brezinsek, J. Coenen, T. Dittmar, A. Drenik, S. Romanelli, E. Jo�rin,K. McCormick, M. Brix et al., �First nitrogen-seeding experiments in jet with the iter-like wall,�Journal of Nuclear Materials, vol. 438, pp. S258�S261, 2013.
[9] L. Laguardia, R. Caniello, A. Cremona, G. Gatto, G. Gervasini, F. Ghezzi, G. Granucci, V. Mellera,D. Minelli, R. Negrotti et al., �In�uence of he and ar injection on ammonia production in n2/d2plasma in the medium �ux gym device,� Nuclear Materials and Energy, vol. 12, pp. 261�266,2017.
[10] S. Markelj, A. Zaloºnik, and I. �adeº, �Interaction of ammonia and hydrogen with tungsten atelevated temperature studied by gas �ow through a capillary,� Journal of Vacuum Science &
Technology A: Vacuum, Surfaces, and Films, vol. 35, no. 6, p. 061602, 2017.[11] A. de Castro, D. Alegre, and F. Tabarés, �In�uence of residence time and helium addition in the

xix
ammonia formation on tungsten walls in n2h2 glow discharge plasmas,� Nuclear Materials and
Energy, vol. 12, pp. 399�404, 2017.[12] R. Pitts, S. Carpentier, F. Escourbiac, T. Hirai, V. Komarov, S. Lisgo, A. Kukushkin, A. Loarte,
M. Merola, A. S. Naik et al., �A full tungsten divertor for iter: Physics issues and design status,�Journal of Nuclear Materials, vol. 438, pp. S48�S56, 2013.
[13] M. B. Yaala, L. Marot, R. Steiner, L. Moser, G. De Temmerman, C. Porosnicu, C. Lungu,M. Oberko�er, and E. Meyer, �Quartz micro-balance and in situ xps study of the adsorptionand decomposition of ammonia on gold, tungsten, boron, beryllium and stainless steel surfaces,�Nuclear Fusion, vol. 58, no. 10, p. 106012, 2018.
[14] M. Ben Yaala, A. Saeedi, D.-F. Scherrer, L. Moser, R. Steiner, M. Zutter, M. Oberko�er,G. De Temmerman, L. Marot, and E. Meyer, �Plasma-assisted catalytic formation of ammoniain n 2�h 2 plasma on a tungsten surface,� Physical Chemistry Chemical Physics, vol. 21, no. 30,pp. 16 623�16 633, 2019.
[15] S. Iyyakkunnel, L. Marot, B. Eren, R. Steiner, L. Moser, D. Mathys, M. Duggelin, P. Chapon,and E. Meyer, �Morphological changes of tungsten surfaces by low-�ux helium plasma treatmentand helium incorporation via magnetron sputtering,� ACS applied materials & interfaces, vol. 6,no. 14, pp. 11 609�11 616, 2014.
[16] S. Tougaard, �Accuracy of the non-destructive surface nanostructure quanti�cation technique basedon analysis of the xps or aes peak shape,� Surface and Interface Analysis: An International
Journal devoted to the development and application of techniques for the analysis of surfaces,
interfaces and thin �lms, vol. 26, no. 4, pp. 249�269, 1998.[17] E. Carrasco, M. Jiménez-Redondo, I. Tanarro, and V. J. Herrero, �Neutral and ion chemistry in
low pressure dc plasmas of h 2/n 2 mixtures: routes for the e�cient production of nh3 and nh4+,� Physical Chemistry Chemical Physics, vol. 13, no. 43, pp. 19 561�19 572, 2011.
[18] J. Hong, S. Pancheshnyi, E. Tam, J. J. Lowke, S. Prawer, and A. B. Murphy, �Kinetic modellingof nh3 production in n2�h2 non-equilibrium atmospheric-pressure plasma catalysis,� Journal ofPhysics D: Applied Physics, vol. 50, no. 15, p. 154005, 2017.
[19] H. Uyama and O. Matsumoto, �Reaction scheme of ammonia formation in microwave-dischargefrom quenching reactions of nh radicals by hydrogen,� Denki Kagaku, vol. 61, no. 7, pp. 925�926,1993.
[20] M. L. Steen, K. R. Kull, and E. R. Fisher, �Comparison of surface interactions for nh and nh 2on polymer and metal substrates during nh 3 plasma processing,� Journal of applied physics,vol. 92, no. 1, pp. 55�63, 2002.
[21] J. Hong, S. Prawer, and A. B. Murphy, �Plasma catalysis as an alternative route for ammoniaproduction: Status, mechanisms, and prospects for progress,� ACS Sustainable Chemistry &
Engineering, vol. 6, no. 1, pp. 15�31, 2017.[22] H. Uyama and O. Matsumoto, �Synthesis of ammonia in high-frequency discharges. ii. synthesis
of ammonia in a microwave discharge under various conditions,� Plasma Chemistry and Plasma
Processing, vol. 9, no. 3, pp. 421�432, 1989.[23] O. Uyama, Haruo; Matsumoto, �Synthesis of ammonia in high-frequency discharges.� in Proceedings
of the Tenth International Symposium on Plasma Chemistry (ISPC-10), Bochum, Germany, no.sect. 2.3�10, Aug. 1991, p. 1.
[24] J. Shah, W. Wang, A. Bogaerts, and M. L. Carreon, �Ammonia synthesis by radio frequencyplasma catalysis: revealing the underlying mechanisms,� ACS Applied Energy Materials, vol. 1,no. 9, pp. 4824�4839, 2018.
[25] B. Patil, �Plasma (catalyst)-assisted nitrogen �xation: reactor development for nitric oxide andammonia production,� Ph.D. dissertation, 2017.
[26] F. Schüth, R. Palkovits, R. Schlögl, and D. S. Su, �Ammonia as a possible element in an energyinfrastructure: catalysts for ammonia decomposition,� Energy & Environmental Science, vol. 5,no. 4, pp. 6278�6289, 2012.
[27] J. C. Ganley, F. Thomas, E. Seebauer, and R. I. Masel, �A priori catalytic activity correlations:

xx
the di�cult case of hydrogen production from ammonia,� Catalysis Letters, vol. 96, no. 3-4, pp.117�122, 2004.
[28] S. Tardio, M.-L. Abel, R. H. Carr, J. E. Castle, and J. F. Watts, �Comparative study of the nativeoxide on 316l stainless steel by xps and tof-sims,� Journal of Vacuum Science & Technology A:
Vacuum, Surfaces, and Films, vol. 33, no. 5, p. 05E122, 2015.[29] P. Mehta, P. Barboun, F. A. Herrera, J. Kim, P. Rumbach, D. B. Go, J. C. Hicks, and W. F.
Schneider, �Overcoming ammonia synthesis scaling relations with plasma-enabled catalysis,�Nature Catalysis, vol. 1, no. 4, p. 269, 2018.
[30] H. Uyama and O. Matsumoto, �Synthesis of ammonia in high-frequency discharges,� Plasma
chemistry and plasma processing, vol. 9, no. 1, pp. 13�24, 1989.[31] J. Amorim, G. Baravian, and G. Sultan, �Absolute density measurements of ammonia synthetized
in n2�h2 mixture discharges,� Applied physics letters, vol. 68, no. 14, pp. 1915�1917, 1996.[32] T. Mizushima, K. Matsumoto, H. Ohkita, and N. Kakuta, �Catalytic e�ects of metal-loaded
membrane-like alumina tubes on ammonia synthesis in atmospheric pressure plasma by dielectricbarrier discharge,� Plasma Chemistry and Plasma Processing, vol. 27, no. 1, pp. 1�11, 2007.
[33] T. Body, S. Cousens, J. Kirby, and C. Corr, �A volume-averaged model of nitrogen�hydrogenplasma chemistry to investigate ammonia production in a plasma-surface-interaction device,�Plasma Physics and Controlled Fusion, vol. 60, no. 7, p. 075011, 2018.
[34] A. Gómez-Ramírez, J. Cotrino, R. Lambert, and A. González-Elipe, �E�cient synthesis of ammoniafrom n2 and h2 alone in a ferroelectric packed-bed dbd reactor,� Plasma Sources Science and
Technology, vol. 24, no. 6, p. 065011, 2015.[35] H.-H. Kim, Y. Teramoto, A. Ogata, H. Takagi, and T. Nanba, �Atmospheric-pressure nonthermal
plasma synthesis of ammonia over ruthenium catalysts,� Plasma Processes and Polymers, vol. 14,no. 6, p. 1600157, 2017.
[36] X. Zhang, Y. Wu, B. Mu, L. Qiao, W. Li, J. Li, and P. Wang, �Thermal stability of tungstensub-nitride thin �lm prepared by reactive magnetron sputtering,� Journal of Nuclear Materials,vol. 485, pp. 1�7, 2017.
[37] A. K. Hill and L. Torrente-Murciano, �Low temperature h2 production from ammonia usingruthenium-based catalysts: Synergetic e�ect of promoter and support,� Applied Catalysis B:
Environmental, vol. 172, pp. 129�135, 2015.[38] D. A. Hansgen, D. G. Vlachos, and J. G. Chen, �Using �rst principles to predict bimetallic catalysts
for the ammonia decomposition reaction,� Nature chemistry, vol. 2, no. 6, p. 484, 2010.[39] T. Bell and L. Torrente-Murciano, �H2 production via ammonia decomposition using non-noble
metal catalysts: a review,� Topics in Catalysis, vol. 59, no. 15-16, pp. 1438�1457, 2016.[40] K. Tamaru, �A" new" general mechanism of ammonia synthesis and decomposition on transition
metals,� Accounts of Chemical Research, vol. 21, no. 2, pp. 88�94, 1988.[41] S. Mukherjee, S. V. Devaguptapu, A. Sviripa, C. R. Lund, and G. Wu, �Low-temperature ammonia
decomposition catalysts for hydrogen generation,� Applied Catalysis B: Environmental, vol. 226,pp. 162�181, 2018.
[42] L. Marot, L. Pichon, M. Drouet, and A. Straboni, �Improved nitrogen transport in fe�c alloysduring nh3 plasma nitridation,� Materials Letters, vol. 44, no. 1, pp. 35�38, 2000.
[43] L. Marot, E. Le Bourhis, and A. Straboni, �Improved nitridation e�ciency and mechanical propertyof stainless steel surface after n2�h2 plasma nitridation at low temperature,� Materials letters,vol. 56, no. 1-2, pp. 76�79, 2002.
[44] A. Boisen, S. Dahl, J. K. Nørskov, and C. H. Christensen, �Why the optimal ammonia synthesiscatalyst is not the optimal ammonia decomposition catalyst,� Journal of Catalysis, vol. 230,no. 2, pp. 309�312, 2005.
[45] J. Hong, S. Prawer, and A. B. Murphy, �Production of ammonia by heterogeneous catalysisin a packed-bed dielectric-barrier discharge: in�uence of argon addition and voltage,� IEEE
Transactions on Plasma Science, vol. 42, no. 10, pp. 2338�2339, 2014.[46] J. Nakajima and H. Sekiguchi, �Synthesis of ammonia using microwave discharge at atmospheric

xxi
pressure,� Thin Solid Films, vol. 516, no. 13, pp. 4446�4451, 2008.[47] M. Mansour, N. El-Sayed, O. Farag, and M. Elghazaly, �E�ect of he and ar addition on n2 glow
discharge characteristics and plasma diagnostics,� Arab J. of Nuclear Sci. and Applications,vol. 46, no. 1, pp. 116�125, 2013.
[48] Y.-K. Pu, Z.-G. Guo, Z.-D. Kang, J. Ma, Z.-C. Guan, G.-Y. Zhang, and E.-G. Wang, �Comparativecharacterization of high-density plasma reactors using emission spectroscopy from vuv to nir,�Pure and applied chemistry, vol. 74, no. 3, pp. 459�464, 2002.
[49] M. Sode, T. Schwarz-Selinger, and W. Jacob, �Ion chemistry in h2-ar low temperature plasmas,�Journal of Applied Physics, vol. 114, no. 6, p. 063302, 2013.
[50] N. Elsayed and o. farag, �The in�uence of the gas mixing ratio on some characteristics andreaction rate coe�cients of ar/n2 and he/n2 dc plasma,� Arab Journal of Nuclear Sciences
and Applications, vol. 52, pp. 181�186, 04 2019.
Copyright © 2022 FDOKUMEN