Discovery and Investigation of Ammonia Decomposition ...
212
University of South Carolina University of South Carolina Scholar Commons Scholar Commons Theses and Dissertations Spring 2021 Discovery and Investigation of Ammonia Decomposition Discovery and Investigation of Ammonia Decomposition Catalysts Catalysts Katherine McCullough Follow this and additional works at: https://scholarcommons.sc.edu/etd Part of the Chemical Engineering Commons Recommended Citation Recommended Citation McCullough, K.(2021). Discovery and Investigation of Ammonia Decomposition Catalysts. (Doctoral dissertation). Retrieved from https://scholarcommons.sc.edu/etd/6345 This Open Access Dissertation is brought to you by Scholar Commons. It has been accepted for inclusion in Theses and Dissertations by an authorized administrator of Scholar Commons. For more information, please contact [email protected].
-
Upload
khangminh22 -
Category
Documents
-
view
0 -
download
0
Transcript of Discovery and Investigation of Ammonia Decomposition ...

University of South Carolina University of South Carolina
Scholar Commons Scholar Commons
Theses and Dissertations
Spring 2021
Discovery and Investigation of Ammonia Decomposition Discovery and Investigation of Ammonia Decomposition
Catalysts Catalysts
Katherine McCullough
Follow this and additional works at: https://scholarcommons.sc.edu/etd
Part of the Chemical Engineering Commons
Recommended Citation Recommended Citation McCullough, K.(2021). Discovery and Investigation of Ammonia Decomposition Catalysts. (Doctoral dissertation). Retrieved from https://scholarcommons.sc.edu/etd/6345
This Open Access Dissertation is brought to you by Scholar Commons. It has been accepted for inclusion in Theses and Dissertations by an authorized administrator of Scholar Commons. For more information, please contact [email protected].

Discovery and Investigation of Ammonia Decomposition Catalysts
by
Katherine McCullough
Bachelor of Science
University of South Carolina, 2016
Submitted in Partial Fulfillment of the Requirements
For the Degree of Doctor of Philosophy in
Chemical Engineering
College of Engineering and Computing
University of South Carolina
2021
Accepted by:
Jochen Lauterbach, Major Professor
Andreas Heyden, Committee Member
John Regalbuto, Committee Member
Hans-Conrad zur Loye, Committee Member
Melissa Moss, Committee Member
Tracey L. Weldon, Interim Vice Provost and Dean of the Graduate School

ii
© Copyright by Katherine McCullough, 2021
All Rights Reserved.

iii
ABSTRACT
Liquid ammonia can be used as a hydrogen transportation and generation source for use in
PEM fuel cells. Current Ru catalysts for ammonia decomposition contain high loadings of
Ru and require reaction temperatures at or above 550°C to attain equilibrium conversion.
For on-site hydrogen generation, it is of interest to combine hydrogen generation from
ammonia decomposition directly with PEM fuel cells. For this occur, operating
temperatures need to be considerably lowered and effluent concentrations of ammonia need
to be minimized to avoid poisoning of the membrane. Therefore, it is of interest to develop
a low-cost catalyst that exhibits high activity at temperatures at or below 450°C.
Prior work from our group discovered the use of supported hollandite (KRu4O8) exhibited
excellent low temperature ammonia decomposition activity. This work further investigates
under what conditions and synthesis parameters the hollandite structure can form, and
further delves into the working state of the catalyst before exposure to ammonia. Here we
show that the hollandite is a sacrificial structure that forms metallic Ru in various particle
sizes depending on the H2 reduction temperature through in-situ XRD analysis.
Additionally, we compare these mixed metal Ru oxide catalysts with K promoted Ru
catalysts synthesized via strong electrostatic adsorption (SEA). Next, we report the
synthesis and high throughput catalytic screening of K promoted Ru based catalysts that
have one of 31 additional metals incorporated, at three different Ru and secondary metal
weight loadings.

iv
Next, we report the synthesis and high throughput catalytic screening of K promoted Ru
based catalysts that have one of 31 additional metals incorporated, at three different Ru and
secondary metal weight loadings. The Ru weight loading varied from 3 wt% to 1 wt%. In
total, over 100 catalysts (including duplicates) were synthesized via incipient wetness
impregnation method and screened for ammonia decomposition activity using a 16-channel
parallel plug flow reactor. Fourier transform infrared (FTIR) imaging was used to analyze
all 16 effluent streams in parallel in under two minutes. At 300°C, catalysts containing Mg,
Ca, Sr, Sc, Y, Zr, Hf, Ta, Rh and Ir with 3wt% Ru were found to have excellent ammonia
decomposition activity compared a K promoted 4wt% Ru catalyst that was previously
optimized by our group. Catalysts containing 1 wt% Ru and 3 wt% Sc, Y, Zr or Hf were
found to outperform the K promoted 4wt% Ru catalyst at the same reaction conditions.
Many of these catalyst combinations reported here have not been reported for ammonia
decomposition previously. Further insight into Sr and Fe containing catalysts were further
investigated for their turnover frequency (TOF), apparent activation energy, H2 uptake, and
through CO adsorption to understand mechanistically the difference between the two
different kinds of catalysts.
Additional insight into the working of the catalysts were investigated through XRD phase
identification and profile fitting to determine how the different Ru species present,
crystallite size and secondary metal influenced the ammonia decomposition activity. A
machine learning algorithm was developed to extract the activity descriptors and elemental
characteristics that are responsible for ammonia decomposition activity at different
operating temperatures. We demonstrate the application of a random forest machine
learning algorithm to high-throughput experimental data to increase understanding of

v
catalyst behaviour through knowledge extraction and to guide catalyst discovery through
predictions. The knowledge extracted from this material agnostic machine learning
algorithm can be used to design a second iteration of catalysts, where features that
contributed to the greatest change in activity were accentuated. Additionally, this
information can be further applied to the design of ammonia synthesis catalysts at ambient
pressures.

vi
TABLE OF CONTENTS
Abstract .............................................................................................................................. iii
List of Tables ................................................................................................................... viii
Chapter 1. Introduction ........................................................................................................1
1.1 Hydrogen Energy and Storage ..................................................................................1
1.2 Catalytic Ammonia Decomposition ..........................................................................5
1.3 High Throughput Experimentation (HTE)..............................................................19
1.4 Dissertation Scope ..................................................................................................22
Chapter 2. Theory & Methods ...........................................................................................24
2.1 NH3 Decomposition Catalytic Activity Testing and Reactor Set Up .....................24
2.2 Catalyst Synthesis ...................................................................................................37
2.3 Characterization of Catalysts ..................................................................................40
Chapter 3. Investigation of the Formation and Working State of K-Ru Hollandite
Catalysts for Ammonia Decomposition ........................................................................54
3.1 Hollandite Background ...........................................................................................55
3.2 Modification of Al2O3 with K .................................................................................58
3.3 Investigation of Hollandite Formation ....................................................................62
3.4 Influence of K Loading ...........................................................................................83
3.5 Working State of the Catalyst .................................................................................86
3.6 Catalyst Reducibility ...............................................................................................92
3.7 Conclusion ............................................................................................................111
Chapter 4. High Throughput Screening of Ru Based Catalysts.......................................116
4.1 Ru Substitution by Transition Metals ...................................................................117
4.2 Design Space for Ammonia Decomposition Catalysts .........................................121
4.3 High Throughput Screening ..................................................................................126
4.4 XRD Analysis .......................................................................................................135

vii
4.5 Machine Learning for Catalyst Feature Extraction ...............................................143
4.6 Investigation of Sr and Fe Catalysts .....................................................................146
4.7 Conclusions ...........................................................................................................153
Chapter 5. Conclusions and Outlook ...............................................................................159
Bibliography ....................................................................................................................170
Appendix A: Permission to Reprint .................................................................................194

viii
LIST OF TABLES
Table 2.1 The standard deviation (Error %) between the same catalysts after they
have been tested for ammonia decomposition at 300°C in two different
randomly selected reactor channels where the reaction conditions are:
T=300°C, 110%NH3/Ar, 30,000 mL/hr/gcat and atmospheric pressure ........................32
Table 3.1 Solution information for 4,12 RuK catalyst synthesis .......................................73
Table 3.2 Average crystallite size for various 4,12 RuK catalysts synthesized with
different impregnation volumes ....................................................................................74
Table 4.1 Summary of the Ru crystal phases present in each catalyst tested for
low temperature ammonia decomposition where the first column indicates the
composition weight loading, the second column indicates the secondary metal,
and a “Y” indicates that the corresponding species is present ....................................136
Table 4.2 H2 uptake, turnover frequency (TOF) and apparent activation energies
(Ea) for Sr and Fe containing catalysts compared to 4 Ru and 4,12 RuK catalysts
where the H2 uptake for each catalyst was calculated from H2 chemisorption
experiments assuming a 1:1 ratio. ...............................................................................152

ix
LIST OF FIGURES
Figure 1.1 Equilibrium conversion of ammonia at atmospheric pressure ...........................6
Figure 1.2 A compilation of some of the ammonia decomposition literature from
2001- 2018 highlighting the active metal studied during the catalytic reaction .............8
Figure 1.3 (a) Dissociation and desorption barriers for nitrogen interaction with Ru
(0001) surface. TS is the transition state. (b) Sketch of the active site for nitrogen
dissociation (black atoms) at the Ru (0001) steps as found by DFT calculations ........18
Figure 2.1 Top-view of the 16-channel parallel high throughput reactor ..........................25
Figure 2.2 Image of the raw data collected using spatially resolved FTIR. Each
colored pixel correlates to a single interferogram .........................................................27
Figure 2.3 FTIR spectra of the v4 vibrational mode of NH3 from 0.1% (bottom) to
1.0% (top) .....................................................................................................................29
Figure 2.4 Measured vs. Predicted NH3 concentrations from 0.1 – 1.0%
for reactor 0 using PLS-1 regression model .................................................................30
Figure 2.5 Model validation for each reactor channel. The black X corresponds to
the measured concentration value .................................................................................31
Figure 2.6 Block diagram of a typical closed loop system ................................................34
Figure 2.7 Response of the PID closed loop system as a function of time for Furnace
3 and the duty cycle output of the solid-state relay ......................................................35
Figure 2.8 Michelson Interferometer .................................................................................44
Figure 2.9 H2 Pulse Chemisorption over 4 wt% Ru, 12 wt% K catalyst supported
on ɣ-Al2O3 .....................................................................................................................52
Figure 3.1 XRD pattern of 12 wt% K supported on ɣ- Al2O3. The circles indicates
reflections corresponding to KAl(OH)2CO3 ................................................................61
Figure 3.2 Raman Spectra of (top) 4,12 RuK/Al2O3 and (bottom) ....................................62
x
Figure 3.3 Left panel: SEM images of (a) 4 Ru/Al2O3 and (b) 4,12 RuK/Al2O3.
TEM images of (b) 4 Ru/Al2O3and (d) 4,12 RuK /Al2O3. Right panel:
corresponding XRD patterns of (e) 4 RuK/Al2O3 and (f) 4,12 Ru/Al2O3 ....................63
Figure 3.4 Arrhenius plot for 4 Ru (filled diamonds) and 4,12 RuK (open diamonds).
Reaction conditions: 100% NH3, 5,400 mL/hr/gcat and atmospheric pressure.
Measurements were conducted under differential conditions ......................................64
Figure 3.5 XRD patterns of 4,12 RuK catalysts synthesized with (blue trace) RuCl3,
KCH3COO, (red trace) RuCl3, KOH and (black trace) RuCl3, KNO3 ..........................65
Figure 3.6 XRD patterns of 4,12 RuK catalysts synthesized with (blue trace)
Ru(acac)3, KCH3COO, (red trace) Ru(acac)3, KOH and (black trace) Ru(acac)3,
KNO3.............................................................................................................................67
Figure 3.7 SEM images of 4,12 RuK supported on ɣ-Al2O3 made with (a)
RuCl3, KCH3COO, (b) RuCl3, KOH, (c) RuCl3, KNO3, (d) Ru(acac)3, KCH3COO,
(e) Ru(acac)3, KOH, and (f) Ru(acac)3, KNO3 .............................................................68
Figure 3.8 NH3 conversion of various 4,12 RuK catalysts synthesized with different
precursors. Reaction conditions: 10%NH3/Ar, 45,300 mL/hr/gcat and atmospheric
pressure .........................................................................................................................69
Figure 3.9 XRD patterns for the three different synthesis methods of 4,12 RuK.
from top to bottom: incipient wetness impregnation (IWI), strong electrostatic
adsorption (SEA) and wet impregnation (WI) ..............................................................71
Figure 3.10 XRD patterns for the 4,12 RuK catalysts synthesized with different
solution volumes from top to bottom: 20 mL, 12 mL, 8 mL, 6 mL, and 5 mL.
The insert shows the 2 Theta values from 10 – 20 deg to highlight the relative
intensity of KRuO4 and KRu4O8 ...................................................................................75
Figure 3.11 SEM images of 4,12 RuK catalysts compared to (a) unpromoted 4 wt%
Ru. Synthesized with (b) 5 mL, (c) 6 mL, (d) 8 mL, (e) 12 mL, or (f) 20 mL of
solution during the incipient wetness impregnation synthesis ......................................76
Figure 3.12 (a) Activity of the 4,12 RuK catalysts synthesized with different
dilution volumes, compared to unpromoted 4 wt% Ru. Reaction conditions:
1% NH3/Ar, 30,000 mL/hr/gcat and atmospheric pressure. (b) Ammonia
conversion as a function of catalyst dilution volume at 300°C and identical
reaction conditions ........................................................................................................77

xi
Figure 3.13 (a) XRD patterns of 4,12 RuK catalysts synthesized by sequential
impregnation compared to co-impregnation method (blue trace) and (b)
enlargement of the XRD patterns to highlight the KCl (110) reflection ......................78
Figure 3.14 SEM images of (a,b) 4,12 Ru(K) and (c,d) 4,12 (Ru)K .................................80
Figure 3.15 XRD patterns of (left) catalysts calcined for 1 hr, (middle) catalysts
calcined for 3 hr, and (right) catalysts calcined for 5 hours. The temperature
listed refers to the evaporation temperature during the wet impregnation
synthesis ........................................................................................................................81
Figure 3.16 (Left) Activity of the 4,12 RuK catalysts synthesized using the wet
impregnation technique where the evaporation temperature and calcine duration
were varied. The legend indicates first the evaporation temperature of each
catalysts (°C) followed by the calcine duration (hr). (Right) Contour plot showing
the relationship between evaporation temperature, calcine duration and ammonia
decomposition activity at 300°C. The legend indicates the NH3 conversion (%)
at 300°C. Reaction conditions: 10%NH3/Ar, 30,000 mL/hr/gcat and atmospheric
pressure .........................................................................................................................82
Figure 3.17 Ammonia decomposition activity of catalysts with various potassium
loadings from 0.5% to 15 % in combination with either 1%Ru (1,X RuK) and 4%
Ru (4,X RuK) supported on γ-Al2O3, where X = K loading. Reaction conditions:
10% NH3/Ar, 30,000 mL/hr/gcat and atmospheric pressure ..........................................85
Figure 3.18 K/Ru ratio as a function of ammonia decomposition for catalysts
containing (a) 1%Ru and (b) 4 % Ru supported on γ-Al2O3. Reaction conditions:
10% NH3/Ar, 30,000 mL/hr/gcat and atmospheric pressure ..........................................86
Figure 3.19 SEM images of 4,12 RuK catalysts (left) fresh, (middle) reduced and
(right) spent at two different scales (top) 3 µm and (bottom) 1 µm .............................87
Figure 3.20 Elemental mapping of reduced 4,12 RuK catalyst .........................................89
Figure 3.21 TEM images of 4,12 RuK catalysts (left) fresh, (middle) reduced and
(right) spent at two different scales (top) 200 nm and (bottom) 50 nm ........................90
Figure 3.22 Nanorod diameter distribution for 4,12 RuK catalysts (bottom) fresh,
(middle) reduced and (top) spent. Each distribution is fit with a Gaussian
function .........................................................................................................................91
Figure 3.23 XRD patterns of 4,12 RuK catlaysts (blue trace) fresh, (red trace)
reduced and (black trace) spent .....................................................................................93

xii
Figure 3.24 Top (a,b) TEM images of spent Ru nanorods and bottom (a,b) dark field
imaging of the same area containing Ru nanowires. Aperture was placed over
different bright spots to illuminate corresponding crystal grains. Adapted from
ref (127) ........................................................................................................................94
Figure 3.25 H2-TPR profile of 4 Ru (black trace) and 4,12 RuK (red trace) supported
on γ-Al2O3 .....................................................................................................................95
Figure 3.26 in-situ XRD patterns for 4,12 RuK during H2 reduction in 5%H2/Ar from
25°C to 450°C. After the last measurement at 450°C, the temperature was held
for 30 minutes and a second measurement was taken. The catalyst was then
allowed to cool to room temperature under inert and the final measurement
was taken (RT) ..............................................................................................................98
Figure 3.27 in-situ XRD patterns for 4,12 RuK during H2 reduction in 5%H2/Ar from
25°C to 225°C highlighting the major reflections of KRuO4 and KRu4O8 from
10°- 30° .........................................................................................................................99
Figure 3.28 in-situ XRD pattern from 43° to 50° at 50°C, highlighting the fitting of
the γ-Al2O3 peak before the appearance of the Ru (101) facet along with the residual
of the fit. Profile fitting of the γ-Al2O3 peak was performed using a Split Voigt
function .......................................................................................................................100
Figure 3.29 in-situ XRD patterns from 41° to 49° of 4,12 RuK under 5%H2/He,
showing the growth of the Ru0 reflection as a function of temperature from
150°C to 450°C ...........................................................................................................101
Figure 3.30 Full Width Half Max (FWHM) and crystallite size (nm) as a function
of reduction temperature. Reduced under 5%H2/He...................................................102
Figure 3.31 SEM images of the 4,12 RuK catalyst reduced ex-situ in 10% H2/Ar at
three different temperatures: 250°C, 350°C and 450°C. ............................................104
Figure 3.32 SEM images of the 4,12 RuK catalyst reduced ex-situ in 10% H2/Ar at
three different temperatures: 250°C, 350°C and 450°C .............................................105
Figure 3.33 XRD patterns of (black trace) fresh and (red trace) spent 4,12 RuK
catalyst after exposure to ammonia. Catalyst was synthesized via SEA
method.........................................................................................................................107
Figure 3.34 (left) Activity of the 4,12 RuK SEA (black squares) compared to the 4,12
RuK catalyst synthesized via incipient wetness impregnation (IWI) (red circles).
Reaction conditions: 100%NH3, 5,400 mL/hr/gcat at atmospheric pressure and
(right) long term stability of the 4,12 RuK SEA (black squares) and of the 4,12
RuK IWI (red circles) at 450°C over 10 hours ...........................................................108

xiii
Figure 3.35 Activity of the 4,12 RuK SEA (black squares) compared to the 4,12
RuK catalyst synthesized via incipient wetness impregnation (IWI) (red circles).
Reaction conditions: 100%NH3, 16,200 mL/hr/gcat at atmospheric pressure .............109
Figure 3.36 Reaction order determination for 4,12 RuK SEA (circles, red trace) and
4,12 RuK IWI (squares, blue trace) with respect to H2 (top) and NH3 (bottom).
Reaction conditions:100% NH3, T= 450°C, 10-30% H2, 10 – 30% NH3 in balance
Ar, 5,400 mL/hr/gcat and atmospheric pressure ..........................................................110
Figure 4.1 NH3 conversion of 2,2 RuM (M= Fe, Ni, Co, Mn, Zn, Mo, Hf or Y) supported
on γ-Al2O3. Reaction conditions: 1%NH3/Ar, 30,000 mL/hr/hgcat and atmospheric
pressure .......................................................................................................................119
Figure 4.2 NH3 conversion of 2,2 RuM (M= Os, Rh, Pt or Ir) supported on γ-Al2O3.
Reaction conditions: 1% NH3/Ar, 30,000 mL/hr/hgcat and atmospheric pressure ......121
Figure 4.3 Ammonia decomposition activity of 3,1,12 RuHfK over various supports.
Reaction conditions: 5,400 mL/hr/gcat, 100% NH3 and 1 bar .....................................124
Figure 4.4 High throughput screening results at 250°C for (a) 3,1,12 RuMK, (b) 2,2,12
RuMK and (c) 3,1,12 RuMK, where the substituted metal M listed on the x-axis.
Reaction conditions: 1%NH3/Ar, 30,000 mL/hr/gcat and atmospheric pressure.
The black dashed line corresponds to the activity of 4,12 RuK at identical
conditions ....................................................................................................................127
Figure 4.5 High throughput screening results at 300°C for (a) 3,1,12 RuMK, (b) 2,2,12
RuMK and (c) 3,1,12 RuMK, where the substituted metal M listed on the x-axis.
Reaction conditions: 1%NH3/Ar, 30,000 mL/hr/gcat and atmospheric pressure.
The black dashed line corresponds to the activity of 4,12 RuK at identical
conditions ....................................................................................................................128
Figure 4.6 High throughput screening results at 350°C for (a) 3,1,12 RuMK, (b) 2,2,12
RuMK and (c) 3,1,12 RuMK, where the substituted metal M listed on the x-axis.
Reaction conditions: 1%NH3/Ar, 30,000 mL/hr/gcat and atmospheric pressure.
The black dashed line corresponds to the activity of 4,12 RuK at identical
conditions ....................................................................................................................129
Figure 4.7 High throughput screening results at 400°C for (a) 3,1,12 RuMK, (b) 2,2,12
RuMK and (c) 3,1,12 RuMK, where the substituted metal M listed on the x-axis.
Reaction conditions: 1%NH3/Ar, 30,000 mL/hr/gcat and atmospheric pressure.
The black dashed line corresponds to the activity of 4,12 RuK at identical
conditions ....................................................................................................................130

xiv
Figure 4.8 SEM images of fresh (a) 3,1,12 RuCaK, (b) 3,1,12 RuMgK, (c) 3,1,12
RuSrK and spent (d) 3,1,12 RuCaK, (e) 3,1,12 RuMgK and (f) 3,1,12 RuSrK .........133
Figure 4.9 Arrhenius plot of various 3,1,12 RuMK catalysts and calculated apparent
activation energies. Turnover frequencies calculated from H2 uptake and assuming
a ratio of 1 H2: 1 Ru active site. Reaction conditions: 100% NH3, 5,400 mL/hr/gcat
and atmospheric pressure ............................................................................................134
Figure 4.10 XRD pattern of 1,3,12 RuMoK showing the profile fit using Pseudo-Voigt
and Split-Voight fit and the residual after fitting from 38 – 60° ................................140
Figure 4.11 NH3 conversion at 300°C as a function of average Ru particle size and the
atomic number of the secondary metal. (a) 3,1,12 RuMK, (b) 2,2,12 RuMK and (c)
1,3,12 RuMK where M refers to the secondary metal ................................................142
Figure 4.12 Highest ranked features according to their feature importance for determining
ammonia decomposition activity for catalysts with 3,1,12 RuMK, 2,2,12 RuMK and
1,3,12 RuMK weight loadings ....................................................................................145
Figure 4.13 Ammonia decomposition activity at 300°C, 1% NH3/Ar and 30,000
mL/hr/gcat as a function of the mean absolute deviation (MAD) of the number of d-
shell valence electrons and the MAD of the catalyst work function ..........................147
Figure 4.14 Arrhenius plot of (a) RuSrK and (b) RuFeK based catalysts. Reaction
conditions: 100% NH3, 5,400 mL/hr/gcat and atmospheric pressure. Apparent
activation energies were conducted under differential conditions ..............................149
Figure 4.15 Ammonia decomposition activity of (a) 3,1,12 RuSrK (black squares)
2,2,12 RuSrK (red circles) and 1,3,12 RuSrK (blue triangles) and (b) 3,1,12
RuFeK (black squares) 2,2,12 RuFeK (red circles) and 1,3,12 RuFeK (blue triangles).
Reaction conditions: 100% NH3, 5,400 mL/hr/gcat and atmospheric pressure ...........152
Figure 4.16 FTIR spectra of CO adsorbed on (a) 4 Ru (b) 4,12 RuK (c) 1,3,12 RuSrK
and (d) 1,3,12 RuFeK..................................................................................................155
1
CHAPTER 1
INTRODUCTION
1.1 Hydrogen Energy and Storage
The rising concern of greenhouse gas emissions generated from non-renewable
energy sources has promoted a wealth of research on sustainable, carbon free energy.
Carbon dioxide emissions from natural gas, coal and oil are considered to be the largest
threat to the environment, and yet world consumption of these energy sources continue to
increase yearly (1). To date, oil consumption around the world has increased by 10% and
natural gas consumption by 16% since 2010 (1, 2). Continued research efforts to make
clean energy technologies more efficient, abundant, and cost effective has resulted in a
steady increase in the use of renewable energies. Primarily, renewable and sustainable
energy sources include nuclear (3, 4), solar, hydro and wind (5–8) and hydrogen energy
(9–12). Ultimately, the challenges facing sustainable energy comes down to reliability, and
an efficient means of storage and conversion for these energy technologies. Of these
sustainable energy sources, hydrogen energy has gained traction and increased funding
over the past decades since the proposal of the “hydrogen economy” during the oil crisis
in 1972 (13–15). This term refers to the integration of hydrogen as one of the main
components in energy systems, primarily for heating and hydrogen vehicles, as well as

2
long term storage and transportation options (16). Globally, hydrogen has the capability to
provide 3% of energy consumption by 2050 and has a significantly higher energy density
than other conventional fuel sources (10, 17).
Advances in proton exchange membrane fuel cells (PEMFCs) have also accelerated
research efforts in hydrogen energy (18, 19). PEMFCs exhibit high power densities, quiet
operation, generate zero pollution and have higher efficiencies compared to combustion
energies that are limited by the Carnot factor (20). Hydrogen is abundant, produces
environmentally benign by products upon combustion, and consists of a very high energy
density between 120 MJ/kg and 144 MJ/kg (16, 21). The major barrier in utilizing
hydrogen energy is the lack of efficient means in which to store and transport it. Gaseous
hydrogen requires excess pressures (>300 bar) for storage which, in and of itself is an
energy intensive process requiring 1.36 kWh/kg H2 to compress isothermally from to 20
to 350 bar (22). Liquefied hydrogen can reduce volume constraints but requires cryogenic
cooling to -253°C (16, 22, 23). These technologies have been applied to some prototype
vehicles, but ultimately these methods of storage do not meet the required gravimetric
energy densities set by the US Department of Energy (DOE) (9, 24, 25). Thus, researchers
have focused on developing hydrogen storage methods and materials to meet the 1.5
kWh/kg H2 gravimetric capacity for onboard hydrogen storage set by the US DOE for 2020
(24). Of course, hydrogen fueling stations and also be proposed in lieu of hydrogen
powered vehicles (11, 25). Additionally, hydrogen is a primary candidate in the zero-
energy concept, which has been introduced in energy policy and investigates the concept
of buildings generated as much renewable energy as they consume (17). Therefore, it
obvious that there are many advantages and interest in integrating hydrogen into existing

3
energy infrastructure and as an alternative, carbon free energy source, but efficient storage
and conversion solutions must be addressed.
Solid hydrogen storage materials generally consists of metal organic frameworks
(MOFs), metal hydrides or borohydrides that can physically or chemical store hydrogen
(16, 26–28). Currently these systems fail to have appreciable hydrogen sorption properties,
slow kinetics, or require harsh operating temperatures. Hydrogen stored in methane, natural
gas or methanol are obvious efficient methods for hydrogen storage and transportation. In
fact, the majority of hydrogen production currently comes from the steam reforming of
methane (21, 29, 30). Ammonia for hydrogen storage is a promising, carbon free alternative
that satisfies the DOE targets for physical storage of hydrogen (23). Ammonia can be
readily decomposed at atmospheric pressure to form molecular hydrogen and nitrogen, and
current infrastructure for transportation already exists. Ammonia has a high hydrogen
content, a comparative energy density to some fossil fuels (3.5 kWh/kg compared to 5.6
for methanol, and 7.2 for ethanol) and is easily liquefied (31, 32). In fact, ammonia as a
direct fuel source has been studied in both laboratories and pilot plants either through
ammonia fuel cells or combustion, and ultimately may be a more attractive and
economically feasible fuel source than hydrogen (33–39). Most importantly, the cost of
anhydrous ammonia is lower than that of pure hydrogen, making this an economically
feasible process (40, 41). Ammonia could be disregarded as a potential hydrogen carrier
because of its toxicity, but recent studies have found that reversible ammonia storage in
the form of metal ammine salts can dramatically reduce the hazards and smells associated
with handling ammonia, while preserving the high hydrogen storage capacity (28, 42).
Additionally, the Advanced Research Project Agency-Energy (ARPA-E) has launched its

4
“Renewable Energy to Fuels through Utilization of Energy-Dense Liquids” REFUEL
program aimed to develop scale up energy generation processes from carbon neutral fuel
sources to make electricity of hydrogen (43). These projects include ammonia cracking
membrane reactors, electrochemical membrane reactors for ammonia, H2 generation from
catalytic ammonia cracking, direct ammonia fuel cells and wind energy to ammonia
synthesis to name a few. Ultimately, these points indicate that ammonia is an excellent
candidate for hydrogen storage and transportation.
While decomposing ammonia to generate hydrogen is a carbon neutral process,
ammonia is primarily produced from the steam reforming of methane and coal gasification
(29, 30, 38). Ammonia alone is responsible for 1% of the world’s CO2 emissions and 1.8%
of the world’s consumption of fossil fuels (38, 44, 45). This is not surprising since it is the
second largest production process in the world (46). Even without facilitating ammonia for
hydrogen transport, there is a need to decarbonize ammonia synthesis and ultimately
hydrogen production. Very recently, a massive number of projects have been announced
for carbon free ammonia production. For example, Saudi Aramco and the Institute of
Energy Economics announced its first shipment of “blue” ammonia, a process which
generates hydrogen from natural gas and then captures the CO2 emissions to be used further
for methanol synthesis and enhanced oil recovery (47, 48). Air Products has also recently
signed an agreement to begin building a 4 GW ammonia production facility powered by
renewable energy in 2025 (49). They propose to produce 650 tons per day of hydrogen
through water electrolysis. Monolith Materials will produce carbon free ammonia by their
proprietary technology that converts natural gas into hydrogen and carbon black, instead
of CO2 (50). This demonstrates that there will be a market and supply for “green” ammonia

5
and hydrogen production in the near future. Yara also announced plans to continue to build
upon their existing fleet of solar powered ammonia production plants from water
electrolysis (36, 39). The decarbonization and green production of ammonia and hydrogen
is a promising step forward towards reducing our impact on the environment, but the long-
term implications of water as a source of fuel should be further debated considering the
growing demand and scarcity of fresh water sources (51–53). Currently, ammonia as a
hydrogen storage and transportation molecule is seeing significant growth in research and
industry sectors. While these points indicate that ammonia is a good candidate for the
storage of hydrogen, the conversion of ammonia to hydrogen is yet to be addressed.
1.2 Catalytic Ammonia Decomposition
Hydrogen liberation from ammonia occurs through a thermal catalytic cracking
process occurring at atmospheric pressure and requiring temperatures upwards of 550°C
for complete conversion (23, 32, 54). The efficiency and cost at which current catalysts can
decompose ammonia is the main drawback for utilizing ammonia for hydrogen storage.
Additionally, the feasibility of ammonia for hydrogen storage depends upon realistic
alignment between the temperature of decomposition with that of the PEMFC (~200°C)
(55) so that the two technologies can be integrated. Using thermodynamic equilibrium data,
we calculated the equilibrium conversion of ammonia at 1 bar, as shown in Figure 1.1. At
200°C, the equilibrium conversion for ammonia is roughly 89%, which is not adequate
conversion for the low ammonia tolerance of PEMFCs (0.1 ppm) (20, 56). This can be
mitigated by using commercially available adsorbents, high-temperature PEMFC, alkaline
fuel cells, or implementing membrane reactors during ammonia decomposition (20, 57,
58). Metals for ammonia decomposition typically include Fe, Co, Ni and Ru, which will

6
be elaborated on in later sections. Currently, the most effective catalysts consist of Ru
nanoparticles supported on carbon nanotubes (CNT) (59–63). Of these, the commonly cited
“state of the art” catalyst achieves less than 10% conversion at 200°C, and reaches 60%
conversion of ammonia at roughly 400°C, using 7% Ru/CNT promoted with 4% Cs (63).
While the Ru loading was considerably high and the inlet ammonia concentration was not
reported, these results were some of the first to demonstrate that high ammonia conversions
can be achieved at more mild temperatures. Typically, Ru based catalysts require upwards
of 550°C to obtain high activity. Thermodynamically, 98% conversion can be achieved at
350°C, and 99.1% at 400°C, at which the reaction is essentially irreversible. Below 400°C,
the conversion becomes more dependent on the kinetics of the reaction on the catalyst
Figure 1.1. Equilibrium conversion of ammonia at atmospheric pressure

7
surface. The scarcity and cost of using high loadings of Ru also limits the economic
feasibility of the decomposition reaction. A compilation of some of the ammonia
decomposition literature shown in Figure 1.2 from 2001 to 2018, highlighting the active
metal used in different studies for this reaction. Interestingly, this demonstrates that
research efforts that are geared towards finding or utilizing alternative catalysts to Ru are
extremely scarce. Instead, most studies focus on the optimization of existing Ru based
catalysts through manipulation of Ru particle size, support and promoters. Therefore, it is
pertinent to focus research efforts on cost reduction of the active metal component while
simultaneously enhancing the reactivity at lower operating temperatures.
Thermodynamically, this could be achieved at very mild temperatures, however
diminishing the gap that exists between the thermodynamic and kinetic limitations will
require more complex and broader research strategies than which currently exist.
1.2.1 A Brief History on Ammonia
Ammonia decomposition has been studied since the early 19th century as a
convenient test reaction, and to better understand the ammonia synthesis reaction, which
had had very little success up until this point (46, 64, 65). After the formulation of the van’t
Hoff equations for thermodynamic equilibrium, Fritz Haber discovered that a combination
of high pressure and low temperatures were necessary for appreciable ammonia synthesis
rates (65). Carl Bosch was then able to successfully scale up this reaction and discovered
the technology for high pressure flow reactors. In the 1950’s, Alwin Mittasch underwent
one of the most comprehensive screening of over 2,500 different catalyst combinations to
discover that fused Fe promoted with Al2O3, CaO and K was highly active for ammonia
synthesis (65–67). Ammonia synthesis had a monumental impact on how we study,

8
investigate and go about catalytic materials and reactions. Industrially, the current
ammonia synthesis catalyst is still relatively unchanged from the composition discovered
by Mittasch. Regardless of these advances, mechanistic understanding was still very
unclear due to the complexity of the reduction of Fe under reaction conditions, the surface
coverage of K species that would change the electronic environment of the multiple
different Fe crystal planes present (68). With the onset of ultrahigh vacuum (UHV)
technologies, it became possible to simplify the complexity of catalysts by studying how
the reaction proceeds over different crystal orientations.
The ammonia synthesis reaction has basically formulated all general concepts
related to heterogeneous catalysis because of its apparent simplicity and the range of
Figure 1.1. A compilation of some of the ammonia decomposition literature from 2001 –
2018 highlighting the active metal studied during the catalytic reaction.

9
conditions and equilibrium situations in which it can be studied (64). The reaction is also
well suited for surface science studies to determine how different atomic surface structures
and composition influence activity (69). These efforts were led by Ertl and Somorjai to
improve understanding of ammonia synthesis (70). For example, Somorjai et al.
demonstrated how promoting three different basal planes of Fe with K could enhance the
sticking coefficients of nitrogen. The rates of ammonia formation varied significantly over
the different basal plans and with the addition of K (71). Additionally, the elementary
reactions for ammonia synthesis could be studied on single crystal surfaces, which can
provide the basis for microkinetic models to furth describe the behavior of a catalyst under
more technical operating conditions.
1.2.2 Kinetics and Reactivity of Ammonia Decomposition
It was originally thought that the best catalyst for ammonia decomposition would
also be the best catalyst for ammonia synthesis due to the principle of microscopic
reversibility. Curiously, it is now widely accepted and demonstrated within one body of
work this is not the case, due to differences in operating conditions and rate determining
steps (adsorption vs. desorption of molecular nitrogen) (72). The original paper compares
ammonia synthesis and decomposition rates as a function of dissociative nitrogen
adsorption energy and makes the claim that the optimal ammonia decomposition catalyst
will not be the optimal ammonia synthesis reaction based on this scaling relation. However,
both reaction are enhanced by basic promoters and alkali and alkaline earth metal oxides
and some examples of further catalyst systems used for both reactions can be found (73–
76). The kinetics of ammonia decomposition have been shown to vary based on the
temperature, concentration and active metal component (77, 78). The most active metal for

10
ammonia decomposition and ammonia synthesis is Ru, and therefore the kinetics and
reactivity addressed here will be mainly focused on Ru based catalysts and surfaces. The
Sabatier principle explains the reason between the high reactivity of Ru, for it can easily
form stable intermediates, but not so stable as to retard the rate of reaction (70, 79, 80).
Ammonia decomposition occurs through sequential dehydrogenation steps,
followed by the recombination and desorption of molecular N2 and H2 from the catalyst
surface. The elementary steps for this reaction are as follows and are the reverse of the
ammonia synthesis reaction:
NH3 ↔NH3,ads (1.1)
NH3,ads→NH2,ads+Hads (1.2)
NH2,ads+Hads→NHads+2Hads (1.3)
NHads+2Hads →Nads+3Hads (1.4)
2Hads →H2 (1.5)
2Nads →N2 (1.6)
Kinetic studies over Ru (0001) crystals have determined that the RDS is either the
associative desorption of nitrogen atoms (eq. 1.6) or N-H bond cleavage (eq. 1.2-1.4) to be
rate limiting (81, 82) but no consensus on the rate determining step (RDS) or the most
abundant reaction intermediate (MARI) have been established within the literature. Egawa
et al., studied ammonia decomposition over Ru (0001) and stepped Ru (1110) single
crystals and determined that the RDS may be a function of temperature, where below 650K,
nitrogen desorption is rate limiting, and above 750K, N-H cleavage becomes rate limiting
(83). They found that the rate of reaction increased up to ca. 560K, and then decreased at
higher temperatures. At low temperatures when nitrogen desorption is rate limiting, they

11
found that the kinetics were dependent on the ammonia and hydrogen partial pressures,
and that the rate of nitrogen formation was one order of magnitude faster on stepped Ru
(1110) than Ru (0001) crystal. Higher hydrogen partial pressures decrease the
concentration of surface nitrogen and therefore inhibits the rate of reaction. This has been
determined over various Ru catalysts by fitting rates of reaction to simple power law
models (84, 85). At higher temperatures, the reaction was found to be independent of
hydrogen and nitrogen pressures and the amount of adsorbed hydrogen on the surface was
found to be negligible (83). The activation energy for N2 desorption on Ru (0001) has been
determined to be 184-190 kJ/mol (81, 86). However, differences in the RDS may appear
under different reaction conditions (UHV conditions vs high pressures). Hinrichsen et al.
(87) used microkinetic modeling to bridge the gap between UHV studies and high pressure
studies, by probing the interaction of N2 with Ru supported on Al2O3, MgO and Cs-
Ru/MgO through N2-TPD and isotopic exchange reactions. They determined that the
desorption of N2 from Ru/MgO resulted in new low temperature desorption peaks, which
were not present in Ru/Al2O3. The Ru/MgO N2 desorption event was attributed to
electronic enhancement of the active site through oxygen vacancies that are exist at the
interface between Ru crystallites and MgO. These sites were also present in Cs-Ru/MgO,
and the addition of Cs lowered the activation energy for N2 desorption from 158.0 to 137.0
kJ/mol.
Differences in RDS may be due to the support used as well as the dispersion and
particle size and shape of the Ru particles. In fact, the dissociative adsorption of N2 on Ru
(0001) crystal has been shown to almost exclusively occur over Ru step sites (88). By
preferentially blocking step sites on a Ru (0001) crystal through Au deposition, Dahl et al.,

12
showed that the N2 sticking coefficient decreased by seven orders of magnitude.
Additionally, N2 desorption on Ru (0001) was strongly affected as exhibited by N2-TPD,
where the desorption of N2 was shifted up roughly 150K with small amounts of Au. Egawa
et al., found that the H2 rate of formation was one order of magnitude higher on the stepped
Ru (1110) single crystal (83). This demonstrates the structure sensitivity of the NH3
decomposition reaction and may explain the differences in different RDS determined in
various studies over Ru catalysts.
Therefore, it is clear that the rate of the reaction and kinetics of ammonia
decomposition are heavily influenced by the support, promoter and operating conditions
employed. In fact, experimental determination of the RDS using Al2O3 supported metal
catalysts have shown that the RDS may be a function of the active metal (78). Ganley et
al. (78) attempted to correlate TOF over 13 different metals with common models used to
predict catalytic reactivity such as the energy of the center of the d-band relative to the
Fermi level and heat of formation of the metal oxide. They determined that both the relative
N-H bond cleavage and associative desorption of nitrogen were needed to predict the
reactivity of the different metals, which resulted in a volcano plot relationship, where N-H
cleavage is the RDS over precious metals like Ru, Rh, Pd, and Pt and the nitrogen
desorption is the RDS over Fe, Co and Ni (23, 78, 80). The determined the order of activity
Ru > Ni > Rh > Co > Ir > Fe. In contrast to Ganley et al., TAP experiments studying surface
species and product formation during NH3 decomposition over Ru/C catalysts determined
that the RDS is associative desorption of N over Ru/C (89). Additionally, Yin et al. (90)
determined the order of activity Ru > Rh > Ni > Pd = Pt > Fe.

13
Regardless of differences in the literature, theoretical calculations commonly utilize
the N2 binding energy of various metal surfaces as a descriptor to predict NH3
decomposition reactivity (80, 88). This method has identified various bimetallic catalysts
such as Fe-Pt, Co-Pt, Cu-Pt (89, 90) and Co3Mo3N (80) as promising cost effective
catalysts. However, such highly defined systems such as Fe-Pt (111) will be difficult to
experimentally synthesize and stabilize at more technical operating conditions. Yet there
has been some success with CoMo catalysts for NH3 decomposition (91), and most recently
by using high entropy alloy catalysts composed of CoMoFeNiCu particles with various
Co/Mo ratios (92).
1.2.3 Active Metals
While Ru is the most intrinsically active metal for ammonia decomposition, the
cost associated with using Ru catalysts is a major drawback to the scaling of this process.
In 2020, the cost of Ruthenium was 270 USD/oz, while that of Cobalt is only 0.21 USD/oz
(93). This has motivated research for alternative catalysts based on metals that are more
readily available and cost effective. These metals mainly consists of non-noble metals like
Co, Fe, Ni as well as a variety of carbides and nitrides, based on their positioning in the
volcano plot relationship describing ammonia decomposition rates of reaction with the N2
binding energy (78–80). This body of work will discuss some of the results and variations
in activity primarily in Fe, Ni and Co based catalysts.
Fe based catalysts have been extensively studied for ammonia decomposition
because of their successful use in the ammonia synthesis reaction. However, under
ammonia decomposition operating conditions, the formation of Fe nitrides is more
14
prevalent, thus deactivating these catalysts at temperatures as low as 300°C (23, 88). It has
been demonstrated that encapsulating Fe nanoparticles in SiO2 to create core-shell
nanoparticles can show stability for up to 40 hours at 550°C and achieve a conversion of
60% at this temperature (94, 95). Jedynak et al., showed that K promoted Fe catalysts
supported on graphitized carbon with Fe nanoparticles resulted in higher turnover
frequency (TOF) with decreasing Fe particle size, but that the apparent activation energy
was significantly higher than that of K promoted Ru catalysts supported on carbon (166
kJ/mol compared to 139 kJ/mol) (96). Duan et al. (97, 98) synthesized Fe particles on top
of carbon nanofibers and achieved 51.3% conversion at 600°C in pure ammonia. On mica
supported Fe/CNF catalysts, the activity was enhanced to 98.8% at the same temperature,
due to the formation of small and highly dispersed Fe particles on top of the CNF. Lu et al.
(99) synthesized Fe nanoparticles supported on CMK-5 carbon and SBA-15 and were
found to be completely immobilized inside the channels of the supports. Fe/CMK-5
showed complete conversion of ammonia at 700°C. The addition of alkali metal promoters
to Fe catalysts have been shown to prevent sintering of Fe nanoparticles (100), but overall,
activities of Fe based catalysts normalized to the content of their active metal content are
roughly two orders of magnitudes less activity than Ru based systems (88).
It has been shown that enhancing dispersion and reducing Ni particle size is the
most effective method for enhancing the activity of Ni based catalysts (88). Ni based
catalysts for ammonia decomposition have shown to be highly surface sensitive. This has
been demonstrated by Li et al. (101) who studied ammonia decomposition over Ru and Ni
catalysts supported on SiO2, MCM-41 and SBA-15. The Ni catalysts with the highest
dispersion were found to have the lowest number of active sites. This suggests that the

15
different preparation methods used may have changed the Ni dispersion, morphology, and
structure of the Ni nanoparticles. Additionally, they found that while K promotion greatly
enhanced the activity of Ru based catalysts, K promotion had little effect on the Ni based
catalysts supported on siliceous materials. Hu et al. (102) studied the effect of preparation
method on Ni/ZSM-5 catalysts by synthesizing catalysts through wet impregnation,
deposition-precipitation, solid state ion exchange, and modified solid state ion exchange
methods. They found that the different preparation methods resulted in various Ni particle
sizes, and that the smallest Ni particles were also the most active. They attributed the
enhanced activity exhibited by the modified solid-state ion exchange synthesis method to
the added dealumination process, which in turn allowed for framework Ni species to be
confined in the ZSM-5. The Ni/ZSM-5 catalyst achieved almost complete conversion of
ammonia at 650°C under pure ammonia. Lucentini et al. (103) achieved near complete
conversion of ammonia at 550°C in 43% NH3 using CeO2 supported Ni catalysts, but these
catalysts suffered from reoxidization to NiO at temperatures below 450°C. CeO2 has also
been shown to promote Ni supported Al2O3 catalysts (104). In 15% NH3, a Ce/Ni ratio of
0.1 resulted in roughly 75% conversion at 500°C. Ce/Ni molar ratios greater than 0.1
resulted in a decrease in activity. The addition of CeO2 to Ni/Al2O3 catalysts suppressed
sintering of Ni nanoparticles and reduced the apparent activation energy compared to
Ni/Al2O3 catalysts.
Co has also showed promise as a cost effect low temperature ammonia
decomposition catalyst. Co has a calculated activation energy of 27 kJ/mol lower than Fe
for ammonia decomposition and does not suffer from nitride formation (105). Czekajło et
al. (106) studied the effect of synthesis conditions and promoters on catalytic activity of

16
Co based catalysts synthesized via precipitation method. Promotion by Ca, K, and Al acted
to hinder sintering of Co nanoparticles and also had the highest number of active sites.
Additionally, the found that higher precipitation temperatures resulted in smaller Co3O4
nanoparticles. Torrente-Murciano et al. (107) demonstrated that microporous carbon
supports were able to stabilize small Co nanoparticles and that ammonia decomposition
activity was hindered by the addition of Cs, which is similarly observed for other non-
metal catalysts, but deviates from the relationships established for Ru based catalysts.
1.2.4 Surface Sensitivity
Both ammonia decomposition and synthesis are both structure sensitive reactions,
which can be studied initially by measuring the reactivity of single crystals in ultra-high
vacuum (UHV). Different surfaces will have different reactivities and product distributions
reflect the difference active sites present on each surface. Strongin et al. (108) determined
initial rates of ammonia synthesis over Fe(111), Fe(100) and Fe(110) surfaces and studied
the effect of potassium over these crystal orientations under UHV reaction conditions.
Fe(110) showed no activity for ammonia synthesis with adsorbed K, and the
addition of K drastically increased the reaction rates over the (111) and (100) surfaces by
inducing changes in the reaction order with respect to hydrogen and ammonia. Dahl et al.
(109) studied the dissociative chemisorption of N2 on Ru (0001) surfaces in order to
determine the influence of step sites on the N2 sticking coefficient. This was accomplished
sputtering Au onto a Ru (0001) metal surface. Typically, even clean metal surfaces will
have some concentration of step sites present, especially those of high-index (110). They
were able to isolate and measure reactivity over flat and stepped surfaces by depositing Au

17
onto the Ru (0001), which would preferentially poisoning step sites. The N2 sticking
coefficient decreased by seven orders of magnitude with step sites were blocked,
demonstrating that N2 dissociation occurs exclusively over stepped sites. While geometries
of step sites cannot be physically measured or observed, density functional theory (DFT)
calculations can be used to determine N2 dissociation energies over different geometric
arrangements (111) and compared to the observed dissociation barriers from UHV
experiments (Figure1.3a). These experiments formed the basis behind determining the
most active site for ammonia decomposition. The site consists of an exposed threefold
hollow site in close proximity to a bridge site, as seen in Figure1.3b. This configuration of
Ru atoms is termed a B5 site, by the nomenclature describing statistical arrangement of
atoms first proposed by Hardeveld and Hartog (112). Since then, other works have
proposed that statistically, different Ru shapes and sizes will more likely have more B5
sites than others (113–115). However, many studies simply conclude that higher activity
of a catalyst must be due to more B5 sites present, either through electronic modification
with a promoter or higher degree of metal dispersion.
1.2.5 Electronic and Structural Modification
The addition of different additives, specifically alkali metals, alkaline earth metals
and lanthanide metals have shown to dramatically enhance activity. Ru catalysts promoted
with K, Cs or Ba have shown to be very active for ammonia decomposition (116–118).
The role of promoters is often unclear, whether they promote the formation of B5 sites,
accelerate the recombination and desorption of nitrogen, or some combination of the two
(119). The role of the promoter also varies significantly based on the promoter precursor,
metal precursor and support used during synthesis. One study has shown that K is the best

18
promoter for Ru/Al2O3 catalysts (118), while another demonstrated that Na is most active
for Ru/CNT (120). The acidity of the support can thus influence the interaction between
the promoter and the support and also influence the optimal loading (61, 121). Yu et al.
(122) studied the effects of alkaline earth metal amides for ammonia decomposition and
found that Ru-Ba(NH2)2 and Ru-Ca(NH2)2 had higher turnover rates and lower activation
energies than Ru-Mg(NH2)2 and Ru/MgO. Yin et al. (123) demonstrated that KNO3
modified Ru catalysts were highly efficient went supported on CNT, but not as effective
supported on MgO. Zhang et al. (124) compared Ru/MgO catalysts promoted with Cs- or
K- from carbonate or nitrate sources, and found that CsNO3 resulted in the most active
catalyst, albeit differences in the four promoted catalysts were very small. It is difficult to
make direction comparisons across the literature due to the large differences in operating
conditions and variations in synthesis parameters. For example, these two studies that both
looked at KNO3 modified Ru catalysts resulted in one with an activity of ~25% at 450°C,
and the other 40% at the same temperature and space velocity.
Figure 1.2. (a) Dissociation and desorption barriers for nitrogen interaction with Ru
(0001) surface. TS is the transition state. (b) Sketch of the active site for nitrogen
dissociation (black atoms) at the Ru (0001) step as found by DFT calculations. Adapted
from ref (109).

19
The differences in promoter activities may be due to residual precursor ions present
on the catalyst surface. Wang et al. (61) studied the effect of different electron withdrawing
groups (F-, Cl-, Br-, SO42- and PO4
3-) from different promoter precursors on ammonia
decomposition for Ru/CNT catalysts. They found that KNO3 had the highest activity and
lowest activation energy, and activity trends were as followed: NO3- > OH- > CO3
2- > F- >
Cl- > Br- > SO42- > PO4
3-. Murata et al. (121, 125) also studied the effect of residual Cl-
from RuCl3 precursors and found that it was detrimental to activity, but that alkali or
alkaline earth metal hydroxides can act as scavengers for the chlorine ions. This has led to
the use of other Ru precursors like Ru2(CO)12 and Ru(acac)3 which are more sterically
hindered and will enhance the metal dispersion of the Ru particles compared to RuCl3. The
effect of lanthanides on Ru based catalysts have shown to have a stronger promoter effect
than alkalis (126). Lanthanide promoter mechanism may involve anchoring Ru particles to
the support while additionally providing electron donation.
1.3 High Throughput Experimentation (HTE)
Few studies are comprehensive enough to provide a legitimate comparison across
different catalysts due to the broad variation that is present in operating conditions and
synthesis parameters. The variables include but are not limited to catalyst structure, surface
area, metal dispersion, and interactions between the metal, promoter and support. To
further complicate matters, these variables are all intertwined and correlated, thus making
it difficult to deconvolute and make viable comparisons through different literature studies.
In addition to variables associated with catalyst synthesis, heterogeneous catalysis has the
added complexity of operating and synthesis conditions that will also influence the activity,
selectivity, and stability of various catalysts.

20
High throughout experimentation (HTE) and combinatorial sciences were first
introduced to the field of materials by Hanak in the 1970s stressing the power of parallel
synthesis techniques (127, 128). These methods contrast the previous, one at a time
approach to material discovery, commonly coined the “Edisonian” approach, due to the
sequential nature of testing that Edison performed during his discovery of the incandescent
light bulb filament. Over the following decades, these approaches to material discovery
and synthesis were integrated into academic labs and companies. For example, Creer et al.
(129) designed a multichannel microreactor for catalyst evaluation, where each of the 6
reactors were attached to a gas chromatograph. HTE can be used to rapidly synthesize,
screen and analyze a large number of materials in a short amount of time. An intelligent
design of experiment based on domain knowledge is pertinent to success. Combinatorial
methods have also been recently developed that allow one to explore multidimensional
catalyst composition and process parameter spaces at a high level of resolution. Initial high
throughput studies suffered from poor data quality and was not considered to have low
scientific value (130). However, methodologies to accurately quantify compositions,
conversions, and selectivity’s of diverse catalyst libraries now exist.
1.3.1 HTE Screening Tools
Design of Experiments (DOE) is an essential tool to HT screening and experiments.
The interactions between large number of variables and the different amounts of these
variables that are present in a catalytic system have already been highlighted by reviewing
ammonia decomposition catalysts. DOE techniques are a way to minimize the number of
experiments needed while maximizing the amount of information acquired through a pre-
determined number of variables and assessing the importance and interactions between

21
multiple variables. DOE can be useful for comparing several factors, screening for which
factors are important, determining interactions between variables, and optimizing a
response, such as activity (131). Combinatorial approaches to catalyst discovery have been
employed for reactions such as dehydrogenation (132), oxidative methane coupling (133,
134), NOx storage and reduction (135, 136), CO oxidation (137) and ethylene epoxidation
(138). DOE encompasses factorial designs, screening designs, response surface
methodologies, and analysis of variance to name a few.
Machine learning (ML) has also been utilized to significantly increase the rate of
material discovery. ML employs statistical algorithms to make connections between
important features in a dataset and makes predictions from these learned relationships (139,
140). Typically, a matrix of input features is constructed for which the algorithm can then
construct qualitative or quantitative relationships between the features and the property of
interest (141). In catalysis, ML techniques are often limited to computational data due to
the massive number of datapoints necessary to generate an accurate model. These methods
are capable of predicting a multitude of catalyst compositions (142–144). But
experimentally, these catalyst compositions are not always physically feasible to
synthesize. The limitation of time-at-a-time experimentation typical of experimental
catalysis has previously limited the feasibility of ML in this field. But when coupled with
data generated from HTE, accurate predictions of stable and synthesizable materials can
be made (145–147).

22
1.3.2 HTE Analysis Techniques
Early HTE studies in catalysis often utilized scanning probe mass-spectrometry,
infrared (IR) thermography or optical imaging techniques such as cataluminescence (CLT)
or laser-induced fluorescence imaging (LIFI) for analysis (148, 149). IR thermography is
able to detect small changes in temperature at the catalyst surface, and thus can measure
activity of exothermic reactions but cannot speciate between products. Similarly, CLT
relies on detecting chemiluminescence emission of combustion reactions and LIFI relies
on the breaking and forming of chemical bonds that can modify fluorescence of a molecule
(132, 149–153). Spatially resolved FT-IR is both quantitative and qualitative but can only
be applied to products with an IR vibration, and only when product vibrations are not
convoluted (135, 154). The advantage of these optical imaging methods is that they offer
parallel analysis of samples, but their uses are limited to specific cases. Scanning probe
mass spectroscopy and gas chromatography have also been applied to HTE analysis for
more complicated gas mixture, but can only be performed in a sequential manner, thus
dramatically increasing the time for analysis and limiting them to only steady state
applications (148, 149, 155).
1.4 Dissertation Scope
The work presented in this dissertation is motivated by the search for a low-cost
ammonia decomposition catalyst that achieves high activity at temperatures at or below
450°C. Chapter 1 has reviewed the underlying reasoning for studying catalytic ammonia
decomposition and has presented the issues in the current technology as well as a
comprehensive review of our currently knowledge. Additionally, this chapter sets up HTE

23
as the primary investigative tool for ammonia decomposition material discovery. In
Chapter 2, the details are provided for the methods and theories behind the techniques that
have been utilized for this work, which include catalyst synthesis, characterization
techniques, and the various reactor configurations used throughout the work. Chapter 3
goes into depth describing a baseline, K promoted Ru catalyst and provides understanding
of the structural and morphological changes of this catalyst before reaction, during the
working conditions, after reaction and in different synthesis environments. Chapter 4 will
discuss the selection of design catalyst design space, high throughput screening, and
characterization of the ammonia decomposition catalysts and compare the activity of these
to the baseline catalyst described in Chapter 3. General insight into the mechanism of the
catalysts will be discussed based on previous work using machine learning algorithms,
crystallite size analysis, and general trends in activity based on the different metals position
on the periodic table. Lastly, Chapter 5 will conclude this body of work and give a
conclusion and perspective on the future of this research and technology.

24
CHAPTER 2
THEORY & METHODS
2.1 NH3 Decomposition Catalytic Activity Testing and Reactor Set Up
2.1.1 High Throughput Reactor Set Up
High throughput catalytic testing was conducted using a 16 channel parallel high
throughput reactor which was previously built and optimized by the Lauterbach group
(149). The reactor is composed of four ceramic radiant heaters (3 in ID, 6 in height), each
of which heat four reactor tubes. Four on-off Proportional-Integral-Derivative (PID)
controllers were used to control the power output of each of the heaters, which are
controlled using an in-house written LABVIEW program. Additionally, the temperature in
each furnace and reactor is measured using this software. A top view of the heater and
reactor set up is shown in Figure 2.1.
Typically, each reactor is loaded with 50 mg – 500 mg of catalyst supported onto
stainless steel frits (10µm pore size, Chand Metallurgical) to hold the catalyst powders in
place within the reactor tube. In order to ensure even flow distribution between the 16
channels, a single gas inlet is split into 16 individual concentric capillary spirals and is fed
to each of the reactor channels. The flow distribution system is contained inside a heated
box. Further detailed information on this system can be found elsewhere (135, 138).

25
2.1.2 Quantitative Analysis using Spatially resolved FTIR
In order to efficiently analyze the effluent from each reactor, parallel analysis of
the product streams is required. Parallel analysis techniques primarily include optical
screening methods, which include CTL, REMPI, ecIRT, FTIR and LIFI (149, 155).
Sequential analysis using GC and MS techniques have also been used for various high
throughput systems (128, 156, 157). Unlike some optical screening techniques, FTIR
permits species identification for molecules that are IR active. Additionally, gas phase
concentrations can be measured as a function of absorbance at a given optical path length.
The incorporation of focal plane array (FPA) detectors provides the spatial resolution
Figure 2.1. Top-view of the high throughput reactor. Adapted from ref (138).

26
necessary for parallel analysis using FTIR, and thus offers an instrumental multiplex
advantage. Array detectors are massively multiplexed versions of single-element detectors,
composed of individual detectors known as pixels.
Previously, our group has developed a unique way to interface rapid-scan
interferometers with a HgCdTe (MCT) FPA detector that allows for faster acquisition and
data processing without sacrificing data quality (135, 149, 158). The imaging system
consists of a Bruker Equinox 55 FTIR spectrometer, a 128x128 MCT FPA detector (Santa
Barbara Focalplane, Goleta, CA, USA) operated at 1610 Hz and an integration rate of 0.046
ms. Spectra are taken from a range of 4000-1000 cm-1 with a spectral resolution of 8 cm-1.
A gas phase array sampling cell has been developed to ensure that each reactor stream is
kept separated, and that no cross talk between streams is possible during data acquisition.
The sampling cell consists of 16 stainless steel tubes, each capped with a ZnSe window
sealed with o-rings. The effluent from the high throughput reactor enters and exists the
sampling cell through tubing welded to the sampling cell. The tubes are then fitted with
stainless steel rectangles at both ends, with sixteen holes cut out of each side, allowing the
IR beam to enter only through the 16 stainless steel tubes. Specifically, an infrared source
is generated within the spectrometer and exits through a side port, where it is then
collimated, and expanded to enter the gas phase array. The infrared radiation exiting the
gas phase array is then focused on the FPA. More information on the design of the sample
cell as well as the optical set up can be found elsewhere (126, 138, 159). During data
acquisition, an image of the reactor gas outlet is taken, as shown in Figure 2.2. The image
contains 16,384 individual MCT detectors, or pixels, and each contains information for an
interferogram. Here, each colored circle represents photon intensity corresponding to one

27
of the sixteen reactor channels. Data acquisition is controlled through an in-house written
software named JAIMP (Just Another Image Processor) and images are recorded using
WinIR 2009 software. During acquisition, 32 frames are captured within a single image in
order to increase the signal to noise ratio. A Fourier Transform is performed on each
individual frame, and the 32 IR spectra are averaged together to obtain the final image for
one data point. Then, multiple IR spectra are averaged over for each reactor channel to
Figure 2.2. Image of raw data collected using spatially resolved FT-IR. Each colored
pixel correlates to a single interferogram.

28
obtain the final IR spectrum for each reactor channel. Figure 2.3 shows the FT-IR spectra
for the NH3 v4 deformation mode for reactor 0 from 0.1% to 1.0% NH3 after processing of
the raw data.
After data acquisition and processing, the spectra are then quantified using the
relationship established through Beer’s Law, shown in Equation 2.1.
A(v̅)=ai(v̅)bci (2.1)
The linear dependence of absorbance (A(v̅)) as a function of wavenumber (v̅), can be
correlated to the concentration of a species (ci), and allows for IR spectra to be quantified
within a linear regime. However, nonlinearities begin to arise when larger values of
absorbance are measured, but in general remans linear for measured absorbance units less
than 2 (160, 161). FTIR calibrations for ammonia decomposition were carried out via
GRAMS software and the PLS-1 regression model. Calibration points were collected in
0.1 % increments from 0.1% to 1.0% NH3 in balance Ar. The model utilizes the IR active
vibrations of NH3 that result from the symmetric and antisymmetric deformation modes
that occur at roughly 1627 cm-1. The FT-IR spectra were integrated from 1925 cm-1 to 1350
cm-1 for calibrations. Figure 2.4 shows the model results for reactor 0 and demonstrated an
R2 value of 0.997. Statistical outliers were determined for each model by determining the
Mahalanobis distance for each data point (162). Each reactor channel exhibited an R2 value
of >0.99 demonstrating an excellent goodness of fit. After a calibration model was
completed for each reactor channel, the models were validated by collecting FTIR of three
randomly selected NH3 concentrations between 0.1% and 1.0%. The results of the model
validation for each reactor channel are shown in Figure 2.5. The average relative error
ranged from 1.24% to 6.7% over the three validation points.

29
The reproducibility of the high throughput reactor has also been tested by first
running a set of reactions for their ammonia decomposition activity from 250°C to 400°C.
Next, the catalysts were randomized in different channels and the reaction was run once
more. The error between the measured activity for each catalyst at 300°C was taken to be
the standard deviation of the two different randomized reactions. The activity
measurements can be found in Table 2.1. The temperature 300°C was chosen because of
the largest distribution of temperatures that was exhibited by the catalysts. The error at
lower and at higher temperatures were much smaller than those shown at 300°C. The
smallest error was found to be 0.6% and the largest error was found to be 8.9% which can
Figure 2.3. FT-IR spectra of the v4 vibrational mode of NH3 from 0.1% (bottom) to 1.0%
(top).

30
then be assumed to be the relative error between runs using spatially resolved FTIR for
quantification of the ammonia concentration in the reactor effluent.
2.1.3 PID Tuning
A PID controller works by reading a sensor, and then computing the desired output
to control a process variable by calculating the appropriate proportional, integral and
derivative response and summing those three components to determine the output. PID
controllers have a wide variety of applications and the tuning will depend greatly on what
response is being measured and the characteristics of the output. In this case, the
Figure 2.4. Measured vs. Predicted NH3 concentrations from 0.1 – 1.0% for reactor 0
using PLS-1 regression model.

31
temperature of each furnace is being read and the output is the power output of the solid-
state relays used to supply power to the furnaces. Duty cycle refers to the ratio of the pulse
width and period of a signal. Therefore, the PID controllers regulate the duty cycle of the
solid-state relays, which in turn regulates the temperature of each furnace. The goal of the
PID controllers is to quickly heat the furnaces without overshooting the desired
temperature, and to regulate the temperature of each furnace. Accurate tuning is required
in order to confirm that wild fluctuations in temperature are minimized. Figure 2.6 shows
a block diagram for a typical closed loop system. The process variable is what is to be
controlled, such as pressure, temperature, or flow rate. A sensor is used to measure this
Figure 2.5. Model validation for each reactor channel. The black X corresponds to the
measured concentration value.

32
variable and provide feedback to the control system. The PID controller tries to minimize
the error between the process variable and the setpoint. The compensator refers to the
control system algorithm and determines the system output, which in this case drives the
heaters. This ultimately results in a closed, constant feedback loop system. The control
Table 2.1. The standard deviation (Error %) between the same catalysts after they have
been tested for ammonia decomposition at 300°C in two different randomly selected
reactor channels where the reaction conditions are: T = 300°C, 10%NH3/Ar, 30,000
mL/hr/gcat and atmospheric pressure.

33
performance will depend on the system, but in this case, it is desired to avoid dramatically
overshooting the setpoint, which can occur with very fast initial heating. An example of
the PID tunning for one of the four furnaces (Furnace 3) when heating from room
temperature to 340°C is shown in Figure 2.7.
The Proportional, Integral and Derivative components are manipulated until the
desired response is given. Here, the red trace is the process variable (PV Sensor) and the
white trace is the temperature of the furnace (Setpoint). The temperature of the furnace
exhibits ±2°C about the setpoint after settling time with this tuning setup. Furthermore, the
duty cycle of the solid-state relay exhibits a steady and constant sinusoidal response.
Additional theory behind PID control as well as heuristics for tuning can be found
elsewhere (163). However, we found that patience and trial and error approach resulted in
the best tuning of each of the individual furnaces. Additionally, we want to minimize the
percent overshoot over the set point and settling time of the process variable.
2.1.4 High Throughput Screening of Ammonia Decomposition Catalysts
Ammonia decomposition activity tests were carried out for the Ru substituted
catalysts using 200 mg of catalysts per channel under 1%NH3 in balance Ar, and a space
velocity of 30,000 ml-hr-1-gcat-1. In some instances, 10% NH3 in balance Ar was used as
the inlet concentration, and a separate calibration file for was made for each reactor channel
for this concentration of ammonia. All reactions took place under atmospheric pressure.
The reactor effluent was measured via FT-IR at intervals of 50°C from 250°C to 400°C.
For each temperature, three data points were taken, and the reported activity is the average
of these three data points, and the standard deviation is reported as the error. Catalyst bed

34
temperatures were measured using K-type thermocouples. A randomly selected channel
was left empty during each experiment to ensure the accuracy of the calibration files and
that zero conversion is observed in the empty reactor channel. NH3 conversion was
calculated using the inlet and effluent concentration of NH3 as shown in Equation 2.2.
NH3Conversion (%)= (1-NH3outlet
NH3inlet
) *100% (2.2)
Prior to activity measurements, catalysts were first heated under Ar to 450°C, and
then exhibited to a H2 reduction in 10% H2/Ar for 1 hour. Catalysts were then cooled to
250°C under Ar, where they were then exposed to NH3 and data collection took place after
ten minutes to allow the system to equilibrate.
2.1.4 Plug Flow Reactor Setup and Activity Testing
A horizontal tube furnace (MTI Corporation) was utilized as the basis for a plug
flow reactor system. The tube furnace is fit with a 3/8” OD stainless steel reactor tube. A
1/8” diameter stainless steel tube is placed inside of the reactor tube at a set distance in
order to maintain the same height of the catalyst bed for each experiment. The reactor tube
is then packed with quartz wool, followed by 250 mg – 2 g of catalyst, and topped with
quartz wool. The reactor system reaches temperatures up to 1250°C and allows for multiple
Figure 2.6. Block diagram of a typical closed loop system.

35
types of gases and concentrations to be flow through. Brooks 5850e mass flow controllers
(MFCs) were used to regulate the flow of each individual gas velocity. Additionally, the
reactor is outfitted with a back pressure regular (Swagelok) on the effluent side of the
reactor and can be pressurized up to 10 bar. The temperature of the catalyst bed is
monitored during experiments with a K-type thermocouple situated directly inside the
catalyst bed. The composition of the product gas stream was analyzed using a Shimadzu
2014 gas chromatogram (GC), equipped with a thermal conductivity detector (TCD). The
GC is equipped with a Mol Sieve 5A plot column for H2 and N2 separation. The
concentration of H2 and N2 in the product stream were used to calculate
the NH3 conversion at each temperature and were always found to be in stoichiometric
proportions. In order to determine the NH3 conversion, the extent of reaction (Xe) was first
calculated based off of the H2 concentration in the outlet and the inlet concentration of NH3
(CNH3,in) as shown in Equation 2.3. More information on the extent of reaction can be found
elsewhere (164).
Figure 2.7. Response of the PID closed loop system as a function of time for Furnace 3
and the duty cycle output of the solid-state relay.

36
CH2, out=
32*Xe
CNH3,in+Xe
(2.3)
After the extent of reaction was determined, the mole fraction of NH3 in the outlet
(𝐶𝑁𝐻3,𝑜𝑢𝑡) could be determined through Equation 2.4 and the conversion could then be
calculated following Equation 2.4.
CNH3, out=CNH3,in-Xe
CNH3,in+Xe
(2.4)
Prior to activity measurements, catalysts were first heated to 450℃ in Ar and then
subjected to a 10% H2 reduction for one hour. For catalyst activity, NH3 conversion was
then measured in 50℃ increments from 250℃ to 400℃. The catalyst bed temperature was
measured using a K-type thermocouple and the space velocity was kept constant for each
reaction at 5,400 ml/hrgcat. NH3 conversion using the support material ɣ-Al2O3 was first
measured under these conditions and found to be negligible at all temperatures.
Reaction orders were calculated by using a standard power law kinetic model as shown in
Equation 2.5, where Pi indicants the partial pressure for i=NH3, H2, N2.
r=A*exp (-Ea
RT) *PNH3
α PH2βPN2γ
(2.5)
The order for each component can then be measured by varying the concentration
of each component and measuring the rate of reaction. The power law model can then be
linearized, such that the plot of the natural log of the rate of reaction as a function of the
partial pressure of each component can be used to estimate the reaction order of each
component from the slope. Through this method, one can determine the negative or
beneficial effect the reactants and products have on the rate of reaction at a given
temperature.

37
2.2 Catalyst Synthesis
2.2.1. Impregnation Methods
Impregnation methods for catalyst synthesis is achieved by contacting a solution
containing active metal precursors with the support material, which is then dried to remove
the solvent. This can be achieved either through the incipient wet impregnation (or dry
impregnation) method or wet impregnation method (165, 166). The defining difference
between the two methods is that an excess of solution is used during wet impregnation, so
that a slurry type mixture containing the solvent, active metal precursors and support is
created, and are mixed and constantly heated. Diffusion is the main method in which the
precursors are deposited onto the support. In incipient wetness impregnation, a volume of
solution containing the active metal precursors and solvent equal to approximately the pore
volume of the support material is added to the dried support, where capillary action then
draws the solution into the pores of the support.
During this process, the impregnated support maintains a dry look on the
macroscopic scale. The catalyst is then dried until the solvent has evaporated from the
pores, and this process is repeated multiple times. Insufficient drying times or adding larger
amounts of solution than that of the support pore volume will change the method of
deposition from capillary action to diffusion, since there is no longer a capillary pressure
difference present. The process of diffusion is much slower than the rate at which liquid is
sucked into the pores of support through capillary action (166), and thus could lead to
insufficient uptake of the active metal precursors.

38
Catalysts used for the high throughput screening of ammonia decomposition were
synthesized using the incipient wetness impregnation technique and supported on SBA-
200 -Al2O3 (Catalox, 99.99%, 192 ± 20 m2/g). KCH3COO (Fischer Scientific, 98% purity),
anhydrous RuCl3 and anhydrous chloride salts of the following: Mg, Ca, Sr, Sc, Y, Zr, Hf,
Nb, Ta, Cr, Mo, W, Mn, Re, Fe, Os, Co, Rh, Ir Ni, Pd, Pt Cu, Ag, Au, Zn, Cd, In, Sn, Pb,
and Bi (Sigma Aldrich, ≥ 95% purity) were used without further modification. The support
was first dried at 120oC for 2 hours before impregnation. An appropriate amount of RuCl3,
secondary anhydrous chloride salt, and KCH3COO were mixed to obtain 3:1:12, 2:2:12 or
1:3:12 weight ratios of Ru:M:K (where M = Mg, Ca, Sr, Sc, Y, Zr, Hf, Nb, Ta, Cr, Mo, W,
Mn, Re, Fe, Os, Co, Rh, Ir Ni, Pd, Pt Cu, Ag, Au, Zn, Cd, In, Sn, Pb or Bi) and dissolved
in DI water. An aliquot of solution equal to the pore volume of the support was slowly
added to the dried support until incipient wetness was achieved. The impregnated support
was then dried at 120oC for 30 minutes, after which the process was repeated until the
entire solution was deposited onto and in the support. The catalysts were then ground, and
heated at 200oC for 2 hours, and subsequently calcined in air at 550oC for 3 hours. This
synthesis procedure was adapted from previous work performed by our group, where for a
4 wt% Ru, 12 wt% K catalyst supported on SBA-200 -Al2O3 was optimized by varying
calcine temperature and time, and then measuring their ammonia decomposition activity.
Details of this study can be found elsewhere (126).
Further catalyst studies were done in order to determine the effect of the precursor
on ammonia decomposition activity. KNO3 (Sigma-Aldrich, >95% purity), KOH (Sigma-
Aldrich, >95% purity), Ru(C5H7O2)3 (Sigma-Aldrich, 97%), and Ru3(CO)12 (Sigma
39
Aldrich, 99%) were used in lieu of the above Ru and K precursors and were synthesized
following the same synthesis procedure.
2.2.2 Strong Electrostatic Adsorption (SEA)
SEA is a unique wet impregnation synthesis technique that is used to maximize the
interactions between the precursors and support by manipulating the pH of the solution.
This enhances the dispersion of the deposited metals onto the surface support and thus
increases the amount of usable metal surface area for catalytic reactions. Ion adsorption
will be dependent on the charging of the support in aqueous solutions and can be measured
with a variety of methods (167). This is achieved by first measuring the point of zero charge
(PZC) of the support used. Below the PZC, the hydroxyl groups present on the surface of
a support will become protonated and thus positively charged at these pH values. Above
the PZC, the hydroxyl groups will become deprotonated and thus negatively charged. Thus,
by manipulating the pH of the solution, different metal cation or anion adsorption can occur
with the support’s surface hydroxyl groups (168). The adsorption of these anions or cations
occurs via strong electrostatic adsorption, hence the name of the synthesis method. The pH
where the electrostatic interaction is strongest is the targeted pH range during synthesis.
Through this method, a monolayer of precursor can be adsorbed onto the surface of the
support, which can produce incredibly small and highly dispersed nanoparticles after
reduction, which removes the precursor ligands.
Here, SEA synthesis was used to synthesize a catalyst containing 1% Ru, 12 % K
supported on γ-Al2O3 and a 4% Ru and 12% K catalyst, in order to determine the effect of
higher dispersion of ammonia decomposition activity, and to isolate the Ru species present

40
on the catalyst, as the wet impregnation methods (as will be shown later) produces a variety
of Ru species on the catalyst surface, and isolation of one proves to be difficult. Therefore,
SEA synthesis helps us target small, isolated Ru clusters during synthesis which can then
be contrasted with the activity of various Ru species made through wet or dry impregnation
techniques. The SEA catalyst was synthesized by the Regalbuto group following a
previously outlined method (169, 170). Briefly, Catalbox brand SBA-200 γ-Al2O3 was
used as a support, potassium hexacyanoruthenate (II) hydrate (Sigma-Aldrich) and
potassium nitrate (Fischer Scientific) were used as the precursors. The alkali metals are
first introduced by dry impregnation and then the Ru was introduced in sequential SEA
steps with intermittent drying and reduction at 250°C to decompose the adsorbed precursor.
2.3 Characterization of Catalysts
2.3.1 X-ray Diffraction (XRD)
XRD is a powerful tool used to determine crystal structure and various crystal
imperfections. For powdered and polycrystalline samples, a large number of randomly
oriented tiny crystals should be present for phase identification and to determine crystallite
size, strain, and faulting (171). In order for X-rays to be diffracted, materials must exhibit
long range periodic arrangement of one or more atoms which are known as crystal lattices.
There are 7 crystal families composed of triclinic, monoclinic, orthorhombic, tetragonal,
cubic, trigonal and hexagonal, and 14 possible crystal lattices, known as the Bravais lattices
which can be generated from 3-unit vectors and a set of integers commonly referred as hkl
values. Therefore, different families of crystals will result in different diffraction patterns,
allowing for phase identification based on the spacing between different layers of atoms (d

41
spacing) in the crystal and angle of diffraction. Constructive inference of monochromatic
X-rays occurs when successive planes of atoms separated by a distance d, in multiples of
n wavelengths, thus satisfying Bragg’s Law, shown in Equation 2.6. A countertop
diffractometer (MiniFlex II, Rigaku) was used for XRD measurements using a Cu-Kα X-
ray (λ=1.542 Å) source. The diffracted X-rays are collected in a small receiving slit located
on a moving counter arm. During the measurement, the counter arm turns at constant
angular velocity about the fixed sample, determined by user-defined instrument conditions.
The detector position is recorded as the angle 2theta, (the angle between the incoming and
outgoing x-rays) and records the number of X-rays at each angle that are diffracted from a
crystal. In this study, XRD patterns were typically collected between 10 and 60 2θ at a rate
of 1.5°/min and at a step scan size of 0.02°. XRD patterns were collected for each catalyst
synthesized in order to perform phase identification and to determine the average crystallite
size of the Ru species in each catalyst.
Particle size broadening can be determined using the Scherrer’s Equation shown in
Equation 2.7, where K is the shape factor, 𝜆 is the X-ray wavelength, L is the crystal
dimension, and B(2θ) is the full-width half max (FWHM).
B(2θ)=Kλ
L cos θ (2.7)
Although Scherrer’s equation was originally derived for cubic crystal systems, it can be
used as approximation for non-cubic systems when the crystal dimension L is interpreted
as the average crystallite size, since peak breadth increases as a function of 1/cosθ, and thus
becomes more pronounced at larger 2theta values. Therefore, the major hkl reflections
present at lower 2θ values were used when possible, to determine the average crystallite
size. In order to determine the FWHM, a curve fitting and data analysis program Fityk

42
(1.3.1) was used for profile fitting and baseline subtraction for each of the XRD patterns.
XRD reflections were fit using the Pseudo-Voigt approximation since peak broadening of
each reflection contains both a Gaussian (particle broadening) and Lorentzian contribution
(strain broadening).
2.3.2 Scanning Electron Microscopy/Energy Dispersive X-ray Spectroscopy
(SEM/EDX)
SEM is an electron microscopy technique that uses a beam of high-energy electrons
(typically between 5 keV – 20 keV) that are dissipated when the incident electrons hit a
solid sample and decelerate. Secondary electrons produce SEM images that can provide
information on particle morphology and texturing, as well as crystallinity and chemical
composition. Chemical compositions can be determined from photons generated from the
sample. Each element generates a characteristic X-ray when inelastic collisions occur
between the incident electron beam and electrons in discrete orbitals of an atom. The
characteristic X-ray is produced when an excited electron returns to lower energy state and
is related to the differences in energy levels of the electron, and thus is unique for each
orbital and for each element.
2.3.3 Transmission Electron Microscopy (TEM)
In contrast to SEM, TEM is an electron microscopy technique that uses a high
voltage beam that is either scattered by the sample or passes through it. The electrons that
pass through the sample are collected onto a fluorescent screen to produce an image of the
sample. The samples must be very thin in order to let electrons pass through the sample.

43
2.3.4 Fourier Transform Infrared Spectroscopy (FTIR)
FTIR is a spectroscopic technique used to obtain an infrared (IR) spectrum of a
sample or molecule. IR radiation may induce vibrational excitation, at which point a
molecule will absorb IR radiation that corresponds to the energy of these vibrations, i.e.,
resonant frequencies. Molecular vibrations are only IR active if they induce a change in the
molecule’s dipole moment. The amount of energy absorbed by the sample can be
determined by analyzing the transmitted light. Historically, an IR spectrum was collected
by passing a monochromatic beam through a sample and determining the amount of IR
radiation absorbed at each individual wavelength using a dispersive spectrometer (172).
FTIR differs by utilizing a broadband light source to collect information from all
wavelengths simultaneously. A comprehensive discussion on the FT-IR can be found
elsewhere (173).
Generally, FTIR utilizes a broadband radiation source which passes through a
Michelson interferometer, through the sample and finally to the detector. The Michelson
interferometer is responsible for modulating the polychromatic light, so that a different
combination of wavelengths is produced at each moment. A schematic of a Michelson
interferometer is shown in Figure 2.8. A Michelson interferometer is a device that can split
a beam into two separate paths and then recombine them after a path difference as been
introduced for one of the beams. This is achieved by splitting the radiation source using a
beam splitter, where the beam is partially reflected to a fixed mirror, and partially
transmitted to a moving mirror. The moveable mirror is moved at a constant velocity, and
both beams are reflected off of the mirrors and back to the beam splitter, where the
combined beams will be reflected back to the detector. There, the two beams experience
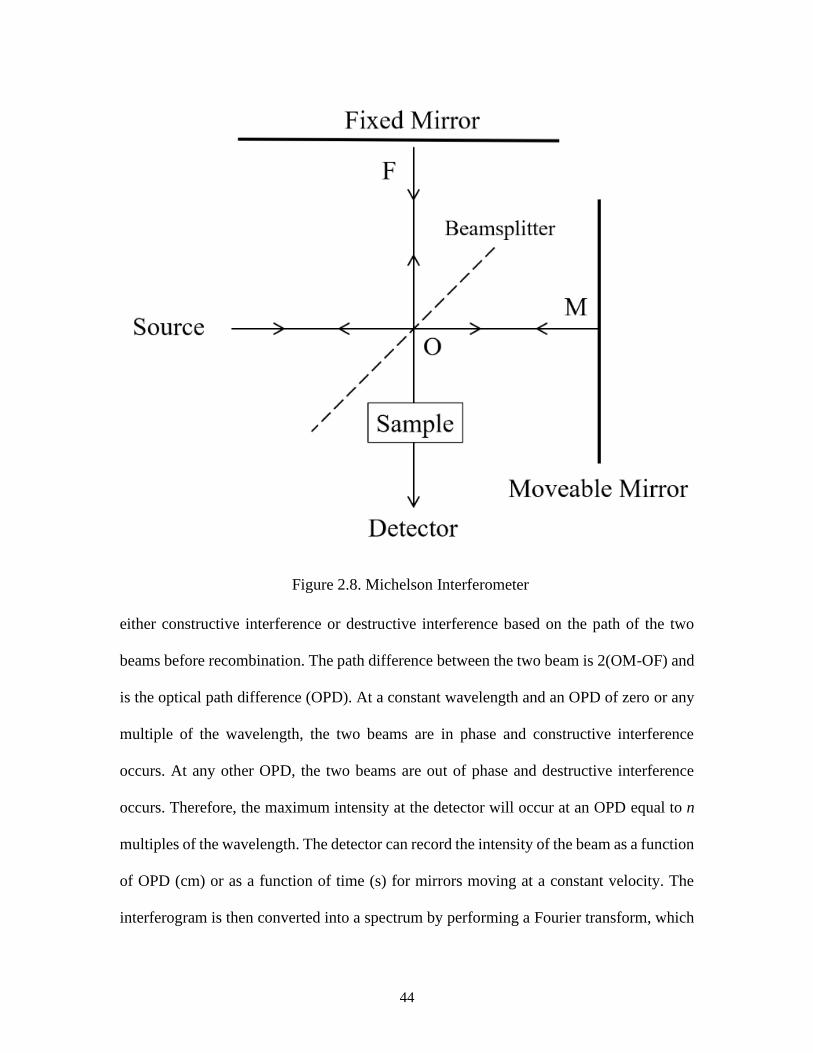
44
either constructive interference or destructive interference based on the path of the two
beams before recombination. The path difference between the two beam is 2(OM-OF) and
is the optical path difference (OPD). At a constant wavelength and an OPD of zero or any
multiple of the wavelength, the two beams are in phase and constructive interference
occurs. At any other OPD, the two beams are out of phase and destructive interference
occurs. Therefore, the maximum intensity at the detector will occur at an OPD equal to n
multiples of the wavelength. The detector can record the intensity of the beam as a function
of OPD (cm) or as a function of time (s) for mirrors moving at a constant velocity. The
interferogram is then converted into a spectrum by performing a Fourier transform, which
Figure 2.8. Michelson Interferometer

45
converts the measured light absorption at each OPD into the absorption at each wavelength.
The Fourier transform and Michelson interferometer dramatically decreases the time of
acquisition needed to collect an IR spectrum, and eliminated the need for a monochromator.
For polychromatic radiation sources, the measured interferogram is the result of the
interferograms corresponding to each wavelength in the radiation source.
2.3.4.1 Diffuse Reflectance Infrared Spectroscopy (DRIFTS)
DRIFTS is a technique that analyzes IR radiation that is scattered from a sample,
typically a fine powder or rough surface. Diffuse reflection refers to the scattering of light
from a surface in many directions, instead of at a specific angle. For a fine powder or small
particles, an incident beam can either be reflected off of the surface of a particle or
transmitted through it. A transmitted beam can then pass through another particle where it
can again be reflected or further transmitted. This method is primarily used when the
transmission of an infrared beam through a sample is not feasible.
2.3.4.2 CO Adsorption
DRIFTS can be used to investigate the nature of adsorbed species on metal surfaces
in order to gain insight into the metal surface configuration (174). The resultant stretching
frequency of CO will depend on the bonding mode of CO, the electron density of the
adsorbing metal and the metal surface configuration (175–178). Binding of CO to a metal
surface can occur either through donation of an electron pair from CO to a metal orbital
forming a σ-bond, or through π-backdonation from a metal d orbital to CO (179–182). The
later requires the metal to have d electrons and for the metal to be in a low oxidation state.
CO adsorption through π-bonding weakens the CO bond in relation to gas phase CO as

46
electrons fill the π-antibonding orbital of CO. This results in a decrease in the CO stretching
vibrational frequency compared to gas phase CO. The degree of weakening will depend on
the metal and the geometry of the adsorption site, and thus provides detail information of
the catalyst surface and can identify ensembles of catalytically active sites (183). In other
cases, the vibrational frequency of CO can increase with respect to gas phase CO with
increasing charge on the metal center, indicating a strengthening in the CO bond.
Therefore, the number of carbonyl stretches, their position and relative intensities will
provide insight into the nature of the atomic surface configuration of the catalyst.
For this study, a Bruker Vertex 70 spectrometer equipped with a Mercury Cadmium
Telluride detector (MCT), Bruker Praying Mantis diffuse reflection attachment and a high
temperature, low pressure reaction chamber were used to collect infrared spectra. Spectra
were typically collected from 4000 cm-1 to 1000 cm-1 at a spectral resolution of 4 cm-1 and
averaged over 512 scans. The reaction chamber consists of ZnSe windows and allows for
gas flow through the chamber, as well as heating up to 1000°C. The reaction chamber was
used to probe the interaction between various gas adsorbates and metal nanoparticles.
Catalyst powders were first ground with a mortar and pestle and packed into the sampling
cup (10mm dia.) without further modification. The powders are held in place with a small
stainless-steel mesh.
Prior to adsorption of CO, catalysts were first heated under He (99.999%, Airgas)
to 450°C and then subjected to a hydrogen reduction in 10% H2/He for one hour. The
catalyst was then further heated to 460°C under He for ten minutes in order to remove any
H2 than may have adsorbed onto the metal surface during the reduction pre-treatment.
Then, the powders are cooled to 50°C under inert gas where a background scan is taken.

47
Next, the catalysts are subjected to 1000 ppm CO in balance He for ten minutes. The
reaction cell was then flushed with He and an IR spectrum was collected and averaged with
the background.
2.3.5 Raman Spectroscopy
Raman spectroscopy is a vibrational technique that relies on inelastic light
scattering, or Raman scattering (RS) to gain insight into a material’s chemical structure. A
comprehensive text on Raman Spectroscopy can be found elsewhere and used primarily
for discussion here (184). In contrast to FTIR, Raman active vibrations occur based on a
molecule’s polarizability. Additionally, photons do not need to have an energy that matches
the difference in energy levels of a molecules ground state and vibration state in order to
be scattered. Raman spectroscopy utilizes a monochromatic radiation source which
interacts with a molecule by distorting its electron cloud. The polarized molecule is
promoted to a virtual energy state and the photon is then re-emitted. If the incident photon
induces nuclear motion from the molecule, energy will be transferred from the photon to
the molecule or, from the molecule to the photon and RS occurs. The strength of RS is
proportional to the fourth power of the excitation frequency. RS measures the differences
in energy between n and m vibrational states by subtracting the energy of the scattered
photon from that of the incident photon. Stokes scattering occurs when RS from the ground
vibrational state leads to absorption of energy by the molecule promoting it to a higher
excited vibrational state, n. If a molecule is present initially in an already excited state, then
this process is referred to as anti-Stokes scattering and the molecule returns to its ground
vibrational state, m and results in a negative Raman shift. Anti-Stokes scattering can be of
interest if the molecule exhibits fluorescence but is typically much weaker than Stokes
48
scattering. Intense RS occurs from vibrations which cause a change in the polarizability of
the molecule’s electron cloud. RS can also occur due to lattice vibrations of a crystal either
longitudinally or perpendicularly to the perturbation.
Raman spectra were collected using a Horiba XploRA Plus Raman spectrometer
equipped with a light microscope with 10x, 20x and 50x magnification. The spectrometer
is equipped with a Linkim TMH600 environmental cell so that in-situ and operando studies
of catalyst surfaces can be conducted. Typically, a monochromatic laser is focused onto a
sample and the scattered light is focused onto a charged couple device (CCD) that is cooled
to -70°C to reduce background noise. As mentioned previously, RS is measured as the
difference between the energy of the incident photon and the photon scattered by the same.
The intensity is measured as a function of Raman shift (∆ cm-1) at a constant excitation
source. The powder was loosely packed into the quartz crucible of the TH600 environment
cell and packed down to create as flat a surface as possible. Care must be taken in choosing
the correct excitation source, laser power, exposure time and working distance especially
in Raman experiments involving elevated heating. Since RS is proportional to the fourth
power of the excitation source, shorter wavelengths will provide stronger Raman signal.
Additionally, longer wavelengths will penetrate deeper into the sample and thus could
provide more signal from the substrate or holder than from the materials of interest.
A 437 nm excitation source was used at 15 mW. Spectra were collected by
irradiating the same for 15 seconds, followed by 15 seconds of delay to allow the sample
to cool and avoid localized heating. Five spectra were collected at each point and then
averaged together to increase the signal to noise ratio.

49
2.3.6 Temperature Programmed Reduction (TPR)
TPR is a technique that monitors a chemical reaction as a function of temperature.
The temperature is ramped linearly, and typically the gas content both before and after the
reaction is measured. In the case of TPR, typically, a known amount of diluted H2 is
introduced to the catalyst, and reduction events will occur with increasing temperature
when a reducible metal is present on the catalyst. After the reduction occurs, the reaction
between the metal oxide and H2 gas will produce H2O, and the amount of consumed H2 is
measured using a thermal conductivity detector. Heating rates are generally between
0.1°C/min and 20°C/min. Insight into the temperature at which supported metal oxides
occur can ensure that sintering is avoided, and complete reduction is reached during any
reduction pretreatment steps that occur before a chemical reaction takes place. Variations
in strong metal support interactions and the crystallite size of the supported metal oxide
will influence the temperature at which reduction events occur.
Additionally, TPR patterns can provide insight into whether the precursor salt is
still present in the catalyst. For example, TPR of Rh/SiO2 made with chloride precursors
will exhibit a higher temperature reduction of Rh-O bonds and a lower temperature
reduction of Rh-Cl bonds. Additionally, the area under the TPR curve represents the
amount of H2 consumed by the catalyst per mole of metal atoms. TPR can also indicate
whether two metals are in contact or not, specifically in the case of bi-metallic catalysts
(185).
For this work, an AutoChem II 2920 benchtop instrument was used for H2-TPR
experiments. A glass U-tube was used as the reaction vessel, which is first loosely packed

50
with quartz wool, followed by 100 – 200 mg of catalyst, and then topped with loosely
packed quartz wool. A K-type thermocouple is placed inside the catalyst bed in order to
measure the temperature of the catalyst during reaction. Before the TPR experiment, the
catalysts are first dried at 120°C for 60 minutes under Ar to remove any physisorbed water
from the surface that may misconstrue the TPR measurement. After the drying process, the
catalysts are cooled to 50°C, and subjected to 10%H2/Ar. A ramp rate of 10°C/min is
typically used, from 50°C to 600°C. H2 consumption is determined based on the moles of
metal and using AgO standard sample for calibration of the TCD.
2.3.7. Pulse Chemisorption
Chemisorption is a technique that can be used to determine active metal surface
area, crystallite size, number of active sites and metal dispersion over a support. Commonly
used gases include H2 and CO for chemisorption onto metal surfaces and knowledge on
the number of H2 or CO atoms that one active site can adsorb is necessary for analysis and
for choosing which gas to use for chemisorption experiments. The rate of uptake of a probe
gas will simply the product of the flux and sticking coefficient, assuming that the process
is non-activated. Pulse chemisorption to measure active sites and metal dispersion should
be a non-dissociative adsorption process.
Pulse chemisorption experiments are carried out on an AutoChem II 2920. samples
are first heated to 450°C under inert and exposed to a hydrogen reduction pretreatment at
450°C for one hour in 10%H2/Ar. Next, the temperature is increased slight to 460°C in
order to remove any strongly bound H2 leftover from the reduction. The samples are then
cooled to 50°C in Ar for the chemisorption experiment. A known amount of reactant gas

51
is pulsed over the sample and the amount of H2 adsorbed is measured using a TCD. The
pulses of reactant gas continue until the amount of H2 measured by the TCD is constant,
indicating that the active sites of the sample are completely saturated with reactant gas. The
result from a typical pulse chemisorption experiment is shown in Figure 2.9 for H2
chemisorption over a 4 wt% Ru, 12 wt% K catalyst supported on ɣ-Al2O3. Each pulse gets
progressively bigger until all active sites have reacted, and the pulsed gas leaves the sample
unchanged. Knowing the weight loading of the active metal in the sample, as well as the
atomic characteristic of the metal, can then be used to calculate average crystallite size
(assuming spherical particles), % metal dispersion, exposed metal surface area and the
number of active sites in a catalyst sample.
2.3.8 Arrhenius Plot
For elementary reactions, the temperature dependence on the rate constant is given
by the Arrhenius equation shown in Equation 2.8, where r is the rate of reaction (mol/kg/s),
A is a pre-exponential factor, and Ea (kJ/mol) is the apparent activation energy.
r=A*exp (-Ea
RT)
(2.8)
The apparent activation energy was measured in a diffusion limited regime and was
calculated by linearizing the Arrhenius equation and plotting the natural log the rate of
reaction as a function of inverse temperature. Due to the various diffusion and adsorption
steps associated with heterogeneous catalysis, various regimes can control the rate of
reaction, including diffusion through a boundary layer, intraparticle diffusion and finally a

52
combination of adsorption, surface reactions and desorption of products. Therefore, it is
important to measure the apparent activation energy at lower temperatures, where diffusion
of the reactants through the boundary layer and through the pores is fast compared to the
rates of the surface reactions. This ensures the measured rate of reaction used to calculate
the apparent activation energy is controlled by the intrinsic reaction kinetics (46).
A lack of linearity can be observed in the linearized Arrhenius equation when the
regime which controls the rate of reaction changes reaction kinetics (46). A lack of linearity
can be observed in the linearized Arrhenius equation when the regime which controls the
rate of reaction changes. In this study activation energies were calculated in 100% NH3 at
Figure 2.9. H2 Pulse Chemisorption over 4 wt% Ru, 12 wt% K catalyst supported on ɣ-
Al2O3.

53
a space velocity of 5,400 mL/hr/gcat between 2 – 15 % conversion. Catalysts were tested
for activation energies in two separate experiments. The standard deviation between the
two calculated apparent activation energies is given as the error, and the average of the two
measurements is reported as the apparent activation energy for each catalyst.
54
CHAPTER 3
INVESTIGATION OF THE FORMATION AND WORKING
STATE OF K-RU HOLLANDITE CATALYSTS FOR
AMMONIA DECOMPOSITION
While the activity of Ru based catalysts for ammonia decomposition is well known
to be enhanced by alkali metals and alkaline earth metals, typically these promoters are in
the range of ppm levels up to 3%. Previously we have shown that promotion of large
amounts of K (up to 36%) can be beneficial for low temperature ammonia decomposition
for Ru catalysts supported on γ-Al2O3 (118, 126). The enhanced activity was contributed
to the formation of K and Ru based hollandite structures on the surface of the catalyst.
While very little is known about supported hollandite catalysts, let alone the catalytic
properties of K-Ru hollandites, unsupported Mn based hollandite catalysts have been
thoroughly studied for a variety of oxidation reactions (186–189). Additionally, these
structures are typically synthesized via solid state reactions or through hydrothermal
synthesis methods (190–196). Therefore, it is interest to better understand the formation
mechanism of K-Ru hollandite during various impregnation synthesis techniques, variables
that influence the formation of hollandite, the working state of the K-Ru hollandite
catalysts, and whether or not the formation of the hollandite structure is beneficial to the
reaction, compared to the “ideal” Ru nanoparticle size of 1.8 to 2.5 nm, suggested in the

55
literature. Additionally, we determined that K act to promote the reaction by chemically
modifying the Al2O3 support surface, and by also acting as a Cl- scavenger, thus, mitigating
the negative effect on reactivity that free Cl- are known to exhibit for ammonia
decomposition.
3.1 Hollandite Background
Hollandite (often referred to as OMS-2 or cryptomelane type materials) refers to
both the Ba Mn oxide mineral and to a specific crystal structure that can form with various
metal cations and transition metals. These crystal structures consist of a one-dimensional
tunnel structure, where a cation such as K, Na or Ba ion occupies the tunnel sites. The
tunnel themselves are composed of 2x2 MO6 (where M = transition metal) octahedrons
that are connected through edge sharing and corner sharing oxygens and can be doped with
various transition metals. The hollandite family has stoichiometry of Ax(B, M)8O16 where
A is an alkali or alkaline earth cation, B is a trivalent cation which may or may not be
present, and M is a transition metal such as commonly used Ti and Mn. Examples include
Na-TiO2 hollandite (197), K-MnO2 hollandite (187, 194, 195, 198–200), Li-TiO2 (201), K-
Ti,FeO2 (202), Ag-MnO2 (203) and Na-VOx (204) to name a few. Hollandites have been
used for a variety of chemical reactions due to their mild surface acid-base properties and
ion-exchange properties. K-MnO2 hollandites are highly active for a variety oxidation
reactions such as CO oxidation (205–207), oxidation of ethyl acetate (208, 209), partial
oxidation (210–212) due to the presence of Mn in different oxidation states and highly
mobile lattice oxygen species (213). However there is very little information present on K-
RuO2 type hollandite aside from the crystal structure and electronic properties (214). For
simplicity, K-MnO2 type hollandites will be discussed moving forward.

56
Typically, hollandite can be synthesized through hydrothermal methods (186, 198,
215, 216) and solid state reactions. The mechanism for formation is generally thought to
occur through initial nucleation and phase ordering of the K and Mn precursors into a
layered structure, where the layers then collapse to form the 2x2 tunnel structure. Portehault
et al. (217) reported the synthesis of K-MnO2 hollandites through low temperature routes
and studied the growth mechanism. After initial mixing of the precursors for a few hours
at room temperature, the initial precipitate was found to be poorly ordered and no hollandite
peaks were from XRD analysis. After mixing at 60 or 95°C, the pH fell below 2.0 and
characteristic hollandite reflections appeared in the precipitate XRD patterns. They
determined that high acidity increased the kinetics of phase transformation. Performing the
synthesis with a mixture pH > 2.0 resulted in the early precipitate not transforming into
hollandite after one week of aging. The precipitate was indexed to the layered MnO2
birnessite phase. The authors state that growth occurs through a dissolution-crystallization
process which is pH dependent. As the pH becomes more acidic, the Mn species become
more soluble thus promoting the growth of the nanowires. However, proton chemisorption
stabilizes small particles that initially form and can limit the growth state and limit
longitudinal growth. Liu et al. (215) have also indicated that a thin, layered precursor forms
during the early stages of synthesis followed by the appearance of lattice fringes, which
indicate the formation of the hollandite tunnel structure. They conclude that the tunnel
formation occurs when some of the Mn (III) octahedra from the layered structure migrate
into the interlayer region and become corner-sharing octahedra, thus making the “walls”
of the tunnel. Gao et al. (218) performed in-situ and ex-situ studies to determine the
structural and morphological formation of β-MnO2 and K-MnO2 hollandite materials under

57
hydrothermal reaction conditions. They found that γ-MnO2 spheres with poorly defined
1x2 tunnel structures first formed and grew in size with increasing reaction time. The
spheres began forming rod like structures on the peripheral of the particles that further grew
in length with increasing reaction time and finally transformed into β-MnO2 after 240
minutes. The phase transformation was thought to occur through the collapse of the 1x2
tunnel framework of γ-MnO2 and rearrangement of the MnO6 octahedra to form a 2x2
tunnel framework.
Shen et al. (219) studied mixed valent Mn oxides through in-situ XRD. They
determined that, beginning with a layered structure precursor, the layers first compressed
and simultaneously formed a 1x 2 tunnel structure, of which increased with increasing
reaction time. After 75 minutes and reaction temperature of 180°C, some of the 1x2 tunnels
began to transform to the 1x1 tunnel structure (β-MnO2) and was completely transformed
after 150 minutes. They further studied the phase transformation of MnOOH precursor to
form K-Mn hollandite, which formed within ten minutes at 120°C. Chen et al. (220)
proposed a framework to predict the formation and mechanism for growth of different
MnO2 polymorphs based on particle size and solution composition by using in-situ X-ray
scattering. They determined that the hydrothermal synthesis of MnO2 proceeds through
different crystallization routes under different K ion concentrations. Wang et al. (186)
studied the reduction profiles for K-MnO2 (K-Hol), H-MnO2 (H-Hol) and β-MnO2 (1x1
tunnel structure). β-MnO2 exhibited three reduction peaks at 320, 350 and 450°C which
corresponded to the reduction of MnO2 to Mn2O3 to Mn3O4 to finally MnO. H-MnO2
showed two reduction peaks at 330 and 490°C which was assigned to the reduction of H-

58
Hol to Mn3O4 and then to MnO. K-Holl exhibited reduction peaks at much lower
temperatures, between 200 – 370°C.
3.2 Modification of Al2O3 with K
Alkali promoted Al2O3 catalysts are commonly used for the transesterification of
palm kernel oil, sunflower oil, coconut oil and rapeseed oil The supported alkali catalysts
can be synthesized via incipient wetness impregnation using nitrates, fluorides, iodides,
and carbonate based potassium precursors after calcining to temperatures around 450-
550°C (221–225), where K aluminates are formed as the active site for these reactions.
Potassium carbonate is commonly used to modify the acid-base properties of alumina, as
it reacts with the surface hydroxyl groups to readily form Al-OK compounds (226). K+
ions derived from K2CO3 supported on alumina have been shown to replace the surface
hydroxyl groups to form O-K compounds, but no Al-OK compound formation was
observed up to 900°C (227).
Iordan et al. (228) that K2CO3 modified alumina resulted in the uptake of K+ on
through cation exchange with isolated Al-OH groups to form Al-OK surface species. They
determined that most of the surface hydroxyl species had been eliminated by 120°C and
KAl(CO3)(OH2) surface species formed. Additionally, as the amount of potassium salt
exceeded the saturation uptake of K+, bulk potassium salts were found to form on the
alumina surface. Wang et al. (229) studied the effect of loading K2CO3, KHCO3 and KOH
on alumina and their ability to generate superbasic sites, which pH as great as 33. For
K2CO3 loadings below 10%, XRD patterns showed that no bulk K2CO3 or Al-OK species
formed, indicating a high dispersion of K. At 10 wt%, KAl(OH)2CO3 was formed, and bulk
K2CO3 began to form at loadings greater than 20%. As for KHCO3, the same Al-OK

59
compound formed as with K2CO3 between 10 -20%. Through TG-DTA and TPDE
analysis, the authors determined that the KAl(OH)2CO3 compound decomposes between
225 – 350°C, which was accompanied by the evolution of CO2 and H2O within the same
temperature regime. The authors determined that KAl(OH)2CO3 thus decomposes to form
KAlO2, H2O and CO2.. The formation of Al-OK compounds from wet impregnation has
been proposed to occur in two different manners: in one mechanism, the non-specific
adsorption of K cations occurs through electrostatic attraction to deprotonated Al-O-
surface groups, which then forms an ion pair with the positively charged K. Secondly,
specific adsorption can occur through cation exchange with Al-OH surface groups which
can form chemical bound Al-OK groups (228, 230).
Sun et al. (231) attempted to create superbasic sites on TiO2, ZrO2 and SiO2 by
loading these supports with KNO3. They were able to determine that dispersion of K nitrate
was not a function of support surface as, the highest dispersion was exhibited on the lowest
surface area, and the lowest dispersion on the highest surface area support, silica. They
determined that octahedral vacant sites present on the various supports determined
dispersion of KNO3 and proposed that K+ deposit onto the support through insertion into
the surface vacant sites which agrees with the previously cited literature. The authors
determined that only alumina and zirconia exhibit the necessary characteristics needed to
form superbasic sites.
Zaki et al. (232) found that functionalization of alumina with K resulted in the
formation of Al-OK groups, which stabilized Rh0 and prevented Al-OH reformation under
hydrolysis conditions. Additionally, they determined that the Al-OK groups were stable
during hydrogen reduction at 200°C and under exposure to H2O and O2.

60
Due to the large loading of K promoter used during this study, we investigated the
effect of K on the surface of support. Figure 3.2 shows the XRD pattern of 12 wt% K
supported on ɣ- Al2O3. KCH3COO was used as the K precursor and synthesized as
described in Chapter 2.2. In the absence of Ru, we clearly see the formation of
KAl(OH)2CO3 with the addition of K to the support (228, 233). To the best of our
knowledge, there is no information of K supported Al2O3 catalysts from using KCH3COO
as a precursor, as commonly used precursors as K2CO3 and KHCO3 as discussed
previously. Due to the variety of different vacancies that may be present in ɣ-Al2O3, the
unidentified XRD reflections may be due to different Al-OK species with different
carbonate or carbonyl type ligands, which may occur due to the two different mechanisms
of K+ adsorption that can occur on ɣ-Al2O3. No reflections related to K2CO3, KHCO3, KOH
or KCH3COO were observed. The surface area of the ɣ-Al2O3 support used here is 192±8
m2/g and has a maximum surface hydroxyl coverage of 11 OH-1 nm-2 (228, 230). This value
is an estimation of the total number of surface lattice sites present on the alumina (100),
(111) and (110) planes, assuming a defect spinel structure. It has also been reported that
the maximum uptake of K+ on alumina through deprotonation of surface hydroxyl groups
to be 13 K+ nm-2 (228, 229). Based on these theoretical values, the maximum uptake of K
in our system is 3.56 mmol, which corresponds to 42% of the total K content in the catalyst.
Figure 3.2 shows the Raman spectra for the K promoted Ru catalyst (red trace) compared
to that of the 12%K on alumina (black trace). There are few reports indicating the Raman
vibrations for the KAl(OH)2CO3 compound, however Raman shifts above 700 cm-1 have
been reported, indicating that scattering from the K-Al bond occurs at 1097 cm-1 and 728

61
cm-1, which are indicated in both Raman spectra, further indicating that the 4,12 RuK
catalyst contains the K-Al compound when Ru is added to the catalyst during synthesis.
The functionalization of the support with K gives insight in how such high loadings of
promoter are not detrimental to the catalyst activity. Typically, large loadings of promoter
are detrimental to activity, because it will begin to cover or block the active metal sites.
Instead, functionalizing the support surface with K actually enhances the basicity
of the support, which will further enhance ammonia decomposition activity (75, 124, 231,
234–236). To the best of our knowledge, using a promoter to enhance the basicity of the
Figure 3.1. XRD pattern of 12 wt% K supported on ɣ- Al2O3. The circles indicate
reflections corresponding to KAl(OH)2CO3

62
support has not been investigated in this manner previously. It would be of interest to
further explore the use of other alkali or alkaline earth metals deposited onto alumina in
order to enhance the basicity of the catalyst. However, this study is outside the scope of
this work.
3.3 Investigation of Hollandite Formation
Figure 3. shows the SEM and TEM images of two different catalysts, a baseline 4
wt% Ru supported on γ-Al2O3 catalyst (a, b) and a 4 wt% Ru promoted with 12 wt% K
Figure 3.2. Raman Spectra of (top) 4,12 RuK/Al2O3 and (bottom) 12K/Al2O3.

63
catalyst (4,12 RuK) (c,d). These catalysts were synthesized using the incipient wetness
impregnation technique. It is quite clear to see that with the addition of K, the catalyst
morphology dramatically changes. While the 4 Ru catalyst exhibits large nanoparticles that
can be indexed to RuO2, the 4,12 RuK catalyst displays nanorod structures that have been
previously been determined to be K-Ru hollandite (KRu4O8). The synthesis of this structure
through impregnation techniques has not previously been investigated. Therefore, this
section is dedicated to exploring under what conditions the hollandite structure can form
in both wet and dry impregnation.
The apparent activation energy for the 4 Ru and 4,12 RuK catalyst were measured
under differential conditions (2-12% conversion) under 100% NH3 and at a space velocity
of 5,400 mL/hr/gcat. The Arrhenius plot for both the 4 Ru and 4,12 RuK catalysts is shown
in Figure 3.. The 4 Ru catalyst had an apparent activation energy of 125.2 ± 8.9 kJ/mol,
while the 4,12 RuK catalyst had an apparent activation energy of 65.7 ± 7.7 kJ/mol. Other
Figure 3.3. Left panel: SEM images of (a) 4 Ru/Al2O3 and (b) 4,12 RuK/Al2O3. TEM
images of (b) 4 Ru/Al2O3 and (d) 4,12 RuK /Al2O3. Right panel: corresponding XRD
patterns of (e) 4 RuK/Al2O3 and (f) 4,12 Ru/Al2O3.

64
apparent activation energy for Ru based catalysts have been reported within the range of
87.9 – 155 kJ/mol (82, 237–239). The decrease in the apparent activation energy with the
addition of K suggests that K electronically modifies the Ru active sites.
3.3.1 Effect of Precursors on Catalyst Composition and Activity
Different precursors were chosen in order to determine which K and Ru precursors
would result in hollandite formation following the incipient wetness impregnation method.
Specifically, two Ru precursors, ruthenium acetylacetonate (Ru(acac)3) and ruthenium
chloride (RuCl3) and three K precursors, potassium acetate (KCH3COO), potassium
Figure 3.4. Arrhenius plot for 4 Ru (filled diamonds) and 4,12 RuK (open diamonds).
Reaction conditions: 100% NH3, 5,400 mL/hr/gcat and atmospheric pressure.
Measurements were conducted under differential conditions.

65
hydroxide (KOH) and potassium nitrate (KNO3) were chosen and each combination of the
six different precursors were investigated through XRD for phase identification and were
also subjected to activity measurements. Due to the complexity and polycrystallinity of the
patterns, phase identification was primarily determined using the major phases for the
variety of components in each catalyst. When necessary, the minor reflections at higher
2Theta values were used to conclusively determine phases. Highly crystalline KCl is seen
in each pattern synthesized using RuCl3 as the Ru precursor, as indicated by reflections at
28.33°, 40.49°, 50.14°, 58.6° and 66.36° (54). Additionally, the broad reflections located
at roughly 46.1° and 67.3° are from the amorphous alumina support. The major reflections
Figure 3.5 XRD patterns of 4,12 RuK catalysts synthesized with (blue trace) RuCl3,
KCH3COO, (red trace) RuCl3, KOH and (black trace) RuCl3, KNO3

66
for KRu4O8 hollandite occur at 12.58° (110), 17.81° (200), and 35.15° (121) ) (54, 118,
126, 200, 240). These reflections are exhibited in the RuCl3, KCH3COO catalyst as well as
the RuCl3, KOH sample. Additionally, these two catalysts contain a secondary phase
KRuO4, which exhibits major reflections at 17.18° (011), 26.28° (013) and 31.84° (020).
Neither KRuO4 nor hollandite appear in the RuCl3, KNO3 XRD pattern. Surprisingly, only
reflections corresponding to RuO2 are present in the RuCl3, KOH pattern, indicated at
28.13°, 34.93°, 54.15°, 57.83° and 59.28°(241, 242).
Very broad reflections appear in the RuCl3, KNO3 at 28.0° and 35.1° which may
indicate highly dispersed RuO2 nanoparticles. While Pyrz et al.(118) reported the formation
of Ru hollandite using KNO3 and RuCl3 precursors, these results were not able to be
reproduced here. Instead, reflections at 18.9°, 23.4°, 29.4°, 32.33°, 33.06°, 34.04°, and
41.8° appear due to KNO3. Therefore, on the basis of XRD analysis, we concluded that Ru
type hollandite can be formed using both KCH3COO and KOH as precursors under the
synthesis conditions studied here. Figure 3.6 shows the XRD patterns for the three catalysts
synthesized using Ru(acac)3 with KCH3COO, KOH or KNO3. As with the RuCl3, KNO3
catalyst, the Ru(acac)3, KNO3 catalyst indexes to KNO3 but does not contain broad
reflections corresponding to RuO2. Catalysts containing KOH and KCH3COO both contain
KRuO4 and also exhibit peak broadening in the range of 50.5° to 57.1°. This may be due
to highly crystalline RuO2, however the main reflections at 28.1 and 35.0° are not present
in either pattern. No catalyst exhibited the major reflections related to hollandite while
using the Ru(acac)3 precursor.
The morphological properties of each of the six catalysts was determined using
SEM and are shown in Figure 3.7. The top figures (a), (b), and (c) correspond to catalysts

67
made with RuCl3, while the bottom figures (d), (e), and (f) correspond to catalysts made
with Ru(acac)3. For catalyst containing Ru type hollandite (RuCl3, KCH3COO and RuCl3,
KOH), we expect to see nanowhisker type structures, while those containing KRuO4
exhibit wispy, sheet like structures instead. Figure 3.7a and Figure 3.7b shows the SEM
images for catalysts synthesized with RuCl3, KCH3COO, and RuCl3, KOH respectively.
Both images show the nanowhisker structure indicative of hollandite, while Figure 3.7c
(RuCl3, KNO3) does not indicate any KRu4O8 or KRuO4 structures as confirmed by the
XRD. The small white spheres seen in the image are related to the morphology of the
support and are not due to Ru nanoparticles. This has been confirmed by SEM images of
the bare ɣ-Al2O3 support. As for the Ru(acac)3 catalysts, flat nanoneedles are seen in
Figure 3.6 XRD patterns of 4,12 RuK catalysts synthesized with (blue trace) Ru(acac)3,
KCH3COO, (red trace) Ru(acac)3, KOH and (black trace) Ru(acac)3, KNO3.

68
abundance in Figure 3.7d, and much more sparingly in Figure 3.7e. Interestingly, Figure
3.7f (Ru(acac)3, KNO3) also shows an abundance of nanoneedles (albeit wider in diameter
compared to Figure 3.7d), even though no crystalline Ru phase could be determined from
the XRD pattern. Therefore, these structures may correspond to KNO3.
Finally, these six catalysts were tested for their ammonia decomposition activity
under 10% NH3 and at a space velocity of 45,300 mL/hr/gcat.. The NH3 conversion from
250° to 400°C is shown in Figure 3.. The most active catalyst at all temperatures was the
Ru(acac)3, KNO3 which obtained 97% conversion at 400°C. The high activity of this
catalyst may be due to the formation of highly dispersed Ru particles, such that could not
be observed via XRD. Other studies have shown that using Ru(acac)3 as a precursor can
increase the Ru dispersion by 10% and enhance activity (123) which is most likely due to
the size of the precursor ligand, which would create highly dispersed Ru nanoparticles due
Figure 3.7. SEM images of 4,12 RuK supported on ɣ-Al2O3 made with (a) RuCl3,
KCH3COO, (b) RuCl3, KOH, (c) RuCl3, KNO3, (d) Ru(acac)3, KCH3COO, (e) Ru(acac)3,
KOH, and (f) Ru(acac)3, KNO3.

69
to the steric hindrance of the large ligands. The next most active catalyst was also
synthesized using Ru(acac)3 and KOH, while the least active catalyst was made with
Ru(acac)3 and KCH3COO. A different trend was observed with the RuCl3 based catalysts.
The catalysts containing hollandite (RuCl3, KOH and RuCl3, KCH3COO) showed roughly
similar performance at all temperatures, and ultimately obtaining 77% and 78%
conversion, respectively. The RuCl3, KNO3 catalyst however showed the poorest activity
of the RuCl3 catalysts. Ultimately, we see here that the effect of the precursor will greatly
influence the activity depending on which Ru precursor is used. Insight into why this may
be the case is beyond the scope of this study. Here, we are further interested in studying
Figure 3.8. NH3 conversion of various 4,12 RuK catalysts synthesized with different
precursors. Reaction conditions: 10%NH3/Ar, 45,300 mL/hr/gcat and atmospheric
pressure.

70
the precursors that are able to form hollandite, and that are also inexpensive. The high cost
of the Ru(acac)3 precursor limits its practical application and thus RuCl3 will be continued
to be used in combination with KCH3COO precursor herein.
3.3.2 Influence of Synthesis Method
Three different synthesis methods were investigated for hollandite formation.
Hollandites are typically synthesized via molten salt reactions, solid state reaction, flux
method or through hydrothermal synthesis methods. Additionally, there is only a single
report of hollandite synthesized for support catalysis. Typically, hollandite structures are
utilized for various oxidation reactions but are not supported (195, 201, 206, 243, 244).
Therefore, we further investigated under what conditions the hollandite structure could
form with supported catalyst synthesis methods. These include wet impregnation method
(WI), incipient wet impregnation (IWI) and strong electrostatic adsorption (SEA). The
methods for each of these synthesis procedures can be found in Chapter 2.2. After
synthesis, XRD patterns of each of the three catalysts made with the three different
synthesis methods were collected and are shown in Figure 3.. We see with the incipient
wet and wet impregnation methods, we are able to form the KRu4O8 hollandite phase, but
is not the case with the SEA synthesis method. The SEA synthesis catalyst instead exhibits
a strong KNO3 reflection at 28.02°. This indicates that the reduction of the precursor
ligands was not complete during the synthesis method.
The primary difference between the SEA synthesis method with the dry and wet
impregnation method is the fact that the two precursors are deposited at two separate times
and not at the same time, as with the dry and wet impregnation methods. This opens up a

71
variety of questions that will be explored in later sections. Primarily, we are interested in
determining whether or not sequential impregnation can also result in hollandite formation,
as is seen with the co-impregnation synthesis used with the incipient wet and wet
impregnation methods here. Additionally, we want to further understand of certain
parameters specific to each the dry and wet impregnation influence the formation of the
hollandite structure and will be the focus of the rest of this section.
KRu4O8 ° KRuO4 KCl KNO3
° °
°
°° °
°
° °
° °
°
°
Figure 3.9. XRD patterns for the three different synthesis methods of 4,12 RuK. From top
to bottom: incipient wetness impregnation (IWI), strong electrostatic adsorption (SEA)
and wet impregnation (WI).

72
3.3.3 Effect of Dilution Volume
The effect of the metal concentration impregnated during each aliquot of the
incipient wetness impregnation method was investigated to determine if this variable
influences the active metal phase formation or the ammonia decomposition activity. As the
solution volume increases, the number of impregnations increases, and the amount of metal
deposited per impregnation will decrease. This may help enhance the dispersion of the
active metal or limit the formation of hollandite. The volume of the impregnation solution
was varied from 5 mL, 6 mL, 8 mL, 12 mL and 20 mL, for a catalyst containing 4 wt% Ru
and 12 wt% K using RuCl3 and KCH3COO precursors. Table 3.1 shows the amount of each
metal contained within one aliquot of solution, and the total number of impregnations
performed for each catalyst synthesis. The volume for one aliquot of solution (one
impregnation) is determined by the pore volume of the support used. Figure 3. shows the
XRD patterns for the five different catalysts. It is obvious that the solution volume
influenced the formation and relative amounts of KRuO4, and Ru based hollandite KRu4O8.
This is highlighted in the insert, which shows that the KRu4O8 (200) plane increases with
increasing solution volume in relation to the KRuO4 (011) plane, and then disappears at
the highest solution volume of 20 mL. The average crystallite size for KRuO4 and KRu4O8
was calculated for each of the XRD patterns using Scherrer’s equation given in Equation
2.7.
The FWHM was determined by fitting each reflection to a pseudo-Voigt profile
using Fityk peak fitting software. The average crystallite size and the ratio of the FWHM
of KRuO4 (001) to KRu4O8 (200) are given in Table 3.. Interestingly, the largest crystallite
size of 34.38 nm was observed in the 20 mL catalyst, which also had the lowest

73
concentration of metal per impregnation. This suggests that after evaporating the water out
of the pores of the support, the metals become mobile and agglomerate during the
subsequent impregnation after water is reintroduced into the system. Alternatively, large
particles may form from Oswalt ripening during the calcine process. The smallest
crystallite size for both KRuO4 (28.50 nm) and KRu4O8 (18.09 nm) was observed in the 6
mL solution volume catalyst. The relative ratio of the FWHM of the two Ru species gives
us insight into the relative composition of each in relation to each other. The 6 mL sample
also exhibited the lowest ratio, indicating more KRu4O8 present than KRuO4, while the
largest ratio was seen in the 5 mL solution volume sample. There did not seem to be a
direct correlation between either particle size or Ru species formation to the dilution
volume, although it heavily influenced the presence of each. However, due to the
anisotropic nature of these particles, averaging the various planes may not result in useful
crystallite information. Instead, the ratio of the FWHM of the KRu4O8 (110) to the (200)
plane shows that as the solution volume increased, the ratio of the two planes decreased
until the hollandite was no longer formed. XRD can only provide information on the
various crystallites that are present within the hollandite particles and does not give us
Table 3.1. Average crystallite size for various 4,12 RuK catalysts synthesized with
different impregnation volumes

74
insight into the variation in the hollandite morphology, and how the aspect ratio changes
as a function of solution volume. Further insight into the morphological changes of the Ru
species can be observed in the SEM images shown in Figure 3.11.
The K promoted catalysts are shown against a unpromoted 4 wt% Ru catalyst
supported on ɣ-Al2O3 (4 Ru, Figure 3.11a). The aspect ratio of the nanowires (Figure
3.11b-f) dramatically changes with increasing solution volume. At low solution volumes,
the hollandite becomes thick and more rod like, and gradually takes on a nanowhisker
morphology, becoming more pliable, longer, and thinner. At 20 mL (f), where only KRuO4
forms, flat, short nanorods are present. The polydispersity may be due to the lower rate of
reactants mixing with higher dilution volume, or dependent on the concentration of K+
which could vary depending on the concentration of Al-OK and KCl that forms (217). It
has also been shown that the crystallization process for Mn tunneled structures is highly
dependent on the ratio of MnO4- to Mn2+
(245). Figure 3.a shows the activity of the five
different 4,12 RuK catalysts compared to an unpromoted 4 Ru catalyst. The activity
measurements were conducted under 1% NH3 in balance Ar at a space velocity of 30,000
Table 3.2. Average crystallite size for various 4,12 RuK catalysts synthesized with
different impregnation volumes.

75
mL/hr/gcat and at atmospheric pressure. Figure 3.b shows the relationship between activity
and the dilution volume for the five different 4,12 RuK catalysts. At all temperature, the 6
mL catalyst showed the best performance, which coincided with the smallest average
particle size and smallest ratio of KRuO4 to KRu4O8. At 300°C, the activity begins to
decline at dilution volumes greater than 6 mL, indicating an optimal dilution volume for
this system under study.
Figure 3.10. XRD patterns for the 4,12 RuK catalysts synthesized with different
solution volumes from top to bottom: 20 mL, 12 mL, 8 mL, 6 mL, and 5 mL. The insert
shows the 2 Theta values from 10 – 20 deg to highlight the relative intensity of KRuO4
and KRu4O8.

76
3.3.4 Effect of Impregnation Order
During the co-impregnation synthesis method, the active metal Ru and promoter K
are typically impregnated together. In order to determine if a synergistic effect occurs from
mixing of the two components during synthesis, we conducted sequential impregnation of
K followed by Ru and sequential impregnation of Ru followed by K onto ɣ-Al2O3. For
sequential impregnation, either Ru or K only was first impregnated onto ɣ-Al2O3 following
the synthesis procedure outlined in Chapter 2.2. After the calcine step, the second metal
was then impregnated onto the calcined support and was then again dried at 200°C for 2
hours, and subsequently calcined in air at 550°C for 3 hours. The nomenclature for these
two catalysts will include brackets to indicate which metal was impregnated first. For
example, 4,12 (Ru), K indicates that Ru was first impregnated, calcined, and then
impregnated with K and calcined again. The effect of impregnation order on catalyst
Figure 3.11. SEM images of 4,12 RuK catalysts compared to (a) unpromoted 4 wt% Ru.
Synthesized with (b) 5 mL, (c) 6 mL, (d) 8 mL, (e) 12 mL or (f) 20 mL of solution during
the incipient wetness impregnation synthesis.

77
morphology was investigated using SEM and XRD. Figure 3.a shows the XRD patterns
for 4,12 (Ru)K (red trace) and 4,12 Ru(K) (black trace) compared to the typical co-
impregnated 4,12 RuK catalyst (blue trace). The 4,12 (Ru)K catalyst showed reflections
corresponding to KRu4O8 as well as KRuO4 and RuO2. Interestingly, the relative intensity
of the RuO2 reflections is much larger than that of KCl, which is typically the most intense
and sharp reflection exhibited in the XRD patterns. Interestingly, the XRD pattern for 4,12
Ru(K) shows that no KCl formed during the synthesis, even though RuCl3 was used as the
Ru precursor. This is highlighted in Figure 3.b, where the tailing on the left side of the KCl
(110) peak in the 4,12 RuK catalyst may be from very small, highly dispersed RuO2
nanoparticles, while the 4,12 Ru(K) catalyst shows no indication of KCl formation, but
also shows highly dispersed RuO2 in relation to the 4,12 (Ru)K catalyst. Additionally, the
catalysts synthesized from sequential impregnation show more prominent reflections from
Figure 3.12.(a) Activity of the 4,12 RuK catalysts synthesized with different dilution
volumes, compared to unpromoted 4 wt% Ru. Reaction conditions: 1% NH3/Ar, 30,000
mL/hr/gcat and atmospheric pressure. (b) Ammonia conversion as a function of catalyst
dilution volume at 300°C and identical reaction conditions.

78
the Al-OK species discussed in Chapter 3.2. The intensity of these peaks is overshadowed
by the formation of KCl and KRu4O8 and KRuO4 in the co-impregnated catalyst.
Varying the impregnation method gives us insight into how the hollandite may form
during the impregnation synthesis method. In typical hollandite hydrothermal synthesis for
KMn4O8, it has been shown that a layered precursor phase is first formed that transforms
to KMn4O8 or in some cases different polymorphs of MnO2 (218, 220, 246, 247). Due to
the chain like nature of the precursor RuCl3, this may be a feasible mechanism of formation
for Ru based hollandite synthesized through incipient wetness impregnation. RuCl3 will be
partially hydrolyzed in water, and the negatively charged ligands could form an ion pair
with K+ in solution, forming the basis for a layered Ru-K compound. This would suggest
that the support does not provide nucleation sites for the formation of hollandite. However,
the formation of hollandite by sequential impregnation of Ru followed by K, suggests that
this may not be the case. Gao et al. (218) showed the structural evolution of MnO2 materials
prepared at 140°C at different reaction times. They observed that spherical particles first
Figure 3.13. (a) XRD patterns of 4,12 RuK catalysts synthesized by sequential
impregnation compared to co-impregnation method (blue trace) and (b) enlargement of
the XRD patterns to highlight the KCl (110) reflection.
79
formed and grew in size with increasing reaction time. Over time, short rod-like structures
began to protrude from the surface of the spheres which grew in size with increasing
reaction time, to finally transform from ɣ- (MnOOH) to β-MnO2 (1x1 tunnel). Figure 3.
shows the SEM images of the 4,12 Ru(K) (Figure 3.a) and 4,12 (Ru)K catalysts (Figure
3.b), where a similar phenomenon was seen when Ru was first impregnated onto the
support followed by K. RuO2 nanoparticles can act as nucleation sites for the formation of
hollandite, or further react with the addition of K to form hollandite and KRuO4.
3.3.5 Effect of Evaporation Temperature and Calcine Duration
Next, we determined whether or not the temperature at which the solution was
allowed to evaporate as well as the duration of the calcine treatment had any effect on the
catalyst activity, morphology, Ru species formation and average crystallite size. D’Addio
(126) studied the effect of calcine temperature and time on ammonia decomposition
activity for 4,12 RuK catalysts, and found that 550°C was an optimal calcine temperature
that resulted in the highest ammonia decomposition activity, of 350°C, 550°C and 750°C.
Therefore, the calcine temperature was kept constant in all cases at 550°C. However, the
study did not further investigate which Ru phases were present at each calcine temperature
or time. In order to study this, 4,12 RuK catalysts were synthesized using the wet
impregnation synthesis method and allowed to evaporate at either 60°C, 90°C, 120°C and
150°C. Each sample individual sample was then separated into four crucibles, and each
was either heated under air to 550°C for either 0 hr (no calcine treatment), 1 hr, 3 hr or 5
hr. Each catalyst was first heated to 200°C and held for 2 hours before being heated at

80
550°C for the aforementioned times. Each sample was then cooled to room temperature
and XRD was performed on each sample as well as ammonia decomposition activity
measurements.
The XRD patterns for all 12 catalysts are shown in Figure 3.. From this figure it is
clear that the formation of hollandite only occurs only with specific environmental factors.
Only under mild evaporation temperatures of 60°C and 90°C, was the hollandite structure
KRu4O8 able to be produced. Calcining these catalysts for up to five hours did not result in
the degradation of the hollandite. In all cases KRuO4 is present. This indicates that KRuO4
is thermodynamically favorable phase under all conditions studied. Additionally, prior
synthesis methods for KRuO4 formation have reported that the compound can be easily
Figure 3.14. SEM images of (a,b) 4,12 Ru(K) and (c,d) 4,12 (Ru)K

81
prepared from [Ru(OH)2O3]2- in the presence of chlorine in basic solution (248). The Ru
hydroxy complex can be easily formed from RuCl3 dissolved in water (249, 250) which
would produce Cl- anions, and the KCH3COO precursor acts as the base in this specific
synthesis method. In addition, KCl is easily formed, and is present both before and after
the calcine procedure. Next, the activity of each of the catalysts was tested in 10% NH3/Ar
and 30,000 mL/hr/gcat for their ammonia decomposition activity. The purpose of this
measurement was to determine whether or not the formation of some Ru species and not
others heavily influenced the reactivity. The catalysts were first reduced under 10% H2/N2
for one hour at 450°C and then allowed to cool to 250°C under inert before activity
measurements. The results are shown in Figure 3. from 250°C to 400°C (left) followed by
a contour plot showing the effect of both the calcine duration and the evaporation
temperature on activity at 300°C. The legend uses the nomenclature where the first number
indicates the evaporation temperature, and second number indicates the calcine duration.
Figure 3.15. XRD patterns of (left) catalysts calcined for 1 hr, (middle) catalysts calcined
for 3 hr, and (right) catalysts calcined for 5 hours. The temperature listed refers to the
evaporation temperature during the wet impregnation synthesis.

82
The contour plot showcasing activity at 300°C was chosen due to the largest variation in
activity exhibited by the catalysts, and because we are interested in optimizing a catalyst
for low temperature ammonia decomposition activity. Here we see that the highest activity
was exhibited by the catalyst that was synthesized at 90°C and calcined at 1 and 5 hours.
Both catalysts contained a mixture of KRuO4 and KRu4O8. The other catalyst
containing KRu4O8 was synthesized at 60°C and was in the highest relative abundance at
1 and 3 hours, and the lowest abundance with a 5 hour calcine duration. The contour plot
shows that the next highest activity catalysts were made at 60°C with calcine durations of
1 and 5 hours. Interestingly, there seems to be the poorest activity exhibited by the catalyst
synthesized at 120°C and at 3 hours, which contained RuO2 and KRuO4 and further
increases in the evaporation temperature above 90°C seemed to result in a catalyst with
poorer activity regardless of the calcine duration. Additionally, the uncalcined catalysts
Figure 3.16. (Left) Activity of the 4,12 RuK catalysts synthesized using the wet
impregnation technique where the evaporation temperature and calcine duration were
varied. The legend indicates first the evaporation temperature of each catalysts (°C)
followed by the calcine duration (hr). (Right) Contour plot showing the relationship
between evaporation temperature, calcine duration and ammonia decomposition activity
at 300°C. The legend indicates the NH3 conversion (%) at 300°C. Reaction conditions:
10%NH3/Ar, 30,000 mL/hr/gcat and atmospheric pressure.

83
(Figure 3., 60-0, 90-0 and 150-0) were tested to determine if the calcine treatment was even
necessary, and it does seem that calcining to produce the oxide phases of Ru is indeed and
unsurprisingly necessary for high activity catalysts. Interestingly we do see that the catalyst
evaporated at 150°C with 0 hr calcine time resulted in much higher activity than the other
two catalyst with no calcine time. This may be due to the fact that the precursor Ru phases
that will produce the RuO2 and KRuO4 phases are more easily reduced in the highly
reducing atmosphere of NH3 than the catalysts evaporated at 90°C and 120°C.
3.4 Influence of K Loading
While Pyrz et al. (118) discussed the effect of large loadings K on the
morphological changes of the hollandite rods as well their implications to ammonia
decomposition activity, there was little work involving the use of K loadings below 12%.
Normally promoter loadings are in the range of ppm to levels to roughly 3% or 5% of the
total weight of the catalyst. With higher loadings of promoter with respect to the active
metal component, there is a risk of covering the surface of the active metal with the
promoter, and thus lowering the activity by blocking the active sites. This has been
exhibited in Cs promoted Ru decomposition catalysts where the Cs/Ru ratio was varied
from 0 to 5, and the activity increased up until Cs/Ru = 2, and then further decreased with
increasing Cs/Ru ratios (235). Therefore, the high loading of 12% K is relatively unique,
as this a very high loading of promoter in relation to what is normally studied within the
literature. Typically, promoters may be structural promoters, in that they increase the
number of active sites present, or may be electronic promoters, in which the number of
active sites stays relatively the same, but their intrinsic activity is increased. As mentioned
in Chapter 3.2, K may act to promote the reaction may enhancing the basicity of the support

84
in addition to electronically modifying the Ru active sites (as seen by the decrease in the
apparent activation energy given in Figure 2.17).
Therefore, we did a systematic study of varying the K from 0.5% to 15% for a 1%
Ru and a 4% Ru catalyst supported on γ-Al2O3. Figure 3.17 shows the ammonia
decomposition activity of the 12 catalysts studied. The six different K loadings studied
were 0.5%, 1%, 3%, 6%, 12% and 15 % each at either 1% Ru loading or 4% Ru loading.
Two Ru loadings were chosen in order to see if the optimal K/Ru ratio varied based on the
amount of Ru for the reasons mentioned earlier. Ultimately, we would expect to see that
this ratio would be a function of the Ru loading, as the loading of Ru will affect the
crystallite size and the dispersion of the metal. Thus, lower loadings of Ru may be more
easily covered with higher loadings of K. The catalysts were run under 10%NH3, with a
space velocity of 30,000 mL/hr/gcat and at atmospheric pressure from 250°C to 450°C. The
filled symbols referred to the 4% Ru catalysts and the open symbols are the activity of the
1% Ru catalysts.
The catalysts containing 1% Ru generally were less active than the 4% Ru catalyst
on an activity basis. Figure 3.18 shows the activity as a function of the K to Ru ratio for (a)
catalysts containing 1% Ru and (b) catalysts containing 4% Ru. Interestingly we see that
for both loadings of Ru, the most optimal loading of K is 12% as previously confirmed by
Pyrz et al. (118). The most active catalyst was the 4,12 RuK catalyst composition, and the
1,12 RuK catalyst was the first most active catalyst. Interestingly, we find that the optimal
K loading is independent on the Ru loading. This suggests that the modification of support
with the K is highly beneficial to the ammonia decomposition reactivity. Pyrz et al. (118).
determined that the next optimal K loading was 18% for a 4% Ru catalyst, while we found

85
that 6% promotion resulted in higher activity than with 15% K. The larger loadings of K
may act to block the Ru active sites or may cause bulk crystallization of K2CO3 or other K
carbonate species as previously mentioned. If the hydroxyl groups located on the surface
of the Al2O3 can participate in ion exchange with the K cations in solution, then by utilizing
the same support, the same interaction and utilization of K will occur regardless of the Ru
loading. This will help mitigate the blocking of active sites. Theoretically, the [OH]-
concentration on γ-Al2O3 has been calculated to 11 OH/nm2 (229, 230) and the theoretical
maximum K+ uptake has been calculated to be 13 K+/nm2 (228). The support used here
had a measured BET surface area of 192 ± 8 m2/g. Therefore, the theoretical maximum
Figure 3.17. Ammonia decomposition activity of catalysts with various potassium
loadings from 0.5% to 15 % in combination with either 1%Ru (1,X RuK) and 4% Ru
(4,X RuK) supported on γ-Al2O3, where X = K loading. Reaction conditions: 10%
NH3/Ar, 30,000 mL/hr/gcat and atmospheric pressure.

86
uptake of K+ during our synthesis is 3.56 mmol of K+, which is roughly 58% of the total
K+ present in the synthesis. Because the K+ can also readily interact with the Cl- ions
present from the Ru precursor, large agglomerations of crystalline K species are most likely
not deposited onto the Al2O3 as seen with other K modified Al2O3 reports at higher K
loadings. If all Cl- ions were utilized in the form KCl, that would result in an additional
2.37 mmol of K utilized, which accounts of 39% of the total K ions in solution. Therefore,
the amount of K cations that are present to deposit near Ru is not nearly as high as the
actual loading of K, as the purpose of the promotional effect of K is multifaceted and
encompasses may different aspects.
3.5 Working State of the Catalyst
While we have a better understanding under what conditions the hollandite
structure will form, we want to understand the role of the structure during the ammonia
decomposition reaction, and more importantly, what the working of the state of the catalyst
looks like and what the active site is. In order to answer these questions, a 4,12 RuK catalyst
Figure 3.18. K/Ru ratio as a function of ammonia decomposition for catalysts containing
(a) 1%Ru and (b) 4 % Ru supported on γ-Al2O3. Reaction conditions: 10% NH3/Ar,
30,000 mL/hr/gcat and atmospheric pressure.

87
was synthesized and then characterization was performed on the fresh catalyst, the catalyst
have it has been reduced at 450°C in 10%H2/Ar for 1 hr to understand the working state
before exposure to ammonia, and after exposure to ammonia (spent). Figure 3.3 shows
SEM images of the three different states of the catalyst: fresh, reduced and spent. In the
fresh catalyst we see nanowhisker formation indicative of hollandite formation. The fresh
image also shown highly crystalline block structure which have been identified as KCl
from EDX mapping (not shown).
From the fresh to the reduced images, very small, fragmented nanowires are now
present. At first glance, they are not present at the 3µm scale, but require much larger
magnification to see. The wires are segmented and much more wormlike in nature.
Additionally, in these reduced images we cotton ball like structures on the surface of the
support. These have been separately identified to be apart of the support, as they are also
present in SEM images of just the bare γ-Al2O3 without any modification. In order to
determine the nature of these segmentations, elemental analysis was performed. The results
Figure 3.3. SEM images of 4,12 RuK catalysts (left) fresh, (middle) reduced and (right)
spent at two different scales (top) 3 µm and (bottom) 1 µm.

88
of the mapping are shown in Figure 3. following the characteristic X-rays of Al, O, Cl, K
and Ru. The segments are composed primarily of Ru, which exhibits the most intense
signal from the mapping, and interestingly the segments are also covered in Cl.
Additionally we see that after the H2 reduction is K is littered all about the surface of the
catalyst, which is to be expected as the K modifies the surface of the support as discussed
previously. Lastly, we can determine from the mapping that the nanowire structure is not
in an oxide phase, as the only O signal present is from that of the support.
This provides some information on the working state of the catalyst already. After
the H2 reduction, the well structure nanorods presumably decompose into Ru and Cl
containing nano worms. After exposure to ammonia, the worm shapes further break apart
into small segments and clusters as seen in Figure 3.3 spent. The corresponding TEM
images for the fresh, reduced and spent nanorods are shown in Figure 3. where two
different scales are shown. The TEM images further highlight the structuring the nanorods
in each of the three cases. The fresh nanorods exhibit for well-defined and straight ordering,
while dendritic like branching and clear segmentation is exhibited in the reduced nanorods.
Lastly the spent rods show much more agglomeration compared to the reduced
rods, however the segmentation persists. This demonstrates that further that the
segmentation is present after exposure to ammonia and the structural changes may be the
reasoning for the enhanced activity of these structures. In order to determine differences
in the three different states, the average diameter of the nanorod in each of the three cases
was determined by measuring the multiple nanorods via TEM for each sample. Figure 3.
shows the distribution of rod diameter for the fresh, reduced and spent catalysts, where an
average of 100 rods were counted for each case. Each histogram is then fitted with a

89
Gaussian curve to visualize the distribution of diameters. The average diameter decreases
from the fresh to the reduced case from 28.0nm to 23.7 nm, and then stays relatively the
same after exposure to ammonia with a diameter of 24.0 nm. This reduction in diameter
suggests that the initial hollandite nanorods decompose during the reduction to produce
metallic Ru rods. This would occur via migration of K+ out of the center of the tunnels. The
diameter of the reduced state and that of the spent state suggests that the morphology of
these segmented rods is highly stable during the reaction conditions since we do not see
dramatic differences in the sizes. The elemental mapping in Figure 3. does indeed suggest
that the surface of the Al2O3 is littered with K+ after reduction.
Figure 3. shows the XRD patterns for the three catalysts. It is obvious to see that
the hollandite whose major reflections are initially present at 12.47° (110) and 17.73°
(200), are no longer visible in the reduced and spent patterns. The same goes the KRuO4
Figure 3.20. Elemental mapping of reduced 4,12 RuK catalyst.

90
reflections, which indicates that these structures are not the active sites during the ammonia
decomposition reaction. After the catalysts are reduced, reflections belonging to highly
crystalline KCl are still present, and reflections indicative of metallic. Ru appear at roughly
42.38° (002) and 44.07° (002). This indicates that both species reduce to metallic Ru during
the reduction pretreatment and that metallic Ru is the active phase during the ammonia
reaction. Additionally, the dendritic nanorods have been shown to be composed to Ru, and
thus are most likely where the reaction occurs. Additionally, the crystallite size of the Ru
(002) and Ru (101) facet for the reduced and spent patterns were calculated using
Scherrer’s equations. For the reduced catalyst, the Ru (002) facet was 16.2 nm, while that
of the spent catalyst was 14.1 nm. The Ru (101) facet for the reduced catalyst was measured
to be 15.1 nm, while that of the spent catalyst was 14.7 nm.
Figure 3.21. TEM images of 4,12 RuK catalysts (left) fresh, (middle) reduced and (right)
spent at two different scales (top) 200 nm and (bottom) 50 nm.

91
Figure 3.22. Nanorod diameter distribution for 4,12 RuK catalysts (bottom) fresh,
(middle) reduced and (top) spent. Each distribution is fit with a Gaussian function.
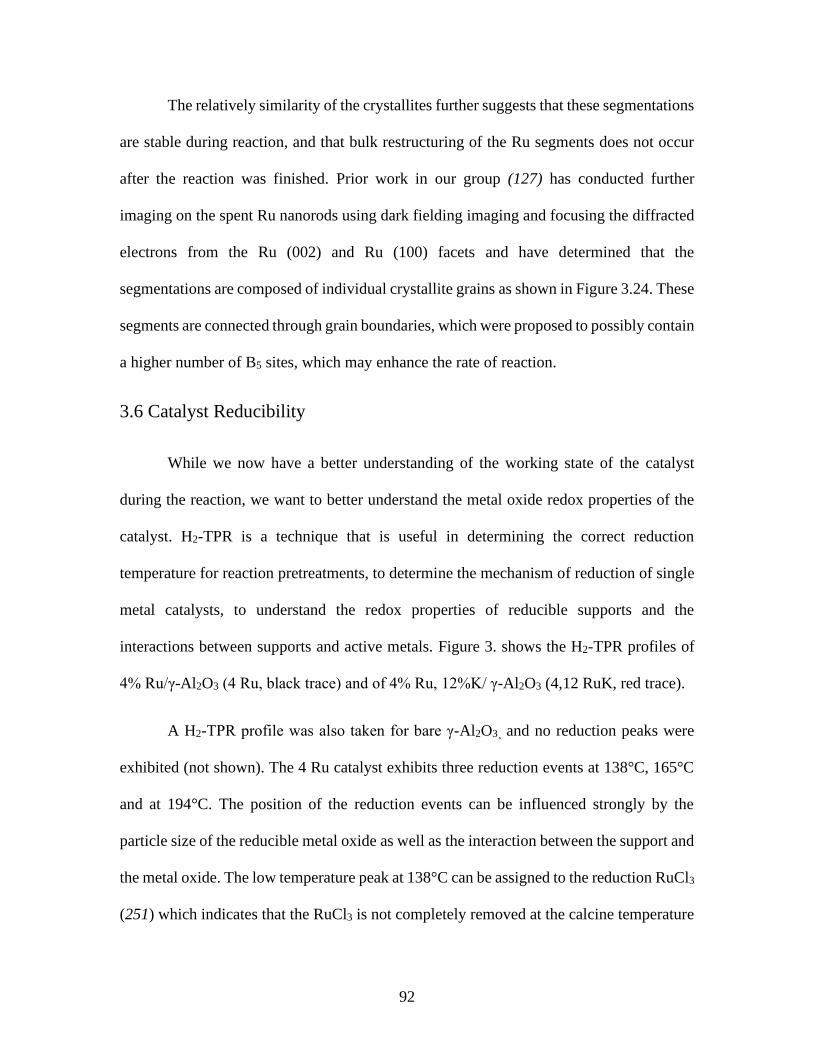
92
The relatively similarity of the crystallites further suggests that these segmentations
are stable during reaction, and that bulk restructuring of the Ru segments does not occur
after the reaction was finished. Prior work in our group (127) has conducted further
imaging on the spent Ru nanorods using dark fielding imaging and focusing the diffracted
electrons from the Ru (002) and Ru (100) facets and have determined that the
segmentations are composed of individual crystallite grains as shown in Figure 3.24. These
segments are connected through grain boundaries, which were proposed to possibly contain
a higher number of B5 sites, which may enhance the rate of reaction.
3.6 Catalyst Reducibility
While we now have a better understanding of the working state of the catalyst
during the reaction, we want to better understand the metal oxide redox properties of the
catalyst. H2-TPR is a technique that is useful in determining the correct reduction
temperature for reaction pretreatments, to determine the mechanism of reduction of single
metal catalysts, to understand the redox properties of reducible supports and the
interactions between supports and active metals. Figure 3. shows the H2-TPR profiles of
4% Ru/γ-Al2O3 (4 Ru, black trace) and of 4% Ru, 12%K/ γ-Al2O3 (4,12 RuK, red trace).
A H2-TPR profile was also taken for bare γ-Al2O3¸ and no reduction peaks were
exhibited (not shown). The 4 Ru catalyst exhibits three reduction events at 138°C, 165°C
and at 194°C. The position of the reduction events can be influenced strongly by the
particle size of the reducible metal oxide as well as the interaction between the support and
the metal oxide. The low temperature peak at 138°C can be assigned to the reduction RuCl3
(251) which indicates that the RuCl3 is not completely removed at the calcine temperature

93
of 550°C. The reduction of RuO2 nanoparticles can be assigned to the high temperature
peak at 194°C (251, 252), where the reduction of RuO2 has been reported between 450K
and 470K. The intermediate reduction temperature peak at 165°C may be due to the
reduction Ru oxychloride. Interestingly, another variable that can change not just the redox
properties, but other chemical and physical properties of a catalyst is the use of chlorine
salt precursors, and the residual Cl that is leftover on the catalyst surface after the calcine.
Figure 3.23. XRD patterns of 4,12 RuK catalysts (blue trace) fresh, (red trace) reduced
and (black trace) spent.

94
Chlorine has been found to have both negative and positive aspects to catalytic activity
depending on the reaction being studied (125, 253, 254)
Chlorine has been found to increase the dispersion of the active metal particles,
change the catalyst selectivity and activity and also can affect the rate of adsorption over
different metal surfaces (121, 125, 255). As shown in Figure 3., the working state of the
4,12 RuK catalyst is covered completely with residual chlorine. With the addition of K, the
Figure 3.24. Top (a,b) TEM images of spent Ru nanorods and bottom (a,b) dark field
imaging of the same area containing Ru nanowires. Aperture was placed over different
bright spots to illuminate corresponding crystal grains. Adapted from ref (127).

95
H2-TPR profile becomes very different from that of the unpromoted 4 Ru catalyst. Two
distinct regions appear in the 4,12 RuK profile. The first low temperature region consists
of peaks located at 120°C, 144°C and 156°C. The second, high temperature region has a
main reduction even occurring at ~345°C, with a peak shouldering the left side at ~287°C
and a much broader shouldering on the right-hand side around 350°C and an even more
broad and long reduction even at ~397°C. These high temperature reduction peaks are not
indicative or RuO2 reduction or from surface or bulk reduction of hydroxyl groups from
Al2O3. Indeed, the profile is further complicated by the fact the catalyst contains multiple
Figure 3.25. H2-TPR profile of 4 Ru (black trace) and 4,12 RuK (red trace) supported on
γ-Al2O3.

96
mixed metal oxides. The reduction of KRuO4 and KRu4O8 have not previously been
reported. In typical cases, the addition of a promoter does not change the structural
arrangement of the metal oxide. Here, from the XRD analysis, we can clearly see that
KRuO4 and KRu4O8 hollandite are two of the primary reductive metal oxides present in
the 4,12 RuK catalyst. Additionally, very small RuO2 particles may be present that are
either convoluted within other XRD reflections or are too small to be visible using XRD.
The addition of promoters to a catalyst has the capability of changing the
reducibility of the active metal when they are in close proximity to one another. Similar to
strong metal support interactions, where the charge state of the metal is altered by
interactions with the support, the charge state of the metal can also be altered by a promoter.
This is typically one reason why promoters are highly electropositive or electronegative.
Therefore, we expect to see major differences in the TPR profile with such high loading of
K present in the catalyst. With the extreme broadening exhibited, it is highly probable that
there are multiple reduction events occurring within one or both of the low and high
temperature reduction areas. Some studies have shown that low loadings of K may not
affect the reducibility of metals below 2% (256), but that higher loadings of K indeed
completely change the TPR events and add to the complexity of the profile. External H2-
TPR measurements of KRuO4 purchased from Sigma-Aldrich were taken, and multiple
reduction events between 50°C and 150°C were seen (not shown). The TPR profile for
KRuO4 exhibited multiple peak maxima at 77°C, 124°C, 145°C and 167°C. In addition,
we see with the 4Ru sample that the reduction of RuO2 also occurs within this temperature
range. The identification of the high temperature reduction events was not straightforward.

97
The TPR profiles of K-Mn based hollandite show that the reduction of K-Mn
hollandites occurs via the reduction of MnO6 octahedrons to Mn3O4, Mn2O3 and finally to
MnO2 (220). However, the Ru3O4 and Ru2O3 oxidation state are extremely uncommon
(248, 257) and therefore it is unlikely the reduction of K-Ru hollandite occurs through a
similar mechanism. However, it is possible that Ru based hollandite reduces by
transitioning through multiple oxidation states. From the H2-TPR the hollandite reduction
event may occur at the high temperature reduction event between 287°C and 397°C,
however further experimentation is needed in order to determine this. To begin, the H2-
TPR profile of 12K/Al2O3 should be probed in order to determine if the carbonates from
the KAl(CO3)OH2 compound are responsible for the high temperature reduction peaks.
In order to gain insight into the reduction mechanism of the catalyst, in-situ XRD
was performed to follow the reduction of the hollandite KRu4O8 and KRuO4 complexes by
monitoring the major phases of both complexes as a function of time. The measurements
were taken while flowing a stream of 5%H2/Ar over the catalyst bed. The temperature of
the catalyst bed was increased in 25°C increments from room temperature to 450°C, and
the temperature was held constant while each measurement was being performed. Next,
the catalyst was allowed to dwell for 30 minutes at 450°C, where another measurement
was taken. Finally. the catalyst was allowed to cool under inert back to room temperature
where a final scan was taken. The XRD patterns are shown in Figure 3.. The XRD
measurements were taken at a scan rate of 2°/min from 10° to 60°. Additionally, each
pattern contains a major reflection of α-Al2O3 at 25.8° which is from the corundum sample
holder.

98
The major reflections for KRuO4 are present at 17.2°, 26.38° and 31.8°, while
KRu4O8 reflections are present at 17.8°, 31.15° and 46.1°. The major reflections at the
smaller 2 Theta values are overshadowed by the highly crystalline KCl, and therefore are
shown more clearly in Figure 3.27. Additionally, we can see here that the reduction of these
two Ru compounds occurs at relatively low temperature. We see a decrease in the relative
intensity of these major reflections, which then completely disappear by 175°C. The
disappearance of these peaks is also accompanied by the formation of a new reflection
located at roughly 44.4°, which can be clearly seen in Figure 3.27. This reflection can be
Figure 3.26. in-situ XRD patterns for 4,12 RuK during H2 reduction in 5%H2/Ar from
25°C to 450°C. After the last measurement at 450°C, the temperature was held for 30
minutes and a second measurement was taken. The catalyst was then allowed to cool to
room temperature under inert and the final measurement was taken (RT).

99
attributed to the metallic Ru (101) crystallite facet, and begins to appear at roughly 175°C.
This peak continues to grow in intensity all the way up to 450°C, where it then remains
relatively constant after holding the catalyst bed temperature at 450°C for 30 minutes. In
order to quantify the changes in the Ru crystallites as a function of temperature, the FWHM
was fit for the Ru (101) facet from 175°C to 450°C and the crystallite size was calculated
using Scherrer’s equation.
Figure 3.27. in-situ XRD patterns for 4,12 RuK during H2 reduction in 5%H2/Ar from
25°C to 275°C highlighting the major reflections of KRuO4 and KRu4O8 and their
disappearance from 10°- 30°.

100
Interestingly, we also see that the FWHM of the metallic Ru reflection changes with
increasing temperature. This suggests a change in the crystallite size. In order to determine
this, profile fitting was conducted in order to fit the FWHM of the metallic Ru reflection,
which was then used to calculate the average crystallite size using Scherrer’s equation.
Because of the peak convolution between γ-Al2O3 and metallic Ru, the γ-Al2O3 was also
fit in order to properly determine the peak function for the metallic Ru. The alumina peak
was first fit in a pattern where no metallic Ru was present, using a Split Pseudo Voigt
function. An example of the fitting for the alumina peak is given in Figure 3.28, where the
Figure 3.28. in-situ XRD patterns from 41° to 49° of 4,12 RuK under 5%H2/He, showing
the growth of the Ru0 reflection as a function of temperature from 150°C to 450°C.

101
position of the Ru (101) facet is indicated on the left-hand side of the alumina peak. Shape
factor 1 was set constant to 0.0216 and shape factor 2 was set constant to 0.077 for each
fitting of the alumina peak at each temperature in order to ensure accurate fitting of the Ru
(101) facet. Next the Gaussian contribution was fit for both sides of the alumina peak at
each temperature from 175°C to 450°C. Afterwards, the metallic Ru peak was fit using a
Pseudo Voigt function. The residual is shown in order to represent the error in the fitting,
which was roughly 1 nm. The fitting for both the alumina and the metallic Ru peak from
175°C to 450°C can be seen in Figure 3.29, where the light-yellow area corresponds to the
alumina, and the orange area corresponds to the metallic Ru. Here we see in increase in the
Figure 3.29. in-situ XRD pattern from 43° to 50° at 50°C, highlighting the fitting of the
γ-Al2O3 peak before the appearance of the Ru (101) facet along with the residual of the
fit. Profile fitting of the γ-Al2O3 peak was performed using a Split Voigt function.

102
FWHM as a function of temperature, indicating crystal growth is a function of the reduction
temperature. The calculated crystal size and the FWHM for the metallic Ru (101) reflection
from 175°C to 450°C is given in Figure 3. as a function the reduction temperature. The
crystallite size increases from 7.4 nm at 175°C to 16.8 nm at 450°C. After holding for 30
minutes at 450°C, the crystal size did not change much from 16.8 nm. After cooling to
room temperature, the crystallite size decreased to roughly 15 nm.
Lastly, this experiment shows us that the large reduction even that occurs in the
4,12 RuK H2-TPR profile from roughly 250°C – 500°C is not due to the reduction of a
metal oxide. We have shown through in-situ XRD that the Ru metal oxides all reduce below
150°C, and thus the complex reduction peak in the H2-TPR from 75°C to 220°C is from
Figure 3.30. Full Width Half Max (FWHM) and crystallite size (nm) of the Ru (101) as a
function of reduction temperature. Reduced under 5%H2/He.

103
the reduction of KRuO4 and KRu4O8. Additionally, we were able to ascertain that the
particle size of the resultant active site can be controlled through the reduction temperature
of the catalyst. However further understanding of what is occurring between the
temperature ranges of 125°C to 175°C, and from above 250°C needs to be further
elucidated. To begin with this, we performed ex-situ SEM imaging of the reduced 4,12
RuK catalyst at three different reduction temperatures, 250°C, 350°C and 450°C, each of
which was subjected to a reduction in 10%H2/Ar. The images for the three reduction
temperatures are shown in Figure 3.31. At a reduction temperature of 250°C, the support
shows a sparce and homogenous covering of short nanorods. As the reduction temperature
increases to 350°C, these short rods begin to agglomerate and form more a more dendritic
covering over the support particle.
Additionally, we see that the thickness of the rods has further increased. At the last
temperature studied 450°C, the rods further agglomerate into more stalky and shorter
nanorods. These images indicate that there are dramatic morphological differences in the
active component of the catalyst as the reduction temperature changes. Even though the Ru
mixed metal oxides are completely reduced by 250°C, the morphology of the metallic Ru
species continues to change. In order to determine the consequence of these morphological
changes, the activity of the 4,12 RuK catalyst at each of these reduction temperatures were
determined. Figure 3.32 shows the ammonia decomposition activity of the catalyst reduced
at 250°C, 350°C and 450°C. The catalysts were subjected to a flow of 100% NH3 and a
space velocity of 16,200 mL/hr/gcat at atmospheric pressure. Interestingly, we see that the
catalyst reduced at 250°C and at 350°C both exhibited very similar activities, while both
having vary different crystallite sizes and morphologies, as indicated by the in-situ XRD

104
measurements and ex-situ SEM images. At a reduction temperature of 450°C, the activity
of the catalyst dramatically increases at all temperatures, while also exhibiting the largest
crystallite size. Since the metal loading of the catalyst does not change for each of these
activity measurements, the differences in activity must be due to more active sites being
present after being reduced at 450°C. Additionally, in most particle size studies, the Ru
particle size or crystallite size of interest is not studied above roughly 7 nm, while here we
look at crystallite sizes between 9 and 17 nm. Further investigation into the working state
of the catalyst at these three reduction temperatures should be done in order to determine
how the nanorod diameter distribution changes, as well as H2 chemisorption in order to
determine the number of active sites present to determine the TOF.
Figure 3.31. SEM images of the 4,12 RuK catalyst reduced ex-situ in 10% H2/Ar at three
different temperatures: 250°C, 350°C and 450°C.

105
3.7 Activity Comparison of Mixed Metal Ru Oxide Catalyst to Highly
Dispersed Ru Nanoparticles Synthesized via SEA
In order to make comparisons of our mixed metal oxide Ru based catalysts to the
more idealized size and shape of Ru particles reported in the literature (1.8nm – 2.5nm), K
promoted Ru catalysts were synthesized via SEA in collaboration with the Regalbuto
group. The catalysts were synthesized using the same γ-Al2O3 support as those made
through wet and dry impregnation methods. The SEA method allows us to control the
Figure 3.32. Ammonia decomposition activity of the 4,12 RuK catalyst reduced at three
different temperatures: 250°C, 350°C and 450°C. The legend indicates the reduction
temperature in 10%H2/Ar, followed by the calculated Ru (101) crystallite size from the
in-situ XRD measurements. Reaction Conditions: 100%NH3, 16,200 mL/hr/gcat and
atmospheric pressure.

106
particle size more efficiently, and thus in theory increase the number of edge sites present
on the Ru particles, and in turn the number of highly active B5 ensembles present, as
discussed in Chapter 1. The SEA catalyst was synthesized with the same nominal loading
as the catalyst synthesized via incipient wetness impregnation (4%Ru and 12%K) so direct
comparisons could be made in activity based on the morphology and particle size.
Figure 3.33 shows the XRD patterns for 4,12 RuK SEA catalyst after synthesis,
and after exposure to ammonia. In the fresh pattern (black trace), reflections corresponding
to Ru metal are not present, which indicate that the Ru is highly dispersed in the catalyst
and have a particle size that is below the limit of detection through XRD (< 3nm).
Additionally, the spent pattern does not shown signs of Ru reflections, which indicates that
sintering did not occur of the Ru particles after exposure to ammonia and to high
temperatures. Next, the activity of the SEA synthesized catalyst was tested and compared
to that of the incipient wetness impregnation catalyst (IWI) under identical operating
conditions. Figure 3.34 shows both the activity of both catalysts as a function of
temperature, as well as the long-term stability of both catalysts at 450°C. The catalysts
were tested in 100% NH3, at a space velocity of 5,400 mL/hr/gcat and at atmospheric
pressure. Interestingly, we found that under these conditions, both catalysts exhibited very
similar reactivity, and were found to be stable for 10 hours at 450°C. At 450°C, the IWI
catalyst exhibited slightly higher activity than the SEA catalyst of 94.2% conversion, while
the SEA catalyst exhibited 93.8% conversion. These values are roughly within error of
each other. In order to try to ascertain differences in activity between the two catalysts, the
space velocity of the reaction was tripled from 5,400 mL/hr/gcat to 16,200 mL/hr/gcat. Due

107
to the high reactivity of both catalysts, it may have been necessary to dramatically increase
the space velocity to determine differences in the two catalysts.
Figure 3.35 shows the activity of the SEA and IWI catalysts with the higher space
velocity, and in 100% NH3 at atmospheric pressure. Here we see that with the increase in
space velocity, there are dramatic differences in activity for the two catalysts. The SEA
catalyst shows a dramatic decline in activity compared to the IWI catalyst. The IWI catalyst
shows slightly lower activity at lower temperatures, but still maintains 94% conversion at
450°C. For the SEA catalyst, the activity at 450°C drops to roughly 80%. This shows that
Figure 3.33. XRD patterns of (black trace) fresh and (red trace) spent 4,12 RuK catalyst
after exposure to ammonia. Catalyst was synthesized via SEA method.

108
our mixed metal oxides exhibiting large Ru particles, are more active than what is
commonly referred to in the literature as the optimal Ru particle size for this reaction.
However, to confirm these results H2 chemisorption should be performed on both catalysts
in order to compare the TOF of the two catalysts.
Lastly, to try to explain the differences in catalytic activity that is exhibited between
the catalysts, the rate of reaction for each catalyst were fit to a simple power law model in
order to determine the reaction order with respect to NH3 and H2. The reaction order with
respect to N2 was not considered here because it has been previously shown in multiple
studies that there is no dependence on the N2 partial pressure on the rate of reaction. Figure
3.36 shows the logarithmic dependence of the partial pressure of hydrogen (top) and the
Figure 3.34. (left) Activity of the 4,12 RuK SEA (black squares) compared to the 4,12
RuK catalyst synthesized via incipient wetness impregnation (IWI) (red circles).
Reaction conditions: 100%NH3, 5,400 mL/hr/gcat at atmospheric pressure and (right) long
term stability of the 4,12 RuK SEA (black squares) and of the 4,12 RuK IWI (red circles)
at 450°C over 10 hours.
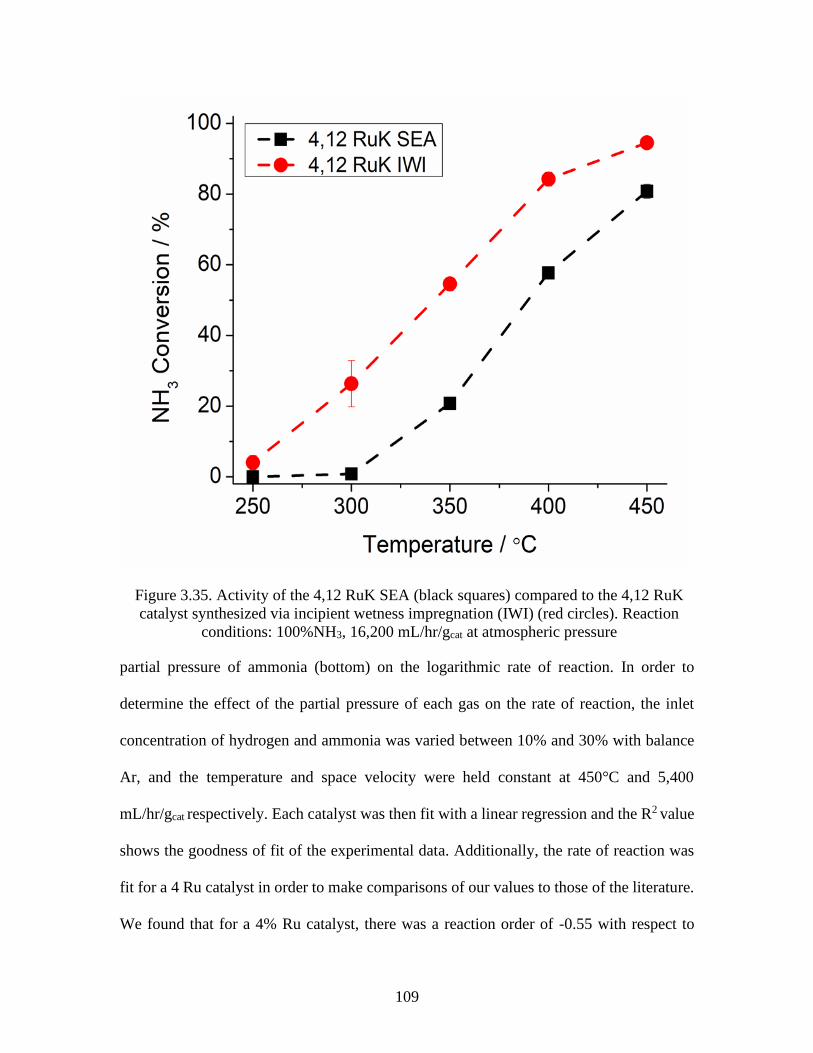
109
partial pressure of ammonia (bottom) on the logarithmic rate of reaction. In order to
determine the effect of the partial pressure of each gas on the rate of reaction, the inlet
concentration of hydrogen and ammonia was varied between 10% and 30% with balance
Ar, and the temperature and space velocity were held constant at 450°C and 5,400
mL/hr/gcat respectively. Each catalyst was then fit with a linear regression and the R2 value
shows the goodness of fit of the experimental data. Additionally, the rate of reaction was
fit for a 4 Ru catalyst in order to make comparisons of our values to those of the literature.
We found that for a 4% Ru catalyst, there was a reaction order of -0.55 with respect to
Figure 3.35. Activity of the 4,12 RuK SEA (black squares) compared to the 4,12 RuK
catalyst synthesized via incipient wetness impregnation (IWI) (red circles). Reaction
conditions: 100%NH3, 16,200 mL/hr/gcat at atmospheric pressure

110
hydrogen, and 0.40 with respect to ammonia. These correlate to similar values within the
literature, where a value -0.60 with respect to hydrogen and between 0.0 – 1.0 with respect
to ammonia have been measured in the literature (82, 83, 258). The SEA 4,12 RuK catalyst
exhibited a reaction order of -0.28 with respect to hydrogen, and 0.49 with respect to
ammonia. The IWI 4,12 RuK catalyst exhibited a similar reaction order with respect to
hydrogen of -0.26 but a much higher reaction order with respect to ammonia of 0.70. The
slight increase in the negative dependence on the hydrogen partial pressure indicates that
Figure 3.36. Reaction order determination for 4,12 RuK SEA (circles, red trace) and 4,12
RuK IWI (squares, blue trace) with respect to H2 (top) and NH3 (bottom). Reaction
conditions: 100% NH3, T= 450°C, 10-30% H2, 10 – 30% NH3 in balance Ar, 5,400
mL/hr/gcat and atmospheric pressure.

111
the inhibitive effect of hydrogen is reduced on both catalysts in comparison to the 4 Ru
catalyst. The dramatic differences in the dependence on the ammonia reaction order may
indicate differences in the rate limiting step, and further experimentation should be done
in order to elucidate the mechanistic differences.
3.7 Conclusions
This chapter investigated various synthesis methods and parameters that may
influence the formation of hollandite for supported catalysts. Firstly, we discussed how the
addition of K to γ-Al2O3 influences and chemically modifies the surface by ion exchanging
with the surface hydroxyls and showed the formation of KAl(OH)2CO3 in a K/Al2O3
catalyst. Nextly, we discussed how the addition of K influenced the catalyst compared to a
4% catalyst through apparent activation energy required for ammonia decomposition as
well as morphological differences and differences in crystalline phases present. The
addition of K induced the formation of mixed metal oxides KRuO4 and KRu4O8 which
took the form of nanowires and sheets in the SEM/TEM images. Additionally, the apparent
activation energy decreased from 125.2 kJ/mol to 65.7 kJ/mol with the addition of 12% K.
Next, we looked at which precursors were able to form the hollandite structure.
These included RuCl3, Ru(acac)3, KNO3, KOH and KCH3COO. A total of six catalysts
were synthesized and analyzed for their crystal structure, morphology and ammonia
decomposition activity. We found that RuCl3 in combination with KOH and KCH3COO
formed hollandite, but synthesis methods with KNO3 failed to produce the hollandite
structure. When Ru(acac)3 was used, no combination of Ru(acac)3 with K precursors
produced the hollandite structure. This suggests that the chainlike nature of RuCl3 is an

112
important factor in forming the tunnel like hollandite structure during impregnation
synthesis methods. These catalysts were tested for their ammonia decomposition activity
in 10% NH3/Ar at a space velocity of 45,300 mL/h/gcat and at atmospheric pressure. The
best performing catalyst was the Ru(acac)3, KNO3 catalyst at all temperatures, followed by
Ru(acac)3, KOH. The high activity of these catalysts may be attributed to the lack of Cl-
anions present which has been known to be detrimental to activity. Three different
impregnation methods were looked at to determine when hollandite will form. We
determined that dry impregnation, incipiently wet impregnation were viable methods to
form hollandite, but SEA was not able to produce the hollandite structure.
Next, variables specific to both dry and incipiently wet impregnation were studied
to further understand under what conditions hollandite can form in supported catalysts.
Firstly, the effect of the volume of the solution used during incipient wet impregnation was
investigated. The abundance of metal deposited per impregnation may have influenced the
availability of Ru to interact with K and provided insight into the growth mechanism of
hollandite. The number of impregnations was varied from 4 to 17 with a solution volume
of 5 mL to 20 mL, respectively. XRD analysis showed that the dilution volume influenced
the relative ratio of KRuO4 to KRu4O8, and that a maximum ratio was obtained with a
solution volume of 5 mL, and that the aspect ratio of the hollandite varied with the solution
volume. The most diluted impregnation did not form hollandite structure. These catalysts
were then tested for ammonia decomposition activity and a catalyst synthesized with a
solution volume of 6 mL showed the highest activity at 300°C, while the catalyst
synthesized with 20 mL of solution volume had dramatically lower activity.

113
Next the effect of the impregnation order was studied to see if both K and Ru needed
to be deposited onto the catalyst in tandem for the hollandite to form. Sequential
impregnation was performed so that K was first impregnated, calcined followed by an
impregnation of Ru and a final calcine, and then the two precursors were reversed so that
Ru was first impregnated. XRD analysis of the two catalysts showed that when first
impregnated Ru, the hollandite structure would form, but not when K was first
impregnated. Additionally, SEM images showed that the hollandite nanowhiskers seemed
to nucleate out of a single point to first starburst structures.
The factors influencing dry impregnation were then studied. These included the
temperature at which the solution was evaporated and the calcine duration. Temperatures
between 60°C and 150°C and calcine durations between 1 and 5 hours were studied. We
determined that at temperatures 60°C and 90°C, the hollandite structure would form
regardless of the calcine duration. At higher evaporation temperatures, only KRuO4 was
present, and at 150°C, RuO2 began to be present on the catalyst. These catalysts were tested
for their low temperature ammonia decomposition activity in 10% NH3/Ar and at a space
velocity of 30,000 mL/hr/gcat at atmospheric pressure. We found that catalysts synthesized
at an evaporation temperature of 90°C and calcine duration of 1 hour showed the highest
activity of the 12 catalysts at 300°C. The least active catalyst was synthesized with an
evaporation temperature of 120°C and a calcine duration of 3 hours.
We also further varied the K loading of the catalyst to determine an optimal K
loading for low temperature ammonia decomposition. K loadings were varied from 0.5, 1,
3, 6, 12 and 15% and in combination with either 1% Ru or 4% Ru, in order to find an
optimal K loading for both a high and low loading of Ru catalysts. Interestingly, we found

114
that for both 1% Ru and 4% Ru, 12% K was the optimal loading and produced the highest
activity at all temperatures when tested in 10% NH3/Ar and at a space velocity of 30,000
mL/hr/gcat at atmospheric pressure.
The working state of the catalyst was investigated to determine what the active site
during ammonia decomposition was. SEM/TEM analysis showed that there was a dramatic
reducing in the nanorod diameter and that the rods became much more dendritic and
segmented after H2 reduction and after exposure to ammonia. XRD analysis and elemental
mapping showed that the dendritic nanorods were composed of metallic Ru and contained
residual Cl- on the surface. XRD analysis showed that the hollandite and KRuO4 had
reduced to Ru0 after the hydrogen reduction pretreatment, and this was the phase present
after exposure to ammonia as well. H2-TPR was performed to understand at what
temperature the two structures reduce and compared to a 4% Ru catalyst. However, two
large broad reduction events occurred between 75°C-175°C and between 350°C and
500°C. To further understand at what temperature KRuO4 and KRu4O8 may reduce, in-situ
XRD measurements were taken under 5%H2/Ar. We determined that the two structures
reduced well below 150°C, and the reflection of metallic Ru became visible at 175°C, and
continued to become sharper and more intense with increasing temperature up to 450°C.
We determined that the crystallite size of the metallic Ru continued to increase with
increasing temperature, from 7.4 nm to 16.2 nm at 450°C and at room temperature after
the catalyst was cooled down under inert. Ex-situ electron microscopy was performed on
the catalyst after it was reduced at 250°C, 350°C and 450°C. The morphology of the
catalyst was found to dramatically change at each reduction temperature in addition to the
particle size. These catalysts were then tested for their ammonia decomposition activity in

115
order to determine if the changes in the crystallite size and morphology had any influence
on reactivity. While reduction temperatures of 250°C and 350°C resulted in similar
activities, a reduction of 450°C resulted in a much more activity catalyst, even though this
reduction temperature resulted in a catalyst with the most stalky like nanorods and largest
crystallite size.
The catalyst reduced at 450°C was then compared in activity to that synthesized
through SEA, in order to synthesize a catalyst was more along the lines of the ideal catalyst
suggested in the literature. The SEA method was able to synthesize Ru nanoparticles that
were highly dispersed on the support, and below the limit of detection via XRD. These
ideal nanoparticles as suggested by the literature were then tested for ammonia
decomposition and compared to the 4,12 RuK IWI catalyst under identical conditions and
found to be highly activity at low space velocities, but to have much lower activities
compared to the IWI catalyst at higher space velocities. We conclude that this may be due
to differences in the measured dependence of the ammonia partial pressure on the rate of
reaction. This was determined by fitting the rate of reaction to a simple power law model
in order to determine the dependence of the reaction rate on the ammonia and hydrogen
partial pressure for the SEA and IWI catalyst with identical weight loadings. Ultimately,
the dependence on the hydrogen partial pressures was similar for both catalysts, but the
IWI catalyst had a higher dependence on the ammonia partial pressure than the catalyst
synthesized via SEA. This may indicate that there are differences in the rate limiting step
over the two catalysts.

116
CHAPTER 4
HIGH THROUGHPUT SCREENING OF RU BASED
CATALYSTS
There exists a lack of diversity in the literature for promotional and active metals
for ammonia decomposition, despite the fact that this reaction has been studied for over
one hundred years. Primarily, ammonia decomposition had been studied to better
understand the ammonia synthesis reaction over Fe and Ru catalysts due to the milder
operating pressure. Now, there interest in this reaction is motivated by the fact that
ammonia can be used as a hydrogen storage and transportation device, which can
catalytically decompose to provide a source of hydrogen for PEM fuel cells. In order for
this to occur, a catalyst must be designed that is not only cost-effective but can exhibit high
activity at temperatures below 450°C in order to avoid either poisoning of the membrane
from ammonia in the effluent, or thermal degradation of the membrane from high operating
temperatures. While Ru is intrinsically the most active metal for this reaction, current
studies work to optimize Ru based catalysts through particle size and shape manipulation
and investigating various supports and promoters. However, this is strongly limited alkali
and alkaline earth metal promoters, and to basic supports such as MgO, and much more
complicated supports such as carbon nanotubes and various spinel and perovskite supports.
117
Since the pioneering work performed by Mittasch and coworkers in the early 20th
century (66) for discovery of ammonia synthesis catalysts, there has been a lack of
exploration to further define combinations of elements that work either as doubly, or triply
promoted catalyst systems or as a dual-active site catalyst to create a cost effective, highly
active low temperature ammonia decomposition. This is mainly due to the time-consuming
nature of a study of this magnitude. This is why the utilization of high throughput
experimentation allows for the testing more exotic catalyst combinations in an efficient
manner. Therefore, we sought to find a highly active low temperature ammonia
decomposition by looking at K promoted catalysts that contained either 1, 2 or 3 wt% Ru
and added one of 31 different metals to these three Ru weight loadings, in order to
determine to what extent the Ru content could be reduced while still maintaining high
activity at low temperatures. In total over 100 unique catalyst combinations were
synthesized.
However, this can be further expedited with the use of machine learning algorithms.
High throughput experimentation is perfectly suited as a means to provide large amounts
of homogeneous data as an input for machine learning algorithms, which can then either
guide a second iteration of catalyst design or provide more efficient means of screening
catalysts by lowering the number of catalysts needed to be tested within a given design
space, in order to predict the activity of the catalysts within the rest of the design space.
4.1 Ru Substitution by Transition Metals
In order to begin screening for bi-metal ammonia decomposition catalysts, various
previous and non-precious metals were chosen to replace half of the Ru content in a 4 wt%

118
Ru catalyst supported on γ-Al2O3 (4 Ru). These included Co, Ni, Fe, Mn, Zn, Mo, Hf and
Y transition and rare earth metals, the latter of which have very little information
concerning their catalytic performance in the literature. Additionally, Pt, Os, Ir and Rh
previous metals were also chosen. Very little experimental literature is available on Ru
based bimetallic or bimetal catalysts for ammonia decomposition. Here we do not claim
that these catalysts are in fact bimetallic, but simply that two metals were impregnated onto
the support. Figure 4.1 shows the catalytic activity of these catalysts measured under 1%
NH3/Ar and at a space velocity of 30,000 mL/hr/hgcat.
Except for 2,2 RuFe at 250°C, all catalyst performed poorly with less Ru compared
to the baseline catalyst of 4 wt% Ru. However, the most promising catalysts were found to
be those substituted with either Mg, Hf or Y which are not typically considered active for
catalytic reactions. Interestingly, we see that the addition of Ni resulted in one of the worst
catalyst activities, while previous literature suggests that Ni is one of the most promising
non-precious ammonia decomposition metals. These studies typically report high activities
between 550 – 650°C, and do not see appreciable activities within the ranges studied here
(103, 259).
Ultimately, substitution of Ru with a transition-based metal will result in a catalyst
with less intrinsically active active sites as compared to the 4 Ru catalyst. For example,
Chen et al. (260) synthesized bimetallic Ru-Fe nanoparticles on carbon nanotubes (CNT)
and showed that these catalysts exhibited a fast desorption of N adatoms from the surface
compared to Ru/CNT catalysts but ultimately resulted in similar activity as a Ru/CNT
catalyst after H2 reduction. Additionally, Fe has been shown to bind N2 too strongly to be
a good ammonia decomposition catalyst, and Co too weakly (79, 80). This evident in the
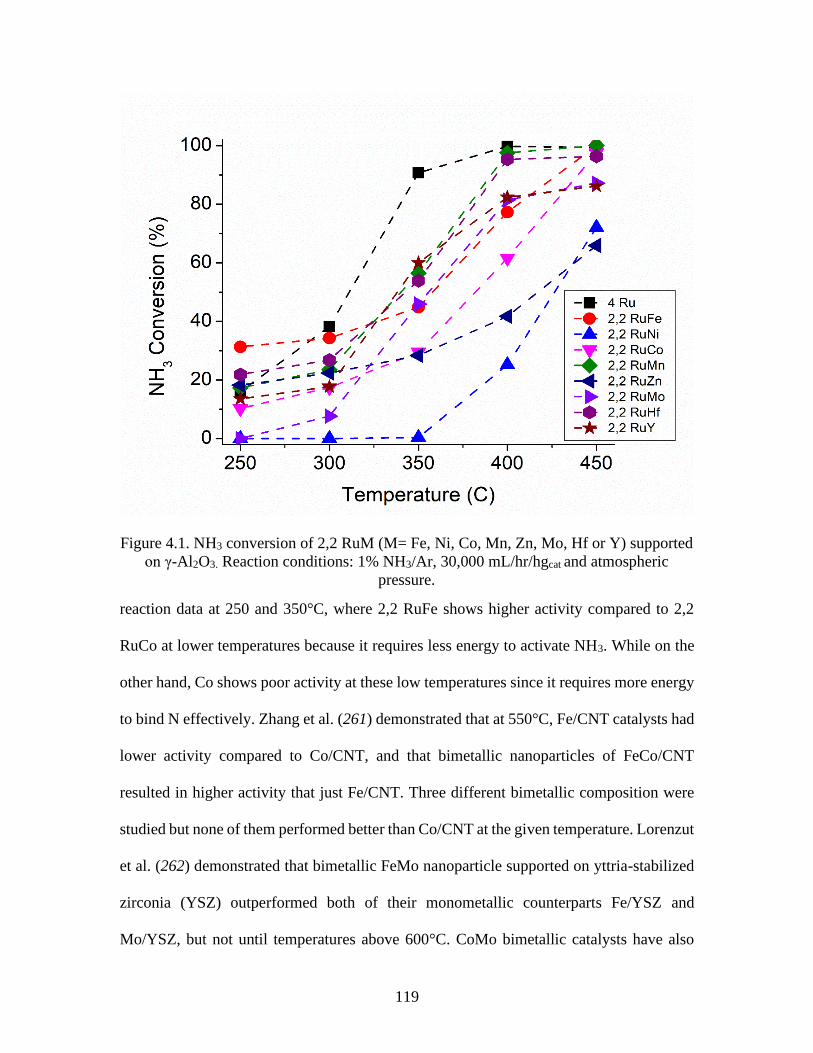
119
reaction data at 250 and 350°C, where 2,2 RuFe shows higher activity compared to 2,2
RuCo at lower temperatures because it requires less energy to activate NH3. While on the
other hand, Co shows poor activity at these low temperatures since it requires more energy
to bind N effectively. Zhang et al. (261) demonstrated that at 550°C, Fe/CNT catalysts had
lower activity compared to Co/CNT, and that bimetallic nanoparticles of FeCo/CNT
resulted in higher activity that just Fe/CNT. Three different bimetallic composition were
studied but none of them performed better than Co/CNT at the given temperature. Lorenzut
et al. (262) demonstrated that bimetallic FeMo nanoparticle supported on yttria-stabilized
zirconia (YSZ) outperformed both of their monometallic counterparts Fe/YSZ and
Mo/YSZ, but not until temperatures above 600°C. CoMo bimetallic catalysts have also
Figure 4.1. NH3 conversion of 2,2 RuM (M= Fe, Ni, Co, Mn, Zn, Mo, Hf or Y) supported
on γ-Al2O3. Reaction conditions: 1% NH3/Ar, 30,000 mL/hr/hgcat and atmospheric
pressure.

120
been extensively studied, and have been shown to also be more active than their
monometallic counterparts, but again require temperatures above 450°C for appreciable
conversion to be achieved (263–266).
Additionally, Pt, Os, Rh and Ir precious metals were also studied due to the high
activity of their monometallic counterparts. While the main objective of this work was to
find a cost, effective catalyst compared a catalyst containing 4 wt% Ru, by substituting Ru
with another precious metal, this may have resulted in such an active catalyst that the cost
per hydrogen produced could have been lower than that of just a Ru supported catalysts.
Figure 4.2 shows the activity results of precious metal substituted Ru catalysts compared
to the baseline 4 Ru catalyst under identical reaction conditions. Here we see a similar trend
as the non-precious metal catalysts, that regardless of the metal substituted, there is no
enhancement in activity compared to the baseline catalyst with more Ru content.
We found here bi-metal Ru catalysts based off of transition metals to be poor
substitutes to catalysts containing only Ru. While studies do in fact create successful
bimetallic catalysts for ammonia decomposition, the comparisons are made between the
bimetallic catalyst and a catalyst with Ru only. Therefore, for transition metals that are
active for ammonia decomposition, it is no surprise they would be more active than a Ru
only catalyst since the Ru content is constant in both cases and additional active metal is
added to the bimetallic catalyst. Additionally, many of these studies include computational
calculations of over various bimetallic crystal planes, which are not feasible to
experimentally produce (89, 267, 268).

121
Due to the lack of success, we found in using previous literature as a basis for creating cost
effective Ru based catalyst for ammonia decomposition, a more Edisonian approach was
taken encompassing a broader scale of metals and weight loadings. Additionally, there are
very few metals that show promise for ammonia decomposition at the low temperatures
studied throughout this body of work.
4.2 Design Space for Ammonia Decomposition Catalysts
Previously, our group determined the effect of promoters and preparation solvents
on ammonia decomposition activity for Ru supported catalysts (118). Of the following
promoters, K, Cs, Ba, Sr, Rb, Ca, Na and Li, the most promising promoters were found to
Figure 4.2. NH3 conversion of 2,2 RuM (M= Os, Rh, Pt or Ir) supported on γ-Al2O3.
Reaction conditions: 1% NH3/Ar, 30,000 mL/hr/hgcat and atmospheric pressure.

122
be K, Cs and Ba. The effect of these three promoters and the optimal promoter loadings
was determined through response surface methodology, which was built around a 4 wt%
Ru catalyst supported on ɣ-Al2O3. The weight loading of the three promoters was varied
from 0 to 12% and either one or two promoters were used. A catalyst promoted by 12 wt%
K was found to be the most active. For this reason, we chose a 4 wt% Ru, 12 wt% K catalyst
supported on ɣ-Al2O3 as a baseline catalyst to make activity comparisons with catalysts
containing less Ru. Using this catalyst as a basis, the total metal loading was held constant
at 4 wt%, and the Ru content was reduced to either 3 wt%, 2 wt% or 1 wt% with the
remaining metal loading be composed of either 1 wt%, 2 wt% or 3 wt% of one of the
following elements: Mg, Ca, Sr, Sc, Y, Zr, Hf, Nb, Ta, Cr, Mo, W, Mn, Re, Fe, Os, Co,
Rh, Ir, Ni, Pd, Pt, Cu, Ag, Au, Zn, Cd, In, Sn, Pb or Bi. These will be referred to as
secondary elements. Lastly, each catalyst was promoted with 12 wt% K. This resulted in
over 100 unique catalyst formulations. The nomenclature for catalyst loadings will first
indicate the three weight loadings of Ru, the secondary metal and K, followed by the three
elements that were used in that catalyst. For example, a catalyst could composed of 3 wt%
Ru, 1 wt% Fe and 12 wt% K will be referred to as 3,1,12 RuFeK, and a catalyst composition
of 1 wt% Ru, 3 wt% Mg and 12 wt% K would correspond to 1,3,12 RuMgK. All catalysts
were supported on ɣ-Al2O3 (192 ± 8 m2/g) for the purpose of the high throughput screening
study.
While the K promoter used here was found to be the optimal loading for a 4 wt%
Ru catalyst, this may not be the case for all of the catalysts studied here due to the variety
of secondary metals probed. In fact, there is no agreement on what the most active promoter
is for a Ru supported catalyst and is a function of the support and promoter precursor. Other

123
studies have shown that LiOH was the most active promoter compared to CsOH and KOH
on a ɣ-Al2O3 supported Ru catalyst (269, 270) due to surface modification of the support
with alkali hydroxides. However, here we have shown that K also modifies the ɣ-Al2O3
support by forming alkali aluminates in Chapter X. By using the same promoter and
support throughout this study, we can ensure that changes in the rate of reaction will be
due to the addition of the secondary element and not due to newly introduced promoter
support interactions, which is beyond the scope of this work. Additionally, it would be time
consuming and costly to reproduce the design space with a different promoter, effectively
doubling or tripling the number of catalysts that would need to be synthesized and screened.
However, it would be worthwhile to further investigate different promoters after promising
catalysts have been identified.
4.2.2 Effect of Support on Ammonia Decomposition Activity
Various supports were probed in order to determine if ɣ-Al2O3 was the best support
to use for this study, including TiO2, SiO2, α-Al2O3, CeO2 and ZSM-5. These supports were
chosen in order to probe the effects of surface area, strong metal support interactions
(SMSI), oxide reducibility and mesoporosity on catalyst activity. The results of the various
supports in relationship to ɣ-Al2O3 are shown Figure 4.3 for 3,1,12 RuHfK catalysts. The
activity was measured in 100% NH3 at a space velocity of 5,400 mL/hr/gcat and atmospheric
pressure. Interestingly we found low surface area α-Al2O3 to be almost as active as ɣ-Al2O3
at 400°C. However, very little information is available on α-Al2O3 as a support for
ammonia decomposition due to its low surface area and inertness and is primarily used to
carry out kinetic studies to minimize temperature gradients and to minimize channeling

124
(269). For ammonia synthesis, α-Al2O3 was shown to have the poorest performance
compared to SiO2, ZrO2, ɣ-Al2O3, and MgO, regardless of the active metal (271). In
contrast, a recent ammonia synthesis study varied the calcine temperature of alumina in
order to study the different phases of Al2O3 for supported Ru-Ba catalysts (272). This study
found that calcining the Al2O3 support to 980°C resulted in the formation of θ-Al2O3 and
α-Al2O3 and resulted in the most active ammonia synthesis catalyst over α and ɣ phase
alumina. Further heating to 1300°C resulted in the formation of α-Al2O3 and resulted in an
increase in Ru particle size. The larger Ru particles may have a higher diffusivity over
larger Ru particles compared to smaller Ru particles (273, 274). Additionally, α-Al2O3 also
250 300 350 400
0
20
40
60
80
100
NH
3 C
onvers
ion (
%)
Temperature (C)
SiO2
TiO2
-Al2O
3
-Al2O
3
CeO2
Figure 4.3. Ammonia decomposition activity of 3,1,12 RuHfK over various supports.
Reaction conditions: 5,400 mL/hr/gcat, 100% NH3 and 1 bar.

125
exhibited the least amount of surface OH groups. Hydrogen atoms that migrate to the
support may interact with the surface OH groups and can cause hydrogen poisoning.
Therefore, the lack of surface OH groups may reduce hydrogen poisoning and increase the
rate of reaction at higher temperatures. Additionally, we observed high activity at low
temperature on 3,1,12 RuHfK supported on CeO2. Investigation into CeO2 as a support is
relatively new has been shown to prevent sintering of the active metal when used as a
promoter for Ni supported catalysts (275). Recently Ru and Ni catalysts supported on CeO2
have been tested for ammonia decomposition, and the activity was found to be greatly
enhanced when Ru and Ni were supported on CeO2, in relation to Al2O3 supported catalysts
(276). However, the synthesized alumina support was found to be in the χ phase, instead
of the commonly used and thermodynamically stable γ phase of alumina. This may lead to
a misleading representation of the activity of CeO2 supported catalysts in relation to
alumina.
Titania was shown to be the least active support followed by SiO2. Yin et al. (277)
also observed TiO2 to be a poor support for Ru catalysts compared to MgO, Al2O3 and
CNT at temperatures up to 600°C. Choudhary et al. (278) synthesized Ni catalysts on HY
zeolite, SiO2, HZSM-5 and Al2O3 and found that the activity per metal site was greatest on
SiO2 supports. However, Li et al. (101) reported that the addition of K to Ru/SiO2 catalysts
did not result in a large improvement in catalytic activity compared to unpromoted the
Ru/SiO2 catalyst. Therefore, it is apparent that the optimal support will vary depending on
the active metal and promotional environment. Previous literature has shown that strongly
basic supports enhance the ammonia decomposition reaction. Surface modification of
alumina with K has been shown to increase basicity of the support which may explain the

126
enhanced activity of the two alumina supports. Sun et al. (231) showed that titania and
silica lacked the proper vacant sites and ability to anchor KNO3 that is necessary to generate
basicity in other supports such as alumina and zirconia. This may explain the poor
performance of the two supports. From this study, we concluded that high surface area ɣ-
Al2O3 was the most effective support for Ru supported catalysts with very high loadings
of K promoter and was utilized for all catalyst during the high throughput screening.
4.3. High Throughput Screening
The K promoted Ru based catalysts were screen for ammonia decomposition
activity in 1% NH3/Ar at 30,000 mL/hr/gcat and at atmospheric pressure. Figure 4.4,
Figure 4.5, Figure 4.6, and Figure 4.7 show the activity results at 250°C, 300°C, 350°C
and 400°C respectively. In each figure, the top graph (a) corresponds to 1 wt% Ru
substitution with a secondary metal (3,1,12 RuMK), the middle graph (b) corresponds to
2 wt% Ru substitution (2,2,12 RuMK), and the last graph (c) corresponds to 3 wt% Ru
substitution (3,1,12 RuMK). The secondary metal substituted is label on the x-axis.
Additionally, each figure has the activity of the baseline 4,12 RuK catalyst indicated by
the black dashed line under identical operating conditions in order to make direct
comparisons to activity at each catalyst weight loading. respectively. In each figure, the
top graph (a) corresponds to 1 wt% Ru substitution with a secondary metal (3,1,12
RuMK), the middle graph (b) corresponds to 2 wt% Ru substitution (2,2,12 RuMK), and
the last graph (c) corresponds to 3 wt% Ru substitution (3,1,12 RuMK). The secondary
metal substituted is label on the x-axis.

127
Because so many catalysts were able to achieve the same activity as the baseline catalyst
at 400°C, we chose a milder temperature of 300°C to determine successful substitutions
of Ru with a secondary metal. This is because we are interested in not only a low
Ru content catalyst, but also a catalyst that has high activity at low temperatures.
Additionally, these screening results utilized only 1% NH3 in the feed gas. The rate of
Figure 4.4. High throughput screening results at 250°C for (a) 3,1,12 RuMK, (b) 2,2,12
RuMK and (c) 3,1,12 RuMK, where the substituted metal M listed on the x-axis.
Reaction conditions: 1%NH3/Ar, 30,000 mL/hr/gcat and atmospheric pressure. The black
dashed line corresponds to the activity of 4,12 RuK at identical conditions.

128
reaction is known to have a negative dependence on the partial pressure of ammonia, so
as the ammonia concentration increases, the rate of reaction should also decrease (258).
Therefore, catalysts that do not perform well at 300°C with 1% NH3 are not expected to
perform well when the reaction conditions become harsher. Under these conditions,
catalysts containing 3% Ru and 1% of either Mg, Ca, Hf, Sc, Ta, Zr, Ir or Y achieved
Figure 4.5. High throughput screening results at 300°C for (a) 3,1,12 RuMK, (b) 2,2,12
RuMK and (c) 3,1,12 RuMK, where the substituted metal M listed on the x-axis.
Reaction conditions: 1%NH3/Ar, 30,000 mL/hr/gcat and atmospheric pressure. The black
dashed line corresponds to the activity of 4,12 RuK at identical conditions.
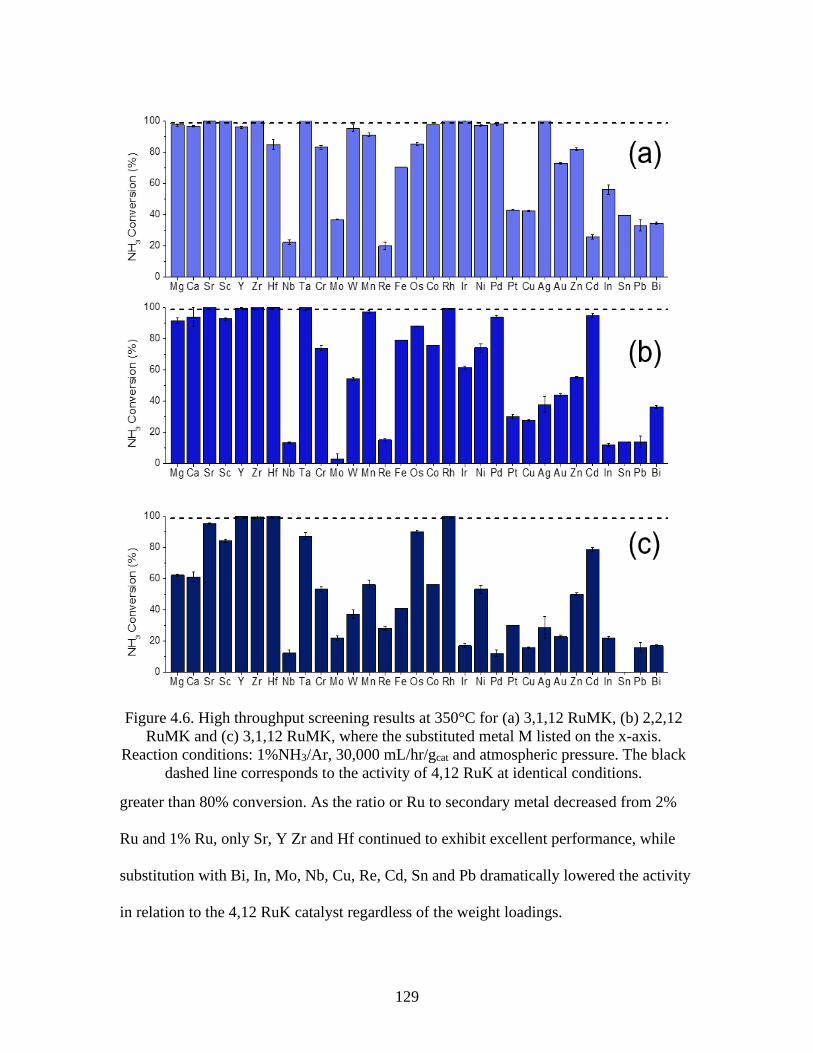
129
greater than 80% conversion. As the ratio or Ru to secondary metal decreased from 2%
Ru and 1% Ru, only Sr, Y Zr and Hf continued to exhibit excellent performance, while
substitution with Bi, In, Mo, Nb, Cu, Re, Cd, Sn and Pb dramatically lowered the activity
in relation to the 4,12 RuK catalyst regardless of the weight loadings.
Figure 4.6. High throughput screening results at 350°C for (a) 3,1,12 RuMK, (b) 2,2,12
RuMK and (c) 3,1,12 RuMK, where the substituted metal M listed on the x-axis.
Reaction conditions: 1%NH3/Ar, 30,000 mL/hr/gcat and atmospheric pressure. The black
dashed line corresponds to the activity of 4,12 RuK at identical conditions.

130
At 250°C, multiple catalyst at each weight loading are able to outperform the 4,12
RuK baseline catalyst with less Ru. These include 3,1,12 RuMgK, 3,1,12 RuCaK, 3,1,12
RuSrK, 3,1,12 RuScK, 3,1,12 RuYK, 3,1,12 RuZrK, 3,1,12 RuHfK, 3,1,12 RuIrK, 3,1,12
RuRhK, 2,2, 12 RuSrK, 2,2,12 RuYK, 2,2,12 RuZrK, 2,2,12 RuTaK, 2,2,12 RuRhK,
Figure 4.7. High throughput screening results at 400°C for (a) 3,1,12 RuMK, (b) 2,2,12
RuMK and (c) 3,1,12 RuMK, where the substituted metal M listed on the x-axis.
Reaction conditions: 1%NH3/Ar, 30,000 mL/hr/gcat and atmospheric pressure. The black
dashed line corresponds to the activity of 4,12 RuK at identical conditions.

131
1,3,12 RuMgK, 1,3,12 RuyK, 1,3,12 RuZrK, 1,3,12 RuHfK and 1,3,12 RuTaK. At this
temperature, the Ta substituted catalyst resulted in the most active catalyst regardless of
the compositional loading. At this low of temperature, the most active substituted catalysts
were composed of alkali metals, alkali earth metals, rare earth metals and precious metals.
Catalysts with 3 wt% Ru and 1 wt% of Mg, Sr, Ca, Hf, Sc, Ta, Zr, Ir or Y achieved greater
than 83% conversion at 300°C. At 350°C and 1 wt% substitution of Ru with W, Mn, Co,
Pd, and Ag begin to light-off, but decrease in activity with decreasing Ru loading in relation
to the 4,12 RuK baseline activity. Interestingly, substitution with Cd shows excellent
activity with lower loadings of Ru. Cd has been previously studied as a catalyst for
hydrolysis, esterification and transesterification of triacylglycerides and fatty acids (279).
Interestingly K supported catalysts have also been studied for transesterification reactions
(221, 225). Cd compounds are of interest because it can act as a Lewis acid, activating
electronegative atoms such as N2. Other common Lewis acids include Cu, Zn, and Sn, but
we do not see a similar enhancement in activity with the addition of these metals. Again,
we see that all of the alkali earth and alkaline earth metals achieve complete conversion at
350°C, but as the Ru loading decreases, the activity of Mg, Ca, Sr and Sc fall below the
4,12 RuK activity baseline, while Y, Zr, Hf and Rh substitution were still highly active
with only 1% Ru. By 400°C, many more catalysts begin to reach the same activity as the
baseline catalyst. With 1% Ru substitution, the worst catalysts contained Nb, Re and Bi,
and at 3% Ru substitution, the worst catalysts contained Nb, In, Sn, Pb, Mo, W, Pd, Ir, Pt
and Cu.
The substitution of Ru with transition-based metals generally resulted in a catalyst
with poorer activity than the baseline. This was also observed in Figure 4.1 and Figure 4.2

132
when a promoter was not added to the catalysts. In general, this can be attributed to the
replacement of highly active Ru active sites with intrinsically less ones. The Ru active sites
are not being electronically or structurally modified, simply replaced. As for substitution
with the noble metals Pt, Pd, Rh, Os, Ir, Pt and Au, these metals exhibited a strong
correlation between and weight loading. Generally, we see that the activity decreases with
increasing noble metal loading, while the activity was not as heavily influenced by
variation in transition metal weight loadings. Higher weight loadings of noble metals
would result in a stronger degree of hydrogen splitting and spillover. Hydrogen has been
well known to be a poison to the ammonia decomposition reaction because it blocks the
active sites of Ru for ammonia adsorption (272, 280–282). So, increasing and noble metal
loading while simultaneously decreasing the Ru loading and thus the number of active
sites, could result in inhibition on the rate of reaction because of the hydrogen spillover
effect (283–286). The most successful catalysts came from the substitution of Ru with
alkali metals, alkali earth metals and rare earth metals. While alkali metals are generally
considered to be electronic promoters, Mg and Ca have shown to provide structural
enhancement (115, 122, 287), increasing the number of active sites present as opposed to
making them more reactive. Recent work has investigating Sr niobates and titanates as
supports for ammonia synthesis have shown that Sr niobate can enhance activity by
inducing epitaxial growth of Ru (288) and that Sr titanate (281) can alleviate hydrogen
poisoning and increase the electron density of Ru sites. Figure 4.8 shows SEM images of
fresh and spent 3,1,12 RuCaK, 3,1,12 RuMgK and 3,1,12 RuSrK catalysts, highlighting
the morphological differences of the Ru nanowhiskers both before and after exposure to
ammonia, with the addition of different alkaline earth metals. All three catalysts exhibited

133
XRD reflections indicative of hollandite crystal structure, and so the variation in the rod
diameter and length is primarily due to the addition of the secondary element, which may
in turn influence the pH of the synthesis solution for example.
Additionally, we wanted to determine the applicability of the results gathered
through high throughput experimentation to those from a traditional plug flow reactor
setup. Therefore, various 3,1,12 RuMK catalysts were chosen to be tested in a plug flow
reactor under more realistic operating conditions. Specifically, the NH3 concentration was
increased from 1% to 100% and the space velocity was changed to 5,400 mL/hr/gcat in
order to meet H2 productivity benchmarks set previously by ARPA-E (289) that can be
financially feasible for upscaling the technology for H2 production. Figure 4.9 shows the
Arrhenius plot and calculated activation energies for randomly selected 3,1,12 RuMK
Figure 4.8. SEM images of fresh (a) 3,1,12 RuCaK, (b) 3,1,12 RuMgK, (c) 3,1,12
RuSrK and spent (d) 3,1,12 RuCaK, (e) 3,1,12 RuMgK and (f) 3,1,12 RuSrK.

134
catalysts, where M = Y, Hf, Sr, Ca, Fe, Bi, Cu or Mg. The conversion was measured from
250°C to 450°C in 50°C increments, and the H2 uptake was measured for each catalyst
using H2 chemisorption experiments. From these, the turnover frequency (TOF) for each
catalyst was determined and the activation energy could be calculated for each catalyst.
The catalysts with the lowest TOF were Bi and Cu, which correlates to what was exhibited
in the high throughput screening experiments. Additionally, catalysts with the highest
conversion were Mg, with Rh and Sr performing slightly behind these two catalysts.
From the measured activation energies, we can see that Hg and Mg substitution had
dramatically lower activation energies than those with Bi, Cu, Sr or Y, and that Ca and Fe
substitution had even higher activation energies than these. This suggests that the rate
determining step may be changing with the various substituted metals (78). Because of
this, we wanted to gain further insight into two specific substituted metal catalysts, Sr and
Fe, of which were a good and bad performing catalyst. Additionally, we did further
Figure 4.9. Arrhenius plot of various 3,1,12 RuMK catalysts and calculated apparent
activation energies. Turnover frequencies calculated from H2 uptake and assuming a ratio
of 1 H2: 1 Ru active site. Reaction conditions: 100% NH3, 5,400 mL/hr/gcat and
atmospheric pressure.

135
characterization and activity measurements on these catalysts in order to validate the
findings of the high throughput screen.
4.4 XRD Analysis
4.4.1 Phase Identification
Due to the complexity of the catalysts studied here, XRD was performed on each
catalyst in order to determine which Ru species were present and whether or not a
crystalline secondary phase was present at the various weight loadings. Specifically, we
identified the formation of RuO2, KRuO4 and KRu4O8 species in each pattern through
phase identification and calculated the crystallite size of these Ru metal oxides using
Scherrer’s equation. The summation of the different Ru species in catalyst can be found in
Table 4.. There were no obvious correlations made between Ru species present and the
activity of each catalyst, most likely because the addition of the secondary metal was more
influential in determining activity than the crystal phase. Future work We have
demonstrated previously that the Ru species all reduce to metallic Ru during the H2 pre-
treatment.

136
Table 4.1. Summary of the Ru crystal phases present in each catalyst tested for low
temperature ammonia decomposition where the first column indicates the composition
weight loading, the second column indicates the secondary metal, and a “Y” indciates
that the corresponding species is present.
Ru, Secondary Metal,K
Weight Loading
Secondary
Metal RuO2 KRuO4 KRu4O8
3,1,12
Mg
Y Y
2,2,12 Y
1,3,12 Y
3,1,12
Ca
2,2,12
1,3,12 Y
3,1,12
Sr
Y
2,2,12 Y
1,3,12
3,1,12
Sc
Y Y
2,2,12 Y
1,3,12 Y
3,1,12
Y
Y
2,2,12 Y
1,3,12 Y
3,1,12
Zr
Y
2,2,12 Y Y
1,3,12 Y Y
3,1,12
Hf
2,2,12 Y
1,3,12 Y
3,1,12
Nb
Y
2,2,12 Y
1,3,12 Y
3,1,12
Cr
Y Y
2,2,12 Y
1,3,12
3,1,12
Mo
Y Y
2,2,12 Y
1,3,12 Y
3,1,12
W
Y
2,2,12 Y
1,3,12 Y
3,1,12
Mn
Y
2,2,12 Y
1,3,12 Y
3,1,12 Re

137
2,2,12 Y
1,3,12 Y
3,1,12
Fe
Y
2,2,12 Y
1,3,12
3,1,12
Os
Y
2,2,12 Y
1,3,12
3,1,12
Co
Y
2,2,12 Y
1,3,12
3,1,12
Ir
Y
2,2,12 Y Y
1,3,12 Y Y
3,1,12
Ni
Y
2,2,12 Y
1,3,12
3,1,12
Pd
Y Y
2,2,12 Y Y
1,3,12 Y Y
3,1,12
Pt
Y
2,2,12 Y
1,3,12 Y
3,1,12
Cu
Y
2,2,12 Y
1,3,12
3,1,12
Ag
2,2,12
1,3,12
3,1,12
Au
Y
2,2,12 Y
1,3,12 Y
3,1,12
Zn
Y
2,2,12 Y
1,3,12 Y
3,1,12
Cd
Y
2,2,12 Y
1,3,12 Y
3,1,12
In
Y
2,2,12 Y
1,3,12 Y
3,1,12
Sn
2,2,12 Y
1,3,12
3,1,12 Pb

138
2,2,12
1,3,12
3,1,12
Bi
2,2,12
1,3,12
4.4.2 Effect of Secondary Element and Crystallite Size on Activity
Due to the structure sensitivity of ammonia decomposition over Ru, previous
studies have identified optimal Ru particle sizes between 3 and 5 nm (113, 290). Within
this regime, there is a higher probability of the occurrence of B5 sites, which consist of
ensembles of five Ru atoms that have a three-fold hollow site and a bridge site in close
proximity (112). This B5 site has been hypothesized to be the most active site for ammonia
decomposition over Ru. While it is has been shown that Ru step sites are more active than
flat surfaces, there is no direct way to measure the activity or number of B5 sites that may
be present in a catalyst. Other works suggest that the optimal Ru particle sizes are closer to
3-5 nm (291), while others have observed that hemispherical particles between 7 – 8.5 nm
are much more active than Ru particles that are roughly 1.5 nm in size (114, 115). Other
works suggest that a broad distribution of Ru particle sizes is necessary for high ammonia
decomposition activity, due to a synergistic effect that occurs between large and small Ru
particles and the migration of H atoms from large to small Ru particles, thus promoting the
hydrogenation of adsorbed NHx species (273, 274). For these reasons profile fitting was
performed on each XRD pattern in order to determine the average crystallite size of RuO2,
KRuO4 and KRu4O8. The profile fitting was used in order to determine the full-width half
max (FWHM) of each Ru species reflection, after which the the average crystallite size
was determined using the Scherrer’s Equation. The average crystallite size for each Ru

139
species present in each individual catalyst composition was then averaged together to
provide a representative crystallite size for each catalyst. An example of the profile fitting
is given in Figure 4.10 showing part of the XRD pattern from for the 1,3,12 RuMoK
catalyst. The reflections for the three Ru species were fitted, using the reflections located
at roughly 12.4°, 17.7° and 47.6° for KRu4O8, reflections located at 28.2°, 35.1°, 39.2°,
58.3° and 59.7° for RuO2, and reflections located roughly at 26.4°, 27.8° and 31.7° for
KRuO4 (54, 126). The position of these reflections will vary slight based on the interatomic
distances of these species, which may change based on crystal stress, strain, or imperfect
stoichiometry (substitutional doping). Additionally, the peak width can provide
information on the crystal defects. Diffraction peaks can be described as a combination of
both Gaussian and Lorentzian functions (292, 293). A diffraction peak will exhibit
Gaussian line broadening based on crystal strain, and will exhibit Lorentzian line
broadening due to crystal size (294). Therefore, a commonly used function to fit diffraction
peaks is the pseudo-Voigt function, which is a linear combination of Gaussian and
Lorentzian functions. In this work, each crystalline reflection was fitted using a pseudo-
Voigt peak fit in order to fit both the profile shape and peak width. For the amorphous
diffraction peaks (ɣ-Al2O3), a split-Voigt function was used in order to capture the peak
asymmetry. This was performed for each of the 99 catalyst compositions studied in the
high throughput screen. The crystallite size was then compared to the measured activity at
300°C and in 1% NH3 at 30,000 mL/hr/gcat.

140
Additionally, due to the variation in secondary metal, the effect of the catalyst
composition was also probed to determine if particle size was dependent on the secondary
metal or metal loadings. In order to make comparisons between activity and each catalyst,
catalysts were grouped based on the weight loadings of each components, and then the
atomic number of the secondary metal was used to differentiate between each of the
catalysts within a constant weight loading. The average particle size as a function of NH3
conversion for each catalyst is shown in Figure 4.1a for the 3,1,12 RuMK catalysts, Figure
4.1b for the 2,2,12 RuMK catalysts and Figure 4.1c for the 1,3,12 RuMK catalysts. Each
Figure 4.10. XRD pattern of 1,3,12 RuMoK showing the profile fit using Pseudo-Voight
and Split-Voight fit and the residual after fitting from 38 – 60°.

141
figure contains a minimum of 17 data points. As the Ru loading decreased, in some
instances the crystallite size becomes too small to accurately measure and identify due to
the convolution of peaks.
For catalysts containing 3,1,12 RuMK weight loadings, the smallest Ru average
particle sizes were catalysts containing Cu (average crystallite size = 9.85 nm, atomic # 29,
NH3 Conversion = 30%), Os (8.4 nm, #76, 28.2%), Pt (8.86 nm, #78, 28.5%), Au (8.48
nm, #79, 30.0%), and Ir (7.75 nm, #77, 100%). The largest particle sizes were those
containing Y (29.51 nm, #39, 95.2%), Cr (28.06 nm, #24, 55.4%), Fe (26.45 nm, #26 and
Co (31.46 nm, #27, 44%). For the higher weight loadings of Ru, those catalysts with
smaller average crystallite size are also the most active over a broad range of secondary
metals. Catalysts within the atomic # range of 30 – 40 exhibit poor performance at average
particle size less than 15 nm. The catalysts within this atomic # range include Cd and Nb.
There are other instances where we see that catalysts with larger particle sizes also perform
well for ammonia decomposition, specifically substitution of Ru with Sc (24.28 nm, #30,
99.8%). As the amount of Ru decreases from 3% to 2% and then to 1%, we that the area
of high activity becomes much more concentrated within a range of low average crystallite
size and secondary metals with low atomic numbers.
Interestingly with the decrease in Ru weight loading, we do not see a consistent
decrease in the average crystallite size. For example, catalysts containing Sc, the average
particle sizes changes from 19.64 nm to 18.8 nm and the conversion decreases to 59.2%
and then to 52.5% at 1,3,12 RuScK. For the Hf catalysts that exhibited very high activity
(~80%) across all three catalyst compositions, but the average particle size increased from
8.46 nm to 16.33 nm and then decreased down to 7.94 nm at the 1,3,12 RuHfK catalyst.

142
So, there is a strong interplay occurring between the composition, secondary metal and
average particle size in addition to a variety of other features, that makes elucidating trends
in such a complicated data set very difficult.
For these reasons, machine learning (ML) has more recently began to be utilized to
guide catalyst discovery and optimization for a few catalytic reactions including methane
oxidative coupling, olefine epoxidation and propane ammoxidation (295–298). For studies
targeted at discovering new catalyst compositions, rudimentary heuristics have been able
to be determined to create better performing catalysts within very specific composition
ranges and do not provide information outside of the original design space (147). Work in
our group has recently shown that we can utilize experimental data to predict ammonia
decomposition catalysts very accurately while using small amounts of data and outside of
the range of compositions used in the training data set. Additionally, we can extract features
from the data set in order to gain insight into what properties are important for influencing
catalytic activity. The development, application and predicative capabilities of the machine
Figure 4.11. NH3 conversion at 300°C as a function of average Ru particle size and the
atomic number of the secondary metal. (a) 3,1,12 RuMK, (b) 2,2,12 RuMK and (c)
1,3,12 RuMK where M refers to the secondary metal.

143
learning algorithm developed for this purpose can be found elsewhere (299). The
importance of the feature extraction will be briefly highlighted here.
4.5 Machine Learning for Catalyst Feature Extraction
Previously our group has developed a methodology that combines ML and high
throughput experimentation to make catalyst predictions. We utilize a variety of operating
parameters, catalyst synthesis conditions, and chemical features that can be easily found in
databases. These include electronic, geometric, and atomic properties of elements used in
order to describe each catalyst. These properties, or features, are then used to make
predictions for catalyst activity and to predict active catalyst compositions that the
algorithm does not have information about. The body of work demonstrates that we can
utilize as little as three catalysts as input data to the algorithm to accurately predict the
activity of other catalysts containing different metals for ammonia decomposition activity
(147). Due to the complexity of the data set studied from the high throughput screening,
machine learning feature extraction is a powerful tool that can help us ascertain which
properties are most influential in determining catalytic activity. Figure 4. shows the highest
rank features determined for a random forest model utilizing a leave one out cross
validation to make predictions on catalyst activity. The determination for which values of
feature importance denoted an actually meaningful feature can be found elsewhere (147,
299).
The algorithm determined that changes in temperature was the most important
feature determining catalytic activity. As most all reactions exhibit endothermicity or
exothermicity, this offers no new insight into the inner workings of the catalyst surface but
does provide evidence in the correctness of the model to learn, as variation in temperature

144
is indeed most influential to changes in activity. The next most important features include
number of d-shell valence electrons, electronegativity, covalent radius, adjusted work
function and the number of valence electrons. These features are all related to the electronic
configuration of the catalysts. Correlations between reactivity of different metal surfaces
and their electronic environment have been studied for decades. Changes in the catalysts
composition and proximity to various promoters will affect the strength of the bond formed
between a metal surface and the adsorbate which will influence the reactivity of that metal
surface for different catalytic reactions (300, 301). For example, the number of d-shell
valence electrons for late transition and noble metal surfaces has been directly correlated
to the reactivity of these metals to small probe molecules (300). However, this feature alone
is not enough to predict catalytic activity, and this has been experimentally validated by
Ganley et al. (78) over monometallic catalysts for ammonia decomposition. The position
of the d-band of different metals relative to their Fermi levels have also been shown to
accurately describe the reactivity of these metals (commonly referred to has d-band theory)
(79, 80, 141, 302, 303). This theory has been extensively used in computational catalysis
to predict reactivity of different metal surfaces. Exceptions to the d-band theory include
situations where there are large differences in electronegativities between the adsorbate
and the substrate when the substrate has a nearly full d-band (304–306). Modification of
the adsorption energy calculations can be modified to include the Pauli repulsion, Pauli
electronegativity, work function and various local chemical environment information in
order to enhance the accuracy of these models (307–309). Interestingly, the algorithm was

145
able to decipher these features as most important without have any prior knowledge on the
reaction or information of the binding energies pertinent to ammonia decomposition. Since
this study incorporates not only transition and noble metals but alkali, rare earth, and
alkaline earth metals, this may result in bias towards more electronic features such as the
electronegativity and covalent radius due to the different interactions between these
elements with the active metal substrate and the adsorbate. The next 9 most important
features include less easily correlateable features such as the Os mol%. We have seen that
removable of these nine features very slightly decreases the overall accuracy of the
machine learning algorithm predictions and provide little meaningful insight (299).
Figure 4.12. Highest ranked features according to their feature importance for
determining ammonia decomposition activity for catalysts with 3,1,12 RuMK, 2,2,12
RuMK and 1,3,12 RuMK weight loadings. Adapted from ref (77).
146
We have looked at some of these individual features and their 2-way interactions
and have found some general trends within them, for example, a low mean absolute
deviation (MAD) of the catalyst work function and a low MAD of the number of d-shell
valence electrons results in a catalyst with higher activity. This is exhibited in the contour
plot shown in Figure 4., which shows these two variables as a function of the NH3
conversion measured at 300°C and 1% NH3 concentration. However, as displayed in Figure
4.1, we also saw a general trend that decreasing particle size and lower atomic number of
the secondary element also resulted in a catalyst with higher activity. The convolution of
these multiple variables exhibits the power of machine learning to disseminate the
relationship between activity and multiple variables, such to a degree that cannot be
generalized by the human mind. However, with these conclusions, future iterations of
catalyst design can be implemented based off these trends discovered here.
4.6 Investigation of Sr and Fe Catalysts
This section is dedicated to understanding the influence of Sr and Fe on ammonia
decomposition kinetics and reactivity. Sr addition of the K promoted Ru based catalysts
allowed for the Ru content to be decreased down to 1% Ru, while still maintaining
extremely high activity at low temperatures and in a flow of 1% NH3/Ar. While Mg, Ca
and Ba have been thoroughly studied for ammonia synthesis, there is very little information
about the other alkaline earth metals such as Sr. In contrast, the Fe containing catalysts
became less active as the amount of Fe increased and the amount of Ru decreased, even
though Fe has also been shown to be an effective ammonia decomposition catalyst.
Typically, Fe containing catalysts are prone to forming nitrides and thus techniques such
as core shell encapsulation of the Fe nanoparticles are taken to avoid this (310, 311). For

147
these reasons, Sr and Fe were chosen to discern trends in catalytic activity under high
concentrations of ammonia, for their long-term stability, and to grasp a better
understanding of the ammonia decomposition kinetics over the Sr and Fe containing
catalysts.
The apparent activation energies were calculated for each of the 3 weight ratios of
Sr and Fe catalysts under differential conditions (2 -12% conversion) and under 100% NH3
at a space velocity of 5,400 mL/hr/gcat and compared to the apparent activation energy of
the 4 Ru and 4,12 RuK catalysts under identical conditions. Before measurements were
taken, the Weisz-Prater criterion was used to determine the absence of internal mass
transfer resistances (312, 313). The Weis-Prater criterion was used to determine the
Figure 4.13. Ammonia decomposition activity at 300°C, 1% NH3/Ar and 30,000
mL/hr/gcat as a function of the mean absolute deviation (MAD) of the number of d-shell
valence electrons and the MAD of the catalyst work function.
148
absence of internal diffusion resistances. The Weis-Prater criterion is given by equation
4.1:
rA' ρ
cRP2
DeCAS
≪1
(4.1)
where 𝑟𝐴′= measured NH3 reaction rate (mol/kg/s), 𝜌𝑐= catalyst pellet density (750 kg/m3),
𝑅𝑃2= pellet radius (2.25x10⁻⁵ m), 𝐷𝑒=effective diffusivity of NH3 in the catalyst pellet and
𝐶𝐴𝑆 = NH3 concentration at the pellet surface (16.7 mol/m3). Effective diffusivity is
calculated by equation 4.2:
De=DNH3-H2ϕpσ
τ
(4.2)
where 𝜙𝑝= pellet porosity, 𝜎 is the constriction factor, and 𝜏 is the tortuosity. Typical
values for a catalyst pellet are 𝜙𝑝=0.4, 𝜎=0.8, and 𝜏= 3 (values adapted from ref. 64).
𝐷𝑁𝐻3−𝐻2 is the diffusion coefficient of NH3 in H2 at 400oC and is given in equation (4.3):
DNH3-H2=0.00266T3/2
PMNH3-H21/2 σNH3-H2
2 ΩD
(4.3)
where T is the temperature (K), P is the pressure (bar), MNH3-H2=2*[(1/MNH3)+(1/MH2)]-1,
MNH3=molecular weight of NH3, MH2 = molecular weight of H2, 𝜎𝑁𝐻3−𝐻2 = characteristic
length (Å) and Ω𝐷 is the diffusion collision integral (dimensionless) (313). 𝐷𝑒 was found
to be 3.51 x10⁻⁴ m2/s.
The measured reaction rate at 400oC for the unpromoted 4 Ru catalyst is 2.07
mol/kg/s. The LHS of the Weis-Prater criterion equates to 1.34x10⁻³ which is much less
than 1. Therefore, the criterion is satisfied. Figure 4. shows the Arrhenius plots for the

149
RuSrK and RuFeK catalysts. Here, measurements were conducted under differential
conditions in order to capture the kinetically limited regime of each catalyst. Additionally,
H2 chemisorption was performed on each catalyst in order to calculate the number of
exposed active sites present. Turnover frequencies (TOF) were calculated at 350°C and
400°C by normalizing the rate of reaction to the number of exposed Ru atoms were gram
of Ru, which was measured through H2 chemisorption. The H2 uptake, TOF and apparent
activation energies are shown in Table 4.. The addition of either Sr or Fe to the Ru based
catalyst resulted in an increase the apparent activation energy for each catalyst regardless
of the compositional weight loadings. The 4,12 RuK catalyst exhibited an activation energy
of 65.7 ± 7 kJ/mol, where the Sr containing catalysts had apparent activation energies
between 149.6 and 156.4 kJ/mol, and the Fe containing catalysts had values vastly larger
values between 248 and 251 kJ/mol. The apparent activation energies for the Fe containing
catalysts is even higher than that which has been calculated for the rate determining step
of the recombination and desorption of molecular N2 on a Ru (001) crystal, of 184 kJ/mol
(81). kJ/mol. Therefore, Fe dramatically inhibits the rate of reaction with even substitution
Figure 4.14. Arrhenius plot of (a) RuSrK and (b) RuFeK based catalysts. Reaction
conditions: 100% NH3, 5,400 mL/hr/gcat and atmospheric pressure. Apparent
activation energies were conducted under differential conditions.

150
of just 1% Ru with Fe in relation to the 4,12 RuK catalyst. However, an increase in the
apparent activation energy may suggest that the rate determining step is changing with the
addition of the second metal. The catalysts were run in 100% NH3, 5,400 mL/hr/gcat and
at atmospheric pressure. Comparing the TOF of the Fe based catalysts to those of the 4 Ru
and 4,12 RuK at 350°C and at 400°C, we see that the TOF decreases from 0.97 to 0.41 and
finally to 0.28 with decreasing Ru loading. The Sr based catalysts also increase the apparent
activation significantly from the 4,12 RuK catalyst and only slight in regards to the
unpromoted 4 Ru catalyst. Therefore, we can assume that the addition of Fe is indeed
negative to the overall performance of the catalyst and does not seem to modify the Ru
active sites in any matter. Instead, we see that the Ru active sites are simply being replaced
with less active Fe sites for ammonia decomposition. In the case of Sr, the apparent
activation energy slightly increased with increasing Sr loading from 149.6 ± 4.1 kJ/mol to
153.7 ± 2.4 kJ/mol to 156.4 ± 1.6 kJ/mol. These values are slightly lower than the 184
kJ/mol required for the recombinative desorption of N2 from Ru stepped surfaces.
Additionally, the TOF for each of the Sr catalysts actually increases with decreasing Ru
loading from 0.88 s-1 for the 3,1,12 RuSrK catalyst, to 1.78 s-1 for the 1,3,12 RuSrK
catalyst, which is dramatically more active than the 4,12 RuK catalyst. Additionally, the
1,3,12 RuSrK catalyst exhibits over twice the apparent activation energy of the 4,12 RuK
catalyst. We also observe a decrease in the H2 uptake of the Sr based catalysts with
increasing Sr loading. This suggests that there are less Ru active sites exposed as the
loading of Ru decreases. However, the apparent activation energy stays relatively
unchanged while the TOF increases. This suggests that the Sr is electronically modifying
the Ru active sites and may be changing the rate determining step from that of 4,12 RuK.

151
For example, microkinetic modeling has calculated the dehydrogenation of adsorbed NH3
to be roughly 44 kJ/mol, the dehydrogenation of NH2 to be 65.3 kJ/mol and the
hydrogenation of adsorbed NH to be the highest with 161.5 kJ/mol (84). Therefore, Sr
seems to either change the rate determining step from the dehydrogenation of NH2 species
to the dehydrogenation of NH (or some combination thereof) or may act to electronically
modify the Ru active sites. Further experiments have shown that Sr supported catalysts are
not active alone for ammonia decomposition (not shown). The changes in rate limiting
steps with different metal surfaces has previously been determined (78), however little
work has been done on determining how the rate limiting step changes with the different
one or multiple promoters.
4 Ru 6.50 0.00 0.14 125.2 8.9
4,12 RuK 4. 0 0.26 0.33 65. .
3,1,12 RuSrK 1.90 0.43 0.88 149.6 4.1
2,2,12 RuSrK 0.90 0.81 1.38 153. 2.4
1,3,12 RuSrK 0. 5 1.10 1. 8 156.4 1.6
3,1,12 RuFeK 0. 6 0.35 0.9 248.1 3.0
2,2,12 RuFeK 0.10 0.03 0.41 226.6 2.9
1,3,12 RuFeK 1.20 0.00 0.28 250.9 .6
Table 4.2. H2 uptake, turnover frequency (TOF) and apparent activation energies (Ea)
for Sr and Fe containing catalysts compared to 4 Ru and 4,12 RuK catalysts where the
H2 uptake for each catalyst was calculated from H2 chemisorption experiments
assuming a 1:1 ratio.

152
Next, the ammonia decomposition activity of these Sr and Fe based catalyst was
further tested in higher concentrations of ammonia, in order to determine the accuracy of
fails and hits in the high throughput experimentation and also to determine how good these
catalysts may be in more realistic conditions for H2 generation from ammonia
decomposition. The activity of the Sr and Fe containing catalysts under higher
concentrations of ammonia in a plug flow reactor set up. The results are shown in Figure
4.. The catalysts were tested from 250°C to 400°C in increments of 50°C. The reactions
were run under 100% NH3 at a space velocity of 5,400 mL/hr/gcat and at atmospheric
pressure. It has been reported that there is a negative dependence on the partial pressure of
ammonia on the rate of reaction (84). Therefore, in general we expect to see a decrease in
the conversion as the inlet concentration of ammonia is increased. So, upon increasing the
concentration from 1% NH3 in the high throughput screen to 100% NH3, all catalysts shown
a decrease in conversion. The Sr based catalysts exhibited similar performance to each
other under these conditions, while the 3,1,12 RuFeK catalyst showed much better
Figure 4.15. Ammonia decomposition activity of (a) 3,1,12 RuSrK (black squares)
2,2,12 RuSrK (red circles) and 1,3,12 RuSrK (blue triangles) and (b) 3,1,12 RuFeK
(black squares) 2,2,12 RuFeK (red circles) and 1,3,12 RuFeK (blue triangles). Reaction
conditions: 100% NH3, 5,400 mL/hr/gcat and atmospheric pressure.

153
performance than the 2,2,12 RuFeK or the 1,3,12 RuFeK catalysts. Additionally, all six
catalysts showed a marked decline in activity at the lower temperatures of 250°C and
300°C. However, we see similar trends compared to what was exhibited in the high
throughput screening, where Sr based catalysts showed excellent activity at lower
temperatures (≤ 400°C).
4.6.1 CO Adsorption over Ru based Catalysts
The adsorption configuration of CO onto a metal surface can provide insight into
the strength of the bond between the metal and CO. Different metal sites will adsorb CO
in various configurations, so CO adsorption can also provide insight into active sites that
may be present in some catalysts and not others. CO adsorption was investigated through
FTIR spectroscopy. The adsorption of CO at room temperature for 4 Ru, 4,12 RuK, 1,3,12
RuSrK and 1,3,12 RuFeK are given in Figure 4.16. The 1,3,12 RuSrK and 1,3,12 RuFeK
were chosen to determine if there were different active sites present in the 1,3,12 RuSrK
which exhibited high conversion and TOF, in contrast to the 1,3,12 RuFeK catalyst.
The baseline 4 Ru (black trace) catalyst exhibits three primary features: a weak
band at 2135 cm-1, a strong band at 2078 cm-1 and another weak band at 2015 cm-1. Studies
of CO adsorption on Ru often report a weak band at 2135 cm-1 in conjunction with a band
at 2078 cm-1, which is ascribed to the vibration of multicarbonyl surface species (314–316).
The 2015 cm-1 exhibited in the 4 Ru catalyst has been attributed to the vibration of
dicarbonyl species, as well as the adsorption of CO on low coordinated Ru or high energy
defect sites (316). These bands are suppressed with the addition of K, which has been
previously observed by other groups (169, 317). In contrast, with the addition of K, the

154
4,12 RuK catalyst (blue trace) exhibits bands at 2165 cm-1, 2033 cm-1 and a broad feature
from 1995 cm-1 to 1850 cm-1. This broad feature is also present in the 1,3,12 RuSrK and
1,3,12 RuFeK catalyst, albeit the peak maxima shift slightly in each spectra. Alkali addition
to metal catalysts have been known to largely affect the interactions of CO in the low
frequency range. This is due to the interactions of CO with an electropositive center, this
weakening the bond between C and O, and making it more reactive. For example, the
adsorption of CO on K pre-covered Ru (0001) crystals have been shown to be a function
of the CO and K coverage, and that K addition can shift the CO stretching frequency by as
much as 600 cm-1 (materials 73-75). Other studies have reported that with the addition of
K, bands become broader and more asymmetrical with bands located at 1995 cm-1, 1950
cm-1 and 1940 cm-1 (169, 317). The suppression of these bands with K has been
hypothesized to be a consequence of blocking low coordinated Ru sites, which in turn
suppresses hydrogen adsorption (317). With the addition of K, we do indeed see a decrease
in the H2 uptake at constant Ru loading during H2 chemisorption experiments (Table 4.).
For the 4,12 RuK catalyst, the band located at 2033 cm-1 may be attributed to linearly
adsorbed CO. The position of this band has been shown to be a function of CO coverage
over the metal surface (169, 314–318), due to dipole-dipole interactions between
neighboring CO molecules. This peak is not present in the 1,3,12 RuFeK catalyst, but is in
the 1,3,12 RuSrK spectra. The addition of Fe may act to suppress the adsorption of CO on
Ru, as this has been previously reported for Rh/SiO2 catalysts when Fe was added to the
catalyst (319, 320). Furthermore, the 1,3,12 RuSrK catalyst shows maxima located at 1950
cm-1 and 1894 cm-1, while the 1,3,12 RuFeK catalyst has maxima located at 1976 cm-1,
1925 cm-1 and 1903 cm-1. Additionally, both catalysts in addition to the 4,12 RuK catalyst

155
exhibit a broad, intense shoulder at 1790 cm-1 which may be attributed to bridge bonded
CO (181, 316). This stretch is not observed in the 4 Ru catalyst and has previously been
reported in K promoted Ru systems using 3% K (materials 68, 76). Single crystal studies
have investigated bridge bonded CO on alkali promoted Pt (111) and Rh (111) surfaces
and have found that the amount of bridge bonded CO increases with alkali coverage (321,
322). Therefore, we may see a dramatic increase in intensity of this band as the alkali
loading is much higher here than reported elsewhere. Ultimately, the electropositive nature
of Sr may act to weaken the CO bond through further charge transfer resulting in a larger
Figure 4.16. FTIR spectra of CO adsorbed on (a) 4 Ru (b) 4,12 RuK (c) 1,3,12 RuSrK and
(d) 1,3,12 RuFeK.

156
relative intensity of bridge bonded CO especially with the lower Ru content, with respect
to the 4,12 RuK catalyst.
4.7 Conclusions
In this chapter we explored various catalysts geared towards lowering the loading
of Ru content compared to a 4% Ru catalyst for ammonia decomposition at low
temperatures. The baseline catalyst used for comparison was a previously optimized
catalyst containing 4% Ru and 12% K supported on γ-Al2O3. Substitution of Ru was first
carried out by using various transition and precious metal catalysts, however no
combination of Ru with a second metal was able to perform better than a catalyst containing
4% Ru. This is because of the high intrinsic activity exhibited by Ru for this activity, as it
is able to bind N2 neither too strongly or too weakly and thus most easily facilitates the rate
determining step for ammonia decomposition. Next, high throughput experimentation was
used to explore an even wider parameter space for low Ru content ammonia decomposition
catalysts by variously not only the secondar metal but also the composition of Ru and the
secondary metal in combination with K. Catalysts contained the compositional loadings of
either 1,3,12 RuMK, 2,2,12 RuMK or 3,1,12 RuMK, where M = Na, K, Mg, Ca, Sr, Sc, Y,
Zr, Hf, Ta, Nb, Cr, Mo, W, Mn, Re, Fe, Os, Co, Rh, Ir, Ni< Pd, Pt, Cu, Ag, Au , Zn, Cd,
In, Sn, Pb or Bi. This resulted in over 100 catalyst formulations, many of which have not
previously been explored for ammonia decomposition. In order to quickly and accurately
test this large number of catalysts, a 16-channel parallel plug flow reactor system was used
for screening of ammonia decomposition catalysts in 1% NH3/Ar from 250°C to 450°C.
Quantification of each of the 16 reactors was performed in parallel by using spatially
resolved FT-IR. A focal plane array based detector was used in order to gain the spatial

157
resolution needed to quantify in parallel. The catalysts were compared to the activity of a
4,12 RuK catalyst under identical operating conditions, and catalysts that performed better
than this baseline with less Ru were considered to be successful hits in the screen. These
catalysts included many different substituted elements including Mg, Ca, Sr, Sc, Zr, Hf,
Ta, Rh and Ir. With only 1% Ru, Sr, Y, Zr and Hf substitution were able to dramatically
outperform the 4,12 RuK catalyst at 300°C with only 75% of the Ru content.
The comprehensive catalyst data set synthesized here was further investigated
through XRD analysis, where XRD patterns for each of the 100 catalysts were collected
and analyzed through profile fitting and crystal identification. While there was no
correlation found between crystal phase present and ammonia decomposition activity, we
found a general trend within average crystallite size, secondary element substation and
ammonia decomposition activity. At 300°C, catalysts containing smaller average Ru
crystallite sizes in conjunction with smaller atomic number secondary elements exhibited
higher ammonia decomposition reactivity. This trend became more evident at each
compositional loading, where the most active catalysts of the 1,3,12 RuMK catalysts had
the smallest average particle size and the small atomic number of the secondary element.
However, due to the vast number of other variables present here that may be
influencing activity, a random forest machine learning algorithm was developed to
determine which features of the catalysts most heavily influenced the activity. The
algorithm showed much promise in predicting catalytic activity by using only few catalysts
as a training set. From this, we were able to determine that many electronic features were
the most important in influencing the activity from catalyst to catalyst. These include
number of d-shell valence electrons, electronegativity, covalent radius and work function.

158
Ultimately, we have shown that high throughput experimentation with an expertly chosen
design space in combination with machine learning, can ultimately reduce the cost and time
necessary for material discovery.
To better understand why some of these catalysts performed better than others,
further investigation into Sr and Fe based catalysts was conducted by determining the
apparent activation energy, measuring the TOF, H2 uptake, and probing the kind of Ru
active sites present through CO adsorption. With the 1,3,12 RuSrK catalyst, the TOF was
increased to 1.78 s-1, compared to 0.88 s-1 exhibited by the baseline 4,12 RuK catalyst.
Additionally, the apparent activation energy was increased from 65.7 kJ/mol for 4,12 RuK
to 149.7 kJ/mol for the 3,1,12 RuSrK catalyst. The apparent activation energy further
increased with increasing Sr loading to 156.4 kJ/mol. With increasing TOF and increasing
apparent activation energy, this suggests that Sr acts to electronically modify the exposed
Ru active sites and may possibly result in a change in the rate determining step over Ru
based on rate determining steps calculated through microkinetic modeling. By probing the
metal surfaces with CO adsorption, we determined that the Sr based catalysts weakened
the CO bonds on Ru sites, and also increased the relative intensity of strongly adsorbed
linear CO. This may be analogous to the weakening of the N-H bonds of adsorbed ammonia
and thus more easily facilitating the dehydrogenation steps.

159
CHAPTER 5
CONCLUSIONS & OUTLOOK
This body of work explored the discovery of ammonia decomposition catalysts
using high throughput experimentation, as well understanding the use of hollandite as an
ammonia decomposition catalyst. Ammonia decomposition is a viable solution to
hydrogen storage and transportation, due to its high energy density, ease of transportation,
and liquification at 8 bar and 298K. Currently, the issues with ammonia decomposition are
that the cost of the Ru based catalyst are much too high for the large-scale manufacturing
of the catalyst to be realistic. Additionally, these catalysts need to be able to reach near
complete conversion at low temperatures, at or below 450°C, in order for this technology
to be pair with PEMFC, which can utilize the liberated hydrogen as a source of energy.
Ammonia decomposition occurs through sequential dehydrogenation steps, followed by
the recombination and desorption of molecular hydrogen and nitrogen. Typically, the rate
limiting step for this reaction is the recombination and desorption of molecular nitrogen.
However, catalysts also suffer from hydrogen poisoning at higher rates of reactions when
more hydrogen is generated from the decomposition of ammonia. The current body of
literature has explored optimization of Ru based catalysts, but typically these loadings are
in excess of 5% or more or require complex synthesis methods such as making carbon
nanotubes for supports. Other transition metals for this reaction include Fe, Co, and Ni,

160
however, these metals are intrinsically less active than Ru and exhibit poor performance at
the temperatures of interest.
In most cases, complete conversion is not met until roughly 600°C. Ultimately,
current catalysts are severely kinetically limited in the lower temperature range for this
simple reaction. There has been little work involving the discovery of multi component
catalysts for low temperature ammonia decomposition, and this fact is what motivated this
body of work presented here.
Previous work from our group used response surface methodology to optimize the
promoter and promoter loading for a 4% Ru catalyst. Through this study, they determined
that 4% Ru 12%K catalyst was the most active for low temperature ammonia
decomposition, and found that structurally, the catalyst consisted of KRu4O8 hollandite as
the Ru structure. The body of work presented here was aimed at understanding under what
conditions this structure could be form through impregnation techniques, as prior synthesis
methods for this structure involve solid state reactions, flux methods and hydrothermal
treatments. In Chapter 3, we investigated multiple variables involving the synthesis of
hollandite, as well as determined what the working state of the 4% Ru 12% K catalyst was
before ammonia decomposition reactions and began to unravel the reduction mechanism
of the hollandite structure. First, we investigated three different impregnation methods, dry
impregnation, incipiently wet impregnation, and strong electrostatic adsorption. We
determined that both dry and incipiently wet impregnation was able to form the hollandite
structure. The SEA method instead produced highly dispersed K on the alumina support,
with very small RuO2 nanoparticles. Additionally, we were able to determine that most of
the K used in the 4,12 RuK catalyst chemically modifies the alumina support by interaction

161
with the surface hydroxyl groups. This creates a KAl(OH)2CO3 compound that is known
to enhance the basicity of the support. We found that the addition of K to the Ru based
catalyst also lowers the apparent activation energy from 125.2 kJ/mol to 65.7 kJ/mol/. This
is most likely due to the electronic enhancement of the Ru active sites by electron donation
from K.
Next, we investigated whether or not which metal precursors were chosen for the
incipient wetness impregnation synthesis had any effect of hollandite formation. This
involved two different Ru precursors and three different K precursors. This study
determined that hollandite is able to be formed with the use of RuCl3 in combination with
KCH3COO and KOH, and not with Ru(acac)3 in combination with either KCH3COO, KOH
or KNO3. Next, we look at dilution volume use during the incipient wetness impregnation
method on the relative abundance of hollandite and KRuO4 formation on the 4,12 RuK
catalyst. The impregnation solution varied from 5 mL to 20 mL, which correlates to 4
impregnations up to 17 impregnations. We were able to determine that with lower solution
volumes, the ratio of hollandite to KRu4O8 was larger through the basis of XRD analysis
and decreased with increasing solution volume. We tested these catalysts for their ammonia
decomposition activity and an optimal dilution volume of 6 mL was determined to have
the highest activity at 300°C. Next, we looked at the effect of impregnation order on the
formation of hollandite. This provided insight into how the hollandite is formed, whether
or not Ru and K require intimate mixing to form some sort of layered precursor structure
to the hollandite or whether they grow epitaxially. The impregnation was changed from
co-impregnation of Ru and K to sequential impregnation of Ru followed by K, and then K
followed by Ru. These catalysts showed that when Ru was impregnated onto the catalyst
162
first, we could forego the formation of KCl. Additionally, when Ru is impregnated first,
hollandite was formed on the catalyst, but this was not the case when K was first
impregnated. This suggests that Ru acts as nucleation sites for the formation of hollandite.
Next, we looked at variables concerning the wet impregnation synthesis,
specifically the duration of the calcine treatment and also the temperature at which the
solution is evaporated during the wet impregnation and whether or not these variables had
any effect on the formation of hollandite for the 4,12 RuK catalyst. Specifically, we looked
at evaporation temperatures of 60°C, 90°C, 120°C and 150°C and calcine durations of 1
hr, 3 hr and 5 hr. We determined that at lowering evaporation temperatures of 60°C and
90°C, the hollandite structure was able to be formed after calcining at 550°C for either 1,
3 or 5 hr, but at higher temperatures, the hollandite could not form regardless of the calcine
temperature. The primary structure present instead of KRuO4. When these catalysts were
tested for ammonia decomposition, we found that an evaporation temperature of 90°C and
a calcine duration of 1 hr resulted in the highest activity at 300°C in 10% NH3/Ar and at a
space velocity of 30,000 mL/hr/gcat. Lastly we looked at the effect of lowering the K
loading on ammonia decomposition activity, as the original study did not investigate
loadings below 12%, but looked at loadings up to 36%. Here, we synthesized 4% Ru
catalysts with various K loadings from 0.5% to 15%, as well as 1% Ru catalysts with
various K loadings from 0.5% to 15%. Interestingly, both the 1% Ru and 4% Ru had an
optimal K loading of 12%. This is most likely due to the fact that K is utilized in the catalyst
in multiple ways, and not simply deposited in close proximity to Ru to enhance activity. In
addition to electronic enhancement, K also chemically modifies the surface of the alumina
has previously mentioned, and also acts to alleviate poisoning from Cl anions leftover from

163
the synthesis, by forming bulk KCl on the catalyst. Based on theoretical calculations of the
uptake of K+ on γ-Al2O3, the maximum uptake of K+ on our support would be 3.56 mmol
of K+. In addition, if all the Cl- interact to form KCl, that would account for an additional
2.37 mmol of K+. These two uses of K would account for roughly 97% utilization of the
K+.
In Chapter 3, the working state of the catalyst was also investigated. Mainly, we
wanted to determine whether or not the KRu4O8 hollandite structure was the active site
during the ammonia decomposition reaction or not. To determine this, the 4,12 RuK
catalyst after H2 reduction was studied using SEM, TEM and EDX. From SEM analysis,
the nanorod structures clearly underwent some degradation to form worm like structures
on the surface of the catalyst, which were further degraded after exposure to ammonia.
Elemental mapping confirmed that these worm-like structures were composed of Ru and
Cl, with K being highly dispersed about the surface of the support. TEM imaging showed
a clearer image of these rods in their fresh, reduced and spent state and measuring the
diameter of the rods determined that they shrink from an average diameter of 27.5 nm to
23 nm after reduction. The size does not further decrease after exposure to ammonia. XRD
analysis showed that the rods are composed of metallic Ru after reduction, and therefore
we can safely confirm that they completely decompose before the ammonia decomposition
reaction. H2-TPR was further used to reducibility of the hollandite structure compared to
4% Ru catalyst. While the 4% Ru catalyst showed typicaly reduction peaks for RuO2 as
well as uncalcined RuCl3 between the range of 100 – 200 °C, the 4% Ru, 12%K catalyst
had two major, broad reduction events. The low temperature event occurred between 75°C
and 200°C with maxima located at 120°C, 144°C and 156°C, and an even larger high

164
temperature event between 275°C and 500°C, with a maximum at 345°C. The reduction of
hollandite and the secondary phase formed during synthesis KRuO4, is not known.
Therefore, we further probed the reducibility of the catalyst through in-situ XRD
measurements to corroborate the reduction events with the disappearance of the major
XRD reflections of the two Ru species. Interestingly, we found that both the KRuO4 and
hollandite structure reduce by 150°C, and that metallic Ru did not appear until roughly
200°C, indicating that some sort of intermediary phase occurs before the hollandite reduces
to metallic Ru. Alternatively, the crystallite size of the Ru particles could have been too
small to be seen with XRD. Regardless, this gave us inside into the reduction temperature
of the catalyst, and that all of the metal oxides species reduce by 150°C. Additionally we
saw that the crystallite size of metallic Ru increases with increasing temperature all the
way up to our typical reduction temperature of 450°C. The particle size increased from 7.4
nm to 16.2 nm. The morphology of catalysts reduced at 250°C, 350°C and 450°C was
analyzed using SEM. We found that the metallic Ru nanosegments became much more
stalky with increasing reduction temperature. Additionally, the effect of reduction
temperature of the ammonia decomposition reactivity of the catalyst was measured.
Catalysts reduced at 250°C and 350°C showed the same activity, even with differences in
morphology and crystallite size. The catalyst when reduced at 450°C, showed dramatically
higher activity than the other two reduction temperatures. This may be due to the fact that
this catalyst had a higher fraction of B5 ensembles.
In Chapter 4, high throughput experimentation was used in order to find new low
temperature ammonia decomposition catalysts that contained less Ru than the previously
discussed catalyst containing 4% Ru and 12%K supported on γ-Al2O3. Ultimately the goal

165
here was to produce a catalyst with dramatically lowered Ru content, that also exhibited
high ammonia decomposition reactivity at low temperatures. High throughput
experimentation gives us the unique ability to test multiple catalysts in parallel, in order to
save on the cost of experimentation as well as time. This gives us the ability to test more
exotic and unique catalyst combinations than a typical single reactor plug flow reactor
would give. When high throughput experimentation is paired with machine learning
algorithms, one has the capability to dramatically reduce the amount of time and
experimentation required for new material discovery. Currently, most literature has only
been able to interpolate within specific ranges of compositions for catalyst discovery or
require complex density functional theory calculations or compiled literature data as a
training data set. Very few studies have the capabilities to generate the large amount of
data required for machine learning algorithms. Firstly, we attempted to find low Ru content
catalysts by adding secondary transition metals to 2% Ru. These included Co, Ni, Fe, Mn,
Zn Mo, Hf, Y and the precious metals Os, Rh, Pt, and Ir. In all cases, the addition of 2% of
these transition metals to a 2% Ru catalyst resulted in poorer activity than a 4% Ru catalyst
under identical conditions. This was not surprising, as similar results have been achieved
in the literature.
Therefore, a different approach was taken to new catalyst discovery. The previously
optimized catalyst containing 4% Ru and 12% K was used as a baseline and further
modified in two ways. Firstly, a secondary metal was introduced into the catalyst, of which
spanned the entire periodic table. Secondly, the total metal weight loading was held
constant at 4%, and varied such that either 1, 2 or 3% of Ru was replaced with one of the
secondary metals. These metals included Ca, Sr, Sc, Y, Zr, Hf, Nb, Ta, Cr, W, Mn, Re, Fe,

166
Os, Co, Rh, Ir, Ni, Pd, Pt, Cu Ag, Au Zn, Cd, In, Sn, Pb or Bi, which are denoted by the
letter “M”. The weight loadings were then either composed of 3%Ru, 1%M, 12%K (3,1,12
RuMK), 2%Ru, 2%M, 12%K (2,2,12 RuMK) or 1%Ru, 3%M, 12%K (1,3,12 RuMK) and
supported on γ-Al2O3. These catalysts were tested for low temperature ammonia
decomposition using a 16-channel parallel plug flow reactor and spatially resolved FTIR
for quantification of all 16 reactions in parallel.
The catalysts were then compared to the baseline 4,12 RuK catalyst tested from
250°C to 450°C under 1 %NH3/Ar at a space velocity of 30,000 mL/hr/gcat. Successful
“hits” were determined at 300°C that, which is an extremely mild ammonia decomposition
temperature and also produced the widest variety of responses from the 99 catalysts
studied. The successful catalysts were those that showed a higher activity than the baseline
catalyst at these conditions. From this study we found that substitution of Ru with Mg, Ca,
Sr, Sc, Y, Zr, Hf, Ta, Rh and Ir with less Ru. It is obvious that this approach was much
more successful than studying simply bi-metal catalyst systems. With as little as 1% Ru,
substitution with Sr, Zr, Y and Hf resulted in a much more active catalyst than the 4,12
RuK baseline. In order to better understand the relationship between catalyst composition,
present metal oxides and activity, XRD patterns were taken for each catalyst in the data
set. To this end, compositional analysis as well as peak fitting to determine the crystallite
size of each crystalline Ru component was performed to determine the average crystallite
size for each catalyst. The activity of each of the three weight loadings as a function of the
average particle size, secondary metal atomic number and ammonia decomposition activity
were then compared. With compositions of 3,1,12 RuMK we found that catalysts with
smaller particle sizes had higher activity, but that the atomic number of the secondary metal

167
was not much a factor. As the compositional loading decreased from 2,2,12 RuMK to
1,3,12 RuMK, the atomic number of the secondary element became a larger factor in
determining trends in the ammonia decomposition activity at 300°C. The catalysts with the
highest activity exhibited the smallest average Ru particle size and the smallest atomic
number of the secondary element. However, we found no discernible trends in Ru metal
oxides and secondary oxides present and ammonia decomposition activity. This may be
due to the strong interplay present between the composition, secondary metal and average
particle size in addition to a variety of other factors that makes elucidating trends not as
straight forward.
For these reasons, we introduced a framework combining high throughput
experimentation with machine learning algorithms using the experimental data collected
here. The purpose of this algorithm was to show that we can use small sets of data
(hundreds of points) to make predictions on catalyst activity and also to determine which
features of the catalyst are the most important in determining activity. These features
include structural, geometric and general chemical data describing metals. Additionally,
we added features that pertained to the synthesis parameters and operating conditions for
each catalyst such as moles of chlorine present, space velocity and ammonia concentration.
A random forest machine learning algorithm was developed for this purpose, and
ultimately, we determined that the most important features describing ammonia
decomposition activity across this range of catalysts was temperature, number of d-shell
valence electrons, electronegativity, covalent radius, work function and number of valence
electrons. While it was obvious that temperature is the most influential variable in

168
determining activity, this serves as a confirmation that the algorithm can indeed accurately
choose variables that influence activity.
Chapter 4 also provided further insight into two catalysts from the high throughput
screen, mainly one good performing set of catalysts containing Sr, and a poor performing
set of catalysts containing Fe. This served as a confirmation that the high throughput was
a good screening tool to find catalysts that can operate under more realistic conditions, and
also to under why one catalyst performed well while the other on did not. Firstly, the
apparent activation energy for each of the 3,1,12 RuSrK, 2,2,12 RuSrK, 1,3,12 RuSrK,
3,1,12 RuFeK, 2,2,12 RuFeK and 1,3,12 RuFeK catalysts was determined in 100% NH3 at
a space velocity of 5,400 ml/hr/gcat and under differential conditions. These values were
then compared to the 4 Ru and 4,12 RuK baseline catalyst. We found that the addition of
Sr increased the apparent activation energy from 65.7 kJ/mol (4,12 RuK) to 149.6 kJ/mol
for the 3,1,12 RuSrK catalyst. The apparent activation energy continued to slightly increase
with increasing Sr loading up to 156.4 kJ/mol. The Fe containing catalysts exhibited a
much higher apparent activation energy between the range of 226.6 kJ/mol and 250.1
kJ/mol. The TOF for each catalyst was also determined under the same conditions. The
1,3,12 RuSrK catalyst had the highest TOF of 1.78 s-1, over twice as active as the 4,12 RuK
catalyst with a TOF of 0.88 s-1. Ultimately, we determined that the substitution of Fe with
Ru replaced the active Ru sites with intrinsically less active Fe sites, while Sr instead
seemed to electronically modify the Ru active sites on the basis of the increasing TOF with
increasing Sr loading and the H2 uptake as determined through H2 chemisorption
experiments. Comparing the activation energy needed for various steps in the ammonia
decomposition reaction, it seems that the addition of Sr may act to change the rate limiting

169
step from the recombination and desorption of N2 to some combination of the
dehydrogenation of NHx species. CO adsorption was performed on 4 Ru, 4,12 RuK, 1,3,12
RuFeK and 1,3,12 RuSrK to further confirm whether Sr modifies or produces different
sites on the Ru catalysts based on the different adsorption configurations of CO on Ru. We
determined that the addition of Sr produced relatively more linearly adsorbed CO and acted
to weaken the CO triple bond on Ru sites, which analogously which could facilitate the
dehydrogenation steps during ammonia decomposition.
Ultimately this work has shown that high throughput experimentation gives us a
unique ability to generate massive, multidimensional datasets that are not typical for
heterogeneous catalysis. Here, we demonstrated the synthesis and catalytic screening of
over 100 different Ru based bimetallic catalysts for low temperature ammonia
decomposition. The aim of this study was to discovery novel elements and catalyst
formulations that could result in a less expensive and highly active ammonia
decomposition catalyst at temperatures below 450°C. We showed that high throughput
experimentation can be a powerful for new catalyst discovery when an appropriate design
space is chosen based on domain knowledge for the reaction in hand. Additionally, when
combined with machine learning, the efficiency of screening and catalyst discovery can
maximize further.

170
BIBLIOGRAPHY
1. BP, “Statistical Review of World Energy” (2020), (available at
www.bp.com/statisticalreview.).
2. D. H. Vo, A. T. Vo, C. M. Ho, H. M. Nguyen, The role of renewable energy,
alternative and nuclear energy in mitigating carbon emissions in the CPTPP
countries. Renew. Energy. 161, 278–292 (2020).
3. S. J. Zinkle, G. S. Was, Materials challenges in nuclear energy. Acta Mater. 61,
735–758 (2013).
4. K. Menyah, Y. Wolde-Rufael, CO2 emissions, nuclear energy, renewable energy
and economic growth in the US. Energy Policy. 38, 2911–2915 (2010).
5. A. S. Iyer, S. J. Couch, G. P. Harrison, A. R. Wallace, Variability and phasing of
tidal current energy around the United Kingdom. Renew. Energy. 51, 343–357
(2013).
6. S. Guo, Q. Liu, J. Sun, H. Jin, A review on the utilization of hybrid renewable
energy. Renew. Sustain. Energy Rev. 91 (2018), pp. 1121–1147.
7. E. Kabir, P. Kumar, S. Kumar, A. A. Adelodun, K. H. Kim, Solar energy: Potential
and future prospects. Renew. Sustain. Energy Rev. 82 (2018), pp. 894–900.
8. S. A. Sherif, F. Barbir, T. N. Veziroglu, Wind energy and the hydrogen economy-
review of the technology. Sol. Energy. 78, 647–660 (2005).
9. E. L. V. Eriksson, E. M. A. Gray, Optimization and integration of hybrid
renewable energy hydrogen fuel cell energy systems – A critical review. Appl.
Energy. 202 (2017), pp. 348–364.
10. A. Chapman, K. Itaoka, K. Hirose, F. T. Davidson, K. Nagasawa, A. C. Lloyd, M.
E. Webber, Z. Kurban, S. Managi, T. Tamaki, M. C. Lewis, R. E. Hebner, Y. Fujii,
A review of four case studies assessing the potential for hydrogen penetration of
the future energy system. Int. J. Hydrogen Energy. 44 (2019), pp. 6371–6382.
11. A. Midilli, M. Ay, I. Dincer, M. A. Rosen, On hydrogen and hydrogen energy
strategies I : Current status and needs. Renew. Sustain. Energy Rev. 9 (2005), pp.
255–271.
12. J. D. Fonseca, M. Camargo, J. M. Commenge, L. Falk, I. D. Gil, Trends in design
of distributed energy systems using hydrogen as energy vector: A systematic
literature review. Int. J. Hydrogen Energy. 44, 9486–9504 (2019).

171
13. J. O. M. Bockris, The hydrogen economy: Its history. Int. J. Hydrogen Energy. 38,
2579–2588 (2013).
14. G. W. Crabtree, M. S. Dresselhaus, M. V. Buchanan, The hydrogen economy.
Phys. Today. 57, 39–44 (2004).
15. J. Bockris, A. . Appleby, The Hydrogen Economy - An Ultimate Economy?
Environ. This Mon., 29 (1972).
16. L. Ouyang, K. Chen, J. Jiang, X. S. Yang, M. Zhu, Hydrogen storage in light-
metal based systems: A review. J. Alloys Compd. 829 (2020),
doi:10.1016/j.jallcom.2020.154597.
17. K. Alanne, S. Cao, Zero-energy hydrogen economy (ZEH2E) for buildings and
communities including personal mobility. Renew. Sustain. Energy Rev. 71 (2017),
pp. 697–711.
18. Y. Wang, D. F. Ruiz Diaz, K. S. Chen, Z. Wang, X. C. Adroher, Materials,
technological status, and fundamentals of PEM fuel cells – A review. Mater.
Today. 32 (2020), pp. 178–203.
19. G. Karanfil, Importance and applications of DOE/optimization methods in PEM
fuel cells: A review. Int. J. Energy Res. 44 (2020), pp. 4–25.
20. S. Chiuta, R. C. Everson, H. W. J. P. Neomagus, P. Van Der Gryp, D. G.
Bessarabov, Reactor technology options for distributed hydrogen generation via
ammonia decomposition: A review. Int. J. Hydrogen Energy. 38 (2013), pp.
14968–14991.
21. R. Pinsky, P. Sabharwall, J. Hartvigsen, J. O’Brien, Comparative review of
hydrogen production technologies for nuclear hybrid energy systems. Prog. Nucl.
Energy. 123 (2020), , doi:10.1016/j.pnucene.2020.103317.
22. DOE, DOE Hydrogen and Fuel Cells Program: Hydrogen Storage. U.S Dep.
Energy. 25, 6 (2009).
23. S. Mukherjee, S. V. Devaguptapu, A. Sviripa, C. R. F. Lund, G. Wu, Low-
temperature ammonia decomposition catalysts for hydrogen generation. Appl.
Catal. B Environ. 226, 162–181 (2018).
24. DOE Technical Targets for Onboard Hydrogen Storage for Light-Duty Vehicles |
Department of Energy, (available at https://www.energy.gov/eere/fuelcells/doe-
technical-targets-onboard-hydrogen-storage-light-duty-vehicles).
25. T. Hua, R. Ahluwalia, L. Eudy, G. Singer, B. Jermer, N. Asselin-Miller, S. Wessel,
T. Patterson, J. Marcinkoski, Status of hydrogen fuel cell electric buses worldwide.
J. Power Sources. 269 (2014), pp. 975–993.
26. K. Young, M. Young, T. Ouchi, B. Reichman, M. A. Fetcenko, Improvement in
high-rate dischargeability, activation, and low-temperature performance in multi-
phase AB 2 alloys by partial substitution of Zr with y. J. Power Sources. 215, 279–
287 (2012).

172
27. B. Sakintuna, F. Lamari-Darkrim, M. Hirscher, Metal hydride materials for solid
hydrogen storage: A review. Int. J. Hydrogen Energy. 32, 1121–1140 (2007).
28. A. Klerke, C. H. Christensen, J. K. Nørskov, T. Vegge, Ammonia for hydrogen
storage: challenges and opportunities (2008), doi:10.1039/b720020j.
29. S. K. Seo, D. Y. Yun, C. J. Lee, Design and optimization of a hydrogen supply
chain using a centralized storage model. Appl. Energy. 262, 1–20 (2020).
30. R.-Y. Chein, Y.-C. Chen, C.-S. Chang, J. N. Chung, Numerical modeling of
hydrogen production from ammonia decomposition for fuel cell applications. Int.
J. Hydrogen Energy. 35, 589–597 (2009).
31. A. Valera-Medina, H. Xiao, M. Owen-Jones, W. I. F. David, P. J. Bowen,
Ammonia for power. Prog. Energy Combust. Sci. 69 (2018), pp. 63–102.
32. K. E. Lamb, M. D. Dolan, D. F. Kennedy, Ammonia for hydrogen storage; A
review of catalytic ammonia decomposition and hydrogen separation and
purification. Int. J. Hydrogen Energy. 44 (2019), pp. 3580–3593.
33. A. Patil, L. Laumans, H. Vrijenhoef, in Procedia Engineering (Elsevier Ltd,
2014), vol. 83, pp. 322–327.
34. A. Valera-Medina, H. Xiao, M. Owen-Jones, W. I. F. David, P. J. Bowen,
Ammonia for power. Prog. Energy Combust. Sci. 69 (2018), pp. 63–102.
35. D. W. Kang, J. H. Holbrook, Use of NH3 fuel to achieve deep greenhouse gas
reductions from US transportation. Energy Reports. 1, 164–168 (2015).
36. A. Tullo, Yara plans to make green ammonia in Norway. c&en (2020), (available
at https://cen.acs.org/business/petrochemicals/Yara-plans-make-green-
ammonia/98/web/2020/12).
37. J. R. Bartels, “A feasibility study of implementing an Ammonia Economy,”
(available at https://lib.dr.iastate.edu/etd).
38. L. Ye, R. Nayak-Luke, R. Bañares-Alcántara, E. Tsang, Reaction: “Green”
Ammonia Production. Chem. 3 (2017), pp. 712–714.
39. T. Brown, Yara: solar ammonia pilot plant, for start-up in 2019. Ammon. Ind.
(2018), (available at https://ammoniaindustry.com/yara-solar-ammonia-pilot-plant-
for-start-up-in-2019/).
40. Fertilizer prices fall to lowest levels in a decade, economist says | Successful
Farming. Success. Farming (2020), (available at
https://www.agriculture.com/news/crops/fertilizer-prices-fall-to-lowest-levels-in-a-
decade-economist-says).
41. J. Reed, “DOE Hydrogen and Fuel Cell Technical Advisory Committee Hydrogen
Energy Storage Activities” (2015).
173
42. C. H. Christensen, R. Z. Sørensen, T. Johannessen, U. J. Quaade, K. Honkala, T.
D. Elmøe, R. Køhler, J. K. Nørskov, Metal ammine complexes for hydrogen
storage. J. Mater. Chem. 15 (2005), pp. 4106–4108.
43. REFUEL | arpa-e.energy.gov, (available at https://arpa-
e.energy.gov/technologies/programs/refuel).
44. Trevor Brown, Ammonia production causes 1% of total global GHG emissions.
Ammon. Ind. (2016), (available at https://ammoniaindustry.com/ammonia-
production-causes-1-percent-of-total-global-ghg-emissions/).
45. H. Bielawa, O. Hinrichsen, A. Birkner, M. Muhler, The Ammonia-Synthesis
Catalyst of the Next Generation: Barium-Promoted Oxide-Supported Ruthenium.
Angew. Chemie Int. Ed. 40, 1061–1063 (2001).
46. G. Ertl, H. Knozinger, F. Schuth, J. Weitkamp, Handbook of Heterogenous
Catalysis Vol. 1 (ed. 2, 2011).
47. Saudi Aramco, World’s first blue ammonia shipment opens new route to a
sustainable future. Saudi Aramco (2020), (available at
https://www.aramco.com/en/news-media/news/2020/first-blue-ammonia-
shipment).
48. T. Brown, Saudi Arabia ships low-carbon ammonia to Japan - Ammonia Energy
Association. Ammon. Energy (2020), (available at
https://www.ammoniaenergy.org/articles/saudi-arabia-ships-low-carbon-ammonia-
to-japan/).
49. Air Products, Air Products, ACWA Power and NEOM Sign Agreement for $5
Billion Production Facility in NEOM Powered by Renewable Energy for
Production and Export of Green Hydrogen to Global Markets. Press release, Air
Prod. Chem. Inc. (2020), (available at https://newsroom.neom.com/air-products-
acwa-power-and-neom-sign-agreement-for-5-billion-production-facility-in-neom-
powered-by-renewable-energy-for-production-and-export-of-green-hydrogen-to-
global-markets-321553).
50. Monolith, Monolith Materials Plans to Build Country’s First Large Scale Carbon-
Free Ammonia Plant (2020), (available at
https://monolithmaterials.com/news/monolith-materials-carbon-free-ammonia-
plant).
51. V. Chaturvedi, M. Hejazi, J. Edmonds, L. Clarke, P. Kyle, E. Davies, M. Wise,
Climate mitigation policy implications for global irrigation water demand. Mitig.
Adapt. Strateg. Glob. Chang. 20, 389–407 (2013).
52. V. Chaturvedi, P. N. Koti, R. Sugam, K. Neog, M. Hejazi, Cooperation or rivalry?
Impact of alternative development pathways on India’s long-term electricity
generation and associated water demands. Energy. 192, 116708 (2020).
53. A. Boretti, L. Rosa, Reassessing the projections of the World Water Development
Report. npj Clean Water. 2, 1–6 (2019).

174
54. K. McCullough, P. H. Chiang, J. D. Jimenez, J. A. Lauterbach, Material discovery
and high throughput exploration of Ru based catalysts for low temperature
ammonia decomposition. Materials (Basel). 13, 1–19 (2020).
55. T. E. Bell, H2 Production via Ammonia Decomposition Using Non-Noble Metal
Catalysts: A Review. Top. Catal. 59, 1438–1457 (2016).
56. R. Halseid, Ammonia as Hydrogen Carrier: Effects of Ammonia on Polymer
Electrolyte Membrane Fuel Cells. 089, 1–264 (2004).
57. J. N. Armor, Overcoming equilibrium limitations in chemical processes. Appl.
Catal. A Gen. 222, 91–99 (2001).
58. A. Di Carlo, A. Dell’Era, Z. Del Prete, 3D simulation of hydrogen production by
ammonia decomposition in a catalytic membrane reactor. Int. J. Hydrogen Energy.
36, 11815–11824 (2011).
59. S.-F. Yin, B.-Q. Xu, C.-F. Ng, C.-T. Au, Nano Ru/CNTs: a highly active and
stable catalyst for the generation of CO x -free hydrogen in ammonia
decomposition. Appl. Catal. B Environ. 48, 237–241 (2004).
60. W. Zheng, J. Zhang, B. Zhu, R. Blume, Y. Zhang, K. Schlichte, R. Schlögl, F.
Schüth, D. S. Su, Structure-Function Correlations for Ru/CNT in the Catalytic
Decomposition of Ammonia. ChemSusChem. 3, 226–230 (2010).
61. S. J. Wang, S. F. Yin, L. Li, B. Q. Xu, C. F. Ng, C. T. Au, Investigation on
modification of Ru/CNTs catalyst for the generation of COx-free hydrogen from
ammonia. Appl. Catal. B Environ. 52, 287–299 (2004).
62. S. F. Yin, Q. H. Zhang, B. Q. Xu, W. X. Zhu, C. F. Ng, C. T. Au, Investigation on
the catalysis of CO x -free hydrogen generation from ammonia. J. Catal. 224,
384–396 (2004).
63. A. K. Hill, L. Torrente-Murciano, Low temperature H2 production from ammonia
using ruthenium-based catalysts: Synergetic effect of promoter and support. Appl.
Catal. B, Environ. 172–173, 129–135 (2015).
64. R. Schlögl, “Part B 2.1. Ammonia Synthesis,” (available at www.fhi-
berlin.mpg.de/ac).
65. I. Chorkendorff, J. W. Niemantsverdriet, Concepts of Modern Catalysis and
Kinetics (2007).
66. A. Mittasch, W. Frankenburg, Early studies of multicomponet catalysts. Adv.
Catal. 2, 81–104 (1950).
67. Y. Ogura, K. Sato, S. I. Miyahara, Y. Kawano, T. Toriyama, T. Yamamoto, S.
Matsumura, S. Hosokawa, K. Nagaoka, Efficient ammonia synthesis over a
Ru/La0.5Ce0.5O1.75 catalyst pre-reduced at high temperature. Chem. Sci. 9,
2230–2237 (2018).

175
68. G. Ertl, Reactions at Surfaces: From Atoms to Complexity (Nobel Lecture).
Angew. Chemie Int. Ed. 47, 3524–3535 (2008).
69. G. Somorjai, Introduction to Surface Chemistry and Catalysis (1993).
70. H. Liu, Ammonia synthesis catalyst 100 years: Practice, enlightenment and
challenge. Cuihua Xuebao/Chinese J. Catal. 35 (2014), pp. 1619–1640.
71. G. A. Somorjai, N. Materer, Surface structures in ammonia synthesis. Top. Catal.
1, 215–231 (1994).
72. A. Boisen, S. Dahl, J. K. Nørskov, C. H. Christensen, Why the optimal ammonia
synthesis catalyst is not the optimal ammonia decomposition catalyst. J. Catal.
230, 309–312 (2005).
73. M. Kitano, S. Kanbara, Y. Inoue, N. Kuganathan, P. V Sushko, T. Yokoyama, M.
Hara, H. Hosono, Electride support boosts nitrogen dissociation over ruthenium
catalyst and shifts the bottleneck in ammonia synthesis. Nat. Commun. 6, 1–9
(2015).
74. M. Saito, M. Itoh, J. Iwamoto, C. Y. Li, K. I. Machida, Synergistic effect of MgO
and CeO2 as a support for ruthenium catalysts in ammonia synthesis. Catal.
Letters. 106, 107–110 (2006).
75. X. Wang, J. Ni, B. Lin, R. Wang, J. Lin, K. Wei, Highly efficient Ru/MgO-CeO2
catalyst for ammonia synthesis. Catal. Commun. 12, 251–254 (2010).
76. X. Ju, L. Liu, P. Yu, J. Guo, X. Zhang, T. He, G. Wu, P. Chen, Mesoporous
Ru/MgO prepared by a deposition-precipitation method as highly active catalyst
for producing COx-free hydrogen from ammonia decomposition. Appl. Catal. B
Environ. 211, 167–175 (2017).
77. A. S. Chellappa, C. M. Fischer, W. J. Thomson, W. J. Chellappa, A.S., Fischer,
C.M.,Thomson, Ammonia decomposition kinetics over Ni-Pt/Al2O3 for PEM fuel
cell applications. Appl. Catal. A. 227, 231–240 (2002).
78. J. C. Ganley, F. S. Thomas, E. G. Seebauer, R. I. Masel, A priori catalytic activity
correlations: the difficult case of hydrogen production from ammonia. Catal.
Letters. 96, 117–122 (2004).
79. A. J. Medford, A. Vojvodic, J. S. Hummelshøj, J. Voss, F. Abild-Pedersen, F.
Studt, T. Bligaard, A. Nilsson, J. K. Nørskov, From the Sabatier principle to a
predictive theory of transition-metal heterogeneous catalysis. J. Catal. 328, 36–42
(2015).
80. C. J. H. Jacobsen, S. Dahl, B. G. S. Clausen, S. Bahn, A. Logadottir, J. K.
Nørskov, Catalyst design by interpolation in the periodic table: Bimetallic
ammonia synthesis catalysts. J. Am. Chem. Soc. 123, 8404–8405 (2001).
81. W. Tsai, W. H. Weinberg, Steady-state decomposition of ammonia on the Ru(001)
surface. J. Phys. Chem. 91, 5302–5307 (1987).
176
82. M. C. J. Bradford, P. E. Fanning, M. A. Vannice, Kinetics of NH 3 Decomposition
over Well Dispersed Ru. History. 484, 479–484 (2000).
83. C. Egawa, T. Nishida, S. Naito, K. Tamaru, Ammonia decomposition on (1 1 10)
and (0 0 1) surfaces of ruthenium. J. Chem. Soc. Farady Trans. Phys. Chem.
Condens. Phases. 80, 1595–1604 (1984).
84. V. Prasad, A. M. Karim, A. Arya, D. G. Vlachos, Assessment of overall rate
expressions and multiscale, microkinetic model uniqueness via experimental data
injection: Ammonia decomposition on Ru/γ-Al2O3 for hydrogen production. Ind.
Eng. Chem. Res. 48, 5255–5265 (2009).
85. F. Hayashi, Y. Toda, Y. Kanie, M. Kitano, Y. Inoue, T. Yokoyama, M. Hara, H.
Hosono, Ammonia decomposition by ruthenium nanoparticles loaded on inorganic
electride C12A7:e-. Chem. Sci. 4, 3124–3130 (2013).
86. H. Shi, K. Jacobi, G. Ertl, Dissociative chemisorption of nitrogen on Ru(0001). J.
Chem. Phys. 99, 9248–9254 (1993).
87. O. Hinrichsen, F. Rosowski, A. Hornung, M. Muhler, G. Ertl, The kinetics of
ammonia synthesis over Ru-based catalysts: 1. The dissociative chemisorption and
associative desorption of N2. J. Catal. 165, 33–44 (1997).
88. F. Schuth, R. Palkovits, R. Schlogl Ogl, D. S. Su, Ammonia as a possible element
in an energy infrastructure: catalysts for ammonia decomposition. Energy Environ.
Sci. 5, 6278 (2012).
89. D. A. Hansgen, L. M. Thomanek, J. G. Chen, D. G. Vlachos, Experimental and
theoretical studies of ammonia decomposition activity on Fe-Pt, Co-Pt, and Cu-Pt
bimetallic surfaces. J. Chem. Phys. 134, 184701 (2011).
90. D. A. Hansgen, D. G. Vlachos, J. G. Chen, Using first principles to predict
bimetallic catalysts for the ammonia decomposition reaction. Nat. Chem. 2, 484–
489 (2010).
91. J. Ji, X. Duan, G. Qian, X. Zhou, G. Tong, W. Yuan, Towards an efficient
CoMo/γ-Al2O3 catalyst using metal amine metallate as an active phase precursor:
Enhanced hydrogen production by ammonia decomposition. Int. J. Hydrogen
Energy. 39, 12490–12498 (2014).
92. P. Xie, Y. Yao, Z. Huang, Z. Liu, J. Zhang, T. Li, G. Wang, R. Shahbazian-Yassar,
L. Hu, C. Wang, Highly efficient decomposition of ammonia using high-entropy
alloy catalysts. Nat. Commun. 10 (2019), doi:10.1038/s41467-019-11848-9.
93. D. M. Prices, Daily metal Price (2020).
94. L. H. Yao, Y. X. Li, J. Zhao, W. J. Ji, C. T. Au, Core–shell structured
nanoparticles (M@SiO 2 , Al2O3 , MgO; M = Fe, Co, Ni, Ru) and their
application in COx -free H2 production via NH3 decomposition. Catal. Today.
158, 401–408 (2010).

177
95. M. Feyen, C. Weidenthaler, R. Güttel, K. Schlichte, U. Holle, A. H. Lu, F. Schüth,
High-temperature stable, iron-based core-shell catalysts for ammonia
decomposition. Chem. - A Eur. J. 17, 598–605 (2011).
96. A. Jedynak, Z. Kowalczyk, D. Szmigiel, W. Raróg, J. Zieliski, Ammonia
decomposition over the carbon-based iron catalyst promoted with potassium. Appl.
Catal. A Gen. 237, 223–226 (2002).
97. J. Ji, X. Duan, G. Qian, P. Li, X. Zhou, D. Chen, W. Yuan, Fe particles on the tops
of carbon nanofibers immobilized on structured carbon microfibers for ammonia
decomposition. Catal. Today. 216, 254–260 (2013).
98. X. Duan, G. Qian, X. Zhou, Z. Sui, D. Chen, W. Yuan, Tuning the size and shape
of Fe nanoparticles on carbon nanofibers for catalytic ammonia decomposition.
Appl. Catal. B Environ. 101, 189–196 (2011).
99. A.-H. H. Lu, J.-J. J. Nitz, M. Comotti, C. Weidenthaler, K. Schlichte, C. W.
Lehmann, O. Terasaki, F. Schüth, Spatially and Size Selective Synthesis of Fe-
Based Nanoparticles on Ordered Mesoporous Supports as Highly Active and
Stable Catalysts for Ammonia Decomposition. J. Am. Chem. Soc. 132, 14152–
14162 (2010).
100. D. Varisli, N. G. Kaykac, CO x free hydrogen production over cobalt incorporated
silicate structured mesoporous catalysts. Appl. Catal. B Environ. 127, 389–398
(2012).
101. X.-K. K. Li, W.-J. J. Ji, J. Zhao, S.-J. J. Wang, C.-T. T. Au, Ammonia
decomposition over Ru and Ni catalysts supported on fumed SiO 2 , MCM-41, and
SBA-15. J. Catal. 236, 181–189 (2005).
102. Z. P. Hu, C. C. Weng, C. Chen, Z. Y. Yuan, Catalytic decomposition of ammonia
to COx-free hydrogen over Ni/ZSM-5 catalysts: A comparative study of the
preparation methods. Appl. Catal. A Gen. 562, 49–57 (2018).
103. I. Lucentini, A. Casanovas, J. Llorca, Catalytic ammonia decomposition for
hydrogen production on Ni, Ru and Ni[sbnd]Ru supported on CeO2. Int. J.
Hydrogen Energy. 44, 12693–12707 (2019).
104. W. Zheng, J. Zhang, Q. Ge, H. Xu, W. Li, Effects of CeO2 addition on Ni/Al2O3
catalysts for the reaction of ammonia decomposition to hydrogen. Appl. Catal. B
Environ. 80, 98–105 (2008).
105. Z. Lendzion-Bieluń, R. Pelka, W. Arabczyk, Study of the kinetics of ammonia
synthesis and decomposition on iron and cobalt catalysts. Catal. Letters. 129, 119–
123 (2009).
106. Ł. Czekajło, Z. Lendzion-Bieluń, Effect of preparation conditions and promoters
on the structure and activity of the ammonia decomposition reaction catalyst based
on nanocrystalline cobalt. Chem. Eng. J. 289, 254–260 (2016).
178
107. L. Torrente-Murciano, A. K. Hill, T. E. Bell, Ammonia decomposition over
cobalt/carbon catalysts—Effect of carbon support and electron donating promoter
on activity. Catal. Today. 286, 131–140 (2017).
108. D. R. Strongin, G. A. Somorjai, THE EFFECTS OF POTASSIUM ON THE
AMMONIA SYNTHESIS OVER IRON SINGLE CRYSTAL SURFACES. Catal.
J. 109, 51–60 (1988).
109. S. Dahl, E. Törnqvist, I. Chorkendorff, Dissociative adsorption of N2 on
Ru(0001): A surface reaction totally dominated by steps. J. Catal. 192, 381–390
(2000).
110. G. A. Somorjai, (Springer, Berlin, Heidelberg, 1984;
https://link.springer.com/chapter/10.1007/978-3-642-82253-7_1), pp. 1–22.
111. S. Dahl, A. Logadottir, R. C. Egeberg, J. H. Larsen, I. Chorkendorff, E. Törnqvist,
J. K. NØrskov, Role of steps in N2 activation on Ru(0001). Phys. Rev. Lett. 83,
1814–1817 (1999).
112. R. Van Hardeveld, F. Hartog, The statistics of surface atoms and surface sites on
metal crystals. Surf. Sci. 15, 189–230 (1969).
113. C. J. H. Jacobsen, S. Dahl, P. L. Hansen, E. Törnqvist, L. Jensen, H. Topsøe, D. V
Prip, P. B. Møenshaug, I. Chorkendorff, Structure sensitivity of supported
ruthenium catalysts for ammonia synthesis. J. Mol. Catal. A Chem. 163, 19–26
(2000).
114. A. M. Karim, V. Prasad, G. Mpourmpakis, W. W. Lonergan, A. I. Frenkel, J. G.
Chen, D. G. Vlachos, Correlating particle size and shape of supported Ru/γ-Al2O3
catalysts with NH3 decomposition activity. J. Am. Chem. Soc. 131, 12230–12239
(2009).
115. K. Kishida, M. Kitano, Y. Inoue, M. Sasase, T. Nakao, T. Tada, H. Abe, Y. Niwa,
T. Yokoyama, M. Hara, H. Hosono, Large Oblate Hemispheroidal Ruthenium
Particles Supported on Calcium Amide as Efficient Catalysts for Ammonia
Decomposition. Chem. - A Eur. J. 24, 7976–7984 (2018).
116. D. Szmigiel, W. Raróg-Pilecka, E. Miśkiewicz, Z. Kaszkur, Z. Kowalczyk,
Ammonia decomposition over the ruthenium catalysts deposited on magnesium-
aluminum spinel. Appl. Catal. A Gen. 264, 59–63 (2004).
117. W. Raróg, Z. Kowalczyk, J. Sentek, D. Składanowski, D. Szmigiel, J. Zieliñski,
Decomposition of ammonia over potassium promoted ruthenium catalyst
supported on carbon. Appl. Catal. A Gen. 208, 213–216 (2001).
118. W. Pyrz, R. Vijay, J. Binz, J. Lauterbach, D. J. Buttrey, Characterization of K-
promoted Ru catalysts for ammonia decomposition discovered using high-
throughput experimentation. Top. Catal. 50, 180–191 (2008).
119. H. Sheng Zeng, K. Inazu, K. I. Aika, The working state of the barium promoter in
ammonia synthesis over an active-carbon-supported ruthenium catalyst using
barium nitrate as the promoter precursor. J. Catal. 211, 33–41 (2002).

179
120. Z. Hu, J. Mahin, S. Datta, T. E. Bell, L. Torrente-Murciano, Ru-Based Catalysts
for H2 Production from Ammonia: Effect of 1D Support. Top. Catal. 1 (2018), pp.
1–3.
121. K. ichi Aika, T. Takano, S. Murata, Preparation and characterization of chlorine-
free ruthenium catalysts and the promoter effect in ammonia synthesis. 3. A
magnesia-supported ruthenium catalyst. J. Catal. 136, 126–140 (1992).
122. P. Yu, J. Guo, L. Liu, P. Wang, F. Chang, H. Wang, X. Ju, P. Chen, Effects of
Alkaline Earth Metal Amides on Ru in Catalytic Ammonia Decomposition. J.
Phys. Chem. C. 120, 2822–2828 (2016).
123. S. F. Yin, B. Q. Xu, X. P. Zhou, C. T. Au, A mini-review on ammonia
decomposition catalysts for on-site generation of hydrogen for fuel cell
applications. Appl. Catal. A Gen. 277, 1–9 (2004).
124. J. Zhang, H. Xu, Q. Ge, W. Li, Highly efficient Ru/MgO catalysts for NH 3
decomposition: Synthesis, characterization and promoter effect. Catal. Commun.
7, 148–152 (2006).
125. S. Murata, K. I. Aika, Removal of chlorine ions from Ru/MgO catalysts for
ammonia synthesis. Appl. Catal. A, Gen. 82, 1–12 (1992).
126. E. D’Addio, thesis, University of Delaware (2011).
127. J. J. Hanak, The “multiple-sample concept” in materials research: Synthesis,
compositional analysis and testing of entire multicomponent systems. J. Mater.
Sci. 5, 964–971 (1970).
128. W. F. Maier, Early years of high-throughput experimentation and combinatorial
approaches in catalysis and materials science. ACS Comb. Sci. 21, 437–444 (2019).
129. J. G. Creer, P. Jackson, G. Pandy, G. G. Percival, D. Seddon, The design and
construction of a multichannel microreactor for catalyst evaluation. Appl. Catal.
22, 85–95 (1986).
130. R. J. Hendershot, C. M. Snively, J. Lauterbach, High-throughput heterogeneous
catalytic science. Chem. - A Eur. J. 11 (2005), pp. 806–814.
131. NIST, NIST/SEMATECH e-Handbook of Statistical Methods (2012).
132. J. Urschey, A. Kühnle, W. F. Maier, Combinatorial and conventional development
of novel dehydrogenation catalysts. Appl. Catal. A Gen. 252, 91–106 (2003).
133. K. Takahashi, I. Miyazato, S. Nishimura, J. Ohyama, Unveiling Hidden Catalysts
for the Oxidative Coupling of Methane based on Combining Machine Learning
with Literature Data. ChemCatChem. 10, 3223–3228 (2018).
134. T. N. Nguyen, T. T. P. Nhat, K. Takimoto, A. Thakur, S. Nishimura, J. Ohyama, I.
Miyazato, L. Takahashi, J. Fujima, K. Takahashi, T. Taniike, High-Throughput
Experimentation and Catalyst Informatics for Oxidative Coupling of Methane.
ACS Catal. 10, 921–932 (2020).

180
135. R. J. Hendershot, S. S. Lasko, M. F. Fellmann, G. Oskarsdottir, W. Nicholas
Delgass, C. M. Snively, J. Lauterbach, A novel reactor system for high throughput
catalyst testing under realistic conditions. Appl. Catal. A Gen. 254, 107–120
(2003).
136. J. C. Dellamorte, M. A. Barteau, J. Lauterbach, Opportunities for catalyst
discovery and development: Integrating surface science and theory with high
throughput methods. Surf. Sci. 603, 1770–1775 (2009).
137. J. Emmanuel, B. E. Hayden, J. Saleh-Subaie, The particle size dependence of CO
oxidation on model planar titania supported gold catalysts measured by parallel
thermographic imaging. J. Catal. 369, 175–180 (2019).
138. K. Mingle, thesis, University of South Carolina (2018).
139. K. McCullough, T. Williams, K. Mingle, P. Jamshidi, J. Lauterbach, High-
throughput experimentation meets artificial intelligence: A new pathway to
catalyst discovery. Phys. Chem. Chem. Phys. 22 (2020), pp. 11174–11196.
140. L. Ward, A. Agrawal, A. Choudhary, C. Wolverton, A general-purpose machine
learning framework for predicting properties of inorganic materials. Npj Comput.
Mater. 2, 16028 (2016).
141. B. R. Goldsmith, J. Esterhuizen, J.-X. Liu, C. J. Bartel, C. Sutton, Machine
learning for heterogeneous catalyst design and discovery. AIChE J. 64, 2311–2323
(2018).
142. Z. Li, S. Wang, W. S. S. Chin, L. E. E. Achenie, H. Xin, High-throughput
screening of bimetallic catalysts enabled by machine learning. J. Mater. Chem. A.
5, 24131–24138 (2017).
143. E. J. Kluender, J. L. Hedrick, K. A. Brown, R. Rao, B. Meckes, J. S. Du, L. M.
Moreau, B. Maruyama, C. A. Mirkin, Catalyst discovery through megalibraries of
nanomaterials. Proc. Natl. Acad. Sci. U. S. A. 116, 40–45 (2019).
144. B. Sun, H. Barron, G. Opletal, A. S. Barnard, From Process to Properties:
Correlating Synthesis Conditions and Structural Disorder of Platinum
Nanocatalysts. J. Phys. Chem. C. 122, 28085–28093 (2018).
145. A. Corma, J. M. Serra, E. Argente, V. Botti, S. Valero, Application of artificial
neural networks to combinatorial catalysis: Modeling and predicting ODHE
catalysts. ChemPhysChem. 3, 939–945 (2002).
146. A. Corma, J. M. Serra, P. Serna, M. Moliner, Integrating high-throughput
characterization into combinatorial heterogeneous catalysis: Unsupervised
construction of quantitative structure/property relationship models. J. Catal. 232,
335–341 (2005).
147. T. Williams, K. McCullough, J. A. Lauterbach, Enabling Catalyst Discovery
through Machine Learning and High-Throughput Experimentation. Chem. Mater.
32, 157–165 (2020).

181
148. J. Hattrick-Simpers, C. Wen, J. Lauterbach, The materials super highway:
integrating high-throughput experimentation into mapping the catalysis materials
genome. Catal. Letters. 145, 290–298 (2015).
149. E. Sasmaz, K. Mingle, J. Lauterbach, High-throughput screening using Fourier-
transform infrared imaging. Engineering. 1, 234–242 (2015).
150. J. Hu, L. Zhang, H. Song, J. Hu, Y. Lv, Ratiometric Cataluminescence for Rapid
Recognition of Volatile Organic Compounds Based on Energy Transfer Process.
Anal. Chem. (2019), doi:10.1021/acs.analchem.9b00592.
151. S. Wang, W. Shi, C. Lu, Chemisorbed Oxygen on the Surface of Catalyst-
Improved Cataluminescence Selectivity. Anal. Chem. 88, 4987–4994 (2016).
152. H. Su, E. S. Yeung, High-throughput screening of heterogeneous catalysts by
laser-induced fluorescence imaging. J. Am. Chem. Soc. 122, 7422–7423 (2000).
153. M. Krämer, M. Duisberg, K. Stöwe, W. F. Maier, Highly selective CO
methanation catalysts for the purification of hydrogen-rich gas mixtures. J. Catal.
251, 410–422 (2007).
154. P. Kondratyuk, G. Gumuslu, S. Shukla, J. B. Miller, B. D. Morreale, A. J.
Gellman, A microreactor array for spatially resolved measurement of catalytic
activity for high-throughput catalysis science. J. Catal. 300, 55–62 (2013).
155. W. F. Maier, K. Stowe, S. Sieg, Combinatorial and high-throughput materials
science. Angew. Chemie - Int. Ed. 46, 6016–6067 (2007).
156. S. Senkan, K. Krantz, S. Ozturk, V. Zengin, I. Onal, High-throughput testing of
heterogeneous catalyst libraries using array microreactors and mass spectrometry.
Angew. Chemie - Int. Ed. 38, 2794–2799 (1999).
157. S. Thomson, C. Hoffmann, S. Ruthe, H. W. Schmidt, F. Schüth, The development
of a high throughput reactor for the catalytic screening of three phase reactions.
Appl. Catal. A Gen. 220, 253–264 (2001).
158. C. M. Snively, J. Lauterbach, Experimental aspects of asynchronous rapid-scan
Fourier transform infrared imaging. Appl. Spectrosc. 59, 1075–1081 (2005).
159. R. Vijay, thesis, University of Dealware (2007).
160. R. Bhargava, I. W. Levin, in Spectrochemical Analysis Using Infrared
Multichannel Detector.
161. E. N. Lewis, P. J. Treado, R. C. Reeder, G. M. Story, A. E. Dowrey, C. Marcott, I.
W. Levin, Fourier Transform Spectroscopic Imaging Using an Infrared Focal-
Plane Array Detector. Anal. Chem. Appl. Spectrosc. Anal. Chem. 67, 3377–33
(1995).
162. R. De Maesschalck, D. Jouan-Rimbaud, D. L. Massart, The Mahalanobis distance.
Chemom. Intell. Lab. Syst. 50, 1–18 (2000).

182
163. PID Theory Explained - NI, (available at https://www.ni.com/en-
us/innovations/white-papers/06/pid-theory-explained.html).
164. S. Sandler, in Chemical, Biochemical, and Engineering Thermodynamics (2006),
pp. 703–777.
165. N. M. Deraz, The comparative jurisprudence of catalysts preparation methods: I.
precipitation and impregnation methods. J. Ind. Environ. Chem. 2, 19–21 (2018).
166. P. Munnik, P. E. De Jongh, K. P. De Jong, Recent Developments in the Synthesis
of Supported Catalysts. Chem. Rev. 115, 6687–6718 (2015).
167. J. Park, J. Regalbuto, A simple, accurate determination of oxide PZC and the
strong buffering effect of oxide surfaces at incipient wetness. J. Colloid Interface
Sci. 175, 239–252 (1995).
168. L. Jiao, J. R. Regalbuto, The synthesis of highly dispersed noble and base metals
on silica via strong electrostatic adsorption: II. Mesoporous silica SBA-15. J.
Catal. 260, 342–350 (2008).
169. S. Cao, J. R. Monnier, J. R. Regalbuto, Alkali promotion of alumina-supported
ruthenium catalysts for hydrogenation of levulinic acid to Γ-valerolactone. J.
Catal. 347, 72–78.
170. S. Cao, J. R. Monnier, C. T. Williams, W. Diao, J. R. Regalbuto, Rational
nanoparticle synthesis to determine the effects of size, support, and K dopant on
Ru activity for levulinic acid hydrogenation to γ-valerolactone. J. Catal. 326, 69–
81 (2015).
171. B. E. Warren, X-Ray Diffraction (1990).
172. M. M. Blum, H. John, Historical perspective and modern applications of
Attenuated Total Reflectance - Fourier Transform Infrared Spectroscopy (ATR-
FTIR). Drug Test. Anal. 4, 298–302 (2012).
173. P. Griffiths, J. de Haseth, Fourier Transform Infrared Spectroscopy (2007).
174. F. Solymosi, J. Raskó, An infrared study of the influence of CO adsorption on the
topology of supported ruthenium. J. Catal. 115, 107–119 (1989).
175. C. M. Gunathunge, J. Li, X. Li, M. M. Waegele, Surface-Adsorbed CO as an
Infrared Probe of Electrocatalytic Interfaces. 40, 36 (2020).
176. C. A. Rice, S. D. Worley, C. W. Curtis, J. A. Guin, A. R. Tarrer, The oxidation
state of dispersed Rh on Al2O3. J. Chem. Phys. 74, 6487–6497 (1981).
177. A. M. Sica, J. H. Z. Dos Santos, I. M. Baibich, C. E. Gigola, Preparation and
characterization of W/γ-Al2O3 and Pd-W/γ-Al2O3 catalysts from organometallic
precursors. The catalytic activity for NO decomposition. J. Mol. Catal. A Chem.
137, 287–295 (1999).

183
178. M. Haneda, T. Fujitani, H. Hamada, Effect of iridium dispersion on the catalytic
activity of Ir/SiO2 for the selective reduction of NO with CO in the presence of O2
and SO2. J. Mol. Catal. A Chem. 256, 143–148 (2006).
179. 4.8: UV/Vis and IR Spectroscopy - Chemistry LibreTexts, (available at
https://chem.libretexts.org/Bookshelves/Analytical_Chemistry/Book%3A_Physica
l_Methods_in_Chemistry_and_Nano_Science_(Barron)/04%3A_Chemical_Specia
tion/4.02%3A_IR_Spectroscopy).
180. P. J. Dyson, J. S. McIndoe, Transition Metal Carbonyl Cluster Chemistry (CRC
Press, 2018; https://www.taylorfrancis.com/books/transition-metal-carbonyl-
cluster-chemistry-paul-dyson-scott-mcindoe/10.1201/9781315273815).
181. F. M. Hoffmann, R. A. De Paola, Anomalous C-O bond weakening of side-on-
bonded carbon monoxide on a potassium-promoted Ru(001) surface. Phys. Rev.
Lett. 52, 1697–1700 (1984).
182. S. F. A. Kettle, in Inorganic Chemistry Metal Carbonyl Chemistry (Springer-
Verlag, 2006; https://link.springer.com/chapter/10.1007/BFb0047780), pp. 111–
148.
183. C. M. Gunathunge, J. Li, X. Li, M. M. Waegele, Surface-Adsorbed CO as an
Infrared Probe of Electrocatalytic Interfaces. 40, 36 (2020).
184. E. Smith, G. Dent, Modern Raman Spectroscopy - A Practical Approach (2019).
185. J. W. Niemantsverdriet, Spectroscopy in Catalysis (Wiley-VCH, ed. 3, 2007).
186. C. Wang, L. Sun, Q. Cao, B. Hu, Z. Huang, X. Tang, Surface structure sensitivity
of manganese oxides for low-temperature selective catalytic reduction of NO with
NH3. Appl. Catal. B Environ. 101, 598–605 (2011).
187. Z. Huang, X. Gu, W. Wen, P. Hu, M. Makkee, H. Lin, F. Kapteijn, X. Tang, A
“Smart” Hollandite DeNO x Catalyst: Self-Protection against Alkali Poisoning .
Angew. Chemie. 125, 688–692 (2013).
188. J. Luo, Q. Zhang, A. Huang, S. L. Suib, Total oxidation of volatile organic
compounds with hydrophobic cryptomelane-type octahedral molecular sieves.
Microporous Mesoporous Mater. 35–36, 209–217 (2000).
189. C. Wang, J. Ma, F. Liu, H. He, R. Zhang, The Effects of Mn2+ Precursors on the
Structure and Ozone Decomposition Activity of Cryptomelane-Type Manganese
Oxide (OMS-2) Catalysts. J. Phys. Chem. C. 119, 23119–23126 (2015).
190. M. Sun, L. Yu, F. Ye, G. Diao, Q. Yu, Z. Hao, Y. Zheng, L. Yuan, Transition
metal doped cryptomelane-type manganese oxide for low-temperature catalytic
combustion of dimethyl ether. Chem. Eng. J. 220, 320–327 (2013).
191. S. Ming, P. Wang, P. Liu, J. Duan, F. Mei, L. Pang, Z. Chen, T. Li, Promotional
effect of metal cations doping on OMS-2 catalysts for NH3-SCR reaction. Chem.
Eng. J. 379 (2020), doi:10.1016/j.cej.2019.122287.
184
192. D. RN, S. YF, N. EJ, S. SL, O. CL, S. Levine, N. JM, SYNTHESIS AND
CHARACTERIZATION OF OCTAHEDRAL MOLECULAR SIEVES (OMS-2)
HAVING THE HOLLANDITE STRUCTURE. Chem. Mater. 6, 815–821 (1994).
193. L. W. Chu, G. H. Hsiue, I. N. Lin, Synthesis of Ba2Ti9O20 materials via a
dissolution-precipitation mechanism in a hydrothermal process. Acta Mater. 54,
1671–1677 (2006).
194. H. S. Potdar, S. Vijayanand, K. K. Mohaideen, K. R. Patil, P. A. Joy, R. R.
Madhavan, K. V. G. Kutty, R. D. Ambashta, P. K. Wattal, A simple chemical co-
precipitation/calcination route for the synthesis of simulated synroc-B and synroc-
C powders. Mater. Chem. Phys. 123, 695–699 (2010).
195. Q. Feng, K. Yanagisawa, N. Yamasaki, Hydrothermal Soft Chemical Process for
Synthesis of Manganese Oxides with Tunnel Structures. J. Porous Mater. 5, 153–
162 (1998).
196. A. Byström, A. M. Byström, IUCr, The crystal structure of hollandite, the related
manganese oxide minerals, and α-MnO2. Acta Crystallogr. 3, 146–154 (1950).
197. M. J. Geselbracht, L. D. Noailles, L. T. Ngo, J. H. Pikul, R. I. Walton, E. S.
Cowell, F. Millange, D. O’Hare, Probing Molten Salt Flux Reactions Using Time-
Resolved in Situ High-Temperature Powder X-ray Diffraction: A New Synthesis
Route to the Mixed-Valence NaTi2O4. Chem. Mater. 16, 1153–1159 (2004).
198. T. Gao, M. Glerup, F. Krumeich, R. Nesper, H. Fjellvâg, P. Norby,
Microstructures and spectroscopic properties of cryptomelane-type manganese
dioxide nanofibers. J. Phys. Chem. C. 112, 13134–13140 (2008).
199. L. Sun, Q. Cao, B. Hu, J. Li, J. Hao, G. Jing, X. Tang, Synthesis, characterization
and catalytic activities of vanadium-cryptomelane manganese oxides in low-
temperature NO reduction with NH3. Appl. Catal. A Gen. 393, 323–330 (2011).
200. C. Chlique, D. Lambertin, F. Frizon, P. Deniard, S. Jobic, Effect of temperature on
the γ-MnO2/“Ag2O” hydrogen getter structure. Fusion Eng. Des. 112, 475–479
(2016).
201. O. A. Drozhzhin, V. V. Grigoriev, A. M. Alekseeva, S. V. Ryazantsev, O. A.
Tyablikov, D. Chernyshov, A. M. Abakumov, E. V. Antipov, Phase
Transformations and Charge Ordering during Li+ Intercalation into Hollandite-
Type TiO2 Studied by Operando Synchrotron X-ray Powder Diffraction. Eur. J.
Inorg. Chem. 2020, 743–748 (2020).
202. S. Roy, A. Ito, M. Nagao, F. Hayashi, K. Furui, H. Shiiba, K. Yubuta, T. Sudare,
C. Terashima, K. Teshima, Flux Growth of Single-Crystalline Hollandite-Type
Potassium Ferrotitanate Microrods From KCl Flux. Front. Chem. |
www.frontiersin.org. 1, 714 (2020).

185
203. K. J. Takeuchi, S. Z. Yau, A. Subramanian, A. C. Marschilok, E. S. Takeuchi, The
Electrochemistry of Silver Hollandite Nanorods, Ag x Mn 8 O 16 : Enhancement
of Electrochemical Battery Performance via Dimensional and Compositional
Control. J. Electrochem. Soc. 160, A3090–A3094 (2013).
204. J. H. Jo, J. U. Choi, M. K. Cho, Y. Aniskevich, H. Kim, G. Ragoisha, E. Streltsov,
J. Kim, S. Myung, Hollandite‐Type VO 1.75 (OH) 0.5 : Effective Sodium Storage for
High‐Performance Sodium‐Ion Batteries. Adv. Energy Mater. 9, 1900603 (2019).
205. R. Hu, Y. Cheng, L. Xie, D. Wang, Effect of doped Ag on performance of
manganese oxide octahedral molecular sieve for CO oxidation. Chinese J. Catal.
28, 463–468 (2007).
206. J. Chen, J. Li, H. Li, X. Huang, W. Shen, Facile synthesis of Ag-OMS-2 nanorods
and their catalytic applications in CO oxidation. Microporous Mesoporous Mater.
116, 586–592 (2008).
207. W. Y. Hernández, M. A. Centeno, S. Ivanova, P. Eloy, E. M. Gaigneaux, J. A.
Odriozola, Cu-modified cryptomelane oxide as active catalyst for CO oxidation
reactions. Appl. Catal. B Environ. 123–124, 27–35 (2012).
208. V. P. Santos, O. S. G. P. Soares, J. J. W. Bakker, M. F. R. Pereira, J. J. M. Órfão,
J. Gascon, F. Kapteijn, J. L. Figueiredo, Structural and chemical disorder of
cryptomelane promoted by alkali doping: Influence on catalytic properties. J.
Catal. 293, 165–174 (2012).
209. V. P. Santos, M. F. R. Pereira, J. J. M. Órfão, J. L. Figueiredo, Catalytic oxidation
of ethyl acetate over a cesium modified cryptomelane catalyst. Appl. Catal. B
Environ. 88, 550–556 (2009).
210. V. D. Makwana, Y. C. Son, A. R. Howell, S. L. Suib, The role of lattice oxygen in
selective benzyl alcohol oxidation using OMS-2 catalyst: A kinetic and isotope-
labeling study. J. Catal. 210, 46–52 (2002).
211. G. D. Yadav, R. K. Mewada, Selectivity engineering in the synthesis of value
added chemicals: Oxidation of 1-octanol to 1-octanal over nano-fibrous Ag-OMS-
2 catalysts. Chem. Eng. Res. Des. 90, 86–97 (2012).
212. R. Kumar, S. Sithambaram, S. L. Suib, Cyclohexane oxidation catalyzed by
manganese oxide octahedral molecular sieves-Effect of acidity of the catalyst. J.
Catal. 262, 304–313 (2009).
213. S. Adjimi, J. M. García-Vargas, J. A. Díaz, L. Retailleau, S. Gil, M. Pera-Titus, Y.
Guo, A. Giroir-Fendler, Highly efficient and stable Ru/K-OMS-2 catalyst for NO
oxidation. Appl. Catal. B Environ. 219, 459–466 (2017).
214. M. L. Foo, W.-L. Lee, T. Siegrist, G. Lawes, A. P. Ramirez, N. P. Ong, R. J. Cava,
Electronic characterization of alkali ruthenium hollandites: KRu 4 O 8 , RbRu 4 O
8 and Cs 0.8 Li 0.2 Ru 4 O 8. Mater. Res. Bull. 39, 1663–1670 (2004).

186
215. J. Liu, V. Makwana, J. Cai, S. L. Suib, M. Aindow, Effects of alkali metal and
ammonium cation templates on nanofibrous cryptomelane-type manganese oxide
octahedral molecular sieves (OMS-2). J. Phys. Chem. B. 107, 9185–9194 (2003).
216. X. Fu, J. Feng, H. Wang, K. M. Ng, Morphological and structural evolution of α-
MnO2 nanorods synthesized via an aqueous route through MnO4-/Mn2+ reaction.
J. Solid State Chem. 183, 883–889 (2010).
217. D. Portehault, S. Cassaignon, E. Baudrin, J. P. Jolivet, Morphology control of
cryptomelane type MnO2 nanowires by soft chemistry growth mechanisms in
aqueous medium. Chem. Mater. 19, 5410–5417 (2007).
218. T. Gao, H. Fjellvg, P. Norby, Structural and morphological evolution of β-MnO2
nanorods during hydrothermal synthesis. Nanotechnology. 20 (2009),
doi:10.1088/0957-4484/20/5/055610.
219. X. F. Shen, Y. S. Ding, J. C. Hanson, M. Aindow, S. L. Suib, In situ synthesis of
mixed-valent manganese oxide nanocrystals: An in situ synchrotron X-ray
diffraction study. J. Am. Chem. Soc. 128, 4570–4571 (2006).
220. B. R. Chen, W. Sun, D. A. Kitchaev, J. S. Mangum, V. Thampy, L. M. Garten, D.
S. Ginley, B. P. Gorman, K. H. Stone, G. Ceder, M. F. Toney, L. T. Schelhas,
Understanding crystallization pathways leading to manganese oxide polymorph
formation. Nat. Commun. 9 (2018), doi:10.1038/s41467-018-04917-y.
221. D. M. Alonso, R. Mariscal, R. Moreno-Tost, M. D. Z. Poves, M. L. Granados,
Potassium leaching during triglyceride transesterification using K/γ-Al2O3
catalysts. Catal. Commun. 8, 2074–2080 (2007).
222. S. Benjapornkulaphong, C. Ngamcharussrivichai, K. Bunyakiat, Al2O3-supported
alkali and alkali earth metal oxides for transesterification of palm kernel oil and
coconut oil. Chem. Eng. J. 145, 468–474 (2009).
223. H. Ma, S. Li, B. Wang, R. Wang, S. Tian, Transesterification of Rapeseed Oil for
Synthesizing Biodiesel by K/KOH/γ-Al2O3 as Heterogeneous Base Catalyst. J.
Am. Oil Chem. Soc. 85, 263–270 (2008).
224. M. Verziu, M. Florea, S. Simon, V. Simon, P. Filip, V. I. Parvulescu, C. Hardacre,
Transesterification of vegetable oils on basic large mesoporous alumina supported
alkaline fluorides-Evidences of the nature of the active site and catalytic
performances. J. Catal. 263, 56–66 (2009).
225. J. P. Da Costa Evangelista, A. D. Gondim, L. Di Souza, A. S. Araujo, Alumina-
supported potassium compounds as heterogeneous catalysts for biodiesel
production: A review. Renew. Sustain. Energy Rev. 59 (2016), pp. 887–894.
226. B. W. Krupay, Y. Amenomiya, Alkali-promoted alumina catalysts. I.
Chemisorption and oxygen exchange of carbon monoxide and carbon dioxide on
potassium-promoted alumina catalysts. J. Catal. 67, 362–370 (1981).

187
227. W. H. J. Stork, G. T. Pott, Studies of compound formation on alkali/γ-aluminum
oxide catalyst systems using chromium, iron, and manganese luminescence. J.
Phys. Chem. 78, 2496–2506 (1974).
228. A. Iordan, M. I. Zaki, C. Kappenstein, Interfacial chemistry in the preparation of
catalytic potassium-modified aluminas. J. Chem. Soc. Faraday Trans. 89, 2527–
2536 (1993).
229. Y. Wang, Jian Hua Zhu, Wen Yu Huang, Synthesis and characterization of
potassium-modified alumina superbases. Phys. Chem. Chem. Phys. 3, 2537–2543
(2001).
230. S. Soled, γ-Al2O3 viewed as a defect oxyhydroxide. J. Catal. 81, 252–257 (1983).
231. L. B. Sun, F. N. Gu, Y. Chun, J. Yang, Y. Wang, J. H. Zhu, Attempt to generate
strong basicity on silica and titania. J. Phys. Chem. C. 112, 4978–4985 (2008).
232. M. I. Zaki, T. H. Ballinger, J. T. Yates, Protection of Rh/Al2O3 catalysts by
potassium functionalization of the Al2O3 support. J. Phys. Chem. 95, 4028–4033
(1991).
233. Y. Wang, Jian Hua Zhu, Wen Yu Huang, Synthesis and characterization of
potassium-modified alumina superbases. Phys. Chem. Chem. Phys. 3, 2537–2543
(2001).
234. T. Baba, H. Handa, Y. Ono, Superbase character of alumina loaded with potassium
by impregnation from ammoniacal solution. J. Chem. Soc. Faraday Trans. 90,
187–191 (1994).
235. K. Nagaoka, T. Eboshi, N. Abe, S. Miyahara, K. Honda, K. Sato, Influence of
basic dopants on the activity of Ru/Pr6O11 for hydrogen production by ammonia
decomposition. Int. J. Hydrogen Energy. 39, 20731–20735 (2014).
236. M. E. Gálvez, S. Ascaso, P. Stelmachowski, P. Legutko, A. Kotarba, R. Moliner,
M. J. Lázaro, Influence of the surface potassium species in Fe-K/Al2O3 catalysts
on the soot oxidation activity in the presence of NOx. Appl. Catal. B Environ.
152–153, 88–98 (2014).
237. A. K. Hill, L. Torrente-Murciano, In-situ H2 production via low temperature
decomposition of ammonia: Insights into the role of cesium as a promoter. Int. J.
Hydrogen Energy. 39, 7646–7654 (2014).
238. T. V Choudhary, C. Sivadinarayana, D. W. Goodman, Catalytic ammonia
decomposition: COx-free hydrogen production for fuel cell applications. Catal.
Letters. 72, 197–201 (2001).
239. A. Di Carlo, L. Vecchione, Z. Del Prete, Ammonia decomposition over
commercial Ru/Al2O3 catalyst: An experimental evaluation at different operative
pressures and temperatures. Int. J. Hydrogen Energy. 39, 808–814 (2014).
188
240. Q. Tang, X. Huang, C. Wu, P. Zhao, Y. Chen, Y. Yang, Structure and catalytic
properties of K-doped manganese oxide supported on alumina. J. Mol. Catal. A
Chem. 306, 48–53 (2009).
241. A. Devadas, S. Baranton, T. W. Napporn, C. Coutanceau, Tailoring of RuO2
nanoparticles by microwave assisted “instant method” for energy storage
applications. J. Power Sources. 196, 4044–4053 (2011).
242. Ž. Petrović, M. Ristić, M. Marciuš, B. Sepiol, H. Peterlik, M. Ivanda, S. Musić,
Formation of RuO2 nanoparticles by thermal decomposition of Ru(NO)(NO3)3.
Ceram. Int. 41, 7811–7815 (2015).
243. C. Chlique, D. Lambertin, F. Frizon, P. Deniard, S. Jobic, Effect of temperature on
the γ-MnO2/“Ag2O” hydrogen getter structure. Fusion Eng. Des. 112, 475–479
(2016).
244. T. Liu, Q. Li, Y. Xin, Z. Zhang, X. Tang, L. Zheng, P. X. Gao, Quasi free K
cations confined in hollandite-type tunnels for catalytic solid (catalyst)-solid
(reactant) oxidation reactions. Appl. Catal. B Environ. 232, 108–116 (2018).
245. J. Luo, A. Huang, S. H. Park, S. L. Suib, C. L. O’Young, Crystallization of
Sodium-Birnessite and Accompanied Phase Transformation. Chem. Mater. 10,
1561–1568 (1998).
246. L. Zhou, J. Zhang, J. He, Y. Hu, H. Tian, Control over the morphology and
structure of manganese oxide by tuning reaction conditions and catalytic
performance for formaldehyde oxidation. Mater. Res. Bull. 46, 1714–1722 (2011).
247. X. Zhang, W. Yang, J. Yang, D. G. Evans, Synthesis and characterization of α-
MnO2 nanowires: Self-assembly and phase transformation to β-MnO2
microcrystals. J. Cryst. Growth. 310, 716–722 (2008).
248. G. Green, W. Griffith, D. Hollinshead, L. S, M. Schroder, Oxo Complexes of
Ruthenium (VI) and (VII) as Organic Oxidants. J. Chem. Soc. Perkin Trans. 1
(1984).
249. A. J. Bailey, W. P. Griffith, S. I. Mostafa, P. A. Sherwood, Studies on Transition-
Metal Oxo and Nitrido Complexes. 13. Perruthenate and Ruthenate Anions as
Catalytic Organic Oxidants. Inorg. Chem. 32, 268–271 (1993).
250. A. Lebedeva, B. L. Albuquerque, J. B. Domingos, J. F. Lamonier, J. M. Giraudon,
P. Lecante, A. Denicourt-Nowicki, A. Roucoux, Ruthenium Trichloride Catalyst in
Water: Ru Colloids versus Ru Dimer Characterization Investigations. Inorg. Chem.
58, 4141–4151 (2019).
251. V. Mazzieri, F. Coloma-Pascual, A. Arcoya, P. C. L’Argentière, N. S. Fígoli, XPS,
FTIR and TPR characterization of Ru/Al 2 O 3 catalysts. Appl. Surf. Sci. 210, 222–
230 (2003).
252. P. Betancourt, A. Rives, R. Hubaut, C. E. Scott, J. Goldwasser, A study of the
ruthenium-alumina system. Appl. Catal. A Gen. 170, 307–314 (1998).

189
253. J. C. Dellamorte, J. Lauterbach, M. A. Barteau, Rhenium promotion of Ag and Cu-
Ag bimetallic catalysts for ethylene epoxidation. Catal. Today. 120, 182–185
(2007).
254. T. C. R. Rocha, M. Hävecker, A. Knop-Gericke, R. Schlögl, Promoters in
heterogeneous catalysis: The role of Cl on ethylene epoxidation over Ag. J. Catal.
312, 12–16 (2014).
255. H. Tan, K. Li, S. Sioud, D. Cha, M. H. Amad, M. N. Hedhili, Z. A. Al-Talla,
Synthesis of Ru nanoparticles confined in magnesium oxide-modified mesoporous
alumina and their enhanced catalytic performance during ammonia decomposition.
Catal. Commun. 26, 248–252 (2012).
256. E. A. Blekkan, A. Holmen, S. Vada, Alkali promotion of alumina-supported
colbalt Fischer-Tropsch catalysts studied by TPR, TPD and pulse chemisorption.
Acta Chem. Scand. 47, 275–280 (1993).
257. C. F. J. Barnard, S. C. Bennett, Oxidation States of Ruthenium and Osmium.
Platin. Met. Rev. 48, 157–158 (2004).
258. V. Prasad, A. M. Karim, A. Arya, D. G. Vlachos, Assessment of overall rate
expressions and multiscale, microkinetic model uniqueness via experimental data
injection: Ammonia decomposition on Ru/γ-Al2O3 for hydrogen production. Ind.
Eng. Chem. Res. 48, 5255–5265 (2009).
259. X. K. Li, W. J. Ji, J. Zhao, S. J. Wang, C. T. Au, Ammonia decomposition over Ru
and Ni catalysts supported on fumed SiO 2, MCM-41, and SBA-15. J. Catal. 236,
181–189 (2005).
260. C. Chen, Y. Chen, A. M. Ali, W. Luo, J. Wen, L. Zhang, H. Zhang, Bimetallic Ru-
Fe Nanoparticles Supported on Carbon Nanotubes for Ammonia Decomposition
and Synthesis. Chem. Eng. Technol. 43, 719–730 (2020).
261. J. Zhang, J. O. Müller, W. Zheng, D. Wang, D. Su, R. Schlögl, Individual Fe-Co
alloy nanoparticles on carbon nanotubes: Structural and catalytic properties. Nano
Lett. 8, 2738–2743 (2008).
262. B. Lorenzut, T. Montini, M. Bevilacqua, P. Fornasiero, FeMo-based catalysts for
H 2 production by NH 3 decomposition. Appl. Catal. B Environ. 125, 409–417
(2012).
263. J. Ji, X. Duan, G. Qian, X. Zhou, G. Tong, W. Yuan, Towards an efficient
CoMo/γ-Al2O3 catalyst using metal amine metallate as an active phase precursor:
Enhanced hydrogen production by ammonia decomposition. Int. J. Hydrogen
Energy. 39, 12490–12498 (2014).
264. X. Duan, G. Qian, X. Zhou, D. Chen, W. Yuan, MCM-41 supported CoMo
bimetallic catalysts for enhanced hydrogen production by ammonia
decomposition. Chem. Eng. J. 207–208, 103–108 (2012).

190
265. W. Zheng, T. P. Cotter, P. Kaghazchi, T. Jacob, B. Frank, K. Schlichte, W. Zhang,
D. S. Su, F. Schüth, R. Schlögl, Experimental and theoretical investigation of
molybdenum carbide and nitride as catalysts for ammonia decomposition. J. Am.
Chem. Soc. 135, 3458–3464 (2013).
266. S. Podila, S. F. Zaman, H. Driss, Y. A. Alhamed, A. A. Al-Zahrani, L. A. Petrov,
Hydrogen production by ammonia decomposition using high surface area Mo2N
and Co3Mo3N catalysts. Catal. Sci. Technol. 6, 1496–1506 (2016).
267. W. Guo, D. G. Vlachos, Patched bimetallic surfaces are active catalysts for
ammonia decomposition. Nat. Commun. 6, 1–7 (2015).
268. D. A. Hansgen, D. G. Vlachos, J. G. Chen, Ammonia decomposition activity on
monolayer Ni supported on Ru, Pt and WC substrates. Surf. Sci. 605, 2055–2060
(2011).
269. K. Lamb, S. S. Hla, M. Dolan, Ammonia decomposition kinetics over LiOH-
promoted, Α-Al 2 O 3 -supported Ru catalyst. Int. J. Hydrogen Energy. 44, 3726–
3736 (2019).
270. S. Bajus, F. Agel, K. M, N. Bhrian, P. Wasserscheid, Alkali hydroxide-modified
Ru/g-Al2O3 catalysts for ammonia decomposition. Appl. Catal. A Gen. 510, 189–
195 (2016).
271. A. Daisley, J. S. J. Hargreaves, R. Hermann, Y. Poya, Y. Wang, A comparison of
the activities of various supported catalysts for ammonia synthesis. Catal. Today.
357, 534–540 (2020).
272. B. Lin, L. Heng, B. Fang, H. Yin, J. Ni, X. Wang, J. Lin, L. Jiang, Ammonia
Synthesis Activity of Alumina-Supported Ruthenium Catalyst Enhanced by
Alumina Phase Transformation. ACS Catal. 9, 1635–1644 (2019).
273. C. Fernández, C. Sassoye, D. P. Debecker, C. Sanchez, P. Ruiz, Effect of the size
and distribution of supported Ru nanoparticles on their activity in ammonia
synthesis under mild reaction conditions. Appl. Catal. A Gen. 474, 194–202
(2014).
274. C. Fernández, C. Pezzotta, E. M. Gaigneaux, N. Bion, D. Duprez, P. Ruiz,
Disclosing the synergistic mechanism in the catalytic activity of different-sized Ru
nanoparticles for ammonia synthesis at mild reaction conditions. Catal. Today.
251, 88–95 (2015).
275. H. Liu, H. Wang, J. Shen, Y. Sun, Z. Liu, Promotion effect of cerium and
lanthanum oxides on Ni/SBA-15 catalyst for ammonia decomposition (2007),
doi:10.1016/j.cattod.2007.10.048.
276. I. Lucentini, A. Casanovas, J. Llorca, Catalytic ammonia decomposition for
hydrogen production on Ni, Ru and Ni[sbnd]Ru supported on CeO2. Int. J.
Hydrogen Energy. 44, 12693–12707 (2019).

191
277. S. F. Yin, B. Q. Xu, W. X. Zhu, C. F. Ng, X. P. Zhou, C. T. Au, Carbon
nanotubes-supported Ru catalyst for the generation of CO x-free hydrogen from
ammonia. Catal. Today. 93–95, 27–38 (2004).
278. T. V. Choudhary, C. Sivadinarayana, D. W. Goodman, Catalytic ammonia
decomposition: COx-free hydrogen production for fuel cell applications. Catal.
Letters. 72, 197–201 (2001).
279. M. B. Alves, F. C. M. Medeiros, P. A. Z. Suarez, Cadmium compounds as
catalysts for biodiesel production. Ind. Eng. Chem. Res. 49, 7176–7182 (2010).
280. T. Ogawa, Y. Kobayashi, H. Mizoguchi, M. Kitano, H. Abe, T. Tada, Y. Toda, Y.
Niwa, H. Hosono, High electron density on ru in intermetallic YRu2 : The
application to catalyst for ammonia synthesis (2018),
doi:10.1021/acs.jpcc.8b02128.
281. J. Huang, M. Yuan, X. Li, Y. Wang, M. Li, J. Li, Z. You, Inhibited hydrogen
poisoning for enhanced activity of promoters-Ru/Sr2Ta2O7 nanowires for
ammonia synthesis. J. Catal. 389, 556–565 (2020).
282. K. Okura, T. Okanishi, H. Muroyama, T. Matsui, K. Eguchi, Promotion effect of
rare-earth elements on the catalytic decomposition of ammonia over Ni/Al 2 O 3
catalyst. "Applied Catal. A, Gen. 505, 77–85 (2015).
283. M. A. Al-Saleh, M. M. Hossain, M. A. Shalabi, T. Kimura, T. Inui, Hydrogen
spillover effects on Pt-Rh modified Co-clay catalysts for heavy oil upgrading.
Appl. Catal. A Gen. 253, 453–459 (2003).
284. P. Y. Lin, M. Meng, J. J. Yuan, S. M. Yu, Y. L. Fu, Spillover effect and CO
oxidation activity on the supported noble metals-metal oxides catalysts. Stud. Surf.
Sci. Catal. 112, 201–210 (1997).
285. L. Wang, C. Yin, R. T. Yang, Selective catalytic reduction of nitric oxide with
hydrogen on supported Pd: Enhancement by hydrogen spillover. Appl. Catal. A
Gen. 514, 35–42 (2016).
286. D. Nabaho, J. W. Niemantsverdriet, M. Claeys, E. Van Steen, Hydrogen spillover
in the Fischer-Tropsch synthesis: An analysis of platinum as a promoter for cobalt-
alumina catalysts. Catal. Today. 261, 17–27 (2016).
287. T. W. Hansen, J. B. Wagner, P. L. Hansen, S. Dahl, H. Topsøe, C. J. H. Jacobsen,
Atomic-resolution in situ transmission electron microscopy of a promoter of a
heterogeneous catalyst. Science (80-. ). 294, 1508–1510 (2001).
288. M. Chen, M. Yuan, J. Li, Z. You, Ammonia synthesis over Cs- or Ba-promoted
ruthenium catalyst supported on strontium niobate. Appl. Catal. A Gen. 554, 1–9
(2018).
289. M. Yu, A novel hollow fiber membrane reactor for high purity H2 generation from
thermal catalytic NH3 decomposition (2018), pp. 1–56.
192
290. F. R. García-García, A. Guerrero-Ruiz, I. Rodríguez-Ramos, in Topics in Catalysis
(2009; https://link.springer.com/content/pdf/10.1007%2Fs11244-009-9203-7.pdf),
vol. 52, pp. 758–764.
291. W. Raróg-Pilecka, E. Miśkiewicz, D. Szmigiel, Z. Kowalczyk, Structure
sensitivity of ammonia synthesis over promoted ruthenium catalysts supported on
graphitised carbon. J. Catal. 231, 11–19 (2005).
292. S. Speakman, Introduction to X-ray Powder Diffraction Data Analysis. Cent.
Mater. Sci. Eng. MIT.
293. F. Girgsdies, E. M. Group, Peak Profile Analysis in X-ray Powder Diffraction.
Fritz-Haber-Institut der MPG (1200) (available at http://www.fhi-
berlin.mpg.de/acnew/department/pages/teaching/pages/teaching__wintersemester_
_2015_2016/frank_girgsdies__peak_profile_fitting_in_xrd__151106.pdf).
294. T. H. de Keijser, J. I. Langford, E. J. Mittemeijer, A. B. P. Vogels, Use of the
Voigt function in a single-line method for the analysis of X-ray diffraction line
broadening. J. Appl. Crystallogr. 15, 308–314 (1982).
295. J. M. Serra, A. Chica, A. Corma, Development of a low temperature light paraffin
isomerization catalysts with improved resistance to water and sulphur by
combinatorial methods. Appl. Catal. A Gen. 239, 35–42 (2003).
296. A. Corma, J. M. Serra, P. Serna, S. Valero, E. Argente, V. Botti, Optimisation of
olefin epoxidation catalysts with the application of high-throughput and genetic
algorithms assisted by artificial neural networks (softcomputing techniques). J.
Catal. 229, 513–524 (2005).
297. K. Huang, F.-Q. Chen, D.-W. Lü, Artificial neural network-aided design of a
multi-component catalyst for methane oxidative coupling. Appl. Catal. A Gen.
219, 61–68 (2001).
298. Z. Y. Hou, Q. Dai, X. Q. Wu, G. T. Chen, Artificial neural network aided design
of catalyst for propane ammoxidation. Appl. Catal. A Gen. 161, 183–190 (1997).
299. T. Williams, thesis (2019).
300. L. M. Falicov, T. And, G. A. Somorjai, Correlation between catalytic activity and
bonding and coordination number of atoms and molecules on transition metal
surfaces: Theory and experimental evidence. Chemistry (Easton). 82, 2207–2211
(1985).
301. B. Hammer, J. K. Nørskov, in Impact of Surface Science on Catalysis (2000), vol.
45, pp. 71–129.
302. A. J. Chowdhury, W. Yang, E. Walker, O. Mamun, A. Heyden, G. A. Terejanu,
Prediction of Adsorption Energies for Chemical Species on Metal Catalyst
Surfaces Using Machine Learning. J. Phys. Chem. C. 122, 28142–28150 (2018).
193
303. D. A. Hansgen, D. G. Vlachos, J. G. Chen, Using first principles to predict
bimetallic catalysts for the ammonia decomposition reaction. Nat. Chem. 2, 484–
489 (2010).
304. A. Vojvodic, J. K. Nørskov, F. Abild-Pedersen, Electronic structure effects in
transition metal surface chemistry. Top. Catal. 57, 25–32 (2014).
305. S. Bhattacharjee, U. V Waghmare, S.-C. Lee, An improved d-band model of the
catalytic activity of magnetic transition metal surfaces. Sci. Rep. 6, 35916 (2016).
306. H. Xin, S. Linic, Communications: Exceptions to the d-band model of
chemisorption on metal surfaces: The dominant role of repulsion between
adsorbate states and metal d-states. J. Chem. Phys. 132, 221101 (2010).
307. S. J. Carey, W. Zhao, C. T. Campbell, Bond Energies of Adsorbed Intermediates
to Metal Surfaces: Correlation with Hydrogen–Ligand and Hydrogen–Surface
Bond Energies and Electronegativities. Angew. Chemie - Int. Ed. 57, 16877–16881
(2018).
308. Y. Kudriavtsev, A. Villegas, A. Godines, R. Asomoza, Calculation of the surface
binding energy for ion sputtered particles. Appl. Surf. Sci. 239, 273–278 (2005).
309. X. Shen, Y. Pan, B. Liu, J. Yang, J. Zeng, Z. Peng, More accurate depiction of
adsorption energy on transition metals using work function as one additional
descriptor. Phys. Chem. Chem. Phys. 19, 12628–12632 (2017).
310. Y. Li, L. Yao, S. Liu, J. Zhao, W. Ji, C. T. Au, Cs-modified iron nanoparticles
encapsulated in microporous and mesoporous SiO2 for COx-free H2 production
via ammonia decomposition. Catal. Today. 160, 79–86 (2011).
311. H. Silva, M. G. Nielsen, E. M. Fiordaliso, C. D. Damsgaard, C. Gundlach, T.
Kasama, I. B. Chorkendorff, D. Chakraborty, Synthesis and characterization of
Fe–Ni/γ-Al2O3 egg-shell catalyst for H2 generation by ammonia decomposition.
Appl. Catal. A Gen. 505, 548–556 (2015).
312. P. B. Weisz, C. D. Prater, Interpretation of Measurements in Experimental
Catalysis. Adv. Catal. 6, 143–196 (1954).
313. R. Reid, in The properties of gases and liquids (New York: McGraw-Hill, 1987).
314. P. Panagiotopoulou, Methanation of CO2 over alkali-promoted Ru/TiO2 catalysts:
II. Effect of alkali additives on the reaction pathway. Appl. Catal. B Environ. 236,
162–170 (2018).
315. A. M. Abdel-Mageed, ∥ D Widmann, S. E. Olesen, I. Chorkendorff, J. Biskupek,
R. J. Behm, Selective CO Methanation on Ru/TiO 2 Catalysts: Role and Influence
of Metal−Support Interactions (2015), doi:10.1021/acscatal.5b01520.
316. S. Y. Chin, C. T. Williams, M. D. Amiridis, FTIR studies of CO adsorption on
Al2O3- and SiO 2-supported Ru catalysts. J. Phys. Chem. B. 110, 871–882 (2006).

194
317. A. Waghray, J. Wang, R. Oukaci, D. G. Blackmond, Influence of alkali promoters
in the selective hydrogenation of 3-methyl-2-butenal over Ru/SiO2 catalysts. J.
Phys. Chem. 96, 5954–5959 (1992).
318. F. Solymosi, J. Raskó, An infrared study of CO and NO adsorption on alumina-
supported iridium catalyst. J. Catal. 62, 253–263 (1980).
319. Bradshaw A.M., Pritchard J., in Proceedings of the Royal Society of London.
Series A, Mathematical and Physical Sciences (1970; https://about.jstor.org/terms),
vol. 316, pp. 169–183.
320. X. Mo, J. Gao, N. Umnajkaseam, J. G. Goodwin, La, V, and Fe promotion of
Rh/SiO2 for CO hydrogenation: Effect on adsorption and reaction. J. Catal. 267,
167–176 (2009).
321. H. W. K. Tom, C. M. Mate, X. D. Zhu, J. E. Crowell, T. F. Heinz, G. A. Somorjai,
Y. R. Shen, Surface studies by optical second-harmonic generation: The
adsorption of O2, CO, and sodium on the Rh(111) surface. Phys. Rev. Lett. 52,
348–351 (1984).
322. E. L. Garfunkel, J. E. Crowell, G. A. Somorjai, The strong influence of potassium
on the adsorption of CO on platinum surfaces. A thermal desorption spectroscopy
and high-resolution electron energy loss spectroscopy study. J. Phys. Chem. 86,
310–313 (1982).

195
APPENDIX A
PERMISSION TO REPRRINT
1. T Williams, K McCullough and J Lauterbach, “Enabling catalyst discovery
through machine learning and high-throughput experimentation.” Chemistry of
Materials 32 (1) 2020, 157-165.

196
2. K McCullough, T Williams, K Mingle, P Jamshidi, J Lauterbach, “High
throughput experimentation meets artificial intelligence: a new pathway to
catalyst discovery.” Physical Chemistry Chemical Physics 22 (20) 2020, 111 4-
11196.

197
3. K McCullough, PH Chiang, JD Jimenez, J Lauterbach, “Material discovery and
high throughput exploration of Ru based catalysts for low temperature ammonia
decomposition.” Materials 13 (8) 2020, 1869.