The influence of the preparation procedures on the catalytic activity of Fe-BEA zeolites in SCR of...
16
Catalysis Today 235 (2014) 210–225 Contents lists available at ScienceDirect Catalysis Today j o ur na l ho me page: www.elsevier.com/locate/cattod The influence of the preparation procedures on the catalytic activity of Fe-BEA zeolites in SCR of NO with ammonia and N 2 O decomposition Paweł Boro ´ n a,d,e , Lucjan Chmielarz a,∗ ∗ ∗ , Jacek Gurgul b,∗∗ , Kazimierz Ł˛ atka c , Barbara Gil a , Jean-Marc Krafft d,e , Stanislaw Dzwigaj d,e,∗ a Faculty of Chemistry, Jagiellonian University, Ingardena 3, 30-060 Kraków, Poland b Jerzy Haber Institute of Catalysis and Surface Chemistry, Polish Academy of Sciences, Niezapominajek 8, 30-239 Kraków, Poland c Marian Smoluchowski Institute of Physics, Jagiellonian University, Reymonta 4, 30-059 Kraków, Poland d Sorbonne Universités, UPMC Univ Paris 06, UMR 7197, Laboratoire de Réactivité de Surface, F-75005, Paris, France e CNRS, UMR 7197, Laboratoire de Réactivité de Surface, F-75005, Paris, France a r t i c l e i n f o Article history: Received 9 November 2013 Received in revised form 9 February 2014 Accepted 5 March 2014 Available online 6 April 2014 Keywords: Iron BEA zeolite Ammonia N2O decomposition SCR of NO a b s t r a c t Three series of Fe-containing BEA zeolites are prepared by two-step postsynthesis (PS), ion exchange (IE) and conventional wet impregnation (Imp) procedures with various Fe content (1.0–4.0 Fe wt.%). In these series of zeolites iron is mainly present as pseudo-tetrahedral Fe(III) as evidenced by combined used of DR UV–vis, 57 Fe Mössbauer and XPS investigations. Two kinds of pseudo-tetrahedral Fe(III) have been distin- guished by 57 Fe Mössbauer spectroscopy in all Fe-containing BEA zeolites. As evidenced by TPD of NH 3 , the (Imp)-Fe x HAlBEA and (IE)-FeHAlBEA have a significantly higher acidity than (PS)-Fe x SiBEA. This is related to the presence in the former both pseudo-tetrahedral Al(III)–O(H)–Si and Fe(III)–O(H)–Si frame- work sites and in the latter only pseudo-tetrahedral Fe(III)–O(H)–Si . (PS)-Fe x SiBEA, (Imp)-Fe x HAlBEA and (IE)-FeHAlBEA are found to be active and selective catalysts of N 2 O decomposition, with 100% con- version in the temperature range of 750–800 K. Moreover, the samples are active in selective catalytic reduction of NO with ammonia, with selectivity toward N 2 exceeding 90% for NO conversions of 80–93% in the temperature range of 550–800 K. Isolated pseudo-tetrahedral Fe(III), present in three series of Fe-containing BEA zeolites, seems to be involved in both N 2 O decomposition and SCR of NO processes. The higher activity of (Imp)-Fe x HAlBEA and (IE)-FeHAlBEA than (PS)-Fe x SiBEA in the SCR of NO process suggests that the acidic Al(III)–O(H)–Si framework sites present in the former catalysts play also a significant role in this process. © 2014 Elsevier B.V. All rights reserved. 1. Introduction Nitrogen oxides, NO, NO 2 and N 2 O, generated by fuel combus- tion processes are a major source of air pollution. The ways to abate these nitrogen oxides are nowadays well documented [1]. Iron modified zeolites have been found to be highly active cata- lysts for the DeNO x process and N 2 O decomposition. The method used for the preparation of iron containing zeolites depends on the particular reaction studied and its goal. Despite many studies, the ∗ Corresponding author at: CNRS, UMR 7197, Laboratoire de Réactivité de Surface, F-75005, Paris, France. Tel.: +33 1 44272113; fax: +33 1 2203405057. ∗∗ Corresponding author. Tel.: +48 12 6395116. ∗ ∗ ∗ Corresponding author. Tel.: +48 12 6632006. E-mail addresses: [email protected] (L. Chmielarz), [email protected] (J. Gurgul), [email protected] (S. Dzwigaj). structure of the active sites in various applications is still a sub- ject of intense debate and attention. The main problem is related to coexistence of many types of Fe species, such as mononuclear and/or polynuclear Fe species, small Fe x O y clusters inside and/or outside of the zeolite pores and large Fe 2 O 3 particles on the exter- nal surface. Thus, identification of the Fe sites active in the specific process is difficult or even impossible [2,3]. Furthermore, accord- ing to the opinion of some scientists, in many reactions only a small fraction of Fe sites actively participates in the catalytic cycle [4–6]. Zeolite beta (BEA) appears to be an attractive host material for iron, as evident from various works indicating higher activity of Fe- BEA with respect to Fe-ZSM-5 in direct N 2 O decomposition [7] and selective reduction of N 2 O by NH 3 [8] or CH 4 [9]. An effect of the preparation procedure used for iron introduction in BEA zeolite on its state in the zeolite structure is still not fully resolved. Also the catalytic performance of Fe-BEA in the studied processes has been less extensively explored than Fe-ZSM-5. The Fe-ZSM-5 catalyst http://dx.doi.org/10.1016/j.cattod.2014.03.018 0920-5861/© 2014 Elsevier B.V. All rights reserved.
-
Upload
independent -
Category
Documents
-
view
0 -
download
0
Transcript of The influence of the preparation procedures on the catalytic activity of Fe-BEA zeolites in SCR of...
TF
PJa
b
c
d
e
a
ARRAA
KIBANS
1
taIlup
F
∗
n
h0
Catalysis Today 235 (2014) 210–225
Contents lists available at ScienceDirect
Catalysis Today
j o ur na l ho me page: www.elsev ier .com/ locate /ca t tod
he influence of the preparation procedures on the catalytic activity ofe-BEA zeolites in SCR of NO with ammonia and N2O decomposition
aweł Borona,d,e, Lucjan Chmielarza,∗ ∗ ∗, Jacek Gurgulb,∗∗, Kazimierz Łatkac, Barbara Gila,ean-Marc Krafftd,e, Stanislaw Dzwigajd,e,∗
Faculty of Chemistry, Jagiellonian University, Ingardena 3, 30-060 Kraków, PolandJerzy Haber Institute of Catalysis and Surface Chemistry, Polish Academy of Sciences, Niezapominajek 8, 30-239 Kraków, PolandMarian Smoluchowski Institute of Physics, Jagiellonian University, Reymonta 4, 30-059 Kraków, PolandSorbonne Universités, UPMC Univ Paris 06, UMR 7197, Laboratoire de Réactivité de Surface, F-75005, Paris, FranceCNRS, UMR 7197, Laboratoire de Réactivité de Surface, F-75005, Paris, France
r t i c l e i n f o
rticle history:eceived 9 November 2013eceived in revised form 9 February 2014ccepted 5 March 2014vailable online 6 April 2014
eywords:ronEA zeolitemmonia2O decompositionCR of NO
a b s t r a c t
Three series of Fe-containing BEA zeolites are prepared by two-step postsynthesis (PS), ion exchange (IE)and conventional wet impregnation (Imp) procedures with various Fe content (1.0–4.0 Fe wt.%). In theseseries of zeolites iron is mainly present as pseudo-tetrahedral Fe(III) as evidenced by combined used of DRUV–vis, 57Fe Mössbauer and XPS investigations. Two kinds of pseudo-tetrahedral Fe(III) have been distin-guished by 57Fe Mössbauer spectroscopy in all Fe-containing BEA zeolites. As evidenced by TPD of NH3, the(Imp)-FexHAlBEA and (IE)-FeHAlBEA have a significantly higher acidity than (PS)-FexSiBEA. This is relatedto the presence in the former both pseudo-tetrahedral Al(III)–O(H)–Si and Fe(III)–O(H)–Si frame-work sites and in the latter only pseudo-tetrahedral Fe(III)–O(H)–Si . (PS)-FexSiBEA, (Imp)-FexHAlBEAand (IE)-FeHAlBEA are found to be active and selective catalysts of N2O decomposition, with 100% con-version in the temperature range of 750–800 K. Moreover, the samples are active in selective catalyticreduction of NO with ammonia, with selectivity toward N2 exceeding 90% for NO conversions of 80–93%
in the temperature range of 550–800 K. Isolated pseudo-tetrahedral Fe(III), present in three series ofFe-containing BEA zeolites, seems to be involved in both N2O decomposition and SCR of NO processes.The higher activity of (Imp)-FexHAlBEA and (IE)-FeHAlBEA than (PS)-FexSiBEA in the SCR of NO processsuggests that the acidic Al(III)–O(H)–Si framework sites present in the former catalysts play also asignificant role in this process.© 2014 Elsevier B.V. All rights reserved.
. Introduction
Nitrogen oxides, NO, NO2 and N2O, generated by fuel combus-ion processes are a major source of air pollution. The ways tobate these nitrogen oxides are nowadays well documented [1].ron modified zeolites have been found to be highly active cata-
ysts for the DeNOx process and N2O decomposition. The methodsed for the preparation of iron containing zeolites depends on thearticular reaction studied and its goal. Despite many studies, the∗ Corresponding author at: CNRS, UMR 7197, Laboratoire de Réactivité de Surface,-75005, Paris, France. Tel.: +33 1 44272113; fax: +33 1 2203405057.∗∗ Corresponding author. Tel.: +48 12 6395116.
∗ ∗Corresponding author. Tel.: +48 12 6632006.E-mail addresses: [email protected] (L. Chmielarz),
[email protected] (J. Gurgul), [email protected] (S. Dzwigaj).
ttp://dx.doi.org/10.1016/j.cattod.2014.03.018920-5861/© 2014 Elsevier B.V. All rights reserved.
structure of the active sites in various applications is still a sub-ject of intense debate and attention. The main problem is relatedto coexistence of many types of Fe species, such as mononuclearand/or polynuclear Fe species, small FexOy clusters inside and/oroutside of the zeolite pores and large Fe2O3 particles on the exter-nal surface. Thus, identification of the Fe sites active in the specificprocess is difficult or even impossible [2,3]. Furthermore, accord-ing to the opinion of some scientists, in many reactions only a smallfraction of Fe sites actively participates in the catalytic cycle [4–6].
Zeolite beta (BEA) appears to be an attractive host material foriron, as evident from various works indicating higher activity of Fe-BEA with respect to Fe-ZSM-5 in direct N2O decomposition [7] andselective reduction of N2O by NH3 [8] or CH4 [9]. An effect of the
preparation procedure used for iron introduction in BEA zeolite onits state in the zeolite structure is still not fully resolved. Also thecatalytic performance of Fe-BEA in the studied processes has beenless extensively explored than Fe-ZSM-5. The Fe-ZSM-5 catalyst
s Toda
iHutcd
peseUad
to
2
2
si(p[tz1arptpeuc(
HaKslfNoi73aa
twa(i1auw1
P. Boron et al. / Catalysi
s very often prepared by liquid ion exchange procedure [10–13].owever, despite a number of various studies, it still remainsnclear whether the different catalytic performance observed forhese zeolitic catalysts is due to an intrinsic effect of the structuralharacteristics of specific zeolite or is related to different nature andistribution of iron species stabilized in both microporous systems.
In this work, three series of Fe-containing zeolites have beenrepared by different procedures: two-step postsynthesis (PS), ionxchange (IE) and conventional wet impregnation (Imp). Theseeries of Fe-containing zeolites have been characterized by sev-ral physicochemical techniques such as X-ray diffraction, DRV–vis, Mössbauer spectroscopy, XPS, FTIR and TPD of NH3. Cat-lytic properties of zeolites modified with iron have been tested inecomposition of N2O and SCR of NO with ammonia.
The main objective of this work is to draw the conclusions abouthe reactivity of iron sites obtained by different preparation meth-ds.
. Experimental
.1. Catalysts preparation
Three series of Fe-containing zeolites were prepared by two-tep postsynthesis (PS), ion exchange (IE) and conventional wetmpregnation (Imp) procedures. (PS)-FexSiBEA zeolites (wherePS)- states for postsynthesis and x = 1.0 or 4.0 Fe wt.%) were pre-ared by the two-step postsynthesis procedure reported earlier14]. In the first step, 2 g of a HAlBEA zeolite, obtained by calcina-ion in air at 823 K for 15 h of tetraethylammonium BEA (TEABEA)eolite (Si/Al = 12.5), provided by RIPP (China) was treated with3 mol L−1 HNO3 solution under stirring (4 h, 353 K) to removeluminium from the zeolite structure. In the second step, 2 g ofesulting SiBEA (Si/Al = 1000) obtained after filtration were dis-ersed in aqueous solutions (pH 2.5) containing from 0.36 × 10⁻³
o 1.8 × 10⁻² mol L−1 of Fe(NO3)3· · ·9H2O and stirred at room tem-erature for 24 h. Then, the obtained suspensions were stirred invaporator under vacuum of a water pump in air at 353 K for 2 hntil water was completely evaporated. The solids with the ironontent of 1.0 and 4.0 wt.% were labelled as (PS)-Fe1.0SiBEA andPS)-Fe4.0SiBEA, respectively.
A second portion of TEABEA was calcined (823 K, 15 h) to obtainAlBEA (Si/Al = 12.5). Organic-free BEA was treated two times with
0.1 mol L−1 NH4NO3 solution at 343 K for 3 h in order to exchange+ and Na+ ions present in industrial BEA zeolite for NH4
+. Then, theolid was washed with distilled water, dried overnight at 363 K andabelled as NH4AlBEA. (IE)-FeHAlBEA zeolites (where (IE)- statesor ion exchange) were obtained by liquid ion exchange method.H4AlBEA was dispersed in a 1.0 × 10⁻² mol L−1 aqueous solutionf Fe(NO3)3· · ·9H2O (pH 2.5, T = 343 K). Then, after filtration, wash-ng with distilled water and drying the sample was calcined in air at73 K for 3 h. The obtained samples with the iron content of 2.6 and.0 wt.% were labelled as (IE1)-FeHAlBEA (Si/Al = 21.5, Fe/Al = 1.3)nd (IE2)-FeHAlBEA (Si/Al = 21.5, Fe/Al = 1.6) respectively (for oncend twice exchange procedure).
(Imp)-FexHAlBEA zeolites (where (Imp)- states for impregna-ion and x = 1.0 or 4.0 Fe wt.%) were prepared by conventionalet impregnation method. Firstly, NH4AlBEA was calcined in
ir at 773 K for 3 h to obtain the acidic form of BEA zeoliteHAlBEA) (Si/Al = 21.5). Secondly, 2 g of HAlBEA were dispersedn aqueous solutions (pH 3.0) containing from 0.36 × 10⁻³ to.8 × 10−2 mol L−1 of Fe(NO3)3·9H2O and stirred at room temper-
ture for 24 h. Then, the suspensions were stirred in evaporatornder vacuum of a water pump in air at 353 K for 2 h untilater was completely evaporated. The solids with iron content of.0 and 4.0 wt.% were labelled as (Imp)-Fe1.0HAlBEA (Si/Al = 21.5,
y 235 (2014) 210–225 211
Fe/Al = 0.5) and (Imp)-Fe4.0HAlBEA (Si/Al = 21.5, Fe/Al = 2.0), respec-tively.
2.2. Catalysts characterization
The structure of the studied zeolite samples was determinedby powder X-ray diffraction. Diffraction patterns were obtained bya PW 3710 Philips X’pert (Philips X’pert APD) diffractometer usingNi-filtered Cu K� radiation (� = 1.54056 A). The measurements wereperformed in the range of 2� from 5 to 50◦ with a 0.02◦ step.
Textural properties of the samples were determined by adsorp-tion of nitrogen at 77 K using a Micromeretics ASAP 2010 apparatus.All the samples were outgassed, first at room temperature and thenat 623 K. The specific surface areas were determined from nitrogenadsorption isotherms in the relative pressure (P/P0) ranging from0.05 to 0.16 using BET method, while the micropore volume wasdetermined from the P/P0 below 0.2.
The structure of the obtained zeolite samples on microscopiclevel was studied by FTIR spectroscopy. FTIR spectra were recordedby DRIFT measurements performed with a Nicolet 6700 ThermoScientific spectrometer. The sample was grounded with KBr(1 wt.%). 200 scans were collected in the range of 600–4000 cm−1
with a resolution of 4 cm−1.Transmission FTIR spectra of self-supported wafers
(10 mg cm−2) were recorded at 100 K with a Bruker Vertex70 spectrometer (resolution 2 cm−1, 128 scans). Before measure-ments, the wafers were activated by calcination at 723 K for 2 hin a flow of 2.5 vol.% O2 diluted in argon and then outgassed at573 K (10−3 Pa) for 1 h. After thermal treatment, the samples werecooled down to 100 K.
The acidity of (PS)-Fe4.0SiBEA, SiBEA and (IE1)-FeHAlBEA wasinvestigated by FTIR using CO as a probe molecule. Before COadsorption experiment, the wafers of samples were activated bycalcination at 723 K for 2 h in a flow of 2.5 vol.% of O2 diluted inAr and then outgassed at 573 K (10−3 Pa) for 1 h. Following ther-mal treatment, the samples were cooled down to 100 K. CO wasintroduced in increasing amounts up to an equilibrium pressure of133 Pa. Infrared spectra were recorded using a Bruker Vertex 70spectrometer (resolution of 2 cm−1, 128 scans). The spectra wereobtained after subtraction of the spectrum recorded after calcina-tion and prior to CO adsorption.
The acidity (concentration and strength of acidic sites) of thezeolite samples was also determined by temperature programmeddesorption of ammonia (NH3-TPD). NH3-TPD measurements werecarried out in the temperature range of 343–923 K in a fix bed con-tinuous flow microreactor. Reaction temperature was measured bya K-type thermocouple located in a quartz capillary immersed in thecatalyst bed. Molecules desorbing from the zeolite samples weremonitored on line by a quadrupole mass spectrometer (VG Quartz)connected directly to the reactor outlet via a heated line. BeforeNH3-TPD experiments, the zeolite sample (100 mg) was outgassedin a flow of pure helium (20 mL min−1) at 773 K for 1 h. Subse-quently, the sample was cooled down to 373 K and saturated forabout 30 min in a flow of 1 vol.% of NH3 diluted in He (20 mL min−1).Then the catalyst was purged in a flow of pure helium until aconstant baseline level was attained. Desorption was carried outwith the linear heating rate (10 K min−1) in a flow of pure helium(20 mL min−1). Calibration of quadrupole mass spectrometer withcommercial mixtures allowed to recalculate the detector signal intoa desorption rate.
The acidity of some zeolite samples was studied by adsorptionof pyridine, followed by IR spectroscopy. Transmission IR spectra
were recorded using wafers in the form of self-supported pelletsof the zeolite powder (ca. 10 mg cm−2). The pellet was placed inan IR cell designed to carry out spectroscopic measurements andequipped with ZnSe windows. The cell was connected to a vacuum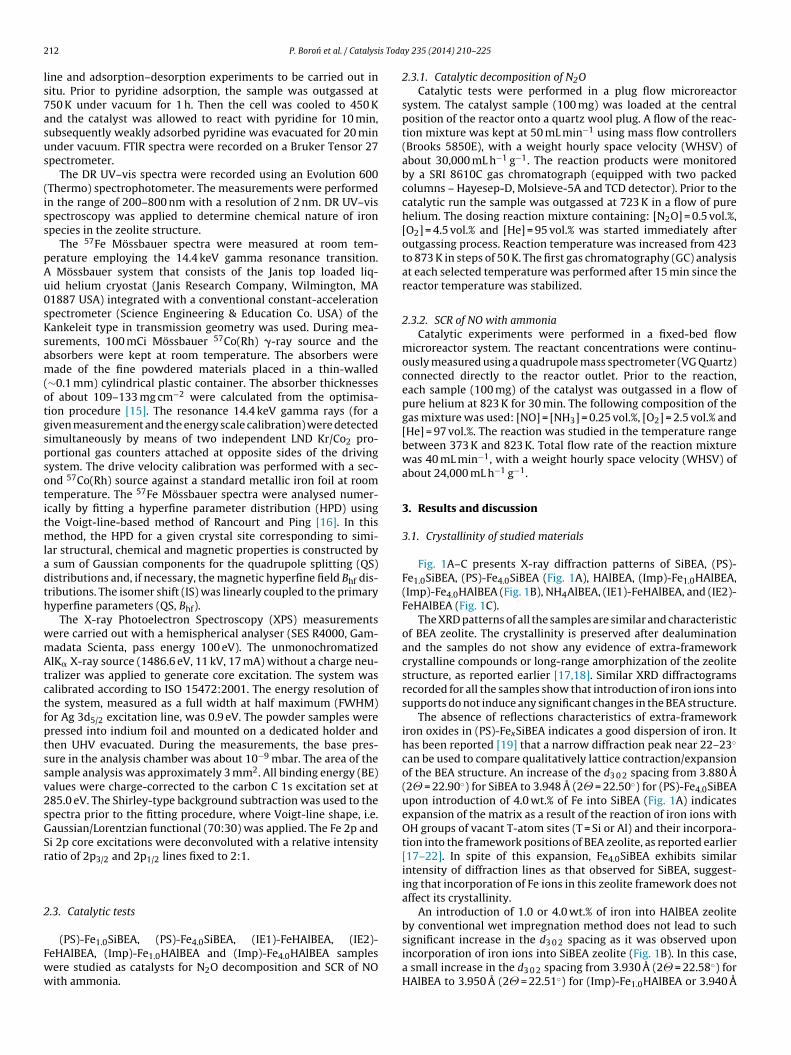
2 s Toda
ls7asus
(iss
pAu0sKsam(otgspsotitmladth
wmAtctfptssv2sGSr
2
Fww
12 P. Boron et al. / Catalysi
ine and adsorption–desorption experiments to be carried out initu. Prior to pyridine adsorption, the sample was outgassed at50 K under vacuum for 1 h. Then the cell was cooled to 450 Knd the catalyst was allowed to react with pyridine for 10 min,ubsequently weakly adsorbed pyridine was evacuated for 20 minnder vacuum. FTIR spectra were recorded on a Bruker Tensor 27pectrometer.
The DR UV–vis spectra were recorded using an Evolution 600Thermo) spectrophotometer. The measurements were performedn the range of 200–800 nm with a resolution of 2 nm. DR UV–vispectroscopy was applied to determine chemical nature of ironpecies in the zeolite structure.
The 57Fe Mössbauer spectra were measured at room tem-erature employing the 14.4 keV gamma resonance transition.
Mössbauer system that consists of the Janis top loaded liq-id helium cryostat (Janis Research Company, Wilmington, MA1887 USA) integrated with a conventional constant-accelerationpectrometer (Science Engineering & Education Co. USA) of theankeleit type in transmission geometry was used. During mea-urements, 100 mCi Mössbauer 57Co(Rh) �-ray source and thebsorbers were kept at room temperature. The absorbers wereade of the fine powdered materials placed in a thin-walled
∼0.1 mm) cylindrical plastic container. The absorber thicknessesf about 109–133 mg cm−2 were calculated from the optimisa-ion procedure [15]. The resonance 14.4 keV gamma rays (for aiven measurement and the energy scale calibration) were detectedimultaneously by means of two independent LND Kr/Co2 pro-ortional gas counters attached at opposite sides of the drivingystem. The drive velocity calibration was performed with a sec-nd 57Co(Rh) source against a standard metallic iron foil at roomemperature. The 57Fe Mössbauer spectra were analysed numer-cally by fitting a hyperfine parameter distribution (HPD) usinghe Voigt-line-based method of Rancourt and Ping [16]. In this
ethod, the HPD for a given crystal site corresponding to simi-ar structural, chemical and magnetic properties is constructed by
sum of Gaussian components for the quadrupole splitting (QS)istributions and, if necessary, the magnetic hyperfine field Bhf dis-ributions. The isomer shift (IS) was linearly coupled to the primaryyperfine parameters (QS, Bhf).
The X-ray Photoelectron Spectroscopy (XPS) measurementsere carried out with a hemispherical analyser (SES R4000, Gam-adata Scienta, pass energy 100 eV). The unmonochromatizedlK� X-ray source (1486.6 eV, 11 kV, 17 mA) without a charge neu-
ralizer was applied to generate core excitation. The system wasalibrated according to ISO 15472:2001. The energy resolution ofhe system, measured as a full width at half maximum (FWHM)or Ag 3d5/2 excitation line, was 0.9 eV. The powder samples wereressed into indium foil and mounted on a dedicated holder andhen UHV evacuated. During the measurements, the base pres-ure in the analysis chamber was about 10−9 mbar. The area of theample analysis was approximately 3 mm2. All binding energy (BE)alues were charge-corrected to the carbon C 1s excitation set at85.0 eV. The Shirley-type background subtraction was used to thepectra prior to the fitting procedure, where Voigt-line shape, i.e.aussian/Lorentzian functional (70:30) was applied. The Fe 2p andi 2p core excitations were deconvoluted with a relative intensityatio of 2p3/2 and 2p1/2 lines fixed to 2:1.
.3. Catalytic tests
(PS)-Fe1.0SiBEA, (PS)-Fe4.0SiBEA, (IE1)-FeHAlBEA, (IE2)-eHAlBEA, (Imp)-Fe1.0HAlBEA and (Imp)-Fe4.0HAlBEA samplesere studied as catalysts for N2O decomposition and SCR of NOith ammonia.
y 235 (2014) 210–225
2.3.1. Catalytic decomposition of N2OCatalytic tests were performed in a plug flow microreactor
system. The catalyst sample (100 mg) was loaded at the centralposition of the reactor onto a quartz wool plug. A flow of the reac-tion mixture was kept at 50 mL min−1 using mass flow controllers(Brooks 5850E), with a weight hourly space velocity (WHSV) ofabout 30,000 mL h−1 g−1. The reaction products were monitoredby a SRI 8610C gas chromatograph (equipped with two packedcolumns – Hayesep-D, Molsieve-5A and TCD detector). Prior to thecatalytic run the sample was outgassed at 723 K in a flow of purehelium. The dosing reaction mixture containing: [N2O] = 0.5 vol.%,[O2] = 4.5 vol.% and [He] = 95 vol.% was started immediately afteroutgassing process. Reaction temperature was increased from 423to 873 K in steps of 50 K. The first gas chromatography (GC) analysisat each selected temperature was performed after 15 min since thereactor temperature was stabilized.
2.3.2. SCR of NO with ammoniaCatalytic experiments were performed in a fixed-bed flow
microreactor system. The reactant concentrations were continu-ously measured using a quadrupole mass spectrometer (VG Quartz)connected directly to the reactor outlet. Prior to the reaction,each sample (100 mg) of the catalyst was outgassed in a flow ofpure helium at 823 K for 30 min. The following composition of thegas mixture was used: [NO] = [NH3] = 0.25 vol.%, [O2] = 2.5 vol.% and[He] = 97 vol.%. The reaction was studied in the temperature rangebetween 373 K and 823 K. Total flow rate of the reaction mixturewas 40 mL min−1, with a weight hourly space velocity (WHSV) ofabout 24,000 mL h−1 g−1.
3. Results and discussion
3.1. Crystallinity of studied materials
Fig. 1A–C presents X-ray diffraction patterns of SiBEA, (PS)-Fe1.0SiBEA, (PS)-Fe4.0SiBEA (Fig. 1A), HAlBEA, (Imp)-Fe1.0HAlBEA,(Imp)-Fe4.0HAlBEA (Fig. 1B), NH4AlBEA, (IE1)-FeHAlBEA, and (IE2)-FeHAlBEA (Fig. 1C).
The XRD patterns of all the samples are similar and characteristicof BEA zeolite. The crystallinity is preserved after dealuminationand the samples do not show any evidence of extra-frameworkcrystalline compounds or long-range amorphization of the zeolitestructure, as reported earlier [17,18]. Similar XRD diffractogramsrecorded for all the samples show that introduction of iron ions intosupports do not induce any significant changes in the BEA structure.
The absence of reflections characteristics of extra-frameworkiron oxides in (PS)-FexSiBEA indicates a good dispersion of iron. Ithas been reported [19] that a narrow diffraction peak near 22–23◦
can be used to compare qualitatively lattice contraction/expansionof the BEA structure. An increase of the d3 0 2 spacing from 3.880 A(2� = 22.90◦) for SiBEA to 3.948 A (2� = 22.50◦) for (PS)-Fe4.0SiBEAupon introduction of 4.0 wt.% of Fe into SiBEA (Fig. 1A) indicatesexpansion of the matrix as a result of the reaction of iron ions withOH groups of vacant T-atom sites (T = Si or Al) and their incorpora-tion into the framework positions of BEA zeolite, as reported earlier[17–22]. In spite of this expansion, Fe4.0SiBEA exhibits similarintensity of diffraction lines as that observed for SiBEA, suggest-ing that incorporation of Fe ions in this zeolite framework does notaffect its crystallinity.
An introduction of 1.0 or 4.0 wt.% of iron into HAlBEA zeoliteby conventional wet impregnation method does not lead to such
significant increase in the d3 0 2 spacing as it was observed uponincorporation of iron ions into SiBEA zeolite (Fig. 1B). In this case,a small increase in the d3 0 2 spacing from 3.930 A (2� = 22.58◦) forHAlBEA to 3.950 A (2� = 22.51◦) for (Imp)-Fe1.0HAlBEA or 3.940 A
P. Boron et al. / Catalysis Toda
10 20 30 40 50
(PS)-Fe4.0 SiBEA
(PS)-Fe1.0 SiBEA
22.50
22.60
2 Theta (°)
SiBEA
22.90
Inte
nsit
y (a
.u.)
A
10 20 30 40 50
(Imp)-Fe4.0
HAlBEA
(Imp)-Fe1.0
HAlBEA
22.53
22.51
2 Theta (°)
HAlBEA
22.58
Inte
nsit
y (a
.u.)
B
10 20 30 40 50
(IE2)-FeHAlBEA
(IE1)-FeHAlBEA
22.57
22.56
2 Theta (°)
NH4AlBEA
22.59
Inte
nsit
y (a
.u.)
C
FF(
(tr
min((eTp
cit
(a
ig. 1. XRD patterns recorded at room temperature of SiBEA, (PS)-Fe1.0SiBEA, (PS)-e4.0SiBEA (A), HAlBEA, (Imp)-Fe1.0HAlBEA, (Imp)-Fe4.0HAlBEA (B), and NH4AlBEA,IE1)-FeHAlBEA, (IE2)-FeHAlBEA (C).
2� = 22.53◦) for (Imp)-Fe4.0HAlBEA, respectively (Fig. 1B) suggestshat only some amounts of iron have been successfully incorpo-ated into the framework of BEA zeolite.
The introduction of iron ions into BEA zeolites by ion exchangeethod leads also to a small increase in the interlayer distance
n BEA matrix, what results in a shift of a narrow diffraction peakear 22–23◦ to lower values of 2�, from 2� = 22.59◦ (3.933 A)NH4AlBEA) to 2� = 22.56◦ (3.938 A) or 2� = 22.57◦ (3.936 A) forIE1)-FeHAlBEA and (IE2)-FeHAlBEA, respectively (Fig. 1C). Thisffect is related to the reaction of iron ions with OH groups of vacant-atom sites and their partial incorporation into the frameworkositions of BEA zeolite.
Moreover, X-ray diffractogram recorded for each sampleontains (3 0 2) reflection of similar intensity, suggesting thatntroduction of iron into zeolite supports does not affect their crys-
allinity.It should be noted that all materials have similar BET surface area490–530 m2 g−1) and micropore volume (0.23–0.25 cm3 g−1) char-cteristic for the BEA structure indicating that textural properties
y 235 (2014) 210–225 213
of BEA zeolite are preserved upon dealumination and introductionof iron into BEA structure by different methods.
3.2. FTIR evidence of incorporation of iron into SiBEA framework
The modifications induced by dealumination of the BEA matrixon microscopic level can be studied by FTIR spectroscopy [20].
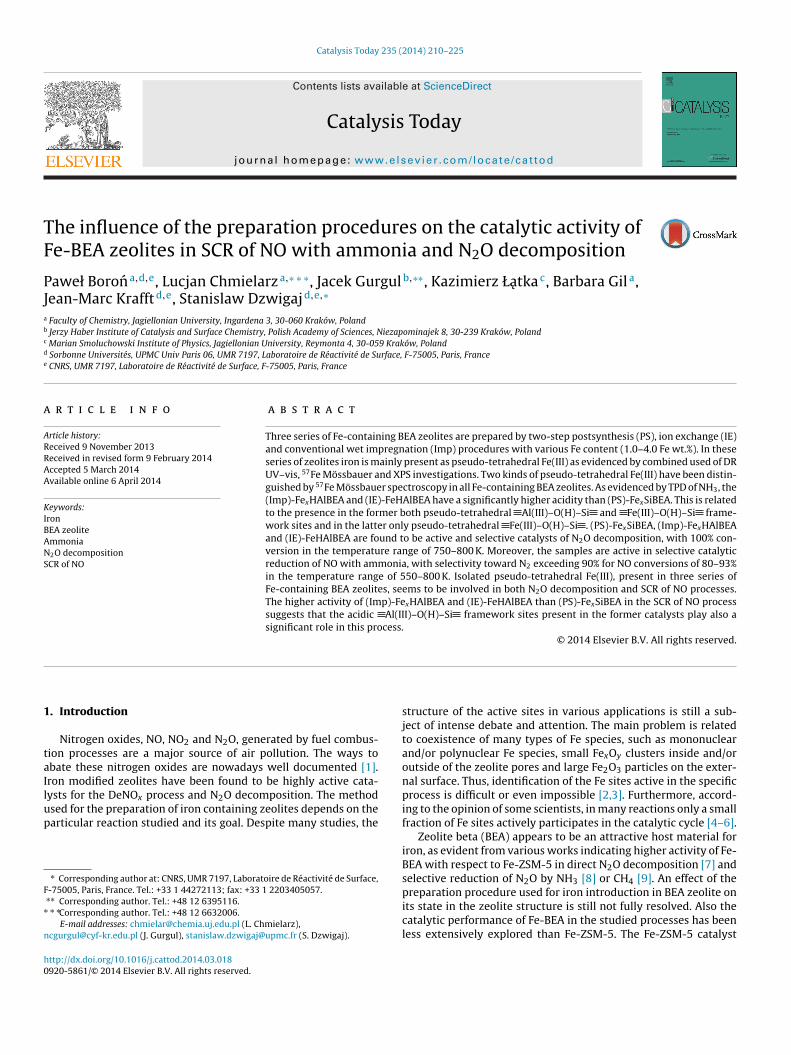
The band observed at 1092 cm−1 for SiBEA (Fig. 2A), HAlBEA(Fig. 2B) and NH4AlBEA (Fig. 2C) supports is characteristic ofthe �As(Si–O) vibration. Moreover, incorporation of iron ions intovacant T-atom sites is proved by the presence of the absorptionband at around 950 cm−1, assigned to the stretching vibration ofSi–O belonging to uncoupled (SiO4) tetrahedra with hydroxyl group[18,23–28] (Fig. 2A).
The band near 950 cm−1, observed for SiBEA, can be attributedto the presence of silanol groups. A strong decrease in intensity ofthis band and a small shift of its position to higher wavenumberobserved after introduction of Fe ions into SiBEA (Fig. 2A) indicatesa consumption of silanol groups as a result of their reaction with Feions.
In contrast, the FTIR spectra of HAlBEA and NH4AlBEA supportsexhibit less intense band at about 937–940 cm−1 indicating lowercontent of Si–O species belonging to uncoupled (SiO4) tetrahedrawith the hydroxyl groups (Fig. 2B and C). As a result only a verysmall change in the intensity of the band at 942 cm−1 is observedfor (Imp)-Fe4.0HAlBEA after introduction of iron ions into HAlBEA.
The treatment of HAlBEA zeolite with aqueous HNO3 solu-tion involves the elimination of Al atoms from the frameworkas evidenced by the disappearance of IR bands at 3781, 3665attributed to AlO–H and 3609 cm−1 to Al–O(H)–Si groups (Fig. 3), inline with earlier investigations [17,29]. The appearance of narrowbands at 3736 and 3710 cm−1 related to isolated silanol groups andbroad band at 3520 cm−1 due to H-bonded SiOH groups in SiBEAreveals the presence of vacant T-sites associated with silanol groups(Fig. 3), as reported earlier [17,29]. An incorporation of Fe into SiBEAzeolite leading to (PS)-FexSiBEA induces reduction of the intensityof these bands as shown in Fig. 3 for (PS)-Fe4.0SiBEA, suggesting thatSiO–H groups of vacant T-sites reacts with Fe ions with the forma-tion of framework Fe(III) sites. It is confirmed by appearance of theband at 3630 cm−1 which can be attributed to Fe(III)–O(H)–Siacidic sites.
3.3. Acidity of studied zeolites determined by FTIR and NH3-TPD
3.3.1. FTIR of adsorbed COCO is often used to simultaneously probe Lewis and Brønsted
acidic sites. Interaction of CO with OH groups in zeolites is welldocumented [30,31]. Due to H-bonding, CO induces a broaden-ing and a red shift of the OH bands. The higher acidity of OHgroups, the larger is the shift of the OH modes and the highercarbonyl stretching frequency [31]. However, the weak CO–OHinteraction requires the experiments to be performed at low-temperature.
Introduction of CO (100 Pa equilibrium pressure) into oxidised(PS)-Fe4.0SiBEA at 100 K leads to an erosion of the original hydroxylbands and appearance of intense bands at 3655 and 3342 cm−1
(Fig. 4A, spectrum a). The intensity of the band at 3655 cm−1 quicklydecreases with the CO equilibrium pressure, while the band at3740 cm−1 is restored (Fig. 4A, spectra b and c). The observed shiftof this band (85 cm−1) indicates a weak acidity of silanol groupspresent in this sample, similar to that observed for silanol groupsof silica [31]. The intensity of a shoulder located at 3342 cm−1
also decreases upon outgassing. However, the corresponding com-plexes are somewhat more stable than those giving the band at3655 cm−1. The CO-induced changes in the OH region of SiBEA(Fig. 5A) are similar. In this case, however, the band at 3655 cm−1
214 P. Boron et al. / Catalysis Today 235 (2014) 210–225
1500 1200 900
951
960
950
Wavenumber (cm-1)
SiBEA
Abs
orba
nce
(a.u
.)
1094
(PS)-Fe
1.0SiBEA
1092 A
(PS)-Fe
4.0SiBEA
1092
1500 1200 900
942
942
937
Wavenumber (cm-1 )
HAlBEA
Abs
orba
nce
(a.u
.)
1092
(Imp)-Fe
1.0HAlBEA
1096 B
(Imp)-Fe
4.0HAlBEA
1092
1500 1200 900
942
942
940
Wavenumber (cm-1)
NH4AlBEA
Abs
orba
nce
(a.u
.)
1091
(IE1)-FeHAlBEA
1091 C
(IE2)-FeHAlBEA
1092
F (PS)-(
(tboifsbg
Cp2T((23ttawz2ias2
ig. 2. FTIR spectra (KBr) recorded at room temperature of SiBEA, (PS)-Fe1.0SiBEA,IE1)-FeHAlBEA, (IE2)-FeHAlBEA (C).
arising from hydrogen-bonded silanols) is more intense, whilehe intensity of the band at 3450 cm−1 (associated with hydrogen-onded acidic hydroxyls) significantly increased. In the spectrumf SiBEA, the additional band at 3282 cm−1 appears and changests intensity simultaneously with the band at 3450 cm−1, there-ore it seems that this acidic centre belong to the same complex. Ahoulder located at 3595 cm−1 also loses intensity upon outgassing,ut the corresponding complexes are little more stable than thoseiving the band at 3655 cm−1.
Fig. 4B shows the FTIR spectrum in the range characteristic ofO adsorbed on oxidised (PS)-Fe4.0SiBEA. Under CO equilibriumressure of 100 Pa, seven carbonyl bands are detected at 2215,186, 2174, 2157, 2141, 2135 and 2091 cm−1 (Fig. 4B, spectrum a).he bands at 2141 and 2135 cm−1 are assigned to weakly bondedphysically adsorbed) CO [31] and disappear firstly upon outgassingFig. 4B, spectra b and c). The next band which disappears is that at157 cm−1. Its intensity correlates with that of the band located at655 cm−1 allowing assigning the 2157 cm−1 band to CO bondedo silanol groups. Further outgassing provokes disappearance ofhe carbonyl band at 2174 cm−1 (Fig. 4B, spectra c–f), which isssigned to CO polarized by the acidic Fe3+–O(H)–Si groups. Theavenumber of this band is typical of CO interacting with bridging
eolite hydroxyls. Three bands of low-intensity at 2115, 2186 and215 cm−1 not correlate with any OH band and are thus assigned to
ron carbonyls. Bands above 2200 cm−1 are often observed after COdsorption on zeolites and assigned to carbonyls formed with EFALpecies [31]. In order to exclude the possibility that the band at215 cm−1 originates from the residual aluminium traces present
Fe4.0SiBEA (A), HAlBEA, (Imp)-Fe1.0HAlBEA, (Imp)-Fe4.0HAlBEA (B), and NH4AlBEA,
in the sample, the additional studies of CO adsorption on zeolitenon-modified with iron were done. The results showed the absenceof the band at 2215 cm−1 and confirmed its assignment to iron car-bonyls, as already proposed by Berlier et al. [32]. In papers relatedto the adsorption of CO on iron-exchanged zeolites [33,34], it isgenerally accepted that Fe2+ ions in exchanged position form car-bonyls observed in the 2200–2190 cm−1 region. This suggests thatthe band at 2186 cm−1 is not associated with iron in exchangedposition and we assign it to CO adsorbed on isolated frameworkFe2+ species. Moreover, the band at 2215 cm−1 (observed for (PS)-Fe4.0SiBEA) has an unusual high wavenumber for iron carbonyls.The stretching frequency of adsorbed CO increases with the oxida-tion state of the metal [31]. This confirms the earlier assignment ofthis band to Fe3+–CO species.
Introduction of CO (100 Pa equilibrium pressure) into (IE1)-FeHAlBEA at 100 K leads to appearance of intense bands at 3655and 3448 cm−1 (Fig. 6A, spectrum a). The intensity of the bandat 3655 cm−1 decreases with the CO equilibrium pressure, whilethe band at 3745 cm−1 is restored (Fig. 6A, spectra b and c). Theobserved shift of this band (90 cm−1) indicates a weak acidity ofthe 3745 cm−1 silanol groups. Intensity of the shoulder located at3580 cm−1 also decreases upon outgassing. However, the corre-sponding complexes are somewhat more stable than those givingthe band at 3655 cm−1. It should be noted that further outgassing
gradually restores the band at 3620 cm−1 (Fig. 6A, spectra b–f),at the expenses of the broad bands at 3272 and 3448 cm−1. Theappearance of two shifted bands could indicate some heterogeneityof the Brønsted acidic sites.
P. Boron et al. / Catalysis Today 235 (2014) 210–225 215
4000 3800 3600 3400 3200
Abs
orba
nce
(a.u
.)
Fe4.0
SiBEA
SiBEA
(IE1)FeHAlBEA
Wavenumber (cm-1
)
HAlBEA
3748
3615
3786
3667
3748
3689
3615
3741
36313516
3741
3631 3516
Fig. 3. FTIR spectra (OH stretching region) of: parent HAlBEA, SiBEA, (IE1)-FeHAlBEAand (PS)-Fe4.0SiBEA zeolite.
4000 3800 3600 3400 3200
fed
c
b
Abs
orba
nce
(a.u
.)
Wavenumber (cm-1)
a
3655
3342
3740
A
2250 2200 2150 2100 2050
fed
c
b
Abs
orba
nce
(a.u
.)
Wavenumber (cm-1)
a
2141
2157
2174
2186
2215
2135
2115
B
Fig. 4. FTIR difference spectra (OH stretching region) of (PS)-Fe4.0SiBEA after adsorp-tion of CO at 100 K: equilibrium CO pressure of 100 Pa (a) and development of thespectra during evacuation at 100 K (b–f) (A) and FTIR spectra (carbonyl stretch-ing region) of CO adsorbed at 100 K on (PS)-Fe4.0SiBEA: equilibrium CO pressure of100 Pa (a) and development of the spectra during evacuation at 100 K (b–f) (B).
4000 3800 3600 3400 3200
fed
c
b
Abs
orba
nce
(a.u
.)
Wavenumber (cm-1 )
a
3655
3450
3740
3282
3595
A
2250 2200 2150 2100 2050
fed
c
b
Abs
orba
nce
(a.u
.)
Wavenumber (cm-1)
a
2140
2157
2174
2135
B
Fig. 5. FTIR difference spectra (OH stretching region) of SiBEA after adsorption of COat 100 K: equilibrium CO pressure of 100 Pa (a) and development of the spectra dur-
ing evacuation at 100 K (b–f) (A) and FTIR spectra (carbonyl stretching region) of COadsorbed at 100 K on SiBEA: equilibrium CO pressure of 100 Pa (a) and developmentof the spectra during evacuation at 100 K (b–f) (B).Adsorption of CO at 100 K on (IE1)-Fe-HAlBEA sample leads tothe appearance of eight IR bands in the carbonyl region at 2235,2222, 2190, 2175, 2157, 2142, 2133 and 2095 cm−1 (Fig. 6B, spec-tra a). The two bands at 2235 and 2222 cm−1 arise from Al3+–COcomplexes [31]. The bands at 2142 and 2133 cm−1 are due tophysically adsorbed CO [31]. The bands at 2175 and 2157 cm−1
are indicative of OH–CO interactions [31]. The respective hydro-xyls are bridging hydroxyls and isolated silanols. Upon decreasingthe CO equilibrium pressure and outgassing at 100 K, the bands at
−1
2142 and 2133 cm , characterizing physically adsorbed CO rapidlydisappear, followed by the bands due to CO H-bonded to Si–OH(2157 cm−1) (Fig. 6B, spectra b and c). The band at 2175 cm−1 dis-appears at higher outgassing temperatures (Fig. 6B, spectrum c).4000 3800 3600 3400 3200
f ed c
b
Abs
orba
nce
(a.u
.)
Wavenumber (cm-1 )
a
3655
3448
3745
3272
3290
A
3620
3580
3692
2250 2200 2150 2100 2050
fed
cb
Abs
orba
nce
(a.u
.)
Wavenumber (cm-1)
a
2222 2190
2175
2157
2142
2133
2235 2095
B
Fig. 6. FTIR difference spectra (OH stretching region) of (IE1)-FeHAlBEA afteradsorption of CO at 100 K: equilibrium CO pressure of 100 Pa (a) and development ofthe spectra during evacuation at 100 K (b–f) (A) and FTIR spectra (carbonyl stretch-ing region) of CO adsorbed at 100 K on (IE1)-FeHAlBEA: equilibrium CO pressure of100 Pa (a) and development of the spectra during evacuation at 100 K (b–f) (B).

216 P. Boron et al. / Catalysis Toda
800700600500400
NH
3 des
orpt
ion
(a.u
.)A
(PS)-Fe4.0SiBEA
(PS)-Fe1.0SiBEA
SiBEA
Temperature (K)
434
547
471
430
639
800700600500400
NH
3 des
orpt
ion
(a.u
.)
B
(Imp)-Fe4.0HAlBEA
(Imp)-Fe1.0HAlBEA
HAlBEA
Temperature (K)
447
596
467
619
483
637
800700600500400
NH
3 des
orpt
ion
(a.u
.)
C
(IE2)-FeHAlBEA
(IE1)-FeHAlBEA
NH4AlBEA
Temperature (K)
473
653
465
667
470
676
F(F
T2
3
tgadFi1rtanaN((D
ig. 7. TPD of NH3 patterns of SiBEA, (PS)-Fe1.0SiBEA, (PS)-Fe4.0SiBEA (A), HAlBEA,Imp)-Fe1.0HAlBEA, (Imp)-Fe4.0HAlBEA (B), and NH4AlBEA, (IE1)-FeHAlBEA, (IE2)-eHAlBEA (C).
he most stable bands correspond to Al3+–CO (band at 2235 and222 cm−1) and Fen+–CO (2190 cm−1) species (Fig. 6B).
.3.2. TPD of NH3The acidity (strength and concentration of acidic sites) of
he samples was studied using the method of temperature pro-rammed desorption of ammonia (NH3-TPD). Apart from ammoniany other gases were emitted during the TPD runs. Fig. 7A showsesorption patterns obtained for SiBEA, (PS)-Fe1.0SiBEA and (PS)-e4.0SiBEA. SiBEA is characterized by a rather low acidity, whichs represented by the concentration of adsorbed ammonia of20.7 �mol g−1. An introduction of iron into the SiBEA supportesulted in a significant increase in its acidity. Therefore, it seemshat transition metal ions incorporated into the zeolite supportre responsible for the formation of additional centres for ammo-ia adsorption. It should be noted that an introduction of highermount of iron ((PS)-Fe4.0SiBEA) generates additional sites for
−1
H3 adsorption (1504.0 �mol g ) compared to the (PS)-Fe1.0SiBEA719.7 �mol g−1). Ammonia desorption from the SiBEA sampleFig. 7A) is represented by symmetric maximum at about 430 K.esorption patterns obtained for the Fe-containing samples arey 235 (2014) 210–225
spread in the range from 400 to about 650 K with two unresolvedmaxima centred at 430–470 and 547–639 K. It should be notedthat ammonia remains chemisorbed on these samples at temper-atures significantly higher than on the SiBEA support. Therefore, itcould be concluded that introduced transition metal has a signif-icant contribution in the formation of stronger sites for ammoniachemisorption in this case.
The NH3-TPD patterns of HAlBEA, (Imp)-Fe1.0HAlBEA and (Imp)-Fe4.0HAlBEA are shown in Fig. 7B. These samples are characterizedby significantly higher concentration and strength of acidic sitescompared to that of SiBEA, (PS)-Fe1.0SiBEA and (PS)-Fe4.0SiBEA. TheTPD pattern of the HAlBEA is spread in the temperature range of393–693 K. Two clearly visible peaks are detected at about 447and 596 K. Introduction of iron into the HAlBEA support resultedin an increase of acidic sites concentration from 1367.4 �mol g−1
(HAlBEA) to 1905.1 �mol g−1 ((Imp)-Fe4.0HAlBEA). Additionally,modification of the HAlBEA support with iron shifts both peaksto higher temperatures as it can be seen in Fig. 7B. It suggests anincrease in strength of acidic sites in HAlBEA after introduction ofiron ions.
Desorption pattern obtained for the NH4AlBEA support (Fig. 7C)is characterized by a broad peak, spanned in the temperaturerange of 393–753 K with two maxima at about 473 and 653 K.The shapes of desorption patterns obtained for the (IE)-FeHAlBEAsamples are very similar to that recorded for (Imp)-FexHAlBEA.Modification of NH4AlBEA with iron increased the intensity ofNH3 desorption peaks. It should be stressed that introduction ofiron by the ion exchange method into the NH4AlBEA supportis accompanied by slight increase in adsorbed ammonia con-centration from 2027.9 �mol g−1 (NH4AlBEA) to 2386.8 �mol g−1
((IE2)-FeHAlBEA) and a shift of NH3 desorption peaks to highertemperatures.
As shown above, the desorption of ammonia proceeded in thetwo stages, however, the positions and intensities of desorptionmaxima depend on the method used for iron deposition as wellas the amount of transition metal that was incorporated into BEAzeolite.
Jansen et al. [76] proved that aluminium ions in BEA zeolite areresponsible for the presence of Brønsted acidic centres, both on theinternal and external surface as well as Lewis acidic centres thatare associated to the local defects. Camiloti et al. [77] discussedthe presence of two types of acidic centres in iron containing BEAzeolites. It was suggested that the first peak is attributed to desorp-tion of ammonia from Lewis acidic centres, while the second onepresent at higher temperature can be related to ammonia desorb-ing from Brønsted acidic centres. According to Hegde et al. [78],part of ammonia desorbing at lower temperatures is not boundedto Brønsted sites but to the structural defects, which are largelypresent in BEA zeolite [76,79].
The TPD patterns of all the samples consist of two maxima:the first one, more intense, at about 430–483 K and another near547–676 K. Incorporation of iron into the SiBEA, HAlBEA andNH4AlBEA supports, increases intensity of the first peak, which isshifted by about 40 K to higher temperatures for (PS)-Fe4.0SiBEAand (Imp)-Fe4.0HAlBEA. The shift of these peaks into higher tem-peratures indicates an increase in acid strength of the sites and,according to Beaumont and Barthomeuf [80], can be attributed toa higher proton activity as a consequence of the lower negativecharge density of the zeolite framework. It should be noted thatammonia desorbing at temperatures between 430 and 480 K wouldbe bounded to the structural defects. According to earlier stud-ies [76] these defects are present in BEA zeolite due to the localsilicon unsaturated bonding, thereby introducing potential Lewisacid sites. It can be noticed that (PS)-FexSiBEA materials with much
lower aluminium content, adsorb lower amounts of ammonia than(Imp)-FexHAlBEA and (IE)-FeAlBEA.
P. Boron et al. / Catalysis Toda
1700 1600 1500 1400
1637
Abs
orba
nce
(a.u
.)
(Imp)-Fe4.0
HAlBEA
Wavenumber (cm-1 )
(PS)-Fe4.0
SiBEA
160916
25
1545
1491
1450
1545
1609
1491
1450
1625
1637
Fp
3
twaaati1aBz
3
3
r(sfF
ecFapFsfsmteps
ig. 8. FTIR spectra of (PS)-Fe4.0SiBEA and (Imp)-Fe4.0HAlBEA pre-adsorbed withyridine.
.3.3. FTIR of adsorbed pyridineIn order to determine the chemical nature of acidic sites, addi-
ional FTIR studies for the selected, pyridine pre-adsorbed catalystsere done (Fig. 8). The bands typical of pyridinium cations are seen
t about 1545 and 1637 cm−1 and indicate the presence of Brønstedcidic centres. Moreover, the bands at about 1450 and 1625 cm−1
re related to pyridine interacting with strong Lewis acidic cen-res, while the band located at 1609 cm−1 corresponds to pyridinenteracting with weak Lewis acidic centres. Finally, the band at491 cm−1 is attributed to pyridine interacting with both Brønstednd Lewis acidic centres. Thus, it could be concluded that bothrønsted and Lewis acidic sites are present in the Fe-containingeolites.
.4. Nature and environment of the iron in Fe-containing zeolites
.4.1. DR UV–vis studiesIn order to obtain more information about the nature and envi-
onment of iron present in (PS)-FexSiBEA, (Imp)-FexHAlBEA andIE)-FeHAlBEA, these samples have been studied by DR UV–vispectroscopy. Fig. 9A–C shows the DR UV–vis spectra obtainedor (PS)-Fe1.0SiBEA, (PS)-Fe4.0SiBEA, (Imp)-Fe1.0HAlBEA, (Imp)-e4.0HAlBEA, (IE1)-FeHAlBEA and (IE2)-FeHAlBEA.
The (PS)-Fe1.0SiBEA sample with low iron content (1.0 wt.%)xhibits only one band at 278 nm, assigned to oxygen-to-metalharge transfer (CT) transitions involving pseudo-tetrahedrale(III), what is in line with earlier results [35–42]. The absence of
broad band near 500 nm, suggests that FeOx oligomers are notresent [35–37]. It should be noted that upon preparation of (PS)-e1.0SiBEA by two-step postsynthesis method iron ions have beenuccessfully incorporated into the zeolite framework and there-ore, this sample is characterized by the white colour. For theample with higher iron content (PS)-Fe4.0SiBEA (Fig. 9A), muchore intense band at about 282 nm assigned to framework pseudo-
etrahedral Fe(III) and additional band at 336 nm attributed toxtra-framework octahedral Fe(III) species are observed [43]. Theresence of a small amount of extra-framework octahedral Fe(III)pecies is confirmed by the light brown colour of the sample.
y 235 (2014) 210–225 217
In the DR UV–vis spectra of (Imp)-FexHAlBEA containing dif-ferent amounts of iron (1.0 and 4.0 wt.%) (Fig. 9B) characteristicbands in the range between 276 and 282 nm were found. It wassuggested that these bands are attributed to the presence of frame-work pseudo-tetrahedral Fe(III) [44–46]. The band recorded for the(Imp)-Fe4.0HAlBEA sample is much more intense, which is consis-tent with the higher iron content. Apart from isolated iron species intetrahedral coordination (bands below 300 nm) there are any addi-tional bands near 500 nm in UV–vis spectrum of (Imp)-Fe4.0HAlBEAcorresponding to FeOx oligomers or Fe2O3 nanoparticles [46].
DR UV–vis spectra of (IE1)-FeHAlBEA (2.6 wt.%) and (IE2)-FeHAlBEA (3.0 wt.%) (Fig. 9C) exhibit two characteristic bands atabout 290 and 340 nm. First band is related to the presence ofpseudo-tetrahedral Fe(III). DR UV–vis bands at 344 and 339 nm,observed respectively for (IE1)-FeHAlBEA and (IE2)-FeHAlBEA, canbe attributed to oxygen-to-metal CT transitions involving Fe(III) inoctahedral environment of oxygen atoms and proved the presenceof small amount of extra-framework octahedral Fe(III) species asreported earlier [38]. The absence of a broad band near 500 nm,suggests that FeOx oligomers are not present [35–37].
3.4.2. 57Fe Mössbauer studiesThe successful iron introduction and the differences between
Fe species in all obtained Fe-containing samples are also found57Fe Mössbauer spectra (Fig. 10A–C) recorded at room temperature.The hyperfine parameters obtained by computer evaluation of allmeasured spectra are summarized in Table 1. At a first glance, thespectra are quite similar. There are asymmetric doublets only, andall of them are characterized by small isomer shift (IS < 0.2 mm s−1).This parameter is often used to distinguish between ferric and fer-rous iron. Usually, ferrous iron exhibits isomer shift values higherthan 0.6 mm s−1, whereas IS of ferric iron is much lower [47–49].Moreover, Garten et al. [50] have also shown that at room tem-perature IS < 0.3 mm s−1 is indicative of tetrahedral Fe(III) specieswhereas octahedral Fe(III) materials give IS > 0.3 mm s−1. This leadsto the conclusion that iron was introduce in the BEA matrix in theform of tetrahedrally coordinated Fe(III) species mainly (Table 1),in line with earlier works [51–54].
On the other hand, the absence of well-resolved magnetic sex-tets in the wide range of velocities indicates lack of large magneticoxide particles, i.e. Fe2O3 [49]. However, the spectra displayed inFig. 10A and B have much broader central part of the spectrum,which can be related to the relaxation phenomena, in line with ear-lier reports [6,52]. It is worth recalling that relaxation phenomenamay appear in the spectra when the electronic spin relaxation timeis faster than the nuclear Larmor precession frequency. This phe-nomenon, which is a function of iron particle volume, results inaveraging of internal magnetic field. It is well known that at highertemperatures the absorption lines become broader and can collapseinto unresolved sextet or even doublet [55,56]. Due to the fact, thatspin-lattice relaxation is significantly faster for Fe2+ than for Fe3+
ions, hence relaxation effects in most cases are observed owing toFe3+ species [55].
The Mössbauer spectrum of (PS)-Fe4.0SiBEA (Fig. 10A) wasdeconvoluted into three components related to Fe(III) species intwo different tetrahedral surroundings (light grey and grey dou-blets) and very broad component assigned to the set of severalunresolved sextets (ca. 21% of total area, dark grey component),in accordance with literature data [47,52,56,57]. According toour recent works [53,58], two tetrahedral Fe(III) species can beattributed to the two kinds of vacant T-atom sites produced in BEAmatrix after the dealumination process. A such a broad component
is a fingerprint of magnetic hyperfine interactions in magnet-ically ordered iron-oxide phases leading to collective magneticexcitations or superparamagnetism [49,55]. Because magneticcontributions from superparamagnetic iron-oxide particles and
218 P. Boron et al. / Catalysis Today 235 (2014) 210–225
800700600500400300200
A
Kub
elka
Mun
k F
unct
ion
(a.u
.)
(PS)-Fe4.0
SiBEA
(PS)-Fe1.0
SiBEA
SiBEA
Wavelength (nm)
336
282
278
800700600500400300200
B
Kub
elka
Mun
k F
unct
ion
(a.u
.)
(Imp)-Fe4.0
HAlBEA
(Imp)-Fe1.0
HAlBEA
HAlBEA
Wavelength (nm)
276
282
800700600500400300200
C
Kub
elka
Mun
k F
unct
ion
(a.u
.)
(IE2)-FeHAlBEA
(IE1)-FeHAlBEA
NH4AlBEA
Wavelength (nm)
286
339
287344
F , (PS)(
ih
bsofitoterlsbtm
ig. 9. DR UV–vis spectra recorded at ambient atmosphere of SiBEA, (PS)-Fe1.0SiBEAIE1)-FeHAlBEA, (IE2)-FeHAlBEA (C).
solated paramagnetic iron atoms have similar values of magneticyperfine splitting, they could largely overlap.
However, there is an easy way to distinguish between theseoth cases by applying a strong external magnetic field. Undertrong external magnetic field the spectra of magnetically orderedxides would be broaden or splitted, whereas paramagnetic hyper-ne spectra will become much sharper. It is worth mentioning thathe use of Mössbauer technique for the samples with low contentf iron is time consuming, in spite of relatively strong source, sinceo get a reasonable good quality of Mössbauer spectrum requiredven several weeks of measuring period. Due to these facts, theesults of our experiments with external magnetic field will be pub-ished in the future. However, brown colour of our sample could
uggest presence of antiferromagnetic interactions due to Fe–O–Feonds arising from very small iron-oxide particles [47,55], andhus relaxation phenomena are assigned rather to the collectiveagnetic excitations. The quadrupole splittings of both tetrahedral
-Fe4.0SiBEA (A), HAlBEA, (Imp)-Fe1.0HAlBEA, (Imp)-Fe4.0HAlBEA (B), and NH4AlBEA,
components are in the typical range, in line with earlier results[53,54]. The Mössbauer spectrum of sample with lower content ofiron, (PS)-Fe1.0SiBEA, has much larger asymmetry and the relax-ation effects are better visible. Besides two tetrahedral Fe(III)components, over 45% of total spectrum area should be assignedto the bunch of unresolved sextets. Despite of a rather large contri-bution of relaxation component, the sample is off-white.
Fig. 10B presents Mössbauer spectra of the samples prepared byimpregnation with two different contents of iron. One can find thatboth spectra contain two characteristic doublets of Fe(III) specieslocated in tetrahedral positions and broad background originatedfrom the unresolved sextets with much smaller values of hyper-fine magnetic field (below 28% of total area, dark grey component).
We believe that this component is related to dilute paramagneticferric ions, which is line with the off-white colour of both the sam-ples. Because this phenomenon is closely related to large Fe–Fedistances, it can be a sign of homogeneous distribution of Fe(III). The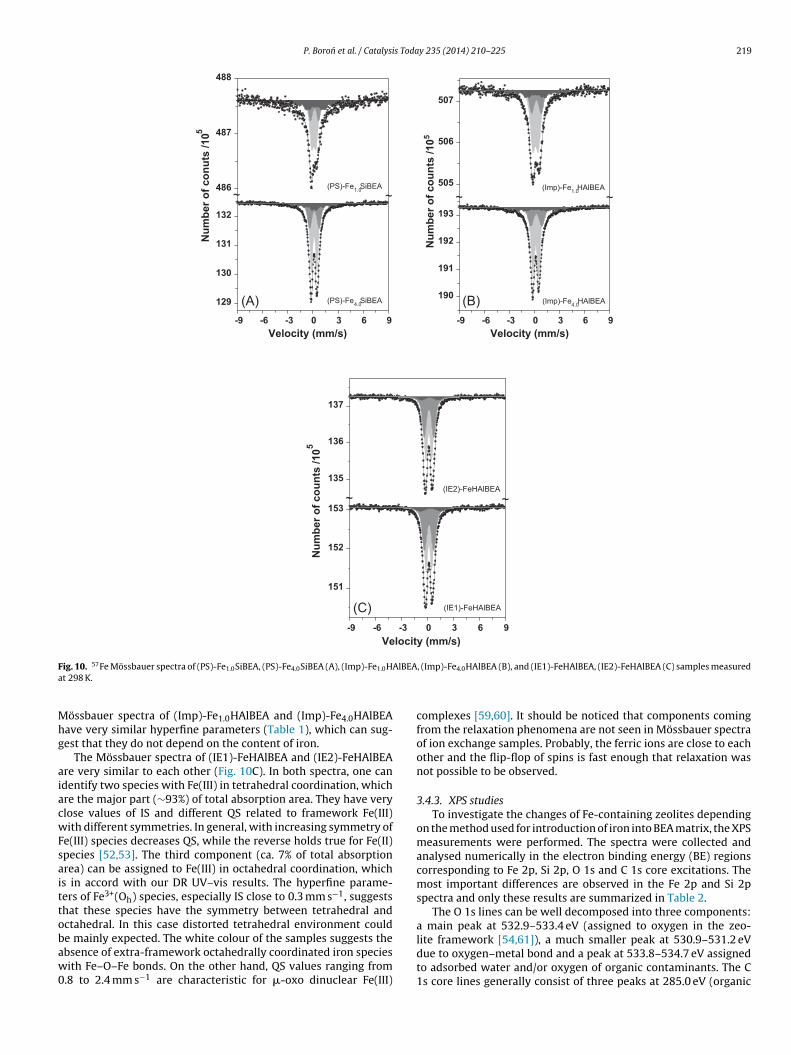
P. Boron et al. / Catalysis Today 235 (2014) 210–225 219
-9 -6 -3 0 3 6 9
129
130
131
132
(PS)-Fe4.0SiBEA
~N
umbe
r of c
onut
s /1
05
Velocity (mm/s)
(A)
486
487
488
(PS)-Fe1.0SiBEA~~
-9 -6 -3 0 3 6 9
190
191
192
193~
(Imp)-Fe4.0HAlBEA
Num
ber o
f cou
nts
/105
Velocity (mm/s)
(B)
505
506
507
~(Imp)-Fe1.0HAlBEA
-9 -6 -3 0 3 6 9
151
152
153
(IE1)-FeHAlBEA
Num
ber o
f cou
nts
/105
Velocity (mm/s)
(C)
135
136
137
(IE2)-FeHAlBEA~~
F AlBEAa
Mhg
aiacwFsaittobaw0
ig. 10. 57Fe Mössbauer spectra of (PS)-Fe1.0SiBEA, (PS)-Fe4.0SiBEA (A), (Imp)-Fe1.0Ht 298 K.
össbauer spectra of (Imp)-Fe1.0HAlBEA and (Imp)-Fe4.0HAlBEAave very similar hyperfine parameters (Table 1), which can sug-est that they do not depend on the content of iron.
The Mössbauer spectra of (IE1)-FeHAlBEA and (IE2)-FeHAlBEAre very similar to each other (Fig. 10C). In both spectra, one candentify two species with Fe(III) in tetrahedral coordination, whichre the major part (∼93%) of total absorption area. They have verylose values of IS and different QS related to framework Fe(III)ith different symmetries. In general, with increasing symmetry of
e(III) species decreases QS, while the reverse holds true for Fe(II)pecies [52,53]. The third component (ca. 7% of total absorptionrea) can be assigned to Fe(III) in octahedral coordination, whichs in accord with our DR UV–vis results. The hyperfine parame-ers of Fe3+(Oh) species, especially IS close to 0.3 mm s−1, suggestshat these species have the symmetry between tetrahedral andctahedral. In this case distorted tetrahedral environment could
e mainly expected. The white colour of the samples suggests thebsence of extra-framework octahedrally coordinated iron speciesith Fe–O–Fe bonds. On the other hand, QS values ranging from.8 to 2.4 mm s−1 are characteristic for �-oxo dinuclear Fe(III)
, (Imp)-Fe4.0HAlBEA (B), and (IE1)-FeHAlBEA, (IE2)-FeHAlBEA (C) samples measured
complexes [59,60]. It should be noticed that components comingfrom the relaxation phenomena are not seen in Mössbauer spectraof ion exchange samples. Probably, the ferric ions are close to eachother and the flip-flop of spins is fast enough that relaxation wasnot possible to be observed.
3.4.3. XPS studiesTo investigate the changes of Fe-containing zeolites depending
on the method used for introduction of iron into BEA matrix, the XPSmeasurements were performed. The spectra were collected andanalysed numerically in the electron binding energy (BE) regionscorresponding to Fe 2p, Si 2p, O 1s and C 1s core excitations. Themost important differences are observed in the Fe 2p and Si 2pspectra and only these results are summarized in Table 2.
The O 1s lines can be well decomposed into three components:a main peak at 532.9–533.4 eV (assigned to oxygen in the zeo-
lite framework [54,61]), a much smaller peak at 530.9–531.2 eVdue to oxygen–metal bond and a peak at 533.8–534.7 eV assignedto adsorbed water and/or oxygen of organic contaminants. The C1s core lines generally consist of three peaks at 285.0 eV (organic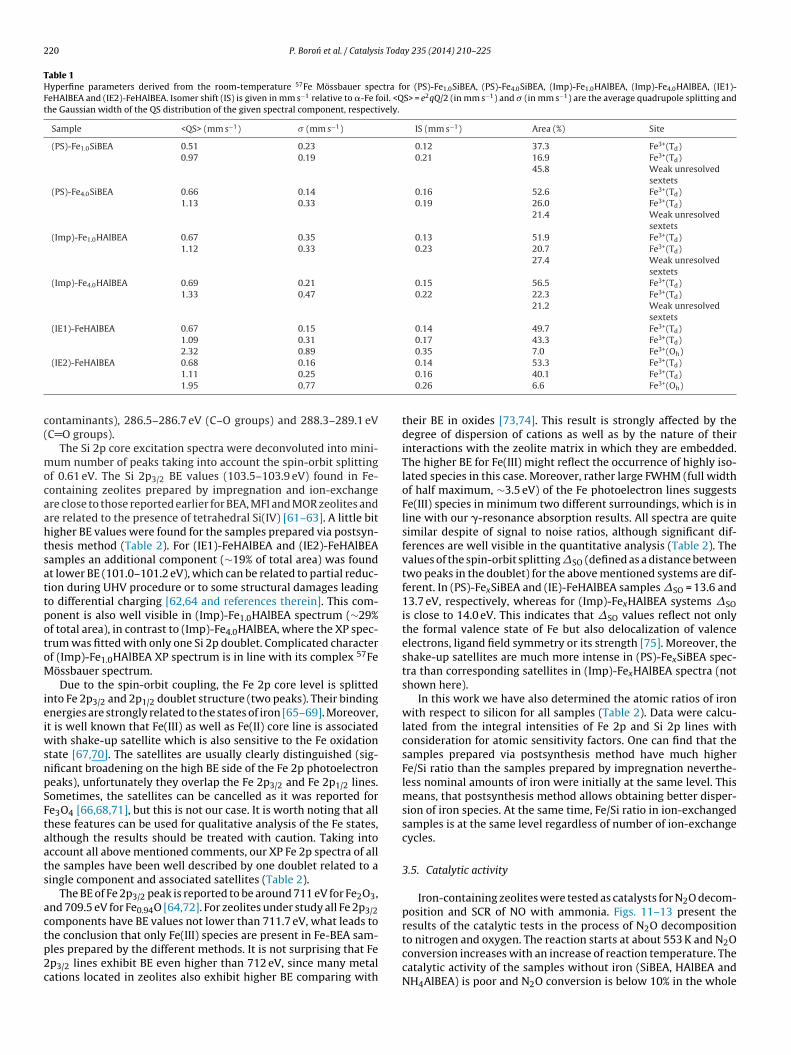
220 P. Boron et al. / Catalysis Today 235 (2014) 210–225
Table 1Hyperfine parameters derived from the room-temperature 57Fe Mössbauer spectra for (PS)-Fe1.0SiBEA, (PS)-Fe4.0SiBEA, (Imp)-Fe1.0HAlBEA, (Imp)-Fe4.0HAlBEA, (IE1)-FeHAlBEA and (IE2)-FeHAlBEA. Isomer shift (IS) is given in mm s−1 relative to �-Fe foil. <QS> = e2qQ/2 (in mm s−1) and � (in mm s−1) are the average quadrupole splitting andthe Gaussian width of the QS distribution of the given spectral component, respectively.
Sample <QS> (mm s−1) � (mm s−1) IS (mm s−1) Area (%) Site
(PS)-Fe1.0SiBEA 0.510.97
0.230.19
0.120.21
37.316.945.8
Fe3+(Td)Fe3+(Td)Weak unresolvedsextets
(PS)-Fe4.0SiBEA 0.661.13
0.140.33
0.160.19
52.626.021.4
Fe3+(Td)Fe3+(Td)Weak unresolvedsextets
(Imp)-Fe1.0HAlBEA 0.671.12
0.350.33
0.130.23
51.920.727.4
Fe3+(Td)Fe3+(Td)Weak unresolvedsextets
(Imp)-Fe4.0HAlBEA 0.691.33
0.210.47
0.150.22
56.522.321.2
Fe3+(Td)Fe3+(Td)Weak unresolvedsextets
(IE1)-FeHAlBEA 0.671.092.32
0.150.310.89
0.140.170.35
49.743.37.0
Fe3+(Td)Fe3+(Td)Fe3+(Oh)
3+
c(
mocaahtsattpotoM
ieiwsnpSFtaats
actp2c
(IE2)-FeHAlBEA 0.681.111.95
0.160.250.77
ontaminants), 286.5–286.7 eV (C–O groups) and 288.3–289.1 eVC O groups).
The Si 2p core excitation spectra were deconvoluted into mini-um number of peaks taking into account the spin-orbit splitting
f 0.61 eV. The Si 2p3/2 BE values (103.5–103.9 eV) found in Fe-ontaining zeolites prepared by impregnation and ion-exchangere close to those reported earlier for BEA, MFI and MOR zeolites andre related to the presence of tetrahedral Si(IV) [61–63]. A little bitigher BE values were found for the samples prepared via postsyn-hesis method (Table 2). For (IE1)-FeHAlBEA and (IE2)-FeHAlBEAamples an additional component (∼19% of total area) was foundt lower BE (101.0–101.2 eV), which can be related to partial reduc-ion during UHV procedure or to some structural damages leadingo differential charging [62,64 and references therein]. This com-onent is also well visible in (Imp)-Fe1.0HAlBEA spectrum (∼29%f total area), in contrast to (Imp)-Fe4.0HAlBEA, where the XP spec-rum was fitted with only one Si 2p doublet. Complicated characterf (Imp)-Fe1.0HAlBEA XP spectrum is in line with its complex 57Feössbauer spectrum.Due to the spin-orbit coupling, the Fe 2p core level is splitted
nto Fe 2p3/2 and 2p1/2 doublet structure (two peaks). Their bindingnergies are strongly related to the states of iron [65–69]. Moreover,t is well known that Fe(III) as well as Fe(II) core line is associated
ith shake-up satellite which is also sensitive to the Fe oxidationtate [67,70]. The satellites are usually clearly distinguished (sig-ificant broadening on the high BE side of the Fe 2p photoelectroneaks), unfortunately they overlap the Fe 2p3/2 and Fe 2p1/2 lines.ometimes, the satellites can be cancelled as it was reported fore3O4 [66,68,71], but this is not our case. It is worth noting that allhese features can be used for qualitative analysis of the Fe states,lthough the results should be treated with caution. Taking intoccount all above mentioned comments, our XP Fe 2p spectra of allhe samples have been well described by one doublet related to aingle component and associated satellites (Table 2).
The BE of Fe 2p3/2 peak is reported to be around 711 eV for Fe2O3,nd 709.5 eV for Fe0.94O [64,72]. For zeolites under study all Fe 2p3/2omponents have BE values not lower than 711.7 eV, what leads to
he conclusion that only Fe(III) species are present in Fe-BEA sam-les prepared by the different methods. It is not surprising that Fep3/2 lines exhibit BE even higher than 712 eV, since many metalations located in zeolites also exhibit higher BE comparing with0.140.160.26
53.340.16.6
Fe (Td)Fe3+(Td)Fe3+(Oh)
their BE in oxides [73,74]. This result is strongly affected by thedegree of dispersion of cations as well as by the nature of theirinteractions with the zeolite matrix in which they are embedded.The higher BE for Fe(III) might reflect the occurrence of highly iso-lated species in this case. Moreover, rather large FWHM (full widthof half maximum, ∼3.5 eV) of the Fe photoelectron lines suggestsFe(III) species in minimum two different surroundings, which is inline with our �-resonance absorption results. All spectra are quitesimilar despite of signal to noise ratios, although significant dif-ferences are well visible in the quantitative analysis (Table 2). Thevalues of the spin-orbit splitting �SO (defined as a distance betweentwo peaks in the doublet) for the above mentioned systems are dif-ferent. In (PS)-FexSiBEA and (IE)-FeHAlBEA samples �SO = 13.6 and13.7 eV, respectively, whereas for (Imp)-FexHAlBEA systems �SOis close to 14.0 eV. This indicates that �SO values reflect not onlythe formal valence state of Fe but also delocalization of valenceelectrons, ligand field symmetry or its strength [75]. Moreover, theshake-up satellites are much more intense in (PS)-FexSiBEA spec-tra than corresponding satellites in (Imp)-FexHAlBEA spectra (notshown here).
In this work we have also determined the atomic ratios of ironwith respect to silicon for all samples (Table 2). Data were calcu-lated from the integral intensities of Fe 2p and Si 2p lines withconsideration for atomic sensitivity factors. One can find that thesamples prepared via postsynthesis method have much higherFe/Si ratio than the samples prepared by impregnation neverthe-less nominal amounts of iron were initially at the same level. Thismeans, that postsynthesis method allows obtaining better disper-sion of iron species. At the same time, Fe/Si ratio in ion-exchangedsamples is at the same level regardless of number of ion-exchangecycles.
3.5. Catalytic activity
Iron-containing zeolites were tested as catalysts for N2O decom-position and SCR of NO with ammonia. Figs. 11–13 present theresults of the catalytic tests in the process of N2O decomposition
to nitrogen and oxygen. The reaction starts at about 553 K and N2Oconversion increases with an increase of reaction temperature. Thecatalytic activity of the samples without iron (SiBEA, HAlBEA andNH4AlBEA) is poor and N2O conversion is below 10% in the whole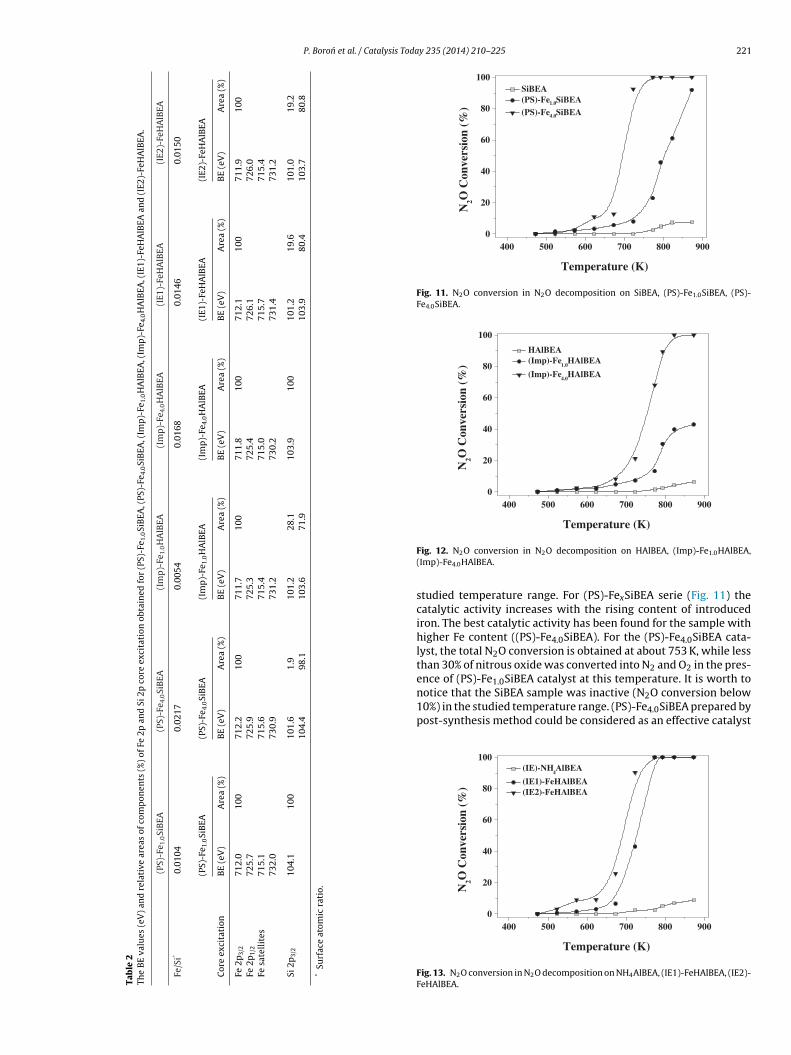
P. Boron et al. / Catalysis Today 235 (2014) 210–225 221
Tab
le
2Th
e
BE
valu
es
(eV
)
and
rela
tive
area
s
of
com
pon
ents
(%)
of
Fe
2p
and
Si
2p
core
exci
tati
on
obta
ined
for
(PS)
-Fe 1
.0Si
BEA
, (PS
)-Fe
4.0Si
BEA
, (Im
p)-
Fe1.
0H
AlB
EA, (
Imp
)-Fe
4.0H
AlB
EA, (
IE1)
-FeH
AlB
EA
and
(IE2
)-Fe
HA
lBEA
.
(PS)
-Fe 1
.0Si
BEA
(PS)
-Fe 4
.0Si
BEA
(Im
p)-
Fe1.
0H
AlB
EA
(Im
p)-
Fe4.
0H
AlB
EA
(IE1
)-Fe
HA
lBEA
(IE2
)-Fe
HA
lBEA
Fe/S
i*0.
0104
0.02
17
0.00
54
0.01
68
0.01
46
0.01
50
(PS)
-Fe 1
.0Si
BEA
(PS)
-Fe 4
.0Si
BEA
(Im
p)-
Fe1.
0H
AlB
EA
(Im
p)-
Fe4.
0H
AlB
EA
(IE1
)-Fe
HA
lBEA
(IE2
)-Fe
HA
lBEA
Cor
e
exci
tati
onB
E
(eV
)A
rea
(%)
BE
(eV
)A
rea
(%)
BE
(eV
)A
rea
(%)
BE
(eV
)A
rea
(%)
BE
(eV
)
Are
a (%
) B
E
(eV
)
Are
a
(%)
Fe
2p3/
271
2.0
100
712.
2
100
711.
7
100
711.
8
100
712.
1
100
711.
9
100
Fe
2p1/
272
5.7
725.
972
5.3
725.
472
6.1
726.
0Fe
sate
llit
es
715.
1
715.
6
715.
4
715.
0
715.
7
715.
473
2.0
730.
9
731.
2
730.
2
731.
4
731.
2
Si
2p3/
210
4.1
100
101.
610
4.4
1.9
98.1
101.
210
3.6
28.1
71.9
103.
9
100
101.
210
3.9
19.6
80.4
101.
010
3.7
19.2
80.8
*Su
rfac
e
atom
ic
rati
o.
400 500 600 700 800 9000
20
40
60
80
100
N2O
Con
vers
ion
(%)
Temperature (K)
SiBEA (PS)-Fe1.0SiBEA (PS)-Fe4.0SiBEA
Fig. 11. N2O conversion in N2O decomposition on SiBEA, (PS)-Fe1.0SiBEA, (PS)-Fe4.0SiBEA.
400 500 600 700 800 9000
20
40
60
80
100
N2O
Con
vers
ion
(%)
Temperature (K)
HAlBEA (Imp)-Fe
1.0HAlBEA
(Imp)-Fe4.0
HAlBEA
Fig. 12. N2O conversion in N2O decomposition on HAlBEA, (Imp)-Fe1.0HAlBEA,(Imp)-Fe4.0HAlBEA.
studied temperature range. For (PS)-FexSiBEA serie (Fig. 11) thecatalytic activity increases with the rising content of introducediron. The best catalytic activity has been found for the sample withhigher Fe content ((PS)-Fe4.0SiBEA). For the (PS)-Fe4.0SiBEA cata-lyst, the total N2O conversion is obtained at about 753 K, while lessthan 30% of nitrous oxide was converted into N2 and O2 in the pres-ence of (PS)-Fe1.0SiBEA catalyst at this temperature. It is worth to
notice that the SiBEA sample was inactive (N2O conversion below10%) in the studied temperature range. (PS)-Fe4.0SiBEA prepared bypost-synthesis method could be considered as an effective catalyst400 500 600 700 800 9000
20
40
60
80
100
N2O
Con
vers
ion
(%)
Temperature (K)
(IE)-NH4AlBEA
(IE1)-FeHAlBEA (IE2)-FeHAlBEA
Fig. 13. N2O conversion in N2O decomposition on NH4AlBEA, (IE1)-FeHAlBEA, (IE2)-FeHAlBEA.
2 s Today 235 (2014) 210–225
fFbD
osttiwFsc(Nic(ifis
ed5tF7odiTh[patZlFaaFns
tNpposNatT9bFc5tti
400 500 600 700 8000
20
40
60
80
100
NO
Con
vers
ion
(%)
Temperature (K)
100
(PS)-Fe1.0
SiBEA
(PS)-Fe4.0
SiBEA
SiBEA
Sele
ctiv
ity
to N
2 (%
)
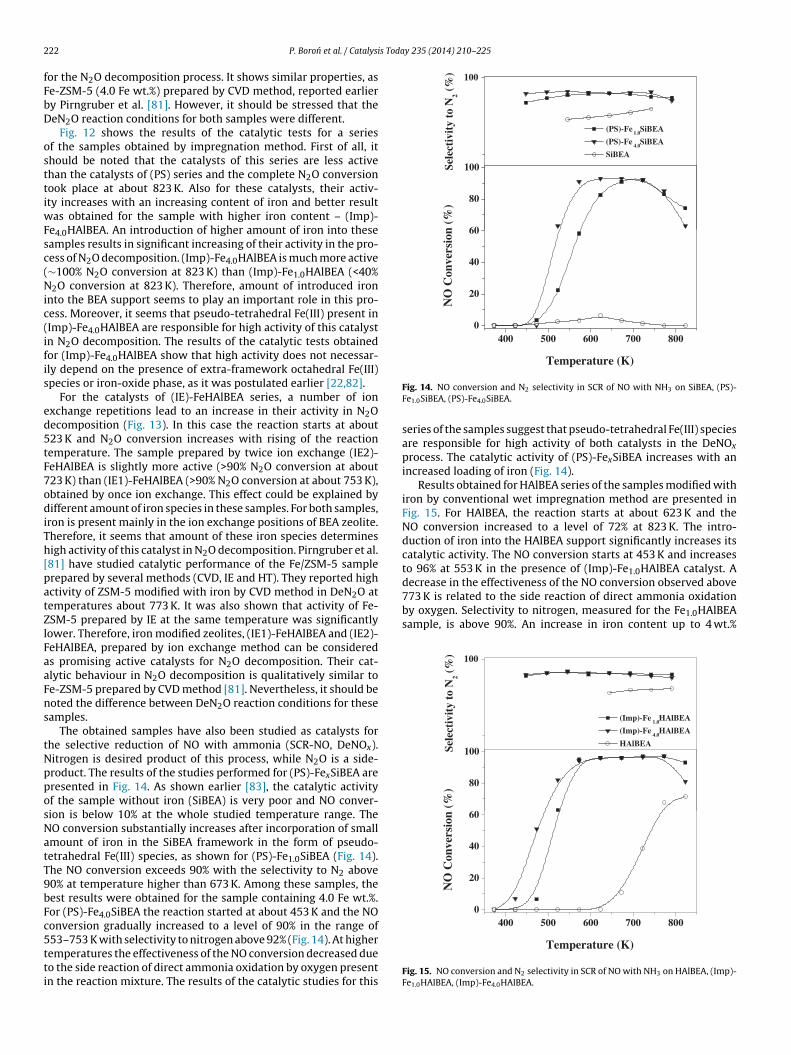
decrease in the effectiveness of the NO conversion observed above773 K is related to the side reaction of direct ammonia oxidationby oxygen. Selectivity to nitrogen, measured for the Fe1.0HAlBEAsample, is above 90%. An increase in iron content up to 4 wt.%
100
(Imp)-Fe1.0
HAlBEA
(Imp)-Fe4.0
HAlBEA
HAlBEASele
ctiv
ity
to N
2 (%
)
400 500 600 700 8000
20
40
60
80
100
NO
Con
vers
ion
(%)
22 P. Boron et al. / Catalysi
or the N2O decomposition process. It shows similar properties, ase-ZSM-5 (4.0 Fe wt.%) prepared by CVD method, reported earliery Pirngruber et al. [81]. However, it should be stressed that theeN2O reaction conditions for both samples were different.
Fig. 12 shows the results of the catalytic tests for a seriesf the samples obtained by impregnation method. First of all, ithould be noted that the catalysts of this series are less activehan the catalysts of (PS) series and the complete N2O conversionook place at about 823 K. Also for these catalysts, their activ-ty increases with an increasing content of iron and better result
as obtained for the sample with higher iron content – (Imp)-e4.0HAlBEA. An introduction of higher amount of iron into theseamples results in significant increasing of their activity in the pro-ess of N2O decomposition. (Imp)-Fe4.0HAlBEA is much more active∼100% N2O conversion at 823 K) than (Imp)-Fe1.0HAlBEA (<40%2O conversion at 823 K). Therefore, amount of introduced iron
nto the BEA support seems to play an important role in this pro-ess. Moreover, it seems that pseudo-tetrahedral Fe(III) present inImp)-Fe4.0HAlBEA are responsible for high activity of this catalystn N2O decomposition. The results of the catalytic tests obtainedor (Imp)-Fe4.0HAlBEA show that high activity does not necessar-ly depend on the presence of extra-framework octahedral Fe(III)pecies or iron-oxide phase, as it was postulated earlier [22,82].
For the catalysts of (IE)-FeHAlBEA series, a number of ionxchange repetitions lead to an increase in their activity in N2Oecomposition (Fig. 13). In this case the reaction starts at about23 K and N2O conversion increases with rising of the reactionemperature. The sample prepared by twice ion exchange (IE2)-eHAlBEA is slightly more active (>90% N2O conversion at about23 K) than (IE1)-FeHAlBEA (>90% N2O conversion at about 753 K),btained by once ion exchange. This effect could be explained byifferent amount of iron species in these samples. For both samples,
ron is present mainly in the ion exchange positions of BEA zeolite.herefore, it seems that amount of these iron species determinesigh activity of this catalyst in N2O decomposition. Pirngruber et al.81] have studied catalytic performance of the Fe/ZSM-5 samplerepared by several methods (CVD, IE and HT). They reported highctivity of ZSM-5 modified with iron by CVD method in DeN2O atemperatures about 773 K. It was also shown that activity of Fe-SM-5 prepared by IE at the same temperature was significantlyower. Therefore, iron modified zeolites, (IE1)-FeHAlBEA and (IE2)-eHAlBEA, prepared by ion exchange method can be considereds promising active catalysts for N2O decomposition. Their cat-lytic behaviour in N2O decomposition is qualitatively similar toe-ZSM-5 prepared by CVD method [81]. Nevertheless, it should beoted the difference between DeN2O reaction conditions for theseamples.
The obtained samples have also been studied as catalysts forhe selective reduction of NO with ammonia (SCR-NO, DeNOx).itrogen is desired product of this process, while N2O is a side-roduct. The results of the studies performed for (PS)-FexSiBEA areresented in Fig. 14. As shown earlier [83], the catalytic activityf the sample without iron (SiBEA) is very poor and NO conver-ion is below 10% at the whole studied temperature range. TheO conversion substantially increases after incorporation of smallmount of iron in the SiBEA framework in the form of pseudo-etrahedral Fe(III) species, as shown for (PS)-Fe1.0SiBEA (Fig. 14).he NO conversion exceeds 90% with the selectivity to N2 above0% at temperature higher than 673 K. Among these samples, theest results were obtained for the sample containing 4.0 Fe wt.%.or (PS)-Fe4.0SiBEA the reaction started at about 453 K and the NOonversion gradually increased to a level of 90% in the range of
53–753 K with selectivity to nitrogen above 92% (Fig. 14). At higheremperatures the effectiveness of the NO conversion decreased dueo the side reaction of direct ammonia oxidation by oxygen presentn the reaction mixture. The results of the catalytic studies for thisFig. 14. NO conversion and N2 selectivity in SCR of NO with NH3 on SiBEA, (PS)-Fe1.0SiBEA, (PS)-Fe4.0SiBEA.
series of the samples suggest that pseudo-tetrahedral Fe(III) speciesare responsible for high activity of both catalysts in the DeNOx
process. The catalytic activity of (PS)-FexSiBEA increases with anincreased loading of iron (Fig. 14).
Results obtained for HAlBEA series of the samples modified withiron by conventional wet impregnation method are presented inFig. 15. For HAlBEA, the reaction starts at about 623 K and theNO conversion increased to a level of 72% at 823 K. The intro-duction of iron into the HAlBEA support significantly increases itscatalytic activity. The NO conversion starts at 453 K and increasesto 96% at 553 K in the presence of (Imp)-Fe1.0HAlBEA catalyst. A
Temperature (K)
Fig. 15. NO conversion and N2 selectivity in SCR of NO with NH3 on HAlBEA, (Imp)-Fe1.0HAlBEA, (Imp)-Fe4.0HAlBEA.

P. Boron et al. / Catalysis Toda
400 500 600 700 8000
20
40
60
80
100
NO
Con
vers
ion
(%)
Temperature (K)
100
(IE1)-FeHAlBEA (IE2)-FeHAlBEA NH
4AlBEA
Sele
ctiv
ity
to N
2 (%
)
Fig. 16. NO conversion and N selectivity in SCR of NO with NH on NH AlBEA,(
(aas
aFateptm(s((
cbi59mtt(vbAns9
dsamic
catalysts in the SCR of NO process depends on their acidity.
2 3 4
IE1)-FeHAlBEA, (IE2)-FeHAlBEA.
(Imp)-Fe4.0HAlBEA) results in a slight increase of the catalyticctivity (above 96% of NO conversion with the selectivity to N2bout 90% at 573 K). This effect could be explained by the sametate of iron present in (Imp)-Fe1.0HAlBEA and (Imp)-Fe4.0HAlBEA.
It seems that high conversion of NO measured over both cat-lysts is related to the presence of isolated pseudo-tetrahedrale(III) (evidenced by DR UV–vis) [84–86]. Clearly, the catalyticctivity of NOx reduction slightly increased with increasing Fe con-ent and strongly depends on the reaction temperature. Iwasakit al. [87] have studied catalytic performance of the Fe/ZSM-5 sam-les prepared by conventional impregnation. They have suggestedhat the iron-containing ZSM-5 catalysts obtained by impregnation
ethod did not exhibit any significant activity in the DeNOx process∼40% NO conversion at about 573 K). It should be stressed that ouramples, prepared by impregnation method, show high activities∼100% NO conversion with selectivity to N2 about 90% at 573 K)Fig. 15).
Fig. 16 shows the results of the activity tests in the DeNOx pro-ess for the catalysts prepared by ion exchange method. It shoulde noted that the NH4AlBEA support exhibits some catalytic activ-
ty in the studied process. In this case, the reaction starts at about53 K and the NO conversion gradually increases to a level of0% at 753 K (Fig. 16). Introduction of iron using ion exchangeethod strongly activates NH4AlBEA zeolites. The catalytic activi-
ies of both samples are very similar, however, it should be notedhat (IE2)-FeHAlBEA is more active in the low-temperature regionT < 523 K), while the (IE1)-FeHAlBEA shows higher activity at ele-ated temperatures (T > 623 K). The NO conversion measured foroth samples increased in the range of 370–523 K reaching 97%.t higher temperatures the side process of ammonia oxidation sig-ificantly decreased the effectiveness of the DeNOx process. Theelectivity to nitrogen, measured for this series of catalysts, is above0% at broad temperature range (450–700 K).
Therefore, these materials seem to be a very interesting candi-ate for the low-temperature DeNOx catalysts. The (IE)-FeHAlBEAamples prepared from NH4AlBEA are very active catalysts, whichre more effective than several zeolite catalysts prepared by IE
ethod, reported earlier [86–88]. Therefore, not only CVD but alsoon exchange method leads to obtaining the well defined catalysts,ontaining Fe3+ ions in pseudo-tetrahedral coordination. It suggests
y 235 (2014) 210–225 223
that isolated pseudo-tetrahedral Fe(III) plays a major role in theDeNOx process, as reported earlier [89].
The results obtained for all series of the catalysts allow compar-ing their activity in the DeNOx and N2O decomposition processes.The catalytic activities of all Fe-containing zeolite catalysts werehigh, however, it should be noted that the catalysts obtained by ionexchange method were the most active in the low-temperaturerange (T < 553 K), while the samples prepared by postsynthesis orconventional wet impregnation way, showed higher activity atelevated temperatures (T > 623 K) (Figs. 14–16). As evidenced byMössbauer and DR UV–vis spectroscopies the Fe-containing zeolitecatalysts, obtained by postsynthesis and conventional wet impreg-nation, contain pseudo-tetrahedral Fe(III). Thus, it seems that thepresence of isolated pseudo-tetrahedral Fe(III) in both kinds ofthe catalysts is responsible for similarity in their high catalyticactivity in the temperature range of 623–723 K. In contrast to thematerials prepared by impregnation and postsynthesis methods,Fe-containing zeolites obtained by ion exchange method effectivelyoperate in the low-temperature range (T < 623 K).
Additionally, the selectivity towards nitrogen, measured for thecatalysts obtained by the ion exchange method, is higher than thatobserved for the samples modified by the impregnation method. Itshould be noted that the DR UV–vis measurements have shown thepresence of pseudo-tetrahedral Fe(III) and small amount of extra-framework octahedral Fe(III) in the samples prepared by the (IE)method. Therefore, it could be concluded that various methodsused for the iron introduction resulted in obtaining of the catalystswith different properties.
It is well known that acidic centres play an important role inthe SCR of NO process and they are responsible for chemisorp-tion and activation of ammonia molecules [84]. Therefore, apartfrom different forms of iron species also acidity strongly influencesthe catalytic performance of the studied samples. The differ-ences in acidity of the catalysts are related to the presence ofAl and Fe atoms in the zeolite structure, which can act simulta-neously as Brønsted (bridging OH groups in Al(III)–O(H)–Si or
Fe(III)–O(H)–Si ) and Lewis (unsaturated Al and Fe frameworkatoms) acidic centres and influence catalytic properties of the (PS)-FexSiBEA, (Imp)-FexHAlBEA and (IE)-FeHAlBEA. The active centresfor (Imp)-FexHAlBEA and (IE)-FeHAlBEA are probably related tobridged Al(III)–O(H)–Si groups with a very strong acidic charac-ter, as evidenced by FTIR of adsorbed CO. They strongly influencesof the catalytic activity of (Imp)-Fe4.0HAlBEA and (IE2)-FeHAlBEAsamples. It should be noted that the similar acidic sites concen-tration for (IE1)-FeHAlBEA (2359.9 �mol g−1) and (IE2)-FeHAlBEA(2386.8 �mol g−1) catalysts results in their close catalytic activityin SCR of NO with NH3.
The samples obtained by impregnation method are character-ized by relatively lower values of total acidity (1790.2 �mol g−1 for(Imp)-Fe1.0HAlBEA) and (1905.1 �mol g−1 for (Imp)-Fe4.0HAlBEA)and their catalytic activity is a little lower than for samples preparedby ion exchange method. The difference can be related to concen-tration and environment of active sites in (Imp)-FexHAlBEA. For(PS)-FexSiBEA, NO conversion may be attributed to the presence offramework pseudo-tetrahedral sites such as Fe(III)–O(H)–Si . Asit was reported [90], these centres are only slightly less acidic thanthe corresponding Al(III)–O(H)–Si analogue. Therefore, it couldbe suggested that the higher strength and concentration of acidiccentres ( Al(III)–O(H)–Si ) in (IE)-FeHAlBEA and (Imp)-FexHAlBEAcomparing to (PS)-FexSiBEA catalysts are responsible for the higheractivity in the SCR-NO with ammonia. It is in line with the reportof Schwidder et al. [91] who have suggested that activity of the
Thus, the catalytic activity of obtained Fe-containing zeolites inthe SCR of NO process seems to be related to the presence of isolatedpseudo-tetrahedral iron species. Moreover, the higher strength

224 P. Boron et al. / Catalysis Toda
400 500 600 700 800
0
20
40
60
80
100C
onve
rsio
n /S
elec
tivi
ty (
%)
Temperature (K)
NH3 conversion
selctivity to N2
selctivity to NO selctivity to N
2O
(PS)-Fe4.0
SiBEA
F
aFCaXcrisrf
Ndetwgmaiato
F
ig. 17. NH3 oxidation and N2, NO2 and NO selectivities over (PS)-Fe4.0SiBEA.
nd concentration of acidic centres in (IE)-FexHAlBEA and (Imp)-exHAlBEA than in (PS)-FexSiBEA (evidenced by FTIR of adsorbedO and TPD of NH3) seem to be responsible for their higher cat-lytic activity. The physicochemical characterization (DR UV–vis,PS, FTIR-CO and FTIR-Py) and the catalytic tests clearly show thatatalysts acidity has influenced catalytic activity of studied mate-ials. Another important issue, that have to be taken into account,s redox properties of iron, which can play not only a role of acidicites for ammonia adsorption but also can be active in catalyticedox cycles. It seems that both these properties are responsibleor high catalytic activity of iron species in the studied reactions.
The results of the DeNOx process show that an efficiency ofO reduction, especially in the high temperature range, can beecreased by the side process of ammonia oxidation. In order tovaluate the activity of the studied catalysts in this process, addi-ional catalytic test in the reaction of ammonia oxidation by oxygen,as performed for two selected catalysts. Results of these investi-
ations are presented in Figs. 17 and 18. As can be seen zeolitesodified with iron are active in the process of ammonia oxidation
t temperatures above 550 K, so at temperature much higher thann the DeNOx process. Moreover, analysis of the results of the DeNOx
nd ammonia oxidation processes shows that at higher tempera-ures ammonia preferentially participate in NO reduction than isxidised by oxygen.
400 500 600 700 800
0
20
40
60
80
100
Con
vers
ion
/Sel
ecti
vity
(%
)
Temperature (K)
NH3 conversion
selctivity to N2
selctivity to NO selctivity to N
2O
(Imp)-Fe4.0
HAlBEA
ig. 18. NH3 oxidation and N2, NO2 and NO selectivities over (Imp)-Fe4.0HAlBEA.
[[[
[[
[[[
[[
y 235 (2014) 210–225
4. Conclusions
Three series of Fe-containing BEA zeolites prepared by two-steppostsynthesis, ion exchange and conventional wet impregnationmethods were prepared. Iron introduced to the zeolite samples invarious Fe amounts (1.0–4.0 Fe wt.%) was present mainly in theform of pseudo-tetrahedral Fe(III) as evidenced by combined usedof DR UV–vis, 57Fe Mössbauer and XPS studies.
Two kinds of pseudo-tetrahedal Fe(III) have been distinguishedby 57Fe Mössbauer spectroscopy in all Fe-containing BEA zeolites.
(Imp)-FexHAlBEA and (IE)-FeHAlBEA have a significantly higheracidity than (PS)-FexSiBEA as evidenced by FTIR of adsorbedpyridine and TPD of ammonia. This is related to the pres-ence in the former samples of framework pseudo-tetrahedral
Al(III)–O(H)–Si and Fe(III)–O(H)–Si sites and in the latter cat-alysts only Fe(III)–O(H)–Si one.
(PS)-FexSiBEA, (Imp)-FexHAlBEA and (IE)-FeHAlBEA are found tobe active and selective catalysts of N2O decomposition, with 100%conversion at temperature range between 750 and 800 K, and of theDeNOx process, with selectivity toward N2 exceeding 90% for NOconversion from 80 to 93% in the temperature range of 550–800 K.
It seems that isolated pseudo-tetrahedral Fe(III), present inthree series of Fe-containing BEA zeolites, are catalytically active inboth N2O decomposition and DeNOx processes. The higher activ-ity of (Imp)-FexHAlBEA and (IE)-FeHAlBEA than (PS)-FexSiBEA inthe DeNOx process suggests that the acidic Al(III)–O(H)–Si sitespresent in the former catalysts play an important role in this pro-cess.
Further studies are underway on (PS)-FexSiBEA (Imp)-FexHAlBEA and (IE)-FeHAlBEA to understand the role of Brønstedand Lewis acidic sites in the DeNOx process.
Acknowledgements
This research has received funding from the Marian Smolu-chowski Kraków Research Consortium – a Leading NationalResearch Centre KNOW supported by the Ministry of Science andHigher Education. Part of the research was done with equipmentpurchased in the frame of European Regional Development Fund(Polish Innovation Economy Operational Program – contract no.POIG.02.01.00-12-023/08).
References
[1] J. Perez-Ramirez, F. Kapteijn, K. Schoffel, J.A. Moulijn, Appl. Catal. B 44 (2003)117.
[2] M.S. Kumar, M. Schwidder, M. Grünert, A. Brückner, J. Catal. 227 (2004) 384.[3] M. Schwidder, M.S. Kumar, K. Klementiev, M.M. Pohl, A. Brückner, W. Grünert,
J. Catal. 231 (2005) 314.[4] F. Heinrich, C. Schmidt, E. Löffler, M. Menzel, W. Grünert, J. Catal. 212 (2002)
157.[5] K. Krishna, G.B.F. Seijer, C.M. van den Bleek, M. Makkee, G. Mul, H.P.A. Calis,
Catal. Lett. 86 (2003) 121.[6] E.J.M. Hensen, Q. Zhu, M.M.R.M. Hendrix, A.R. Overweg, P.J. Kooyman, M.V.
Sychev, R.A. van Santen, J. Catal. 221 (2004) 560.[7] A. Guzmán-Vargas, G. Delahay, B. Coq, Appl. Catal. B 42 (2003) 369.[8] M. Mauvezin, G. Delahay, F. Kisslich, B. Coq, S. Kieger, Catal. Lett. 62 (1999) 41.[9] S. Kameoka, T. Suzuki, K. Yuzaki, T. Takeda, S. Tanaka, S. Ito, T. Miyadera, K.
Kunimori, Chem. Commun. (2000) 745.10] J.B. Peri, J. Phys. Chem. 69 (1965) 211.11] J.A.Z. Pieterse, K. Seshan, J.A. Lercher, Stud. Surf. Sci. Catal. 130 (2000) 2567.12] A.E.W. Beers, J.A. van Bokhoven, K.M. De Lathouder, F. Kapteijn, J.A. Moulijn, J.
Catal. 218 (2003) 239.13] M. Muller, G. Harvey, R. Prins, Micropor. Mesopor. Mater. 34 (2000) 135.14] I. Hnat, I. Kocemba, J. Rynkowski, T. Onfroy, S. Dzwigaj, Catal. Today 176 (2011)
29.15] G.J. Long, T.E. Cranshaw, G. Longworth, Mössbauer Eff. Ref. Data J. 6 (1983) 42.
16] D.G. Rancourt, J.Y. Ping, Nucl. Instrum. Methods Phys. Res., Sect. B 58 (1991) 85.17] S. Dzwigaj, M.J. Peltre, P. Massiani, A. Davidson, M. Che, T. Sen, S. Sivasanker,Chem. Commun. (1998) 87.18] S. Dzwigaj, P. Massiani, A. Davidson, M. Che, J. Mol. Catal. 155 (2000) 169.19] M.A. Camblor, A. Corma, J. Pérez-Pariente, Zeolites 13 (1993) 82.

s Toda
[
[
[
[
[[[
[[[
[
[[
[
[
[[
[[
[
[
[[
[
[
[
[
[[
[
[[[[
[
[[[
[
[
[
[[[[[[
[[[[[[
[
[
[
[
[
[[
[[
[[
[[[[[
P. Boron et al. / Catalysi
20] E. Bourgeat-Lami, F. Fajula, D. Anglerot, T. Des Courieres, Micropor. Mater. 1(1993) 237.
21] S. Dzwigaj, J. Janas, J. Gurgul, R.P. Socha, T. Shishido, M. Che, Appl. Catal. B 85(2009) 131.
22] J. Janas, J. Gurgul, R.P. Socha, J. Kowalska, K. Nowinska, T. Shishido, M. Che, S.Dzwigaj, J. Phys. Chem. C 113 (2009) 13273.
23] M. Camblor, A. Corma, J. Perez-Pariente, J. Chem. Soc., Chem. Commun. (1993)557.
24] M. Decottignies, J. Phalippou, J. Zarzycki, J. Mater. Sci. 13 (1978) 2605.25] R. Soda, Bull. Chem. Soc. Jpn. 34 (1961) 1491.26] A. Duran, C. Serna, V. Fornes, J.M. Fernandez-Navarro, J. Non-Cryst. Solids 82
(1986) 69.27] M. Hino, T. Sato, Bull. Chem. Soc. Jpn. 44 (1971) 33.28] M. Ocana, V. Fornes, C.J. Serna, J. Non-Cryst. Solids 107 (1989) 187.29] S. Dzwigaj, M. Matsuoka, R. Franck, M. Anpo, M. Che, J. Phys. Chem. B 102 (1998)
6309.30] A. Davydov, Molecular Spectroscopy of Oxide Catalyst Surfaces, Wiley, Chich-
ester, 2003.31] K. Hadjiivanov, G. Vayssilov, Adv. Catal. 47 (2000) 307.32] G. Berlier, G. Spoto, S. Bordiga, G. Ricchiardi, P. Fisicaro, A. Zecchina, I. Rossetti,
E. Selli, L. Forni, E. Giamello, C. Lamberti, J. Catal. 208 (2002) 64.33] A. Zecchina, F. Geobaldo, C. Lamberti, S. Bordiga, G. Turnes Palomino, C. Otero
Arean, Catal. Lett. 42 (1996) 25.34] X. Wang, J. Long, G. Yan, G. Zhang, X. Fu, J.-M. Basset, F. Lefebvre, Micropor.
Mesopor. Mater. 108 (2008) 258.35] H. Tippins, Phys. Rev. B 72 (1970) 279.36] S. Bordiga, R. Buzzoni, F. Geobaldo, C. Lamberti, E. Giamello, A. Zecchina, G.
Leofanti, G. Petrini, G. Tozzola, G. Vlaic, J. Catal. 158 (1996) 486.37] P. Wu, T. Komatsu, T. Yashima, Micropor. Mesopor. Mater. 20 (1998) 139.38] L. Capek, V. Kreibich, J. Dedecek, T. Grygar, B. Wichterlova, Z. Sobalik, J.A.
Martens, R. Brosius, V. Tokarova, Micropor. Mesopor. Mater. 80 (2005) 279.39] J. Perez-Ramirez, J.C. Groen, A. Bruckner, M.S. Kumar, U. Bentrup, M.N. Debbagh,
L.A. Villaescusa, J. Catal. 232 (2005) 318.40] M. Schwidder, S. Heikens, A. De Toni, S. Geisler, M. Berndt, A. Bruckner, W.
Grunert, J. Catal. 259 (2008) 96.41] P. Balle, B. Geiger, S. Kureti, Appl. Catal. B 85 (2009) 109.42] M.S. Kumar, M. Schwidder, W. Grunert, U. Bentrup, A. Bruckner, J. Catal. 239
(2006) 173.43] G. Delahay, M. Mauvezin, A. Guzman-Vargas, B. Coq, Catal. Commun. 3 (2002)
385.44] E.J.M. Hensen, Q. Zhu, R.A.J. Janssen, P.C.M.M. Magusin, P.J. Kooyman, R.A. van
Santen, J. Catal. 233 (2005) 123.45] G. Berlier, M. Pourny, S. Bordiga, G. Spoto, A. Zecchina, C. Lamberti, J. Catal. 229
(2005) 45.46] M. Santhosh Kumar, M. Schwidder, W. Grünert, U. Bentrup, A. Brückner, J. Catal.
239 (2006) 173.47] A. Raj, S. Sivasanker, K. Lázár, J. Catal. 147 (1994) 207.48] N.S. Ovanesyan, K.A. Dubkov, A.A. Pyalling, A.A. Shteinman, J. Radioanal. Nucl.
Chem. 246 (2000) 149.49] A.R. Overweg, M.W.J. Crajé, A.M. van der Kraan, I.W.C.E. Arends, A. Ribera, R.A.
Sheldon, J. Catal. 223 (2004) 262.
50] R.L. Garten, W.N. Delgass, M. Boudart, J. Catal. 18 (1970) 90.51] K. Lázár, G. Borbély, H. Beyer, Zeolites 11 (1991) 214.52] R. Kumar, S.K. Date, E. Bill, A. Trautwein, Zeolites 11 (1991) 211.53] J. Gurgul, K. Łatka, I. Hnat, J. Rynkowski, S. Dzwigaj, Micropor. Mesopor. Mater.168 (2013) 1.
[[
[
y 235 (2014) 210–225 225
54] P. Boron, L. Chmielarz, J. Gurgul, K. Łatka, T. Shishido, J.-M. Krafft, S. Dzwigaj,Appl. Catal. B 138–139 (2013) 434.
55] A. Meagher, V. Nair, R. Szostak, Zeolites 8 (1988) 3.56] L. Guczi, K. Lázár, React. Kinet. Catal. Lett. 96 (2009) 335.57] M. Mauvezin, G. Delahay, B. Coq, S. Kieger, J.C. Jumas, J. Olivier-Fourcade, J. Phys.
Chem. B 105 (2001) 928.58] R. Hajjar, Y. Millot, P.P. Man, M. Che, S. Dzwigaj, J. Phys. Chem. C 112 (2008)
20167.59] K.A. Dubkov, N.S. Ovanesyan, A.A. Shteinman, E.V. Starokon, G.I. Panov, J. Catal.
207 (2002) 341.60] E. Tabor, K. Zaveta, N.K. Sathu, A. Vondrova, P. Sazama, Z. Sobalik, Catal. Today
175 (2011) 238.61] J. Janas, J. Gurgul, R.P. Socha, S. Dzwigaj, Appl. Catal. B 91 (2009) 217.62] W. Grünert, R. Schlögl, Mol. Sieves 4 (2004) 467.63] L.P. Oleksenko, Theor. Exp. Chem. 40 (2004) 331.64] M. Stöcker, Microporous Mater. 6 (1996) 235.65] K. Nomura, Y. Ujihira, A. Vértes, J. Radioanal. Nucl. Chem. 202 (1996) 103.66] M. Descostes, F. Mercier, N. Thromat, C. Beaucaire, M. Gautier-Soyer, Appl. Surf.
Sci. 165 (2000) 288.67] T.-C. Lin, G. Seshadri, J.A. Kelber, Appl. Surf. Sci. 119 (1997) 83.68] T. Yamashita, P. Hayes, Appl. Surf. Sci. 254 (2008) 2441.69] T. Schedel-Niedrig, W. Weiss, R. Schlögl, Phys. Rev. B 52 (1995) 17449.70] B.L. Maschhoff, N.R. Armstrong, Langmuir 7 (1991) 693.71] M. Muhler, R. Schlögl, G. Ertl, J. Catal. 138 (1992) 413.72] A.P. Grosvenor, B.A. Kobe, M.C. Biesinger, N.S. McIntyre, Surf. Inter. Anal. 36
(2004) 1564.73] S. Dzwigaj, J. Janas, J. Mizera, J. Gurgul, R.P. Socha, M. Che, Catal. Lett. 126 (2008)
36.74] J. Janas, J. Gurgul, R.P. Socha, T. Shishido, M. Che, S. Dzwigaj, Appl. Catal. B 91
(2009) 113.75] Y. Okamoto, M. Fujii, T. Imanaka, S. Teranishi, Bull. Chem. Soc. J. 48 (1975)
1163.76] J. Jansen, E. Creyghton, S. Njo, H. van Koningsveld, H. van Bekkum, Catal. Today
38 (1997) 205.77] A. Camiloti, S. Jahn, N. Velasco, L. Moura, D. Cardoso, Appl. Catal. A 182 (1999)
107.78] S.G. Hegde, R. Kumar, R.N. Bhat, P. Ratnasamy, Zeolites 9 (1989) 231.79] J.M. Newsam, M.M.J. Treacy, W.T. Koetsier, C.B. Gruyter, Proc. R. Soc. Lond. A
420 (1988) 375.80] R. Beaumont, D. Barthomeuf, J. Catal. 26 (1972) 218.81] G. Pirngruber, M. Luechinger, P. Roy, A. Cecchetto, P. Smirniotis, J. Catal. 224
(2004) 429.82] J. Pérez-Ramirez, J. Catal. 227 (2004) 512.83] J. Janas, T. Machej, J. Gurgul, R.P. Socha, M. Che, S. Dzwigaj, Appl. Catal. B 75
(2007) 239.84] G. Busca, L. Lietti, G. Ramis, F. Berti, Appl. Catal. B 18 (1998) 1.85] R. Long, R. Yang, Catal. Lett. 74 (2001) 201.86] H. Bosch, F. Janssen, Catal. Today 2 (1988) 369.87] M. Iwasaki, K. Yamazaki, K. Banno, H. Shinjoh, J. Catal. 260 (2008) 205.88] G. Delahay, D. Valade, A. Guzman-Vargas, B. Coq, Appl. Catal. B 55 (2005)
149.
89] R. Long, R. Yang, J. Am. Chem. Soc. 121 (1999) 5595.90] K. Hadjiivanov, E. Ivanova, R. Kefirov, J. Janas, A. Plesniar, S. Dzwigaj, M. Che,Micropor. Mesopor. Mater. 131 (2010) 1.91] M. Schwidder, M. Kumar, U. Bentrup, J. Perez-Ramirez, A. Bruckner, W. Grunert,
Micropor. Mesopor. Mater. 111 (2008) 124.


![[2013] 11 SCR 1 - Supreme Court of India](https://static.fdokumen.com/doc/165x107/632826dc051fac18490e98a9/2013-11-scr-1-supreme-court-of-india.jpg)

![supreme court reports [2011] 6 scr](https://static.fdokumen.com/doc/165x107/63226297aa6c954bc707acc5/supreme-court-reports-2011-6-scr.jpg)