
Sedimentation equilibrium and the generalized Archimedes' principle

The interplay of sedimentation and crystallization in hard-sphere suspensions
John Russo,1, ∗ Anthony C. Maggs,2, † Daniel Bonn,3, ‡ and Hajime Tanaka1, §
1 Institute of Industrial Science, University of Tokyo,4-6-1 Komaba, Meguro-ku, Tokyo 153-8505, Japan
2 PCT, ESPCI, 10 Rue Vauquelin, 75005 Paris, France3 van der Waals-Zeeman Institute, University of Amsterdam,Valckenierstraat 65, 1018 XE Amsterdam, The Netherlands
We study crystal nucleation under the influence of sedimentation in a model of colloidal hardspheres via Brownian Dynamics simulations. We introduce two external fields acting on the colloidalfluid: a uniform gravitational field (body force), and a surface field imposed by pinning a layer ofequilibrium particles (rough wall). We show that crystal nucleation is suppressed in proximity of thewall due to the slowing down of the dynamics, and that the spatial range of this effect is governedby the static length scale of bond orientational order. For distances from the wall larger than thislength scale, the nucleation rate is greatly enhanced by the process of sedimentation, since it leads toa higher volume fraction, or a higher degree of supercooling, near the bottom. The nucleation stageis similar to the homogeneous case, with nuclei being on average spherical and having crystallineplanes randomly oriented in space. The growth stage is instead greatly affected by the symmetrybreaking introduced by the gravitation field, with a slowing down of the attachment rate due todensity gradients, which in turn cause nuclei to grow faster laterally. Our findings suggest that theincrease of crystal nucleation in higher density regions might be the cause of the large discrepancyin the crystal nucleation rate of hard spheres between experiments and simulations, on noting thatthe gravitational effects in previous experiments are not negligible.
PACS numbers:
INTRODUCTION
Crystal nucleation is a fundamental physical processwhose understanding has far-reaching consequences inmany technological and industrial products, like pharma-ceuticals, enzymes and foods [1–7]. The simplest crystal-lization process is the homogeneous nucleation case, inwhich solid clusters spontaneously form from the meltthroughout the system. The opposite case is insteadthe heterogeneous nucleation process, where nuclei ofthe solid phase form preferentially around external sur-faces, like containers walls or impurities present in themelt [8, 9]. But the crystallization processes in practicalsystems are often very far from these idealized cases, forexample when multiple fields concurrently affect the crys-tallization behaviour, making it difficult to match theo-retical expectations with experimental outcomes. Quot-ing the famous words of Oxtoby [10], “nucleation theoryis one of the few areas of science in which agreement ofpredicted and measured rates to within several orders ofmagnitude is considered a major success”. The most id-iomatic example comes from the simplest crystallizationprocess, the homogeneous crystallization of hard spheres,where the discrepancy between predicted nucleation ratesand experimental measurements stretches as far as 10 or-ders of magnitude. In particular, numerical simulationsusing a variety of techniques (Brownian dynamics, bi-ased Monte Carlo, and rare-events methods) found thatthe nucleation rate increases dramatically with the col-loid volume fraction φ, growing by more than 15 ordersof magnitude from φ = 0.52 to φ = 0.56, where it has a
maximum [11–18]. On the other side, experiments foundthe nucleation rate to be much less sensitive on the vol-ume fraction [19–23]. This is probably the second worstprediction in physics, the first being the 100 orders ofmagnitude difference between the cosmological constantpredicted from the energy of the vacuum and that mea-sured from astronomical data [24].
In the present work we address a very important factoraffecting the crystallization process, which often occursin real experiments of colloidal suspensions but has beenignored in most simulations: how the crystallization pro-cess is affected by the sedimentation of particles. Weperform Brownian Dynamics simulations of a model ofcolloidal hard spheres, and induce sedimentation by in-troducing both a gravitational force G and rough wallswhich confine the system along the direction of gravity.The effects of rough walls on both the static and dynamicproperties of the colloidal fluid are analyzed in detail.In particular we will show that there is strong slowingdown of the dynamics close to the walls, and that thiseffect has a static origin. Correspondingly, the crystal-lization process is strongly suppressed in proximity ofthe walls, which allow us to study the nucleation processunder gravity without interference from the walls. Wewill show in fact that both the nucleation rates, crystalshape and the orientation of crystalline planes are similarto what observed at bulk conditions. On the other hand,the gravitation field strongly affects the growth stage,and we will show that nuclei grow more slowly across adensity gradient, and thus prefer to grow laterally. Thisindicates that not only local density but also its gradient
arX
iv:1
307.
0658
v1 [
cond
-mat
.sof
t] 2
Jul
201
3

2
affect the crystallization behavior.We also provide new insights on the debated origin
of the discrepancy between theoretical predictions andexperimental measurements of nucleation rates in hardspheres. We first note that the experiments measur-ing the nucleation rates in hard spheres are usuallycharacterized by rather short gravitational lengths (andquite marked sedimentation effects have indeed been re-ported [19, 25]). We will then present some arguments toshow that sedimentation should have a rather big effect inthese experiments, especially at lower volume fractions,where the discrepancy is much more significant.
The paper is organized as follows. In Section we de-scribe the methods employed in our study and the choiceof the state points considered. Section presents the re-sults of the study, logically divided in five parts. Sec-tion examines the effects of gravity on the nucleationrates measured by simulation. Section deals with theeffects of gravity on the static properties of the suspen-sion. Section investigates the effects of the walls, both onthe dynamics and the statics. Section considers insteadthe growth of the nuclei as affected by gravity. Sectioncompares our results with previous experimental investi-gation of the crystallization in hard-sphere colloidal sys-tems. We conclude in Section .
METHODS
We perform Brownian Dynamics (BD) simulationsof spherical particles interacting through the Weeks-Andersen-Chandler (WCA) potential [26]
βU(r) =
{4βε
((σr
)12 −(σr
)6+ 1
4
)for r
σ ≤ 21/6
0 for rσ > 21/6
where σ is the length scale, ε is the energy scale andβ = 1/kBT (kBT : the thermal energy). In the followingwe set the energy scale to ε = 1. The WCA potential isa purely repulsive short-range potential. The value of βfixes the hardness of the interaction, and we choose β =40 for which a mapping to the hard-sphere phase diagramis known. In particular in Ref. [16] the freezing densitywas located at ρF = 0.712, which can be compared to thevolume fraction of hard spheres at the freezing transition(φF = 0.492) to define an effective hard-sphere volume(veff) for WCA particles, ρF veff = φF . The mappingof the WCA system onto the HS phase diagram is thensimply given by the relation
ρWCA veff = φHS. (1)
The effective hard-sphere diameter d of our particles isthen given by d = 3
√6φHS/πρWCA ∼ 1.097σ.
In BD the equation of motion of particle i is
dridt
=D
kBTfi + ηi(t),
where t is the time, ri is the position of particle i, D isthe bare diffusion coefficient, fi is the systematic forceacting on particle i and ηi is the noise term describingthe effective stochastic force exerted by the solvent onparticle i and obeying the fluctuation-dissipation relation〈ηi(t)ηj(t′)〉 = 6Dδijδ(t − t′). In the following we setD/kBT = 1 and integrate the equations of motion bythe standard Ermak integrator [27] with a time step of∆t = 10−5σ2/D. The Brownian time τB = d2/D is thetime it takes for a colloid to diffuse a distance equal toits diameter in a dilute suspension.
The systematic force acting on particle i has two terms
fi = −∇iU + fB
where the first term accounts for the conservative forcesbetween the particles, and the second term is the bodyforce, given by the difference between the gravitationalforce and the buoyancy force
fB = veff (ρf − ρP ) z ≡ −G z,
where ρf is the density of the implicit solvent into whichthe particles are suspended, ρP is the density of the col-loidal particles, G is the modulus of the total body force,and z is the unit vector opposite to the direction of grav-ity.
The gravitational force, breaking the translationalsymmetry in the z direction, produces a z-dependentdensity profile, also called barometric law ρ(z) [28]. Thisdensity profile can be calculated from the pressure differ-ence between two altitudes zi and zj as
p(zi)− p(zj) = −G∫ zi
zj
ρ(z) dz, (2)
by inserting the appropriate equation of state, p(ρ), onthe left hand side. We use the Carnahan-Starling equa-tion of state
β p =ρ(1 + φ+ φ2 − φ3
)(1− φ)3
,
where φ = ρ veff is the volume fraction. Equation (2) canthen be rewritten as an integral equation whose solutionis given in an implicit form by the roots of the followingequation
log φ+1
(φ− 1)2− 2
(φ− 1)3= −βGz +K, (3)
where K is a constant fixed by the following normaliza-tion condition ∫ h
0
φ(z;K) dz = hφavg, (4)
where h is the height of the simulation box (in the di-rection of the gravitational field) and φavg is the volume

3
FIG. 1: Simulation box configuration. The fluid is confinedbetween z = 0 and z = h by two rough walls of height hW
each. The external force (with body acceleration of G) actsin the negative z direction. Wall particles are depicted bydark (gray) spheres, while fluid particles are depicted by light(blue) spheres. We choose hW = 3σ and the box length alongx (and y) equal to h.
fraction averaged over the total volume occupied by theparticles in the simulation box. The theoretical deter-mination of the density profile inside the simulation boxthus requires fixing the field G, the height h, the averagevolume fraction φavg occupied by the particles in the sim-ulation box, and solving numerically Eq. (3) and Eq. (4).
Before applying the external force we need to boundthe system with walls in the direction perpendicular tothe external field. Choosing flat walls would induce het-erogeneous nucleation, whereas we want to study the ho-mogeneous process which happens in the bulk in the pres-ence of the external field. We then choose to confine oursystems with rough walls, obtained by freezing the posi-tions of particles in equilibrated fluid configurations. Wewill show in Section , that rough walls indeed disfavournucleation in their proximity and are thus the appropri-ate choice for our investigation. It is also well known thatrough walls do not induce layering effects, as the fluid’sdensity remains unperturbed in their proximity [29, 30].Ideally we wish thus to prepare the walls at the samestate point of the layer of fluid in contact with the wall.Since the external field will induce a density gradient inthe system we thus need to predict the density of thefluid at z = 0 and z = h (h being the height of the box,see Fig. 1).
A representation of the simulation box is depicted inFig. 1. The protocol for the simulations is as follows.
profile prediction - given G, h and φavg we solveEqs. (3) and (4) to obtain the density profile ρ(z).
wall preparation - two independent BD simulationsare run respectively at ρ(0) and ρ(h) in the absenceof the external field. Since the predicted ρ(0) is of-ten very high, nucleation could occur at this stage,
so we add a biasing potential Ubias which preventsthe systems from nucleating. The biasing potentialhas the form of Ubias = kn2, where k is an harmonicconstant and n is the size of the largest crystal inthe box at each time step.
box setup - a slab of height hW is cut from each of thetwo previous configurations. The slab at densityρ(0) is placed at −hW < z < 0 of the new simula-tion box, whereas the slab at density ρ(h) is placedbetween h < z < h + hW . N fluid particles areplaced randomly between 0 < z < h at the volumefraction φavg, and then equilibrated with the exter-nal field switched off. A typical simulation box isdepicted in Fig. 1.
simulation run - at t = 0 the field G is switched onand simulations are run until the size of the largestnucleus reaches nmax = 500. The position of wallparticles is kept fixed.
We set N = 20, 000 fluid particles (not including wallparticles), with the height h equal to the box dimensionsin both the x and y directions, for which periodic bound-ary conditions are imposed.
Identification of crystal particles
To identify crystal particles we use the local bond-order analysis introduced by Steinhardt et al. [31], firstapplied to study crystal nucleation by Frenkel and co-workers [32]. A (2l + 1) dimensional complex vec-tor (ql) is defined for each particle i as qlm(i) =
1Nb(i)
∑Nb(i)j=1 Ylm(rij), where l is a free integer parameter,
and m is an integer that runs from m = −l to m = l. Thefunctions Ylm are the spherical harmonics and rij is thevector from particle i to particle j. The sum goes over allneighbouring particles Nb(i) of particle i. Usually Nb(i)is defined by all particles within a cutoff distance, butin an inhomogeneous system the cutoff distance wouldhave to change according to the local density. Insteadwe fix Nb(i) = 12 which is the number of nearest neigh-bours in close packed crystals (like hcp and fcc) which areknown to be the only relevant structures for hard spheres.If the scalar product (q6(i)/|q6(i)|) · (q6(j)/|q6(j)|) be-tween two neighbours exceeds 0.7 then the two particlesare deemed connected. We then identify particle i ascrystalline if it is connected with at least 7 neighbours.A useful order parameter which is built from the previousbond-order analysis is
Si =
Nb(i)∑j=0
q6(i) · q6(j)
|q6(i)| |q6(j)|. (5)
It measures the coarse-grained bond orientational orderof particle i, which is a very effective order parameter to

4
measure the coherence of crystal-like bond orientationalorder. Hereafter we call this “crystallinity” [33]. How-ever, we note that it is not a direct indicator for thepresence of crystals, but rather a measure for a tendencyto promote crystallization.
Gravitational length and time scales
The gravitational field breaks the translational symme-try of the system and introduces a characteristic lengthscale called the gravitational length, lG. The gravita-tional length describes the typical length scale over whichthe density profile decreases in the z direction. For a di-lute gas the density profile is given by the barometric lawφ(z) ∼ e−Gz/kBT , and thus
lG =kBT
G(6)
where G is the effective gravitational force. To compareto the experiments, we report the adimensional lengthlG/d (see also below), where d is the hard-sphere diame-ter of the particles.
In addition to the length scale, the gravitational fielddefines also a time scale, the sedimentation time τS ,which is the time it takes for a particle to move overthe distance d due to the gravitational pull. The veloc-ity attained by a sphere pulled by the gravity inside afluid is simply given by vdrag = G/ζ, where ζ is the dragcoefficient (which can be computed from the viscosityof the solvent by using the Stokes law). The sedimen-tation time is then given by τS = dζ/G. The Pecletnumber, Pe, is given by the ratio of the diffusion timeto the sedimentation time. The Brownian time is simplyτB = d2/D = d2ζ/kBT , and so
Pe =τBτS
=dG
kBT=
d
lG. (7)
In our simulations lG > d and so we are working in theregime of small Peclet numbers, which is the relevantregime for colloidal dispersions used in estimating thenucleation rate (see Table II). All results reported in thefollowing sections are taken after waiting for at least 3τSbefore acquiring data.
Choice of state points
The state points simulated in the present work are re-ported in Table I (the volume comprised by the wallsalong z and the periodic boundaries along x and y direc-tions is cubic, and the height h can be readily obtainedfrom φavg). The points are divided into the following fourgroups.
I : once the profile is settled, these simulations have thesame average density at z = 0 but differ for theirgravitational lengths lG. With these simulations weinvestigate the effect of the strength of the densitygradient produced by the gravitational field on thecrystallization process.
II : these simulations all have the same gravitationallength lG but differ for their average densities.With these simulations we can investigate the ef-fect of the walls on the nucleation process.
III : all simulations have a density low enough to avoidthe crystallization of the system, and are thussuited to study the effect of the gravitational fieldand of the walls on the dynamics of the melt (or,supercooled liquid) prior to crystallization. Withthese simulations we can investigate the effect ofthe walls on the nucleation process.
IV : these simulations have a gravitational lengthlG comparable with that of several experimentsin index matched but not density matched sol-vents [19, 21]. This group is used to study theeffects of gravity on the nucleation rates.
TABLE I: Simulated state points. Each state point isuniquely defined by the definition of the gravitational length,lG, and the average volume fraction of particles in the sim-ulation box, φavg. Simulations are divided into four groups.In Group I all simulations have approximately the same den-sity at z = 0 but differ for their gravitational lengths. InGroup II simulations have the same gravitational length butdiffer for their densities at z = 0. In Group III the high-est density is still low enough to avoid crystallization duringthe simulation time. In Group IV all simulations have thesame gravitational length, comparable to some colloidal ex-periments [19, 21]. For simulations in Group I, II and IV wereport the effective nucleation rate, k d5/D, and the averageheight where nucleation occurs, 〈z〉.group lG/d φavg k d5/D 〈z〉/d
I2.07 0.530 9.5 · 10−6 5.6
1.90 0.525 6.5 · 10−6 5.2
1.75 0.520 5.7 · 10−6 4.9
II1.75 0.540 1.7 · 10−5 7.2
1.75 0.520 5.7 · 10−6 4.9
1.75 0.510 2.9 · 10−6 4.0
III7.59 0.530
5.70 0.525
4.56 0.520
IV
3.10 0.520 7.4 · 10−7 3.8
3.10 0.525 1.0 · 10−6 4.2
3.10 0.530 1.9 · 10−6 4.6
3.10 0.540 4.4 · 10−6 6.7
3.10 0.550 6.1 · 10−6 8.8
3.10 0.560 7.5 · 10−6 11.1

5
We show the theoretical profiles calculated fromEqs. (3) and (4) for the state points in group I, II, IIIin Fig 2. State points with the same gravitational lengthare characterized by the same density gradient across thebox. Decreasing the gravitational length increases thedensity gradient.
RESULTS
Nucleation rates
We directly measure nucleation rates in our simula-tions by running 50 independent simulations for eachstate point in groups I, II and IV (see Table I). In theabsence of a gravitation field, the nucleation rate as cal-culated by simulations has a very strong dependence onthe density, growing by 15 orders of magnitude by justgoing from φ = 0.52 to φ = 0.54 [34] (see Fig. 14). Thedirect simulation of nucleation events becomes unfeasi-ble for φ < 0.53 and one has to resort to rare-eventssampling techniques in order to extract the nucleationrate [13, 34]. This is not the case in the presence of agravitational field: most of our simulation state pointsare within φavg < 0.53 but still we are able to observedirectly nucleation events, for all state points of groupsI, II and IV. For the calculation of the nucleation rate kwe resort to the direct formula
k =1
〈t〉V, (8)
FIG. 2: Theoretical volume fraction profiles calculated fromEqs. (3) and (4) for the state points of groups I, II and III,in Table I. Group I state points are depicted with continuouslines: they are characterized by φ(z = 0) ∼ 0.570 and differ-ent density gradients. Group II simulations are depicted withopen symbols: they all have the same gravitational length andaccordingly the density profiles are parallel. Group III simu-lations are depicted with dashed lines: their volume fractionφ < 0.54 and thus nucleation events are never observed duringour observation time.
where 〈t〉 is the average time at which nucleation eventsoccur, and V is the system’s volume. The nucleationrate of course depends sensibly on the definition of thenucleation time. We define the nucleation time as thetime it takes for the largest nucleus in the system to reachsize 100 particles. This size is bigger than the criticalnucleus size, as all nuclei that reach this size always keepgrowing. For the volume V we use the volume availableto the fluid, even if (as we will see later) nucleation eventsdo not occur in the whole volume. Despite the fact thatboth the choice of the critical size and of V are veryconservative, potentially leading to lower nucleation ratesthan actually observed, the nucleation rates reported inTable I are very high, comparable to the nucleation rateswhich homogeneous systems have around the nucleationrate maximum, at φ ∼ 0.56. A great enhancement ofthe nucleation rates is indeed observed in our systems.In the following section we will address the origin of thisenhancement, and whether the nucleation stage is reallyakin to a homogeneous nucleation process.
Static properties
Previous studies have addressed the crystallization ofhard spheres in gravity by confining the system with flatwalls [35–40]. In this case the high nucleation rates weredue to heterogeneous nucleation on the walls. In orderto prevent heterogeneous nucleation, we confine our sys-tem with rough walls, i.e. walls that are obtained byfreezing a zone of colloidal particles, occupying positionsthat are characteristic of the bulk liquid. It is well knownthat such frozen walls do not induce the density layeringtypical of flat smooth walls [29, 41]. This is due to thefact that the roughness leads to the lack of the phasecoherence of the density waves.
As a first step to prove that walls are not enhancingour nucleation rate, we run simulations of the WCA fluidconfined by rough walls prepared at volume fraction ofφw = 0.5657 in the absence of gravity. The fluid withinthe walls was prepared at different volume fractions, fromφ = 0.54 to φ = 0.57, and nucleation events were seento occur randomly in the simulation box, without anyapparent enhancement in the proximity of the walls.
When a gravitational field is turned on, a density pro-file is induced in the simulation box. We first start byvisually locating the nucleation events, as shown in Fig. 3.From these direct observations we can already infer thatthe location of the nucleation events depends sensibly onthe local density. For φavg = 0.510 (top row) nucleationoccurs very close (but not in contact) with the wall, whilefor φavg = 0.540 (bottom row) it is located too far awayto be due to wall effects. While always distinct, manynucleation events can occur in the simulation box, a con-sequence of the high nucleation rate, and in principleinteractions between the different nuclei will occur.

6
FIG. 3: Nucleation snapshots for simulations of group II, at φavg = 0.510 (top row) and φavg = 0.540 (bottom row). Wallparticles are coloured in grey, whereas only crystalline particles are shown and coloured according to the cluster they belongto. An algorithm is used to identify particles belonging to the same cluster in time, so that the colouring of the clusters shouldremain consistent across the time frames. For φavg = 0.510 snapshots are taken at a time interval of ∆t = 3τB after waitingfor t0 = 3 τS to ensure the settling of the profile. For φavg = 0.510 snapshots are taken at a time interval of ∆t = 1.5τB afterwaiting for t0 = 3 τS . The snapshots span clusters from pre-critical to post-critical sizes.
To study these events in detail we determine the aver-age location of the nucleation events, 〈z〉, which is sum-marized also in Table I. To calculate 〈z〉 we first detectall individual nuclei via a cluster algorithm, and thencalculate the average height of the centers of mass as afunction of the size of the nucleus n. The results are re-ported in Fig. 4. For each state point, the average heightof the centers of mass has a characteristic dependence onthe size of the nucleus. For very small nuclei (n . 10)the height of the center of mass decreases with n: thisis due to the fact that small nuclei randomly form in alarge portion of the simulation box, so that their averageheight is high, while growing nuclei form preferentiallyat the bottom of the simulation box. With increasingn, 〈z〉 reaches a plateau which encompasses the criticalnucleus size and can thus be considered as the averageheight at which nucleation events occur. The averagenucleation height is clearly correlated with the densityprofile of each state point, as we will see shortly. Inter-estingly, for n & 60 the average height increases again,which means that the growth of nuclei occurs on aver-age more in the positive z direction, thus opposite to thedirection of gravity.
Figure 5 plots the volume fraction profile φ(z) for
FIG. 4: Average height of the centers of mass of nuclei as afunction of their size, for all state points of group I (closedsymbols) and group II (open symbols). Averages are done sep-arately for each nucleus size, and then sizes within the samehistogram bin (in logarithmic scale) are averaged together.The average height displays a clear plateau at intermediatesizes, which corresponds to the average height 〈z〉 of nucle-ation events and is reported in Table I.
group I (a-top panel) and group II (b-bottom panel) state

7
FIG. 5: Volume fraction profiles φ(z) for group I (a) andgroup II (b) simulations, obtained by means of Voronoi di-agrams. The simulated profiles are represented by sym-bols, while dashed lines are theoretical predictions based onEqs. (3) and (4). The vertical dotted lines show the averageheight of nucleation as determined from the plateaus in Fig. 4.The coloured horizontal band in both figures represents the φregion where average nucleation events occur, as determinedby the intersection of the density profiles with the verticaldotted lines. Simulation profiles are calculated by averagingconfigurations with the biggest nucleus having size between50 and 60 particles, and by dividing the z dimension into binsof size ∆z = 1.
points. The measured profile (symbols) is obtained byaveraging over configurations where the biggest nucleusis of size between 50 and 60 particles, thus capturing theprofile just before the growth stage. The measured pro-file (symbols) can be compared with the expected equi-librium profiles, calculated from Eqs. (3) and (4), andplotted in Fig, 5 as dashed lines. For all state pointswe note that the actual profile at the time of nucleationis in very good agreement with the equilibrium one fordistances not too close to the wall (z = 0). Next to thewalls, instead the density saturates to a constant value.Density profiles are practically unchanged also even atlater times, when nuclei have started filling the system.In Fig. 5 we also report as dotted vertical lines the aver-age height of nucleation events, as determined in Fig. 4.By intersecting these lines with the corresponding den-
FIG. 6: Average crystallinity order parameter, as defined byEq. (5), for the state point of group I and lG = 1.9. Thedifferent curves are averages of the crystallinity for configu-rations with nuclei of size n ± 5, for the following values ofn = 25, 55, 105, 155, 205, 355, and 405 (the order is specifiedby the arrow). The crystallinity profile increases rapidly withthe size of the growing nuclei.
sity profiles we note that all nucleation events (irrespec-tive of φavg and gravitational length) occur in regionswhere 0.55 . φ(z) . 0.56. This interval is exactly thevolume fraction where the nucleation rate in bulk has amaximum. It is thus clear that the origin of the highnucleation rates, and the localization of the nucleationevents, corresponds to homogeneous nucleation occur-ring in regions characterized by a local volume fraction of0.55 . φ(z) . 0.56. In the next section we will providean explanation for the saturation of the density profileclose to the walls, but in the meanwhile we emphasizethat nucleation events occur in regions of the simulationbox where density has relaxed.
By looking at the density profiles it is difficult to de-tect the presence of the growing nuclei, since the densitychange between the small nuclei and the fluid phase isvery small. Moreover, growing nuclei are known to havea density closer to the melt than to the bulk crystal up tosizes many times larger than the critical nucleus size [33].Growing crystals are more easily detected by bond orien-tational order parameters, such as the one introduced inEq. (5) which we refer to as crystallinity order parame-ter [33, 42]. A plot of the profile for this order parameteris shown in Fig. 6 for the state point of group I withlG = 1.9. The different curves show the average profilefor configurations with embedded nuclei of different sizen (we take n as the size of the largest nucleus in eachconfiguration). As the size of the nucleus n grows, thecrystallinity rapidly increases. The average mean posi-tion of the crystalline peak is in good agreement withthe one extracted from Fig. 4. Also we note that theaverage peak position shifts to higher values of z as thesize of the nuclei grow, as was also observed in Fig. 4.
8
We thus once again confirm that, along the z direction,the growth of the nuclei occurs preferentially opposite tothe gravitational force.
We conclude this section by raising two questions. Thefirst one is why the density does not relax to its equilib-rium value close to the walls, even long after nucleationhas started. A second question, possibly related to thefirst one, is why nucleation never occur close to the wall.As for this last question, let us take as an example thestate point of group II and φavg = 0.510. As can beseen from Fig. 5(b) the nucleation starts on average at adistances around 4σ from the wall, despite the fact thatthe density approaches φ = 0.56 going closer to the wall,where the nucleation rate should have its maximum. Toanswer these questions, in the next section we study theeffects of rough walls on the static and dynamical prop-erties of the fluid.
Wall effects
The effects of walls on the static and dynamical prop-erties of fluids is of great interest, and many studies havebeen devoted to this problem [29, 30, 41, 43]. To studythe combined effects of gravity and rough walls we usestate points of group III in Table I, where nucleationevents do not occur within the simulated time.
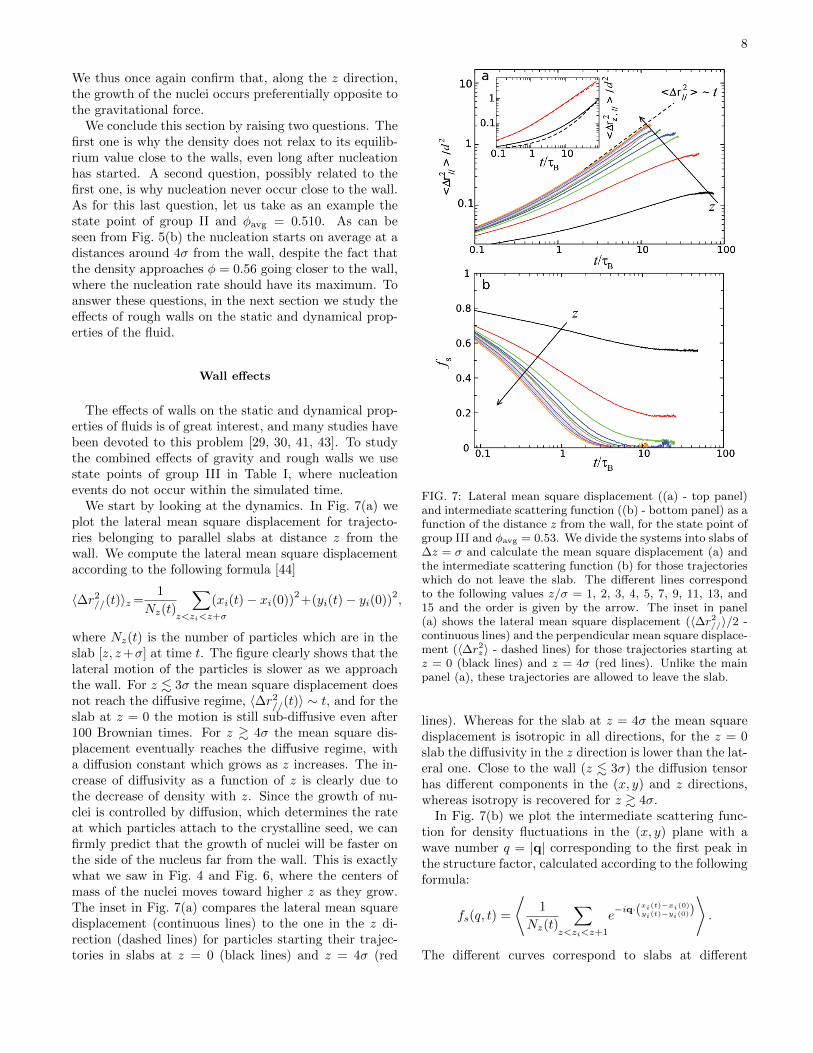
We start by looking at the dynamics. In Fig. 7(a) weplot the lateral mean square displacement for trajecto-ries belonging to parallel slabs at distance z from thewall. We compute the lateral mean square displacementaccording to the following formula [44]
〈∆r2//(t)〉z=
1
Nz(t)
∑z<zi<z+σ
(xi(t)− xi(0))2+(yi(t)− yi(0))
2,
where Nz(t) is the number of particles which are in theslab [z, z+σ] at time t. The figure clearly shows that thelateral motion of the particles is slower as we approachthe wall. For z . 3σ the mean square displacement doesnot reach the diffusive regime, 〈∆r2
//(t)〉 ∼ t, and for theslab at z = 0 the motion is still sub-diffusive even after100 Brownian times. For z & 4σ the mean square dis-placement eventually reaches the diffusive regime, witha diffusion constant which grows as z increases. The in-crease of diffusivity as a function of z is clearly due tothe decrease of density with z. Since the growth of nu-clei is controlled by diffusion, which determines the rateat which particles attach to the crystalline seed, we canfirmly predict that the growth of nuclei will be faster onthe side of the nucleus far from the wall. This is exactlywhat we saw in Fig. 4 and Fig. 6, where the centers ofmass of the nuclei moves toward higher z as they grow.The inset in Fig. 7(a) compares the lateral mean squaredisplacement (continuous lines) to the one in the z di-rection (dashed lines) for particles starting their trajec-tories in slabs at z = 0 (black lines) and z = 4σ (red
FIG. 7: Lateral mean square displacement ((a) - top panel)and intermediate scattering function ((b) - bottom panel) as afunction of the distance z from the wall, for the state point ofgroup III and φavg = 0.53. We divide the systems into slabs of∆z = σ and calculate the mean square displacement (a) andthe intermediate scattering function (b) for those trajectorieswhich do not leave the slab. The different lines correspondto the following values z/σ = 1, 2, 3, 4, 5, 7, 9, 11, 13, and15 and the order is given by the arrow. The inset in panel(a) shows the lateral mean square displacement (〈∆r2//〉/2 -continuous lines) and the perpendicular mean square displace-ment (〈∆r2z〉 - dashed lines) for those trajectories starting atz = 0 (black lines) and z = 4σ (red lines). Unlike the mainpanel (a), these trajectories are allowed to leave the slab.
lines). Whereas for the slab at z = 4σ the mean squaredisplacement is isotropic in all directions, for the z = 0slab the diffusivity in the z direction is lower than the lat-eral one. Close to the wall (z . 3σ) the diffusion tensorhas different components in the (x, y) and z directions,whereas isotropy is recovered for z & 4σ.
In Fig. 7(b) we plot the intermediate scattering func-tion for density fluctuations in the (x, y) plane with awave number q = |q| corresponding to the first peak inthe structure factor, calculated according to the followingformula:
fs(q, t) =
⟨1
Nz(t)
∑z<zi<z+1
e−iq·(xi(t)−xi(0)
yi(t)−yi(0))⟩.
The different curves correspond to slabs at different

9
FIG. 8: Volume fraction profile φ(z) for state points of groupIII, and comparison of the lateral mean square displacementfor slabs at φ = 0.54 (left inset) and at φ = 0.537 (rightinset). Choices of colours and symbols are consistent betweenthe volume fraction profiles in the main panel, and the lateralmean square displacements in the two insets.
heights. Again, for z . 3σ we can see that the self scat-tering function has still not decayed to zero, meaning thatdensity fluctuations are not able to relax in the observedtime window. Near the walls the dynamics slows consid-erably, and this is at the origin of the non-equilibriumprofile observed in the previous section (Fig. 5) for slabsclose to the wall.
We can investigate the range of the wall effects by com-paring the dynamics between simulations with differentgravitational lengths. In Fig. 8 we plot the dynamics ofslabs located at different distances from the wall but withthe same local volume fraction. The main panel showsthe volume fraction profiles φ(z) for the group III statepoints. For each of the state points, the dynamics of slabshaving the average density of φ = 0.54 (left inset) andφ = 0.537 are then compared. In the right inset all slabsare at distance z ≥ 4σ and they display the same dy-namics. Thus the dynamics is bulk-like for z & 4σ, andindependent of the local density gradient. For φ = 0.54(left inset), the dynamics of the slabs located at z = 1σ ismuch slower than the dynamics at z = 3σ. We can againconclude that for z . 3σ there are strong wall effects.
We now proceed to study the effects of the walls onthe static properties of the fluid. We consider positionalorder (as expressed by the local density) and bond ori-entational order (expressed by the crystallinity order pa-rameter defined in Eq. (5)), both depicted in Fig. 9. Bothtranslational and bond orientational order grow as z de-creases, but their behavior in the proximity of wall is verydifferent. While density is almost unperturbed on ap-proaching the wall, crystallinity is instead strongly sup-pressed. The range of this suppression coincides well withthe region where deviations from bulk dynamics were ob-served. A link between static and dynamic properties un-der confinement was recently proposed in Ref. [41], and
FIG. 9: Crystallinity (solid lines, left axis scale) and volumefraction (dashed lines, right axis scale) profiles for state pointsof group III. Results are averaged by taking slabs with ∆z =σ.
it is compatible with our findings. Moreover it was re-cently argued that crystallization is driven by bond orien-tational order and not by positional order [33], and this isclearly shown in our results: while density is rather un-perturbed on approaching the wall, bond orientationalorder is strongly suppressed and in fact we do not findany nucleation events happening in close proximity to thewalls. As a first approximation, density can be used as ameasure of positional order, but more rigorous definitionsare also possible [33, 45]. The range of the perturbationinduced by the rough wall is governed by the correlationlength of bond orientational order in the bulk phase. Itis well known that such structural correlation lengths in-crease as the density is increased, but its absolute value isalways very small (no static correlation length has beenfound that exceeds a few particles diameters [43, 45–48]),thus the value of the crossover is rather insensitive of thestate point considered. We can thus conclude that theperturbation induced by the walls in our system extendsroughly only for distances up to z . 3σ, and what weobserve are genuine homogeneous nucleation events.
Gravity effects on crystal growth
In this section we address the question of how nucleigrow in the presence of a gravitational field. We alreadyobserved in previous sections that the average positionof the centers of mass of nuclei shifts to higher z as thenuclei grow. We also argued that this is due to the dif-ferences in the dynamics of the fluid particles on the twosides of the growing nuclei. The side with higher z ischaracterized by a faster dynamics and consequently afaster crystal growth.
Figure 10 plots the mean first passage time for simula-tions of group I. The mean first passage time 〈tfp(n)〉 isdefined as the average time elapsed until the appearanceof a nucleus of size n in the system. For homogeneoussystems it was shown that the following expression ap-

10
FIG. 10: Mean first passage time as a function of the nucleussize n for state points of group I. Symbols are measured meanfirst passage times, whereas continuous lines are fits to Eq. (9)up to n = 120. The left inset shows that by scaling the timesall curve at different field strengths collapse on the same curve.The right inset shows the average distribution of crystal sizesP (n) for all configurations in which the biggest cluster hassize smaller than 400 particles. The dashed line representsa power-law crystal size distribution with Fisher exponent,τ = 1.9.
plies [49]
〈tfp(n)〉 =1
2kV{1 + erf [c(n− nc)]} , (9)
where k is the nucleation rate, nc is the critical nucleussize, erf is the error function, and c =
√∆F ′′(nc)/kBT .
Here ∆F ′′(nc) is the second derivative of the nucleationbarrier ∆F (n) at its maximum and thus c characterizesthe curvature at the top of the nucleation barrier profile.A direct fit is attempted for n < 120 and representedas continuous lines in Fig. 10. We limit the fit to smallnuclei, since as the nucleus grows it likely feels the effectsof the density gradient, which Eq. (9) does not take intoaccount. Moreover the growth of the nucleus is also af-fected by the presence of surrounding smaller nuclei, asdescribed in Ref. [18]. The fit gives us nucleation timesin good agreement with the one reported in Table I and acritical nucleus size of approximately 50 particles for allstate points. The coincidence of the critical nucleus sizeis not surprising, as we have shown that nucleation occursfor all state points in regions with similar volume frac-tions. Note the relation between the mean first passagetime and the gravitational length: longer gravitationallengths correspond to shorter mean first passage times,i.e. faster growth. This relationship is much deeper: inthe right inset of Fig. 10 we show that it is possible tocollapse all mean first passage times by just rescaling thetime unit with a scaling factor α. This rescaling canbe explained in the context of mean first passage theoryof activated processes, as developed in Ref. [49] (we fol-low here its notation). One first introduces the auxiliary
function
B(n) =1
Pst(n)
[∫ b
n
Pst(n′) dn′ − 〈tfp(b)〉 − 〈tfp(n)〉
〈tfp(b)〉
],
where Pst(n) is the stationary time-independent proba-bility of finding a nucleus of size n and b is the size atwhich simulations are stopped (b = 480 in our case).First we note that Pst(n) is the same for all state pointsreported in Fig. 10 (group I), since Pst(n) depends on thedensity accessible to the system, and not on the densitygradient. This is seen in the right inset of Fig. 10 whichshows that even the full crystal size distribution P (n),which includes both stationary and non-stationary stateswith clusters bigger than the critical size, is unchangedfor all state points. The decay of P (n) is slow, and forthe limited sizes available to our study, it resembles apower law with Fisher exponent τ ' 1.9. As we will seesoon, the growth of the nucleus occurs faster laterally,and this exponent can suggest a similarity with a two-dimensional percolation process (where τ = 187/91), inwhich the largest nucleus grows by merging with smallernuclei. A consequence of the observed scaling of 〈tfp(n)〉is that all state points of group I are characterized by thesame function B(n). Once the function B(n) is known,one can reconstruct the free energy landscape from theexpression [49]
β∆F (n) = logB(n)−∫
dn′
B(n′)+ C.
This means that the simulations with different gradientsshare the same free energy landscape, as already notedwith the equivalence of the critical nucleus sizes. B(n)enters also into the definition of the generalized diffusioncoefficient D(n), which expresses the rate of attachmentof particles to a nucleus of size n [49]:
D(n) = B(n)/∂〈tfp〉∂n
.
The above theory provides a basis for understandingthe effects of density gradient on the initial processesof crystallization shown in Fig. 10. Since we have es-tablished that B(n) is the same for all simulations ofgroup I, we conclude that the growth of the nuclei, as ex-pressed by the mean first passage time, is simply inverselyproportional to the generalized diffusion D(n). We ob-served in Fig. 10 that shorter gravitational lengths areaccompanied by slower growth, which is a consequenceof smaller D(n). Physically this corresponds to a moredifficult growth of interfaces when the density gradient isstronger. On noting that D(n) is the rate of attachmentof particles to a nucleus of size n, we speculate there aretwo origins behind the gradient-induced slowing down ofcrystal growth: a dynamical and a thermodynamic ori-gin. First we consider the dynamical origin. The dif-fusion constant is a very strong decreasing function of φ

11
FIG. 11: Shape of nuclei as a function of size n for the statepoint of group II and φavg = 0.520. The shape is expressedas the ratio between the maximum and minimum eigenvalueof the inertia tensor matrix. Two different types of averagesare considered. The first one is just the simple average overthe eigenvalues of individual nuclei, and is represented by thesquare (red) symbols. With the round (black) symbols werepresent instead the ratio between the maximum and min-imum eigenvalue of the averaged inertia tensor. The insetshows the x (black), y (red) and z (green) components of theeigenvector corresponding to the maximum eigenvalue of theaveraged inertia tensor.
near φg. Thus the density gradient has a nonlinearly am-plified strong perturbation on the dynamics. This shouldlead to a significant slowing down of particle diffusion onthe high density side of a nucleus. On the other hand,the thermodynamic origin may play an important role inthe slowing down of the growth on the opposite side (thelow density side). The thermodynamic driving force de-creases dramatically when the liquid density decreases to-ward the melting volume fraction, where the crystal andthe liquid have the same free energy. Thus, we expectthat the lower density of the liquid surrounding a crystalleads to the weaker driving force for crystal growth andthus to the slower growth.
We conclude this section by looking at the effects ofthe gravitational field on the shape and the orientationof the growing nuclei. The shape can be determined bycalculating the inertia tensor of nuclei
Ilm =
n∑i=1
|~ri|2δlm − ri,lri,m, (10)
where ~ri is the vector from particle i to the center of massof a nucleus, l and m are its vector components, and δ isthe Kronecker delta. The eigenvalues of the inertia tensorrepresent the inertia moments along the principal axis ofinertia, given by the corresponding eigenvectors. The ra-tio between the maximum eigenvalue and the minimumeigenvalue describes the asphericity of the crystalline nu-cleus. In Fig. 11 we report the values of this ratio as afunction of the size of the nuclei for two different types
FIG. 12: Probability distribution, in spherical coordinates(θ, ψ), for the orientation of the hexagonal plane of crystalsformed at the state point with lG = 1.75 and φavg = 0.520.θ is the angle between the vector perpendicular to the planeand the z-axis (along which gravity is directed). ψ is theangle between the projection on the (x, y) plane of the vectorperpendicular to the plane and the x axis. Note that weconsider weighted averages, where each nucleus enters in thedefinition of P (θ, ψ) with a weight equal to its size (similarresults are obtained with unweighted averages).
of averages. The first one is simply the average of theratio λmax/λmin for individual nuclei, and is reported inthe square (red) symbols. It clearly shows that individ-ual nuclei are always very aspherical. This comes not asa surprise, since the volume fraction at which the nucleiare forming is always rather high, and deviations fromthe spherical shape have already been reported at thesevolume fractions [18, 50]. We observe that despite theaspherical shape, nuclei are always clearly distinct fromeach other: we are still far from a spinodal type of nu-cleation. The second type of average is reported withthe round (black) circles in Fig. 11, and it is the ratioλmax/λmin for the average inertia tensor. Averaging theinertia tensor of different nuclei corresponds to looking atthe convolution of their shapes. If nuclei are asphericalbut randomly oriented, their convoluted shape will stillspherical. This is exactly what we observe for small nu-clei in Fig. 11, where the ratio λmax/λmin ∼ 1 for smalln. As the nuclei grow the ratio increases steadily, andthis is due to an asymmetric growth induced by gravity.In the inset of Fig. 11 we report the components of theprincipal axis of inertia (corresponding to the maximumeigenvalue) of the convoluted shape. Clearly this inertiaaxis is oriented along the z direction, i.e., along the grav-ity field. This means that the nuclei grow as ellipsoidswith the two major axis laying in the (x, y) plane. Aprocess which contributes to this result is probably alsothe merging of different nuclei in the x, y directions, aswe have already shown that many nuclei form in a rathernarrow z strip.

12
FIG. 13: Probability distribution function P (θ) for all statepoints of group I and II (continuous lines with symbols),scaled so that P (θ) = 1 represents a uniform distribution.The dashed line shows the probability distribution for a bulkfcc crystal with lattice vectors oriented along the (x, y, z)directions and at volume fraction φ = 0.535 (the distribu-tion function is scaled to improve readability). The insetshows a snapshot from a nucleation event at lG = 1.75 andφavg = 0.520: the continuous lines are traced along the hexag-onal planes while the dashed line gives the plane orientation.The θ angle of the nucleus in the inset is shown as the dashed-dotted line in the main panel.
In Fig. 12 we consider the orientation of crystal planesfor the state point with lG = 1.75 and φavg = 0.520. Itis well known that for hard potentials the relevant crys-tal polymorphs are either fcc or hcp (and rhcp whichis given by randomly stacking fcc and hcp planes) [33].Both polymorphs are characterized by hexagonal planes.For fcc the hexagonal plane is written as (1, 1, 1) in Millerindices (due to the C4 symmetry of cubic crystals, thereare actually 4 planes differing for a π/2 rotation alongany of the unit cell vectors). For hcp the hexagonalplane is written as (0, 0, 0, 1) in Miller-Bravais indices.For each crystalline particle in a nucleus we detect thedirection of the hexagonal plane (the vector perpendic-ular to the plane) and plot its probability distributionin spherical coordinates, according to the usual trans-formations: r =
√x2 + y2 + z2, θ = cos−1(z/r) and
ψ = tan−1(y/x) (z is the direction of gravity). The prob-ability to find a crystalline particle with hexagonal planespointing in the (θ+dθ, ψ+dψ) direction is then given byP (θ, ψ) sin θ dθ dψ. We have approximately 50 indepen-dent trajectories, and for each we analyse the orientationof crystal particles belonging only to the largest clusterin the system, and only if the cluster has size bigger than20 particles (to avoid the contribution from metastablenuclei). In Fig. 12 the peaks corresponding to the orien-tation of the individual crystals are still visible, but it isalready clear that P (θ, ψ) has no sensible ψ dependence.
To examine the θ dependence, in Fig. 13 we plot the re-duced probability distribution P (θ) =
∫P (θ, ψ) dψ. This
plot shows that, for all state points in groups I and II,there is no noticeable θ dependence for the orientationof the crystalline planes. This means that the nucleationstage occurs homogeneously, with nuclei having no pre-ferred orientation. Since the rotational diffusion of nu-clei is much slower than the growth process, the nucleiretain their random orientation even when the averageshape of the nuclei becomes asymmetric (Fig. 11). Oneexample of crystal orientation and of its inclination θ isshown in the inset of Fig. 13 (the same value of θ is in-dicated in the main panel as a dashed-dotted line). InFig. 13 we note that for the state point where the aver-age nucleation event is closest to the wall (lG = 1.75 andφavg = 0.510), there is a small probability excess closeto θ = cos−1(1/
√3). This orientation corresponds to a
cubic crystal oriented with its lattice vectors along the(x, y, z) directions, as shown in the dashed curve for athermal fcc crystal. We can speculate that, for nucle-ation events occurring very close to the wall (low valuesof φavg and high G values) the orientation of crystalscould become anisotropic, but a confirmation of this ef-fect needs more statistical significance.
Comparison with experiments
We now address the question whether a gravitationalfield can enhance the crystallization rate in a colloidalsuspension of hard spheres. We first report in Table IIsome experimental parameters relevant to our study.The experiments can be clearly distinguished accord-ing to their gravitational lengths lG. Experiments inRefs. [19, 21] involve colloidal particles suspended in anindex-matched solvent but not in a density matched one,resulting in very short gravitational lengths. Experi-ments in Refs. [20, 22, 23] instead improve considerablythe density matching by either employing small parti-cles, or by using swelling microgels whose density is veryclose to the density of the solvent. In Fig. 14 we comparethe adimensional nucleation rates as a function of volumefraction calculated in these experiments (all experimen-tal results are plotted with black symbols). Experimentswith shorter gravitational lengths (plus symbols [21] andstars [19]) are characterized by higher nucleation rateswhen compared to experiments with longer gravitationallengths (crosses [20] and diamonds [22]). This shows thata reduction of the gravitational effects goes indeed in theright direction of explaining the discrepancy between ex-periments and simulations.
To assess the importance of gravitational effects in thecrystallization of hard spheres we define the followingquantity: Q(l) = τs/τx, where τs is the average time fora colloid to move the distance l due to the gravity field,and τx is the average time for a nucleation event to occurin the volume l3. Q(l) is thus an adimensional num-ber which quantifies the relative importance of the sed-

13
TABLE II: Comparison of colloidal diameter d, colloidal type and density ρP , solvent type and density ρf , and gravitationallengths lG for the experiments in Refs. [19–23]. It should be noted that the determination of gravitational lengths in experimentsis subject to high uncertainty. The determination of the size of particles is especially difficult, and some estimates indicate thatthe error is of the order of 3− 6% [51].
experiment colloids d solvent lG/d
Schatzel et al. [19] PMMA 1µm decalin/tetralin 2.9
ρP = 1.19g/cm3 ρf = 0.92g/cm3
Harland & van Megen [20] PMMA 0.40µm decalin/CS2 138
ρP = 1.19g/cm3 ρf = 0.97g/cm3
Sinn et al. [21] PMMA 0.89µm decalin/tetralin 4.1
ρP = 1.19g/cm3 ρf = 0.92g/cm3
Iacopini et al. [22] polystyrene microgel 0.86µm 2-ethyl-naphthalene 80
Franke et al. [23] ρP = 1.01g/cm3 ρf = 0.992g/cm3
FIG. 14: Adimensional crystal nucleation rates estimatedfrom simulations (dashed red lines) and from experiments(black symbols). The legends have the following correspon-dence: Filion et al.(1) is Ref. [13], Filion et al.(2) is Ref. [16],Kawasaki et al. is Ref. [14], Schatzel et al. is Ref. [19](lG = 2.9 d), Harland et al. is Ref. [20] (lG = 138 d), Sinnet al. is Ref [21] (lG = 4.1 d) and Iacopini et al. is Ref. [22](lG = 80 d). Nucleation rates for the simulations of group IVand the two-state model fit are reported as continuous greenlines. This figure is drawn starting from Fig. 6 of Ref. [16]and Fig. 12 of Ref. [20].
imentation timescale with respect to the crystallizationtimescale, at any particular length scale l. For Q(l)� 1we expect gravitational effects to be negligible, and theobserved nucleation rate in experiments to be the sameas in gravity-free simulations. On the other hand, forQ(l)� 1 gravitational effects cannot be ignored as theybecome significant on timescales much shorter than theaverage nucleation time. The most relevant length scalel in this problem is the size of the critical nucleus Rc,since below that size, l < Rc, nuclei can convert backinto the metastable melt. We will thus focus on Q(Rc) atordinary experimental conditions. Table II reports someexperimental parameters relevant to the determination ofQ(Rc), namely, the diameter of the colloids d, the densityof the solvent ρf , and the gravitational length lG, and the
density of a colloidal particle ρP . The details of the calcu-lations are given in the Appendix . We find that the con-dition Q(Rc) ∼ 1 is realized in a small windows of |∆µ|(the chemical potential difference between the solid andfluid phase), β|∆µ| ∼ 0.38, and φ ∼ 0.525, for the exper-iments in Refs. [19, 21]. These values are slightly less (asexpected) for the experiments with a longer gravitationallength, Refs. [20, 22], i.e. β|∆µ| ∼ 0.36 and φ ∼ 0.522.Thus, for φ & 0.525, we find Q(Rc) � 1 and gravita-tional effects can be ignored. But for φ . 0.525 the con-verse is true, and gravitational effects become increas-ingly important. Thus, for φ significantly larger than0.525 we expect that experiments without density match-ing (Refs. [19, 21]) and gravity-free simulations will mea-sure similar nucleation rates, whereas a big discrepancy,due to gravitational effects, should emerge at φ . 0.525.This can be confirmed by looking at the nucleation ratesin Fig. 14 where experiments are plotted with (black)symbols, while simulations without gravity as (red) linesand symbols, confirming that the value obtained fromour simple dimensional analysis, φ ∼ 0.525, is indeedbetween these two regimes.
The same behaviour is seen within our simulations.In Fig. 15 we plot the z profiles of both volume frac-tion, φ, and crystallinity, S, for the state points in groupIV. The profiles are taken by averaging all configurationsin which the largest nucleus has a size comprised be-tween 20 and 30 particles, in order to have a picture ofthe nucleation process in its early stage. The figure re-veals that, at the beginning of the nucleation events, a z-dependent profile has developed both for φ and S. Whileφ has a smooth monotonic behavior, apparently unaf-fected by the ongoing crystallization process, the crys-tallinity order parameter S reveals that the location ofthe nucleation events is in the density enhanced regions.The extent of these regions depends on the average vol-ume fraction, φavg. This is shown by the dashed-dottedline in Fig. 15 which clearly separates two regimes: forφ . 0.525 the φ and S profiles display the same z de-pendence, while φ & 0.525 marks the beginning of the

14
FIG. 15: Volume fraction profiles φ(z) (full lines) and crys-tallinity profiles S(z) (dashed lines) for state points in GroupIV. The φ scale and the S scale are reported respectively onthe left and right axis. The nearly horizontal dashed-dottedline marks the value φ = 0.525, separating the region of crys-tal formation from the metastable region. Profiles are ob-tained by averaging all configurations in which the biggestnucleus size is between 20 and 30 particles, and by dividingthe z dimension into bins of size ∆z = 1.
nucleation events. We recall from our previous adimen-sional analysis that Q(φ = 0.525) ∼ 1, again confirm-ing that for φ & 0.525 nucleation events are bulk-likeand the same as in a gravity-free environment, whereasfor φ . 0.525 sedimentation can occur on shorter time-scales than nucleation, and significant deviations are tobe expected with respect to the zero gravity case. Thenucleation process under gravity is inevitably out of equi-librium and even hydrodynamics should play an impor-tant role eventually. However, we argue that within theincubation time (at most ∼ 102 Brownian times) theremay be no macroscopic processes involved and gravity-induced density fluctuations via diffusion may be a majorprocess. This is indirectly shown by the experiments inRef. [19] which report that the first indication of crys-tallization could be observed on timescale of 103 s witha solvent viscosity of 2.37 · 10−3 Pa·s. This correspondsto incubation times of the order of 102 Brownian times,which is the same range measured in our simulations.Despite having similar incubation times, experiments innon-density matched solvents and simulations differ fortheir nucleation rates, as can be seen in Fig. 14, where thenucleation rates of simulations in group IV are reportedas (green) squares. But this difference is trivially dueto the different volumes accessible in simulations and ex-periments (the nucleation rate is obtained by dividing theaverage incubation time by the total volume of the sys-tem). Simulations measure nucleation events in strips ofheight z, while experiments measure nucleation events inregions of height ∼ 104 z (the section of the laser beam),so that the difference in nucleation rates between exper-iments and simulations at the lowest volume fraction isexpected to be of the order of 104, provided that the ex-
periments are sensitive enough to detect the formationof only a few nuclei. This estimation well matches withthe ratio in the nucleation rate between the experimentand our simulation observed at φ = 0.52, as shown inFig. 14. The physical picture which emerges is thus that,at low volume fraction, the nucleation rate is controlledby small density inhomogeneities induced by gravity. Onsmall scales these inhomogeneities should resemble theones obtained in simulations.
Given the previous physical picture, we can easily builda model to connect the results at high φ (where bulkcrystallization dominates) and low φ (where sedimenta-tion dominates). We adopt a simple two-state model,with high-density regions (φ > φ∗ and with nucleationrates similar to the ones extracted from our simulations)coexisting with low-density regions (φ < φ∗, and withnucleation rates similar to the bulk behavior in absenceof gravity). Due to the steep increase in nucleation rateswe can take the value φ∗ as the density of the nucleationrate maximum, φ∗ ∼ 0.56. The nucleation rate in thesample can thus be written as k = kSx + kH(1 − x),where kS is the rate extracted from our simulations, kHis the rate obtained without gravity, and x is the frac-tion of the volume in the sample with φ > φ∗ due togravity (and not thermal fluctuations). We model the φdependence of x by a Fermi function to account for theconstraint on x from the conservation of the total vol-ume fraction φ: x(φ) = 1/(1 + exp{κ(φ − φ∗)/G}), sothat at G = 0 density inhomogeneities are null, while forG > 0 the extent of the fluctuations is proportional toexp (φ− φ∗). κ ∼ 1.5 is fixed from the equivalence of nu-cleation rates at φ = 0.52, as previously discussed. Theresults of the model are depicted in Fig. 14 as a dashedline for the experiments in Refs. [19, 21]. As expected, forφ > 0.525 the nucleation rate gradually recovers its grav-ity free value with an increase in φ. The good agreementshows that, at least in principle, nucleation enhanced bygravity-induced density fluctuations is a viable mecha-nism to explain the discrepancy between experimentaland theoretical results.
CONCLUSION
In the previous sections we have considered the in-terplay between sedimentation and crystallization in amodel of colloidal hard spheres. Gravity is a very impor-tant factor that determines the crystallization behaviourin many experimental situations [52]: as we have shown,even density-matched suspensions are characterized byrather small gravitational lengths (see Table II).
The first noticeable effect of gravity is the strong en-hancement of nucleation rates, which is due to the in-crease of the local density in proximity of the walls. Nu-cleation events occur preferentially in regions where, dueto sedimentation, the volume fraction is approximately

15
55−56%, in correspondence of the nucleation rate maxi-mum in bulk hard spheres. In this respect, the nucleationprocess is similar to a homogeneous nucleation event,with similar nucleation rates, and with pre-critical nucleiwhich are on average spherical and have crystal planesrandomly oriented with respect to the direction of grav-ity. The symmetry breaking induced by the gravitationalfield is seen in the growth stage, where a steeper densityprofile (shorter gravitational length) slows down the dy-namics of the growth process, as seen by the reductionof the generalized diffusion coefficient D(n). The bottomside of the nucleus is in contact with a slowly relaxingfluid, while on the opposite side the dynamics is muchfaster, leading to an increase of the average height ofthe center of mass position as the nuclei grow. But thefaster dynamics on the top side of the nucleus is even-tually compensated by a smaller thermodynamic drivingforce to crystallization, due to the decrease of densityalong the z direction. On average thus the nuclei willgrow faster laterally, as shown by the study of the av-erage inertia tensor. As the nuclei grow, they becomeon average more asymmetric, with their principal axisof inertia located along the z axis, which again signalsa faster growth on the x, y plane. An important contri-bution to crystal growth is also the merging of differentnuclei along the x, y plane, as revealed by the distribu-tion of crystal sizes. The orientation of crystalline planesremains isotropic also in the growth stage, as the rota-tional diffusion of nuclei is a slower process compared totheir growth.
We devoted special attention to the study of the effectsof rough walls. By predicting the density profile fromthe equation of state, we were able to prepare walls atthermodynamic conditions close to the nearby fluid, thusminimizing the disturbance introduced by the walls onthe liquid structure. First we determined that the effectsof the walls on the dynamic properties of the fluid van-ish on a length scale comparable to the static correlationlength in the bulk fluid. Close to the walls the dynamicsis greatly slowed down, and a decoupling of lateral andperpendicular diffusion occurs. These dynamic anomaliesare accompanied by a suppression of bond orientationalorder. This is the structural origin of the suppression ofcrystallization close to the walls, and confirms previoussimulations where it was shown that nucleation is mainlycontrolled by the development of bond orientational or-der [33]. Positional order, i.e. density, is instead almostunaffected by the presence of the walls, providing a cleanexample where slowness is linked to many-body correla-tors (like bond-orientational order) and not to two-bodyquantities (like density) [45].
Finally we looked at the experimental results on thecrystallization of hard sphere suspensions in the light ofthe gravitational effects, which we believe do play a ma-jor role in non-density matched samples. We first identi-fied the regime where sedimentation is possibly control-
ling the crystallization behaviour, and showed that den-sity inhomogeneities induced by the gravitational fieldare indeed capable of enhancing the nucleation rate upto the values reported in the literature. However, thereare other non-ideal features in experiments, such as thepresence of effects of shear flow or other hydrodynamiceffects, which our simulations do not take into account.In order to single out unambiguously the mechanism re-sponsible for the discrepancy between simulations andexperiments, experiments with improved density match-ing should be carried out, possibly showing a significantdecrease in the nucleation rates. Already the results ofsome experiments [20, 22, 23, 53] suggest that this mightbe a promising mechanism, and we hope that the presentwork will stimulate more efforts towards this direction.
Appendix: Calculation of Q(l)
For hard spheres Q(l) can be immediately calculatedas follows. τs is given by the Richardson-Zaki expres-sion [54] for hindered settling at low Reynolds numbers:τs = lΞ/G(1 − φ)4.65, where Ξ is the Stokes drag co-efficient and G is the gravitational pull on the colloids.To obtain τx we need an estimate of the nucleation ratek in hard-spheres. This can be calculated within theframework of Classical Nucleation Theory (CNT), wherethe nucleation rate k is simply the product of a kineticterm K and a thermodynamic term U , the former ex-pressing the mobility of the fluid-solid interface, and thelatter accounting for the free energy barrier of forma-tion of a crystal nucleus. For the kinetic term we usethe expression K = ρfZf
+c , where ρf is the density of
the suspending fluid, Z =√β|∆µ|/6πnc is the Zeldovich
factor, and f+c is the attachment rate of particles to the
critical cluster containing nc particles, usually written as
f+c = 24Dn
2/3c /λ. In the previous expressions |∆µ| is
the chemical potential difference between the solid andfluid phase, D is the short-time diffusion coefficient, λ isthe typical distance over which diffusing particles attachto the interface (which we set as a fraction of the parti-cle’s diameter λ = 0.4 d as was determined in Ref. [55]),and β = 1/kBT . The thermodynamic term of the nu-cleation rate is simply given by the free energy barrierof formation of the critical nucleus, U = exp(−β∆Gc).We model the free energy with the CNT expression, cor-rected with a radius (R) dependent interfacial free energyγ(R), namely ∆G = 4πR2γ(1 − ε/R2) − 4πR3ρs|∆µ|/3,where γ and ε are model-dependent constants, and ρs isthe density of the solid phase. In Ref. [56], the valuesβγd2 = 0.741 and ε/d2 = −0.279 were shown to describevery accurately the hard-spheres case. Combining theabove expressions for τs and τx we obtain Q(l) as a func-tion of φ and |∆µ|, which can be further simplified byusing an equation of state |∆µ|(φ), which we derived bya fit to simulation results [13] in the φ-range of interest.

16
Acknowledgements
This work was partially supported by a Grant-in-Aidfor Scientific Research (S) from JSPS, Aihara Project,the FIRST program from JSPS, initiated by CSTP, anda JSPS Postdoctoral Fellowship.
∗ Electronic address: [email protected]† Electronic address: [email protected]‡ Electronic address: [email protected]§ Electronic address: [email protected]
[1] K. Kelton and A. L. Greer, Nucleation in CondensedMatter: Applications in Materials and Biology, Perga-mon, 2010.
[2] T. Palberg, Curr. Opin. Colloid Interface Sci., 1997, 2,607–614.
[3] V. J. Anderson and H. N. W. Lekkerkerker, Nature, 2002,416, 811–815.
[4] S. Auer and D. Frenkel, Adv. Polym. Sci., 2005, 173,149–207.
[5] R. Sear, J. Phys.: Condens. Matter, 2007, 19, 033101.[6] U. Gasser, J. Phys.:Condens. Matter, 2009, 21, 203101.[7] N. C. Karayiannis, K. Foteinopoulou and M. Laso, Int.
J. Mol. Sci., 2012, 14, 332–358.[8] A. Cacciuto, S. Auer and D. Frenkel, Nature, 2004, 428,
404–406.[9] D. Winter, P. Virnau and K. Binder, Phys. Rev. Lett.,
2009, 103, 225703.[10] D. W. Oxtoby, Acc. Chem. Res., 1998, 31, 91–97.[11] S. Auer and D. Frenkel, Nature, 2001, 409, 1020–1023.[12] E. Zaccarelli, C. Valeriani, E. Sanz, W. C. K. Poon,
M. E. Cates and P. N. Pusey, Phys. Rev. Lett., 2009,103, 135704.
[13] L. Filion, M. Hermes, R. Ni and M. Dijkstra, J. Chem.Phys., 2010, 133, 244115.
[14] T. Kawasaki and H. Tanaka, Proc. Nat. Acad. Sci.U.S.A., 2010, 107, 14036.
[15] P. N. Pusey, E. Zaccarelli, C. Valeriani, E. Sanz, W. C. K.Poon and M. E. Cates, Philos. T. R. Soc. A, 2009, 367,4993–5011.
[16] L. Filion, R. Ni, D. Frenkel and M. Dijkstra, J. Chem.Phys., 2011, 134, 134901.
[17] T. Schilling, S. Dorosz, H. J. Schope and G. Opletal, J.Phys.: Condens. Matter, 2011, 23, 194120.
[18] C. Valeriani, E. Sanz, P. N. Pusey, W. C. K. Poon, M. E.Cates and E. Zaccarelli, Soft Matter, 2012, 8, 4960.
[19] K. Schatzel and B. J. Ackerson, Phys. Rev. E, 1993, 48,3766.
[20] J. L. Harland and W. Van Megen, Phys. Rev. E, 1997,55, 3054.
[21] C. Sinn, A. Heymann, A. Stipp and T. Palberg, Prog.Coll. Pol. Sci. S, 2001, 266–275.
[22] S. Iacopini, T. Palberg and H. J. Schope, J. Chem. Phys.,2009, 130, 084502.
[23] M. Franke, A. Lederer and H. J. Schope, Soft Matter,2011, 7, 11267–11274.
[24] M. P. Hobson, G. P. Efstathiou and A. N. Lasenby, Gen-eral relativity: an introduction for physicists, Cambridge
University Press, 2006.
[25] S. M. Underwood, J. R. Taylor and W. Van Megen, Lang-muir, 1994, 10, 3550–3554.
[26] J. D. Weeks, D. Chandler and H. C. Andersen, J. Chem.Phys., 1971, 54, 5237–5247.
[27] M. Allen and D. Tildesley, Computer Simulation of Liq-uids, Oxford university press, 1989, vol. 18.
[28] R. Piazza, T. Bellini and V. Degiorgio, Phys. Rev. Lett.,1993, 71, 4267–4270.
[29] P. Scheidler, W. Kob and K. Binder, EPL, 2002, 59, 701.[30] P. Scheidler, W. Kob and K. Binder, J. Phys. Chem. B,
2004, 108, 6673–6686.[31] P. J. Steinhardt, D. R. Nelson and M. Ronchetti, Phys.
Rev. B, 1983, 28, 784–805.[32] S. Auer and D. Frenkel, J. Chem. Phys., 2004, 120, 3015–
3029.[33] J. Russo and H. Tanaka, Sci. Rep., 2012, 2, 505.[34] S. Auer and D. Frenkel, Nature, 2001, 409, 1020–1023.[35] I. Volkov, M. Cieplak, J. Koplik and J. R. Banavar, Phys.
Rev. E, 2002, 66, 061401.[36] J. P. Hoogenboom, P. Vergeer and A. van Blaaderen, J.
Chem. Phys., 2003, 119, 3371.[37] A. Mori, S. Yanagiya, Y. Suzuki, T. Sawada and K. Ito,
Sci. Technol. Adv. Mat., 2006, 7, 296–302.[38] M. Marechal and M. Dijkstra, Phys. Rev. E, 2007, 75,
061404.[39] I. B. Ramsteiner, K. E. Jensen, D. A. Weitz and
F. Spaepen, Phys. Rev. E, 2009, 79, 011403.[40] E. Allahyarov and H. Lowen, EPL, 2011, 95, 38004.[41] K. Watanabe, T. Kawasaki and H. Tanaka, Nat. Mater.,
2011, 10, 512–520.[42] J. Russo and H. Tanaka, Soft Matter, 2012, 8, 4206–4215.[43] W. Kob, S. Roldan-Vargas and L. Berthier, Nat. Phys.,
2012, 8, 164–167.[44] P. Liu, E. Harder and B. J. Berne, J. Phys. Chem. B,
2004, 108, 6595–6602.[45] M. Leocmach, J. Russo and H. Tanaka, J. Chem. Phys.,
2013, 138, 12A536.[46] H. Tanaka, T. Kawasaki, H. Shintani and K. Watanabe,
Nature Mater., 2010, 9, 324–331.[47] H. Tanaka, Eur. Phys. J E, 2012, 35, 113.[48] M. Leocmach and H. Tanaka, Nat. Commun., 2012, 3,
974 doi:10.1038/ncomms1974.[49] J. Wedekind and D. Reguera, J. Phys. Chem. B, 2008,
112, 11060–11063.[50] E. Sanz, C. Valeriani, E. Zaccarelli, W. C. K. Poon, P. N.
Pusey and M. E. Cates, Phys. Rev. Lett., 2011, 106,215701.
[51] C. P. Royall, W. C. Poon and E. R. Weeks, Soft Matter,2013, 9, 17–27.
[52] J. Zhu, M. Li, R. Rogers, W. Meyer, R. Ottewill, W. Rus-sel, P. Chaikin et al., Nature, 1997, 387, 883–885.
[53] J. Taffs, S. R. Williams, H. Tanaka and C. P. Royall, SoftMatter, 2013, 9, 297–305.
[54] J. F. Richardson and W. N. Zaki, Trans. Inst. Chem.Eng., 1954, 32, 35–53.
[55] S. Auer and D. Frenkel, Annu. Rev. Phys. Chem., 2004,55, 333–361.
[56] S. Prestipino, A. Laio and E. Tosatti, Phys. Rev. Lett.,2012, 108, 225701.
Copyright © 2022 FDOKUMEN