Crossflow membrane filtration of interacting nanoparticle suspensions
12
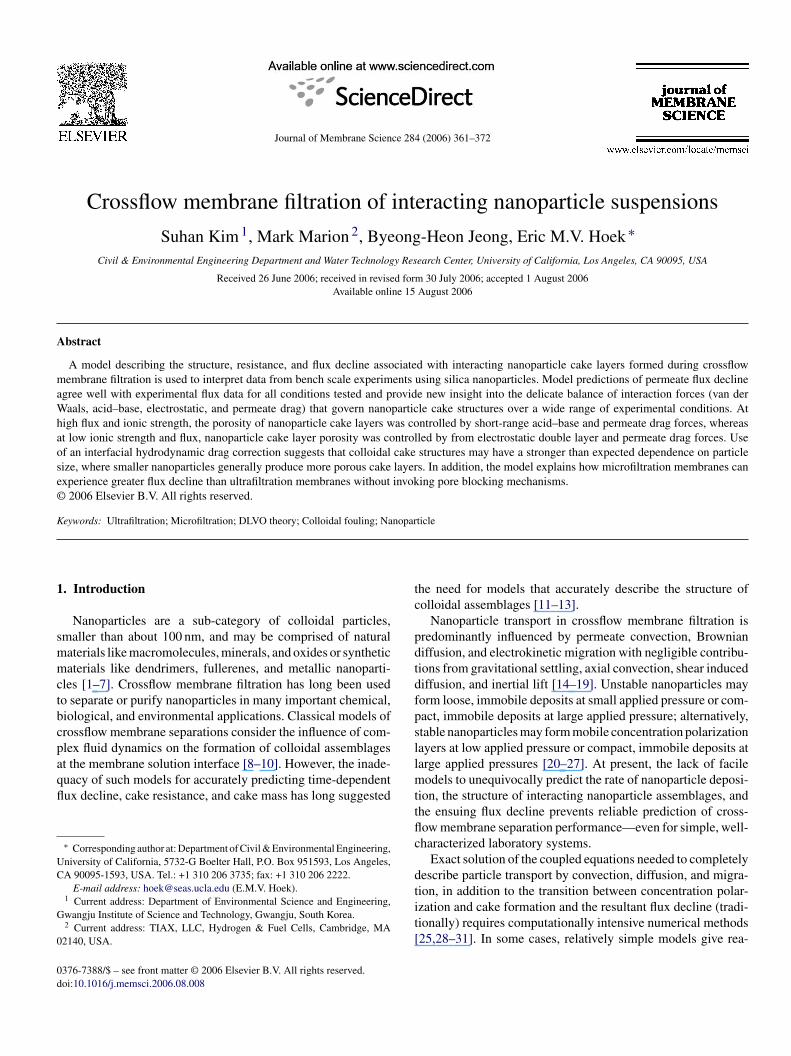
Journal of Membrane Science 284 (2006) 361–372 Crossflow membrane filtration of interacting nanoparticle suspensions Suhan Kim 1 , Mark Marion 2 , Byeong-Heon Jeong, Eric M.V. Hoek ∗ Civil & Environmental Engineering Department and Water Technology Research Center, University of California, Los Angeles, CA 90095, USA Received 26 June 2006; received in revised form 30 July 2006; accepted 1 August 2006 Available online 15 August 2006 Abstract A model describing the structure, resistance, and flux decline associated with interacting nanoparticle cake layers formed during crossflow membrane filtration is used to interpret data from bench scale experiments using silica nanoparticles. Model predictions of permeate flux decline agree well with experimental flux data for all conditions tested and provide new insight into the delicate balance of interaction forces (van der Waals, acid–base, electrostatic, and permeate drag) that govern nanoparticle cake structures over a wide range of experimental conditions. At high flux and ionic strength, the porosity of nanoparticle cake layers was controlled by short-range acid–base and permeate drag forces, whereas at low ionic strength and flux, nanoparticle cake layer porosity was controlled by from electrostatic double layer and permeate drag forces. Use of an interfacial hydrodynamic drag correction suggests that colloidal cake structures may have a stronger than expected dependence on particle size, where smaller nanoparticles generally produce more porous cake layers. In addition, the model explains how microfiltration membranes can experience greater flux decline than ultrafiltration membranes without invoking pore blocking mechanisms. © 2006 Elsevier B.V. All rights reserved. Keywords: Ultrafiltration; Microfiltration; DLVO theory; Colloidal fouling; Nanoparticle 1. Introduction Nanoparticles are a sub-category of colloidal particles, smaller than about 100 nm, and may be comprised of natural materials like macromolecules, minerals, and oxides or synthetic materials like dendrimers, fullerenes, and metallic nanoparti- cles [1–7]. Crossflow membrane filtration has long been used to separate or purify nanoparticles in many important chemical, biological, and environmental applications. Classical models of crossflow membrane separations consider the influence of com- plex fluid dynamics on the formation of colloidal assemblages at the membrane solution interface [8–10]. However, the inade- quacy of such models for accurately predicting time-dependent flux decline, cake resistance, and cake mass has long suggested ∗ Corresponding author at: Department of Civil & Environmental Engineering, University of California, 5732-G Boelter Hall, P.O. Box 951593, Los Angeles, CA 90095-1593, USA. Tel.: +1 310 206 3735; fax: +1 310 206 2222. E-mail address: [email protected] (E.M.V. Hoek). 1 Current address: Department of Environmental Science and Engineering, Gwangju Institute of Science and Technology, Gwangju, South Korea. 2 Current address: TIAX, LLC, Hydrogen & Fuel Cells, Cambridge, MA 02140, USA. the need for models that accurately describe the structure of colloidal assemblages [11–13]. Nanoparticle transport in crossflow membrane filtration is predominantly influenced by permeate convection, Brownian diffusion, and electrokinetic migration with negligible contribu- tions from gravitational settling, axial convection, shear induced diffusion, and inertial lift [14–19]. Unstable nanoparticles may form loose, immobile deposits at small applied pressure or com- pact, immobile deposits at large applied pressure; alternatively, stable nanoparticles may form mobile concentration polarization layers at low applied pressure or compact, immobile deposits at large applied pressures [20–27]. At present, the lack of facile models to unequivocally predict the rate of nanoparticle deposi- tion, the structure of interacting nanoparticle assemblages, and the ensuing flux decline prevents reliable prediction of cross- flow membrane separation performance—even for simple, well- characterized laboratory systems. Exact solution of the coupled equations needed to completely describe particle transport by convection, diffusion, and migra- tion, in addition to the transition between concentration polar- ization and cake formation and the resultant flux decline (tradi- tionally) requires computationally intensive numerical methods [25,28–31]. In some cases, relatively simple models give rea- 0376-7388/$ – see front matter © 2006 Elsevier B.V. All rights reserved. doi:10.1016/j.memsci.2006.08.008
Transcript of Crossflow membrane filtration of interacting nanoparticle suspensions
A
maWhaose©
K
1
smmctbcpaqfl
UC
G
0
0d
Journal of Membrane Science 284 (2006) 361–372
Crossflow membrane filtration of interacting nanoparticle suspensions
Suhan Kim 1, Mark Marion 2, Byeong-Heon Jeong, Eric M.V. Hoek ∗Civil & Environmental Engineering Department and Water Technology Research Center, University of California, Los Angeles, CA 90095, USA
Received 26 June 2006; received in revised form 30 July 2006; accepted 1 August 2006Available online 15 August 2006
bstract
A model describing the structure, resistance, and flux decline associated with interacting nanoparticle cake layers formed during crossflowembrane filtration is used to interpret data from bench scale experiments using silica nanoparticles. Model predictions of permeate flux decline
gree well with experimental flux data for all conditions tested and provide new insight into the delicate balance of interaction forces (van deraals, acid–base, electrostatic, and permeate drag) that govern nanoparticle cake structures over a wide range of experimental conditions. At
igh flux and ionic strength, the porosity of nanoparticle cake layers was controlled by short-range acid–base and permeate drag forces, whereast low ionic strength and flux, nanoparticle cake layer porosity was controlled by from electrostatic double layer and permeate drag forces. Use
f an interfacial hydrodynamic drag correction suggests that colloidal cake structures may have a stronger than expected dependence on particleize, where smaller nanoparticles generally produce more porous cake layers. In addition, the model explains how microfiltration membranes canxperience greater flux decline than ultrafiltration membranes without invoking pore blocking mechanisms.2006 Elsevier B.V. All rights reserved.
nopar
tc
pdtdfpsl
eywords: Ultrafiltration; Microfiltration; DLVO theory; Colloidal fouling; Na
. Introduction
Nanoparticles are a sub-category of colloidal particles,maller than about 100 nm, and may be comprised of naturalaterials like macromolecules, minerals, and oxides or syntheticaterials like dendrimers, fullerenes, and metallic nanoparti-
les [1–7]. Crossflow membrane filtration has long been usedo separate or purify nanoparticles in many important chemical,iological, and environmental applications. Classical models ofrossflow membrane separations consider the influence of com-lex fluid dynamics on the formation of colloidal assemblages
t the membrane solution interface [8–10]. However, the inade-uacy of such models for accurately predicting time-dependentux decline, cake resistance, and cake mass has long suggested∗ Corresponding author at: Department of Civil & Environmental Engineering,niversity of California, 5732-G Boelter Hall, P.O. Box 951593, Los Angeles,A 90095-1593, USA. Tel.: +1 310 206 3735; fax: +1 310 206 2222.
E-mail address: [email protected] (E.M.V. Hoek).1 Current address: Department of Environmental Science and Engineering,wangju Institute of Science and Technology, Gwangju, South Korea.2 Current address: TIAX, LLC, Hydrogen & Fuel Cells, Cambridge, MA2140, USA.
lmttflc
dtit[
376-7388/$ – see front matter © 2006 Elsevier B.V. All rights reserved.oi:10.1016/j.memsci.2006.08.008
ticle
he need for models that accurately describe the structure ofolloidal assemblages [11–13].
Nanoparticle transport in crossflow membrane filtration isredominantly influenced by permeate convection, Brownianiffusion, and electrokinetic migration with negligible contribu-ions from gravitational settling, axial convection, shear inducediffusion, and inertial lift [14–19]. Unstable nanoparticles mayorm loose, immobile deposits at small applied pressure or com-act, immobile deposits at large applied pressure; alternatively,table nanoparticles may form mobile concentration polarizationayers at low applied pressure or compact, immobile deposits atarge applied pressures [20–27]. At present, the lack of facile
odels to unequivocally predict the rate of nanoparticle deposi-ion, the structure of interacting nanoparticle assemblages, andhe ensuing flux decline prevents reliable prediction of cross-ow membrane separation performance—even for simple, well-haracterized laboratory systems.
Exact solution of the coupled equations needed to completelyescribe particle transport by convection, diffusion, and migra-
ion, in addition to the transition between concentration polar-zation and cake formation and the resultant flux decline (tradi-ionally) requires computationally intensive numerical methods25,28–31]. In some cases, relatively simple models give rea-
3 brane
seoc0m7tsdico
iwompm[sotaahc
nstiseciPnfibFtidfl
lttcaaddtt
lvvccflTpioa
2
2
magcdi
wlp
i
v
wciota
td
wc(r
62 S. Kim et al. / Journal of Mem
onable predictions of permeate flux decline with time. Forxample, Hong et al. [26] assumed a constant cake layer porosityf 0.36 (i.e., maximum random packing) for silica nanoparti-les; however, average cake layer porosities ranged from 0.35 to.40 and cake porosity changed over the course of their experi-ents. Faibish et al. [27] observed cake layer porosities of up to
0% during crossflow ultrafiltration of silica nanoparticles dueo strong electrostatic repulsion at the lower fluxes and ionictrengths considered. Hence, the assumption of maximum ran-om packing may not be adequate when inter-particle repulsions comparable to permeate drag. Further, assuming the specificake resistance is constant with time can cause over estimationf permeate flux decline.
Hwang et al. [19] presented a model to predict cake poros-ty and flux decline by combining a sphere-in-cell drag modelith the Derjaguin–Landau–Verwey–Overbeek (DLVO) the-ry of colloid stability [32,33]. Model predictions qualitativelyatched experimental results. A key to the reasonable model
redictions was the use of an interfacial correction for the per-eate drag experienced by particles near the membrane surface
34]. Brant and Childress [35] demonstrated the importance ofhort-range, Lewis acid–base interactions on colloidal foulingf polymeric membranes. The inclusion of acid–base interac-ions with van der Waals and electrostatic interactions is knowns “extended DLVO” or “XDLVO” theory. We recently appliedmodel coupling interfacial drag, lift, and XDLVO forces to
elp interpret particle deposition rates observed in an opticalrossflow membrane filter [36,37].
In this paper, we present a model that considers hydrody-amic and colloidal (XDLVO) forces in predicting the transienttructure, resistance, and flux during crossflow membrane fil-ration of silica nanoparticle suspensions. A key assumptionn the model is that particle accumulation at the membrane-uspension (or cake-suspension) interface is effectively gov-rned by permeate convection. This implies that the nanoparticleoncentration polarization (CP) layer quickly collapses into anmmobile cake, which governs permeate flux decline with time.ast studies suggest shear-induced diffusion and inertial lift doot influence nanoparticle deposition in crossflow membraneltration and that particle concentration polarization is negligi-le for particles larger than about 10–20 nm [9,14,15,24,26,38].urther, it has been shown that electrokinetic migration—due
o (initially) particle–membrane and (later) particle–particlenteractions—does not significantly influence the net particleeposition rate at permeate fluxes in large excess of a criticalux [18,26,27,30,39–41].
Nanoparticle deposition, inter-particle interaction, and cakeayer structure models are combined with the classic cake filtra-ion model to predict permeate flux decline with time. Predictinghe flux at each time step begins with determination of the netompressive force across the nanoparticle cake layer, which isfunction of permeate drag and inter-particle XDLVO inter-
ctions. At each time step, an average inter-particle separation
istance is derived from the balance of forces. This separationistance is used to calculate the average cake layer porosityhrough a sphere-in-cell cake model, which in turn describes theime-dependent specific cake resistance. The increase in cakedt
τ
Science 284 (2006) 361–372
ayer thickness over each time step is predicted from the con-ective mass flux (i.e., the product of the transient permeateelocity and the ratio of particle feed concentration to particleake concentration). Transient cake layer thickness and specificake resistance are both influenced by the transient permeateux, and the permeate flux declines as cake resistance increases.hus, an iterative solution is applied to describe these coupledhenomena. A matrix of bench-scale membrane filtration exper-ments are used as the basis for model calculations across a rangef operating conditions, membrane and nanoparticle properties,nd solution chemistries.
. Theoretical
.1. Cake formation and flux decline
Beginning with a two-dimensional convective–diffusiveass balance, a number of researchers have derived a rel-
tively simple expression to describe colloidal cake layerrowth in deadend and crossflow membrane filtration pro-esses [26,31,42]. Following the simplified theoretical methodsescribed in these past studies, a particle mass balance equations obtained:
dδc
dt= v
(φb
φc − φb
), (1)
here v is the permeate velocity (flux), t the time, δc the cakeayer thickness, and φc and φb are the solid volume fractions ofarticles in the cake layer and in the bulk [31].
Permeate flux decline (due to colloidal cake layer formation)s described by a Darcy type expression of the form:
= �p
µ(Rm + rcδc), (2)
here �p is the applied hydraulic pressure, µ the solution vis-osity, Rm the intrinsic membrane hydraulic resistance, and rcs the specific cake layer hydraulic resistance [27]. The productf the specific cake resistance and cake layer thickness provideshe apparent cake layer hydraulic resistance, Rc (=rcδc), and isssumed the sole mechanism for permeate flux decline.
Combining Eqs. (1) and (2) and integrating with respect toime results in an equation that describes the permeate fluxecline associated with the formation of a colloidal cake layer:
v
v0=
(1 + t
τ
)−1/2, (3a)
1
τ= 2φb
φc − φb
rcv0
Rm, (3b)
here v0 (=�p/µRm) is the initial permeate velocity and τ is theharacteristic time for cake layer growth [43]. In arriving at Eqs.3), �pm, µ, Rm, φb, φc, and rc were all assumed constant withespect to time; hence, the growing cake layer thickness alone
etermines the increase of cake resistance and flux decline withime.This cake filtration model is typically used to obtain a fitted-value by linear regression of experimental flux data plotted

brane Science 284 (2006) 361–372 363
aeprEic
2
rbr
r
w(Krac
r
Ci
Tpce
2
amcp
�
HitT
Fo
c
A
wTc
N
Tpo
p
r
Ci
1 −Hwdtbp
2
K
S. Kim et al. / Journal of Mem
s (v0/v)2 against t. Regression analysis of this plot gives anquation with intercept of 1 and slope of τ−1. Another usefularameter is the “fouling half-life,” t1/2 (=3τ), which is the timeequired for the flux to reach 50% of its starting value. Finally,qs. (3) can be used to predict permeate flux decline with time
f the specific resistance is known [26,27]. Hence, the modelinghallenge is to accurately predict the specific cake resistance.
.2. “Kozeny–Carman” specific cake resistance
The specific (thickness independent) cake layer hydraulicesistance associated with particle assemblages can be describedy the Kozeny–Carman (KC) equation [31]. The specific cakeesistance, rKC, is
KC = KS2 φ2c
(1 − φc)3 , (4)
here K is the Kozeny constant, S the specific surface area=AV−1), and φc = 1 − εc, where εc is the cake porosity. Theozeny constant, K, is assumed equal to 5.0 over the porosity
ange of 0.26–0.8 for spherical particles. The specific surfacerea, S, is 3a−1
p for spherical particles [44]. Therefore, the spe-ific cake resistance becomes:
KC = 45φ2c
a2p(1 − φc)3 = 45(1 − εc)2
a2pε
3c
. (5)
ombining Eq. (5) with Eqs. (3) and assuming φc � φb, resultsn a solution for the Kozeny–Carman cake layer time constant:
1
τKC= 90φbv0
a2pRm
[1 − εc
ε3c
]. (6)
herefore, if the bulk particle concentration, particle size, initialermeate flux, and intrinsic membrane resistance are known onean obtain the Kozeny–Carman fitted cake layer porosity fromxperimental flux decline data.
.3. “Happel cell” specific cake resistance
The specific hydraulic resistance associated with particlessemblages can also be modeled through a sphere-in-cell dragodel [24,25]. A representative illustration of the sphere-in-
ell approach is provided in Fig. 1. According to this model, theressure drop across a colloidal assemblage is [26]:
pc = vfStAsNp = vµrcδc. (7)
1
τHC= 9φbv0
a2pRm
As = 9φbv0
a2pRm
[
ere, fSt (=6πµap) is the Stokes frictional drag coefficient for ansolated particle and As is a correction function accounting forhe effect of neighboring particles on the frictional resistance.he correction function, As, evaluated from Happel’s sphere-in-
cotp
ig. 1. Conceptual model of nanoparticle cake layer structure and the meaningf the “minimum inter-particle separation.”
ell model is
s = 1 + (2/3)θ5
1 − (3/2)θ + (3/2)θ5 − θ6 , (8)
here θ (= 3√
1 − εc) is a porosity dependent variable [44,45].he total number of particles (per unit area) accumulated in theake layer, Np, is determined from:
p = 3φc
4πa3pδc. (9)
he variable drag correction parameter, As, gives rise to theossibility of a variable cake structure, or porosity, dependingn the transient permeate velocity.
Combining Eqs. (7)–(9) provides an expression for the Hap-el cell (HC) model specific cake resistance:
HC = 9Asφc
2a2p
= 9As(1 − εc)
2a2p
. (10)
ombining Eq. (10) with Eqs. (3) and assuming φc � φb, resultsn a solution for the Happel cell cake layer inverse time constant:
1 + (2/3)(1 − εc)5/3
(3/2)(1 − εc)1/3 + (3/2)(1 − εc)5/3 − (1 − εc)2
]. (11)
ere, the term in brackets is Happel’s correction function, As,ith the definition of θ substituted to indicate the functionalependence of τHC on the cake porosity. Again, if bulk concen-ration, particle size, initial permeate flux, and intrinsic mem-rane resistance are known, the Happel cell model fitted cakeorosity can be determined experimentally.
.4. Cake layer structure
The sole difference between the Happel cell andozeny–Carman specific cake resistance models is the fixed
ake structure in the KC model, embodied by the assumed valuef 5.0 for the Kozeny constant, and the variable cake structure inhe HC model. Using a sphere-in-cell model with random close-acked structure, the porosity of a colloidal cake layer can be
3 brane
d
ε
wts
modwoidpfad
flfi
rbmcccad
F
wcf
aaimc
h
wmcr
Gtp
icaw
F
F
F
H(ai
γLWw
(2√apptpt
sis depicted in Fig. 2. At large separations, the permeate dragdominates, but at small separations colloidal forces are compa-rable to permeate drag. In the scenario depicted, van der Waalsinteractions are attractive, but both electrostatic and acid–base
64 S. Kim et al. / Journal of Mem
escribed by
c = 1 − φmax
(2ap
2ap + heq
)3
, (12)
hereφmax is the maximum cake concentration and heq is termedhe equilibrium or minimum inter-particle separation betweenurfaces of neighboring particles [19].
The cake structure model is semi-empirical because theaximum cake concentration, φmax, cannot be predicted with-
ut assuming a theoretical packing structure. Maximum ran-om packing for monodisperse, non-interacting spheres is 0.64,hereas monodisperse, interacting spheres can produce morerdered structures and higher concentrations [46]. However,n most real systems the packing structure may not be wellescribed because particles are not perfectly spherical, monodis-erse, and smooth. Since there is no satisfactory theoretical basisor selecting a priori a specific ordered structure, we eitherssume a maximum cake concentration of 0.64 to enable pre-iction of cake porosity, specific cake resistance, and permeate
ux decline, or we treat the maximum cake concentration as atting parameter.
The net force influencing the minimum inter-particle sepa-ation between particles in the cake layer is determined from aalance of interfacial hydrodynamic and colloidal forces. Theost obvious force is the permeate drag (PD) force, which is
onventionally described by Stokes drag with a sphere-in-cellake structure model. In our model, an interfacial hydrodynamicorrection factor is also applied [34], such that the total perme-te drag force on a colloidal particle within the cake layer isetermined from:
PD = −vwfStAsfG, (13)
hich accounts for Stokes’ drag, fst (=6πµap), Happel’s dragorrection given in Eq. (8), and an interfacial drag correction,G, originally described by Goren [34].
Goren’s interfacial correction is a complex function thatccounts for the increased drag on a particle as it approachespermeable interface (e.g., a membrane). The correction factor
s unity at infinite separation, but as a particle approaches theembrane the correction factor increases sharply, converging at
ontact to
lim→0
fG(h) =[
2Rtap
3+ (1.072)2
]1/2
, (14)
�GLWlwl
[= 2
(√γLW
w −√
γLWl
) (√γLW
l −√
�GABlwl
[= 2
√γ+
w
(2√
γ−l −
√γ−
w
)+ 2
√γ−
w
here Rt is the total hydraulic resistance offered by the per-eable surface, which is Rt = Rm + Rc for the membrane and
ake layer. The correction function, fG, increases with hydraulicesistance and particle size. Using tabulated data provided in
Fai
Science 284 (2006) 361–372
oren [34], we developed a method of numerically reproducinghe interfacial hydrodynamic correction for any combination ofarticle size, membrane resistance, and separation distance [36].
Forces that determine the stability of colloidal particlesn a suspension also determine the structure of nanoparticleake layers. These include Lifshitz–van der Waals (LW), Lewiscid–base (AB), and electrostatic double layer (EL) forces,hich can be determined from:
LW = πh20ap�GLW
lwl
(1
h2
) (1 + 5.32h
λLW
)−1
, (15)
AB = πap�GABlwl exp
(−h0 − h
λAB
), (16)
EL = 2πap�GELlwl exp
(− h
λEL
). (17)
ere, λLW (=100 nm), λAB (=0.6 nm), and λEL=3.05 × 10⁻¹⁰ c−1/2 with c in moles per liter) are char-cteristic interaction decay lengths; h0 represents the minimumnterfacial separation distance (=0.158 nm):)
= AH
12πh20
],
γ+l −
√γ+
w
)− 4
√γ−
l γ+l
]and �GEL
lwl[= εwζ2pλ−1
EL]
re the interfacial free energies at contact, εw is the dielectricermittivity of water (=6.95 × l0−10 C V−1 m−1), and ζp is thearticle zeta potential [37]. Individual surface tension parame-ers for particles (γLW, γ−
1 and γ+1 ) are determined via multiple
robe-liquid contact angle analysis, while the particle zeta poten-ial is determined from particle electrophoresis [47,48].
All of the interfacial forces considered vary with inter-particleeparation distance. The variation with separation of each force
ig. 2. Representative inter-particle force profiles, including van der Waals,cid–base, electrical double layer, and permeate drag forces, plotted againstnter-particle separation.

brane
ice∑
fsFOEcpns
2
diifc
Faf
Tnlit
ri(FE(tipt
rusi
S. Kim et al. / Journal of Mem
nteractions are repulsive (i.e., a hydrophilic, charged nanoparti-le). Theoretically, a minimum inter-particle separation distancexists, where the sum of all forces balance such that
F (h) = FPD(h) + FLW(h) + FAB(h) + FEL(h) = 0. (18)
Neglecting inertial effects, the separation distance at which allorces sum to zero represents the average minimum inter-particleeparation between neighboring particles, heq. Therefore, inig. 2 the minimum inter-particle separation is about 1.3 nm.nce heq is known, the cake layer porosity, determined fromq. (12), can be used to calculate the specific resistance of theake layer from Eq. (10) and the flux from Eq. (2). For constantressure operation, the flux will decline with time; hence, theet compressive force decreases and the minimum inter-particleeparation (cake porosity) increases with time.
.5. Numerical procedure for predicting flux decline
Fig. 3 illustrates the iterative solution algorithm used to pre-ict the transient flux at each time step (t = tn). The flux at the
nitial time step, n = 0, is the initial flux, v0, which is known. Anteration begins by using the initial flux and an arbitrary valueor cake concentration as the initial value for flux and cake con-entration at the next time step, v(tl) and φ (tl), respectively.ig. 3. Iterative numerical procedure for predicting minimum inter-particle sep-ration, cake layer porosity, and permeate flux decline using the inter-particleorce balance approach.
rcefipp
3
3
Mba2SipssfS
mmieIitra
d(
Science 284 (2006) 361–372 365
hese flux and cake concentration values are used to calculateet compressive drag force from Eq. (18) and the particle depositayer thickness from Eq. (2) at the next time step. The integraln Eq. (1) is solved numerically using the trapezoidal rule withhe initial value of permeate flux.
The next step is to find the minimum inter-particle sepa-ation between two neighboring particles from the balance ofnter-particle forces and the cake porosity, calculated from Eq.12), which defines the specific cake resistance through Eq. (10).inally, the resultant permeate flux, v′
w(tn), is calculated fromq. (2) using δc(tn) and rc(tn), and then compared to the initial
assumed) value of vw(tn). If the two flux data differ by morehan 10−6, v′
w(tn) replaces the initial value and the entire loops repeated until the specified tolerance is met. The iterativerocedure is repeated at each additional time step to produce aransient permeate flux.
For a given combination of operating conditions, membraneesistance, particle properties, and solution chemistry, the onlynknown parameter is maximum cake concentration, φmax. Inome cases, the permeate flux is predicted with an assumed max-mum cake concentration (φmax = 0.64) and then compared witheal (experimental) flux data. In other cases, the maximum cakeoncentration is used as a fitting parameter to minimize the totalrror between predicted fluxes and experimental flux data. Thetted maximum cake concentrations obtained from the modelrovide insight into the structure of non-ideal, i.e., non-spherical,olydispere, and rough, interacting nanoparticle assemblages.
. Experimental
.1. Colloidal particles and membranes
Two suspensions of amorphous silica colloids (ST20L andP1040, Nissan Chemicals, Tarrytown, NY) were used in mem-
rane filtration experiments. The sizes and densities of ST20Lnd MP1040 reported by the manufacturer were 40–50 nm and280 kg m−3 and 100 ± 30 nm and 2317 kg m−3, respectively.canning electron microscope (SEM, Hitachi S4700, Japan)
maging was used to determine the nanoparticle size, shape, andolydispersity. Silica nanoparticles were dispersed in ethanol byonication in a heated bath for 30 min. The nanoparticle suspen-ion was then deposited on carbon conductive tabs, dried in airor 1 h, and sputter coated with a mixture of gold and palladium.EM images were obtained at an accelerating voltage of 10 kV.
Hydrodynamic diameters of ST-20L and MP1040 were deter-ined by dynamic light scattering (BI90, Brookhaven Instru-ents Corp., Holtsville, NY, USA) after dispersing the particles
n deionized water. Particle zeta potentials were obtained fromlectrophoretic mobility measurements (ZetaPals, Brookhavennstruments Corp., Holtsville, NY, USA) for particles dispersedn NaCl (reagent grade, Fisher Scientific, Pittsburgh, PA) solu-ions of varied ionic strength and unadjusted pH. Previouslyeported surface tension parameters were used to calculate LW
nd AB interfacial free energies for the silica colloids [35].A microfiltration (MF) and an ultrafiltration (UF) membrane,enoted as PLCMK (Millipore, Billerica, MA, USA) and MX50GE-Osmonics, Minneatonka, MN, USA), respectively, were

366 S. Kim et al. / Journal of Membrane Science 284 (2006) 361–372
cale c
uts1iiwmafMomos
3
imaT6mmflammcUltsmaPmCmr
cmbatrb
v
wseosr
d(ssDtto
4
4
mMhfdp
Fig. 4. Schematic diagram of bench s
sed in filtration experiments. Upon receipt from the manufac-urer, residual preservative agents were removed from membraneurfaces by soaking coupons in a 60% ethanol solution for2 h, followed by 12 h of soaking in deionized water. Soak-ng in ethanol was repeated and then membranes were storedn deionized water at 5 ◦C with the water replaced every 2eeks. According to the manufacturers, MX50 membranes areade from polyacrylonitrile (PAN) and modified to possesshigh energy (hydrophilic) surface, while PLCMK are made
rom composite regenerated cellulose. The manufacturers ratedX50 and PLCMK to have a nominal molecular weight cut-
ffs of 70 and 300 kDa, respectively. Hydraulic resistances ofembranes were determined by performing a linear regression
f experimental applied pressure and electrolyte flux data at thetart of each experiment.
.2. Crossflow membrane filtration experiments
The experimental crossflow membrane filtration system isllustrated in Fig. 4. The filtration module was designed and
achined on site to have crossflow channel dimensions of 12.7nd 2.54 cm (5.0 and 1.0 in.) for length and width, respectively.wo top plates were machined with flow channel heights of.4 and 3.2 mm (0.25 and 0.125 in.). The retentate flow rate waseasured by a floating disk rotameter (Model 7510, King Instru-ent Co., Garden Grove, California) attached to the retentateow line. Applied trans-membrane pressure was measured byn analog pressure gage (EW-68833–84, Cole-Parmer Instru-ent Company; Vernon Hills, IL) connected at the inlet of theembrane module. The flow rate and pressure were accurately
ontrolled using a back-pressure regulator (2440, 0–60 psig,.S. Para Plate Corporation; Corona, California) on the retentate
ine and a by-pass valve on the feed line. Temperature was main-ained constant at 25 ◦C by re-circulating chilled water through atainless-steel coil immersed in the feed tank. The steel coil wasachined onsite. Chilled water temperature was controlled byrecirculating heater/chiller (Neslab RTE-7, Fisher Scientific;ittsburgh, PA). Permeate flow was measured in by a digital flow
eter (Optiflow 1000, Agilent Technologies, Inc., Palo Alto,A) and recorded directly to a laboratory PC in real time. Per-eate flow was converted to flux by dividing the volumetric flowate by membrane area (32.3 cm2).
tdso
rossflow membrane filtration system.
Before each experiment, the filtration system was thoroughlyleaned and repeatedly rinsed with deionized water. A sample ofembrane was then placed in the filtration cell and conditioned
y filtering a particle-free electrolyte solution for one hour toccount for membrane compaction and to ensure stable condi-ions. After a stable flux was achieved, permeate fluxes wereecorded for a range of applied pressures. The intrinsic mem-rane resistance was then determined according to
0 = �p
µRm, (19)
here Rm was determined from linear regression of the mea-ured fluxes and pressures assuming the solution viscosity wasqual to that of water at 25 ◦C (0.00089 Pa s). Measuring the fluxf an electrolyte solution allows incorporation of non-idealitiesuch as electro-viscous effects into the membrane hydraulicesistance term [49].
A number of filtration experiments were conducted withifferent feed particle concentration, initial permeate fluxi.e., applied pressure), crossflow velocity, particle size, ionictrength, and membrane type (MF/UF). Solution pH was con-tant for all experiments at an unadjusted value of 5.8 ± 0.2.uring filtration experiments, pH, conductivity, and turbidity of
he feed and permeate solutions were monitored continuouslyo ensure the system was stable and to verify complete rejectionf nanoparticles by the membranes.
. Results and discussion
.1. Nanoparticle and membrane properties
Average intrinsic membrane hydraulic resistances were deter-ined to be ∼2 × l011 and ∼9 × l011 m−1 for PLCMK andX50, respectively. At the same flux, the higher intrinsic
ydraulic resistance of MX50 produces a greater permeate dragorce on nanoparticles via the Goren interfacial drag correctionescribed in Eq. (14). Table 1 provides the silica nanoparticlehysicochemical properties including particle size, zeta poten-
ial, Lifshitz–van der Waals, Lewis acid–base, and electrostaticouble layer interfacial free energy at contact used in modelimulations. Nanoparticles exhibit average hydrodynamic radiif 34 and 60 nm in deionized water as well as in NaCl solutions
S. Kim et al. / Journal of Membrane Science 284 (2006) 361–372 367
Table 1Phvsicochemical Drooerties of nanooarticles
apa (nm) �0.1
b (mV) �10b (mV) �100
b (mV) �GLW (mJ/m2) �GAB (mJ/m2) �GEL0.1 (mJ/m2)c �GEL
10 (mJ/m2)c �GEL100 (mJ/m2)c
ST20L 34 −68 −38 −15 −2.81 6.57 1.05 0.33 0.05MP1040 60 −72 −29 −20 −2.81 6.57 1.18 0.19 0.09
6).tions
uspcdFswoSaNfaW
Fs
aas
4
osa(
a Measured by dynamic light scattering.b Calculated zeta potentials in 0.1, 10, and 100 mol m−1 NaCl solutions (pH ∼c Electrostatic interfacial free energies in 0.1, 10, and 100 mol m−1 NaCl solu
p to 100 mol m−1 (data not shown), which suggests they aretable and well-dispersed even in saline conditions. The largerarticle will experience a greater permeate drag force as indi-ated in Eq. (13) via both Stokes drag and the Goren interfacialrag correction. The scanning electron microscope images inig. 5 suggest the particles are somewhat poly-disperse and non-pherical with nano-scale roughness features. It is not certainhether the surface roughness is intrinsic to the nanoparticlesr from the sputter coating used in preparing the samples forEM. Nanoparticle zeta potential variation with ionic strengthre similar with a range of about −15 to −20 mV at 100 mol m−1
−1
aCl up to about −68 to −78 mV at 0.1 mol m NaCl. Theree energy values represent the interfacial energy per unit areat contact for interacting nanoparticles. As expected, van deraals interactions are attractive and electrostatic interactionsig. 5. Scanning electron microscope images of (a) MP1040 and (b) ST20Lilica nanoparticles at magnification of 100 kX.
igbsoAmti
Kfettia
F
Fdr
(pH ∼6).
re repulsive. Positive acid–base free energy implies that inter-cting silica nanoparticles are inherently stable in water due tohort-range hydrophilic repulsion.
.2. Experimental flux decline and fitted cake layer porosity
Fitted cake layer porosities obtained from linear regressionf experimental flux data plotted as (v0/v)2 versus t are pre-ented in Fig. 6. The porosities from 11 separate experimentsre calculated by fitting the regression coefficients with Eqs.3a) and (6) or (3a) and (11). Two of the experiments produceddentical porosity values, so only 10 data points appear on theraph. The predicted porosity values range from 0.32 to 0.44 foroth the Kozeny–Carman and Happel cell models. This range ofpherical particle cake layer porosities is consistent with numer-us past theoretical and experimental studies [22,24–27,30,50].lthough the fitted porosities by both models are close, the KCodel fitted porosities are larger than the HC model fitted porosi-
ies. The difference is due to the different Kozeny constants usedn the two models. If one sets rc = 9K((1 − εc)2/a2
pε3c) with
= 5.0 for the Kozeny–Carman model and K = Asε3c/2(1 − εc)
or the Happel cell model, then the two models are identicalxcept for the value of K. Happel cell K-values range from 4.44o 4.74 for porosities ranging from 0.3 to 0.5 [44,45]. Hence,he smaller K value derived from the Happel cell model results
n smaller estimated porosity (for the same cake resistance) byfactor of ∼KHC/KKC.Another interesting observation, based on the data plotted inig. 6, is that the porosity is almost universally smaller for larger
ig. 6. Nanoparticle cake layer porosities determined by fitting experimentalata to Eqs. (3) using the Kozeny–Carman (KC) and the Happel cell (HC) cakeesistances.

3 brane
pfiuaiitcgcldsos
4f
clt(tbIs(
GtHdiwf
aT(oFcacasXdr
Tiot
Ft
68 S. Kim et al. / Journal of Mem
articles, εc ∼ 0.32–0.38 for 60 nm particles and εc ∼ 0.35–0.43or 34 nm particles. Differences in particle surface propertiesnfluence the cake layer porosity. However, since both particlessed were silica the distinctly different range of porosities islmost entirely due to the difference in particle size. Combin-ng the interfacial hydrodynamic correction with Stokes dragn Eq. (13) results in the permeate drag force being propor-ional to the particle radius raised to a power of 1.5. Thus, theompressive drag force on the 60 nm particle is about 2.3 timesreater (∼601.5/341.5) than that experienced by the 34 nm parti-le, whereas according to Eqs. (15)–(17) the inter-particle col-oidal forces are about 1.76 times greater (∼60/34). Further, theisproportionate dependence of permeate drag force on particleize results in a relatively stronger influence of hydrodynamicsver colloidal forces in determining the minimum inter-particleeparation and cake layer porosity.
.3. Relative importance of colloidal and hydrodynamicorces
Fig. 7(a)–(d) illustrate the relative influence of the variousolloidal and hydrodynamic interactions on the transient cakeayer porosity and permeate flux decline. Experimental condi-ions simulated include particle feed concentration of 0.004%v/v), initial flux of 95 �m/s, crossflow velocity of 6 cm/s, par-icle radius of 60 nm, ionic strength of 10 mM, MX50 mem-
rane (Rm = 8.14 × l011 m−1), and unadjusted pH of 5.8 ± 0.2.nter-particle forces are calculated according to three differentcenarios considering (1) DLVO interactions with Stokes dragDLVO + SD), (2) DLVO interactions with Stokes drag and theauGt
ig. 7. Plots of (a) total inter-particle forces, (b) cake layer porosity, (c) transient inteime.
Science 284 (2006) 361–372
oren drag correction (DLVO + GD), and (3) XDLVO interac-ions with Stokes drag and the Goren drag (XDLVO + GD). Theappel correction function was used to compute all permeaterag forces, but for the DLVO + SD scenario, fG, the “Goren”nterfacial drag correction is set equal to one. A value of 0.64as assumed for the maximum cake concentration in Eq. (12)
or all three scenarios.The force profiles plotted in Fig. 7(a) compare the net inter-
ction force at a time of 40 min for the experimental conditions.he interfacial drag correction, fG, approaches a value of ∼180
at contact), which represents the increase in permeate dragver the uncorrected value predicted by the Stokes drag alone.or DLVO-based colloidal interactions (i.e., acid–base ignored),onsidering only the Stokes drag results in long-range repulsionnd a minimum inter-particle separation of ∼10 nm, whereasonsidering the corrected interfacial drag produces attractiont both long and short range with a negligible inter-particleeparation. The particles will aggregate. The combination ofDLVO colloidal forces with the corrected interfacial hydro-ynamic forces results in long-range attraction and short-rangeepulsion and a minimum inter-particle separation of ∼2.5 nm.
Model predicted cake porosity data are plotted in Fig. 7(b).he fitted cake porosity derived from experimental flux data
s plotted for reference. The DLVO + SD scenario significantlyver predicts inter-particle separation and cake porosity, whilehe DLVO + GD scenario under predicts inter-particle separation
nd cake porosity. Considering only Stokes drag dramaticallynderestimates the compressive drag force; however, addingoren’s drag correction to DLVO inter-particle forces suggestshe particles will form a densely packed cake layer. The porosity
r-particle force profiles at t = 10, 40, 70, and 100 min, and (d) flux decline with

brane
trocteAnmfBmb
irffptptrgrb
4p
p
tciftmvtmficcnm
ctfTatsdbcpt
TE
φ
aRf∆
v
�
IR
τ
tε
ε
φ
hε
EA
I
S. Kim et al. / Journal of Mem
akes a value of 36.1% because the minimum inter-particle sepa-ation is taken as the theoretical minimum interfacial separationf 0.158 nm. Combination of XDLVO and the corrected interfa-ial hydrodynamic forces (XLDVO + GD) results in a porosityhat increases from ∼0.38 to ∼0.42 over the duration of thexperiment, which agrees well with the fitted porosity of ∼0.40.ccording to the model calculations, the interfacial hydrody-amic correction has a huge impact on the permeate drag andinimum inter-particle separation, but short-range acid–base
orces are also required to accurately predict cake layer porosity.oth the Goren drag and Lewis acid–base forces increase dra-atically inside about 5 nm, and thus, these interactions cannot
e ignored for densely packed nanoparticle assemblages.As the cake layer builds, the compressive drag force decreases
n proportion to the flux decline; however, the growing cakeesistance increases the permeate drag force through the inter-acial drag correction. In Fig. 7(c), force profiles are plottedor times of 10, 40, 70, and 100 min. The minimum inter-article separation shifts from ∼1.5 to ∼2.7 nm over this time, sohe transient inter-particle forces produce increasing cake layerorosity as flux declines. However, for destabilized particles,he cake layer porosity may not increase with time because theeduction in compressive drag might not reverse particle aggre-ation. In Fig. 7(d), the transient flux decline is successfullyeproduced by the XDLVO + GD force balance, while DLVO-ased scenarios are relatively inaccurate.
.4. Comparison of experimental data and model
redictionsParticle concentration, particle size, ionic strength, appliedressure (initial flux), crossflow velocity, and membrane resis-
pTAa
able 2xperimental (“exp”) and model (“mod”) results
Experiment no.
1 2 3 4 5
b(%) 0.002 0.004 0.008 0.004 0.004
p (nm) 34 34 34 34 60
m (×1010 m−1) 88 77 88 90 104
G,h=0 141 132 141 143 204
p (kPa) 55 48 55 228 262
0 (�m s−1) 71 71 71 283 283
p (mV) −15 −15 −15 −68 −72(mol m−3 NaCl) 100 100 100 0.1 0.1e 762 762 762 762 762
exp (s) 833 244 196 161 178
1/2,exp (s) 2,500 732 588 484 535
c,exp (KC) 0.40 0.36 0.39 0.44 0.32
c,exp (HC) 0.39 0.35 0.38 0.43 0.32
max, mod 0.69 0.72 0.69 0.64 0.69
min, mod 2.1 2.2 2.7 2.1 0.16
c,moda 0.37 0.35 0.39 0.42 0.31
xp v100/v0 (%)b 35 20 20 17 17vg. error (%)c 0.5 1.6 0.6 0.6 0.8
talicized values indicate experiments 1–11.a Average predicted porosity.b Permeate flux at t = 100 min.c Average fitting error = (1/N)
√(vexp − vmod)2, where N is the number of data,
Science 284 (2006) 361–372 369
ance were varied systematically to determine their influence onake structure and flux decline. Experimental conditions givenn Table 2 were modeled using the XDLVO + GD inter-particleorce balance. The italicized entries running horizontally acrosshe table indicate the parameter that was varied in each experi-
ent. For example, the feed particle volume fraction, φb is thearied parameter in experiments 1–3, while all other parame-ers listed vertically are held constant. In these simulations, the
aximum cake concentration, (φmax in Eq. (12)), is used as atting parameter. Below the experimental conditions, the fittedake porosity, fitted maximum cake concentration, and predictedake porosity are listed. Finally, the experimentally observedormalized fluxes at the end of each 100 min filtration experi-ent, v100/v0, are reported along with the overall fitting errors.The 34 nm particles exhibit a wider range of maximum cake
oncentrations (0.64–0.72 for experiments 1–4 in Table 2), whilehe range of maximum cake concentrations is relatively narrowor 60 nm particles (0.67–0.69 for experiments 5–11 in Table 2).heoretically, the maximum cake concentration should reflectcertain packing structure; however, the nanoparticles used in
he study are not mono-disperse nor perfectly spherical. Thecanning electron microscope images in Fig. 5 illustrate the poly-isperse, non-spherical, and nano-scale roughness features ofoth nanoparticle surfaces. The variation in maximum cake con-entration may reflect the non-ideality of the nanoparticles andotential experimental error more than a specific packing struc-ure such as face-centered cubic or hexagonal close packing.
In Table 2, both fitted (εc,exp) and predicted (εc,mod) cake
orosities were larger for 34 nm particles (experiments 1–4,able 2) than for the 60 nm particle (experiments 5–11, Table 2).ccording to Eq. (12), at a given minimum inter-particle sep-ration the porosity is slightly smaller for the larger particles
6 7 8 9 10 11
0.004 0.004 0.004 0.004 0.004 0.00460 60 60 60 60 60
104 19 87 88 93 81204 87 187 188 193 180262 48 110 110 117 69284 287 143 143 143 95−29 −29 −29 −29 −29 −29
10 10 10 10 10 10762 762 762 254 127 762
227 42 370 417 435 667682 126 1,111 1,250 1,304 2,000
0.34 0.35 0.34 0.35 0.36 0.370.33 0.34 0.33 0.33 0.35 0.360.67 0.69 0.67 0.68 0.68 0.670.60 0.87 0.90 0.60 0.60 0.900.34 0.33 0.35 0.33 0.33 0.35
19 9 26 24 25 311.7 1.2 1.6 2.0 2.1 1.3
vexp the experimental flux and vmod is the model flux.

3 brane
aa
itldtdrmlsf
oHgfnfld1cp
stt
cep3iait
4r
rswAiacnnM
70 S. Kim et al. / Journal of Mem
nd, according to Eq. (10), specific cake resistance varies with−2p . However, the minimum inter-particle separation is stronglynfluenced by particle size through the permeate drag correc-ion function (∼ a
3/2p ). The 60 nm particles experience relatively
arger permeate drag than the 34 nm particles, and thus, shouldevelop into more tightly packed cake structures. For 34 nm par-icles in dilute electrolytes (experiment 4, Table 2), compressiverag is relatively small compared to the electrostatic double layerepulsion. As ionic strength and particle size increase (experi-ent 2, Table 2), the apparent porosity of nanoparticle cake
ayers decreases. However, for 60 nm particles there does noteem to be much impact of ionic strength on cake layer porosityor the conditions tested (see experiments 5 and 6, Table 2).
The effects of nanoparticle feed concentration and initial fluxn the rate of flux decline with time are reasonably intuitive.igher feed concentration and initial permeate flux producereater particle deposition rates, and thus, more rapid cake layerormation. This behavior is directly captured in the flux compo-ent (right-hand side) of Eq. (1). Also, higher initial permeateux produces (initially) a higher compressive drag force oneposited particles. The data from experiments 1–3, 6, 10, and1 in Table 2 confirm more flux decline occurs when feed con-entration and initial flux are higher. The predicted and fittedorosity and flux decline values are also in good agreement.
The cake formation and cake structure models used in thistudy neglect crossflow hydrodynamics completely. Both iner-ial lift and shear-enhanced diffusion influence particle back-ransport through crossflow hydrodynamics [8,14]. For parti-
dfioT
Fig. 8. Plots of (a) total inter-particle forces, (b) flux decline with time, (c)
Science 284 (2006) 361–372
les smaller than ∼300 nm in diameter, inertial lift and shear-nhanced diffusion are generally neglected [26,41]. Since thearticles used in these experiments were much smaller than00 nm in diameter, crossflow hydrodynamics have negligiblenfluence on cake formation. The data from experiments 8, 9,nd 10 presented in Table 2 confirm there is not a significantmpact of crossflow hydrodynamics on flux decline, at least upo a Reynolds number of almost 800.
.5. Relative importance of membrane resistance and cakeesistance
The relative importance of membrane resistance and cakeesistance on flux decline was investigated by conducting theame experiment twice, once with the MF membrane and onceith the UF membrane. These are experiments 6 and 7 in Table 2.ccording to Eq. (14), Goren’s drag correction increases with
ncreasing membrane resistance, which suggests that particlesccumulating on the UF membrane surface experience a largerompressive drag force (at the same permeate flux). Indeed, theet inter-particle force profile plotted in Fig. 8(a) is much moreegative (compressive) for the UF membrane than it is for theF membrane.In the model simulations matching these experimental con-
itions, the maximum cake concentration, φmax, was used as atting parameter. The best fit was achieved with φmax valuesf 0.67 and 0.69 for the UF and MF membranes, respectively.hus, even though a smaller inter-particle separation distance
transient cake layer porosity, and (d) transient cake layer thickness.

brane
imfTfutm
Ftidafr
wboiftrdia
bpspmMboadetsrH
5
psnifled
daoacd
iilrtdpccifdb
A
CEtW
R
S. Kim et al. / Journal of Mem
s calculated for nanoparticle assemblages formed over the UFembrane, the model fitted cake porosities are slightly larger
or the UF membrane than for the MF membrane (εc,mod inable 2). The opposite trend is observed for the porosities derivedrom linear regression of (v0/v)2 versus t data (εc,exp in Table 2)sing the Kozeny–Carman cake layer time constant. However,he subtle differences in cake structure cannot explain the dra-
atic differences in flux decline.Both the theoretical and experimental flux data presented in
ig. 8(b) suggest much greater flux decline for the MF membranehan for the UF membrane. The loss of flux is both more rapidnitially and more severe at the end of 100 min—despite theramatically smaller compressive force (predicted by the model)nd higher porosity of the cake layer (fitted from the experiment)ormed on the MF membrane. Combining Eqs. (2) and (19) ande-arranging yields:
v
v0=
[1 + rcδc
Rm
]−1
, (20)
hich provides a basis to explain the apparent discrepancyetween the differences in compressive drag, cake porosity, andbserved flux decline. Assuming the rate of particle deposition isnitially (instantaneously at t = 0) identical, the compressive dragorce is large and the cake porosity is small producing essentiallyhe same rc and δc for both membranes. However, the membraneesistance, Rm, is much larger for the UF membrane. Since fluxecline is related to the ratio of rcδc/Rm, the observed flux losss not as severe on the UF membrane (both on a normalized andbsolute basis because the same initial flux was employed).
Since the actual flux decreases more quickly for the MF mem-rane, (theoretically) the compressive drag force and the rate ofarticle deposition decrease more rapidly, which leads (at sub-equent time steps) to cake layers that are increasingly moreorous and relatively less thick (than those formed on the UFembrane). In Fig. 8(c), the porosity of the cake formed on theF membrane is higher than that formed on the UF membrane
etween times of about 50 and 90 min. In Fig. 8(d), the thicknessf the cake formed on the MF membrane is substantially smallert all time steps beyond the first few minutes of filtration. Theifference in cake layer thickness is predominantly due to differ-nces in convective deposition (proportional to flux). Althoughhe increase in total cake resistance, Rc (=rcδc), with time islower on the more permeable MF membrane, the ratio of cakeesistance to membrane resistance is disproportionately larger.ence, flux decline is much more severe.
. Conclusions
A delicate interplay between compressive drag and inter-article repulsion leads to complex and dynamic cake layertructures in crossflow membrane filtration of interactinganoparticle suspensions. The additional hydraulic resistance
mparted by the formed nanoparticle assemblages leads to rapidux decline. Generally, the porosity of nanoparticle cake lay-rs increases with time as the permeate flux (i.e., compressiverag) decreases. Classical DLVO forces combined with Stokes[
Science 284 (2006) 361–372 371
rag forces capture the correct qualitative behavior, but fail toccurately reproduce experimental flux data. The combinationf extended DLVO (van der Waals, acid–base, and electrostatic)nd interfacial hydrodynamic forces (Stokes drag, Goren dragorrection, and Happel drag correction) gives reasonable pre-ictions of cake layer porosity and permeate flux decline.
For the hydrophilic silica nanoparticles used in these exper-ments, Lewis acid–base interactions controlled the minimumnter-particle separation between nanoparticles within the cakeayers because of the relatively large magnitude of hydrophilicepulsion at short range (<5 nm). Goren’s interfacial correc-ion factor increases dramatically as inter-particle separationecreases, as membrane hydraulic resistance increases, and asarticle size increases. Thus, interactions between large parti-les are more strongly affected by permeation drag through theombination of Stokes drag and the Goren drag correction. Thenfluence of short-range acid–base and interfacial hydrodynamicorces offers a reasonable, mechanistic explanation for the fluxecline produced by interacting nanoparticles in crossflow mem-rane filtration processes.
cknowledgements
Financial support for Dr. Suhan Kim was provided by thealifornia Department of Water Resources and the Californianergy Commission through the Desalination Research Innova-
ion Partnership (DRIP), which is managed by the Metropolitanater District of Southern California.
eferences
[1] S.M. Webb, B.M. Tebo, J.R. Bargat, Structural characterization of biogenicMn oxides produced in seawater by the marine Bacillus sp. strain SG-1,Am. Miner. 90 (2005) 1342.
[2] L. Brant, H. Lecoanet, M.R. Wiesner, Aggregation and deposition charac-teristics of fullerene nanoparticles in aqueous systems, J. Nanopart. Res. 7(2005) 545.
[3] A. Kumbhar, G. Chumanov, Synthesis of Iron(III)-doped titania nanopar-ticles and its application for photodegradation of sulforhodamine-B pollu-tant, J. Nanopart. Res. 7 (2005) 489.
[4] M.S. Diallo, C.J. Glinka, W.A. Goddard, J.H. Johnson, Characterization ofnanoparticles and colloids in aquatic systems. 1. Small angle neutron scat-tering investigations of Suwannee River fulvic acid aggregates in aqueoussolutions, J. Nanopart. Res. 7 (2005) 435.
[5] G.A. Waychunas, C.S. Kim, J.F. Banfield, Nanoparticulate iron oxide min-erals in soils and sediments: unique properties and contaminant scavengingmechanisms, J. Nanopart. Res. 7 (2005) 409.
[6] Z.R. Yue, J. Economy, Nanoparticle and nanoporous carbon adsorbentsfor removal of trace organic contaminants from water, J. Nanopart. Res. 7(2005) 477.
[7] J. Buffle, K.J. Wilkinson, S. Stoll, M. Filella, J.W. Zhang, A generalizeddescription of aquatic colloidal interactions: the three-colloidal componentapproach, Environ. Sci. Technol. 32 (1998) 2887.
[8] G. Belfort, R.H. Davis, A.L. Zydney, The behavior of suspensions andmacromolecular solutions in cross-flow microfiltration, J. Membr. Sci. 96(1994) 1.
[9] R.H. Davis, Modeling of fouling of cross-flow microfiltration membranes,Sep. Purif. Meth. 21 (1992) 75.
10] R.J. Wakeman, E.S. Tarleton, Colloidal fouling of microfiltration mem-branes during the treatment of aqueous feed streams, Desalination 83 (1991)35.

3 brane
[
[
[
[
[
[
[
[
[
[
[
[
[
[
[
[
[
[
[
[
[
[
[
[
[
[
[
[
[
[
[
[
[
[
[
[
[
[
72 S. Kim et al. / Journal of Mem
11] S. Chellam, M.R. Wiesner, Evaluation of crossflow filtration models basedon shear-induced diffusion and particle adhesion: complications inducedby feed suspension polydispersivity, J. Membr. Sci. 138 (1998) 83.
12] S. Chellam, M.R. Wiesner, Particle-transport in clean membrane filters inlaminar-flow, Environ. Sci. Technol. 26 (1992) 1611.
13] S. Chellam, M.R. Wiesner, Particle back-transport and permeate flux behav-ior in crossflow membrane filters, Environ. Sci. Technol. 31 (1997) 819.
14] M.R. Wiesner, M.M. Clark, J. Mallevialle, Membrane filtration of coagu-lated suspensions, J. Environ. Eng. ASCE 115 (1989) 20.
15] L.F. Song, M. Elimelech, Particle deposition onto a permeable surface inlaminar-flow, J. Colloid Interface Sci. 173 (1995) 165.
16] R.M. Mcdonogh, C.J.D. Fell, A.G. Fane, Surface-charge permeability inthe ultrafiltration of non-flocculating colloids, J. Membr. Sci. 21 (1984)285.
17] A.S. Jonsson, B. Jonsson, Colloidal fouling during ultrafiltration, Sep. Sci.Technol. 31 (1996) 2611.
18] P. Bacchin, P. Aimar, V. Sanchez, Model for colloidal fouling of mem-branes, AIChE Lett. 41 (1995) 368.
19] K.J. Hwang, H.C. Liu, W.M. Lu, Local properties of cake in cross-flowmicrofiltration of submicron particles, J. Membr. Sci. 138 (1998) 181.
20] K. Welsch, R.M. Mcdonogh, A.G. Fane, C.J.D. Fell, Calculation of limitingfluxes in the ultrafiltration of colloids and fine particulates, J. Membr. Sci.99 (1995) 229.
21] S.G. Yiantsios, A.J. Karabelas, The effect of colloid stability on membranefouling, Desalination 118 (1998) 143.
22] T.D. Waite, A.I. Schafer, A.G. Fane, A. Heuer, Colloidal fouling of ultra-filtration membranes: Impact of aggregate structure and size, J. ColloidInterface Sci. 212 (1999) 264.
23] V.V. Tarabara, I. Koyuncu, M.R. Wiesner, Effect of hydrodynamics andsolution ionic strength on permeate flux in cross-flow filtration: directexperimental observation of filter cake cross-sections, J. Membr. Sci. 241(2004) 65.
24] L.F. Song, M. Elimelech, Theory of concentration polarization in cross-flow filtration, J. Chem. Soc. Faraday Trans. 91 (1995) 3389.
25] S. Bhattacharjee, A.S. Kim, M. Elimelech, Concentration polarization ofinteracting solute particles in cross-flow membrane filtration, J. ColloidInterface Sci. 212 (1999) 81.
26] S. Hong, R.S. Faibish, M. Elimelech, Kinetics of permeate flux decline incrossflow membrane filtration of colloidal suspensions, J. Colloid InterfaceSci. 196 (1997) 267.
27] R.S. Faibish, M. Elimelech, Y. Cohen, Effect of interparticle electrostaticdouble layer interactions on permeate flux decline in crossflow membranefiltration of colloidal suspensions: an experimental investigation, J. ColloidInterface Sci. 204 (1998) 77.
28] W.R. Bowen, F. Jenner, Dynamic ultrafiltration model for charged colloidal
dispersions—a Wigner–Seitz cell approach, Chem. Eng. Sci. 50 (1995)1707.29] W.R. Bowen, P.M. Williams, J. Wilson, Quantifying extra interaction forcesin charged colloidal dispersions from frontal ultrafiltration experiments,Colloid Surf. A: Physicochem. Eng. Asp. 231 (2003) 67.
[
[
Science 284 (2006) 361–372
30] J.C. Chen, M. Elimelech, A.S. Kim, Monte Carlo simulation of colloidalmembrane filtration: model development with application to characteriza-tion of colloid phase transition, J. Membr. Sci. 255 (2005) 291.
31] A.S. Kim, E.M.V. Hoek, Cake structure in dead-end membrane filtration:Monte Carlo simulations, Environ. Eng. Sci. 19 (2002) 373.
32] B.V. Derjaguin, L.D. Landau, Theory of the stability of strongly chargedlyophobic sols and of the adhesion of strongly charged particles in solutionsof electrolytes, Acta Physicochim. URSS 14 (1941) 733.
33] E.J.W. Verwey, J.T.G. Overbeek, Theory of the Stability of LyophobicColloids, Elsevier, Amsterdam, 1948.
34] S.L. Goren, Hydrodynamic force resisting the approach of a sphere to aplane permeable wall, J. Colloid Interface Sci. 69 (1979) 78.
35] J.A. Brant, A.E. Childress, Assessing short-range membrane–colloid inter-actions using surface energetics, J. Membr. Sci. 203 (2002) 257.
36] S.T. Kang, A. Subramani, E.M.V. Hoek, M.A. Deshusses, M.R. Matsumoto,Direct observation of biofouling in cross-flow microfiltration: mechanismsof deposition and release, J. Membr. Sci. 244 (2004) 151.
37] S. Wang, G. Guillen, E.M.V. Hoek, Direct observation of microbial adhe-sion to membranes, Environ. Sci. Technol. 39 (2005) 6461.
38] M. Elimelech, S. Bhattacharjee, A novel approach for modeling concentra-tion polarization in crossflow membrane filtration based on the equivalenceof osmotic pressure model and filtration theory, J. Membr. Sci. 145 (1998)223.
39] P. Bacchin, P. Aimar, V. Sanchez, Influence of surface interaction on transferduring colloid ultrafiltration, J. Membr. Sci. 115 (1996) 49.
40] P. Harmant, P. Aimar, Coagulation of colloids in a boundary layer duringcross-flow filtration, Colloid Surf. A: Physicochem. Eng. Asp. 138 (1998)217.
41] R.D. Cohen, R.F. Probstein, Colloidal fouling of reverse-osmosis mem-branes, J. Colloid Interface Sci. 114 (1986) 194.
42] C.A. Romero, R.H. Davis, Transient model of cross-flow microfiltration,Chem. Eng. Sci. 45 (1990) 13.
43] S.G. Redkar, R.H. Davis, Cross-flow microfiltration with high-frequencyreverse filtration, AIChE J. 41 (1995) 501.
44] R.F. Probstein, Physicochemical Hydrodynamics: An Introduction, 2nd ed.,John Wiley & Sons Inc., Hoboken, 2003.
45] J. Happel, Viscous flow in multiparticle systems: Slow motion of fluidsrelative to beds of spherical particles, AIChE J. 4 (1958) 197.
46] W.B. Russel, D.A. Saville, W.R. Schowalter, Colloidal Dispersions, Cam-bridge University Press, Cambridge, England, 1992.
47] C.J. Van Oss, Interfacial Forces in Aqueous Media, Marcel Dekker Inc.,New York, NY, 1994.
48] M. Elimelech, J. Gregory, X. Jia, R.A. Williams, Particle Depositionand Aggregation: Measurement, Modeling and Simulation, Butterworth-Heinemann, Woburn, MA, 1995.
49] I.H. Huisman, B. Dutre, K.M. Persson, G. Tragardh, Water permeabilityin ultrafiltration and microfiltration: viscous and electro viscous effects,Desalination 113 (1997) 95.
50] J. Rodriguez, C.H. Allibert, J.M. Chaix, A computer method for randompacking of spheres of unequal size, Powder Technol. 47 (1986) 25.