THE MEMBRANE FILTRATION AND THE VACUUM DRYING ...
266
THE MEMBRANE FILTRATION AND THE VACUUM DRYING OF PROTEINS AND ENZYMES A Thesis submitted to the University of London for the degree of Doctor of Philosophy by Geoffrey Taylor B.Sc. (Hon.)
-
Upload
khangminh22 -
Category
Documents
-
view
4 -
download
0
Transcript of THE MEMBRANE FILTRATION AND THE VACUUM DRYING ...
THE MEMBRANE FILTRATION AND
THE VACUUM DRYING OF
PROTEINS AND ENZYMES
A Thesis submitted to the
University of London for the degree of
Doctor of Philosophy
by
Geoffrey Taylor B.Sc. (Hon.)
ProQuest Number: 10611088
All rights reserved
INFORMATION TO ALL USERS The quality of this reproduction is dependent upon the quality of the copy submitted.
In the unlikely event that the author did not send a com p le te manuscript and there are missing pages, these will be noted. Also, if material had to be removed,
a note will indicate the deletion.
uestProQuest 10611088
Published by ProQuest LLC(2017). Copyright of the Dissertation is held by the Author.
All rights reserved.This work is protected against unauthorized copying under Title 17, United States C ode
Microform Edition © ProQuest LLC.
ProQuest LLC.789 East Eisenhower Parkway
P.O. Box 1346 Ann Arbor, Ml 48106- 1346
Abstract
THE MEMBRANE FILTRATION AND THE VACUUM DRYING OFPROTEINS AND ENZYMES
This study examines the process integration of membrane filtration and vacuum drying to produce a dried protein or enzyme with the protein in an undenatured or active form.
The concentration and drying of proteins and enzymes forms a main constituent part of a series of biochemical engineering unit operations to produce protein products from feed materials such as fermentation broths.
Pilot-scale membrane filtration cartridges of short length - large diameter hollow-fibre membranes were used to produce dewatered, protein precipitate suspensions suitable for feeding a pilot-scale vacuum drier. The flow properties of these suspensions in the hollow-fibres displayed non-Newtonian characteristics which were accurately described by independent rheological measurements provided suitable viscometric geometries were employed.
The membrane filtration of protein precipitates proceeded by two different mechanisms depending on the degree of membrane polarization. The extent of polarization was controlled by the suspension shear rate at the membrane surface and the permeate flux rate. A critical operating point existed whereby polarization of the membrane alternated between pre-gel- and gel-polarized states.
An experimental procedure for examining the temperature, moisture content and product quality during vacuum drying is presented. For the enzyme glucose oxidase in the presence of precipitated soya protein no product damage was observed at low, 4.25 kPa, and moderate, 10 to 25 kPa, absolute pressure. At higher pressures, above 25 kPa, the enzyme was irreversibly damaged at a rate dependent on the highest product temperature during the apparent constant-rate drying period.
An economic appraisal indicated that the protein
precipitate suspensions should be dewatered to a high degree before feeding to the vacuum drier to enable fast drying rates at low absolute pressures without the product expanding significantly. To minimize membrane filtration costs the hollow-fibre membrane channels should be long and narrow provided the protein concentrate can be recirculated through the channels without exceeding the bursting pressure of the membrane.
Acknowledgements
I am especially grateful to my supervisor, Dr. Michael Hoare, for his advice and encouragement during my research at the SERC Centre for Biochemical Engineering, Department of Chemical and Biochemical Engineering, University College London.
I would like to thank the technical staff of the department for their skilled assistance in the construction of the experimental apparatus, and Clive Orsborn, Chris Lees and John Betts who made work in the pilot-plant more bearable. Also thanks to the students and academic staff who made my time at University College so enjoyable.
The financial support provided the SERC and Baker Perkins (Peterborough, England) is gratefully acknowledged. Further acknowledgements are given to Baker Perkins for providing an experimental vacuum drier, and especially to Peter Gerrard and Tony Moll for their invaluable comments on the design and operation of continuous band vacuum driers.

Contents PageAbstract 2Acknowledgements 4Contents 5
Chapter 1 Introduction 91.1 Overview 91.2 Choice of equipment for dewatering and
drying operations 111.2.1 Dewatering equipment 111.2.1.1 High speed centrifugation 131.2.1.2 Membrane filtration 141.2.2 Drying equipment 161.2.2.1 Adiabatic driers 161.2.2.2 Non-adiabatic driers 171.2.3 Economic considerations of dewatering and
drying 191.3 Membrane filtration of precipitated protein
suspensions 211.3.1 Previous studies on the membrane filtration
of precipitated protein suspensions 221.3.2 Rheological aspects concerning membrane
filtration 241.3.3 Choice of experimental membrane filtration
equipment 251.4 Vacuum drying 261.4.1 Vacuum drying technology 271.4.1.1 Industrial vacuum drying 271.4.1.2 Choice of an experimental vacuum drier 281.4.2 Physical aspects of vacuum contact drying 291.4.3 Theoretical analysis of vacuum contact
drying 341.5 Thermal effects on protein concentrates and
powders 381.5.1 Thermal denaturation of proteins and enzymes 391.5.2 Thermal denaturation at low moisture levels 441.5.3 Thermodynamics and kinetics of thermal
denaturation 461.5.4 Evaluation of protein and enzyme damage
during processing 49

ge51
54
5454
55555557
58595960
64666767676869696970
727272727677787980838486
Conclusions
2 Materials and MethodsPreparation of precipitated soya protein suspensionsPrecipitated soya protein from TWE Precipitated soya protein from isolated soya protein powder Membrane filtration EquipmentMaintenance of membranesMembrane filtration of precipitated proteinsuspensionsVacuum dryingDrying equipmentOperation of drying equipmentVacuum drying of precipitated proteinsuspensionsEnzyme denaturationAnalytical techniquesRheological measurementsApparent viscosityShear modulusParticle size analysisProtein assay techniquesTotal proteinGlucose oxidase
3 Equipment Design Introduction Membrane filtration Membrane and membrane module Recirculation pumpPipework arrangement and holding tankInstrumentationVacuum dryingIntroduct ionFeed systemProduct transport within the drier Product removal system
Page3.3.5 Heating and cooling system 873.3.6 Drying chamber and vacuum system 893.4 Conclusions 92
Chapter 4 Membrane Filtration of ConcentratedPrecipitated Protein suspensions 94
4.1 Fluid mechanics of membrane filtration 944.1.1 Non-Newtonian laminar flow in pipes 954.1.2 Precipitated protein suspension rheology 1004.2 Membrane filtration theory for concentrated
precipitated protein suspensions 1024.2.1 Membrane filtration models 1024.2.1.1 Concentration polarization models 1034.2.1.2 Hydraulic resistance models 1104.3 Results and discussion 1124.3.1 Preliminary studies on membrane filtration 1124.3.2 Studies on the fluid mechanics 1224.3.2.1 Membrane filtration of water 1224.3.2.2 Membrane filtration of precipitated protein
suspensions 1304.3.3 Studies on the rate of membrane filtration 1464.3.3.1 Effect of protein fouling 1464.3.3.2 Effect of flow-pressures during precipitated
protein concentration 1484.3.3.3 Effect of flow-pressures at constant
precipitated protein concentration 1534.3.3.4 Permeate flux rate prediction 1674.4 Conclusions 1724.4.1 Studies on the fluid mechanics 1724.4.2 Studies on the rate of membrane filtration 1734.5 Recommendations for further work 174
Chapter 5 Vacuum Drying of Enzymes and DewateredPrecipitated Protein Suspensions 175
5.1 Introduction 1755.2 Vacuum contact drying of a continuous bed 1775.3 Results and discussion 1825.3.1 Characteristics of the feed material 1825.3.1.1 Concentrated precipitated protein
suspension rheology 183

page5.3.1.2 Enzyme denaturation 1895.3.2 Studies on the drying rate and enzyme
activity retention 1965.3.2.1 Effect of heating temperature 1965.3.2.2 Effect of vacuum level and initial
moisture content 2025.3.2.3 Evaluation of vacuum contact drying theory 2085.4 Conclusions 2115.5 Recommendations for further work 212
IChapter 6 Process Design for Membrane Filtration
and Vacuum Drying of precipitated Protein Suspensions 213
6.1 Introduction 2136.2 Results and discussion 2146.2.1 Membrane filtration 2156.2.1.1 Process and equipment design 2156.2.1.2 Operating costs 2266.2.2 Integrated design of membrane filtration
and vacuum drying 2356.3 Conclusions 2406.4 Recommendations for further work 240
Nomenclature 242References 246Appendices 254A.1 Derivation for end-loss pressure 254A.2 Experimental results of vacuum drying
experiments 256

1 Introduction
1.1 Overview
The concentration and drying of proteins and enzymes are an important constituent part of a series of biochemical engineering unit operations to produce protein products from feed materials such as fermentation broths. The considerable number of recovery or purification stages requires a high yield to be attained at each stage to achieve a good overall yield. The formation of a dried product is necessary to prevent adverse reactions such as microbial, oxidative and biochemical degradation occurring during storage. Also, drying is one method of improving the thermal stability of enzymes, the enhanced stability enabling enzymic reactions to be carried out at high temperatures without severe loss of catalytic activity (Eduardo et al., 1986).
The objectives of this thesis are to examine the final concentration or dewatering stage and its interaction with the finishing drying process. The specification of these two operations must be considered together to maximize the yield of active dry product when processing heat labile proteins and enzymes. Dewatering and drying are both complex operations, each possessing a large number of interrelated operating variables. These operating variables depend on the biochemically active nature and the physical properties of proteins and enzymes, as well as the operating equipment employed. When a particular operating scheme has been chosen the next step is process evaluation, in order that the optimized integrated design of the dewatering and drying operations can be determined. The process evaluation at a detailed research level may be performed using one of three methods: (i) developing a physico-mathematical model to simulate the process; (ii) using an idealized case to reduce the number of variables, or; (iii) experimental analysis.
The first two methods of approach to research are conveniently illustrated by considering the drying stage. Examples of the first method are given by Luyben et al.

(1980) and Wijlhuizen et al. (1979). These authors used independently determined experimental data on the kinetic parameters of enzyme inactivation to solve numerically series of simultaneous equations to predict the effect of adjusting the process variables on the retention of enzyme activity during spray drying. The second method may similarly be illustrated by an example of spray drying.Liou (1981) dried a distribution of droplet sizes of samples of immobilized enzymes positioned carefully in well-defined hot-air streams, and by repeating the same batch run several times determined the enzyme inactivation profile for a fixed set of drying conditions.
Generally, these two methods of approach to process optimization are employed to determine the relative sensitivity of the operating variables and to gain a better understanding of how they interact. However, such approaches often provide at best only qualitative information which cannot be applied with a large degree of certainty to' an industrial-scale process. To provide more reliable and quantitative information, which may be directly applied to the industrial-scale dewatering and drying of proteins and enzymes, the process variables should be examined experimentally, preferably using pilot-scale equipment. This, the last of the three methods, provides invaluable scale-up information and precisely identifies the important process variables and what specific areas, if any, require further research. Such further research may then be performed using perhaps the second method with laboratory- scale equipment. Similarly, relevant process data from pilot- and industrial-scale equipment is required, since it is rarely published, to evaluate and compare the process simulation models that will be ultimately used for process optimization. It is important that the pilot-scale equipment used for the experimentation mimics to a large degree the corresponding industrial-scale equipment. This will avoid systematically any errors or unforeseen problems occurring as a result of applying pilot-scale experimental data to the scale-up of equipment. Thus careful attention should be paid to the design of the pilot-scale equipment to ensure that the relevant process variables involved in scale-

up are examined for a "real situation", that is an industrial-scale process.
Thus, this study examines by experiment the dewatering and drying of proteins and enzymes using custom-built pilot- scale equipment. The choice and description of a process scheme which would be relevant and potentially viable for the industrial-scale production of dry protein and enzyme preparations is discussed in Section 1.2. The dewatering and drying operations adopted for this study are discussed in more detail in Sections 1.3 and 1.4 with particular emphasis placed on examining the operations at a research level. Section 1.5 of the Introduction discusses the thermal damage of proteins and enzymes which is of direct relevance to the drying process, and to a lesser extent in this study, the dewatering process. Finally, Section 1.6 gives a brief summary of the decisions reached during the Introduction.
1.2 Choice of equipment for dewatering and drying operations
Generally, proteins and enzymes are heat sensitive and susceptible to damage at interfaces especially under high shear conditions (Virkar et al., 1981). They require processing operations to be continuous and of relatively low residence time to lessen the extent of unwanted time- dependent reactions such as protease and microbial attack (Higgins et al., 1978). Therefore, a considerable number of restraints are placed on the choice of dewatering and drying equipment.
1.2.1 Dewatering equipment
The protein or enzyme may be presented to the dewatering or concentration equipment either in the form of a solution or a precipitate phase. Proteins may also be processed as a gel (Kinsella, 1983), but this case shall not be considered here. The precipitation of proteins has been extensively reviewed elsewhere (Bell et al., 1983). A cheap and effective method of precipitation is by adjustment to

the isoelectric point of the protein, this precipitating a large proportion of the soluble protein. It should be noted that precipitation of the desired protein acts as a concentration and purification step, such that a suitably specified dewatering operation will recover the protein precipitate in preference to, if present, any undesirable soluble non-protein compounds.
The dewatering of soluble proteins may be achieved using evaporation or membrane filtration. Evaporation is a relatively expensive process and, at ambient pressure, is a high temperature operation, and is consequently unsuitable for particularly heat labile proteins and enzymes. Evaporating under reduced pressure lowers the operating temperature but also increases capital and operating costs. Heat labile soluble proteins are commonly concentrated using ultrafiltration membranes. Unfortunately, even at relatively modest concentrations the rate of solvent or permeate removal is low due to membrane polarization effects. In addition, soluble protein material recirculated through the membrane filtration equipment often experiences large mechanical shear forces which, in the presence of gas- liquid interfaces, may disrupt the protein structure and thereby lower the quality of the product (Narendranathan & Dunnill, 1982). Gas-liquid interfaces arise if the membrane filtration equipment is operated incorrectly. For example, cavitation at the inlet to the recirculation pump can occur if there is insufficient flow of process material to the pump, or air entrainment in the holding tank, if present, can occur due to excessive mixing of the process material.
Dewatering operations commonly used for precipitated proteins include centrifugation and conventional filtration (Bell et al., 1983). Conventional filtration is prone to blinding of the filter septa and often filter aids must be added (Gray et al., 1973) which subsequently contaminate the dewatered precipitate. Alternatively, high speed centrifugation requires no additives and, provided the reactor for the protein precipitate preparation is carefully designed, will yield a homogeneous sediment suitable for drying (Bell & Dunnill, 1982a). For both centrifugation and conventional filtration protein in the soluble phase is lost

into the supernatant. A more recently devised process for precipitated protein recovery involves the use of membrane filtration where considerably higher rates of permeate removal and higher final dewatered concentrations are achieved compared to the membrane filtration of soluble protein (Devereux & Hoare, 1986). In addition, unlike centrifugation and conventional filtration, membrane filtration may be employed to recover soluble protein together with precipitated protein.
High speed centrifugation and membrane filtration of precipitated protein suspensions are discussed in more detail in the following sections.
1.2.1.1 High speed centrifugation
From the wide variety of commercial centrifugal separators currently available only a handful are capable of efficiently recovering protein precipitates. These include tubular-bowl, disk-stack and scroll-discharge centrifuges. The tubular-bowl centrifuges can generate high centrifugal forces to recover fine precipitate particles but are only used for small scale applications, due to the low sediment holding volumes and batch-wise operation.
Continuous, larger scale separations are achieved using disk-stack centrifuges which are characterized as either continuous-nozzle or semi-continuous intermittent discharge centrifuges. Although not as good in terms of dewatering or fine particle removal, the advantages of the disk-stack compared to the tubular-bowl centrifuge are the reduced particle sedimentation distance, allowing particles to be removed with shorter residence times, and the greater settling area provided by the disks. The maximum centrifugal forces attainable are restricted by the materials of construction, and hence improving the removal of fine particles requires lower throughputs, often in combination with product cooling to prevent the sediment becoming overheated. However, operation at lower throughputs can lead to excessive dewatering of the sediment, or require frequent discharging of sediment from the disk-stacks which is inefficient in terms of power
consumption and is often damaging for the centrifuge.A good alternative to disk-stacks for easily sedimented
particles is the scroll-discharge centrifuge. Although it operates at lower centrifugal forces than disk-stack centrifuges, it is capable of producing a continuous stream of homogeneous, low moisture content precipitated protein sediment (Bell & Dunnill, 1982a).
In general, centrifugation provides a highly effective method for precipitated protein recovery with hygenic containment or aseptic operation and with no additives required. In terms of initial capital investment, power consumption and maintenance costs, centrifugation is often more expensive compared to membrane filtration especially for small scale operations (Tutunjian, 1985). However, centrifugal dewatering of precipitated protein suspensions enables removal to a large extent of soluble protein and nonprotein macromolecules. A high recovery of particulate material compared to soluble material is often difficult to achieve using membrane filtration (Le & Atkinson, 1985).
1.2.1.2 Membrane filtration
Membrane-based separations can be broadly categorized as microfiltration, ultrafiltration and reverse osmosis.This classification is based on nominal pore size where microfilters can retain suspended particles, such as cells and precipitated proteins, while ultrafilters can also retain soluble macromolecules. Reverse osmosis usually refers to the separation of low molecular weight substances from water, and is of no concern here.
Membrane filtration using ultrafilters offers the following advantages: reduced aerosol formation compared to centrifugation since the protein material travels at lower velocities; no expensive and difficult to remove filter aids or flocculation agents required; very high separation efficiences; recovery of soluble macromolecules is possible, and; low capital investment and power consumption costs.The disadvantages include: batch operation required to obtain high retentate concentrations from dilute feed suspensions unless large membrane area used; maximum

dewatered concentration is reduced when processing highly viscous materials; protein fouling of the membrane which reduces the permeate flow rate, or flux, and may shorten the membrane life, and; it may not be possible to separate undesirable macromolecular components from the particulate material.
Overall, ultrafiltration provides a viable alternative to centrifugation by producing well-defined, homogeneous precipitated protein concentrates at high separation efficiences (Devereux et al., 1984). The dewatered product will also contain higher concentrations of the soluble protein which was not precipitated. Hence, ultrafiltration is a particuarly desirable operation for total recovery of protein.
The true alternative to centrifugation, in terms of the dewatered product, is microfiltration where all the macrosolutes are permeated together with the solvent. Microfilters can achieve considerably greater pure solvent flux rates compared to ultrafilters. Microfiltration has been shown to be suitable for several solid-liquid bioprocess separations, such as cell harvesting from fermentation broths and, after cell disruption, cell debris removal from soluble protein products (Le & Atkinson, 1985). Compared to using centrifugation for these process streams, microfiltration offers the same operating advantages as ultrafiltration, as discussed above. However, studies using microfiltration to dewater precipitated protein suspensions proved unsuccessful due to blinding of the membrane pores by soluble protein and particulate material (Bentham et al., 1988). In the initial stages of dewatering using new membranes high permeate flux rates, accompanied by high levels of soluble protein transmission through the microporous membranes can be obtained. However, adsorption of soluble protein to the membrane, which has been shown may cause membrane pores with diameters two orders of magnitude larger than the protein molecules to become blocked (Bauser et al., 1982), eventually leads to a decline in flux and soluble protein transmission. These trends were observed for nominal pore sizes in the range of 0.2 pm to 1.2 pm though the time taken for the permeate flux and protein

transmission to fall below certain levels increases, to a small extent, with pore size (Bentham et al., 1988).
1.2.2 Drying equipment
Throughout the history of drying there have been few notable improvements to the basic design of the equipment and it still remains a poorly understood technology.Usually, selection from the numerous types of drier available depends upon the experience of the equipment user, who is often content to ignore the process as long as it works.
The heat labile nature of proteins and enzymes requires mild drying conditions, such as low temperature operation, or very fast drying rates. This confines the choice to such equipment as spray, fluidized-bed, vacuum and vacuum-freeze driers. These driers may be classified as adiabatic or non- adiabatic according to the manner in which the drying product is heated (Dittman, 1977).
1.2.2.1 Adiabatic driers
In adiabatic driers the heat for drying is supplied by hot gases passing through or across the wet solid. Spray and fluidized-bed driers are adiabatic type driers. They require the retention time to be short, to minimize loss of product through thermal inactivation by the hot gases. Typical product retention times for spray drying range from 3 to 60 s, and for fluidized-bed drying from 120 to 600 s (Belcher et al., 1977).
The spray drying of enzymes is well established and produces either bulk industrial enzymes, such as proteases for detergents, or smaller quantities of enzymes for analytical use. A two-stage operation is often employed, with spray drying to reduce the moisture content to around 15 % w/w, and a fluidized-bed drier as an after-drier (Kjaergaard, 1974). For example, comparatively heat stable enzymes produced in a one-stage operation would have an activity loss of 10 to 20 % whereas for a two-stage operation there would be virtually no overall loss (Masters,
1985). However, the spray drying of particuarly heat labile enzymes, such as alkaline phosphatase, can result in high levels of enzyme loss even at relatively low outlet gas temperatures (Daeman & van der Stege, 1982). Feeds to spray driers must be easily atomized especially when processing heat labile products. The high levels of dewatering achieved using continuous centrifuges, and to a lesser extent membrane filtration equipment, leads to highly viscous concentrates (Bell & Dunnill, 1982a; Devereux et al., 1984) which may not be readily atomized (Masters,1985) .
The use of fluidized-bed drying on its own for drying proteins or enzymes is not as widespread as spray drying. Fluidized-bed drying of enzymes has been shown to lead to a considerable loss of activity of enzymes such as alcohol dehydrogenase and glucose-6-phosphate dehydrogenase (Zimmerman & Bauer, 1985). Atmospheric pressure fluidized- bed freeze drying has found limited success in the drying of proteins and starter cultures (Boeh-Ocansey, 1984). Fluidized-bed drying under reduced pressure appears to offer an interesting alternative to conventional drying of heat labile materials. Unfortunately, it is difficult to prevent the particulate solids from clumping together to form large agglomerates, or from coating the walls of the drying vessel. Similarly, case hardening, where the particulate solids become over-dried on the surface, causes operating problems and increases the time required for drying since the dried surface acts as a barrier to heat and mass transfer to and from the wet solids (Gupta & Mujumdar,1983).
1.2.2.2 Non-adiabatic driers
Non-adiabatic driers supply heat using either radiation, or conduction through wetted walls in contact with the drying material, vacuum and vacuum-freeze driers are classified as non-adiabatic.
The use of reduced pressure in vacuum and vacuum-freeze driers facilitates low temperature operation by reducing the saturated vapour temperature of the volatile fractions to be

evaporated. By careful adjustment of the vacuum level and the heating temperatures, the product drying temperature can be maintained below that at which thermal damage occurs. Another advantage of using reduced pressure derives from the formation of easily redispersed dehydrated products (Beveridge & Lyne, 1976).
The use of vacuum-freeze drying, or lyophilization, has increased rapidly in recent years as the most effective method of preserving labile biochemicals for long periods. Before any drying occurs the feed material is formed into frozen slabs, or beds, which enables either dilute or concentrated feed materials to be freeze-dried. Local regions in the drying bed undergo a rapid transition from a fully hydrated and frozen state to a near complete dry state because of the passage of a relatively sharp ice-front inward through the bed. Due to the rigid ice structure at the water sublimation point, shrinkage or expansion during drying only occurs to a very small extent. The high resultant porosity of the dried product yields rapid rates of rehydration or redispersion. Vacuum-freeze drying suffers from necessarily long retention times which can be shortened to some degree by using a combination of radiant and microwave heating to return up to 20 % savings in the operating costs (Ma & Arsen, 1982).
Vacuum drying has similar advantages to vacuum-freeze drying and is considerably less expensive both in terms of capital investment and operating costs. As with vacuum- freeze driers, microwave vacuum drying systems also exist, although the extra initial capital investment and the operating costs are comparable to the savings obtained by reducing the retention time, and thereby little improvement is realized over conventional steam heating modes (Gardener et al., 1982; Decareau, 1986). Feed materials particuarly suited to vacuum driers are viscous and highly concentrated with typical solids contents between 50 and 90 % w/w (Beveridge & Lyne, 1976). A lower moisture content feed generally increases the capacity of the drier and decreases the product retention time. Vacuum drying of heat sensitive foods has been widely reported (Beveridge & Lyne, 1976; Hertzendorf & Moshy, 1970). However, little published
information exists on the performance of vacuum driers for drying proteins and enzymes (Hartmeier, 1977; Kumazawa et al., 1980). More information is available on the vacuum- freeze drying of proteins and enzymes as this technique is commonly used in the biochemical and pharmaceutical industries for producing dry products with almost complete retention of activity (Hill & Hirtenstein, 1983; Mellor, 1978) .
1.2.3 Economic considerations of dewatering and drying
A general comparison of the economics of dewatering by centrifugation and membrane filtration is complicated by variables such as the rheological properties, and mechanical and thermal damage of shear sensitive, heat labile process materials. However, if a material can be filtered, without membrane fouling causing a severe reduction in the rate of permeate removal, then membrane filtration is usually the cheaper process, especially for small scale operations (Tutunjian, 1985).
The selection of the most appropriate drying equipment depends on two primary considerations, namely the cost of drying and the product quality. In terms of the cost per unit mass of water removed, adiabatic drying is generally the cheapest process. The use of reduced pressure increases the cost compared to spray and fluidized-bed drying (sapakie et al., 1979). Vacuum-freeze drying is very expensive in both capital investment and operating costs which limits its use to high value products. For vacuum and vacuum-freeze drying to become more competitive, shorter retention times and more automation is required (Litchfield & Liapis,1982).
In terms of protein and enzyme quality, that is the complete retention of functionality, vacuum and vacuum- freeze drying appear to cause much less damage than spray and fluidized-bed drying. Although these comparisons suggest a direct trade-off between the drying costs and the dry product quality, the drying operation should not be considered in isolation. The dewatering operation leading up to drying is usually more cost effective since volatiles are removed mechanically as opposed to supplying the latent
heat of vaporization or sublimation. For example, the energy required to remove water by membrane filtration is typically 1 to 2 % of that required to evaporate water using a spray drier (Bemberis & Neely, 1986). Hence, driers capable of handling a highly dewatered or very viscous feed material, such as vacuum and vacuum-freeze driers, become more financially attractive. Moreover^ for particularly heat labile proteins and enzymes vacuum and vacuum-freeze driers will be the only options available.
Therefore, this study shall investigate the use of vacuum drying and establish the operating conditions required to optimize the production of active dry protein products. A parallel study shall also be performed on the use of membrane filtration to produce concentrated precipitated protein materials suitable for feeding to a vacuum drying operation. Although high speed centrifugation may be successfully employed for dewatering precipitated proteins, the technique has already been extensively researched (Bell & Dunnill, 1982a; Bell et al., 1983).
Membrane filtration for processing soluble proteins has been well researched and the operation and the theory have been reviewed elsewhere (Le & Howell, 1985; Cheryan, 1986). Hence, the following section (1.3) focuses on using membrane filtration to dewater protein precipitates to high concentrations suitable for vacuum drying. This section discusses the physical, as opposed to the theoretical, aspects of the membrane filtration of precipitated protein suspensions. The presentation of a theoretical treatise is delayed until Chapter 4 (Section 4.2) to enable all the theory concerned with membrane filtration to be presented as a whole. In contrast to membrane filtration, vacuum drying of proteins and enzymes has been poorly reviewed (Beveridge & Lyne, 1976), and is a comparatively novel technique for such application. Therefore, Section 1.4 considers the subject of vacuum drying in a more general sense, and discusses the established theory of vacuum drying.

1.3 Membrane filtration of precipitated protein suspensions
In Section 1.2 membrane filtration and vacuum drying for the dewatering and the drying of heat labile proteins and enzymes were selected as a potential industrial-scale process scheme which merited further research. The successful operation of a vacuum drier requires dewatered feed materials of high concentration and viscosity (Beveridge & Lyne, 1976). Using highly concentrated or low moisture content feed materials reduces the retention time, and thereby reduces drying costs and product damage occurring during drying, similarly, a viscous feed material is required to prevent excessive expansion of the material under reduced pressure.
Precipitated protein suspensions may be dewatered to high concentrations and viscosities using high speed centrifugation provided the reactor for- precipitate preparation is carefully designed. This application of centrifugation has been extensively researched by Bell & Dunnill (1982a). Using scroll discharge centrifugation they obtained solids dry weights ranging from 23 to 35 % w/w (250 to 390 kg m“3 total protein) for precipitated soya protein. Conversely, membrane filtration has been shown to dewater precipitated protein suspensions to only relatively moderate concentrations, of the order of 26 % w/w, or 280 kg m- total protein (Devereux et al., 1986a). It is possible to vacuum dry semi-concentrated materials provided that low vacuum levels, or high pressures, are employed to minimize expansion of the product during drying. However, this leads to slower drying rates, more product damage and larger capacity driers, and thereby increased costs (Beveridge & Lyne, 1976). Generally, per kg of water removed, vacuum drying is more costly by an order of magnitude than membrane filtration. Therefore, the dewatering step should be operated to achieve a more highly concentrated feed material for the vacuum drier (Sapakie & Renshaw, 1983).

1.3.1 Previous studies on the membrane filtration ofprecipitated protein suspensions
The performance of membrane filtration for concentrating precipitated protein suspensions has been studied by Devereux et al. (1984). The relationship between the rate of permeate flow, or flux, and the retained protein concentration is shown in Figure 1.1. Data is shown for the examples of concentrating soya protein in the soluble form and in the precipitated form, where the protein solution is adjusted to its isoelectric point to precipitate out approximately 85 % of the soluble protein. The data was obtained using a pilot-scale batch ultrafiltration rig with a single PM50 type hollow-fibre membrane cartridge. A centrifugal pump was used to recirculate the retentate through the membrane cartridge. The permeate flux rate for concentrating the soluble soya protein exhibits the classical semi-logarithmic decline with increasing retained protein concentration (Blatt et al., 1970) whereas for the same protein precipitated at its isoelectric point the flux curve consists of three regions. The initial region of flux decline is ascribed to protein adsorption to the membrane surface which is generally completed within the first 600 s (Le & Howell, 1985). This is followed by a region where the flux rate remains comparatively constant with increasing protein concentration. This region of flux decline eventually crosses the flux rate curve for soluble protein, thereby enabling higher flux rates to be obtained at high protein concentrations for the protein in its precipitated form. These high flux rates are maintained until a limiting concentration is reached whereupon a sharp decline in flux rate is observed over a small range of protein concentration. This decline is attributed to the rheological characteristics of the retentate (Devereux et al., 1984). Compared to the data shown in Figure 1.1, the decline in flux rate occurred at lower retained protein concentrations when longer membrane cartridges were employed, although it was possible to reverse fully the flux decline by increasing the pressure drop along the cartridge length which similarly enabled high final retentate

I— 1IA
CMIe
0jjfOuX3rHIM04JfO06i-i0CM
60 100 200 300
Retained protein concentration, kg m-3
Figure 1.1 Comparison of the pilot-scale concentration of soluble and precipitated soya protein using a PM50 type hollow-fibre membrane cartridge.
Data taken from Devereux et al., 1986a. Hollow-fibre length, 0.315m, inner diameter, 1.1 mm, total membrane area, 0.7 m^. Temperature of operation, 50 °C. Operating conditions; o , soya total water extract, pH 9.0, average soluble protein rejection, 0.95; • , isoelectric soyaprotein precipitate, pH 4.8, average soluble protein rejection 0.98.

concentrations to be attained (Devereux et al., 1984).Devereux et al. (1986a) attained final dewatered
precipitated soya protein concentrations up to 340 kg at a laboratory-scale using a gear pump and PM50 type hollow- fibre membranes. This suggests that higher dewatered concentrations could be achieved at a pilot- or industrial- scale by using positive displacements pumps rather than centrifugal pumps to recirculate the viscous retentate materials.
1.3.2 Rheological aspects concerning membrane filtration
For membrane filtration and centrifugation the rheological properties of the precipitated protein suspensions are perhaps the most influential parameters concerning the dewatering operation. A thorough understanding of the flow behaviour of the concentrated protein suspensions provides information on the operating limitations of the equipment, and enables effective matching of the material to be handled to the equipment and process design.
Rheological measurements of the yield stress and shear modulus describe the structural characteristics of concentrated suspensions and quantifies their ability to flow from a state of no shear. For any material that displays a yield stress, the shear stress applied on the material must exceed the magnitude of the yield stress for the substance to flow. such materials are described as Bingham plastics. Similarly, the shear modulus provides a measure of the elasticity, or resistance to deformation, of a material, and is used to describe viscoelastic fluids. Viscoelastic fluids are fluids which deform elastically, where removal of a shear stress producing deformation allows the material to recover its original shape. Knowledge of structural formation within a process material, which may occur at low shear rates for concentrated precipitated protein suspensions (Bell, 1982), is of importance when designing membrane filtration equipment. In regions of low shear the apparent viscosity, and hence the pressure drop along the membrane cartridges or in the associated pipework,

for precipitated protein suspensions can increase considerably due to structural formation, compared to the same material in regions of high shear (Bell & Dunnill, 1982a) . During membrane-based dewatering of the precipitated protein suspensions the yield stress and apparent viscosity of the retentate continually increase and eventually attain such levels as to prevent further recirculation of the retentate through the membrane cartridges (Devereux et al., 1984). Knowledge of the flow behaviour of the concentrated protein suspensions would enable the maximum extent of dewatering to be predicted for a specified membrane filtration system. In addition, the optimization for the choice and operation of the precipitant and precipitation reactor configuration would be influenced by the rheological properties of the subsequent concentrated protein suspensions. The rheology of precipitated protein suspensions is discussed in more detail in Chapter 4,Section 4.1.2.
1.3.3 Choice of experimental membrane filtration equipment
Generally, membrane ultrafiltration equipment is designed for handling low to relatively moderate concentrations of process material. To attain final dewatered precipitated protein concentrations similar to those produced by centrifugation requires a reappraisal of the existing equipment design. The work of Devereux et al. (1986a) at a laboratory-scale, where a gear pump was employed to achieve highly dewatered protein concentrates, indicates that at a pilot-scale a positive displacement recirculation pump, compared to a centrifugal pump, would be better suited to handling the highly viscous concentrates.
The selection of membrane cartridge type is somewhat arbitrary. In general, hollow-fibre and tubular type membranes are particuarly suited to handling concentrated particulate suspensions (Le & Howell, 1985). However, compared to the tubular type membrane system, the thin- channel configuration of the hollow-fibres reducesconsiderably the hold-up volume, per unit of membrane area,
\
of the retentate. A low retentate hold-up volume enables

small quantities of concentrated material, such as that remaining towards the end of the dewatering operation, to be recirculated through the membrane cartridges. This overcomes the necessity of concentrating large volumes of initially dilute feed material as would be required if a tubular membrane system were adopted.
The specification and design of the pilot-scale ultrafiltration equipment is discussed in more detail in Chapter 3.
1.4 Vacuum drying
Vacuum drying is a well established drying method and has been employed by the chemical, paper and food industries to a large extent. However, for pharmaceutical and biochemical applications the use of the related method of vacuum-freeze drying has been considerably more widespread when compared to vacuum drying, especially for expensive heat labile products. In parallel with these non-adiabatic drying techniques, spray and fluidized-bed drying have similarly received much attention from the biochemical industries, although there are often design problems in process optimization and scale-up to industrial-size driers (Masters, 1985; Gupta & Mujumdar, 1983). Of these four general drying techniques, vacuum drying is the least studied method with respect to protein and enzyme drying.
The design and optimization of a drying operation requires a thorough understanding of the governing theoretical principles, which are then related to the drying of specific materials given their dehydration kinetics and, in the case of proteins and enzymes, the reaction kinetics of denaturation or inactivation. Thus, for a known drying history, it is possible to predict the retention of native protein structure or enzyme activity and, given the operating costs of vacuum drying, ultimately determine an economically optimized process. It should be noted that the cheapest method of production may not always be desirable,particularly in cases where health and safety of personnel and upstream and downstream processing limitations become a major consideration. Very often an economic drying
operation is not a priority when manufacturing expensive products, and this has still further discouraged the basic research required for process optimization.
This section is split into three main subsections: the first details the various vacuum driers available, in order to assess the options for choosing an experimental pilot- scale drier; the second concerns the physical aspects of vacuum drying; and finally the present state of vacuum drying theory is examined.
1.4.1 vacuum drying technology
1.4.1.1 Industrial vacuum drying
There are several types of vacuum drier available whichcan be broadly divided into two groups based on whether ornot the drying solids are disturbed (Day & Lyne, 1972). Examples in which the solids remain undisturbed include vacuum tray and continuous band vacuum driers. The batchoperated tray driers simply consist of trays of the materialto be dried resting on hot water-, or steam-, heated shelves, all enclosed within a vacuum drying chamber. However, the labour intensive process of filling and emptying the trays, and loading and unloading the drier becomes too expensive as the capacity increases (Day & Lyne, 1972).
The vacuum band drier is a continuous version of the tray drier, and thereby overcomes the uneconomical and time consuming operation of a batch process. The process material, usually fed to the drier as a viscous slurry or paste, is continuously distributed on to one or several conveyor bands situated in a vacuum chamber, constructed in the shape of a tunnel. The bands carry the product over a series of heated plates whereupon it is dried and then discharged at one end of the vacuum chamber, whilst the conveyor band returns back to the feed end of the chamber. The feed material has to be sufficiently viscous, 30 to
_ o300 N s m , so as not to flow over the edges of the band or expand too violently under reduced pressure (Beveridge & Lyne, 1976). Although a continuous stream of a viscous feed
material is required, the dried product is often removed batch-wise via two or more hoppers which serve as air-locks. The construction and operation of the continuous vacuum band drier has been discussed by Beveridge & Lyne (1976) and Lyne et al. (1974). The largest industrial band driers can process up to 1 tonne per hour of dry product with typical residence times varying from 0.25 to 1.25 h. The product residence time will depend on the solids content of the feed material, which usually ranges from 75 to 90 % w/w, as this achieves the most economic operation in terms of production costs for drying (Day & Lyne, 1972).
Driers in which the solids are disturbed are most commonly represented by rotating and agitated vacuum driers (Day & Lyne, 1972; Perry, 1986). Compared to a static bed of material, constant agitation exposes a greater surface area of the material to the heated surface during the overall drying process. Agitation prevents prolonged contact between any one part of the drying material and the heated surfaces, which could otherwise damage heat sensitive products. Agitation is usually provided by a helical ribbon mixer or fixed scrapers. Often shear sensitive particles are vacuum dried using rotary driers where the entire drying chamber is turned to achieve agitation via a gentle tumbling action.
1.4.1.2 Choice of an experimental vacuum drier
The selection of a drier for studying the vacuum drying of proteins and enzymes is necessarily limited to the case where the solids remained undisturbed during drying. The theoretical and experimental problems encountered when investigating agitated systems in vacuum drying have been discussed by Schlunder (1980). The drying history of a particular section of material or a particle is more simply defined for the static case than for the agitated case, where additional knowledge of the particle motion during drying is required.
The use of a batch tray drier will yield only one representative experimental value, for the drying history of the material, per drying run since the drying operation must

be stopped in order to remove a sample. In constrast, a continuous band drier will provide samples pertaining to the entire drying history for a given set of drying conditions as it is possible to stop the process and analyse material at any point along the conveyor band. Thus, partially dried material near the feed zone, in addition to the final dried product, can be analysed from a single drying run unlike for the batch drying operation where the process would have to be stopped and restarted every time a sample was taken. Moreover, the provision of a sequence of heated plates transferring heat to the product through the conveyor band allows flexible temperature control within discrete zones of constant temperature.
Thus, it was decided to employ a continuous vacuum band drier for the drying experiments. The design, construction and operation of the experimental pilot-scale band drier is discussed in more detail in Chapter 3.
1.4.2 Physical aspects of vacuum-contact drying
The most significant feature of vacuum drying is the reduction in the boiling temperature of the volatile fractions. This is due to the decrease in the saturated equilibrium vapour pressure which permits drying to occur at low temperatures. In addition, during the initial drying stages, the product temperature will not approach the heated surface temperature but rather the saturated vapourtemperature, which only depends on the total pressure in thedrier (Ernst et al., 1938). The initial drying period is often referred to as the constant-rate period, characterized by the rate of removal of water per unit of drying surface area being constant. The constant-rate period continues until a critical moisture content of the drying material is reached, beyond which the instantaneous drying rate continuously decreases. The drying period concerned with drying at moisture contents less than the critical value is known as the falling-rate period. It should be noted thatan apparent constant-rate period may also be observed if thesurface area available for drying is increased during the falling-rate period.

There exists two extreme cases for vacuum drying operations, namely where heat transfer is achieved by conduction or radiation. Batch tray or continuous band drying essentially consists of a slab, or bed, of material, one face of which lies adjacent to a heated surface, the other face, an exposed surface open to the bulk gas phase. Consequently, heat transfer to the slab of material usually occurs by conduction from the heated surface, and sometimes by radiation emitted from heated surfaces situated above the exposed surface. Heat transfer by convection is negligible at low pressures since only a small mass of air or vapour can exist in the drying chamber.
A very common occurrence during vacuum drying is bed expansion, resulting from flash vaporization of the volatiles when first exposed to high vacuums levels (Kawamura et al., 1977). Similarly, any entrained air bubbles within the feed material will expand considerably under the influence of reduced pressure. Subsequently, for a large degree of expansion, the drying rate will be seriously affected as the emphasis on heat transfer shifts from conduction to radiation. For conductive heat transfer only, bed expansion will reduce the drying rate since the depth of material to be dried increases and the cross- sectional area available for heat conduction through the drying material decreases. However, radiant heat transfer is limited by the poor permeability of moist materials, and hence expanding the semi-dried bed to form thin, uniform layers of material will enhance the heat transfer process (Kawamura et al., 1977; Keey, 1978). Also, if the dried material forms a skin or case hardens, so as to hinder heat transfer by conduction, then radiant heat transfer would be preferred, where a radiated energy emitter may be chosen which radiates at wavelengths for which the skin or shell of material is essentially transparent (Keey, 1978). Thus, for a greatly expanded bed of relatively dry material, radiated heat transfer would be more effective than conducted heat. Expanding the bed increases the surface area available for heat transfer by radiation but the layers need to be thin and dry enough to enable radiative heat to penetrate the bed of material, conductive heating is properly suited to feed
materials of high moisture content, high thermal conductivity and non-porous structure. Hence, an optimized process can be envisaged whereby conductive heat input occurs during the initial drying stages and radiated heat is used to complete the drying cycle.
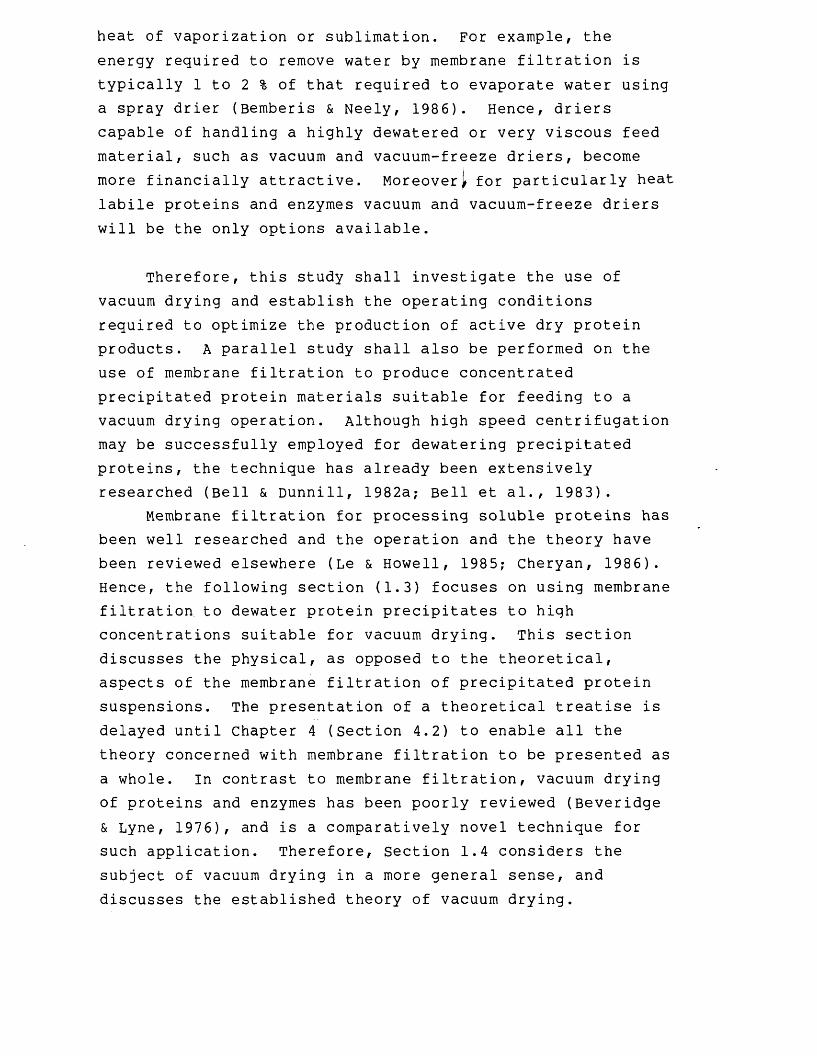
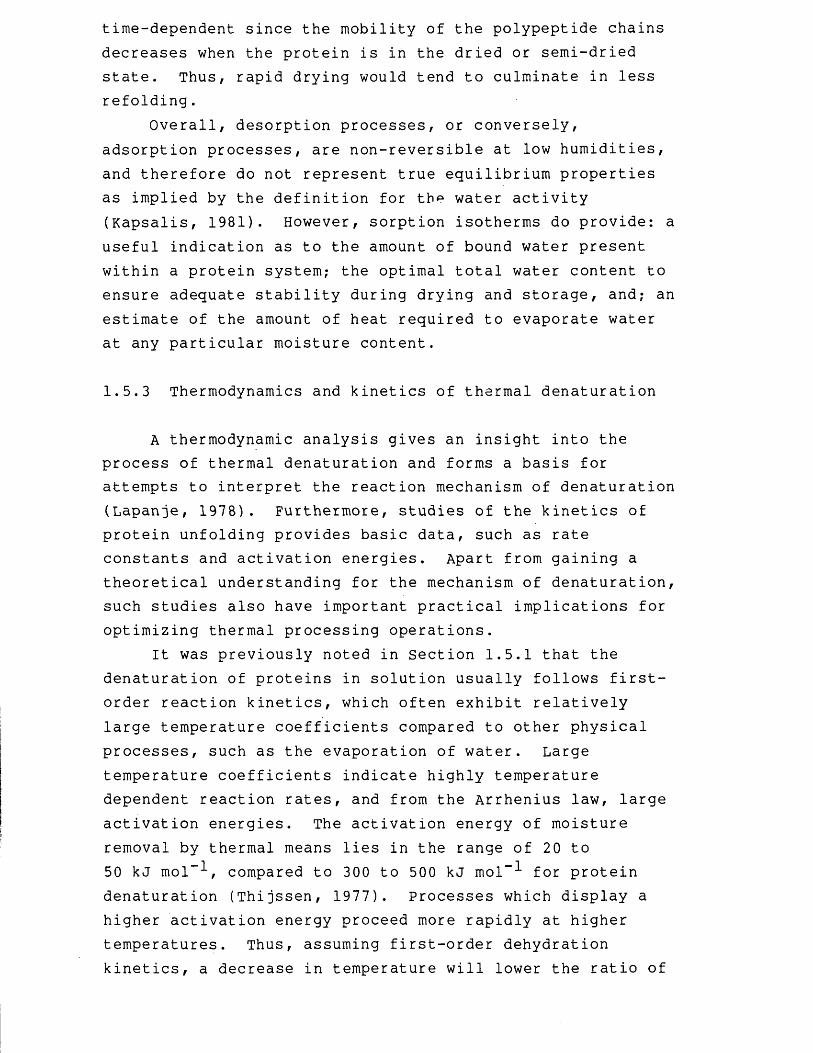
Another physical aspect to consider before attempting to describe vacuum drying mathematically is the variation of moisture distribution, in the slab of material, with respect to drying time. For a slab of material resting on a horizontal heated surface, moisture evaporation will occur almost exclusively at the heated interface during the constant-rate period (Strek & Nastraj, 1980). This is shown schematically in Figure 1.2. The newly formed vapour then flows from the so-called 'hot-layer' to the exposed surface as hydraulic flux created by the total pressure gradient across the depth of the bed. Liquid is transported to the hot-layer under the influence of the force of gravity and capillary forces, with frictional forces impeding the flow of liquid. As the frictional forces become more significant, that is the liquid must travel through narrower capillary channels in the material, and the liquid evaporated partly originates from loosely bound water regions in the solid (see Section 1.5), a critical point is reached, where the rate of evaporation is just counterbalanced by the flow rate of liquid to the hot-layer. Drying beyond the critical point develops a layer of dried material with an evaporating front which recedes from the heated surface as shown in Figure 1.2. To maintain a heat flux to the moving evaporating front a temperature gradient forms over the dried layer, which simultaneously absorbs heat. The total heat flux is restricted by the maximum permissible temperature rise of the dried product, and consequently the maximum drying rate during the falling-rate period is limited and continually decreasing.
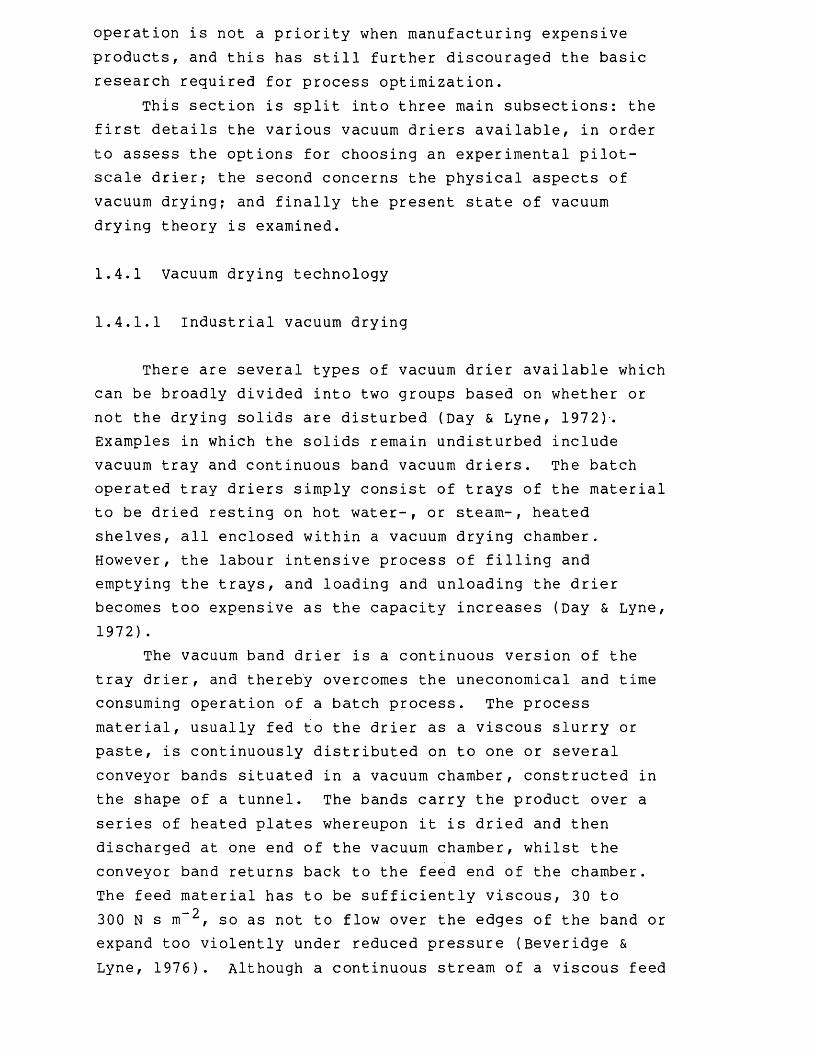
One final important effect, which is also observed during vacuum-freeze drying (Litchfield & Liapis, 1982) , is the decrease in thermal conductivity of the dried material as the total pressure decreases (Kumazawa et al., 1980).This is shown in Figure 1.3. This phenomena can be explained in terms of the mean free path of gas molecules

A: Constant-rate drying period
Exposedsurface Vapour transfer B*d of dry in9
material
Moisturetransfer
Evaporationfront
Flow of heatHeated plate
B: Falling-rate drying period
ExposedDrying materialsurface Vapour transfer
Evaporationfront
Dry material
Flow of heatHeated plate
Figure 1.2 Cross-section through a bed of material, resting on a heated surface, drying under reduced pressure.

0-04 o-oCN
003>i•H
•rH
002
10 100 1000 10000 100000
Pressure, N m~2
Figure 1.3 Effect of pressure on the thermal conductivity of dried fish meal protein.
Data taken from Kumazawa et al., 1980.
\

which at very low pressures is larger than the diameters of the spaces in which the gas molecules exist. As the pressure increases the mean free path of the gas molecules decreases, to become comparable to the space or pore size, which corresponds to the thermal conductivity increasing and gradually levelling off at atmospheric pressure.
1.4.3 Theoretical analysis of vacuum contact drying
The amount of literature published concerning vacuum contact drying theory is meagre, and is often merely an adaptation of vacuum-freeze drying theory. Generally, two cases exist which are either computer simulation based with little experimental corroboration, or experimentally based with a poorly developed theoretical analysis.
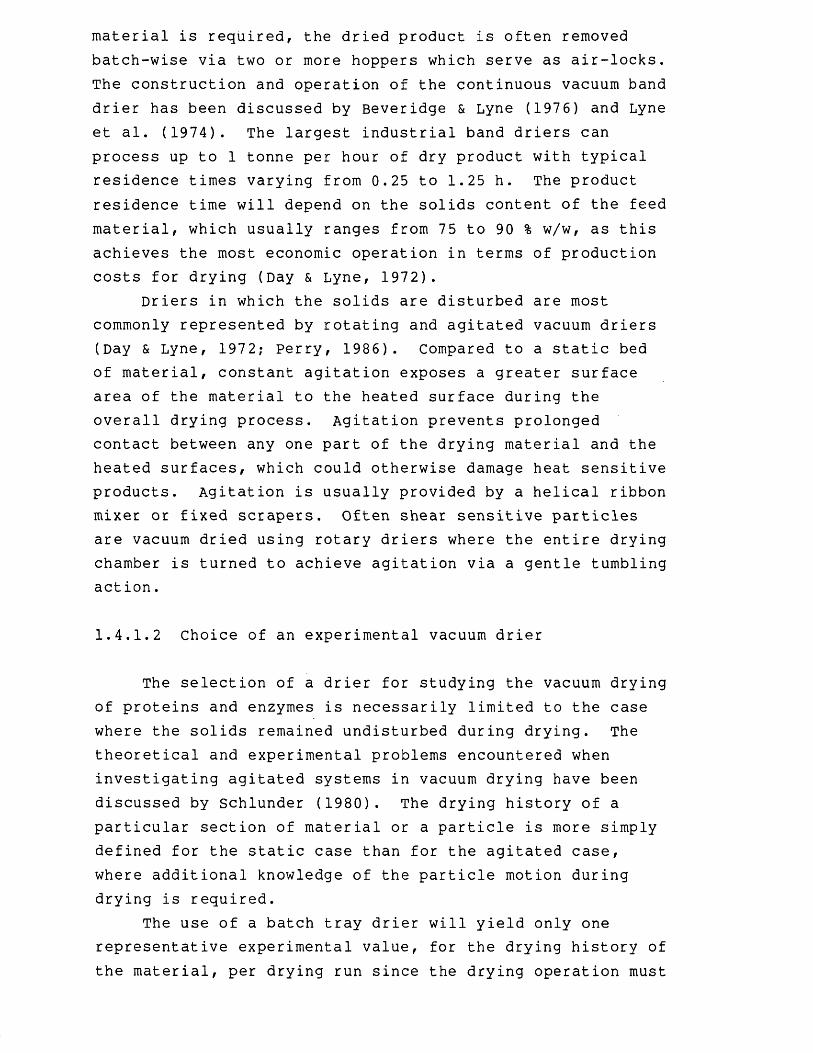
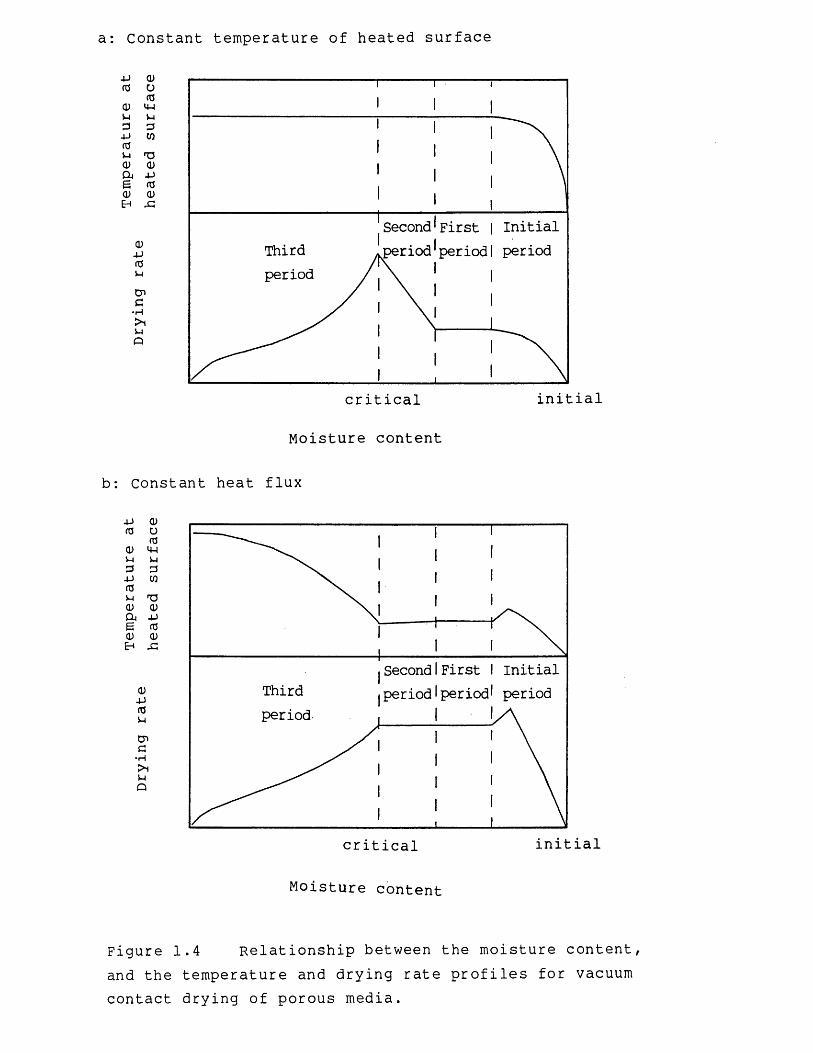
Strek & Nastaj (1980) used a computer simulation method, in conjunction with rather idealized experimental evidence, to investigate vacuum contact drying of porous media with internal porosity. The results obtained are shown in Figure 1.4 for two different cases, the first assuming a constant heated surface temperature, and the second, a constant heat flux to the solids. A constant heated surface temperature was maintained by adjusting the heat input. The initial drying period in Figure 1.4 corresponds to a warming-up period which can be ignored if the temperature of the feed material is adjusted to the initial drying temperature of the material. The first and second drying periods represent the constant-rate period, where vaporization only occurs at the heated surface, and the third drying period represents the falling-rate period, characterized by a moving evaporation front. In Figure 1.4a the increase in the drying rate during the second period is due to an increase in the surface area available for evaporation, whereby liquid is vaporized at the surface of the superheated solids, adjacent to the heated surface, in addition to evaporation at the heated surface.
Obviously the main aim in drying is to maximize the drying rate, or conversely minimize the drying time, with respect to the operating parameters of the drier and the physical properties of the process material. Thus, this
a: Constant temperature of heated surface
4J05<uu34JnjV-lQ)cugcuEh
0U034-1V-l3coT5<U4->05Q)Xi
0)4->05UC7>G•H>1i-JQ
Initialperiod
Second1 First period*periodThird
period
initialcritical
Moisture content
b: constant heat flux
XJ (1)05 u
05<D 4-ti-i34-J05U(D04 £ <D Eh
u3CO
T30)4-105Q)X
Q)4-105Ucnc>ip
Firstperiod
Initialperiod
SecondperiodThird
period
critical
Moisture content
initial
Figure 1.4 Relationship between the moisture content, and the temperature and drying rate profiles for vacuum contact drying of porous media.

analysis is directed towards determining an expression for the drying time. Kumazawa et al. (1980) described the continuous band vacuum drying process using the uniform receding evaporating front model with theory originally developed for vacuum-freeze drying. Using the analysis of Kumazawa for a continuous bed of material, of depth L^, and heated on one side, the following equation for the drying time is obtained:
_ AHV Lb2 Wi e sfcd " (1.1)
2 kt <Tpl - Tf>
where AHV is the latent heat of vaporization, kt is the thermal conductivity, is the initial moisture content, (? s is the bulk density of dry solid, and Tpl and Tf are respectively the temperatures of the heated surface and the evaporating front. This expression was similarly derived by Geankoplis (1983) for vacuum-freeze drying, except that an extra term was introduced to account for a finite final moisture content. However, several important assumptions were made which shall now be considered in turn.
No attempt was made to distinguish between the constant- rate period and the falling-rate period. During the initial stages the drying rate only depends on the heated surface temperature, and hence the thermal conductivity and depth of material will have no significance (Strek & Nastaj, 1980).In fact, the expression only describes the falling-rate period, and will therefore yield an over-estimate of the actual drying time. The external heat transfer coefficient for conduction from the heated surface to the solid was assumed negligible compared to the term Lb/kt , which is only true in cases where the evaporating front is far from the heated surface (Kumazawa et al., 1980). Modelling the constant-rate period is relatively easy, requiring estimates of the external heat transfer coefficient, and the temperature difference, between the heated surface and the evaporation front (see Section 5.2). The difficulty lies in predicting the moisture content of the product at which the constant-rate period ends.
The analysis also ignores bed expansion, which will affect the depth of material being dried and the overall
heat transfer coefficient across the depth of the dried solid. Unfortunately, no theory or empirical correlation exists which can predetermine the degree of bed expansion, and therefore the only alternative is on-line measurement of the depth of material during drying.
Finally, the whole process is assumed to be heat transfer controlled with no account taken for the diffusion of liquid or vapour through the solids. This is perhaps the most poorly understood area and, in the absence of diffusion data, is often ignored (Kawamura et al., 1977; Geankoplis, 1983). For the constant-rate period the diffusion of vapour through the wet solids may be the limiting transfer process, and for the falling-rate period the diffusion of both liquid to, and vapour from, the evaporating front may be limiting.
Incorporating some of the points outlined above, such as bed porosity, E, at time t^, the drying time may be expressed as follows (see chapter 5 for derivation of equation):
where is the dried solids density, is the initial bedporosity, L0 is the bed depth at t^ = 0, U is the overall heat transfer coefficient, Wj_, Wcr, Wf^ are respectively the initial, critical and final moisture content, and Tp^, Tf, TSmax are respectively the heated surface, evaporating front and maximum product temperature. The first term inside the square brackets represents the constant-rate period, and the second term, the falling-rate period. As would be expected bed expansion only increases the drying time during the falling-rate period while the constant-rate period only depends on the bulk density, (?as(l - E^), of the dry solid. Upon reaching the critical moisture content, changes in the bed porosity and the thermal conductivity may be assumed negligible, although ignoring changes in the latent heat of vaporization in the falling-rate period is an
td AHv (? ds (1 ^i ) Lbi
(1 .2)
oversimplification of real drying processes (Strek & Nastaj, 1980). Heat transfer by radiation from the heated plates has similarly been ignored since the heat input due to radiation incident on the product surface will be transmitted through the solid by conduction, and hence the theory is resolved in terms of conduction only. Often in industrial vacuum drying operations radiated heat is applied to the exposed surface of the product to increase the drying rate. However, in this study, this aspect of heat transfer shall not be considered, and all the heat to the product is assumed to be supplied via the heated plates situated beneath the slab of product.
1.5 Thermal effects on protein concentrates and powders
Thermal damage to proteins and enzymes during dewatering and drying affects the quality of the dried product. The pharmaceutical industry requires the minimum loss of activity in producing dry enzyme preparations, whereas in food processing the maximum inactivation of food degrading enzymes is desirable. The food industry also requires dried proteins possessing an appropriate range of functional properties (Kinsella, 1976). These properties are governed by the specific conformational state of the molecular structure of the protein, and subsequent changes in that state may result in loss of function. Generally, compared to denatured proteins, proteins retaining the structure of their native, or undenatured, state display superior functional properties, such as solubility, emulsifying, foaming and thermosetting properties. Thus, the phenomena of protein denaturation and enzyme inactivation are extremely important during dewatering and drying operations as regards the final product quality. Although protein denaturation depends upon many other factors (Lapanje, 1978), the most pertinent effect during a dehydration process is thermal denaturation, which therefore merits further discussion. The majority of research literature is confined to globular proteins, with which this discussion is concerned, though rod-like proteins can similarly undergo denaturation (Feeney, 1980).

1.5.1 Thermal denaturation of proteins and enzymes
Globular proteins exist in the crystalline state as compact, specifically coiled molecules and are believed to retain this state in aqueous solution (Tanford, 1960).Their native conformational secondary and higher structures are formed from a combination of weak hydrogen bonds, electrostatic and hydrophobic interactions and, in many cases, relatively strong covalent disulphide bonds. The process of this structural configuration undergoing a change as a result of heating is termed thermal denaturation or inactivation. Note that this study makes no distinction between denaturation and inactivation. Tanford (1968) gave a definition for the denaturation of proteins and enzymes in terms of gross changes occurring to the molecular conformation of the protein molecule. Enzymes may be also inactivated as a result of minor conformational changes, as well as major ones, or as a result of strong interaction between an inactivating agent and the catalytic or binding site of the enzyme. Except where otherwise stated protein denaturation and enzyme inactivation shall refer to gross conformational changes.
For small, compact globular proteins Privalov (1979) considered thermal denaturation as a co-operative transition between two macroscopic states, namely, native and denatured. Once a few bonds responsible for holding the shape of the protein structure, such as disulphide cross- linking, are broken, by having achieved sufficient activation energy, the secondary and tertiary structures are disrupted at a very fast rate. However, denaturation may not always proceed by this 'two-state' transition but be confined to segments of the protein structure, and involve little alteration of the overall structure (Lillford, 1978). The transition for a protein from the native to the completely denatured state occurs over a narrow range of temperatures, and the corresponding temperature coefficient of denaturation and the activation energy of denaturation are very high, compared to processes such as the evaporation of water (Thijssen & Kerkhof, 1977). The temperature coefficient is a measure of the sensitivity with increasing
heating temperature of protein denaturation. Often, the temperature coefficient is defined as the difference in the heating temperatures over which a 10 fold reduction in native protein is observed, all other denaturing conditions being equal. Generally, protein denaturation is considered to follow first-order reaction kinetics, according to the Arrhenius equation, though several predenaturation states are often involved, indicating the domination of a first- order reaction in a sequence of zero-order reactions (Lanpanje , 1978) .
Globular proteins will fold to attain an energetically favourable state, where changes in the entropy of the random state have been counterbalanced by the sum of the changes in the energy of interactions between the component polypeptides of the protein molecule. Usually the free energy change upon folding is minor compared to the correspondingly large enthalpy and entropy changes (Lapanje, 1978), and many proteins will readily unfold upon alteration of the enthalpy of the system. The amount of this free energy required to denature the initial native structure varies widely. Proteins containing disulphide cross-links, such as lysozyme and 11S soy globulin, demonstrate greater stability to thermal changes in state than proteins with few cross-links, such as ovalbumin and oc-lactalbumin (Kinsella, 1983). As with native protein folding, large enthalpy and entropy changes occur upon polypeptides unfolding and are gained from bond breaking, increased freedom of motion of the protein structure, and hydration of non-polar groups (Brandts, 1967).
Apart from different proteins displaying characteristic resistances to thermal denaturation, or rather thermal stabilities, the lowest temperature at which denaturation is first observed, and the temperature coefficient of denaturation, are dependent upon environmental conditions, including the moisture content, the pH and the ionic strength of the suspending medium. The effect of moisture content shall be considered in Section 1.5.2. Variations in pH and ionic strength presumably perturbs the thermodynamic equilibrium of the native structure of the protein to eventually induce denaturation. For some proteins the

maximum thermal stability, or the lowest rate of thermal denaturation, occurs at the isoelectric point (Lapanje, 1978). However, egg white and whey proteins exhibit their highest rate of denaturation in the isoelectric pH range (Kinsella, 1983). In excess quantities, acids or alkali may ionize buried groups within the non-polar/ interior, which are normally inaccessible to water molecules or hydroxyl ions, and increase the electrostatic repulsion between charged groups of the protein molecule. Upon ionization, the non-polar groups become hydrated, disrupt the native structure and cause unfolding (Perutz, 1974). The electrostatic interactions, or coulombic forces, are weakened by protonation of anionic groups at acidic pH, which induces molecular expansion due to hydration and increased electrostatic repulsions. Alkali similarly increase the repulsion between charged cationic groups, and may split covalent disulphide bonds (Kinsella, 1983). Perturbations due to pH changes are usually minimized by addition of stabilizing inorganic salts. Also, the complex effects of inorganic salts display a general trend of increasing stability with increasing salt concentration, though for some proteins the stability decreases at high concentration (Finch & Ledward, 1973). Salts either effect denaturation by electrostatic interactions (for example,Ca++ stabilization of amylase or precipitation of casein), or by chaotropic action in which the inorganic anions parallel pH effects by favouring the transfer of buried nonpolar groups to water (Hatefi & Hanstein, 1969).
For protein concentrates thermal denaturation is generally an irreversible process. However, several proteins have the ability to renature upon cooling if the appropriate environmental conditions are provided (Feeney, 1980). Sochava et al. (1985) studied ribonuclease and observed reversible thermal denaturation, even for protein concentrations up to 15 % w/w. Renaturation is sometimes misinterpreted as high thermal stability (Ruegg et al., 1977). For example, the high activity of alkaline phosphatase and ribonuclease in milk and peroxidase in vegetables after heat treatment was assumed to indicate high thermal stability or inadequate thermal processing

(Whitaker, 1977). Subsequent differential scanning calorimetry (see Section 1.5.4) studies revealed that conformational changes in the polypeptide structure had occurred at temperatures as low as 45 °C suggesting that thermal stability must be interpreted in terms of ability to renaturate and not by the elevated temperatures at which irreversible denaturation first occurs (Ruegg et al., 1977).
Irreversible denaturation occurs when denatured polypeptides are brought close enough together to combine intermolecularly. As the unfolding polypeptides randomly interact they may form insoluble precipitates, coagulates or gels, depending upon the protein type, concentration, heating and cooling rates, and the nature of the environment (pH, ionic strength, etc.). Irreversible denaturation is similarly observed during evaporation of water, even at room temperature, and during freezing of water molecules surrounding the protein molecule (Fukushima, 1980). The stabilizing protein-protein intermolecular forces responsible for insolubilization include ionic and hydrophobic interactions, hydrogen bonds and covalent disulphide bonds. Compared to coagulates or gels, precipitates are small, less hydrated aggregates, produced under more extreme conditions such as high temperatures and rapid heating (Kinsella, 1983). The difference between coagulates and gels is more difficult to define. Generally, gels are less disordered, and are formed when aggregation proceeds at a slower rate than unfolding. A coagulum is produced when aggregation occurs very rapidly, and the extent of polymer-polymer interaction is greater than polymer-solvent interaction. The formation of a gel requires a fine balance of polymer-polymer and polymer- solvent interactions (Tombs, 1974).
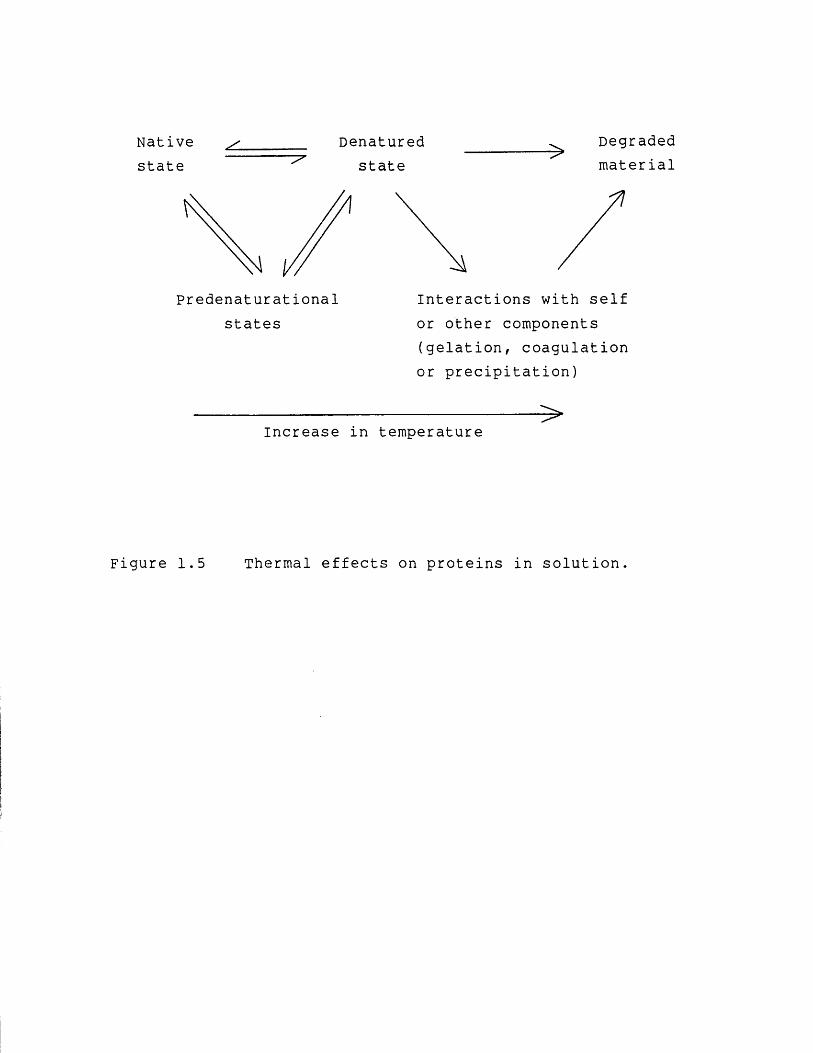
The extreme of thermal denaturation is degradation. At high temperatures, and for large heat inputs, denatured proteins undergo non-reversible degradation reactions, involving complete severance of covalent linkages to carbon atoms. However, such structural changes provide no useful product in terms of protein functionality and are necessarily avoided.
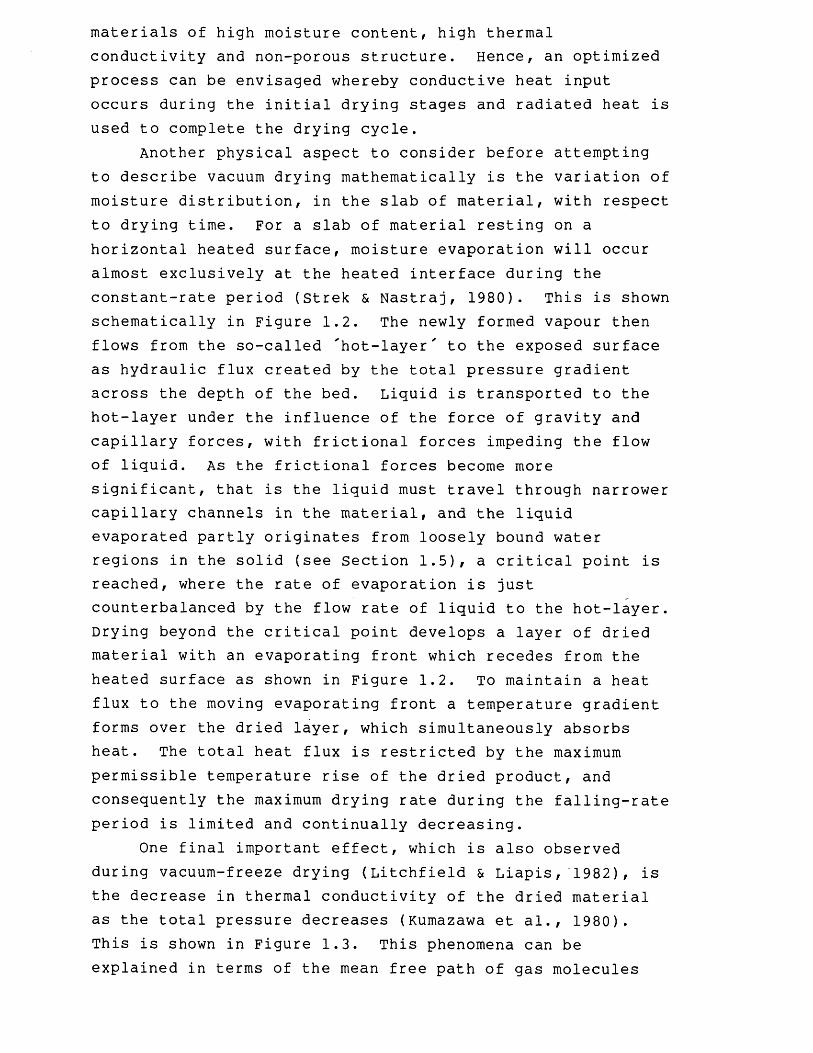
To summarize this section Figure 1.5 shows a schematic
Native ^ _________ Denaturedstate ^ state
Degradedmaterial
Interactions with self or other components (gelation, coagulation or precipitation)
>Increase in temperature
Figure 1.5 Thermal effects on proteins in solution.
i’!■
Predenaturat ional states

representation of thermal effects on proteins and enzymes in solut ion.
1.5.2 Thermal denaturation at low moisture levels
Water associated with protein molecules can be classified as constitutional (strongly bound), interfacial or multilayer (loosely bound) and bulk phase water (Fennema,1977). Constitutional and interfacial water both exhibit a reduced vapour pressure and mobility, compared to bulk phase water, due to the presence of the hydrophilic groups on the surface of the protein molecules. These hydrophilic groups contribute to enforcing organized structures of water molecules, which are in turn partly responsible for maintaining the native structure of protein molecules. Surplus thermal energy will progressively disrupt the organized structure of the water molecules, thereby weakening the hydrophilic interactions and eventually resulting in the collapse of the conformational state (Lewin, 1974). Not only is water necessary in forming protein structures, it is also required to flow into the spaces around tightly folded polypeptide chains as they are unfolding (Lewin, 1974). This fact is demonstrated by dry proteins displaying a greater thermal stability than proteins in solution. Similarly, protein concentrates are more stable than dilute protein suspensions (Daeman, 1981; Verhey, 1973). Usually, as the water content decreases to low levels significant increases in heat are necessary to denature proteins (Kinsella, 1983). Presumably, the increased thermal energy is required to disorganize and mobilize the more structured, or bound water molecules, to facilitate protein unfolding.
Mobility, or the availability of water for reaction, is reduced by concentrated sugar solutions and other polyhydroxy compounds. Van der Beek & Gerlsma (1960) observed an increase in the thermal stability of rennin in concentrated sugar solutions. Evidently these hygroscopic compounds stabilize the structure of bound water to thermal effects, and the level of flowing intersticial water is reduced, rendering conditions analogous to low moisture

content situations. For chemical and biochemical processes it is customary to express this availability of water forreaction by the water activity, aw , which may be defined asfollows:
aw - pw / pw° <3-3>
where Pw is the equilibrium water vapour pressure and Pw° isthe vapour pressure of pure water. Thus, the water activity, as opposed to the total water content, will yield a more meaningful correlation between the thermal stability of proteins and the levels of moisture content (Acker,1969).
There are several methods available for measuring the characteristics and amounts of tightly or loosely bound water in protein solutions. These methods may be placed into one of four groups according to the measurement technique employed: (i) thermodynamic; (ii) kinetic; (iii) spectroscopic, and; (iv) diffraction. These methods have been reviewed by Kuntz & Kauzmann (1974). The study of moisture sorption behaviour, an example of the thermodynamic method, is the most widely adopted technique for studying protein concentrates (Labuza, 1968). The moisture sorption relationship between the water activity and the-water content is commonly represented by desorption and absorption isotherms, although their interpretation is open to question (Kuntz & Kauzmann, 1974). All the absorbed water is assumed to be bound, which thereby implies that hydration would become infinite in infinitely dilute solutions. At lower water activities, below 80 % relative humidity (approximately 0.3 kg water per kg dry protein), hysteresis is always observed with the absorption (wetting) curve lying 10 to 30 % below the desorption (drying) curve (Kuntz & Kauzmann, 1974). Hysteresis may reflect conformational changes in the molecular structure of dried proteins which result from the formation of large voids formerly occupied by water molecules. As water is removed the polypeptide chains will attempt to regain an equilibrium state by randomly rearranging themselves to reduce the volume of the newly created voidage. This process of refolding may be
time-dependent since the mobility of the polypeptide chains decreases when the protein is in the dried or semi-dried state. Thus, rapid drying would tend to culminate in less refolding.
Overall, desorption processes, or conversely, adsorption processes, are non-reversible at low humidities, and therefore do not represent true equilibrium properties as implied by the definition for the water activity (Kapsalis, 1981). However, sorption isotherms do provide: a useful indication as to the amount of bound water present within a protein system; the optimal total water content to ensure adequate stability during drying and storage, and; an estimate of the amount of heat required to evaporate water at any particular moisture content.
1.5.3 Thermodynamics and kinetics of thermal denaturation
A thermodynamic analysis gives an insight into the process of thermal denaturation and forms a basis for attempts to interpret the reaction mechanism of denaturation (Lapanje, 1978). Furthermore, studies of the kinetics of protein unfolding provides basic data, such as rate constants and activation energies. Apart from gaining a theoretical understanding for the mechanism of denaturation, such studies also have important practical implications for optimizing thermal processing operations.
It was previously noted in Section 1.5.1 that the denaturation of proteins in solution usually follows first- order reaction kinetics, which often exhibit relatively large temperature coefficients compared to other physical processes, such as the evaporation of water. Large temperature coefficients indicate highly temperature dependent reaction rates, and from the Arrhenius law, large activation energies. The activation energy of moisture removal by thermal means lies in the range of 20 to 50 kJ mol”-*-, compared to 300 to 500 kJ mol” for protein denaturation (Thijssen, 1977). Processes which display a higher activation energy proceed more rapidly at higher temperatures. Thus, assuming first-order dehydration kinetics, a decrease in temperature will lower the ratio of
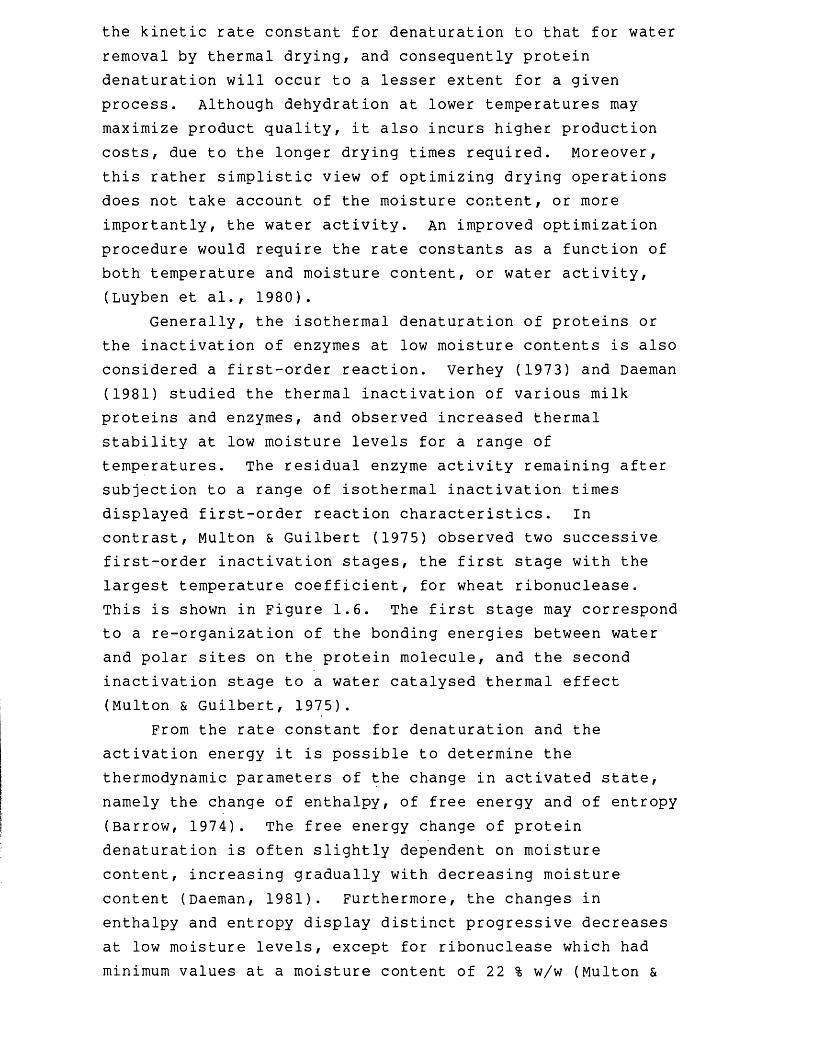
the kinetic rate constant for denaturation to that for water removal by thermal drying, and consequently protein denaturation will occur to a lesser extent for a given process. Although dehydration at lower temperatures may maximize product quality, it also incurs higher production costs, due to the longer drying times required. Moreover, this rather simplistic view of optimizing drying operations does not take account of the moisture content, or more importantly, the water activity. An improved optimization procedure would require the rate constants as a function of both temperature and moisture content, or water activity, (Luyben et al., 1980).
Generally, the isothermal denaturation of proteins or the inactivation of enzymes at low moisture contents is also considered a first-order reaction, verhey (1973) and Daeman (1981) studied the thermal inactivation of various milk proteins and enzymes, and observed increased thermal stability at low moisture levels for a range of temperatures. The residual enzyme activity remaining after subjection to a range of isothermal inactivation times displayed first-order reaction characteristics. In contrast, Multon & Guilbert (1975) observed two successive first-order inactivation stages, the first stage with the largest temperature coefficient, for wheat ribonuclease.This is shown in Figure 1.6. The first stage may correspond to a re-organization of the bonding energies between water and polar sites on the protein molecule, and the second inactivation stage to a water catalysed thermal effect (Multon & Guilbert, 1975).
From the rate constant for denaturation and the activation energy it is possible to determine the thermodynamic parameters of the change in activated state, namely the change of enthalpy, of free energy and of entropy (Barrow, 1974). The free energy change of protein denaturation is often slightly dependent on moisture content, increasing gradually with decreasing moisture content (Daeman, 1981). Furthermore, the changes in enthalpy and entropy display distinct progressive decreases at low moisture levels, except for ribonuclease which had minimum values at a moisture content of 22 % w/w (Multon &

58°C
>1•H•H-IJ■H
•H
•rHJ
O- □
1-51-00*50
time, h
Figure 1.6 Relative decrease of extractable ribonuclease activity in 35 % hydrated wheat, plotted as a function of the duration of the heating time, for several temperatures.
Data taken from Multon & Guilbert, 1975. f^O, 35 % w/w dry basis.
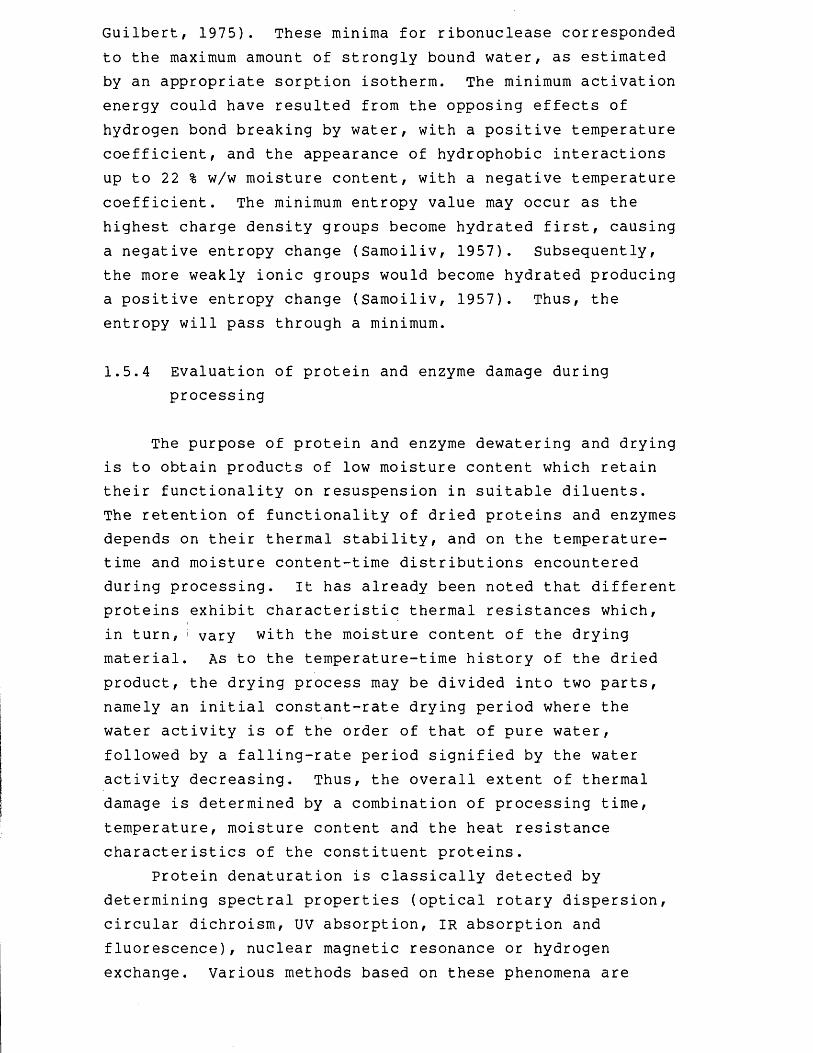
Guilbert, 1975). These minima for ribonuclease corresponded to the maximum amount of strongly bound water, as estimated by an appropriate sorption isotherm. The minimum activation energy could have resulted from the opposing effects of hydrogen bond breaking by water, with a positive temperature coefficient, and the appearance of hydrophobic interactions up to 22 % w/w moisture content, with a negative temperature coefficient. The minimum entropy value may occur as the highest charge density groups become hydrated first, causing a negative entropy change (Samoiliv, 1957). Subsequently, the more weakly ionic groups would become hydrated producing a positive entropy change (Samoiliv, 1957). Thus, the entropy will pass through a minimum.
1.5.4 Evaluation of protein and enzyme damage during processing
The purpose of protein and enzyme dewatering and drying is to obtain products of low moisture content which retain their functionality on resuspension in suitable diluents.The retention of functionality of dried proteins and enzymes depends on their thermal stability, and on the temperature- time and moisture content-time distributions encountered during processing. It has already been noted that different proteins exhibit characteristic thermal resistances which, in turn, ' vary with the moisture content of the drying material. As to the temperature-time history of the dried product, the drying process may be divided into two parts, namely an initial constant-rate drying period where the water activity is of the order of that of pure water, followed by a falling-rate period signified by the water activity decreasing. Thus, the overall extent of thermal damage is determined by a combination of processing time, temperature, moisture content and the heat resistance characteristics of the constituent proteins.
Protein denaturation is classically detected by determining spectral properties (optical rotary dispersion, circular dichroism, UV absorption, IR absorption and fluorescence), nuclear magnetic resonance or hydrogen exchange, various methods based on these phenomena are
employed in monitoring protein denaturation provided that the sample solutions are optically clear or pure (Lapanje,1978). Moreover, gross structural changes are indicated by measuring the solubility (Hansen, 1978) and transport properties, such as viscometry, sedimentation and diffusion (Lapanje, 1978). Downstream processing limitations and the heterogeneity of plant, microbial and food proteins confines the reported analytical methods of evaluating structural changes to differential scanning calorimetry (DSC), measurement of heat gelation time (Muir et al., 1978), gel rheological properties (Catsimpoolas & Meyer, 1970) and dissolution rates (papamichael et al, 1982).
DSC has proved indispensible for studying protein denaturation. The inherent ultilization of heat to examine thermal effects on protein structure is more desirable compared to techniques which directly imply that structural changes have occurred. This technique was applied by Papamichael et al. (1982) to determine the overall percentage recovery of native protein for resuspended, spray dried soya protein powders. Muir et al. (1978) measured the coagulation time at 40 °C for spray dried milk powders, reconstituted to their original total solids content, and was able to correlate the drying conditions to the coagulation time - pH profiles. Again, for spray drying, Papamichael et al. (1982) measured the dissolution rates of soya protein isolate, and the method appeared to be a more sensitive indicator, than DSC, of the operating conditions of the drier. Unfortunately, these methods of measuring protein damage are relatively time-consuming to perform, and thereby limit the number of samples that could be analysed in a reasonable time for a single experiment. Conversely, the quantification of enzyme activity changes is usually more convenient and faster to perform, due to the wide variety and typically fast procedures available with standard enzyme assay techniques. However, decreasing enzyme activity, incorrectly interpreted as thermal structure changes, may occur as a result of loss of active site functionality, due to, say, oxidation. To overcome this possible problem careful consideration should be given to the design of control experiments.

1.6 Conclusions
The following section is intended to summarize the discussions and describe the decisions reached during the Introduction.
The objectives of this thesis are to examine the final dewatering stage and its interaction with the finishing drying process. In order to yield relevant data suitable for scaling-up to an industrial-scale operation, pilot-scale equipment is to be employed to perform the experimental work. In this way the experiments can be conducted so as to mimic a typical industrial-scale process.
From Section 1.2 the choice of suitable equipment for the operating scheme of dewatering and drying of heat labile proteins and enzymes emerged as membrane filtration and vacuum drying. The choice of vacuum drying places a number of restraints on the dewatering operation, such as the requirement of a viscous, low moisture content feed material, this to prevent excessive expansion of the material under vacuum and to reduce the capital and operating costs of drying. To dewater protein and enzyme suspensions to such low levels of moisture content at a relatively high rate of filtration necessitates presenting the protein feed material in the form of the precipitate phase. Processing the protein in a soluble form is precluded due to the low permeation rates obtained at high concentrations of retained soluble protein. Thus, the filtration equipment has to process a concentrated, viscous, particle-laden suspension. Hollow-fibre ultrafiltration membranes are suitable for handling such process streams and will be employed for the experimental work. In addition, the thin-channel configuration of the hollow-fibres minimizes hold-up volume per unit of membrane area and enables small quantities of material to be processed, such as that remaining towards the end of a dewatering operation.
The vacuum drying experiments are to| be performed using pilot-scale continuous band vacuum drier. The configuration of the band drier does not require agitation of the product and the solids remain undisturbed during drying. This considerably simplifies the theoretical analysis of the
drying process. More importantly, the use of continuous, as opposed to batch, operation offers several experimental advantages. A batch-wise operated process yields only one sample per experiment so that a whole series of experiments, carried out for a range of drying times, would have to be performed to determine the drying history for a given set of operating conditions. Similarly, there is the difficulty of allowing for start-up and shut-down times. Continuous operation enables the entire drying history for a given set of drying conditions to be determined from one experiment. This derives from having the option to stop the drying process and sample material at any point along the band, and hence the final dried product and partially dried material, that has been exposed to the same drying conditions but different residence times, can be analysed.
The interaction of the membrane filtration and the vacuum drying operations depends on two main factors: the rheological properties of the dewatered protein concentrate, and; the cost per unit mass of water removed. As noted previously, the dewatered product should be viscous and of low moisture content. A viscous feed material is necessary to prevent the material expanding uncontrollably whilst maintaining sufficient vacuum level to enable product drying at low product temperatures. Similarly, due to the large difference in the operating costs of dewatering by membrane filtration and drying under vacuum, from an economic viewpoint the tendency is to take the dewatering process to its furthest limits, that is to dewater to the lowest possible moisture content. In the case of processing precipitated protein suspensions, the effect of dewatering to low moisture contents also increases markedly the suspension viscosity, and hence there is the dual incentive to attain a well-dewatered material.
Soya protein is to be employed as a suitable representative protein material for the experimental work. The advantages of adopting soya protein include: cheap, readily available food protein? little variation between batches; ease of large scale preparation; precipitate preparation and properties of precipitate material well documented and researched, and; relatively unstable to heat

denaturation. The last aspect listed above is a desirable property in that a challenge is presented to the process scheme to produce an active, dry protein. However, though it is possible to measure the extent of denaturation of soya protein, the experimental techniques available to quantify the extent of denaturation, such as differential scanning calorimetry, are time consuming. Thus, to enable more samples of material to be analysed quickly, the precipitated soya protein is to be "seeded" with an enzyme, the remaining activity of which can be conveniently measured after processing. For this purpose a relatively crude extract of glucose oxidase, partially purified by fractional precipitation, will be employed. Using a partially purified enzyme preparation will ensure that no extraneous1 effects to the enzyme as a result of further processing could have occurred, which may have been the case had the enzyme preparation been further purified and dried. As with soya proteins, glucose oxidase is also relatively unstable to heat denaturation.
2 Materials and Methods
2.1 Preparation of precipitated soya protein suspensions
For the dewatering experiments the precipitated soya protein suspensions were prepared from soya protein total water extract, TWE. For the drying experiments precipitated soya protein prepared from isolated soya protein powder was used since the presence of contaminating carbohydrates in the TWE prevented accurate measurement of enzyme activity (see Section 2.5.3.2).
2.1.1 Precipitated soya protein from TWE
Soya flour (Soya fluff 200 W, Interfood Ltd., Hemel Hempstead, Herts., UK) was dispersed in deionized water to form an 11 % w/v suspension. The suspension was agitated for 0.5 h using a 3-bladed pitched paddle of diameter 0.19 m driven at|5 rev s~^ in a 0.25 m^ single-baffled, jacketed tank at 20 °C. To solubilize the soya protein the suspension was adjusted to pH 9.0 + 0.1 using sodium hydroxide, 2.5 M, and further agitated for 0.5 h. The insoluble carbohydrates were removed by an intermittent discharge disk-stack centrifuge (Model SAMR 3036, Westfalia Separators Ltd., Wolverton, Bucks, UK) operated at a throughput of 0.18 m^ h”1 with partial desludging every 0.16 h. To prevent excessive aeration of the supernatant a back pressure of 3600 kPa was used. The clarified stream of total water protein extract, TWE, was returned to the jacketed tank, and cooled to 20 °C.
To obtain a higher protein concentration the TWE was slurried with fresh soya flour to form an 11 % w/v suspension which was processed as above to yield a TWE of 100 + 15 kg m”3 total protein. This was stored overnight at 3 + 2 °c.
The TWE was heated to 20 + 2 °C and adjusted to its isoelectric point, pH 4.7 + 0.1, using sulphuric acid,3.5 M, to precipitate between 70 to 85 % of the soluble soya protein. The precipitate was aged for 0.5 h using the jacketed tank described above. The isoelectric
precipitation was performed within 16 h of preparing the TWE.
2.1.2 Precipitated soya protein from isolated soya protein powder
Isolated soya protein powder (Purina Protein 710, Ralston Purina Company, Brussels, Belgium) was suspended in deionized water to 15 % w/v and agitated for 0.5 h at 20 °C using a 6-bladed turbine impeller of diameter 0.04 m driven at 10 rev s"1 in a baffled 5 L glass beaker. The suspension was then adjusted to pH 4.7 + 0.1 to precipitate between 75 and 80 % of the soluble protein at its isoelectric point. After ageing the precipitate for 0.5 h in the same 5 L vessel the suspension was centrifuged (Mistral 4L, MSE, Crawley, Sussex, UK) at an approximate RCF of 6500 for 0.75 h. The supernatant was then decanted off and the sediment resuspended to the desired moisture content and rheology by adding back supernatant. To measure product damage during drying the enzyme glucose oxidase (see Section 2.5.3.2) was added at 0.1 % w/w to the precipitated soya protein concentrate to give an initial enzyme activity of 23 + 3 IU g”-*- suspension (for definition of units see Section 2.5.3.2). The resultant mixture of sediment, supernatant and enzyme was blended by recirculating it through a gear pump (Model 615 B, Ibex Pumps, Sussex, UK) at 25 + 2°C for 0.67 h. During resuspension and blending great care was taken to ensure little or no air became entrained.
2.2 Membrane filtration
2.2.1 Equipment
The pilot-scale filtration equipment (Model HF ISSS, Romicon Inc., Woburn, Mass., USA) is shown in a schematic form in Figure 2.1. It consisted of a 0.1 m^ holding tank which was fully baffled, and tapered at the bottom to reduce the hold-up volume and to enable agitation of small volumes of retentate. Except where stated otherwise, the retentate was recirculated using a variable speed, positive
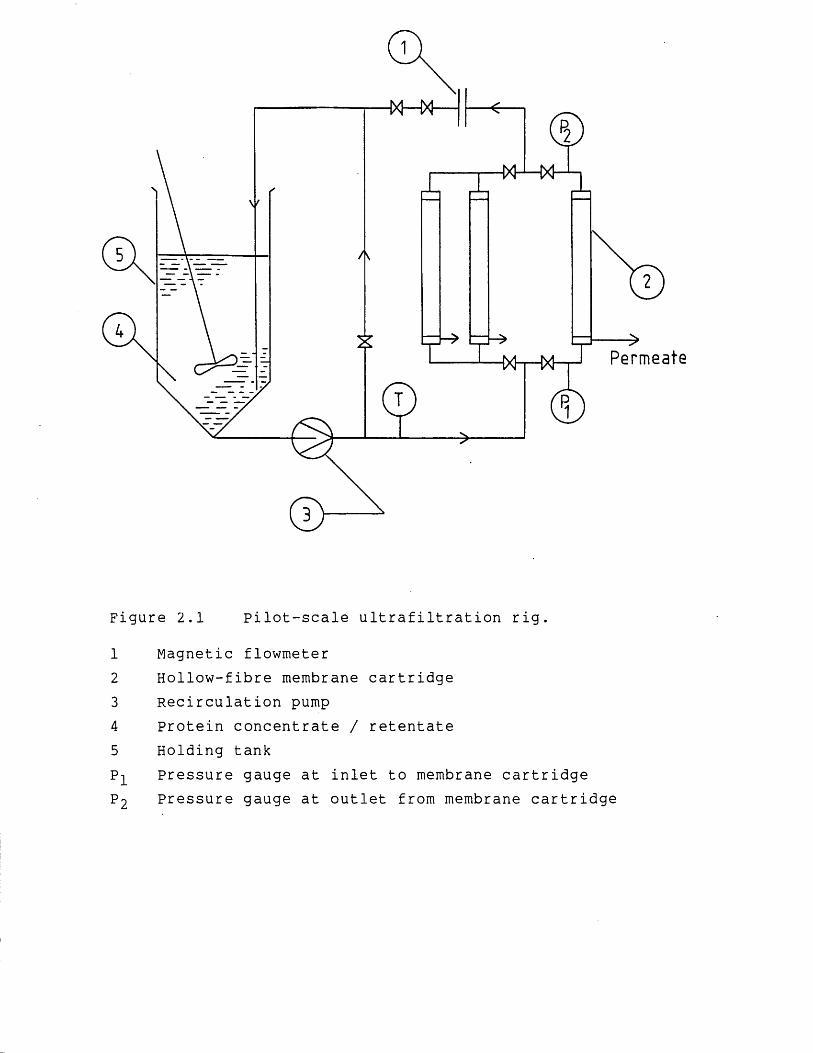
Figure 2.1 Pilot-scale ultrafiltration rig.
1 Magnetic flowmeter2 Hollow-fibre membrane cartridge3 Recirculation pump4 Protein concentrate / retentate5 Holding tankP-L Pressure gauge at inlet to membrane cartridgeP2 Pressure gauge at outlet from membrane cartridge
displacement, mono screw pump (Mono Merlin Model SAC12 HIRS/Hl, Monopumps, Manchester, UK) which could deliver flow rates between 1.2 and 7.5 m^ h“ for water at a temperature of 25 °C. One experiment was carried out using a centrifugal recirculation pump (Puma shrouded centrifugal pump, APV Co. Ltd., Crawley, Sussex, UK) which operated at similar maximum flow rates as compared to the mono screw pump. The temperature of the retentate was controlled to within + 1 °C by circulating a refrigerant (ethylene-glycol/water mixture) at 0 °C through a large cooling coil fitted inside the holding tank. To effect good temperature control the retentate was agitated using an 4- bladed turbine impeller, of diameter 0.16 m, which could be operated at low speeds, approximately! 1 rev s--*- to avoid air entrainment and foaming of the process material. The retentate flow-pressures were measured using diaphragm gauges (0-4 bar Type S, Anderson Instrument Comp., New York, USA) and the retentate flow rate was measured using a magnetic flowmeter (Model DN 25, Tekflo Ltd., Granby Ind. Est., Weymouth, UK). The diaphragm pressure gauges were calibrated using a standard test gauge (Bundenburg Gauge Co., Broadheath, London, UK). The calibration was performed under non-flow conditions with water in the pipe-work which was pressurized using compressed air.
The membrane filters used were PM50 (except where stated otherwise) hollow-fibre type ultrafiltration membrane cartridges of 0.315 and 0.635 m length and of 1.1 mm inner diameter. Also, a 0.315 m long, 1.9 mm diameter PM50 type and a 0.315 m long, 2.7 mm diameter PM500 type hollow-fibre membrane cartridge were used. Special pipe-work adaptors were used to accommodate membrane cartridges of different lengths without substantial modification to the rig, and up to three membrane cartridges could be operated simultaneously.
The design of the membrane filtration equipment is discussed in more detail in Chapter 3.
2.2.2 Maintenance of membranes
The membranes were conditioned from new in accordance

with the manufacturers instructions (Romicon Inc., Woburn, Mass . , USA) .
After processing the soya protein suspensions the membranes were subjected to rigorous cleaning. The membrane cartridges and rig were flushed through with soft water at 50 °C for 0.1 h. Any remaining protein was removed by washing with sodium hydroxide, 0.1 M, at 50 °C for 1 h.This was repeated and then followed by washing with sodium hypochlorite (BDH Chemicals Ltd., Poole, Dorset, UK), at 200 ppm available chlorine, at 30 °C for 1 h.
2.2.3 Membrane filtration of precipitated protein suspens ions
Prior to each filtration run the soft water flux was measured at fixed temperature and transmembrane pressure drop. Upon warming the aged precipitated protein suspension (for preparation see Section 2.1.1) a known volume, between 0.06 and 0.07 m^, was transferred from the batch precipitation tank to the holding tank. Before concentration the precipitate was recirculated for 0.33 h to remove any air from the pipe-work and membrane cartridges. This also enabled membrane fouling phenomena such as protein adsorption to be completed and the retentate to attain the operating temperature of 25 °C. The retentate was then ultrafiltered to the desired concentration at high flow rates to minimize membrane polarization. When examining the effect of changing the hollow-fibre membrane dimensions, during the same dewatering run, all the membrane cartridges examined were used for concentrating the retentate to reduce variations in the extent of protein fouling.
The retentate flow rate through the membrane cartridge was adjusted by varying the recirculation pump speed, and to achieve very low flow rates, a recycle line was employed which by-passed the cartridge and the associated instrumentation. For measuring the transcartridge pressure drop at various retentate flow rates the permeate was recycled into the holding tank to maintain a constant retentate concentration and viscosity. The transcartridge pressure drop was set by varying the retentate flow rate and
by applying a suitable back-pressure, achieved using two butterfly valves, positioned in series, which enabled the back-pressure to be controlled more precisely than compared to one single butterfly valve. Approximately 300 s after adjusting the pressure drop the permeate flow rate was measured using a measuring cylinder and a stop watch. When examining a series of flow rate settings at the same retentate concentration alternate high and low flow rates were employed at random to avoid any systematic experimental errors. Similarly, after using low flow rate settings the membrane cartridge was subjected to a high recirculation flow rate for 200 s to remove any polarizing material which may have accumulated at the membrane surface.
If more than one membrane cartridge was examined at the same retentate concentration, the recirculation pump was stopped, the membrane cartridges isolated and then interchanged to ensure that the same pressure gauges were used and the same flow conditions were experienced by each cartridge. After interchanging the cartridges, and before performing further experimentation, the retentate was slowly recirculated for 400 s to remove any trapped air, to avoid foaming the process material.
At each concentration the total volume of permeate removed was measured and permeate samples were taken for protein assay and retentate samples were taken for rheology measurements, dry weight analysis and particle size analysis (where indicated). The protein concentration in the retentate was calculated by a mass balance on the total protein in the system. To measure the retentate dry weights the samples were heated in a drying oven at 90 °C for 24 h.
2.3 Vacuum drying
2.3.1 Drying equipment
A pilot-scale continuous band vacuum drier was used to conduct the drying experiments. Essentially it consisted of a cylindrical vacuum chamber, with two large end doors and a glass column situated half-way along the drier to permit viewing of the product during drying. The vacuum was formed

by a liquid-ring vacuum pump and the vacuum level could be varied from very low pressures of the order of 1 kpa(abs) up to pressures of 75 kPa(abs), obtained by bleeding air into the vacuum chamber. During continuous operation feed material in the vacuum drier was dried by transporting it, using a conveyor band, across three heating sections, or heating plates, and a cooling plate. The function of the cooling plate was simply to cool the dried product prior to discharging it into a collection hopper at one end of the vacuum chamber. The temperature of the cooling plate was controlled by recirculating water through it. The heating plates were heated electrically and were temperature controlled independently, with energy being supplied to maintain the set temperature.
The design of the drying equipment is discussed in more detail in Chapter 3.
2.3.2 Operation of the drying equipment
Two modes of operation were possible which varied according to the manner in which protein concentrate was presented to the drier. One method, as described above, was to feed material continuously into the drying chamber and on to a moving conveyor band which transported the product over the heating and cooling sections. This method is used industrially. The other method was to layer the feed material into a large tray which was then placed batch-wise inside the drying chamber and moved over the heating and cooling sections in a similar fashion to material on the moving band. Operating the drier in either mode enabled the entire drying history of the material to be obtained from a single uninterrupted run since it was possible to stop the operation and sample dried or partially dried material at any point on the band or in the tray.
Under continuous operating conditions a suitably viscous feed material was pumped via several nozzle pipes on to the moving conveyor band. Ideally, when the material issues from the nozz:le pipes it should spread out across the moving band to form a continuous slab of material of well- defined thickness. Unfortunately, the dewatered

precipitated protein concentrates had a high moisture content and required a long residence time for drying.Thus, to dry the protein concentrates in a relatively short length pilot-scale drier necessitated employing very low feed flow rates. Preliminary drying experiments demonstrated that it was not possible to feed continuously the protein concentrates in a controlled fashion even when using a series of very narrow, 0.5 mm diameter, nozzle pipes. Similarly, during sampling, the dried and partially dried material on the heated band could not be sampled quickly enough to prevent a considerable amount of further drying and product damage occurring. The problems encountered with feeding the protein concentrates continually into the vacuum drier are further discussed in Section 5.1.
To overcome these problems the batch-wise feed system was adopted. Placing the protein concentrate in a tray before presenting it to the drier ensured that a uniform depth of material at the start of drying was achieved. Similarly, at the end of the drying experiment, when the protein concentrate was to be sampled for analysis, the tray could be removed quickly from the drying chamber and thereby minimize further drying or product damage occurring during sampling.
Under continuous operating conditions material at one end of the conveyor band is dry whereas material at the feed end has only briefly been exposed to the heated conveyor band. Material at all other points on the band has been dried to varying degrees depending on the position relative to the feed end of the conveyor band. In order to mimic the continuous operation of feeding material into the drier and on to the heated conveyor band, the tray of protein concentrate was moved slowly on to the heated plates so that material towards the front of the tray was exposed to the heat source for longer periods than the material at other points in the tray. By suitable adjustment of the speed of the moving tray at the start of the experiment and by stopping the drying operation when the rear end of the tray just moved on to the heated surface, then the material at the front of the tray would be dry whereas the material at
the rear end of the tray would not have been dried at all. Material at all other points along the tray would have been partially dried, the time of exposure to drying conditions depending on the position in the tray. To minimize drying and expansion of the material before it reached the heated surface, the tray was moved on to the heated surface from the cooling plate. This is shown schematically in Figure 2.2. This is counter to continuous operation where the material moves in the opposite direction from the heated surface to the cooling surface. However, this has no effect on the analysis of the experimental results.
The first experimental tray was constructed of aluminium, and the tray itself was placed on the conveyor band. As a construction material aluminium had the advantage of being a good conductor of heat and its rigid structure enabled a tray to be fabricated with a flat base, thereby ensuring that the conveyor band contacted the tray at all points. However, the aluminium tray readily conducted heat along its length which prevented steady state drying conditions from being attained. The solution to this problem was to construct the tray of the same material as the conveyor band, that is glass fibre mesh coated in PTFE (Tigaflor 162G/10T, Fothergill Tigaflor Ltd., Littleborough, Lancs, UK). Although this material is an insulator it is relatively easy for heat to be conducted in the perpendicular plane compared to conduction along the length of the material. Thus, heat supplied to the underneath of the conveyor band was transmitted to the other side with relatively little heat transmitted in a lateral direction.
The tray was nominally 0.58 m long and 0.30 m wide which corresponded approximately to the dimensions of the individual heating sections or plates. To obtain a better correspondence between this batch-wise feed system and the continuous system using the moving conveyor band, the conveyor band was removed completely and the tray was allowed to rest directly on the heated surfaces. The tray itself was attached to the drive roller for the conveyor band (see Chapter 3) the speed of which could be varied to achieve the desired product residence time.
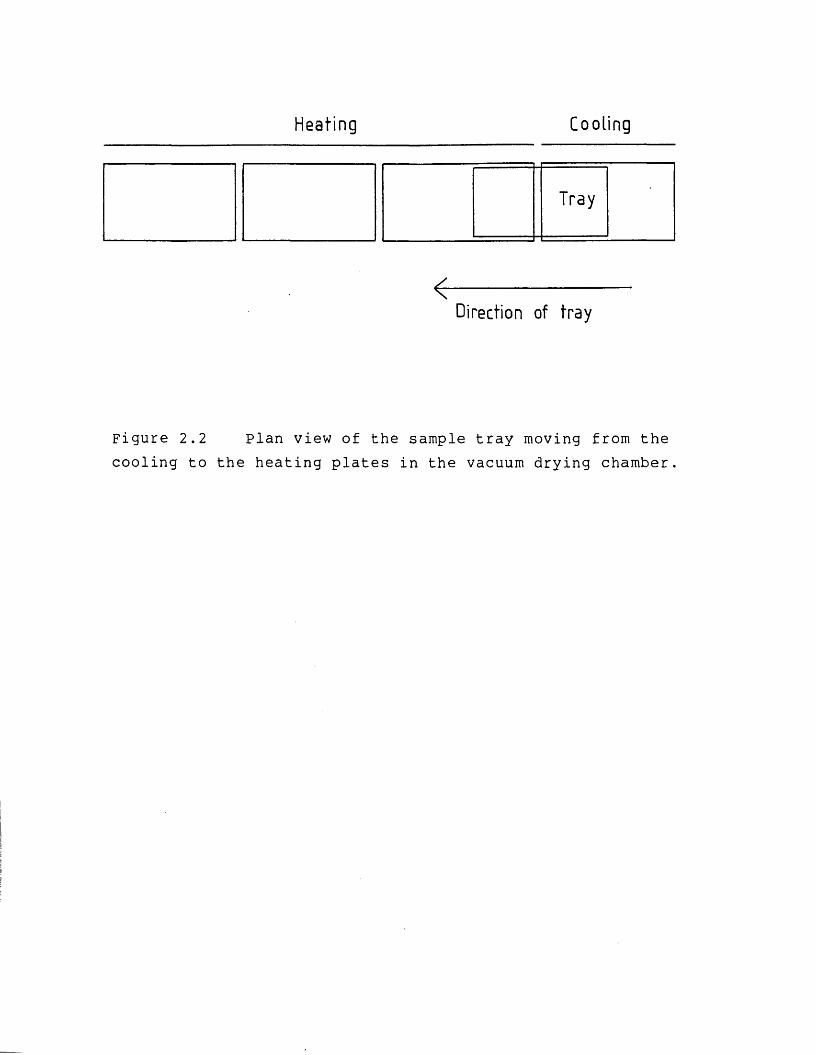
Heating Cooling
Tray
<------Direction of tray
Figure 2.2 Plan view of the sample tray moving from the cooling to the heating plates in the vacuum drying chamber.

2.3.3 Vacuum drying of precipitated protein suspensions
The preparation of the drier feed material is described in Section 2.1.2. The feed material was layered into the tray and carefully levelled, using a metal template, to a uniform depth of 3.5 + 0.1 mm. For the highest vacuum levels employed product expansion prior to drying was minimized by initially cooling the material in the tray to 4 °C in a freezer and then by maintaining the temperature at 10 °C whilst the product was over the cooling plate.
Preliminary drying experiments demonstrated that the temperature of the heating plate, for all points on the surface of the plate, varied according to whether or not there was product being dried at that point during the course of the experiment. Similarly, the nature of the drying product affected the heating temperature. For a moist product more heat energy was required for drying and subsequently a lower temperature, compared to the average temperature of the entire heating plate, was observed. In contrast, for an almost dry product comparatively little energy was used for drying and the heating temperature was higher than the average value. To attain a steady state heating temperature, + 2 °C, at all points on the heated plate, the following procedure was adopted. The heating plates were allowed to heat up to the set-point temperature without any product being dried. A vacuum was formed in the drying chamber and a tray of the product to be dried was moved slowly on to the heated plate. The speed of the tray was adjusted to ensure that the product at the front of the tray was dry upon traversing the length of the first heating plate. The vacuum was released and a second identically prepared tray of precipitated protein material was placed in the drier on the cooling plate. This tray was attached on to the first tray, the required vacuum level was formed once again and the two trays set in motion. The elapsed time between stopping and restarting the vacuum drier was less than 300 s. The drying run was stopped when the end of the second tray reached the edge of the first heating plate, and all of the sample had been dried or partially dried. This procedure enabled steady state heating temperatures to be
attained.because the nature of the drying product, that is the moisture content, at each point along the length of the heating surface varied with time only to a small extent after the first tray had passed over the heated surface. On completing the run the vacuum was released and the sample tray removed all within 30 s, compared to a typical drying time of 1 h for the dried product, to prevent further drying or product damage occurring. For each experiment a control or reference sample was placed on the cooling plate inside the drying chamber for the duration of the drying experiment. The control sample was layered to a depth of 3.5 + 0.1 mm on a piece of the material used to construct the sample tray.
The temperature of the drying product was monitored using Type K, Teflon insulated, 0.2 mm diameter, platinum wire thermocouples. These thermocouples were either situated in contact with the heated tray surface or approximately 2 mm above the tray surface. Four pairs of thermocouples were employed to measure the product temperature and were positioned at equi-spaced intervals along the length of the sample tray. By monitoring the product temperature continuously at different positions along the tray and by noting the position, with time, of the thermocouples relative to the heated plate it was possible to assess whether the drying process was at steady state.The temperature of the first heating plate was measured along the length of its centre-line by inserting into the plate 10 equi-spaced thermocouples, of the same type as was used to measure the product temperature. All the thermocouple readings were monitored and recorded with the aid of a desk-top computer.
The moisture content and the remaining enzyme activity of the dried and partially dried material were determined by taking 24 samples from known positions along the centre-line of the tray. Samples were taken only from the centre-line of the tray since material at the edges was often over-dried and unrepresentative of the dried or partially dried material as a whole. The samples analysed were representative of the entire depth of material dried. To measure the moisture content 12 of the samples were placed
in a drying oven at 90 °C for 24 h. The remaining 12 alternately positioned samples were weighed, and diluted in deionized water, and then agitated slowly for 0.15 h and left for 12 h to ensure the samples were completely dispersed. The samples were then further diluted in phosphate buffer (pH 6.0, 0.1 M) and assayed for enzyme activity (see Section 2.5.3.2). In order that the overall enzyme dilution could be determined the moisture content of the partially dried samples to be assayed was estimated by interpolation. To determine the percentage of enzyme activity remaining the measured activities were compared to the control sample which was similarly placed in the drying chamber during experimentation.
2.4 Enzyme denaturation
The kinetics of glucose oxidase inactivation were studied by incubating the enzyme in either a heated water bath or a heated metal bar. The heated metal bar was constructed 'in house', and consisted of a 1 m long aluminium bar with a series of holes drilled along its length, into which 5 mL glass test-tubes could be inserted. The bar was heated at one end using a 1 kW electric heater and cooled at the other end using a refrigeration unit (Model type LE8, Grant Instruments Ltd., Barrington, Cambridge, UK). By suitably adjusting the cooling rate the heated bar could be used to incubate the enzyme suspensions over a range of temperatures from 30 to 75 °C. The glucose oxidase was diluted to 1 kg kg"-*-, or 25 IU mL”-*- (for definition of units see Section 2.5.3.2) in deionized water or precipitated soya protein suspensions, prepared from isolated soya protein as described in Section 2.1.2, except where stated otherwise. In all cases, 2 g of the enzyme preparations were placed in 5 mL glass test-tubes (8 mm inner diameter) and incubated using either a thermostatically controlled (temperature + 0.5 °C) water bath or the heated metal bar. Upon heating the enzymes for the desired time period the test-tubes were cooled down rapidly to 25 °C to minimize further inactivation. For the enzyme suspended in the protein concentrate the inactivated

samples were resuspended in deionized water and left for 12 h at 4 °c before assaying for activity.
2.5 Analytical techniques
2.5.1 Rheological measurements
For the rheological measurements the protein concentrates were prepared as described in Section 2.1. To prepare very high concentrations of precipitated soya protein from TWE the precipitate was sedimented in a bench centrifuge (Mistral 4L, MSE, Crawley, Sussex, UK) at an RCF of 6500 and temperature of 4 °C for 0.5 h. The sediment was then resuspended in the supernatant to achieve the desired protein concentration. All the samples were agitated at a shear rate of approximately 50 s"-*- for 10 s prior to analysis to ensure the suspension was homogeneous and that no liquid had drained off. All measurements were made at 25 °C.
2.5.1.1 Apparent viscosity
The apparent viscosity of the precipitated soya protein suspensions was measured using a rheometer (Rheomat 115, Contraves A.G., Zurich, Switzerland) fitted with several rheometric geometries which were varied according to the concentration of the suspension to be analysed. For the most dilute suspensions examined a double-concentric cylinder geometry (0.45 mm gap, No. 1092, Contraves AG) was most suitable. The more concentrated suspensions required using either a cone-and-plate (0.5 0 - or 2 ° - angled,50 mm diameter cones, No. 5 and No. 6, Contraves AG) or a coni-cylindrical (0.95 mm gap, No. 125, Contraves AG) geometry (see also Section 4.3.2.2 for further discussion). The coni-cylindrical geometry is a combination of the cup- and-bob and cone-and-plate geometries and has the advantage of virtually eliminating end effects (van Wazer et al.,1963).
The rheometer was thermostatted at 25 °C using a water bath. Evaporation effects were minimized by using a
stainless steel hood. The torque readings for the suspensions were recorded 10 s after changing the shear rate over an increasing and then decreasing shear rate cycle.All the measurements were duplicated and the torque data averaged. The maximum experimental errors were + 5 % of the torque reading and could be attributed mainly to the presence of air bubbles which had become entrained while the material was being prepared and handled.
Rheological measurements were also made using an Instron 1141 Food Tester (Instron Ltd., High Wycombe,Bucks., UK) modified to house a range of capillary tubes.The capillary tubes (coopers Needle Works Ltd., Birmingham, UK) were made of precision bore stainless steel. The tubes were mounted in a reservoir barrel, of inner diameter 9.54 mm, and a piston was driven at a known speed and forceto cause the protein concentrate to flow from the reservoir
/
barrel through the capillary tube, whereupon it was discharged into an open receiver. Varying the piston speed and the diameter of the capillary tube enabled a wide range of shear rates to be obtained. To feed the protein concentrates into the reservoir barrel, the concentrate was initially pumped (gear pump, Model 615B, Ibex Pumps, Sussex, UK) into a length of plastic tubing, of inner diameter 10 mm. The plastic tube was then inserted into the end of the reservoir barrel and the concentrate forced into the barrel using positive air pressure.
2.5.1.2 Shear modulus
The shear moduli of the precipitated soya protein suspensions were measured using a 'Pulse Shearometer' (Rank Brothers, High Street, Bottisham, Cambridge, UK). The instrument consisted of two parallel discs which were each mounted on a piezo-electrical crystal. The upper disc initiated a torsional shear wave which was propagated through the protein suspension, placed in a small gap between the two discs, and was detected by the lower disc. The frequency of the generated wave was approximately 200 Hz. The gap setting between the two discs was adjustable, and was varied from 3 to 10 mm according to the
concentration of the protein concentrate to be examined.The gap setting was adjusted to enable the detection of a measurable signal whilst maintaining a large gap to minimize errors due to non-parallelism of the discs. The propagation time of the shear wave was measured with the aid of a BBC microcomputer. The slope of the graph of propagation time against disc separation yielded the wave velocity. A value of the shear modulus, G, was then calculated from the approximation:
G = (?b V2 (2.1)
where v is the wave propagation velocity and is the density of the suspension.
2.5.2 Particle size analysis
Particle size analysis was carried out using an electrical sensing zone method (Elzone, Particle Data Ltd., Cheltenham, Gloucs., UK) with a statistics computing accessory (Karuhn and Berg, 1982). The analyser was fitted with a 30 pm orifice tube and calibrated using latex standards (Particle Data Ltd.). The protein suspensions were suitably diluted in sodium acetate buffer (pH 4.6,0.07 M, 0.1 pm filtered and vacuum degassed) to give a coincidence count of less than 0.5 % during size analysis. Coincidence refers to the case when two or more particles pass through the orifice at the same time and are counted as one larger particle. Good dispersion was maintained during the dilution procedure and size analysis, and particular care was taken to exclude any foreign particles.
2.5.3 Protein assay techniques
2.5.3.1 Total protein
The total soya protein concentration was measured using the Biuret method as described by Gornall et al. (1949). Bovine serum albumin (fraction V, Lot 84F-0099, 96 to 99 % albumin, Sigma Chemical Co. Ltd., Poole, Dorset, UK) was
used as a calibration standard.
2.5.3.2 Glucose oxidase
Glucose oxidase catalyses the oxidation of D-glucose to D-gluconic acid as follows:
Glucose + C>2 + H2O glucose Gluconic acid + H2O2 (2.2)oxidase
The glucose oxidase activity was measured by reacting the hydrogen peroxide produced with cr-dianisidine which converts the cr-dianisidine from the reduced form to the oxidized form as follows:
The rate of accumulation of oxidized cr-dianisidine was measured spectrophotometrically at 460 nm and 25 + 1°C over a period of 250 s. The activity was calculated as follows:
where AAS and AAb were respectively the rate of change of absorbance per minute for the sample and the reagent blank, and d was the total dilution used on the original sample.One International Unit (IU) of enzyme activity is the amount of enzyme that liberates one micromole of hydrogen peroxide per minute at 25 °C. The samples to be assayed were diluted in phosphate buffer (pH 6.0, 0.1 M) to a final concentration of approximately 0.10 to 0.50 IU g--*-. The reagents used for the reactions in Equations 2.2 and 2.3 consisted of:8.33 xl0“ g mL--*- cr-dianisidine; 1.8 % v/v p-D-glucose;2.65 xl0“ g mL-1 horseradish peroxidase (No. P-8125,Type I, Lot 15F-9520), and; 1.7 % v/v of the diluted enzyme. All the reagents were supplied by Sigma Chemical Co. Ltd., Poole, Dorset, UK. The glucose oxidase (supplied by J. and
cr-dianisidine + H2O2 (reduced)
peroxidase> o-dianisidine + H2O (2.3) (oxidized)
IU g"1 = 5.4 ( Aa s - AAb ) d (2.4)
E. Sturge Ltd., Selby, North Yorks, UK) was a postfermentation product which had been purified by fractional precipitation but had not been dried.
3 Equipment Design
3.1 Introduction
This chapter is intended to provide information which was not covered by the Materials and Methods chapter on the engineering design of the pilot-scale dewatering and drying equipment. Where possible the pilot-scale design is compared to the corresponding industrial-scale equipment.
The reasons for adopting membrane filtration and vacuum drying, for dewatering and drying protein and enzyme materials, have been discussed in the Introduction and shall not be considered here. The design of the equipment is also discussed in Chapter 6 in retrospect of the experimental results.
3.2 Membrane filtration
3.2.1 Membrane and membrane module
The membrane and the module that supports and houses the membrane are the essential basic components of membrane filtration equipment.
The choice of membrane type and molecular weight cutoff is a somewhat arbitrary process. Biological feed streams usually contain one or several solute species that become attached to the membrane surface to reduce markedly the solvent flow or flux through the membrane, often by as much as a ten-fold reduction compared to the pure solvent flux. To minimize adsorption of such membrane fouling species, the membrane is usually chemically modified with positively or negatively charged groups on the membrane surface which repel likewise charged solutes present in the process stream. Traditionally cellulose based membranes have been the most commonly employed although many other physically and chemically more durable membranes made from synthetic polymers are now commercially available. The more widely adopted of these polymers include aromatic amides, polycarbonates, polysulphone, polypropylene and polyacrylonitrile. Inorganic membranes can also be

fabricated, using materials such as alumina and silica- glass .
The molecular weight cut-off of commercially availablecultrafiltration membranes varies from 500 to 3 xlO daltons.
There is a large difference, 3 orders of magnitude, in the flux rate for water between these various membranes (Le & Howell, 1985). However, the difference in permeabilities for protein solutions varies less markedly. The most likely hypothesis for this is that the water permeability depends only on the surface properties of the membrane, all other factors such as pore size and membrane porosity being equal. These surface properties lose their influence when the membrane surface is covered with a layer of protein molecules. In this case the flux depends on the degree of protein adsorption to the membrane and the extent of concentration polarization. When processing soluble proteins where total protein recovery is desirable then the molecular weight cut-off, or pore size, of the membrane should be smaller than the molecular weight of the protein of interest. However, membranes with larger molecular weight cut-offs may be employed since the protein rejection qharacteristics of the membrane are also influenced by particle bridging, which can occur even for pore sizes one order of magnitude greater than the solute size (Le &Howell, 1985). Similarly, solute adsorption on the pore wall will reduce the effective pore size and increase solute rejection.
In general, the process of membrane and molecular weight cut-off selection is performed using small laboratory ultrafiltration equipment in order to evaluate the performance of a range of possible membranes. Precipitated soya proteins have previously been successfully concentrated using polysulphone (PM50) and modacryl polymer (XM50) ultrafiltration membranes (Devereux et al., 1986a). The molecular weight cut-off of 50000 daltons permits some of the smaller molecular weight soluble soya proteins remaining in the suspension to permeate through these membranes. Although other membrane types may be employed, the polysulphone membranes (PM50) were considered suitably appropriate for the experimental studies reported here.

Unlike membrane type, the choice of membrane module is a more defined process with basic principles of engineering design. In general, modules are designed to provide high flow rates of material over the membrane surface to minimize the concentration of polarizing materials at the membrane surface, and to provide support for the membranes. The ideal module should incorporate the following characteristics: high membrane packing density, or low holdup volume; uniform pressure distribution over the membrane surface, and; high pressure operation. Also the module should be designed to prevent the formation of dead spots on both sides of the membrane where bacterial growth or accumulation of deposits may occur to cause product contamination. In addition, for dewatering precipitated protein or enzyme concentrates prior to vacuum drying the modules should be capable of handling high and low viscosity suspensions with a high solids content.
There are several modules manufactured commercially today, including flat sheet, spiral wound, tubular and fibre bundle. The advantages and disadvantages of these modules have been discussed elsewhere (Le & Howell, 1985). For the pilot-scale equipment it was decided to employ the fibre bundle or hollow-fibre configuration. The low hold-up volume of the hollow-fibres enabled relatively small batch volumes to be highly concentrated without using large quantities of feed material. Typically, hollow-fibre membranes are 0.5 to 1.0 mm in diameter and cannot process highly concentrated viscous materials without exceeding the recommended operating pressures of the membranes. To enable dewatering to higher protein concentrations larger diameter hollow-fibres, up to 2.7 mm, were used.
From the view-point of operating at an industrial- scale, hollow-fibres and other thin channel modules require relatively low flow rates of retentate material to control polarization, and therefore the recirculation costs are small compared to tubular modules. In addition, the hollow- fibre membranes can withstand a negative pressure difference which enables the permeate shell-side to be pressurized to unblock membrane pores and aid the removal of accumulated deposits on the membrane surface, even while the process is
running. One drawback of the present generation of hollow- fibre membranes is the low operating pressure which limits the maximum attainable permeate flux rate. Despite this disadvantage, hollow-fibre membranes would be an option considered for the large scale dewatering of precipitated protein and enzyme suspensions.
The final decision on the choice of membrane and membrane module would be economic. Thus, the capital cost of the membranes and the durability of the membranes for processing precipitated proteins and enzymes are important factors that must be taken into consideration. However, this should not be the concern of the experimental work, which is to examine the effect on the permeate flux rate of the fluid hydrodynamics and the properties of precipitated protein suspensions. Thus, the experimental findings for the hollow-fibre membranes should be adaptable to other modules. Also, the new generation of ceramic membranes are fabricated with a similar module geometry to the hollow- fibres, that is the retentate flows through a series of parallel circular membrane channels, and the experimental findings should be directly applicable, ceramic membranes can be operated at very high pressures and are particularly advantageous for processing biological feed streams since they can be fully steam sterilized, and thereby enable a high level of sterility to be maintained.
Previously hollow-fibre membranes and modules have been used by Devereux et al. (1986a) for concentrating precipitated soya protein suspensions to high concentrations. Devereux & Hoare (1986) also demonstrated that there was potential for scale-down of the ultrafiltration process where one or several individual hollow-fibres may be employed to form a small laboratory- scale ultrafilter.
For the overall process of dewatering and drying an intrinsic advantage of using hollow-fibres for the dewatering operation derives from the operation of a continuous band drier. Here the dewatered feed material is pumped into the vacuum chamber through a series of capillary nozzle tubes of similar diameter and length to the individual hollow-fibres. Thus, any basic knowledge and
understanding gained from studying the flow of concentrated suspensions in the hollow-fibres could be applied to also describe the characteristics of the feed system to the vacuum drier.
To extend the studies of protein precipitate dewatering to lower moisture contents suitable for feeding to a vacuum drier, Romicon Inc. (Woburn, Mass., USA) supplied a range of hollow-fibre membrane modules. Included in this range were large diameter - short length hollow-fibre modules which were not available commercially.
Thus, polysulphone membrane type hollow-fibre modules were used to conduct the majority of the dewatering experiments. The specification for the dimensions of the hollow-fibre modules for dewatering precipitated protein suspensions is further discussed in Chapter 6.
3.2.2 Recirculation pump
Industrial membrane filtration rigs usually employ single or multi-stage centrifugal pumps which offer high flow rates for their size, non-pulsatile flow, low investment costs and low maintenance expenses. However, the high viscosity and non-Newtonian nature of concentrated protein suspensions would normally preclude the use of centrifugal pumps since they are prone to cavitation and eventually stop pumping at even relatively moderate concentrations (Devereux et al., 1986a). Also, individual centrifugal pumps only operate efficiently over a narrow range of flow rates, and to obtain low flow rates would require using a recycle line. This would be undesirable for shear sensitive proteins and enzymes which should be recirculated as little as possible to minimize product damage.
Positive displacement pumps, and in particular rotary pumps such as gear and screw pumps, are ideally suited for viscous suspensions. Positive displacements pumps have a gentler pumping action than centrifugal pumps and impart less shear damage to the product. Thus, for the pilot-scale membrane filtration rig a variable speed screw pump was used. A variable speed pump permitted more precise and
positive flow control compared to a fixed speed pump with a recycle line. The pump was sized according to a general working rule of providing a maximum flow rate of about
O _ 16 mJ h per hollow-fibre module, to correspond to a maximum flow velocity of 2 m s” in the hollow-fibres.
The containment of biologically hazardous products may not be possible to achieve with some positive displacement pumps. For such applications the pump should be constructed of stainless steel and careful attention paid to the pump design and operation to prevent the seals leaking product.
3.2.3 Pipework arrangement and holding tank
The hold-up volume of the pipe-work was minimized to permit the processing of small batch volumes of concentrated retentate that were typically encountered at the end of a batch run. This overcame using large quantities of feed material. The length of the retentate return line was shortened, not only to minimize the hold-up volume, but also to reduce the pressure drop over the pipe length. If the pressure drop were high, as would be the case for highly concentrated materials, then the outlet pressure of the membrane module would similarly be high and reduce the maximum pressure drop available for flow across the membrane module. It is important when recirculating highly concentrated viscous materials that the pipe runs are as short as possible with very few fittings. Also, high flow rates should be maintained to prevent flow stagnation, especially where the pipe-work expands to connect to the membrane modules.
All the pipe-work and fittings on the pilot-scale rig were connected using tri-clamps, to assist in cleaning the equipment and to speed up dismantling if a modification was required quickly during a batch run.
The 0.2 m^ stainless steel holding tank, 0.55 m in diameter, had a steep-angled (60 0 to the horizontal) tapered base to enable small batch volumes to be agitated and cooled. The retentate in the tank was agitated using an air-driven turbine impeller (0.19 m diamter, 4 - bladed) which was situated close to the tank outlet to allow the
smallest batch volumes to be agitated without entraining air. A large pipe diameter, 50 mm, was used for the tank outlet to provide an adequate feed supply to the recirculation pump, to prevent cavitation occurring. For the same reason the pump inlet was positioned close, 0.25 m, to the tank outlet. The retentate return line was positioned deep into the cone of the tank, well below the liquid level, to prevent foaming of the retentate. The pipework leading to and from the membrane cartridges was either 37 mm or 50 mm in diameter.
The heat exchanger used to control the retentate temperature consisted of a stainless steel helical coil situated in the lower half of the tank. The maximum heat duty was determined by assuming no heat losses, since the process was operated at 25 °C which was close to ambient, and that all the heat input was derived from the recirculation pump, positive displacement pumps are usually 90 % efficient, in terms of converting the supplied energy to pumping the process fluid, with the remaining 10 % of the energy supplied given out as heat. Thus, the maximum heat exchanger duty was evaluated as 10 % of the maximum work rate of the recirculation pump, the power input of the stirrer being negligible compared with that of the pump.
3.2.4 Instrumentation
The pressure drop across the membrane module was measured using diaphragm pressure gauges set into pressure tap holes of equal diameter, 37 mm, to the pipe-work. For accurate pressure measurements the section of pipe-work into which the pressure gauges were positioned was straight, with a calming section of about 15 pipe diameters before the pressure tap hole. To reduce this pipe length straightening vanes could have been used to mitigate flow disturbances but the vanes would also increase the pressure drop.
The pressure tap holes themselves can cause flow disturbances which give rise to hole pressure errors. In laminar flow these errors are negligible but for highly non- Newtonian fluids they can be large and negative (Tanner & Pipkin, 1969). However, for the experimental work on
precipitated protein suspensions the errors were expected to be small (see Chapter 4), and since only a differential pressure across the membrane module was required then the errors would tend to cancel out.
The retentate flow rate was measured using a magnetic flowmeter placed in the retentate return line. The main advantages of this type of flowmeter were the ability to measure accurately a wide range of flow rates, irrespective of the retentate rheology, and the absence of intrusive internal parts which would have restricted the flow.
The retentate temperature was measured using a stainless steel temperature probe positioned centrally within the pipe-work immediately after the recirculation pump.
3.3 Vacuum drying
The first design decision made was whether the pilot- scale experimental process should operate batch-wise or continuously. From arguments put forward in Section 1.4.1.2 continuous operation using a vacuum band drier emerged as the favoured option. A batch-wise operated drying process yields only one sample per experimental run so that a whole series of experiments, conducted over a range of sample residence times, would be required to determine the drying history for a given set of operating conditions. Similarly, there would be difficulties of allowing for start-up and shut-down times. This experimental approach is time consuming and inaccurate due to variations between batch runs. A continuous band drier overcomes these problems by providing samples pertaining to the entire drying history from a single run as it is possible to stop the operation and sample dried or partially dried material at any point along the conveyor band. Apart from these experimental advantages, studying continuous processes yields important information on control of equipment and operation which is particuarly desirable for a manufacturing industry economically orientated towards the efficiency of continuous operation. Thus, a pilot-scale vacuum drier which employs the same basic principles as an industrial continuous band
drier was built and commissioned by Baker Perkins, Peterborough, UK (drier now supplied by APV Pasilac Ltd., Carlisle, UK).
The following sections describe the detailed design of the pilot-scale drier for operating with a continuous feed system.
3.3.1 Introduction
A schematic diagram of the pilot-scale drier is shown in Figure 3.1, and Figure 3.2 shows a photograph of the drier. The vacuum chamber of the pilot-scale drier was approximately 80 times smaller than the largest industrial band driers. These large industrial multi-band driers can produce over 1 t h“ dry product for low moisture content feed materials (10 - 25 % w/w) whereas the maximum loading capacity of the pilot-scale drier was 1 kg h“ dry product for high moisture content, 70 % w/w, dewatered precipitated protein feed materials.
The scale-down from industrial size to pilot-scale created a considerable reduction in the complexities of the mechanical engineering design of the equipment and allowed some new innovations to be incorporated. For instance, the largest band driers have up to 10 bands closely stacked in parallel layers with each band requiring heating and cooling facilities, tracking systems, drive motors and feed and discharge systems. Similarly, to obtain a high vacuum for a large chamber requires an augmentor, a type of steam ejector, and a condenser to reduce the volume of gas recovered. In contrast, the pilot-scale drier had just a single band and the volume of the drying chamber was small enough to be evacuated using a single liquid-ring vacuum pump. The main innovations were the inclusion of a transparent borosilicate vacuum chamber, to permit viewing of the product during drying, and an electrical heating system to provide more precise control than compared to a steam heating system, which would be preferred industrially.
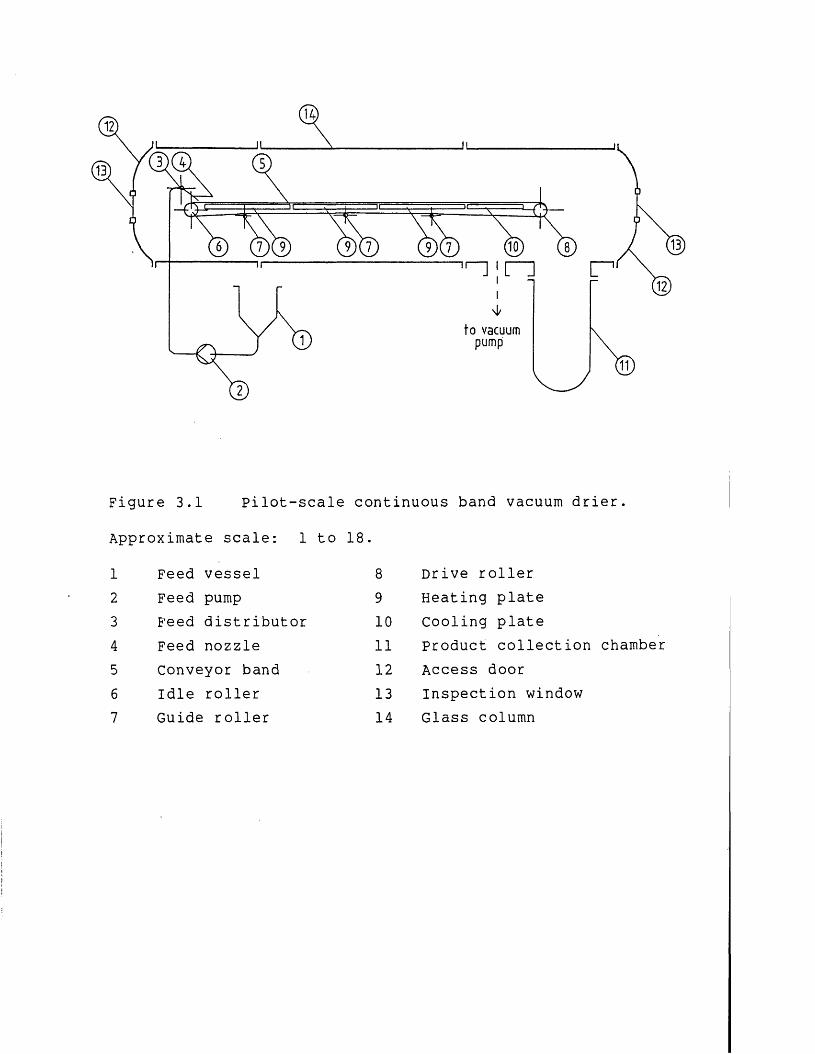
t o v a c u u m p u m p
Figure 3.1 Pilot-scale continuous band vacuum drier.
Approximate scale: 1 to 18.
1 Feed vessel 8 Drive roller2 Feed pump 9 Heating plate3 Feed distributor 10 Cooling plate4 Feed nozzle 11 Product collection chamber5 Conveyor band 12 Access door6 Idle roller 13 Inspection window7 Guide roller 14 Glass column

Figure 3.2 Pilot-scale continuous band vacuum drier.
Sample tray shown in foreground
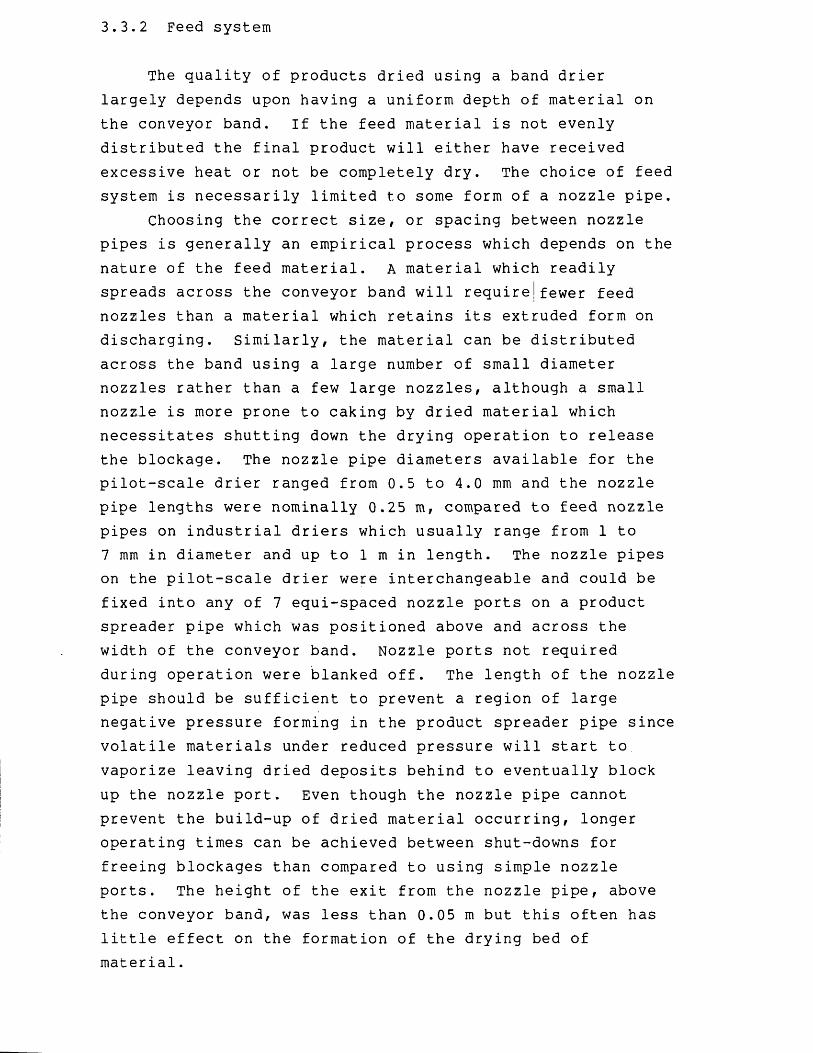
3.3.2 Feed system
The quality of products dried using a band drier largely depends upon having a uniform depth of material on the conveyor band. If the feed material is not evenly distributed the final product will either have received excessive heat or not be completely dry. The choice of feed system is necessarily limited to some form of a nozzle pipe.
Choosing the correct size, or spacing between nozzle pipes is generally an empirical process which depends on the nature of the feed material. A material which readily spreads across the conveyor band will requirejfewer feed nozzles than a material which retains its extruded form on discharging. Similarly, the material can be distributed across the band using a large number of small diameter nozzles rather than a few large nozzles, although a small nozzle is more prone to caking by dried material which necessitates shutting down the drying operation to release the blockage. The nozzle pipe diameters available for the pilot-scale drier ranged from 0.5 to 4.0 mm and the nozzle pipe lengths were nominally 0.25 m, compared to feed nozzle pipes on industrial driers which usually range from 1 to 7 mm in diameter and up to 1 m in length. The nozzle pipes on the pilot-scale drier were interchangeable and could be fixed into any of 7 equi-spaced nozzle ports on a product spreader pipe which was positioned above and across the width of the conveyor band. Nozzle ports not required during operation were blanked off. The length of the nozzle pipe should be sufficient to prevent a region of large negative pressure forming in the product spreader pipe since volatile materials under reduced pressure will start to vaporize leaving dried deposits behind to eventually block up the nozzle port. Even though the nozzle pipe cannot prevent the build-up of dried material occurring, longer operating times can be achieved between shut-downs for freeing blockages than compared to using simple nozzle ports. The height of the exit from the nozzle pipe, above the conveyor band, was less than 0.05 m but this often has little effect on the formation of the drying bed of material.

On industrial-scale driers the series of fixed nozzles is often replaced by one single nozzle pipe which swivels back and forth across the conveyor band. This particular method of feed distribution requires careful design and control to prevent less material being deposited at the centre of the band, where the nozzle is normally travelling at its maximum velocity, than at the edges. However, it has the advantage of enabling higher flow rates to be maintained to reduce the frequency of blockages in the nozzle pipe.
The pilot-scale drier was fed from a 0.1 m^ tank using a variable speed lobe pump (Ibex MOG 610 multi-lobe, Ibex pumps, Sussex, UK) which imparted little or no pulsation to the flow. An interesting variation of this feed system was to use the high vacuum generated within the drying vessel to act as a constant driving force for feeding the material.The flow rate was varied using a ball valve placed in the feed line.
3.3.3 Product transport within the drier
The conveyor band is the heart of the continuous band vacuum drier in that it performs the entire drying operation by transporting the product from the feed system over a series of heating and cooling plates to the other end of the drying chamber where the product is subsequently discharged. Apart from the heating and cooling plates, the conveyor band in the pilot-scale drier also travelled over two rollers situated at either end of the drying chamber. At the discharge end there was a motor-driven roller which relied on frictional forces to move the band, whereas at the feed end there was a highly polished guide roller. The drive roller was covered in nitrile rubber to increase the friction between itself and the band.
The feed end roller served the dual purpose of band tensioning, which was achieved by moving the roller back and forth until the desired degree of tension was attained, and band tracking. Unless the band and rollers were perfectly aligned with each other the band displayed a tendency to track or move to one side of the feed end roller and slip off. To prevent this occurring the feed end roller had
tapered ends of wider diameter than the centre so that the band experienced a large frictional increase if it attempted to move across the roller. Also, the feed end roller was unable to rotate. If the band was travelling across the tapered section while the roller rotated and the centre-line of the band was no longer perpendicular to the axis of the roller then only a single point of contact would exist between the band and the roller. This point of contact would gradually move up the tapered edge and continue until the band came off the roller completely. When the roller cannot rotate then the moving point of contact does not occur and the band slides around the roller with a large surface area remaining in contact.
The self-tracking roller was simple in design and operation but it still allowed a partial sideways movement which had to be accounted for when feeding material onto the band. More importantly, the heating and cooling plates needed to be wider than the band to accommodate sideways movement and ensure that the product was always receiving heat. Thus, there was inefficient ultilization of the heating plates since the heated area was greater than the band area which in turn was greater than the drying product area. The width of the conveyor band for the pilot-scale drier was a nominal 0.3 m, with approximately + 0.01 m • tracking deviation from the centre-line.
The conveyor band speed, or product residence time, was variable from a few minutes to several hours. As the speed of the conveyor band increased the tension of the band also increased, which reduced the area of the band remaining in contact with the heated surface, to decrease the overall heat transfer coefficient. To compensate, the heated plate temperature would have to be increased to maintain a constant rate of heat transfer which would also increase heat losses, and thereby reduce the heat efficiency of the drier. Thus, if an industrial-scale drier requires a short product residence time, of the order of several minutes, the drying chamber should be designed short rather than using a high conveyor band speed in a long chamber.
Conveyor bands were traditionally made of steel wire mesh but this material has now been superseded by various
reinforced plastics, which offer both economic and operating advantages. Apart from being more expensive to replace, the main disadvantages of steel and other metallic materials were that the bands could be easily overtightened, beyond the yield stress, and if the band slipped off the tracking roller it was often permanently damaged. Synthetic polyester bands are more flexible and, if desired, can be manufactured as watertight non-porous sheets, unlike the alternative metallic meshes. The conveyor band of the pilot- scale drier consisted of a glass fibre mesh coated in PTFE (polytetrafluoroethylene) which acted as an anti-static agent and prevented dust particles becoming attached to the band. Without the PTFE coating dust particles would have been attracted to the underside of the band and collected at the rollers to eventually jam the drive system of the conveyor band. The conveyor band material (Tigaflor 162G/10T, Fothergill Tigaflor Ltd., Littleborough, Lancs, UK) was 0.25 mm thick and was joined at the ends by an alligator clip for ease of replacement.
The thickness of the conveyor band to be employed depends on a trade-off between strength, flexibility and degree of insulation. The conveyor band should exhibit sufficient rigidity to withstand tensioning without stretching while being supple enough to move smoothly over the surface of the rollers and not provide too much insulation between the heated plates and the product.Indeed, the main disadvantage of plastic bands derives from their insulating properties. If the band acts as an insulator this has an effect similar to increasing the band speed whereby the heat efficiency of the drier is reduced due to the higher operating temperatures required of the heating plates.
3.3.4 Product removal system
When the dried, brittle product reached the end of the conveyor band it could be partially broken up using a manually operated breaker bar. The breaker bar was situated 0.15 m from the end of the run of the conveyor band and simply pushed down onto the slab of product to break off

3large pieces. These pieces then fell into a 0.17 m collection vessel which was open directly to the drying chamber. The quantities of dried material obtained from a single run of the pilot-scale drier were not large enough to necessitate emptying the collection vessel during operation. This considerably simplified the problem of product removal compared to industrial-scale driers which use either continuous or semi-continuous product discharge systems which operate without releasing the vacuum in the drying chamber.
3.3.5 Heating and cooling system
On the pilot-scale drier the heating and-cooling system over which the conveyor band travelled consisted of three heating, or conveyor support plates, and one cooling plate. Water could be circulated through the cooling plate to provide temperatures in the range of 15 to 100 °C. For mechanical design purposes the cooling plate was a pressure vessel which had to be capable of normal operation at 1 bar internal pressure, which corresponds to operating under a complete vacuum. To ensure precise control of the energy input and the plate temperature, the heating plates were heated electrically. The electrical energy was supplied to each heated section by a 2 m length of a sealed, tubular element. These electric elements, looped back and forth several times within each heating section, were located directly beneath the conveyor support plates and were supported from underneath by another plate. Energy transfer by radiation and conduction to the conveyor band is approximately a 75 % efficient process. Some radiated energy was recovered by exposing the element support plate to the conveyor band before it returned to the feed end.The power input to each individual element was controlled by an adjustable potentiostat.
Industrially the preferred heating medium is steam which, on the basis of providing the latent heat of water vaporization, is around four times cheaper to use than electricity, assuming steam and electrical costs of respectively 1.6 p kg"1 and 7.0 p kW"1 h"1. Unfortunately,
the advantages of using steam do not extend to the construction and design of the drying equipment. Steam heaters are designed as pressure vessels and are necessarily tested, for insurance purposes, to 1.5 times their operating pressure, after allowing for working in a complete vacuum (0 kPa). This incurs a high materials cost and complicated construction practices since special, interspaced pins have to be welded internally, together with steam baffles to prevent the plates from sagging and losing contact with the conveyor band. No problems in the design or construction of flat conveyor support plates were encountered for the electrical heating system of the pilot-scale drier.
Thermocouples, embedded in the heating plates, were used to adjust the set-point temperature and monitor the plate temperature during drying. The maximum plate temperature was set at 250 °C to correspond to the highest temperature that could be tolerated by the conveyor band.
The total energy output of the heaters was 2.1 kW, or0.7 kW per heating plate. The total energy output requiredwas determined by analogy with steam heated industrialdriers which typically evaporate water at a rate of
— 1 — 93.0 kg h 1 m of heated surface. The latent heat of vaporization of steam at, say, 2 bar is 2200 kJ kg-1, and2.2 kg steam is usually required to evaporate 1 kg water. Hence,
energy output = 2.2 x 3.0 x 2200 = 14520 kJ h”1 m”2
Allowing 5 % for the heating element end losses and given a heated surface area, which was fixed by the drier dimensions (see Section 3.3.6), of 0.5 m2, then
total energy output = 0.5 (14520 + 0.05 x 14520)= 7620 kJ h”1, or 2.1 kW h"1
The latent heat of water vaporization at high vacuum levels (low pressure) in the absence of solid particles is approximately 2500 kJ kg-1 (Rogers and Mayhew, 1980). Assuming the heat transfer process is 75 % efficient then,

evaporation rate = 7620 x 0.75 _ 2.2 kg h ^2500
On the basis of producing a protein product of 5 % w/w moisture content from a feed material of 30 % w/w dry solids content, the maximum production rate attainable is,
rate = 2.2 x — — = 1 kg h“ dry product(1-0.3)
3.3.6 Drying chamber and vacuum system
The pilot-scale drier had a circular chamber cross- section whereas the cross-section through an industrial multi-band drier may be either circular or rectangular, with a dished or convex perimeter. These rectangular crosssectioned, cuboid chambers have more available band surface area, for a given band width, than compared to cylindrical chambers of the same volume since less space is wasted at the edges of the bands. This is shown in Figure 3.3. However, cuboid chambers require more shell material and internal supports to increase the shell strength which often leads to an economic trade-off between the capital cost of the drying vessel and the increased vacuum raising costs for evacuating the extra volume. If space were at a premium then the cuboid-shaped drying chamber would be preferred since less floor area is required for siting the equipment. The circular cross-section of the pilot-scale chamber was 0.46 m in diameter and 3.0 m long, with a width to length ratio of 1/6.5 which is similar to the dimensions of industrial driers. If the ratio were much smaller than 1/6.5, so that wide bands were used in short vessels, then the increased capital cost for constructing the greatly enlarged end doors, to prevent them collapsing under vacuum, would become prohibitively expensive. Similarly, if the ratio were much greater than 1/6.5 the friction between the conveyor band and the drive roller would reach a critical point beyond which the roller could no longer move the band.
On the pilot-scale drier midway along the chamber was a1.5 m borosilicate glass sleeve (Corning QVF, Stone, Staffs, UK) to permit viewing of the product during drying. Access
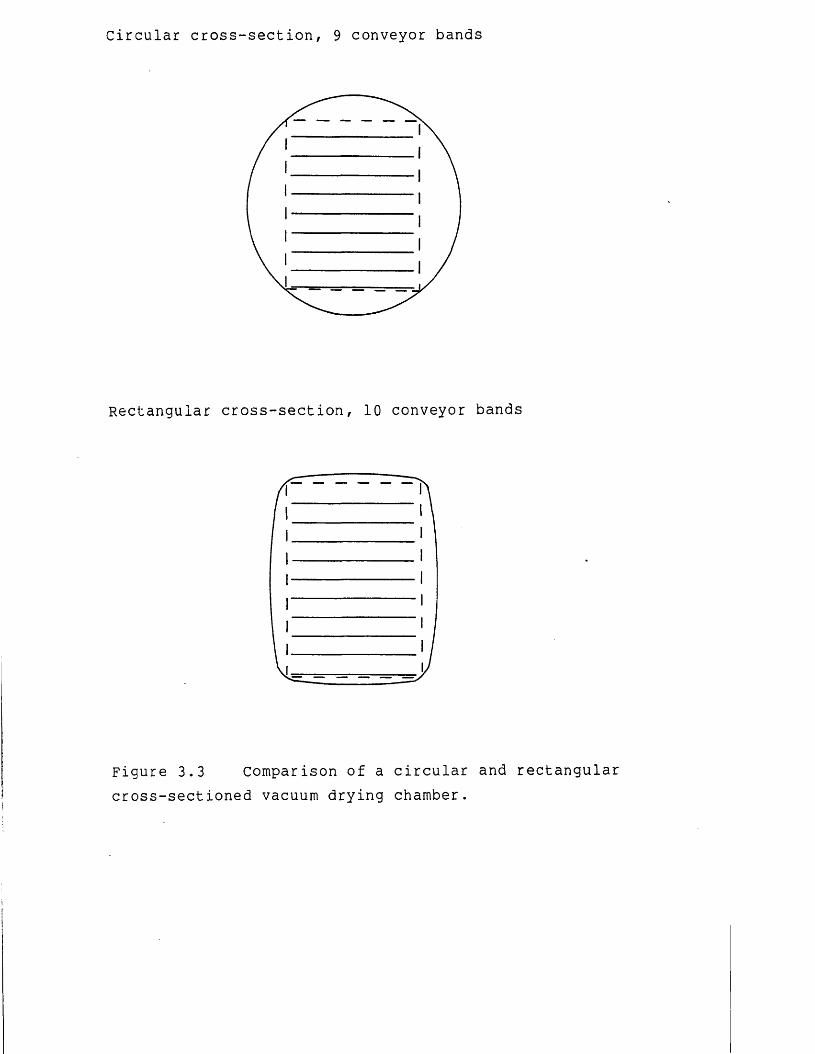
Circular cross-section, 9 conveyor bands
Rectangular cross-section, 10 conveyor bands
Figure 3.3 Comparison of a circular and rectangula cross-sectioned vacuum drying chamber.

to the chamber was via two dished end doors which were loosely mounted on sliding hinges to allow a complete seal to form between the door, a rubber gasket and the chamber flange, when the vessel was under vacuum. It was not possible to steam sterilize the drier due to these door seals leaking as they were not designed to operate with positive internal pressures. Although the end doors could be clamped shut, the design of a steam sterilizable vacuum drier would also need to incorporate other special sealing arrangements, to withstand positive internal pressures, for the drive shaft of the drive roller, the sight glasses, the product collection chamber and any other non-welded joints associated with the vacuum chamber.
Apart from the glass sleeve, the entire drying chamber and internal fittings were constructed from 304 and 316 stainless steel to prevent rust formation and to aid cleaning. The drying chamber itself was supported at working height by a mild steel framework which also housed the vacuum and feed pumps. To allow expansion and contraction of the chamber to occur during drying the feed end was secured to the framework by bolts clamped into slotted grooves. The vacuum chamber was designed to BS 5500 specifications. The shell thickness was determined by assuming a working pressure of 0.0 kPa(abs), that is a complete vacuum, and adding on 10 % to the resultant thickness to allow for thinning of the shell wall during fabrication. There is no recognized legislation for insurance of vacuum vessels so they are often treated as pressure vessels, which are normally designed to operate at1.5 times the working pressure. However, this design safety factor is irrelevant since no internal pressures lower than a complete vacuum can ever be achieved under normal operating conditions and consequently vacuum chambers are often designed to operate at no more than 0.0 kPa(abs).
The vacuum was raised using a liquid-ring vacuum pump (3 kW motor, Loch-Pye Ltd., Carne House, Bolton, UK) which was capable of evacuating the chamber to a pressure of1.0 kpa(abs), or less depending on the amount of water vapour drawn off and the ambient pressure. This working pressure corresponded to a steady state product drying .

temperature of around 10 °C. The efficiency of a liquid- ring vacuum pump is limited by the physical properties of the service liquid, in this case, water. At high vacuums or low pressures the service liquid will simply vaporize, thereby increasing the volume of gas to be removed and decreasing the capacity of the pump for evacuating the drying chamber. The capacity of the vacuum pump may be increased by using chilled water or an organic liquid with a high boiling point.
The outlet for the vacuum pipe was located underneath the conveyor support plates, at the discharge end, to avoid disturbing the product on the band. The vacuum level or pressure was monitored using a coarse gauge and a fine, barometrically independent, gauge which indicated the absolute pressure irrespective of the ambient.
3.4 Conclusions
To complete this section on the detailed equipment design this last section has been included to briefly discuss the compatability of these dewatering and drying operations and how they would be operated together as part of a production process.
The throughput of the vacuum drier is 1 kg h -1 dry product which corresponds to a feed flow rate of 3.3 kg h”-*-, assuming a 30 % w/w dewatered protein precipitate feed. Assuming a protein feed concentration of 5 % w/w prior to dewatering then approximately 17 L h” of solvent must be permeated to produce 3.3 kg h”1 of dewatered product. From the work of Devereux et al. (1986a) on precipitated soya protein for a new PM50 type hollow-fibre membrane a permeate flux rate of 20 L m“2 h-1 may be achieved provided theultrafiltration operating conditions, such as flow rate andpressure, are optimized. Thus, 1 m2 of membrane surface area would be sufficient to produce a 30 % w/w dewatered product for the vacuum drier. However, since small quantities of product must be dewatered to a low moisture content the membrane filtration process would be operated batch-wise, the dewatered product being stored in anintermediate holding tank while feeding the vacuum drier.
Hence, a larger batch volume than indicated above, say 100 L, would be processed and a suitable time period would have to be allowed for membrane cleaning to restore the permeate flux rate at the end of the dewatering run.Overall, the throughputs of the pilot-scale membrane filtration and vacuum drying equipment are compatable.
To transfer the dewatered product from the membrane filtration holding tank to the vacuum drier could be simply achieved, underj sanitary conditions, by using the ultrafiltration recirculation pump to transport the dewatered material either to an intermediate holding tank or to the feed vessel of the vacuum drier. Inevitably some protein material would be left in the filtration equipment. This may be partly recovered by recycling a small amount of a suitable buffer through the equipment and the resultant mixture recycled back to the next batch volume of protein to be dewatered. Employing a nitrogen purge to recover all the concentrate from the equipment is not desirable since gas entrainment will affect the rheological properties of the concentrate and may lead to increased expansion of the material during vacuum drying.
4 Membrane Filtration of Concentrated precipitatedProtein Suspensions
This chapter concerns hollow-fibre membrane ultrafiltration for dewatering precipitated soya protein suspensions to high concentrations suitable for feeding to a vacuum drying operation. The fluid mechanics of hollow- fibre ultrafiltration of water and precipitated protein suspensions are investigated. Also, the effects of theultrafiltration processing conditions on the protein concentrate dewatering process are examined.
The results and discussion, Section 4.3, are divided into three main parts. The first, Section 4.3.1, concerns the preliminary experiments performed to evaluate the dewatering of precipitated protein concentrates to a high solids content. From these initial experiments it became obvious that a more detailed analysis was required to gain a clearer quantitative understanding of the membrane dewatering process, and this analysis is presented in Sections 4.3.2 and 4.3.3. In Section 4.3.2 the fluid mechanics of the membrane filtration of water and precipitated protein suspensions are examined using the theory presented in Section 4.1. section 4.3.3 examines the effects of the process fluid flow conditions on the rate of filtration, and assesses, in retrospect, the membrane filtration models presented in Section 4.2.
4.1 Fluid mechanics of membrane filtration
A study of the fluid mechanics of membrane filtration is of practical significance in both the specification and the optimal design of membrane cartridges and associated membrane filtration equipment. Also, it can be used to gain a more fundamental understanding of membrane processes, providing information to assist in the development of predictive models relating the rate of filtration, or the permeate flux rate, to the operating parameters.
Belfort & Nagata (1985) have reviewed the fluid mechanics of membrane filtration and have performed extensive studies to elucidate the differences in flow

properties between porous and non-porous pipes. Generally, fluid flow in porous pipes displays suppression of turbulent flow, and a greater frictional pressure loss which can be correlated to the permeate flux rate, conversely, little research on the flow properties of concentrated non- Newtonian fluids in porous tubes, or during membrane filtration, is documented (Aimer, 1987). Similarly, no report is made of the application of rheometry to simulate the pressure drop - fluid flow rate characteristics for membrane cartridges of any common geometry. The non- Newtonian rheological properties of precipitated protein suspensions and their significance for membrane filtration is discussed in Section 4.1.2.
A theoretical description of the hydrodynamic processes occurring during the concentration of non-Newtonian materials using hollow-fibre membranes may be based on non- porous pipe flow theory. In addition, although membrane filtration may proceed in either the laminar flow or turbulent flow regimes, the studies will be necessarily confined to laminar flow due to the viscous nature of protein concentrates.
4.1.1 Non-Newtonian laminar flow in pipes
A wealth of information exists on non-Newtonian pipe flow and this section will therefore only present the important results, the theoretical derivations of which can be found elsewhere in standard texts (for example Coulson & Richardson, 1979).
For a non-Newtonian fluid the shear stress, Rrx/ at a radius, r, may be expressed as some function of the shear rate as follows:
where ux is the velocity in the direction of flow. The precise function is often unknown and has to be determined from experiments yielding the flow rate, Q, through a pipe plotted against the cross-flow pressure drop, -APCF, along
(4.1)

the length, L, of the pipe. Such data can be related to the shear rate at the pipe wall, Yw , by an equation of the foim:
_ J 2 Q 3 n _ M L = Sjfc 3 ^tt df3 \ 4n / df \ 4n /
where dp is the inner diameter of the pipe, ub is the mean- average fluid velocity in the pipe, and n' is the flow behaviour index which is given by the slope of the log-log plot of -APCp<3f/4L versus 32Q/]r'df^ f°r particular values of Q and _APCF in question. For any small region on that graph an equation can be written in the form:
^PCF df-Rwx = — -- = k I-----1 (4*3>4 L
,/32 Q\
where k' is a constant referred to as the consistency index. When n' is unity, k' is equivalent to the viscosity of the fluid or suspension, pb , and Equation 4.3 reduces to the Poiseuille-Newtonian relationship:
n(-APrJ df4q = _ J - - - - C F / — ( 4 > 4 )128 L pb
The relationship between the shear stress and shear rate for precipitated protein suspensions may be approximated by the power-law model (see Section 4.1.2):
/du \ n duRwx (dT/ ~ 'Pb a T 5)
The constant n is equal to n' and k is related to k' asfollows:
k ' = k n (4.6)
and the flow rate is given by:

Equations 4.3 and 4.7 require an accurate determination of the cross-flow pressure drop, -AP^p* This is related to the measured pressure differential between the cartridge inlet and outlet, or transcartridge pressure drop, - A P a s follows:
-APm = -APcf + (-APe ) + Qb g L (4.8)
where (£b g L) is equivalent to the static head pressure drop, L is the vertical height and -APp refers to the pressure loss due to contraction and expansion at fittings at each end of the membrane cartridge. These pressure drops will be respectively termed the head-loss pressure and the end-loss pressure.
The components of the end-loss pressure for the hollow- fibre membrane cartridge are attributed to the following: (i), sudden contraction at the inlet to the fibres; (ii), sudden expansion at the outlet from the fibres; (iii), pipework length between cartridge and pressure gauge mountings, and; (iv), expansion and contraction fittings connecting the pipe-work to the cartridge. Component (iv) may be ignored since the pipe-work diameter is comparable to the overall diameter of the bundle of hollow-fibres and component (iii) is essentially equivalent to two long-radius pipe-work bends (see Chapter 2 for description of pipe-work arrangement).No published information was found on the pressure drop specifically for contraction and expansion at the entrance and exit to a tube bundle. In addition, few theoretical correlations exist for the various components of -APE during non-Newtonian laminar flow (Perry, 1986). However, where necessary, a suitable estimate can be made by employing correlations developed for Newtonian flow.
Assuming a negligible effect from the presence of inlets to adjacent hollow-fibres, the pressure drop due to contraction for a single hollow-fibre at the fibre inlet is given by (Perry, 1986):
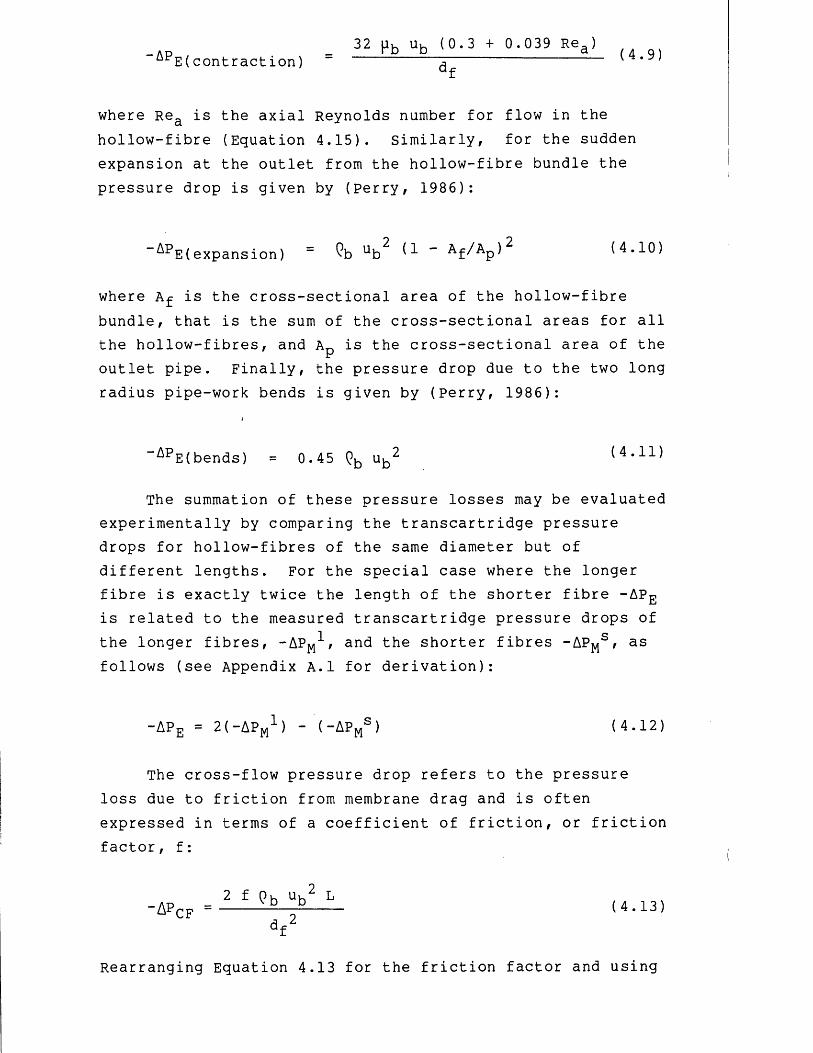
_ 32 Pb ub <0 -3 + °-039 Rea> o,APE(contract ion) ^ (4.9)
where Rea is the axial Reynolds number for flow in the hollow-fibre (Equation 4.15). similarly, for the sudden expansion at the outlet from the hollow-fibre bundle the pressure drop is given by (Perry, 1986):
ApE(expansion) ^b ub ^ ~ Af/Ap^ (4.10)
where Af is the cross-sectional area of the hollow-fibre bundle, that is the sum of the cross-sectional areas for all the hollow-fibres, and AD is the cross-sectional area of the
iroutlet pipe. Finally, the pressure drop due to the two long radius pipe-work bends is given by (Perry, 1986):
APE(bends) = 0.45 Qb ub2 (4.11)
The summation of these pressure losses may be evaluated experimentally by comparing the transcartridge pressure drops for hollow-fibres of the same diameter but of different lengths. For the special case where the longer fibre is exactly twice the length of the shorter fibre -APE is related to the measured transcartridge pressure drops of the longer fibres, -APM , and the shorter fibres -APMS , as follows (see Appendix A.l for derivation):
-APe = 2( — APjyj1 ) - (~APms ) (4.12)
The cross-flow pressure drop refers to the pressure loss due to friction from membrane drag and is often expressed in terms of a coefficient of friction, or friction factor, f:
2 f Qu Ui2 L-A pc f = j L -^r ( 4 - 13)
Rearranging Equation 4.13 for the friction factor and using
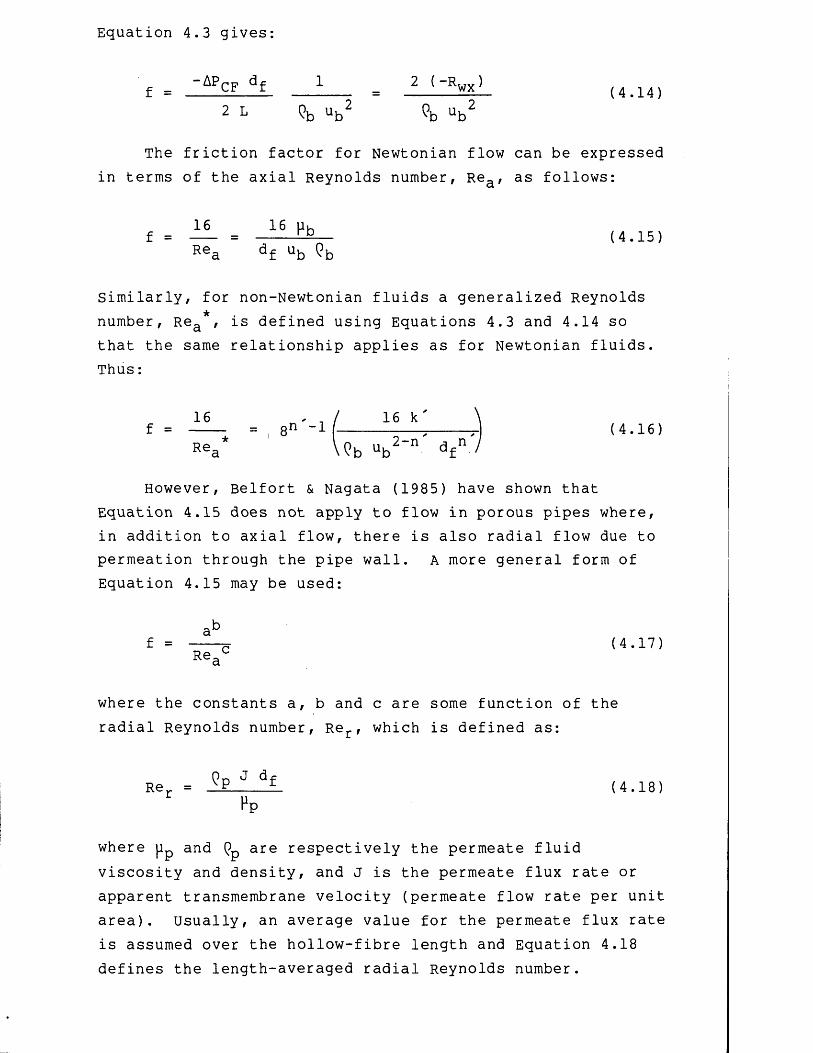
Equation 4.3 gives:
— APpo d.p 1 2 (—R^jv )f = £F L ------ = (4.14)2 L <?b ub2 ?b ub2
The friction factor for Newtonian flow can be expressed in terms of the axial Reynolds number, Rea , as follows:
16 16 uhf = = — (4.15)Rea df ub <?b
Similarly, for non-Newtonian fluids a generalized Reynolds number, Rea , is defined using Equations 4.3 and 4.14 so that the same relationship applies as for Newtonian fluids. Thus:
16 . / 16 k' \f = = , 8n -if------ --- ;---- 7- (4-16)
Rea W b ub df" '
However, Belfort & Nagata (1985) have shown that Equation 4.15 does not apply to flow in porous pipes where, in addition to axial flow, there is also radial flow due to permeation through the pipe wall. A more general form of Equation 4.15 may be used:
a^f = f (4.17)
Rea
where the constants a, b and c are some function of the radial Reynolds number, Rer, which is defined as:
Re = J df (4.18)Pp
where pp and (?p are respectively the permeate fluid viscosity and density, and J is the permeate flux rate or apparent transmembrane velocity (permeate flow rate per unit area). Usually, an average value for the permeate flux rate is assumed over the hollow-fibre length and Equation 4.18 defines the length-averaged radial Reynolds number.

4.1.2 Precipitated protein suspension rheology
Generally, precipitated protein concentrates can be described as pseudoplastic materials exhibiting a power-law relationship between the shear stress and shear rate, although a combination of high shear rates and low concentration yields a trend towards Newtonian behaviour.The pseudoplastic behaviour of decreasing apparent viscosity with increasing shear rate is ascribed to the disentanglement of the precipitate particles or aggregates during shear flow (Devereux et al., 1984). At low rates of shear, below 10 s” , and high particle concentrations the aggregates will interlock to form a floc-type network which may be readily dispersed on increasing the shear rate. This structural formation induces a yield stress. The yield stress is a measure of a materials resistance to movement from rest and for precipitated protein suspensions varies
_ olinearly with concentration up to 150 kg m J and then increases more rapidly at higher concentrations (Devereux et al., 1984). The presence of a large yield stress coupled with the highly viscous nature of the protein concentrates is a considerable handicap in maintaining high shear rates at the membrane surface and eventually narrow membrane channels become blocked or the recirculation pump fails (Devereux et al., 1986a).
The membrane filtration of precipitated proteins using ultrafiltration membranes will not only concentrate the precipitated protein but also any soluble protein remaining after precipitation. High concentrations of soluble protein will have a marked influence on the shear rheology since the soluble protein viscosity increases exponentially with concentration and exhibits similar apparent viscosities to precipitated proteins for the same protein concentration (Bell & Dunnill, 1982a).
Published rheological data on concentrated precipitated protein suspensions usually refers to centrifugally prepared material, with subsequently lower soluble protein content, and hence any comparison with such data will have to account for soluble protein content variations (Bell & Dunnill, 1982a). In addition, the range of shear rates examined are

lower than those encountered in hollow-fibre membrane filtration.
The high shear rheology of viscous materials are often investigated using capillary rheometers which directly simulate the conditions that are observed in pipe flow.Using a capillary rheometer, with stainless steel capillaries of similar diameter to the hollow-fibre membranes, Devereux et al. (1984) measured the shear rheology of precipitated protein concentrates prepared by membrane filtration. They observed lower apparent viscosities when using the capillary rheometer compared to other viscometric geometries, such as cup-and-bob, and ascribed the difference to shear break-up of the precipitate particles during recirculation through the capillaries. Dervisoglu & Kokini (1986) also observed that capillary rheometers yielded lower viscosities compared to cone-and- plate and parallel-plate viscometers for non-Newtonian particulate suspensions. They attributed the effect to dispersed solid particles migrating away from the tube wall causing wall slippage to occur. This effect contradicts particle motion during membrane filtration where suspended particles are convected towards the membrane wall, which would thereby minimize wall slip (see Section 4.2.1.1). Another explanation for the difference in measured viscosities may arise due to flocculation of the solid particles, the flocculated particles imparting different yield stress properties depending on the rheometric geometry employed. Thus, rather than particle size, the ratio of the gap width, in parallel-plate or cone-and-plate viscometers, or capillary diameter to the floe size may be an important parameter affecting the rheological measurements. It would be difficult to assess the effect of shear break-up, particle migration and particle flocculation on predicting the flow conditions in membrane fibres using capillary rheometry. Another approach would be to employ a range of different viscometric geometries, such as cup-and-bob and cone-and-plate, and assess their suitability for predicting the flow characteristics of protein concentrates during membrane filtration.
4.2 Membrane filtration theory for concentratedprecipitated protein suspensions
The optimum mechanical design and operation of any membrane filtration process necessitates a thorough understanding of the underlying guidelines to qualitative and quantitative prediction of the permeate flux rate. Many excellent reviews exist on correlating or predicting permeate flux rates for membrane filtration operations (Blatt et al., 1970; Fane, 1986; Zydney & Colton, 1986) and it is not the intention to provide a definitive review here but merely to highlight the important and most appropriate models for the concentration of a suspension of precipitated and soluble protein.
4.2.1 Membrane filtration models
Generally membrane filtration models may be placed in one of three categories depending on the conditions perceived to determine the permeate flux rate: (i), available osmotic pressure gradient; (ii), concentrated layer of polarizing species at the membrane surface in dynamic equilibrium with the bulk suspension; and, (iii), hydraulic resistance by the polarizing species where the solutes are considered to form a cake of deposited particles on the membrane surface. Models based on the osmotic pressure gradient are employed when the osmotic pressure due to high solute concentrations at the membrane surface is large compared to the applied transmembrane pressure driving force. For reverse osmosis operations osmotic pressure effects are the main cause of reducing the permeate flux rate whereas typical ultrafiltration operations display negligible osmotic pressures (Fane, 1986), and consequently osmotic effects can be ignored. Wijmans et al. (1984) concluded that osmotic pressure flux limitations would only be expected in the ultrafiltration of macrosolutes up to a molecular weight, MW, of 10^ to 10^. The macrosolutes present in soya protein isolates are usually of the order of 10^ to 10^ MW (Devereux et al., 1986b), and hence osmotic effects are assumed to be insignificant.
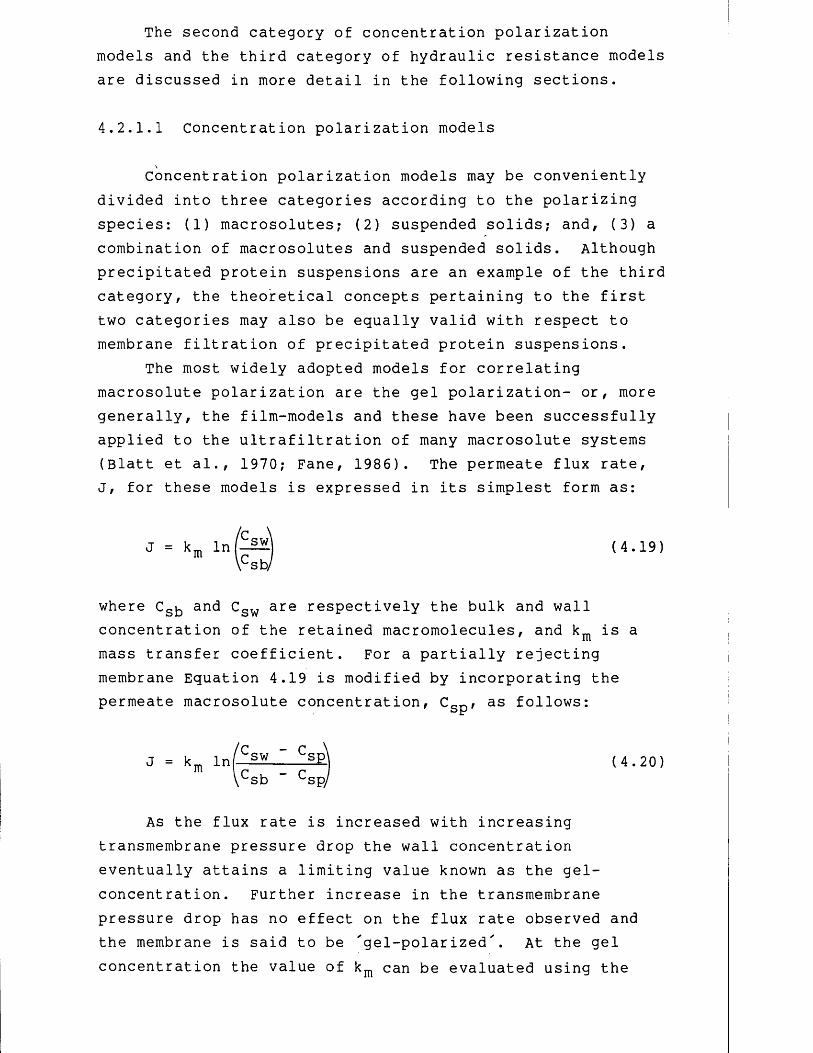
The second category of concentration polarization models and the third category of hydraulic resistance models are discussed in more detail in the following sections.
4.2.1.1 Concentration polarization models
Concentration polarization models may be convenientlydivided into three categories according to the polarizing species: (1) macrosolutes; (2) suspended solids; and, (3) a combination of macrosolutes and suspended solids. Although precipitated protein suspensions are an example of the third category, the theoretical concepts pertaining to the first two categories may also be equally valid with respect to membrane filtration of precipitated protein suspensions.
The most widely adopted models for correlating macrosolute polarization are the gel polarization- or, more generally, the film-models and these have been successfully applied to the ultrafiltration of many macrosolute systems (Blatt et al., 1970; Fane, 1986). The permeate flux rate,J, for these models is expressed in its simplest form as:
where Cg^ and Csw are respectively the bulk and wall concentration of the retained macromolecules, and km is a mass transfer coefficient. For a partially rejecting membrane Equation 4.19 is modified by incorporating the permeate macrosolute concentration, CGr., as follows:
As the flux rate is increased with increasing transmembrane pressure drop the wall concentration eventually attains a limiting value known as the gel- concentration. Further increase in the transmembrane pressure drop has no effect on the flux rate observed and the membrane is said to be 'gel-polarized'. At the gel concentration the value of km can be evaluated using the
(4.19)
(4.20)

analogous heat transfer problem solved by Leveque (1928):
/Y D 2\1/3km = 0.82 w (4.21)
where Yw is the shear rate at the membrane surface, Ds is the macrosolute diffusion coefficient, and L is the length of the membrane channel. The validity of this equation depends on the state of development of the velocity and concentration profiles. The flow should be laminar and the fibre length required to attain a fully developed laminar flow velocity profile, Lv , should be small compared to the overall length of the membrane channel (Porter, 1972). Lv is given by:
Lv = 0.029 df Rea (4.22)
where df is the diameter of the membrane channel.Similarly, the length of the concentration profile entrance region, Lc, should be large compared to L. In the hollow- fibre system under study here, Lc can be calculated from (Cheryan, 1986):
Yw j f Ds
Lc = 0.1 — ^ M (4.23)
Combining Equations 4.20 and 4.21:
J = 0.82 /Yw ds2\ In /-sw " °SP) (4.24)\ L / \csb ” Csp/
Equation 4.24 is only valid for constant Yw and Cg^ over thelength of the hollow-fibre, or when the ratio of the bulkvolumetric flow rate to the permeate flux rate is large compared to unity. The model assumes that the gel layer formation and the gel concentration depends only on the nature of the macrosolute, but Nakao (1979) has shown that the fluid hydrodynamics within the system may also have an effect. In addition, Fane (1986) demonstrated that an effective free-area correction term may be necessary to

account for the different permeabilities observed for different membrane types.
The gel-polarization model has been successfully employed by Narendranathan (1981) to describe the hollow- fibre ultrafiltration of soluble soya protein isolates. However, the model may not be applied for predicting the permeate flux rate profile during the concentration of precipitated soya protein suspensions (Devereux & Hoare, 1986) .
For the second category of concentration polarization, where particulate suspended solids instead of macrosolutes form the polarizing species, the particle Brownian motion diffusivity, evaluated using the Stokes-Einstein equation and used in conjunction with Equation 4.24, substantially underpredicts the maximum flux rate and the shear rate dependence (Blatt et al, 1970; Fane, 1986). This discrepancy is called the "flux-paradox for colloidal suspensions" (Green & Belfort, 1980), and is often attributed to an augmentation in particle transport due to a hydrodynamic lift force (Porter, 1972; Henry, 1972). This arises from inertial effects in the presence of flow boundaries. The phenomenom of particles being lifted or migrating away from the tube wall is usually termed the "tubular-pinch effect". Unfortunately, for membrane filtration processes in general, the evaluated inertial lift velocity is small compared to the permeation velocity (Altena & Belfort, 1984), and hence the theory predicts a concentrated layer of deposited particles would form on the membrane surface and eventually block the flow channel.This situation has not been observed experimentally for filtering relatively concentrated particulate feed suspensions (Davis & Leighton, 1987), which thereby contradicts the underlying theory of the tubular-pinch effect model. None of the models proposed to date which are based upon the tubular-pinch effect incorporate a correction for the lift velocity to account for the presence of other particles (Zydney and Colton, 1986).
Another theory, proposed by Blatt et al. (1970), considers the extent of particle deposition on the membrane surface to be balanced by the rate of removal of the

particle layer formed. This particle layer moves tangentially along the membrane surface due to the hydrodynamic shear forces exerted by the flow of the bulk of the suspension, and exits the flow channel together with the bulk of the suspension. The build-up of particles at the membrane surface is usually observed to dramatically reduce the filtrate flux compared to the pure solvent flux. Using this mechanism as a basis, zydney & Colton (1982) proposed that the flux-paradox was due to an augmentation of the diffusive motion of particles in the concentrated cake layer resulting from shearing forces imparted by the flowing bulk of the suspension. The enhanced particle diffusivity observed under simple shearing forces arises from particle migrations and rotations causing the concentrated cake layer to expand and become re-entrained in the faster moving bulk of the suspension. These particle displacements are distinct from Brownian diffusion since they result from particle interactions with other particles in the presence of shear rather than particle interactions with solvent molecules which are present even in the absence of shear. This process is termed "shear-induced particle diffusion", and is described in detail by Leighton & Acrivos (1987).
Eckstein et al. (1977) tracked the motion of individually labelled particles in a Couette flow device to analyse augmented particle diffusion. They found that the particle diffusion coefficient, Dp, increased with increasing particle concentration up to a volume fraction of 0.2 and was approximately constant thereafter with a value given by the following equation:
where dp is the particle diameter.Zydney & Colton (1986) incorporated Equation 4.25 into
Equations 4.19 and 4.21 for the permeate flux rate:
Dp = 0.03 dp Yw (4.25)
(4.26)

where CpW and Cp^ respectively refer to the dimensionless particle concentration (volume fraction) at the membrane surface and in the bulk of the suspension.
The volume fraction of particles may be evaluated using a semi-empirical equation such as that proposed by Krieger (Jeffery & Acrivos, 1976) which relates the volume fraction, Cp, to the relative viscosity, r|(Cp ), as follows:
Equation 4.27 assumes the particles are spherical and in a randomly packed arrangement. The aggregate volume fractions obtained for precipitated soya protein using Equation 4.27 were shown by Bell (1982) to be slightly greater than the volume fractions measured for low centrifugal force settling data (maximum RCF = 770). Although the pressure forces involved during hollow-fibre membrane filtration are not typical of such centrifugal forces, Equation 4.27 would be expected to yield a reasonable estimate for the particle volume fraction in the bulk of the suspension, the volume fraction at the wall assuming a value of 0.62. A similar empirical expression was proposed by Leighton & Acrivos (1987) for the relative viscosity of rigid latex particles in shear flow at ambient pressure. At a shear rate of 24 s--*- and for volume fractions up to 0.5 the relative viscosity may be determined by:
Zydney and Colton (1986) found their model (Equation 4.26) to correlate experimental data with a good degree of accuracy especially for deformable particles such as red blood cells. However, Davis & Leighton (1987) have recently shown the diffusivities obtained by Eckstein to be a considerable underestimate due to wall effects in the Couette flow device used for measurement. For a particle volume fraction of 0.4 they reported an effective particle diffusivity 25 times greater than that reported by Eckstein
(4.27)
(4.28)
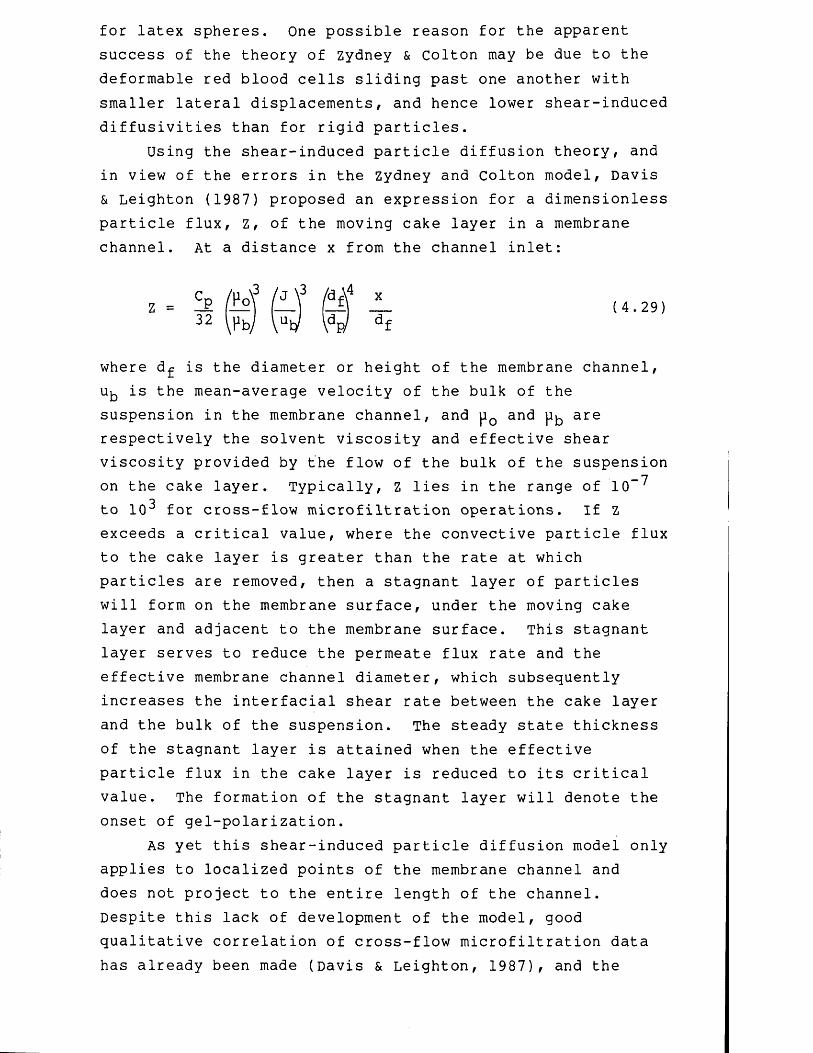
for latex spheres. One possible reason for the apparent success of the theory of zydney & Colton may be due to the deformable red blood cells sliding past one another with smaller lateral displacements, and hence lower shear-induced diffusivities than for rigid particles.
Using the shear-induced particle diffusion theory, and in view of the errors in the zydney and Colton model, Davis & Leighton (1987) proposed an expression for a dimensionless particle flux, z, of the moving cake layer in a membrane channel. At a distance x from the channel inlet:
where d^ is the diameter or height of the membrane channel, u^ is the mean-average velocity of the bulk of the suspension in the membrane channel, and pQ and p^ are respectively the solvent viscosity and effective shear viscosity provided by the flow of the bulk of the suspension
_ 7on the cake layer. Typically, z lies in the range of 10 to 10^ for cross-flow microfiltration operations. If Z exceeds a critical value, where the convective particle flux to the cake layer is greater than the rate at which particles are removed, then a stagnant layer of particles will form on the membrane surface, under the moving cake layer and adjacent to the membrane surface. This stagnant layer serves to reduce the permeate flux rate and the effective membrane channel diameter, which subsequently increases the interfacial shear rate between the cake layer and the bulk of the suspension. The steady state thickness of the stagnant layer is attained when the effective particle flux in the cake layer is reduced to its critical value. The formation of the stagnant layer will denote the onset of gel-polarization.
As yet this shear-induced particle diffusion model only applies to localized points of the membrane channel and does not project to the entire length of the channel.Despite this lack of development of the model, good qualitative correlation of cross-flow microfiltration data has already been made (Davis & Leighton, 1987), and the
(4.29)

inherent theoretical contradictions of the tubular-pinch models have been overcome. Although these permeate flux rate models have been developed for the cross-flow microfiltration of particulate solids, they should also apply to the less permeable ultrafiltration membranes. However, the application of these models to process streams which contain significant quantities of similarly polarizing macrosolutes has not been reported. These shear-induced particle diffusion models assume that the necessary hydraulic resistance to reduce the flux is provided by the particle layer which builds up at the membrane surface.This has been shown to be true for the cross-flow microfiltration of deformable particles such as red blood cells (zydney & Colton, 1986) but for the ultrafiltration of precipitated protein the porosity of a coherent layer of closely packed protein aggregates is too large to cause a significant resistance to flow by itself (Devereux et al., 1986b) .
For the third category of concentration polarization, where the polarizing species are suspended solids and macrosolutes, membrane filtration models often simply correlate the permeate flux rate to the shear rate using an equation of the form:
J = A Ywz (4.30)
where A is a constant. The value of the shear rate exponent, z, usually varies from 0.6 to 1.33 depending on the particular membrane and filter geometry used and the product to be filtered (cheryan, 1986; zydney & Colton,1986) .
Fane et al. (1982) proposed a "scour-model" to describe the effect of suspended solids in a macrosolute feed material. The theory is based on the interface between the bulk flow of the suspension and the deposited solids on the membrane surface being a region of high shear and erosion. Thus, the presence of suspended solids promotes turbulence and augments the back diffusion of macrosolutes by scouring the membrane or cake layer surface. The scour-model may be written as:
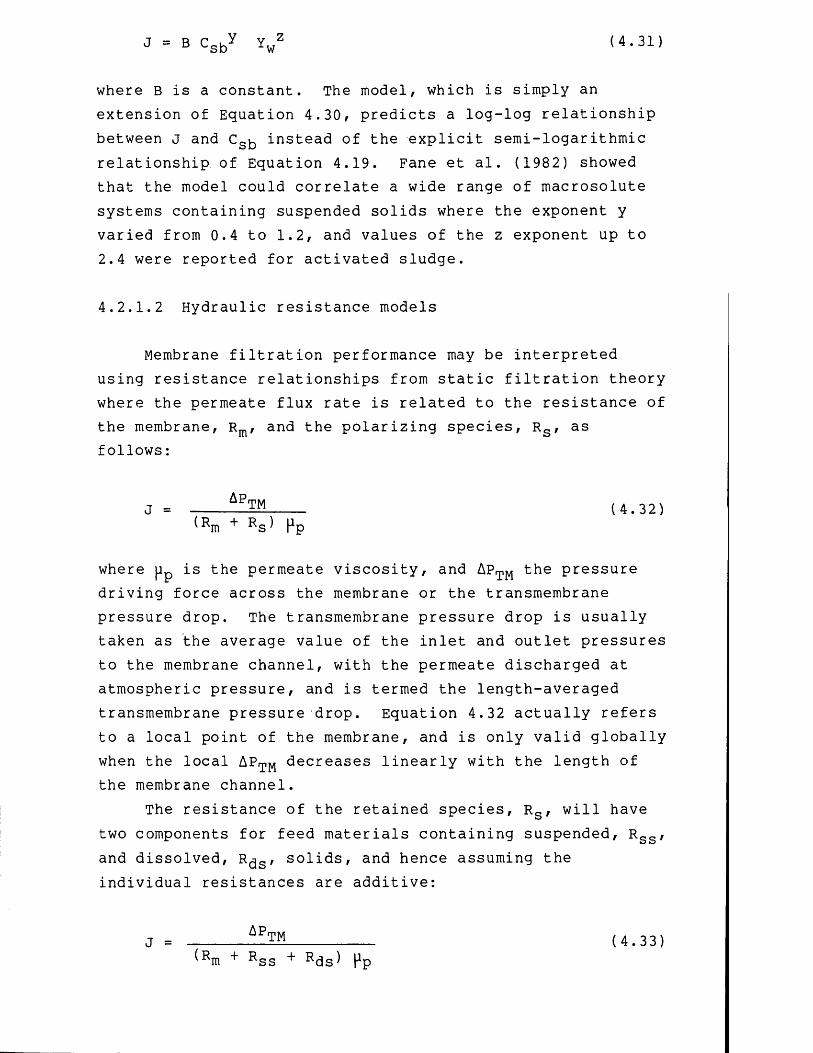
(4.31)
where B is a constant. The model, which is simply an extension of Equation 4.30, predicts a log-log relationship between J and Cg^ instead of the explicit semi-logarithmic relationship of Equation 4.19. Fane et al. (1982) showed that the model could correlate a wide range of macrosolute systems containing suspended solids where the exponent y varied from 0.4 to 1.2, and values of the z exponent up to2.4 were reported for activated sludge.
4.2.1.2 Hydraulic resistance models
Membrane filtration performance may be interpreted using resistance relationships from static filtration theory where the permeate flux rate is related to the resistance of the membrane, Rm , and the polarizing species, Rs , as follows:
where pp is the permeate viscosity, and Aptm the pressure driving force across the membrane or the transmembrane pressure drop. The transmembrane pressure drop is usually taken as the average value of the inlet and outlet pressures to the membrane channel, with the permeate discharged at atmospheric pressure, and is termed the length-averaged transmembrane pressure drop. Equation 4.32 actually refers to a local point of the membrane, and is only valid globally when the local APtm decreases linearly with the length of the membrane channel.
The resistance of the retained species, Rs , will have two components for feed materials containing suspended, RSSf and dissolved, R^s , solids, and hence assuming the individual resistances are additive:
J (4.32)(Rm + Rs ) Pp
J (4.33)(Rm + Rss + R(3S) Pp
However, the addition of suspended solids to a macrosolute system is often observed to increase rather than decrease the permeate flux rate as implied by Equation 4.33 (Fane, 1986). In practical terms it is difficult to predict, even on a qualitative basis, how the presence of suspended solids will influence flux rates for a mixture of dissolved and suspended solids. For precipitated soya protein suspensions Devereux & Hoare (1986) found that the predicted resistances due to the precipitated protein aggregates, evaluated by the Carman-Kozeny relation, and the low concentration of macrosolutes was small compared to the observed resistance, and concluded that the major resistance, Ram/ was due to the active surface of the membrane in the presence of precipitated and soluble protein. This resistance can be related to the soluble protein rejection by the membrane, crs , and the mean particle diameter, dp, as follows:
Ram ^ ®s^^p (4.34)
where m is a constant and takes a value of 2.0 x 10® for precipitated soya protein suspensions concentrated using PM50 type hollow-fibre membranes. Combining Equations 4.32 and 4.34 for the permeate flux rate yields:
J = (4.35)(Rm + m crs/dp) pp
This model was only assessed for shear rates in the range of 1000 to 6000 s--*-, and the accuracy of the reported value for m would be questionable for shear rates outside this range.
Since the flux rate is a function of the transmembrane pressure drop, the aforementioned resistance models can only be applied to pre-gel polarized membranes where the protein concentration at the membrane surface has not attained a limiting value. A hydraulic resistance model for a gel- polarized membrane requires a further resistance term for the gel-polarized layer, Rg . Thus:

J = (4.36)(Rm + Rg + R s ) Pp
Increasing the transmembrane pressure drop simply increases the gel layer thickness, and hence increases Rg.
This concludes the theory section on membrane filtration. The theory section has been included here to assist in the discussion of the results and, where necessary, the following text will refer back to this section. The following sections concern the experimental results obtained using the pilot-scale membrane filtration equipment. The first section, 4.3.1, describes the preliminary studies. In retrospect of this preliminary work, the other sections, 4.3.2 and 4.3.3, examine in more detail the fluid mechanics of membrane filtration and the effects of the fluid flow conditions on the filtration rates.
4.3 Results and discussion
4.3.1 Preliminary studies on membrane filtration
Figure 4.1 shows the decline in permeate flux rate with increasing retained protein concentration for the examples of using a centrifugal and a positive displacement recirculation pump. The same membrane filtration system with only minor pipe-work modifications and the same membrane cartridge dimensions were used for both sets of data. Similarly, the membrane cartridge inlet and outlet pressures, 172 and 103 kpa, were initially equal and were maintained constant by reducing the pump speed or the retentate flow rate until the flow rate could be reduced no further. The permeate flux rate curve obtained using the centrifugal pump is typical of the results presented by Devereux et al. (1986a) for dewatering the same precipitated protein material. For both examples presented in Figure 4.1 the permeate flux rate curve is comprised of two regions.
_ oThe first region, up to approximately 230 kg m J total protein, is identified by a gradual reduction in the flux

<NI6J
<1)4->fOu><;Di—IIW0)OJ(0CUeuQ)Pa
20
10
5
0100 150 300 400
Total protein concentration, kg m-3
Figure 4.1 Permeate flux rate during the concentration of precipitated soya protein suspensions: the effect of recirculation pump type on the flux rate profile.
Membrane type, XM50; hollow-fibre length, 0.315 m, inner diameter, 1.52 mm; membrane area, 0.7 m . Experimental conditions: o , centrifugal pump; operating temperature,42 °C; inlet and outlet retentate pressures, 172 kPa,103 kPa; initial fraction of total protein soluble, 0.19;B , □ r positive displacement pump; operating
temperature, 27 °C; inlet and outlet retentate pressures;■ , 172 kPa, 103 kPa; □ , 172 kPa, 69 kPa; initialfraction of total protein soluble, 0.23.
rate as the concentration increased whereas in the second region a more rapid decline in the flux rate was observed.At the end of the first region of flux decline obtained using the centrifugal pump the cartridge inlet and outlet pressures dropped below the values set at the start of the process and the original pressure settings could not be regained. With the cartridge inlet pressure at 83 kPa and the outlet pressure at 41 kPa the final flux rate was recorded at a retentate flow rate of 1.8 xlO” m^ s“ . When the positive displacement pump was used the transition from the first region to the second region of flux decline was observed over the protein concentration range of 230 to 250 kg m” . The flux rate did not decline suddenly to the low value obtained using the centrifugal pump at the same protein concentration. When the flux rate had declined to 8 L m“2 h”-*- the cartridge outlet pressure was lowered from 103 kPa to 69 kPa while the inlet pressure was maintained at 172 kPa by increasing the retentate flow rate. This increase in the cross-flow, or transcartridge, pressure drop improved the flux rate despite the corresponding decrease in the length-averaged transmembrane pressure drop. Using the positive displacement pump enabled the concentration process to be continued until the cross-flow pressure drop could not be increased further without exceeding the maximum cartridge inlet pressure of 172 kPa. The final retentate concentration obtained, 305 kg m” , is similar to that obtained at a laboratory-scale by Devereux et al. (1986a) using PM50 type hollow-fibre membranes, 0.5 m long and1.1 mm in diameter, and a positive displacement gear pump to recirculate the retentate.
The sudden decline in the flux rate observed when using the centrifugal pump is ascribed to pump cavitation occurring which considerably reduced the flow of retentate passing through the membrane cartridge. The use of the positive displacement pump produced a more gradual and controlled decline in the flux rate over a significantly larger range of protein concentration. The increase in the flux with the cross-flow pressure drop and the correspondingly lower length-averaged transmembrane pressure drop suggests that the membrane was gel-polarized at this
protein concentration, although further experimentation would be required to verify this. The apparent coincidence of the range of protein concentration at which the second region of flux decline commenced for the two different systems is not considered to be a significant result. The sudden flux decline observed for the centrifugal pump system occurs over a comparatively small increase in protein concentration, and is likely to be the result of the highly viscous nature of the retentate rather than gel-polarization (Devereux et al., 1986a).
A higher final protein concentration was obtained using the positive displacement pump with two larger diameter,1.9 mm, CM50 type hollow-fibre membrane cartridges operated in parallel. The permeate flux rate curves are shown in Figure 4.2. A high initial protein concentration and two cartridges operated in parallel were used to reduce the total dewatering time. Again, when operating with constant cartridge inlet and outlet pressures, two regions of flux decline were observed, the first region up to a protein concentration of approximately 210 kg m” . The concentration process was continued until the flux rate in the second region of flux rate decline had dropped to
— 9 — 15 L m h x for both cartridges. The cross-flow pressure drop was then increased by a factor of 2.4 while slightly reducing the length-averaged transmembrane pressure drop from 138 kPa to 124 kPa. The increase in cross-flow pressure drop almost doubled the flux rate for both
— 9 — 1cartridges. When the flux rate had dropped to 2 L m h the process was stopped. The final protein concentration of
_ o385 kg m , and the other intermediate retentate concentrations, were calculated from a total protein mass balance for the dewatering operation.
The intersection between the two regions of flux rate decline occurred at a lower protein concentration compared to the intersection point observed for the smaller diameter, 1.52 mm, hollow-fibres as shown in Figure 4.1. This may be due to various factors, including the difference in the initial flux rates, the soluble protein content, or the flow rate of the retentate through the hollow-fibre channels. By interpolation of the flow meter readings, which were

rHIJZ(NIgJ
Q)4J(0uXDr— I 4-1<d4-J<TJ(Ugu<Deu
25
15
10
5
0200 250 300
Total protein concentration, kg m-3
Figure 4.2 Permeate flux rate during the concentration of precipitated soya protein suspensions: the effect of using large diameter hollow-fibres.
Membrane type, CM50; hollow-fibre length, 0.315 m, inner diameter, 1.9 mm; membrane area, 0.42 m2. Experimental conditions for both membrane cartridges: operating temperature, 25 °C; initial fraction of total protein soluble, 0.28; inlet and outlet retentate pressures: O ,• , 172 kPa, 103 kPa; □ , ■ , 207 kPa, 34 kPa. The
open and closed points refer to the two individual membrane cartridges.
recorded when the permeate flux rate was measured, the average velocity of the retentate in the hollow-fibres corresponding to the intersection point was estimated to be1.2 m s_1 for the large diameter fibres and 0.55 m s~^ for the small diameter fibres. This suggests the onset of the second region of flux decline cannot entirely be attributed to the mean-average velocity of the retentate in the membrane channels, and is therefore dependent on other factors yet to be established. However, in the second region of flux decline, the cross-flow pressure drop, and the corresponding mean-average velocity of the retentate, are important parameters as demonstrated by the large increase in permeate flux rate with cross-flow pressure drop.
The permeate flux rates for two different membrane types, XM50 and PM50, obtained using the positive displacement pump are compared in Figure 4.3. The results refer to two separately performed dewatering experiments using different batches of precipitated protein feed material. Both membrane types exhibited the two regions of flux rate decline with increasing concentration and the intercept, or the transition point, between the two regions occurred at about 235 kg m”2 for the PM50 type membrane and at 260 kg m“2 for the XM50 membrane. At the higher concentrations, beyond 280 kg m~2, the two flux rate profiles converged, the flux rate apparently becoming independent of the membrane type.
Figure 4.4 shows the effect on the permeate flux rate of increasing the hollow-fibre cartridge length from 0.315 to 0.64 m. The hollow-fibres were of the same membrane type, XM50, and diameter, 1.52 mm, and were operated at the same transmembrane and transcartridge pressure drops using the positive displacement pump. As before, the results refer to separate experiments performed using independently prepared batches of precipitated protein feed material. A small decline in the flux rate was observed for both cartridges in the first region of flux decline, over the concentration range of 110 to 200 kg m-2. Of greater significance is the point at which the transition to the second region of steeper flux decline occurred. For the

(NI6J
CD4- )
CtfV-lXDi—I M-l<1)
4 - )COCDgMCDCL,
o —
\ □
400300200150
Total protein concentration, kg m-3
Figure 4.3 Permeate flux rate during the concentration of precipitated soya protein suspensions: comparison of membrane types.
Experimental conditions: inlet and outlet retentate gauge pressures, 172 kPa, 69 kPa; operating temperature, 27 °C; hollow-fibre length, 0.315 m, inner diameter, 1.52 mm; □ , XM50 membrane type, membrane area, 0.65 m2, initial fraction of total protein soluble, 0.24; O , PM50 membrane type, membrane area, 0.70 m , initial fraction of total protein soluble, 0.18.

(NIej
o4JCOi-lx:Dr— I4-1o4_)COCDe0CL,
25
20
10
0400BOO200150
Total protein concentration, kg m-3
Figure 4.4 Permeate flux rate during the concentration of precipitated soya protein suspensions: the effect of changing the hollow-fibre length.
Experimental conditions: inlet and outlet retentate pressures, 172 kPa, 69 kPa; operating temperature, 27 °C; membrane type, XM50; hollow-fibre inner diameter, 1.52 mm; O , hollow-fibre length, 0.315 m, membrane area, 0.7 m ,
initial fraction of total protein soluble, 0.18; □ ,2hollow-fibre length, 0.64 m , membrane area, 1.39 m ,
initial fraction of total protein soluble, 0.19.

longer cartridge this point was reached at a protein concentration of 200 kg m”2 while for the short cartridge the first region continued up to 260 kg m“2. Consequently, low flux rates, of say below 4 L m“2 h”1, were observed at 250 kg m"2 for the longer cartridge while the flux rate for the shorter cartridge did not reach this value until the concentration had exceeded 300 kg m“2. The retentate flow rates were not recorded for these experiments.
The effect of using different hollow-fibre diameters,1.1 and 1.52 mm, at a fixed cartridge length, 0.315m, and membrane type, XM50, is shown in Figure 4.5. The cartridges were examined in parallel to ensure the same retentate material was used throughout. The small difference in the initial permeate flux rates may be attributed to the degree of membrane fouling. Soft water flux measurements (see figure legend) indicated a higher membrane resistance for the larger diameter hollow-fibres, and this was reflected in the lower flux rates obtained when using this cartridge for
— "3the concentration of protein up to 200 kg m . For the small diameter hollow-fibres the transition point was reached at approximately 190 kg m“2 compared to 230 kg m“ for the large diameter hollow-fibres. Consequently, the flux rate obtained for the small diameter fibres was observed to decline below that of the large diameter fibres at 200 kg m~2, and the flux rates declined in parallel
_ *3beyond 230 kg m .In summary, the results presented in Figures 4.1 to 4.5
show that there exists two distinct regions of flux decline with increasing protein concentration. The intercept of these two regions, or the transition point, where the flux rate starts to decline more rapidly with concentration, may be shifted to higher retentate concentrations by employing larger diameter and shorter length hollow-fibres. In the second region of steeper flux decline the flux rate can be enhanced by increasing the cross-flow pressure drop, provided that sufficient flow of retentate can be maintained. Provision of high retentate flow rates at high dewatered concentrations necessitates employing a positive displacement recirculation pump.
A more detailed analysis of the trends using this data

250 300 350100 150 200
Total protein concentration, kg m-3
Figure 4.5 Permeate flux rate during the concentration of precipitated soya protein suspensions: the effect of changing the hollow-fibre diameter.
Experimental conditions: inlet and outlet retentate pressures, 207 kPa, 138 kPa; membrane type, XM50; hollow- fibre length, 0.315 m; membrane area, 0.70 m 2; operating temperature, 27 °C; initial fraction of total protein soluble, 0.1S; hollow-fibre inner diameter and soft water flux (measured at 20 °C and at inlet and outlet retentate pressures of 138 kPa, 103 kpa): O , 1.1 mm, 220 L m“2 h_1;□ , 1.52 mm, 190 L m-2 h--*-.
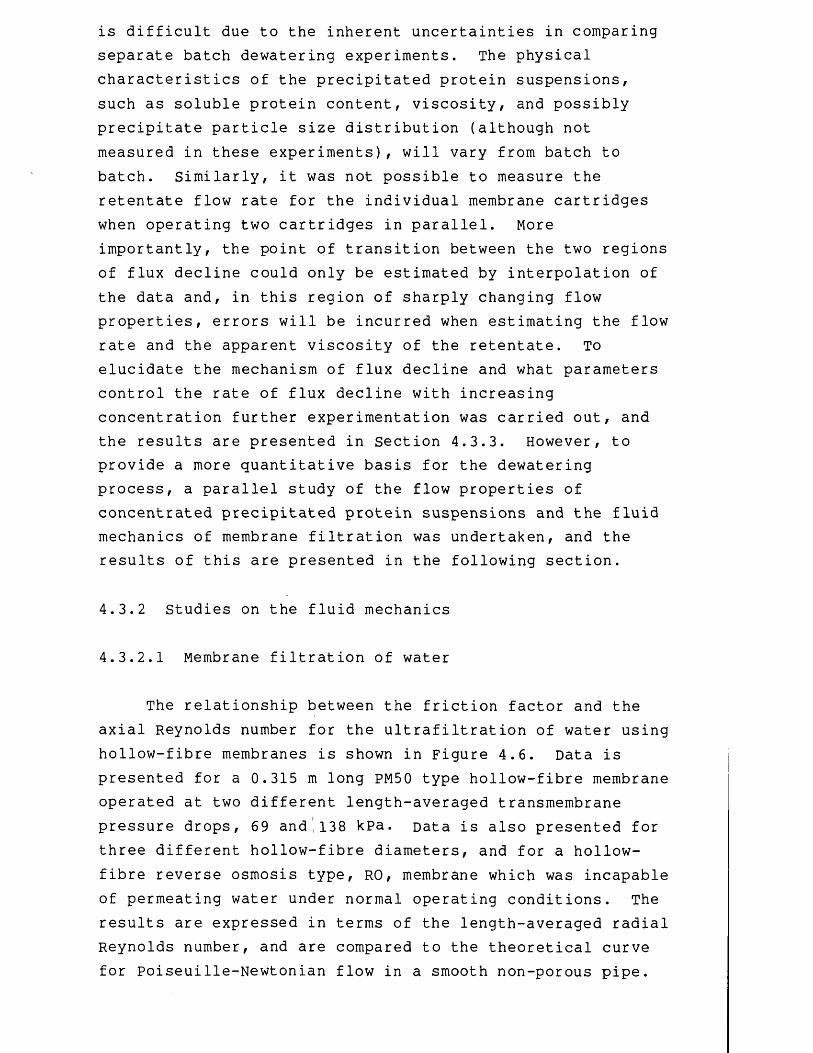
is difficult due to the inherent uncertainties in comparing separate batch dewatering experiments. The physical characteristics of the precipitated protein suspensions, such as soluble protein content, viscosity, and possibly precipitate particle size distribution (although not measured in these experiments), will vary from batch to batch. Similarly, it was not possible to measure the retentate flow rate for the individual membrane cartridges when operating two cartridges in parallel. More importantly, the point of transition between the two regions of flux decline could only be estimated by interpolation of the data and, in this region of sharply changing flow properties, errors will be incurred when estimating the flow rate and the apparent viscosity of the retentate. To elucidate the mechanism of flux decline and what parameters control the rate of flux decline with increasing concentration further experimentation was carried out, and the results are presented in Section 4.3.3. However, to provide a more quantitative basis for the dewatering process, a parallel study of the flow properties of concentrated precipitated protein suspensions and the fluid mechanics of membrane filtration was undertaken, and the results of this are presented in the following section.
4.3.2 Studies on the fluid mechanics
4.3.2.1 Membrane filtration of water
The relationship between the friction factor and the axial Reynolds number for the ultrafiltration of water using hollow-fibre membranes is shown in Figure 4.6. Data is presented for a 0.315 m long PM50 type hollow-fibre membrane operated at two different length-averaged transmembrane pressure drops, 69 a n d 138 kpa. Data is also presented for three different hollow-fibre diameters, and for a hollow- fibre reverse osmosis type, RO, membrane which was incapable of permeating water under normal operating conditions. The results are expressed in terms of the length-averaged radial Reynolds number, and are compared to the theoretical curve for Poiseuille-Newtonian flow in a smooth non-porous pipe.
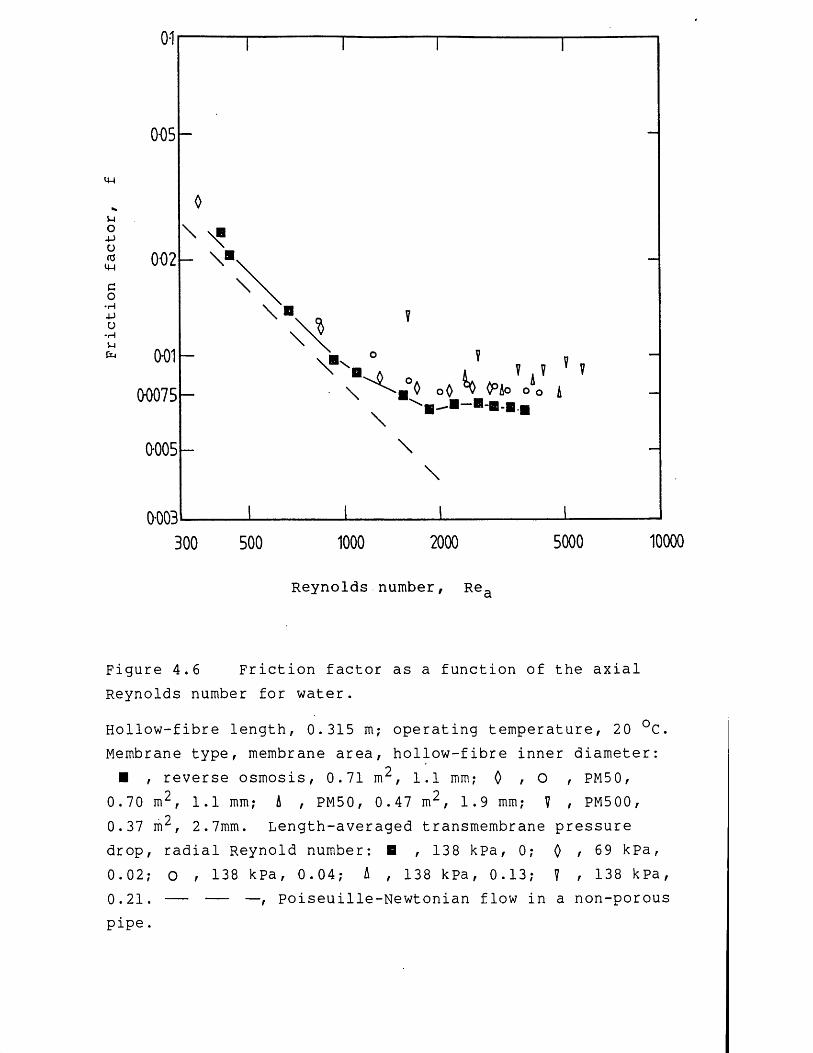
005
i-loJju (0 4-1 002GO•H-PU•rHUfcj
\ "
001
00075
0-005
0-00310000500020001000500300
Reynolds number, Rea
Figure 4.6 Friction factor as a function of the axial Reynolds number for water.
Hollow-fibre length, 0.315 m; operating temperature, 20 °C. Membrane type, membrane area, hollow-fibre inner diameter:■ , reverse osmosis, 0.71 m2, 1.1 mm; 0 , O , PM50,
0.70 m2, 1.1 mm; A , PM50, 0.47 m2, 1.9 mm; V , PM500, 0.37 rrr, 2.7mm. Length-averaged transmembrane pressure drop, radial Reynold number: ■ , 138 kPa, 0; 0 , 69 kPa, 0.02; o , 138 kPa, 0.04; A , 138 kPa, 0.13; y , 138 kPa,0.21. — , Poiseuille-Newtonian flow in a non-porouspipe.

The axial Reynolds number was evaluated using the length- averaged velocity of the retentate in the hollow-fibres, that is the average value of the velocity at the cartridge inlet and outlet, the difference being due to permeation of water. The friction factor was also evaluated using the length-averaged velocity, and the transcartridge pressure drop, after correcting for the static head pressure loss, or the head-loss pressure, but not for the end-loss pressure.
After correcting for the head-loss pressure, the transcartridge pressure drop used to evaluate the friction factor included the pressure drop due to: (i) the contraction and expansion at fittings at each end of the membrane cartridge; (ii) the pipe-work length between the membrane cartridge and the pressure gauges; (iii) the friction resulting from membrane drag, and; (iv) the change in momentum of the flowing fluid. The total pressure drop resulting from components (i) and (ii) is referred to as the end-loss pressure. The pressure drop for component (ii) mainly derived from the presence of the two long-radius bends in the pipe-work. Long-radius refers to pipe-work bends which curve gradually as opposed to a sharp elbow bend. Flow in the RO type hollow-fibres yielded the lowest friction factors which were slightly greater than the theoretical predictions for Poiseuille-Newtonian flow. In this case there is no permeation, and fluid momentum is conserved, whilst membrane friction induces a decrease in pressure with axial distance. Thus, ignoring errors in the pressure measurement which become less significant at high transcartridge pressure drops, the difference between the theory and the experimental results may be attributed to the end-loss pressure.
In the PM50 type hollow-fibres the pressure drop will increase due to membrane friction but also decrease due to momentum-loss by permeation. Overall, an approximate 15% increase in the friction factor due to permeation was observed by comparing the RO type hollow-fibres to the equivalent PM50 type fibres. In addition, although there is some scatter in the data at low axial Reynolds number, the friction factor only increased marginally when the permeate flux rate was doubled by increasing the transmembrane

pressure drop, indicated by the higher value of the radial Reynolds number (see figure legend). However, increasing the radial Reynolds number by increasing the hollow-fibre diameter, rather than the transmembrane pressure drop, induced a correspondingly large change in the magnitude of the friction factor. For the largest hollow-fibre diameter studied, 2.7 mm, the friction factor increased by approximately 30% compared to the reverse osmosis fibres. Similarly, the transition region between laminar and turbulent flow appeared to be shifted to a higher axial Reynolds number compared to the value of 2100 normally observed for flow in non-porous pipes.
For laminar flow through porous pipes Belfort & Nagata (1985) observed a maximum friction factor at a radial Reynolds number, Rer, of 0.23-0.33, and then a considerable drop up to Rer = 2, beyond which the friction factor remained relatively constant. They also observed suppression of turbulent flow and ascribed it to a combination of momentum-loss and axial flow reversal (that is where fluid immediately downstream of a porous section of the pipe experiences a force due to suction, or permeation, causing fluid close to the wall of the pipe to flow a short distance in the opposite direction to the bulk flow).Further experimental data would be required to establish the presence of a maximum friction factor for ultrafiltration membranes. However, to achieve greater radial Reynolds numbers, such as those employed by Belfort & Nagata, would require highly permeable membranes. Such experimentation is unrealistic since ultrafiltration operations usually operate at values of Rer < 0.2.
The relationship between the transcartridge pressure drop and the mean-average velocity of the retentate in the hollow-fibres, for a long and a short PM50 type hollow-fibre membrane cartridge is shown in Figure 4.7. The pressure- flow curves intersect the abscissa at a point corresponding to the head-loss pressure, and the onset of turbulent flow is characterized by the gradient change at a mean-average velocity in the hollow-fibres of around 1.7 m s“ , which is equivalent to an axial Reynolds number of 2100. Using this plot the end-loss pressure as a function of the velocity was

140
120CN
100a
O'
0
Velocity, m s”1
Figure 4.7 Transcartridge pressure drop as a function of the mean-average velocity of the retentate in the hollow- fibres for water.
Membrane type, PM50; hollow-fibre inner diameter, 1.1 mm; operating temperature 20 °C; length-averaged transmembrane pressure drop, 138 kPa. Membrane area and hollow-fibre length: • , 1.42 m2, 0.64 m; O , 0.70 m2, 0.315 m.

determined using Equation 4.12. This experimentally determined end-loss pressure is shown in Table 4.1 for several mean-average velocities, together with the predicted values calculated using Equations 4.9 to 4.11. Due to permeation the mean-average velocity at the cartridge inlet is higher than at the outlet, and the velocity, u^, of the retentate referred to here is the average value of the mean- average velocity at the inlet and outlet. Although several assumptions were made for predicting the end-loss pressure, such as basing the calculations on a single hollow-fibre and ignoring the effect of adjacent fibres, the predicted and the experimental pressure losses are in good agreement. One possible source of error may occur in the assumption that a fully developed velocity profile exists throughout the length of the hollow-fibres. Using Equation 4.22 the hollow- fibre length required to obtain a fully developed laminar velocity profile is less than 1/5 of the length of the shortest hollow-fibre examined, and hence this error will be cancelled out when determining the end-loss pressure.
The largest component of the transcartridge pressure drop was the pressure drop due to membrane friction. In turbulent flow the end-loss pressure became more significant but this study is confined to laminar flow systems which predominate in hollow-fibre membrane ultrafiltration. The effect of correcting for the end-loss pressure using the experimental data presented in Figure 4.7 is shown in Figure 4.8 which gives the relationship between the shear stress and the shear rate at the membrane surface. The shear stress and the shear rate were evaluated according to Equation 4.3 and, to account for the permeation of water, the length-averaged velocity of the retentate in the hollow- fibres. Figure 4.8 also presents data for the RO type hollow-fibres after correcting for end-loss pressure. Flow in the RO type hollow-fibres accurately correlated the Poiseuille-Newtonian relationship (Equation 4.4) for pipe- flow whereas flow in the PM50 type hollow-fibres yielded a shear rate exponent greater than 1 suggesting that the flowing fluid was 'dilatant'. This apparent dilatant nature of water is a consequence of the additional increase in frictional pressure drop observed for the permeating hollow-
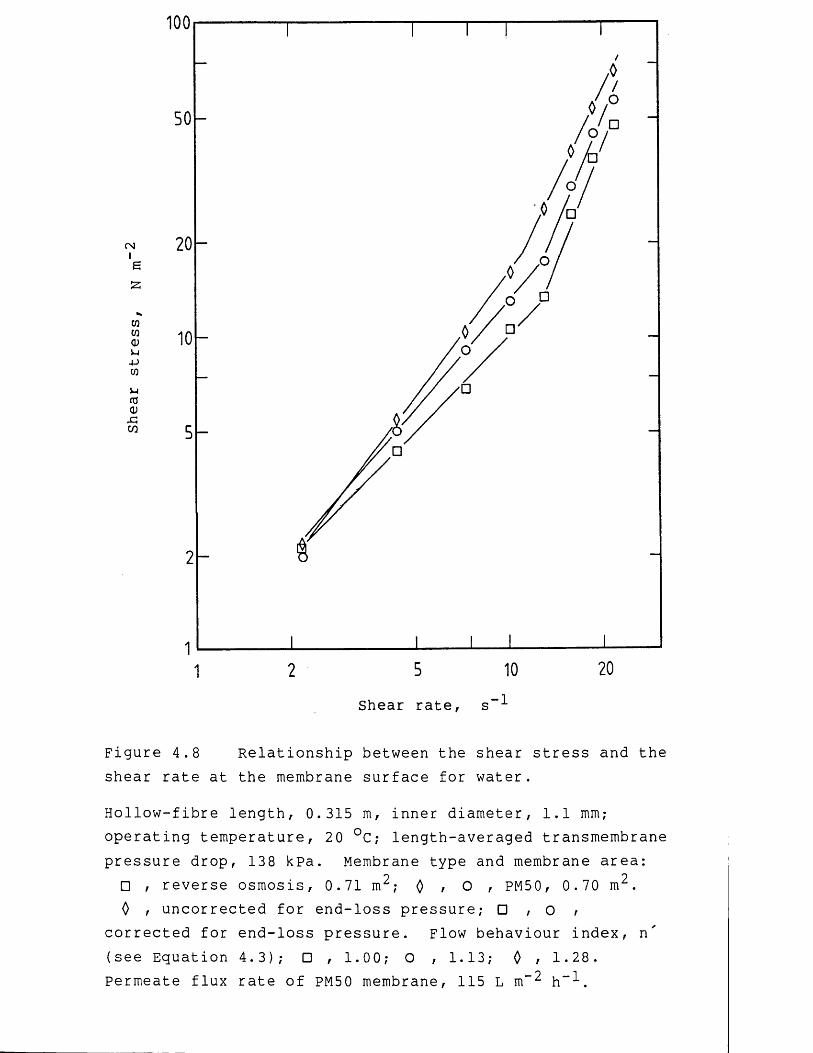
100
CNe
4->
20Shear rate, s”1
Figure 4.8 Relationship between the shear stress and the shear rate at the membrane surface for water.
Hollow-fibre length, 0.315 m, inner diameter, 1.1 mm; operating temperature, 20 °C; length-averaged transmembrane pressure drop, 138 kpa. Membrane type and membrane area:□ , reverse osmosis, 0.71 m2; 0 , 0 , PM50, 0.70 m 2.0 , uncorrected for end-loss pressure; □ , o ,
corrected for end-loss pressure. Flow behaviour index, n' (see Equation 4.3); □ , 1.00; O , 1.13; 0 , 1.28.Permeate flux rate of PM50 membrane, 115 L m-2 h"-*-.

Retentate
Average
velocity
End-loss
pressure
Tota
lmaterial
of fluid
in
pressure
loss
holl
ow-f
ibre
s Predicted
Obse
rved
C Ni
CNI o O o O O Oo O o O o O0 0 LD O 0 0 o O<T\ LO CN 0 0 V O
rH CN CN VO
C NIEZ
O O o o o oO O o o o oLO VO VO r o i— I o1— 1 ro i— I ro
CNIEZ
o o o o o oo o o LO o or - CN ro r^- ro N 1CN N* CN N 1
X3
V O O N *• • •
O i—I >—I
u0XCO£
V O O • • •
O i—I i—I
1 30X(0X•H
g• H04->OV4CU 04•rHo0V404c0>iOCO
co•rH4->•rHG•rHCM0)1 3XOXa;X34->coi—iuG0eoGCDCL)CO
Eco(U • GX CO COX ) 1 3•rH G z4-1 CU1 X r oS 1O CO o1- 1 3 i— i1-1 •rH Xo rax co oX •(U L OX C P4-> G IIoo 1—1 - X4-)
o »•4-1 ? CTlCU 4-> O'!r H .G 1 3 o•I—1 Gc0 II(UX G4-J COCU4-J X Gco X -I—1•rH 0G 4-4 Xo 1 o•rH 5 x4-J O XuU i—lCO i— 1 COX o > i-LJ X oC COo CUu X XX 0o X4-J E COo XCU x -rH3 4-1 C U13 •rH
X uCO CU 0CO 1- 1 XO X C Ui— 1 3O XCU oX 0 X3 XCO X coCO XCU X COx co 1 3C U G > iCO O XCU •rH •rH13 CO CO3 c oi— 1 CO uU D u COG X •rH• H 0 >
CD4-JCOX
XCOCUX !CO
COCO0 *x xX 0CO X0x Eco o0 oX COCO •rH>oX x
0G 1 3O G•rH •rHX i— 1co > i •E u 0•rH CPX o 1 3o • H •rHX X xC U X XC U G xco 0 coO u? Gc0 O 0■— 1 O G1 COX 0 X0 i— 1 X5 X EO 3 0C U O E
13c0 CPc0 GC P O
G E l— 1-rH OX X EX X•rH L OX 13 i— 1
0 r o> i G •X •rH oCO1 3 X co0 XG o G•rH OE COX 0 130 3 0X i— 1 CO0 c0 COU > X
Table
4.1
End-loss
pressure
for
water
and
prec
ipit
ated
-soy
a protein
susp
ensi
ons
during
holl
ow-f
ibre
membrane
filt
rati
on

fibre membranes compared to the RO type membranes.
4.3.2.2 Membrane filtration of precipitated protein suspensions
The friction factor for the ultrafiltration of precipitated soya protein using a PM50 type hollow-fibre membrane and a short length cartridge is shown in Figure 4.9. The friction factor is plotted as a function of a generalized Reynolds number, as defined by Equation 4.16. The viscosity data (see figure legend) used to evaluate the Reynolds number was determined by fitting a power-law equation to the viscosity data obtained using a double concentric cylinder viscometer operated over a similar range of shear rates to those employed for the filtration experiment. The relative viscosity of the protein suspension used to conduct this experiment was about 5 times greater than the viscosity of water. Also, the protein permeate flux rate was more than an order of magnitude smaller than the water flux rate at the same transmembrane pressure drop. At these low flux rates the radial Reynolds number approaches zero, Rer = 0.006, permeation effects are negligible and, after correcting for the end-loss pressure, the friction factor closely correlates to the theoretical curve for laminar flow of a viscoelastic fluid given by Equation 4.16.
The end-loss pressures were determined from Figure 4.10 which shows the relationship between the transcartridge pressure drop and the mean-average velocity of the retentate at two hollow-fibre lengths for precipitated soya protein. The experiment was performed at the same retentate concentration by replacing the short length cartridge with the longer cartridge during the one experiment. Other experimental details are given in the figure legend. As with the ultrafiltration of water, the end-loss pressure may be determined using Equation 4.8 and, in Table 4.1, the resulting experimental values are compared to the predicted values. The difference between predicted and experimental observations is partly attributed to errors in pressure measurement. The development of a laminar velocity profile
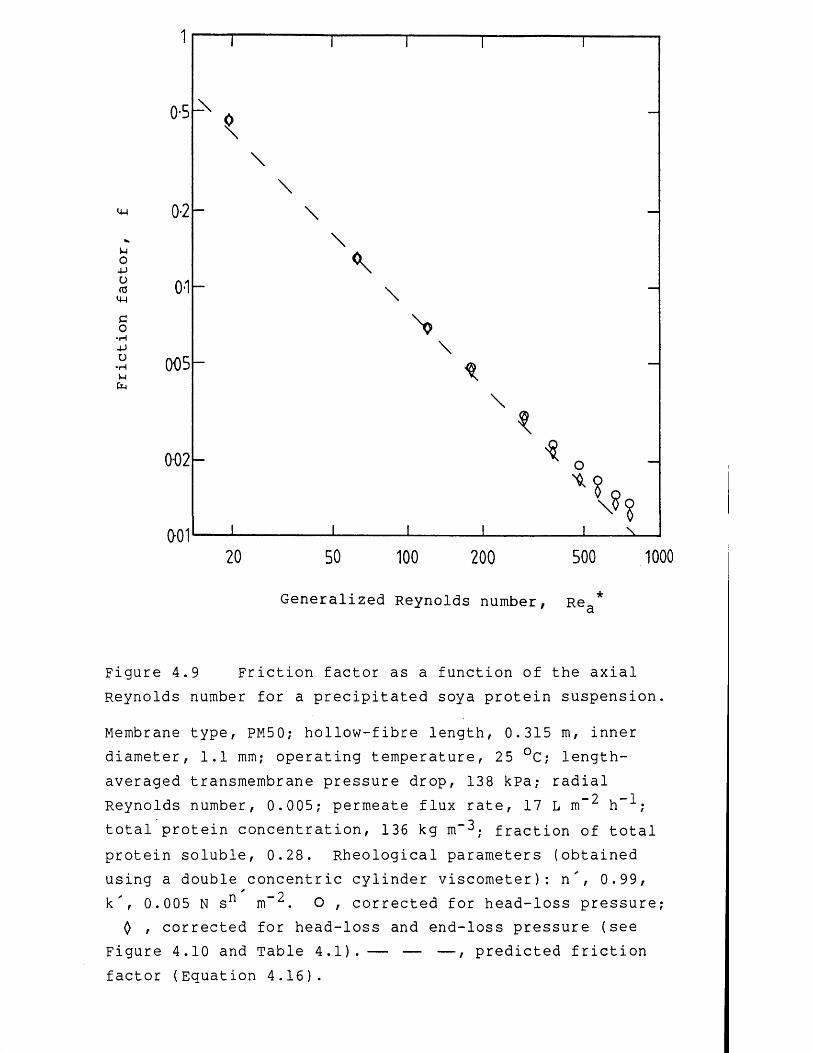
4-1
UO4-JuftJ4-1co-Pu•HUUa
005
002
0-01100020 500100 200
Generalized Reynolds number, Re.
Figure 4.9 Friction factor as a function of the axial Reynolds number for a precipitated soya protein suspension.
Membrane type, PM50; hollow-fibre length, 0.315 m, inner diameter, 1.1 mm; operating temperature, 25 °C; length- averaged transmembrane pressure drop, 138 kpa; radial
_ o _ IReynolds number, 0.005; permeate flux rate, 17 L m h ; total protein concentration, 136 kg m“3. fraction of total protein soluble, 0.28. Rheological parameters (obtained using a double concentric cylinder viscometer): n', 0.99, k', 0.005 N sn m“ . O , corrected for head-loss pressure;0 , corrected for head-loss and end-loss pressure (see
Figure 4.10 and Table 4.1). — — — , predicted friction factor (Equation 4.16).
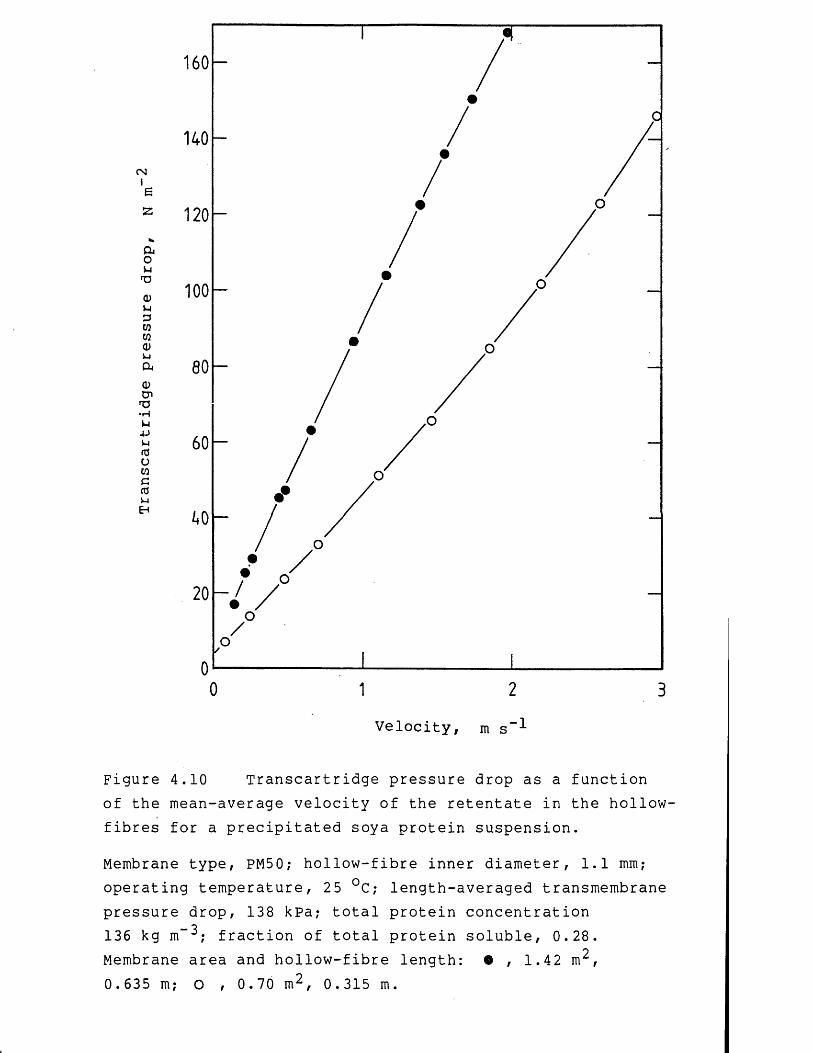
CNI
04ou'UQ)uawcoa;u040)cnT3•rHl-l4-JMnju03CCtJVHEH
Velocity, m s”1
Figure 4.10 Transcartridge pressure drop as a function of the mean-average velocity of the retentate in the hollow- fibres for a precipitated soya protein suspension.
Membrane type, PM50; hollow-fibre inner diameter, 1.1 mm; operating temperature, 25 °C; length-averaged transmembrane pressure drop, 138 kpa; total protein concentration 136 kg m“3; fraction of total protein soluble, 0.28. Membrane area and hollow-fibre length: • , 1.42 m ,0.635 m ; O , 0.70 m 2, 0.315 m.

will be the same for the long and short length fibres, and hence no errors will arise from subtracting the pressure drop for the long cartridge from the pressure drop for the short cartridge. The errors of pressure measurement partly arise from the presence of pressure tap holes for the diaphragm pressure gauges (see Chapter 3). Tanner & Pipkin (1969) demonstrated that pressure tap hole errors for incompressible Newtonian liquids are negligible but are often large and negative for viscoelastic liquids when the laminar flow-lines become distorted by the tap hole. Measuring the differential pressure as opposed to the absolute pressure will tend to cancel out these systematic errors.
Determination of end-loss pressure at higher viscosities is difficult since the large transcartridge pressure drops required of the longer fibres cannot be maintained. However, the data presented in Table 4.1 indicates that as the retentate becomes more viscous the relative contribution of end-loss pressure to the overall transcartridge pressure drop diminishes.
Figure 4.11 shows the shear stress - shear rate behaviour for a range of precipitated protein concentrations. The membrane filtration data were determined by varying the transcartridge pressure drop at a constant length-averaged transmembrane pressure drop and protein concentration, maintained by recycling the permeate to the retentate. The shear stress was evaluated using the transcartridge pressure drop which was corrected for the' head-loss pressure but not for pressure changes due to permeation or the end-loss pressure. The contribution of permeation effects to the measured transcartridge pressure drop was negligible and was ignored. Although the end-loss pressure was more significant, it was difficult to estimate with any degree of certainty without further experimentation, that is determining the transcartridge pressure drop for a range of hollow-fibre lengths. Using Table 4.1 the maximum error incurred by not accounting for the end-loss pressure was estimated to be approximately 10% of the total shear stress. The shear rate at the membrane surface was calculated using Equation 4.2 assuming a single
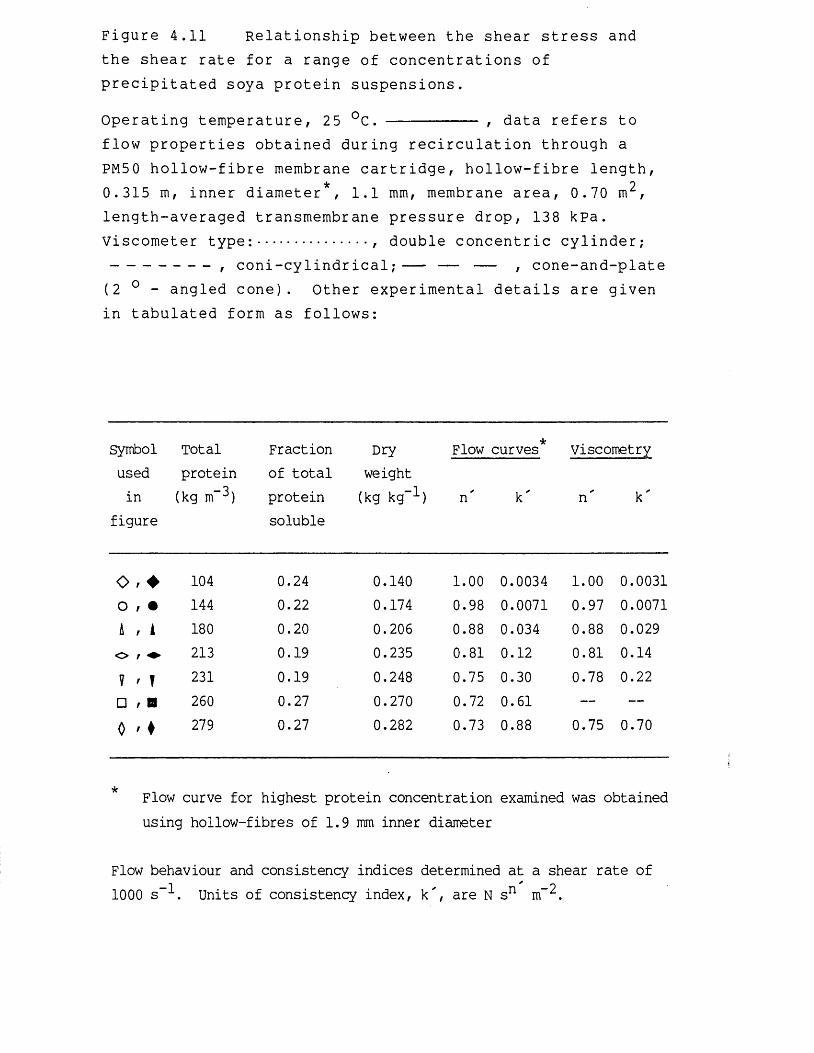
Figure 4.11 Relationship between the shear stress andthe shear rate for a range of concentrations ofprecipitated soya protein suspensions.
Operating temperature, 25 °C. ---------- , data refers toflow properties obtained during recirculation through a PM50 hollow-fibre membrane cartridge, hollow-fibre length, 0.315 m, inner diameter , 1.1 mm, membrane area, 0.70 m , length-averaged transmembrane pressure drop, 138 kpa.Viscometer type:............., double concentric cylinder;----------- , coni-cylindrical;-- — — , cone-and-plate(2 0 - angled cone). Other experimental details are given in tabulated form as follows:
Symbol Total Fraction Dry kFlow curves Viscometryused protein of total weightin (kg m*~2) protein (kg kg-1) n' k' n' k'
figure soluble
O r ♦ 104 0.24 0.140 1.00 0.0034 1.00 0.0031o , • 144 0.22 0.174 0.98 0.0071 0.97 0.0071A , 1 180 0.20 0.206 0.88 0.034 0.88 0.029
O r ♦ 213 0.19 0.235 0.81 0.12 0.81 0.14V ' T 231 0.19 0.248 0.75 0.30 0.78 0.22□ , B 260 0.27 0.270 0.72 0.61 — —0 ' ♦ 279 0.27 0.282 0.73 0.88 0.75 0.70
Flow curve for highest protein concentration examined was obtained using hollow-fibres of 1.9 mm inner diameter
Flow behaviour and consistency indices determined at a shear rate of 1000 s--*-. Units of consistency index, k', are N sn m-2.
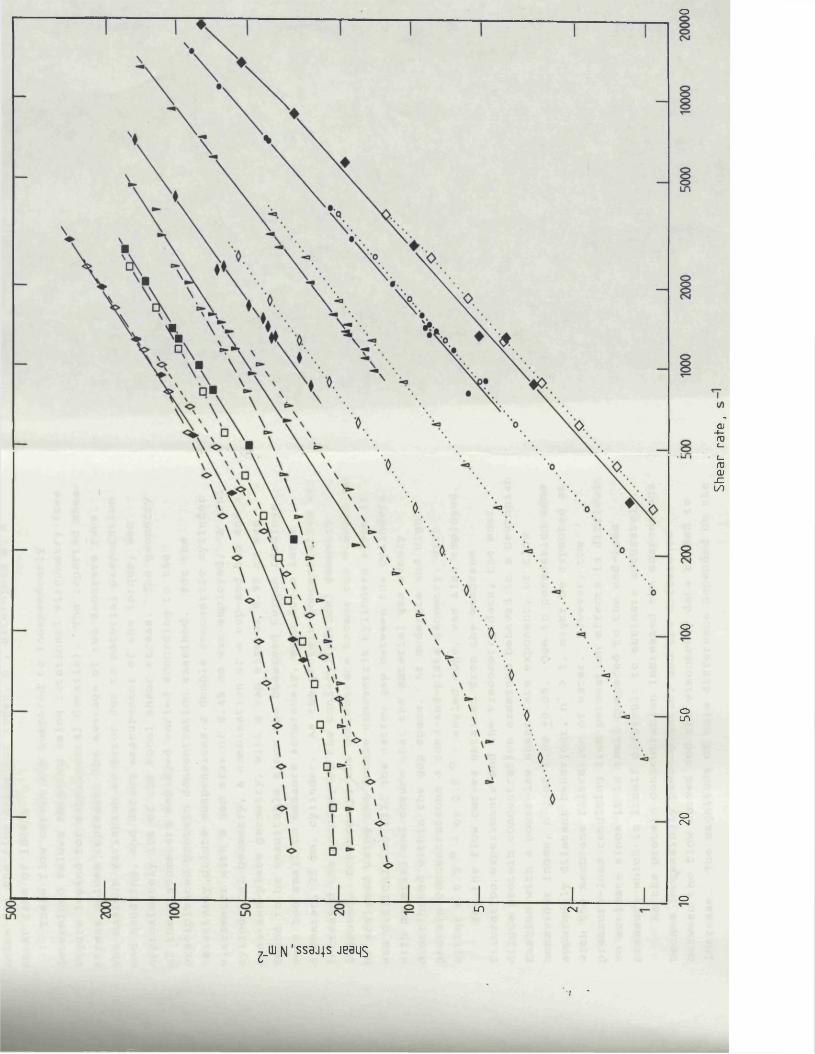
o
o
oi_n
ocsi
oun (N
_iu n ' ssejjs jeeqs
Shea
r ra
te,

value for the flow behaviour index, n', determined at a shear rate of 1000 s”^.
These flow curves are compared to independently determined values obtained using rotational viscometry (see figure legend for experimental details). The reported shear stress values represent the average of two separate runs.The maximum variation or error due to material preparation and handling, and during measurement of the torque, was approximately 10% of the total shear stress. The geometry of the viscometers employed varied according to the precipitated protein concentration examined. For the relatively dilute suspensions a double concentric cylinder viscometer with a gap size of 0.45 mm was employed. A coni- cylindrical geometry, a combination of a cup-and bob and a cone-and-plate geometry, with a gap size of 0.95 mm was found to be unsuitable since the observed torque readings were too small to measure accurately, even for a large diameter, 25 mm, cylinder. As the protein concentration was increased the accuracy of the coni-cylindrical geometry improved. Conversely, the concentrate became too viscous to be analysed using the double concentric cylinders since it was difficult to fill the narrow gap between the cylinders with material and ensure that the material was evenly distributed within the gap space. At moderate and high protein concentrations a cone-and-plate geometry, with either a 0.5 ° - or 2.0 ° - angled cone, was also employed.
For the flow curves obtained from the membrane filtration experiments and the viscometry data, the most dilute protein concentration examined behaved in a Newtonian fashion with a power-law shear rate exponent, or flow behaviour index, n', of 1.00 +0.05. Due to permeation some apparently dilatant behaviour, n' > 1, might be expected as with the membrane filtration of water. However, the pressure-loss resulting from permeation effects is difficult to estimate since it is small compared to the end-loss pressure which is itself difficult to estimate accurately.
As the protein concentration increased the suspensions became increasingly pseudoplastic, and the difference between the flow curves and the viscometry data tended to increase. The magnitude of this difference depended on the

protein concentration dnd the type of viscometer employed.At the highest concentrations examined here the smallest differences were obtained using the coni-cylindrical geometry. If the end-loss pressure was accounted for in determining the flow curves the difference would be even smaller. In addition, for pseudoplastic materials analysed' using Couette flow geometries, such as the coni-cylindrical geometry, it is often necessary to correct the assumed shear rate since there will be a non-linear distribution of shear rates across the gap (Van Wazer et al., 1963). This correction may be performed using the Ostwald correction factor, kostw' which is expressed in terms of the geometry of the viscometer and is related to the corrected shear rate, Yc, as follows:
where R^ and Ra are respectively the inner and outer radius of the cylindrical gap. The effect of applying the Ostwald correction would reduce the difference between the flow curves and the viscometric data. Applying Equation 4.37 to the coni-cylindrical geometry, using a value of 0.75 for the flow behaviour index, yielded less than a 2% decrease in the reported shear rate, Y, and hence the correction term was ignored. For the cone-and-plate data such a correction factor is not required since the shear rates for shallowangled cones, < 4 °, are approximately constant across the entire gap, provided that the centre of the cone is in contact with the plate.
Another source of error between the viscometry results and the measured flow curves may arise from the shear viscometry method employed. For all the geometries of the viscometers examined the torque readings were recorded 10 s after every change in the shear rate setting, to allow flow disturbances and inertial effects to subside. The more highly concentrated suspensions examined in Figure 4.11 were thixotropic, showing a fall in the apparent viscosity with prolonged shearing. At these same concentrations the exposure time to high shear conditions in the membrane
Y,c Y (4.37)

fibres ranged from 1 to 10 s compared to the viscometric measurements which required 300 s to examine the complete range of shear rates for each sample. Thixotropic behaviour would result in lower apparent viscosities, and the shear stress - shear rate curve obtained from the viscometer would be lower than the measured flow curve. However, the flow curves may be similarly affected since the precipitate suspension would also have been highly sheared on passing through the recirculation pump prior to entering the hollow- fibres which would tend to cancel this error due to thixotropy.
Despite ignoring the end-loss pressure and the errors involved in determining the rheological properties there is good agreement between the viscometry data and the actual flow properties in the hollow-fibres. Indeed the largest source of error may be attributed to the end-loss pressure which was not accounted for due to uncertainties in predicting it with the experimental data available. If a reasonable estimate of the end-loss pressure was made, then suitably specified viscometers could be employed toaccurately predict the flow curves over the range of shearrates examined in Figure 4.11.
The highly concentrated suspensions were observed to become more pseudoplastic at low shear rates and approach a yield stress. Instead of using the power-law approximation, an improved correlation between viscometry data and the measured flow curves at high concentrations may have been obtained if the flow curves had been modelled according to the Herschel-Bulkley or Casson model, which both account for the presence of a yield stress (Coulson & Richardson, 1979). However, compared to the power-law model, the mathematics involved in evaluating such models is cumbersome and complicated, and to gain a significant improvement over the power-law model an accurate estimate of the yield stress atzero shear rate is required (Dervisoglu & Kokini, 1986).With the experimental data available an accurate estimate of the yield stress cannot be made.
The cone-and-plate geometry was found to be unsuitable for predicting the flow curves, especially at low shear rates. Figure 4.12 compares the rheological properties, for

1000
500
200
1000020 100 1000
Shear rate, s“^
Figure 4.12 Comparison of the viscometry data obtained using cone-and plate geometry with a 0.5 0 - and 2.0 0 - angled cone.
Operating temperature, 25 °C; total protein concentration, 241 kg m-3; fraction of total protein soluble, 0.26. • , 0.5 0 - angled cone; o , 2.0 0 - angled cone.

a moderately concentrated precipitated protein suspension, measured using a 0.5 0 - and 2.0 ° - angled cone. For the shallow-angled cone the torque readings from the viscometer at low shear rates were irreproducible and very erratic,+ 30% of the reported value. Employing the 2 ° - angled cone improved the reproducibility and relatively stable torque readings, + 5%, were yielded for each shear rate setting examined. However, as shown in Figure 4.11, there still remained a large difference in the results obtained at low shear rates using the cone-and-plate and the coni- cylindrical geometries. This difference is difficult to explain. Generally, the cone-and-plate geometry is unsuitable for disperse systems since particle-surface interactions may control the resistance to deformation of the material and the point of the cone may not contact the plate. Similarly, at high shear rates, > 10 s~^, secondary flow and radial migration of the material out of the gap may occur (Dervisoglu & Kokini, 1986).
Figure 4.13 shows the variation of the flow behaviour index and the consistency factor with increasing total solids concentration. The values were determined at a shear rate of 1000 s” , which represents the approximate mid-point of the flow curves, from the shear stress - shear rate curves obtained using either the coni-cylindrical or double concentric cylinder viscometer geometries as shown in Figure 4.11. The pronounced non-Newtonian behaviour of the dewatered precipitated protein suspensions is indicated for a total solids content greater than 15%, which corresponded to approximately 100 kg m“ total protein. Two additional points have been included to show how the linear trends continue for the data at high solids concentrations. The precipitated protein material was prepared using a batch centrifuge. The viscometry method employed is described in Section 5.3.1.1, and the shear stress - shear rate results are presented in Figure 5.2.
Figure 4.14 shows how the resistance to deformation, as measured by the shear modulus, increases to a significant magnitude above a concentration of 250 kg m” precipitated protein. As with the yield stress, the shear modulus marks the onset of viscous flow where the interparticle forces are
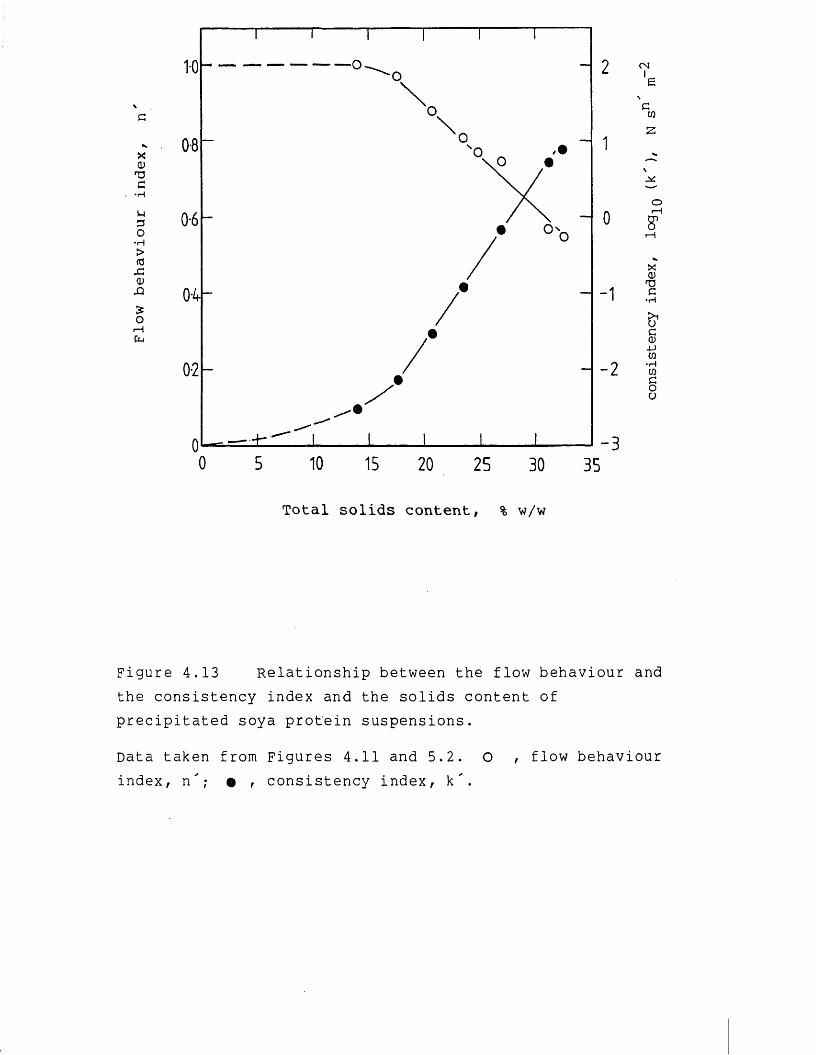
X<D53C•Huao•H><TJx:<DXI
oI—I tu
■4--10 15 20 25 30
Total solids content, % w/w
35
CMI
CO2
oi—3g1
XQ)TSC•rHuc<u-pCO•rHcoGOO
Figure 4.13 Relationship between the flow behaviour and the consistency index and the solids content of precipitated soya protein suspensions.
Data taken from Figures 4.11 and 5.2. O , flow behaviour index, n'; O r consistency index, k'.

CN162no
W3i-H3'COeurtJ0JZCO
_ oPrecipitated protein concentration, kg in J
260 280 300 320
03125 26 29 30
Total solids content, % w/w
Figure 4.14 Relationship between the shear modulus and the solids content of precipitated soya protein suspensions.
Operating temperature, 25 °C; fraction of total protein soluble, 0.245 + 0.01; samples prepared by membrane filtration. Pulse shearometer: minumum gap, 3.0 mm, maximum gap, 5.0 mm, 5 gap settings examined per sample.

broken down and the material flows with little hindrance from particle-particle interactions. Thus, a high yield stress or shear modulus coupled with a low shear rate may cause flow stagnation to occur where the inlet pipe expands to connect on to the membrane cartridge, and in the hollow- fibres themselves. However, the good agreement between the measured flow curves and the viscometry data shown in Figure 4.11 implies little fibre blockage or stagnation was occurring over the range of protein concentrations studied. It is particuarly important that no hollow-fibres become blocked during operation both from an engineering design view-point and for analysis of the factors affecting the permeate flux rate (see Section 4.3.3).
It has already been noted that the transcartridge pressure drop varies proportionally with the hollow-fibre length during laminar flow, Figure 4.10, since the end-loss pressure becomes negligible at high precipitated protein concentrations, provided high retentate flow rates are maintained in the pipe-work and there is no flow stagnation occurring. The transcartridge pressure drop also varies with the hollow-fibre diameter as shown in Figure 4.15.Also presented is the predicted transcartridge pressure drop evaluated using Equation 4.38, which is obtained by combining Equations 4.2 and 4.3, and interpolated viscosity data from the decreasing shear rate curve obtained using a coni-cylindrical viscometer. The results are expressed in terms of the shear rate at the membrane surface, Yw , as follows:
where _APCF refers to the cross-flow pressure drop along the hollow-fibres. In determining “APCF only the head-loss pressure was accounted for and not the end-loss pressure as required by the definition for the cross-flow pressure drop, Equation 4.8. Despite ignoring the end-loss pressure and fitting the rheological data to a power-law equation with single values for the flow behaviour and consistency indices, there is a good fit between the predicted and
Yw (4.38)

experimental results, apart from for the smallest hollow- fibre diameter where the predicted transcartridge pressure drop is lower than the measured pressure drop. This indicates that some fibre blockage or flow stagnation in the pipe-work may have occurred. Although the range of membrane shear rates examined for the three hollow-fibre diameters were similar, the total flow rate of retentate through the membrane cartridge, and consequently through the pipe-work, was an order of magnitude smaller for the smallest diameter hollow-fibres. At the lowest flow rates studied for the small diameter hollow-fibres the shear rates in the pipework associated with the membrane cartridge were estimated to be approximately 3 s” . At such low shear rates the protein concentrates exhibit structure formation which would be subsequently disrupted at the inlet to the hollow-fibres and would tend to form again at the outlet of the fibres. Disrupting such structural formations to cause the retentate to flow would lead to the higher than predicted transcartridge pressure drops observed for the small diameter hollow-fibres.
At high precipitated protein concentrations maintenance of high velocities, or corresponding membrane shear rates, cannot be achieved without eventually exceeding the bursting pressure of the membrane. At a constant transcartridge pressure drop and length of hollow-fibre the relationship between the membrane shear rate and the hollow-fibre diameter may be written, using Equation 4.38, as follows:
Yw cc df1/"' (4.39)
This indicates that higher membrane shear rates can be maintained without exceeding the bursting pressure by increasing the hollow-fibre diameter as shown in Figure 4.15. Unfortunately, the hollow-fibre diameter increases at the expense of the membrane area per unit of volumetric flow of the retentate, and thereby the membrane area per membrane cartridge is reduced. Conversely, a higher flow rate of retentate to the membrane cartridge can be maintained using large diameter fibres which minimizes

120
Q)i-iaww<uuO.
00
2000 40000 1000 3000
Shear rate, s
Figure 4.15 Relationship between the transcartridge pressure drop and the shear rate at the membrane surface for three hollow-fibre diameters.
Operating temperature, 25 °C; length-averaged transmembrane pressuredrop, 138 kPa; total protein concentration, 246 kg m“ , fraction oftotal protein soluble, 0.15. Membrane type and hollow-fibre innerdiameter: o , PM50, 1.1 mm; □ , PM50, 1.9 mm; 0 r PM500, 2.7 mm.------- data obtained using Equation 4.38, APcf refers to measuredtranscartridge pressure drop, corrected for head-loss pressure,uncorrected for end-loss pressure, rheological parameters (obtained✓using a coni-cylindrical viscometer): n', 0.78; k', 0.26 N sn
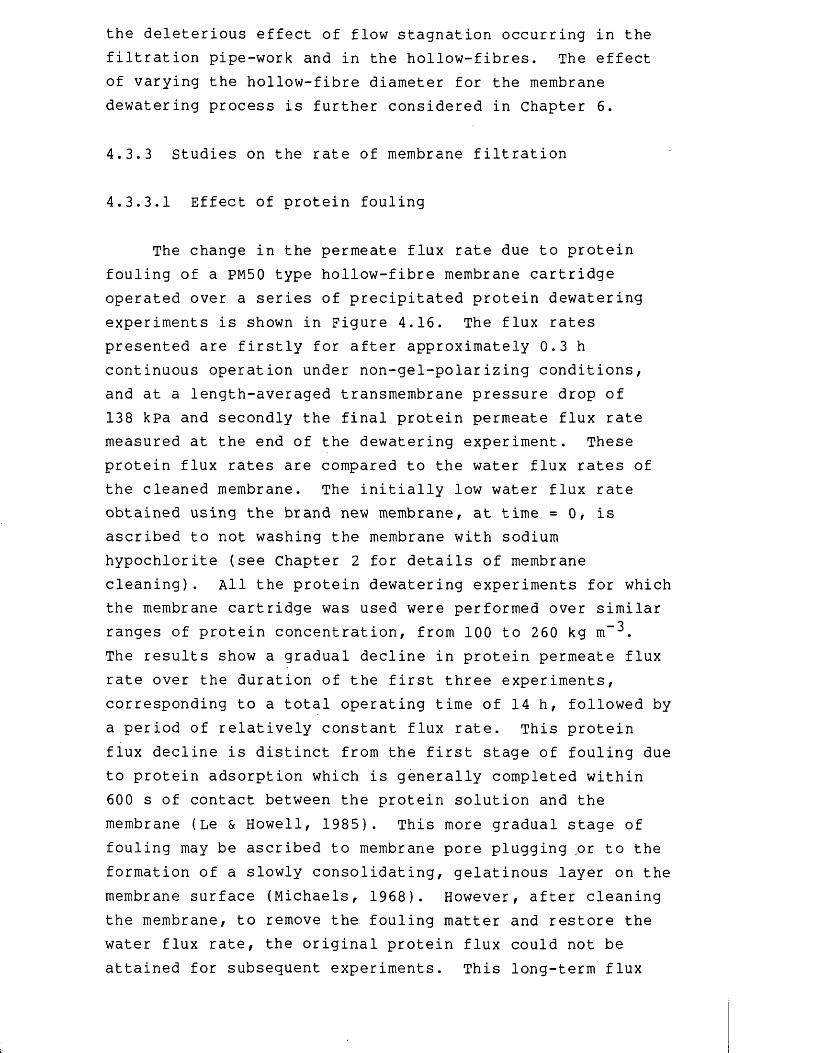
the deleterious effect of flow stagnation occurring in the filtration pipe-work and in the hollow-fibres. The effect of varying the hollow-fibre diameter for the membrane dewatering process is further considered in Chapter 6.
4.3.3 Studies on the rate of membrane filtration
4.3.3.1 Effect of protein fouling
The change in the permeate flux rate due to protein fouling of a PM50 type hollow-fibre membrane cartridge operated over a series of precipitated protein dewatering experiments is shown in Figure 4.16. The flux rates presented are firstly for after approximately 0.3 h continuous operation under non-gel-polarizing conditions, and at a length-averaged transmembrane pressure drop of 138 kpa and secondly the final protein permeate flux rate measured at the end of the dewatering experiment. These protein flux rates are compared to the water flux rates of the cleaned membrane. The initially low water flux rate obtained using the brand new membrane, at time = 0, is ascribed to not washing the membrane with sodium hypochlorite (see Chapter 2 for details of membrane cleaning). All the protein dewatering experiments for which the membrane cartridge was used were performed over similar ranges of protein concentration, from 100 to 260 kg m“ .The results show a gradual decline in protein permeate flux rate over the duration of the first three experiments, corresponding to a total operating time of 14 h, followed by a period of relatively constant flux rate. This protein flux decline is distinct from the first stage of fouling due to protein adsorption which is generally completed within 600 s of contact between the protein solution and the membrane (Le & Howell, 1985). This more gradual stage of fouling may be ascribed to membrane pore plugging or to the formation of a slowly consolidating, gelatinous layer on the membrane surface (Michaels, 1968). However, after cleaning the membrane, to remove the fouling matter and restore the water flux rate, the original protein flux could not be attained for subsequent experiments. This long-term flux

Permeate
flux
Water
flux (Ne BOO
o-oO - - -
0 10 20 30 40
Operating time, h
Figure 4.16 Effect of fouling on soya protein and water flux rate.
Operating temperature, 25 °C; length-averaged transmembrane pressure drop, 138 kPa. Other details given in text. o , protein flux rate; • , water flux rate, after cleaningmembrane.

decline finally levelled off after around 20 h operation, whereupon variations primarily resulted from changes in the feed material and operating conditions, such fouling behaviour may arise from a chemical change on the membrane surface rather than the formation of a fouling layer, which does not explain the maintenance of high water flux rates after cleaning the membrane. Another possible explanation is derived from the work of Ofsthun & Colton (1987) who observed blood cells deformed into the membrane surface pores even at low transmembrane pressure drops. Such pore blocking may physically damage the delicate membrane surface enabling subsequent pore blockages to occur more easily until the majority of the membrane area becomes scarred.
It is important to appreciate these various forms of fouling before assessing the effect of the operating parameters on the permeate flux rate. To determine the likely fouling mechanism would require further experimentation which is beyond the scope of this thesis.
4.3.3.2 Effect of flow-pressures during precipitated protein concentration
The relationship between the permeate flux rate and total retained protein concentration for a PM50 type hollow- fibre membrane is shown in Figure 4.17. The flux rate was measured at various concentrations for three different length-averaged transmembrane pressure drops, 69, 103 and 138 kpa. The transcartridge pressure drop was maintained constant at 41 kpa during each flux rate measurement. Similarly, for the flux rate measurements, the protein concentration of the retentate was maintained constant by continuously recycling the permeate to the holding tank. As observed previously in Section 4.3.1, the protein flux rate curves are comprised of two distinct regions of flux rate decline. The first region, region I, exhibited a gradual decrease in flux rate with increasing protein concentration
_ -5up to a retained protein concentration of 200 kg m . This was then followed by a second region, region II, of more rapid flux decline which continued until retentate flow could no longer be maintained through the hollow-fibres. It

iHIx:(NI6J
<D4J(0l-iXDrH4-404JCtJ06140C4
10
8
6
4
2
0100 150 200 250 300
Total protein concentration, kg m-3
Figure 4.17 Influence of the length-averaged transmembrane pressure drop on the permeate flux rate during concentration of precipitated protein suspensions.
Operating temperature, 25 °C; transcartridge pressure drop, 41.4 kpa; membrane type, PM50; hollow-fibre length,
20.315 m, inner diameter, 1.1 mm; membrane area, 0.70 m ; initial fraction of total protein soluble, 0.30. Length- averaged transmembrane pressure drop: o , 138 kPa;□ , 103 kpa; 0 r 69 kpa.
i

was mentioned earlier, in Section 4.3.3.1, that another region of flux decline exists due to protein adsorption to the membrane but since this process is completed within the first 600 s of operation it need not be considered here. Increasing the length-averaged transmembrane pressure drop in region I, whilst maintaining a constant transcartridge pressure drop, increased proportionally the magnitude of the permeate flux rate. Conversely, no variation in the flux rate was observed in region II when the same transmembrane pressure drop changes were made.
Figure 4.18 shows the effect on the permeate flux rate of varying the transcartridge pressure drop at a constant length-averaged transmembrane pressure drop. Increasing the transcartridge pressure drop at a constant length-averaged transmembrane pressure drop had no significant effect on the flux rate in region I but partially restored the magnitude of the flux in region II to that of region I. This dependence on the hydrodynamic conditions implies that region II corresponds to a 'gel-polarized' membrane whereas region I exhibits some of the typical properties of 'pre-gel polarization'. The properties of both polarization states are well documented (Blatt et al., 1970; Fane, 1986).
In region I the transmembrane pressure drop and the protein concentration were apparently too low to induce gel- polarization of the membrane. Similarly, if the velocity of the retentate in the hollow-fibres, or rather the shear rate at the membrane surface, was too small then gel-polarization would occur. This is shown in Figure 4.19, using the data presented in Figure 4.17 for a length-averaged transmembrane pressure drop of 138 kpa. Figure 4.19 also shows how the membrane shear rate varied as the retentate concentration increased, while operating at constant transcartridge and length-averaged transmembrane pressure drop. To maintain consistency and enable direct comparisons to be made with.; the rheological data obtained from rotational viscometry, the flux rate is described in terms of the membrane shear rate rather than the mean-average velocity of the retentate. The membrane shear rates for the data in Figure 4.19 were calculated by substituting viscosity data interpolated from Figure 4.11 into Equation 4.2. Although the transcartridge

CNIaij
<D-P(CX3r— I4-4<1)4-1toQ)ai-ia)p4
250 300200Total protein concentration, kg m-^
Figure 4.18 Influence of the transcartridge pressure drop on the permeate flux rate during concentration of precipitated soya protein suspensions.
Operating temperature, 25 °C; length-averaged transmembranepressure drop, 103 kpa; membrane type, PM50; hollow-fibrelength, 0.315 m, inner diameter, 1.52 mm; membrane area,2 . . .0.65 m ,• initial fraction of total protein soluble, 0.20. Transcartridge pressure drop: A , 138 kpa; o / 69 kPa;□ , 41 kPa; 0 , 34 kpa.

CMIe
0)4-JrouX3i—I
14-1
CD4->fO<D6u(D(U
Total protein concentration, kg m”^
250 241 232 219 188 170 145 12220
5
2
11-300 5000 8000500 1000 2000
Membrane shear rate, s-1
Figure 4.19 Influence of the membrane shear rate during concentration of precipitated soya protein suspensions.
Operating temperature, 25 °C; membrane type, PM50; hollow- fibre length, 0.315 m, inner diameter, 1.1 mm; membrane area, 0.70 m , initial fraction of total protein soluble, 0.30. Length-averaged transmembrane pressure drop,138 kpa, transcartridge pressure drop, 41 kPa.

pressure drop was maintained constant, the measured membrane shear rate decreased with retentate concentration. This follows from Equation 4.3 noting that the apparent viscosity is a function of total protein concentration, as discussed in Section 4.3.2.2. The dependence of the protein flux rate on the membrane shear rate, as with increasing retained protein concentration, consisted of two distinct regions of flux rate decline. At a length-averaged transmembrane pressure drop of 138 kPa the first region of flux decline in Figure 4.17 corresponds to membrane shear rates greater than 1500 s”-*- and the second region of flux rate decline corresponds to shear rates below 1500 s“ as shown in Figure 4.19. This figure can be misleading since it implies that for any protein concentration the highest flux rate is obtained by operating at the maximum permissible membrane shear rate. The permeate flux rate is a time-dependent parameter such that changes in protein concentration, or long-term flux rate decline, may be interpreted as membrane shear rate effects. In addition, it is difficult to determine accurately the membrane shear rate, Yw ', corresponding to the transition or intersection point at which the two regions of flux decline meet, without continuously monitoring the flux rate. Similarly, the rheological properties of the retentate at the transition point would have to be interpolated from a series of viscometry experiments performed at different protein concentrations. These problems of experimental analysis were overcome by using a different experimental approach as described in the following section.
4.3.3.3 Effect of flow-pressures at constant precipitated protein concentration
Compared to varying the flow-pressures during protein concentration, for analysing the flux rate behaviour at different membrane shear rates, a simpler and more convenient experimental approach is to maintain a constant retentate concentration, achieved by recycling the permeate, and vary the transcartridge pressure drop at a constant length-averaged transmembrane pressure drop. This is shown

by the solid curve in Figure 4.20. The data was determined during the same experiment as was used to determine the data in Figure 4.17. Although the data shown by the solid curve in Figure 4.20 was recorded at a total retained protein concentration of 260 kg m” , which lies within the gel- polarized region in Figure 4.17, there is good agreement between the two methods, where the data from Figure 4.19 is represented by the broken curve. The measured permeate flux rate of the region dependent on the length-averaged transmembrane pressure drop, region I, was invariant of the membrane shear rate. Conversely, in the gel-polarized region the flux rate exhibited a similar dependency on the shear rate. The good correlation between the two sets of results in Figure 4.20 indicates that the technique of varying the transcartridge pressure drop at a constant protein concentration and length-averaged transmembrane pressure drop could be used to characterize the entire membrane permeate flux rate - protein concentration performance by examining just the precipitated protein feed sample. This would overcome the necessity of concentrating the sample and, if the relationship between the apparent viscosity and the protein concentration were known, then the operating conditions for the onset of gel-polarization could be determined for any membrane geometry.
Comparing the two sets of data in Figure 4.20 suggests that over the concentration range studied the total precipitated and soluble protein content had little effect on flux rate in either region of flux rate decline since the difference in region I may be partially ascribed to some form of long-term flux decline. The dependence of flux rate on membrane shear rate at different protein concentrations is shown in Figures 4.21 and 4.22. The data in Figure 4.21 was observed using a comparatively unused, approximately 2 h of processing precipitated protein, PM50 type membrane whereas the data in Figure 4.22 refers to the same membrane subjected to 15 h further use and several washing procedures (see Figure 4.16). The permeate flux rate profiles have been plotted in two different forms to demonstrate that the flux rate may be correlated either semi-logarithmically or logarithmically with the membrane shear rate. Permeate flux

CNIE
04J05UXDi~I 4-10-U00EV-l0cu
/ -
-O
2
11-250 5000 80002000500 1000
Membrane shear rate, s"^
Figure 4.20 Influence of the membrane shear rate on the permeate flux rate at a constant precipitated soya protein concentration.
Operating temperature, 25 °C; membrane type, PM50; hollow-fibre length, 0.315 m,- inner diameter, 1.1 mm; membrane
9 — 3area, 0.70 m ,• total protein concentration, 260 kg m ,•fraction of total protein soluble, 0.27. Length-averagedtransmembrane pressure drop, 138 kPa. □ , data obtained byvarying the transcartridge pressure drop at constantprotein concentration (membrane shear rate evaluated usingrheological parameters obtained from the flow curve, Figure4.11: n ', 0.72, k ' , 0.61); O , data from Figure 4.19.
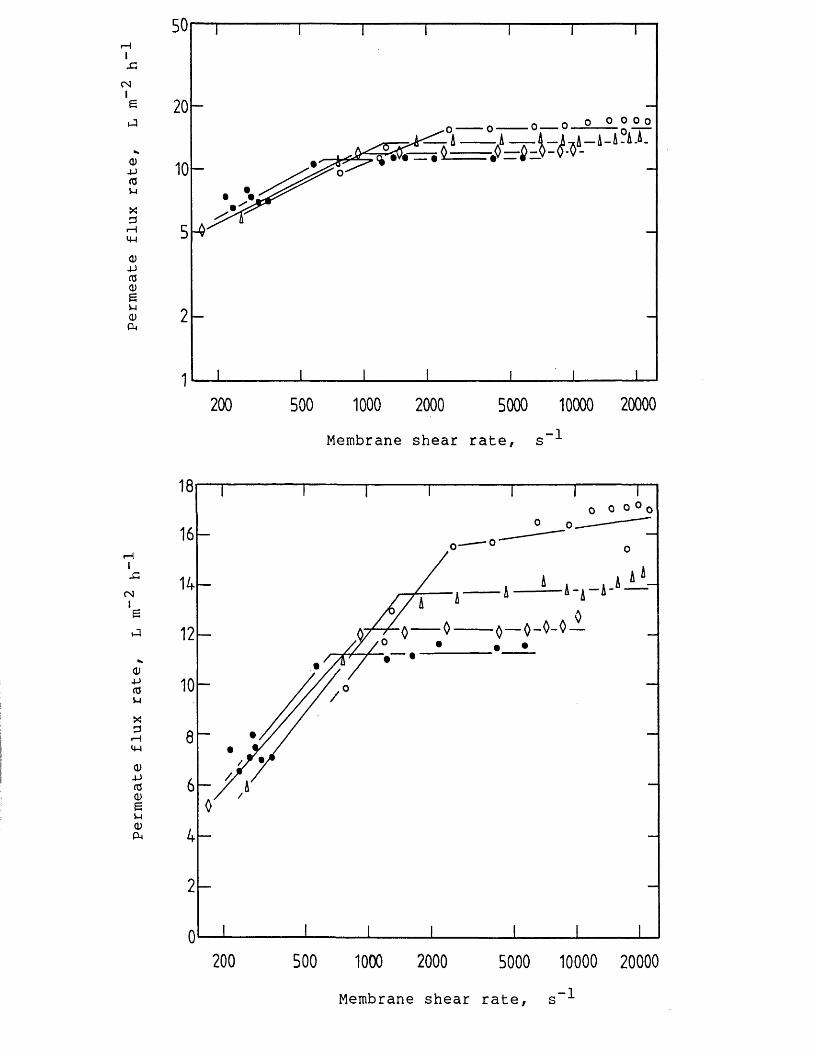
permeate
flux
rate,
L m"
2 h_i
Permeate
flux
rate
50
20o o
10
5
2
5000 10000 20000200 1000 2000
Membrane shear rate, s”^
200 500 1000 2000 5000 10000 20000
Membrane shear rate, s

Figure 4.21 Dependence of the permeate flux rate on the membrane shear rate at different precipitated soya protein concentrations.
Operating temperature, 25 °C; membrane type, PM50; hollow- fibre length, 0.315 m, inner diameter, 1.1 mm; membrane area, 0.70 m . Length-averaged transmembrane pressure drop, 138 kPa. Membrane shear rate evaluated using rheological parameters determined from the corresponding flow curves, and the transcartridge pressure drop, corrected for head-loss pressure but not for end-losspressure Total protein concent rat ion, fractio n of totalprotein soluble, dry wei ght: • , 91 kg m~3, 0.29,0.130 kg kg-1; 0 t 118 kg m”3, 0.27, 0. 156 kg kg-1; A ,169 kg m~3, 0.25, 0.206 kg kg"1; o f 202 kg m" 3, 0.24,0.235 kg kg 1.
ii

rates measured at a constant membrane shear rate under gel- polarized conditions indicated a steady state flux rate could be achieved after approximately 300 s. This explains the data scatter observed in Figure 4.21 where some flux rates were measured only 120 s after changing the transcartridge pressure drop. Davis & Birdsell (1987) observed experimentally that several minutes were required for a concentrated cake layer to form on the membrane surface and attain a steady state thickness, ignoring longterm flux rate decline due to protein fouling, all the previous and subsequent results presented refer to steady state operation. As mentioned earlier the flux rate decline in region I of Figure 4.21 largely resulted from a long-term fouling phenomenon) rather than increasing retained protein concentration. This argument is supported by the data in Figure 4.22 where the flux rate in region I actually increased with retained protein concentration initially, and then remained constant at higher retained concentrations.An explanation for this increase may be ascribed to size variations of the precipitated protein aggregates since the mean precipitated protein aggregate diameter increased from4.5 pm (s.d. = 2.5 pm) up to 6.4 pm (s.d. = 2.6 pm) during the first 1.5 h operation, and thereafter varied according to the operating conditions employed. Devereux et al. (1986a) reported that higher permeate flux rates could be obtained with soya protein suspensions containing larger precipitate aggregates.
For the dilute concentrations examined in Figure 4.22 the flux rate in region I decreased slightly at the highest shear rates employed. This may have arisen due to not accounting for the end-loss pressure which was noted in Section 4.3.2.2 to increase with the flow rate of the retentate in the hollow-fibres, and hence reduce the effective transmembrane pressure drop along the length of the hollow-fibres .
In the region independent of the length-averaged transmembrane pressure drop, region II, the flux rate curves tended to converge, suggesting that a dependence on the total protein concentration existed over the protein concentration range examined. Generally, for macrosolute
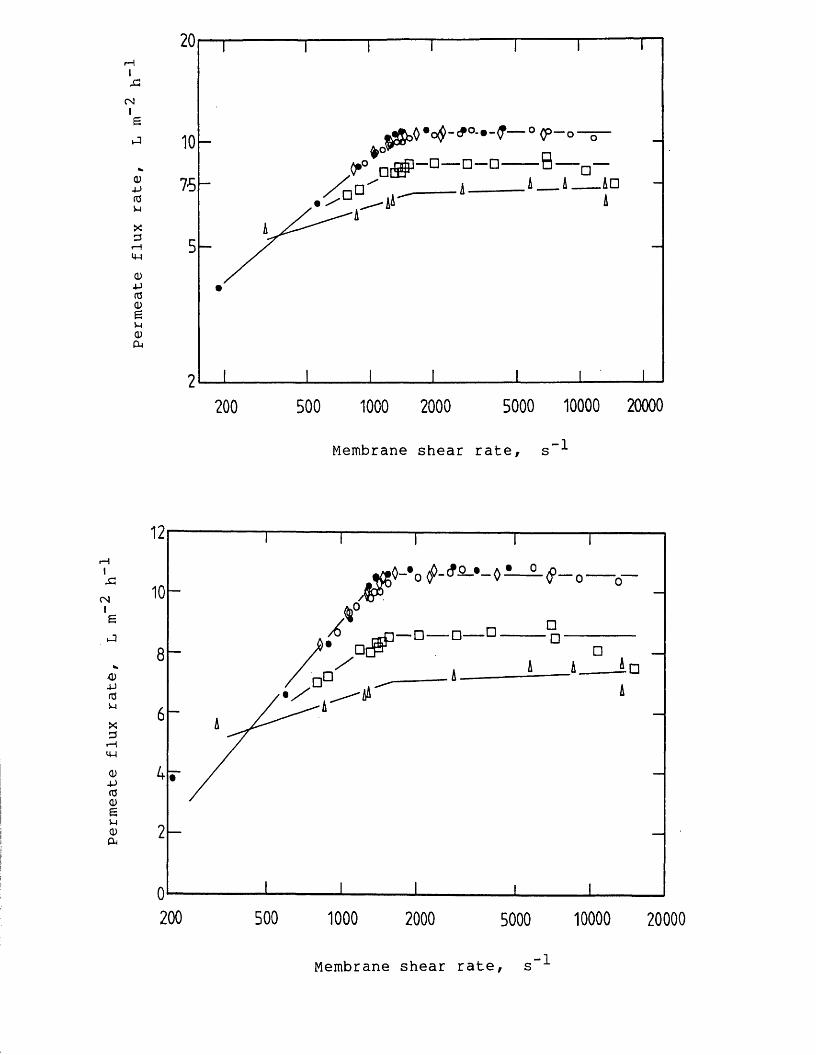
(NI6
CD■Pto4-1Xzs
r— f
14-1CD-P(CCDej-i0)Pn
°(p-(]-□— □ — □ ---- B — A______ A — A7*5
5
25000 10000 200001000 2000500200
Membrane shear rate, s~^
CNi6
<D■PfO4-1X3rHM-lCD-P03CDe4-1CDCU
12
10
8
6
4
2
500 1000 10000 200002000 5000
Membrane shear rate, s-1
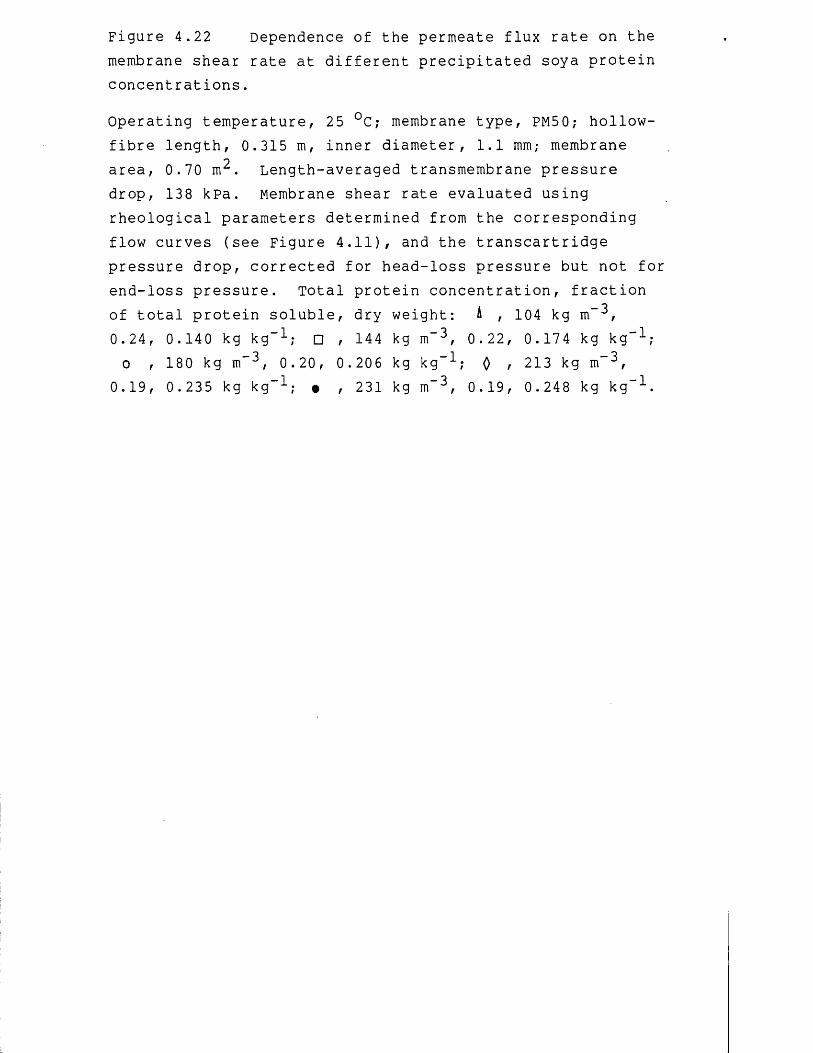
Figure 4.22 Dependence of the permeate flux rate on the membrane shear rate at different precipitated soya protein concentrations.
Operating temperature, 25 °C; membrane type, PM50; hollow- fibre length, 0.315 m, inner diameter, 1.1 mm; membrane area, 0.70 m3 . Length-averaged transmembrane pressure drop, 138 kPa. Membrane shear rate evaluated using rheological parameters determined from the corresponding flow curves (see Figure 4.11), and the transcartridge pressure drop, corrected for head-loss pressure but not for end-loss pressure. Total protein concentration, fraction of total protein soluble, dry weight: A , 104 kg m”3,0.24, 0.140 kg kg-1; □ , 144 kg m”3, 0.22, 0.174 kg kg"1;o , 180 kg m"3, 0.20, 0.206 kg kg”1; 0 r 213 kg m~3,
0.19, 0.235 kg kg”1; • , 231 kg m”3, 0.19, 0.248 kg kg"1.
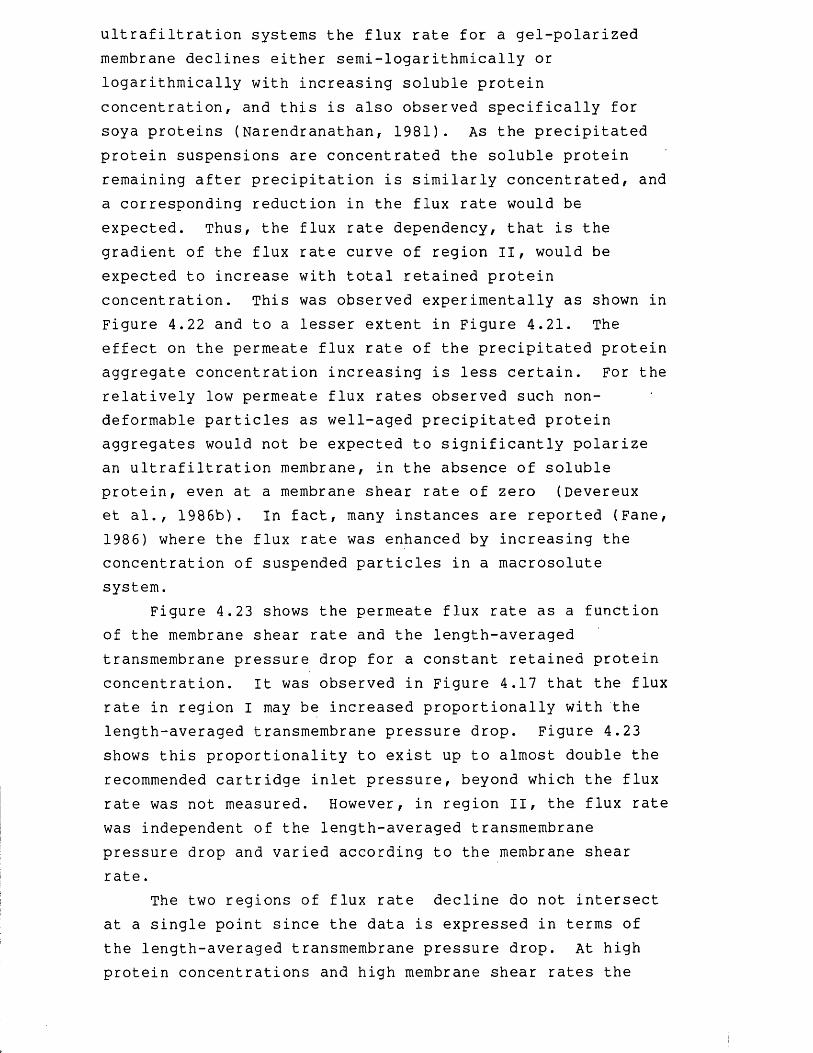
ultrafiltration systems the flux rate for a gel-polarized membrane declines either semi-logarithmically or logarithmically with increasing soluble protein concentration, and this is also observed specifically for soya proteins (Narendranathan, 1981). As the precipitated protein suspensions are concentrated the soluble protein remaining after precipitation is similarly concentrated, and a corresponding reduction in the flux rate would be expected. Thus, the flux rate dependency, that is the gradient of the flux rate curve of region II, would be expected to increase with total retained protein concentration. This was observed experimentally as shown in Figure 4.22 and to a lesser extent in Figure 4.21. The effect on the permeate flux rate of the precipitated protein aggregate concentration increasing is less certain. For the relatively low permeate flux rates observed such non- deformable particles as well-aged precipitated protein aggregates would not be expected to significantly polarize an ultrafiltration membrane, in the absence of soluble protein, even at a membrane shear rate of zero (Devereux et al., 1986b). In fact, many instances are reported (Fane, 1986) where the flux rate was enhanced by increasing the concentration of suspended particles in a macrosolute system.
Figure 4.23 shows the permeate flux rate as a function of the membrane shear rate and the length-averaged transmembrane pressure drop for a constant retained protein concentration. It was observed in Figure 4.17 that the flux rate in region I may be increased proportionally with the length-averaged transmembrane pressure drop. Figure 4.23 shows this proportionality to exist up to almost double the recommended cartridge inlet pressure, beyond which the flux rate was not measured. However, in region II, the flux rate was independent of the length-averaged transmembrane pressure drop and varied according to the membrane shear rate.
The two regions of flux rate decline do not intersect at a single point since the data is expressed in terms of the length-averaged transmembrane pressure drop. At high protein concentrations and high membrane shear rates the
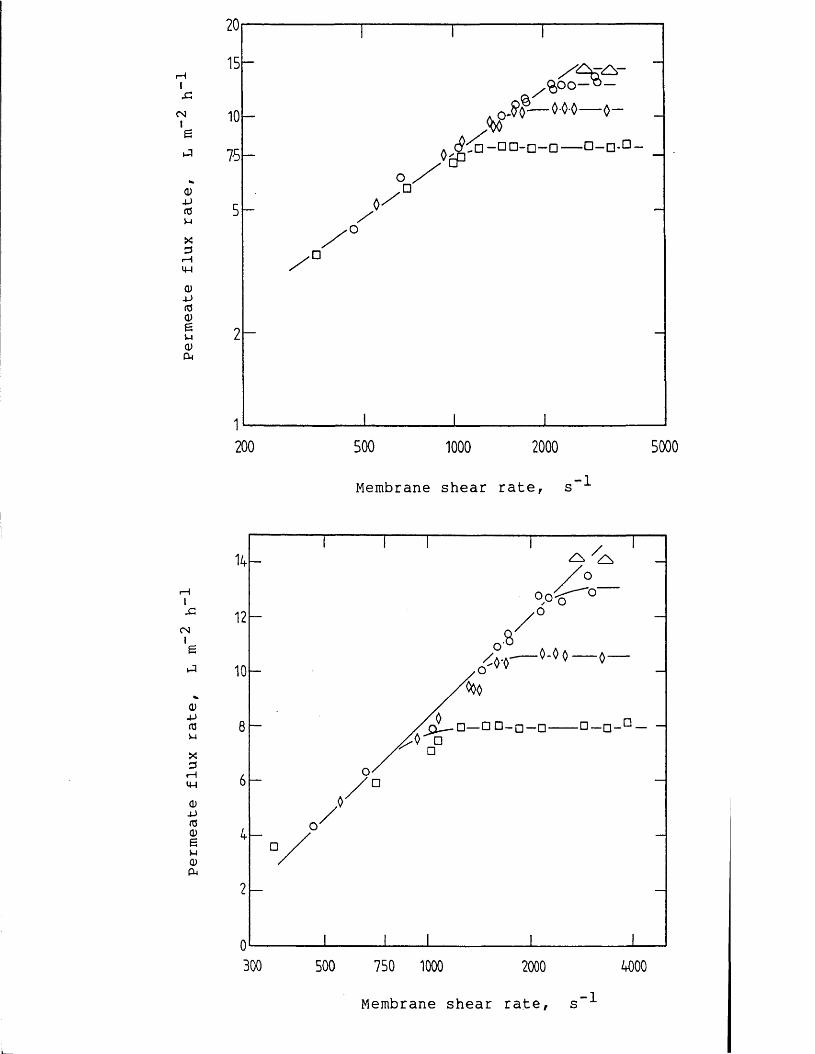
Permeate
flux
rate,
L m
h Permeate
flux
rate
200 500 1000 2000 5000
Membrane shear rate, s“^
14
o.o'12
>-oo— o -10
8
6
2
0300 500 750 1000 2000 4000
Membrane shear rate, s”^
Figure 4.23 Permeate flux rate at constant concentration of precipitated soya protein suspensions: effect of membrane shear rate and length-averaged transmembrane pressure drop.
Figure 4.23a and 4.23b refer respectively to the permeate flux rate plotted on a logarithmic and linear scale. Operating temperature, 25 °C; membrane type, PM50; hollow-fibre length, 0.315 m, inner diameter, 1.1 mm; membrane
9 — 3area, 0.70 m . Total protein concentration, 236 kg m ;fraction of total protein soluble, 0.25. Membrane shearrate: rheological parameters, determined with a coni-cylindrical viscometer, n', 0.79, k', 0.22; evaluated usingtranscartridge pressure drop, corrected for head-loss butnot for end-loss pressure. Length-averaged transmembranepressure drop: □ , 103 kPa; Q , 138 kPa; o , 172 kPa;^ , 193 kPa.

transcartridge pressure drop was large compared to the length-averaged transmembrane pressure drop, and hence the local transmembrane pressure drop at the cartridge inlet was considerably higher. Thus, as the shear rate decreased at a constant length-averaged transmembrane pressure drop a gradual decline in the flux rate was observed and continued ' until the cartridge outlet pressure approached the length- averaged transmembrane pressure drop and the entire membrane became gel-polarized.
The data in Figure 4.23 can be replotted to express the flux rate as a function of the length-averaged transmembrane pressure drop. This similar, but more familiar, representation, shown in Figure 4.24, clearly displays the asymptotic behaviour of the flux rate with increasing length- averaged transmembrane pressure drop, indicative of a gel- polarized membrane (Blatt et al., 1970). The solid line represents the region dependent on the length-averaged transmembrane pressure drop, region I, and this is compared to data determined by Devereux & Hoare (1986) for precipitated soya protein suspensions using the same membrane type and the hollow-fibre geometry. The different dependency of the flux rate on the length-averaged transmembrane pressure drop may be attributed to variations in the membrane permeability, the extent of protein fouling and the large disparity in protein concentrations studied. Devereux & Hoare reported no polarization effects possibly because the range of membrane shear rates and protein concentrations examined were not conducive to promoting gel- polarization of the membrane.
Figure 4.25 shows the effect on the permeate flux rate of changing the hollow-fibre diameter for a fixed cartridge length and membrane type. The cartridges were examined using the same retentate material by interchanging the cartridges during the same experiment. Although the two membranes examined in this figure were of PM50 type, the larger diameter hollow-fibres exhibited a higher flux rate in the constant flux region. This may be ascribed to the difference in the history of use of the membranes, the smaller diameter hollow-fibres having been employed for processing precipitated protein suspensions for

CNI6
0)-UfOuXDi-H
<4-1
0)4-405<UeO
14
12
10
8
6
4
2
050 1000 150 200
Length-averaged transmembrane pressure drop, N m”2
Figure 4.24 Permeate flux rate at constant concentration of precipitated soya protein suspensions: effect of membrane shear rate and length-averaged transmembrane pressure drop.
Operating temperature, 25 °C; membrane type, PM50; hollow-fibreolength, 0.315 m, inner diameter, 1.1 mm; membrane area, 0.70 m .
_ oTotal protein concentration, 236 kg m fraction of total protein soluble, 0.25. Membrane shear rate: rheological parameters, determined with a coni-cylindrical viscometer, n', 0.79, k',0.22 N sn m"2; evaluated using transcartridge pressure drop, corrected for head-loss but not for end-loss pressure. Membrane shear rate: <\7 , 500 s_1; 0 , 1000 s"1; ^ , 1500 s"1; O , 2000 s"1;□ , 3000 s”-*-. — — — , data obtained by Devereux & Hoare
(1986); same membrane type and hollow-fibre dimensions; membrane shear rate, 1380 to 6580 s”\* operating temperature, 50 °C? total protein concentration, 40 kg m“2; fraction of total protein soluble, 0.12.

□□□
250 500 1000 2000
Membrane shear rate, s“^
5000
Figure 4.25 Permeate flux rate at constant precipitated protein concentration: effect of changing hollow-fibre diameter.
Operating temperature, 25 °C; membrane type, PM50; hollow- fibre length, 0.315 m. Total protein concentration,236 kg m-3; fraction of total protein soluble, 0.25. Length-averaged transmembrane pressure drop, 138 kPa. Membrane shear rate evaluated using rheological parameters determined from the corresponding flow curves, and the transcartridge pressure drop, corrected for head-loss pressure but not for end-loss pressure. Hollow-fibre inner diameter and membrane area: o , 1.9 mm, 0.47 m ; □ ,
1.1 mm, 0.70 m3.
approximately 3 times longer than for the larger diameter fibres. From Figure 4.23, and all factors being equal, such as membrane pore size and membrane porosity, the intersection point, Yw ', would be expected to occur at a higher membrane shear rate for the larger diameter hollow- fibres since the permeate flux rate is higher. Due to scatter in the results in Figure 4.25 it is difficult to assess with a degree of certainty whether there was any effect on the permeate flux rate - shear rate relationship with changing the hollow-fibre diameter. This perhaps illustrates the problems of comparing different membranes, in spite of using the same feed material, in order to examine the effects on the filtration rate.
4.3.3.4 permeate flux rate prediction
Figure 4.26 shows the experimental data from Figure 4.23a for the permeate flux rate together with the predictions determined for several of the models considered in Section 4.2.1. Data is only included for operating at a length-averaged transmembrane pressure drop of 172 kPa to aid clarity.
The gel-polarization model, as defined by Equation 4.24, using a particle Brownian motion diffusion coefficient based on the mean value of the diameter of the precipitated protein aggregates, underpredicts the flux rate by several orders of magnitude, and the results are not shown in Figure 4.26. The model is improved by using a diffusion coefficient based upon the soluble protein concentration in the retentate. A coefficient of3.6 xlO“^ m s”-*- was assumed, evaluated using a reported value (Narendranathan, 1981) of 3.5 xlO~^ m s“ for soyaprotein total water extract, TWE, (total protein concentration of 40 kg m-3) and corrected for viscosity using the Stokes-Einstein equation and viscosity data fromBell (1982). Devereux et al. (1986b) noted that thesupernatant is composed of smaller molecular weight macromolecules than the TWE. Therefore, the diffusion coefficient will be underestimated and the predicted flux rate even greater than the actual flux. However, Probstein

10
5
2500 1000 2000 5000 10000
Membrane shear rate, s“^
Figure 4.26 Permeate flux rate as a function of the membrane shear rate for several membrane filtration models.
Data of Figure 4.23 for a length-averaged transmembrane pressure drop of 172 kPa compared to prediction of various models: (A) gel-polarization model, using diffusion coefficient based on soluble protein content; (B) shear- induced hydrodynamic diffusion model, using data of Eckstein et al. (1977); (C) hydraulic resistance model (Devereux & Hoare, 1986).

et al. (1978) suggested that diffusivities evaluated at the gel-concentrat ion should be used rather than diffusivities at the concentration of the bulk of the retentate. This would tend to cancel the error of using a diffusion coefficient evaluated for the TWE. The generalized axial Reynolds number for the experimental data presented in Figure 4.26 did not exceed a value of 20, and hence the channel length, as defined by Equation 4.22, required to attain a fully developed laminar velocity profile is small compared to the length of the hollow-fibres. Conversely, the model also requires that the length of the concentration profile entrance region, as defined by Equation 4.23, is large compared to the length of the hollow-fibres, and this is also observed for the experimental conditions employed.
Notwithstanding the considerable uncertainty of estimating a diffusion coefficient, the gel-polarization model predicts a constant membrane shear rate dependence which remains unaffected by changes in the protein concentration of the bulk of the retentate. It would expected that the polarization model is not applicable to protein systems which consist of a large proportion of precipitated protein, and this has been observed more generally for many colloidal laminar flow systems (Chiang & Cheryan, 1987; Fane, 1986). The gel-polarization model predicts that increasing the soluble protein content will decrease the flux rate but this counteracts the simultaneously occurring effect of the solids concentration increasing, which was shown by Fane et al. (1982) to often enhance the permeate flux rate for non-deformable solids.
For particulate cross-flow microfiltration systems the model developed by zydney & Colton, defined by Equation 4.26, also predicts the permeate flux rate to better than one order of magnitude accuracy. A value of6.0 pm was assumed for the particle diameter, although separate experiments showed that the mean value of the diameter of the precipitated protein aggregates may vary between 4.5 and 7.0 pm depending on the residence time and membrane filtration operating conditions employed. The volume fraction of particles at the wall and in the bulk suspension were evaluated using Equation 4.27, with relative
viscosity data evaluated from the torque - shear rate data obtained using a coni-cylindrical viscometer. The viscosity of the soluble soya protein, ps (N s m-3) , was evaluated using the following equation derived from the data of Bell ( 1982) :
ps = 1.2 xlO-5 Cs + 1 x 10“3 (4.40)
_ owhere Cs is the concentration of soluble protein in kg m . The relative viscosity is a function of the shear rate and varies from 21 to 36 for the shear rate range of 3000 to 400 s--*-. For example, at a shear rate of 1500 s“3 the relative viscosity was estimated to be 26, and hence from Equation 4.27 the volume fraction of particles in the bulk of the retentate and at the membrane surface were respectively calculated to be 0.54 and 0.62.
The discrepency between the experimental results and the predicted results for the zydney & Colton model may derive from errors in estimating the volume fraction of particles. Using Equation 4.28 instead of Equation 4.27 to relate the relative viscosity to the volume fraction of particles only slightly improved the correlation between the predicted and experimental data. However, neither of these equations employed to determine the volume fraction accounted for non-sphericity of the particles, a particle size distribution, or surface charges on the particles. All these factors are exhibited by precipitated protein aggregates to some degree (Bell, 1982). Moreover, despite the uncertainty in estimating the volume fraction of particles, the method of evaluating the particle diffusivity for the Zydney & Colton model was shown by Davis and Leighton (1987) to underestimate considerably the actual diffusivity for rigid particles, and they suggested that the model itself was inapplicable for the range of high particle concentrations in the bulk of the retentate examined here. Similarly, the shear-induced particle diffusion hypothesis of Davis & Leighton (1987), which was discussed in Section 4.2.1.1, is not applicable since the model requires that a constant shear stress acts on the cake layer, and thereby the thickness of the flowing portion of the cake
layer should be small compared to the effective hollow-fibre diameter. However, this condition is not met for the range of protein concentrations and operating conditions examined here, and the stagnant cake layer, which serves to reduce the effective diameter of the hollow-fibre, is predicted to be greater than the actual hollow-fibre diameter.
In general, for relatively dilute feed suspensions, these shear-induced particle diffusion models provide superior correlations to experimental data compared to the 'tubular-pinch' models. However, they are not applicable to highly concentrated suspensions such as those examined in this study (Davis & Leighton, 1987). Unlike the other membrane filtration models, the model proposed by Davis & Leighton may be used to predict the onset of gel- polar ization , or rather the critical membrane shear rate, Yw '. It was noted in Section 4.2.1.1 that if the particle flux in the flowing cake layer exceeds a critical value then a stagnant layer of particles forms next to the membrane surface to reduce the flux rate, akin to gel-polarization. The critical particle flux may be decreased by reducing the permeate flux rate or increasing the membrane shear rate,and this was observed experimentally as shown inFigure 4.24. | This particle flux may also bedecreased by lowering the particle concentration in the bulkof the suspension, the suspension viscosity, the length and diameter of the hollow-fibres, or by increasing the particle diameter. The relative effect on the| particle flux of changing these parameters may be determined using Equation 4.29. To assess accurately the individual effect of these parameters on the onset of gel-polarization is not possible with the experimental data available due to their complex interaction during protein concentration and time- dependent effects, such as break-up of the precipitated protein aggregates, particle aggregation and protein fouling.
These particle diffusion models make no explicit correction for the presence of macrosolutes, which appear to be the major polarizing species in the system under consideration here. The scour-model can be used to correlate the log-log relationship between flux rate and the
membrane shear rate but the evidence for a logarithmic dependence on protein concentration is limited since the typical range of protein concentrations studied, as indicated in Figure 4.22, was too small.
The permeate flux rate for the pre-gel polarized region may be predicted using the hydraulic resistance model proposed by Devereux & Hoare (1986), which is given by Equation 4.35, and the results are shown in Figure 4.26. A mean value of 6.0 pm was assumed for the diameter of the precipitated protein aggregates, although typical size variations may reduce the observed permeate flux rate to about 80% of the values presented in Figure 4.26. Aggregate size variations only partly explain the difference between prediction and experimental observation since the major discrepency arises from membrane fouling effects. This system specific model may be employed to predict accurately flux rates for new, clean membranes but may over-estimate the actual flux rate by up to a factor of 2 for a used membrane, depending on the degree of protein fouling.
4.4 Conclusions
4.4.1 Studies on the fluid mechanics
The friction factor for the flow of water in hollow- fibre ultrafiltration membranes is higher than for flow in non-permeating reverse osmosis membranes and increases with the permeate flux rate and hollow-fibre diameter.Similarly, the onset of turbulent flow appears to be shifted to higher axial Reynolds number as the hollow-fibre diameter increases. Dilute precipitated protein suspensions (total protein concentration < 80 kg m”3) are also expected to behave similarly.
The contribution of end-loss pressure and permeation effects during protein concentration becomes less significant, and the magnitude of the pressure drop over the membrane cartridge is determined by pressure losses due to membrane friction. Thus, the friction factor is accurately correlated to a generalized axial Reynolds number, evaluated using suitable viscosity data.
The high shear rheology data obtained using suitable viscometric geometries provides a good description of the flow characteristics of precipitated protein suspensions in hollow-fibre membrane cartridges. The behaviour of protein concentrates during flow through the hoilow-fibres is Newtonian at dilute concentrations (total protein concentration < 100 kg m“3) and becomes increasingly pseudoplastic at higher concentrations. At the highest concentrations the presence of a large yield stress was indicated which has important implications for maintenance of high recirculation flows.
4.4.2 Studies on the rate of membrane filtration
The membrane filtration of a precipitated protein suspension may proceed by one of two mechanisms depending upon the degree of membrane polarization. Over the protein concentration range studied the extent of polarization is controlled by the membrane shear rate and the permeate flux rate where increasing the shear rate or decreasing the flux rate minimizes membrane polarization. A critical operating point exists whereby the polarization mechanism alternates between the pre-gel- and the gel-polarized states. In the pre-gel polarized state the flux rate depends on the applied pressure driving force across the membrane wall whereas in the gel-polarized state the flux is invariant of this pressure driving force and depends on the shear rate at the membrane surface. The magnitude of the steady state flux rate may also be affected by the protein concentration, precipitated protein aggregate size and the membrane characteristics, which include the extent of protein fouling, the membrane type and the hollow-fibre dimensions. Protein fouling of the PM50 type membrane reduced the flux rate to about half the original value during the first 20 h of protein processing after which the steady state flux rate remained relatively constant.
There is a significant discrepency between the permeate flux rate prediction and the experimental data for all the membrane filtration models considered. The application of the gel-polarization model is complicated by the presence of
precipitated protein aggregates which interfere with the diffusion of macromolecules from the membrane surface. Similarly, the shear-induced particle diffusion models are grossly inaccurate for the high concentrations of particles in the retentate studied, and do not account for the observed macrosolute polarization of the membrane. The system specific scour-model and resistance model (Equation 4.35) can respectively correlate the gel- and pregel-polarized states and, evaluated simultaneously, can predict the onset of gel-polarization.
4.5 Recommendations for further work
The relationship between the operating conditions necessary for gel-polarization to occur and the soluble protein concentration and precipitated protein aggregate size should be investigated to establish the optimum precipitation reactor design and operating conditions. Of particular interest would be on-line particle size analysis during membrane filtration to determine the operating criteria and equipment design required to maintain large precipitate aggregates during recirculation.
The application of the shear-induced particle diffusion model should be assessed at lower protein concentrations than were examined in this study, and then the model suitably modified to predict permeate flux rates at higher protein concentrations.

5 Vacuum Drying of Enzymes and Dewatered PrecipitatedProtein Suspensions
5.1 Introduction
To maintain continuity with the dewatering experiments this chapter concerns the vacuum drying of precipitated soya protein concentrates. These protein concentrates used as the feed material for the drying experiments represent the typical maximum dewatered protein concentrations that may be achieved using membrane filtration, with short length - large diameter hollow-fibre membrane cartridges. The vacuum drying of the enzyme glucose oxidase is also studied. The glucose oxidase preparation was supplied as a postfermentation product which had been only subjected to primary purification procedures, such as fractional precipitation. This ensured that the enzyme was representative of a typical purification scheme and had not been previously dried, which would otherwise tend to invalidate the results of subsequent drying experiments.Only small quantities of glucose oxidase were dried, by mixing it together with dewatered soya protein concentrate, since the scale of the drying experiments required the use of relatively large quantities of material, which were not available for the expensive enzyme preparation. In addition, it was possible to monitor the extent of product damage occurring during drying by following the change in enzyme activity, which could quickly and reproducibly be measured after resuspending the dried or partially dried product in a suitable buffer. It was not possible to combine glucose oxidase with precipitated soya protein prepared from a total water extract due to the presence of contaminating carbohydrates interfering with the enzyme assay procedure. Therefore, precipitated soya protein prepared from isolated soya protein powder was used for the drying experiments. The experimental details of the preparation of the dewatered precipitated protein suspensions have been described in chapter 2.
Although a pilot-scale continuous band vacuum drier was employed, the drying experiments used to obtain the results

presented here were conducted in a batch-wise fashion rather than continuously feeding the protein concentrates to the drier. Under continuous operating conditions the protein concentrates were pumped into the vacuum chamber of the drier via a series of capillary tubes. The high water content of the dewatered protein concentrates necessitated a long residence time for drying, and hence very low feed flow rates through the capillary tubes were required.Preliminary drying experiments demonstrated that it was not possible to feed continuously the protein concentrates in a controlled fashion at such low feed flow rates. Ideally, from a processing point of view, material extruded from the capillary tubes and on to the moving conveyor band should form a continuous slab, or bed, of material of uniform depth. To obtain lower flow rates with a more precise flow control smaller diameter capillary tubes were employed. However, the smaller diameter capillaries became blocked more frequently due to partial drying of the material in the tube. Another experimental problem was encountered with regards to sampling material for analysis. The dried and partially dried material on the heated conveyor band could not be sampled quickly enough to prevent a significant amount of further drying and product damage occurring. Product damage during sampling was exacerbated by having to release the vacuum, to gain access to the drying chamber, whereupon the product temperature quickly approached the heating temperature, which was usually considerably greater than the product drying temperature under vacuum.Typically, product damage occurring during sampling was estimated to account for up to 50 % of the total enzyme activity loss at the highest heating temperatures studied. Similarly, due to the problem of using the capillary tubes at low feed flow rates, the small variations in the depth of material extruded on to the moving band, which were of the order of + 1.0 mm compared to a total depth of product of4.0 mm, produced spurious and unreproducible results.
These experimental problems prompted the development of a batch-wise feeding system. The dewatered protein concentrate was layered into specially constructed trays which were placed in the drying chamber and moved across the
heated plates, in a similar fashion to the product on the conveyor band. This method, described in Chapter 2, enabled accurate adjustment of the depth of material to be dried and, upon releasing the vacuum, the tray containing the sample to be analysed could be quickly removed from the heated plates with a minimum of further drying or product damage occurring. Thus, the vacuum drying results presented here refer to the case where material is fed batch-wise rather than continuously extruded on to a moving conveyor band. In all other respects, such as the drying material moving over heated plates, steady state heating temperatures and constant operating pressure, the batch-wise experimental method is similar to industrial-scale continuous band vacuum drying, and the results presented here should be directly applicable for scale-up to such operations.
The results of the vacuum drying experiments are presented in Section 5.3. To assist in the analysis of the drying results a short section on the theory of vacuum contact drying is presented in the following section.
5.2 vacuum contact drying of a continuous bed
The vacuum drying of dewatered protein concentrates dried in the sample tray may be described in terms of the vacuum contact drying of a continuous slab, or bed, of material. The theoretical and physical conceptions pertaining to vacuum contact drying have already been discussed in the Introduction, Section 1.4, and this section seeks only to derive the equations used to describe the drying process.
The term 'contact drying' refers to the case where a material is dried by supplying heat conducted from a suitable heating source in contact with the product. For contact drying under vacuum the evaporation of moisture occurs almost entirely at the heated surface, until a critical point is reached where the rate of evaporation just equals the rate of moisture flow to the evaporating front, where the majority of evaporation takes place. This period of drying is known as the constant-rate period. During the constant-rate period the temperature of the solids

approaches the saturated vapour temperature, which is in turn controlled by the magnitude of the reduced pressure applied to the drying system. Drying beyond the critical point causes the evaporating front to recede from the heated surface towards the exposed surface, the furthest point from the heated surface, leaving behind a dried layer of solids. -This drying period is known as the falling-rate period. Schematic representations of the physical conditions prevailing during these two drying periods are shown in Figure 5.1.
Assuming the drying process to be heat transfer controlled, the drying time, t^, may be conveniently determined by considering the constant-rate and falling-rate periods separately. During the constant-rate period the heat flux, qc , conducted from the heated plate to the heated tray surface, or evaporating front, can be expressed as:
where U is the overall heat transfer coefficient from the heated plate to the evaporating front and Tp^ and Tf are respectively the temperatures at the surface of the heated plate and at the evaporating front. The mass flux, Nc , of moisture to the evaporating front is given by:
where Wj_ is the initial moisture content (kg water per kg dry solid), Q>s is the bulk density of the dry solid, isthe depth of the bed, and w is the fraction of originalmoisture remaining at time t.
For steady state operation:
qc = U (Tpl - Tf) (5.1)
Nc (5.2)
qc Nc (5.3)
where AHV is the latent heat of vaporization, which varies according to the absolute pressure, increasing with ' decreasing pressure. Equation 5.3 assumes that there is no

A: constant-rate drying period
Exposed surface
Wet solid
Evaporating \/ front \
Heated plate
Temperature of product at heated surface, Tf
Temperature of
B: falling-rate drying period
Exposed surfaceV
Wet solid
Evaporating front
Heated plate
Temperature of product at evaporation front, Tf
Temperature of product at heated surface, Tf
Temperature of heated plate, Tpl
Figure 5.1 Schematic representation of the physical conditions existing during vacuum contact drying.
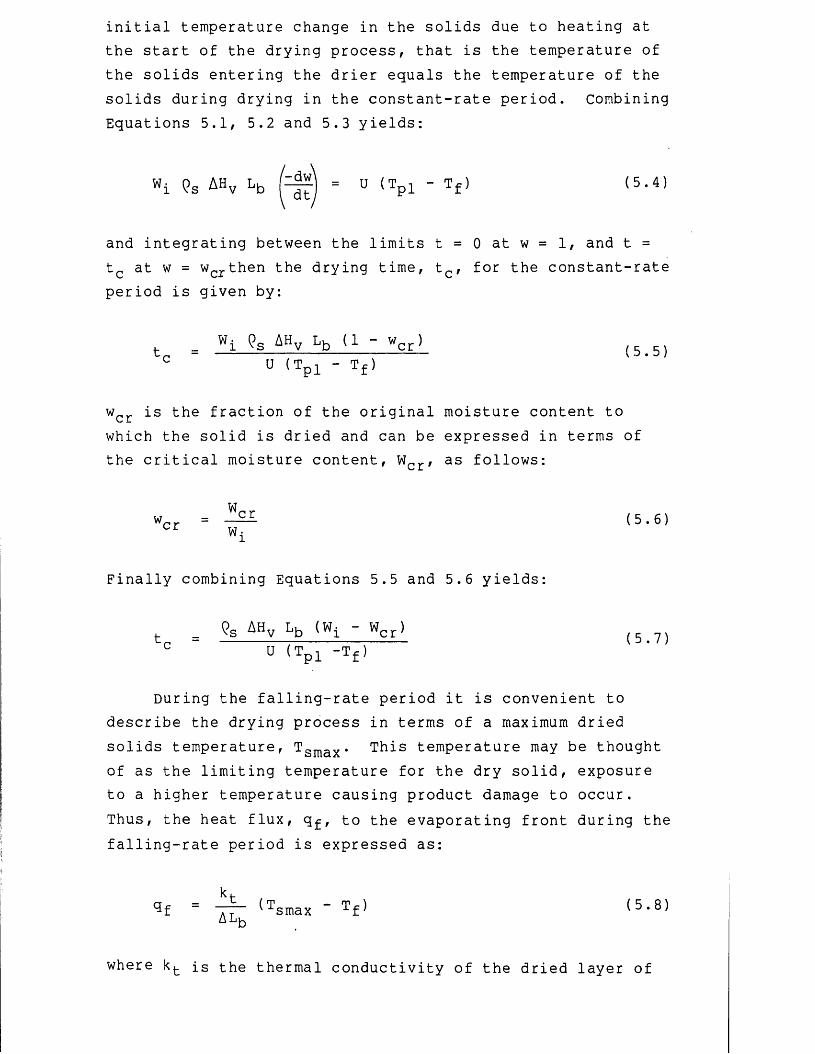
initial temperature change in the solids due to heating at the start of the drying process, that is the temperature of the solids entering the drier equals the temperature of the solids during drying in the constant-rate period, combining Equations 5.1, 5.2 and 5.3 yields:
w i <?s AHv Lb - u <tp 1 - Tf> (5-4)
and integrating between the limits t = 0 at w = 1, and t = tc at w = wcrthen the drying time, tc , for the constant-rate period is given by:
t„ = Wj (?s AHV Lb (1 - wcc) {5_5)’pi0 U (T„t - T f )
w c r is the fraction of the original moisture content to which the solid is dried and can be expressed in terms of the critical moisture content, Wcr, as follows:
Wrrwc = — ^ (5.6)cr Yli
Finally combining Equations 5.5 and 5.6 yields:
t = Qs AHv (Wt - Wcr) ^ ^c " u (TPi -Tf>
During the falling-rate period it is convenient to describe the drying process in terms of a maximum dried solids temperature, Tsmax. This temperature may be thought of as the limiting temperature for the dry solid, exposure to a higher temperature causing product damage to occur. Thus, the heat flux, q^, to the evaporating front during the falling-rate period is expressed as:
3f . (Tsmax ” Tf) (5.8)aLu
where k. is the thermal conductivity of the dried layer of
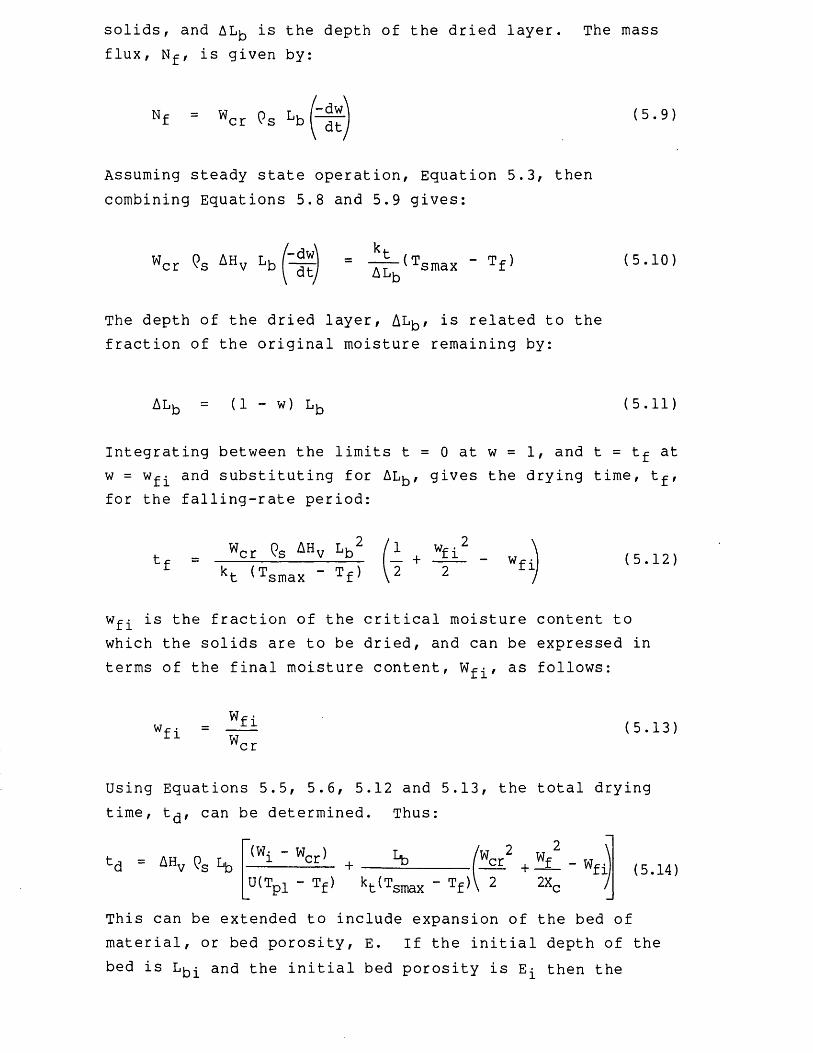
solids, and AL^ is the depth of the dried layer. The mass flux, Nf, is given by:
Nf = wcr Ps Lb r a <5'9>
Assuming steady state operation, Equation 5.3, then combining Equations 5.8 and 5.9 gives:
wcr (?s AHv Lb "AL^^smax T f (5.10)
The depth of the dried layer, AL^, is related to the fraction of the original moisture remaining by:
A Li (1 - w) Li (5.11)
Integrating between the limits t = 0 at w = 1, and t = tf at w = Wff and substituting for Al^, gives the drying time, tf, for the falling-rate period:
Wcr (?s AHv Lj-j(Tsmax - Tf)
wrfi wfi (5.12)
wfi is the fraction of the critical moisture content towhich the solids are to be dried, and can be expressed in terms of the final moisture content, Wff, as follows:
Wwfi f iW (5.13)cr
Using Equations 5.5, 5.6, 5.12 and 5.13, the total drying time, t^, can be determined. Thus:
2
-'■•fitd = AH V 9g Lb (wi - wcr> + 'W.crU(Tpi - Tf) M tc - Tf)\ 2
(5.14)
This can be extended to include expansion of the bed of material, or bed porosity, E. If the initial depth of the bed is and the initial bed porosity is Ef then the

depth of the bed at time t will be:
(5.15)
The bulk density of the dried solid can be expressed in terms of the dry solid density, as follows:
Using Equation 5.14, substituting for and Qs, yields:
Unfortunately, prediction of the expansion of the bed of material under reduced pressure is difficult and Et would have to be expressed empirically in terms of the absolute pressure and the rheological properties of the material to be dried.
5.3 Results and discussion
The results and discussion section is divided into two parts. The first part concerns the characterization of the dewatered precipitated protein feed material, in terms of the rheological properties and the kinetics of enzyme inactivation. The second part concerns the drying experiments performed.
5.3.1 Characteristics of the feed material
The successful operation of a vacuum drier requires feed materials with a high yield stress or shear modulus to prevent excessive expansion under reduced pressure. The rheology of dewatered precipitated protein suspensions prepared by membrane filtration has already been discussed
s d Et ^ds (5.16)
fcd = AHy <?d*
+

in Chapter 4. The rheological characteristics of the protein concentrates used to perform the drying experiments are presented in Section 5.3.1.1. These rheology results represent an extension to higher concentrations of the results presented in Chapter 4, and also a comparison is made between the dewatered protein suspensions prepared from a total water extract, TWE, and from isolated soya protein.
In Section 5.3.1.2 the kinetics of thermal inactivation, measured under non-drying conditions at a high water activity, are presented for glucose oxidase. The kinetics of glucose oxidase inactivation in deionized water and in soya protein concentrates are compared to assess the effect of enzyme-protein interactions on the thermal inactivation of glucose oxidase.
5.3.1.1 Concentrated precipitated protein suspension rheology
Figure 5.2 shows the shear stress - shear rate relationship for highly dewatered precipitated soya protein suspensions. The precipitated protein suspensions were prepared using soya protein from a TWE and from isolated soya protein. The protein suspensions were dewatered using a batch centrifuge as described in Chapter 2. The rheology data was determined using torque measurements obtained from a steep-angled, 2 °, cone-and-plate viscometer. The viscometer was operated by gradually increasing the shear rate setting to the highest value examined and then by decreasing the shear rate setting. Approximately 10 s was allowed to elapse between each shear rate setting, and the torque measurements were recorded for the decreasing shear rate section (except where otherwise indicated). The data in Figure 5.2 represents an extension to higher protein concentrations of the shear rheology data presented in Section 4.3.1.2. The apparent viscosity increased rapidly over a relatively small range of protein concentration and total solids content, and the precipitate suspensions prepared from the TWE were marginally more pseudoplastic in behaviour, with a greater degree of shear thinning at the same apparent viscosity. A large degree of thixotropy was
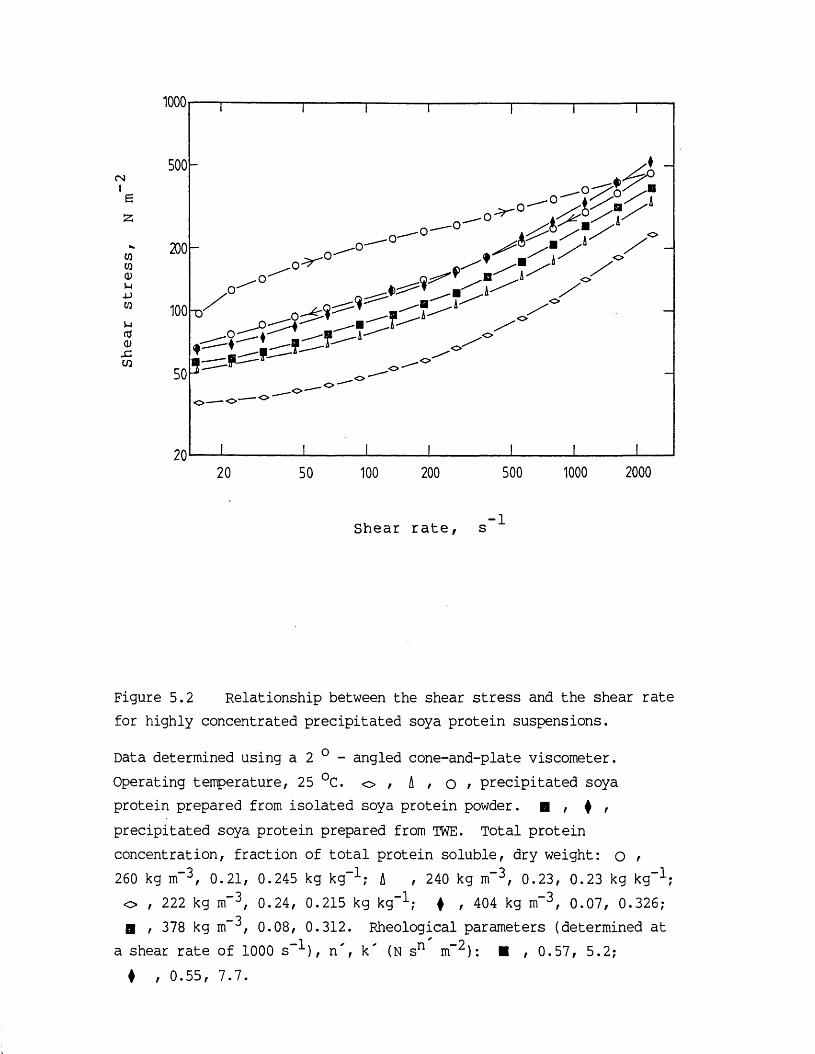
CMI
WwQ)uJJwufO0£CO
1000
500
200o
100
o• Oo
2000500 100020 200100
Shear rate, s-1
Figure 5.2 Relationship between the shear stress and the shear rate for highly concentrated precipitated soya protein suspensions.
Data determined using a 2 0 - angled cone-and-plate viscometer. Operating temperature, 25 °C. o , A , o , precipitated soya protein prepared from isolated soya protein powder. ■ , 4 , precipitated soya protein prepared from TWE. Total protein concentration, fraction of total protein soluble, dry weight: o r 260 kg m'3, 0.21, 0.245 kg kg"1; A , 240 kg m~3, 0.23, 0.23 kg kg"1; o , 222 kg m"3, 0.24, 0.215 kg kg"1; + , 404 kg m"3, 0.07, 0.326;B f 378 kg m , 0.08, 0.312. Rheological parameters (determined at
a shear rate of 1000 s"1), n', k" (N sn m~3): B , 0.57, 5.2;+ , 0.55, 7.7.

observed for the most concentrated suspension with structural breakdown resulting in lower apparent viscosities on the decreasing shear rate section. Such time dependency will have notable consequences regarding prediction of the flow conditions necessary to dewater these concentrates using membrane filtration (Chapter 6).
At the high protein concentrations examined here it was not possible to use Couette flow viscometers, such as the coni-cylindrical or the cup-and-bob type. Experimental difficulties, such as ensuring that the gap space was homogeneously filled without significantly compressing the protein concentrate, were experienced with presenting the protein concentrate to such viscometers. Rheological measurements using cone-and-plate viscometry at higher concentrations than shown in Figure 5.2 were erratic and unreproducible due to wall slip effects. These effects resulted from material compression between the cone and plate which caused liquid to drain from the protein sample and form a film between the precipitate solids and the metallic surfaces of the cone and plate. Analysis of higher protein concentrations may be achieved using capillary rheometry. However, the preliminary investigations, performed using an Instron 1141 Food Tester (see Chapter 2) modified to house a range of capillary tubes, proved unsuccessful. This form of capillary rheometer works by forcing material at a constant flow rate and known force from a piston barrel, into which the material must be loaded batch-wise, and through an open-ended capillary tube. By varying the flow rate of material and using capillary tubes of different diameters a wide range of high shear rates can be examined. Experimental problems were experienced with presenting the concentrated protein material to the rheometer since interstitial water drained from the material before entering the capillary tube and pockets of air formed which subsequently resulted in erratic flow through the capillary tube. Similarly, the time course of the experiments was too short, that is the capacity of the barrel was too small, to obtain a steady state measurement at high shear rates. To overcome these problems a capillary rheometer for precipitated protein concentrates would have

to be designed such that material was continuously passed through the capillary tube, perhaps by using a suitable positive displacement pump. Ideally, the pump would be operated in a closed circuit so that material from the capillary tube was recirculated back to the pump. This system would correlate directly to the operation of a membrane filtration process and could be employed for predicting the maximum physical extent of dewatering.
Extrapolation of the shear stress - shear rate curves, of Figure 5.2, to zero shear rate indicates the presence of high yield stresses. Similarly, a large increase in the shear modulus over a small range of total solids content was observed for the protein concentrates prepared from the TWE and isolated soya protein and this is shown in Figure 5.3. This tendency of increasing shear modulus with concentration denotes the formation of a solid structure with considerable elastic properties, arising from aggregate interlocking and other interaggregate forces. Precipitated protein concentrates with a shear modulus greater than 5000 N m“3 were found to be most suitable for vacuum drying. Lower shear moduli could only be tolerated at low vacuum levels where air or water vapour expansion was minimized.
It should be noted that only rheological comparisons can be made between the membrane filtration products, TWE soya protein, and the drier feed materials, isolated soya protein, since there was a large difference in protein concentration and total solids content. This is illustrated in Figure 5.4 which shows a similar proportional relationship between the total protein concentration and the total solids content for the two types of precipitated soya protein suspensions. These concentrates have similar soluble protein concentrations and the presence of soluble carbohydrates in the precipitated soya protein suspensions prepared from the TWE will have little effect on the protein aggregate structural strength or on the volume of solid particles. Size analysis gave a mean precipitated protein aggregate size of 3.0 pm (s.d. = 0.8 pm) and 6.5 pm (s.d. = 2.7 pm) for, respectively, the isolated and the TWE soya protein aggregates. Bell (1982) obtained a higher Bingham yield stress for larger TWE soya protein aggregates

30000
20000C Ng
10000
35
% Total solids content
Figure 5.3 Relationship between the shear modulus and the total solids content of highly concentrated precipitated soya protein suspensions.
Operating temperature, 25 °C. Total protein concentration given by Figure 5.4. Pulse shearometer, minumum gap setting, 3 mm, maximum gap setting, 10 mm, 5 gap settings per sample. O , precipitated soya protein prepared from isolated soya protein powder; □ , precipitated soya protein prepared from TWE.
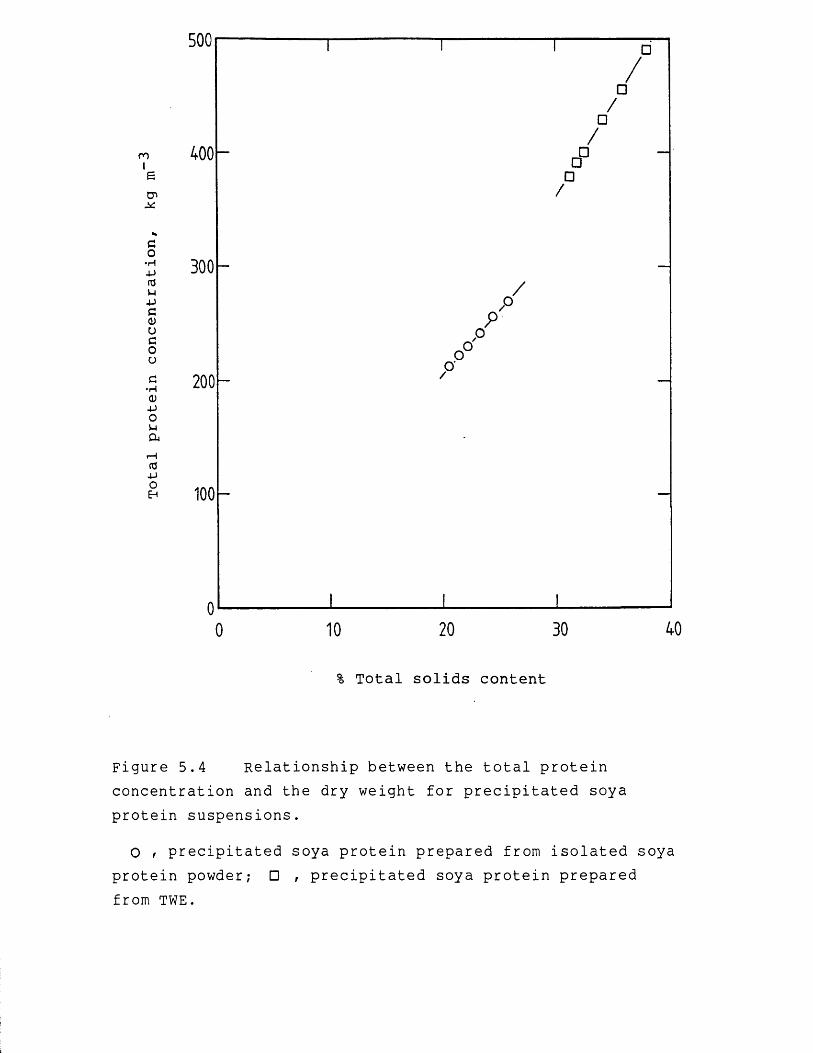
COItjla:
Go•H-Pnju-PG<1)UGOOG•H<D-POPCUtd•po
500
200
20% Total solids content
Figure 5.4 Relationship between the total protein concentration and the dry weight for precipitated soya protein suspensions.
O r precipitated soya protein prepared from isolated soya protein powder; □ , precipitated soya protein prepared from TWE.

at the same concentration and ascribed the difference to nonsphericity effects and a broadening of the aggregate size distribution leading to an increased number of particle interactions. Unfortunately, this explanation contradicts the results. Instead, the differences may be due to an increase in the amount of interparticle bound water in the isolated soya protein aggregates as a result of the isolation procedures employed which produced a considerable proportion, approximately 30% w/w, of insoluble protein, after resuspension but prior to precipitation.
At the highest concentrations reported in Figures 5.3 and 5.4 the suspensions of protein aggregates are approaching the maximum packing density. These materials would not flow readily and could not expect to be further dewatered by membrane filtration or easily pumped into a vacuum drier, and thereby they represent the upper limit of the dewatered protein concentration for the integration of the dewatering and drying operations.
5. 3.1.2 Enzyme denaturation
Figure 5.5 shows the variation in residual enzyme activity with time at two different heating temperatures for glucose oxidase suspended in deionized water. The enzyme preparations were heated in a water bath which enabled the temperature of the suspension to attain the steady state heating temperature within 60 s. The thermal inactivation curves consisted of a rapid activity decline during this heating-up period of the first 60 s, followed by an intermediate curved portion and a final linear inactivation stage. The gradient, or inactivation rate constant, of the first stage was greater than the gradient of the second inactivation stage and both increased as the heating temperature was raised. Inactivation data of this form is consistent with the presence of two, or possibly more, enzyme fractions with differing thermal stability, and each exhibiting independent first-order inactivation reactions.The amount of the most thermostable fraction can be estimated by extrapolating the residual activity curves back to zero time as shown in Figure 5.5. This fraction

> 1JJ•H>•rH-UuCO
T30)N•Hn3eMO2<#P
1 0 -
5 -□
400 800 1200 1600
Incubation time, s
Figure 5.5 Relationship between the residual glucose oxidase activity and time for incubation in a water bath
Glucose oxidase suspended in deionized water; enzyme dilution, 25 IU mL” . Incubation temperature: O ,58.0 °C; □ , 61.3 °C.
2000

constituted approximately 75% of the total measured act ivity.
Another method of examining the enzyme inactivation was to incubate the enzyme suspensions in a heated metal bar over which there was a temperature gradient (see chapter 2). Unlike the heated water bath, this method enabled a wide range of heating temperatures to be studied simultaneously. The inactivation curves obtained using this method are shown in Figure 5.6. As for incubation in the water bath, the inactivation curves were determined for an enzyme concentration of 1 xlO” kg kg”-*-, or approximately 25 IU mL”-*-, which corresponded to the dilution employed for the vacuum drying experiments. As expected these curves closely resemble the inactivation data obtained using the heated water bath, apart from the initial heating-up stage where the temperature of the enzyme suspensions incubated in the heated metal bar relatively slowly approached a steady state heating temperature. After 300 s heating, compared to 60 s for the heated water bath, the suspensions were within 1 °C of their respective steady state heating temperature.No activity loss was observed until the heating temperature exceeded 45 °C after which the rate of inactivation accelerated substantially with increasing heating temperature. The activation energy for the thermostable fraction was evaluated as 220 kJ mol”-*-. This high value reflected the large loss of enzyme activity over the narrow range of heating temperatures from 53 to 62 °C.
The effect of chemical modification on the inactivation kinetics is shown in Figure 5.7. The data was obtained using the heated metal bar at a steady state heating temperature of 61 °C. The greatest thermal stability was observed for glucose oxidase in 0.1 M phosphate buffer (pH 6.0) whereas for 0.07 M sodium acetate buffer (pH 4.6) the magnitude of inactivation was similar to the nonbuffered enzyme suspensions.
In general, it is not possible to predict what effect the nature of the ionic environment will have on the thermal stability of an enzyme in its native state. For glucose oxidase in a concentrated suspension of precipitated protein prepared from isolated soya protein the inactivation
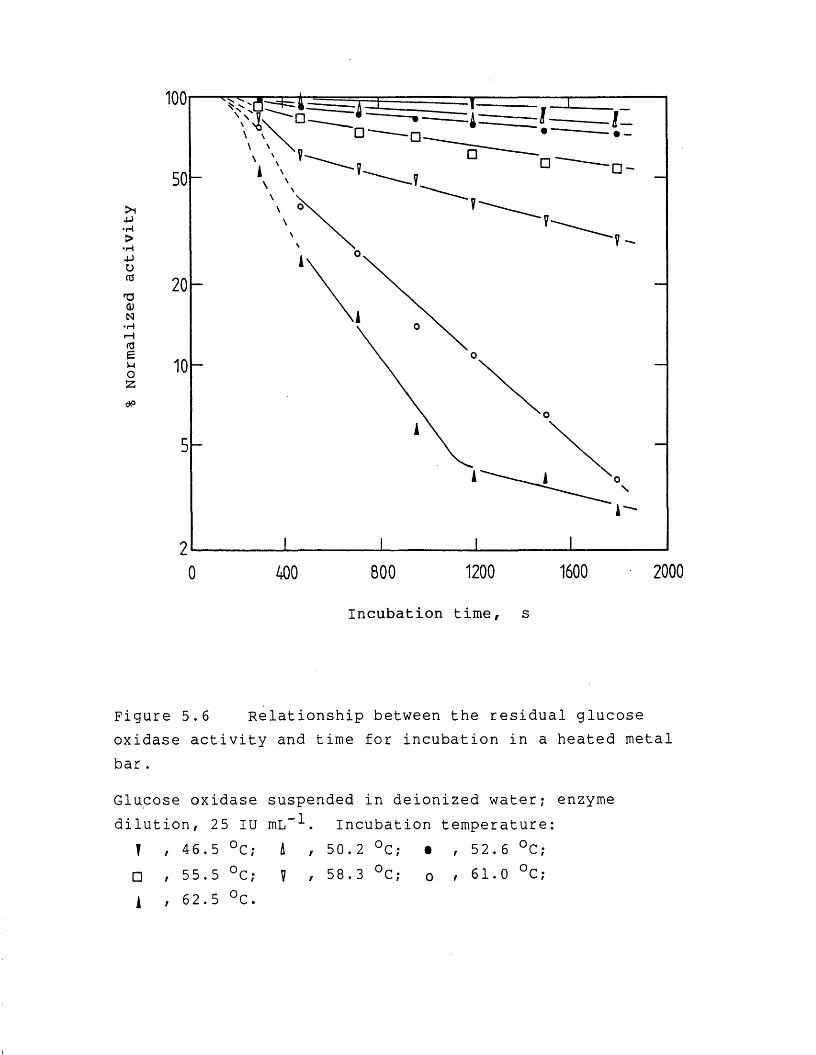
-U•H>■HAJU03Q)N•Hr H03euO2dP
100• —
400 800 1200
Incubation time, s
1600 2000
Figure 5.6 Relationship between the residual glucose oxidase activity and time for incubation in a heated metal bar .
Glucose oxidase suspended in deionized water; enzyme dilution, 25 IU mL” . Incubation temperature:
T , 46.5 °C; A , 50.2 °C; • ,52.6 °C;□ , 55.5 °C; V , 58.3 °C; O r 61.0 °C;1 , 62.5 °C.
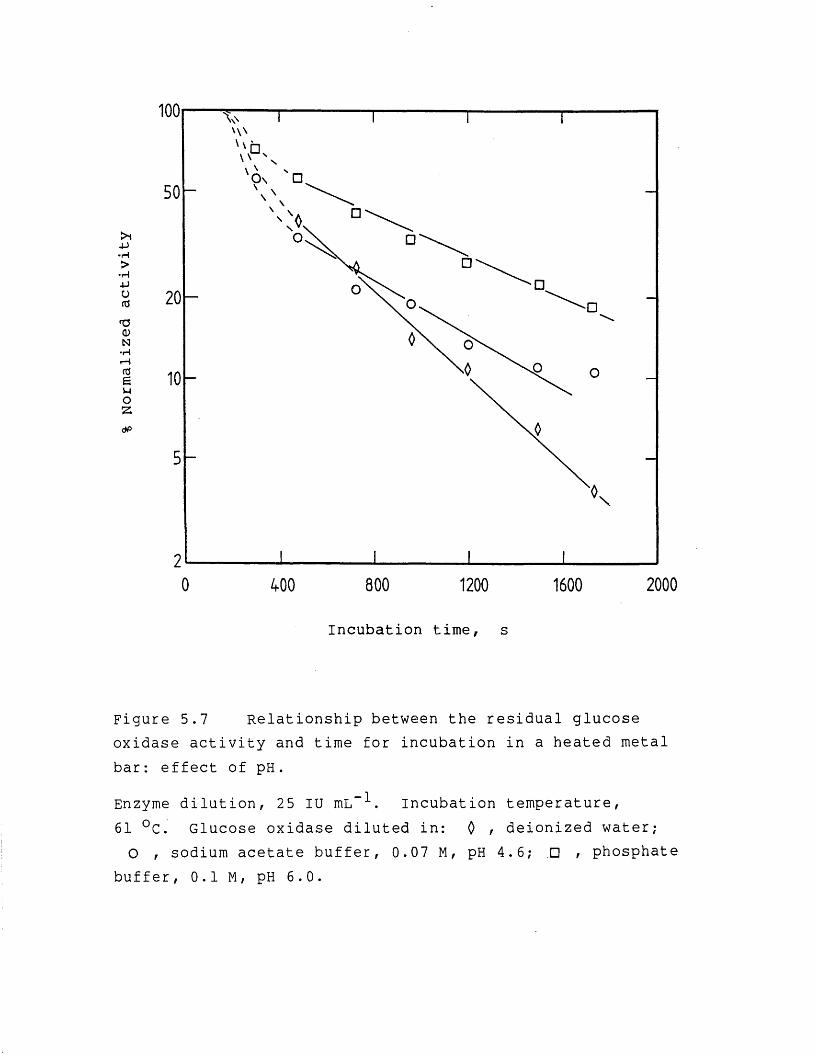
100
Q\
•H
•H
z
20000 800 1200 1600400
Incubation time, s
Figure 5.7 Relationship between the residual glucose oxidase activity and time for incubation in a heated metal bar: effect of pH.
Enzyme dilution, 25 IU mL-1. Incubation temperature,61 °c. Glucose oxidase diluted in: 0 / deionized water;O , sodium acetate buffer, 0.07 M, pH 4.6; .□ , phosphate
buffer, 0.1 M , pH 6.0.

kinetics obtained using the heated metal bar are shown in Figure 5.8. The environment provided by the concentrated soya protein had a marked effect on the thermal stability of glucose oxidase, increasing the heating temperature at which a large degree of enzyme inactivation was first observed by about 10 °C, and lowering the activation energy to 190 kJ mol”'-*- for the most thermostable enzyme fraction. At a heating temperature of 61 °C the inactivation rate constant for the thermostable enzyme fraction wasj decreased by a factor of 10 compared to the same enzyme preparation heated in deionized water.
The concentration of the precipitated protein suspensions used were typical of the vacuum drier feed material, and were liable to dry significantly over the longer steady state temperature holding times examined. However, similar results were observed when control experiments were performed with a layer of deionized water covering, but not dispersed in, the glucose oxidase - protein concentrate mixture.
The thermal stability of enzymes is often greatly influenced by the hydrogen ion concentration, and is usually greatest at the isoelectric point. The isolated soya proteins were precipitated at pH 4.6. However, from Figure 5.7, small adjustments in the pH value had a comparatively minor effect and consequently variations in the hydrogen ion concentration cannot wholly explain the increased thermal stability provided by the precipitated protein concentrate. Thus, it is concluded that the soya proteins themselves either in the soluble, insoluble or precipitated form have an effect on the thermal stability of glucose oxidase. This conclusion is not unexpected. Daeman (1981) and Verhey (1973) observed that proteins in a concentrated form were more thermostable than the same protein in a diluted form. The most likely explanation for the increased thermal stability of the glucose oxidase is that the water activity of the suspension has been lowered by the presence of a large concentration of protein material. At a reduced water activity proteins and enzymes often display an increased thermal stability since 'mobile" water molecules are required to facilitate protein

> 1 4-> •I—I >-PU(CTD0)N•Hi-H(CenozdP
2000800 1200400
Incubation time, s
Figure 5.8 Relationship between the residual glucose oxidase activity and time for incubation in a heated metal bar .
Glucose oxidase suspended in precipitated soya protein prepared from isolated soya protein powder; enzyme dilution, 25 IU mL-'*'. Incubation temperature: • ,54.2 °C; 0 , 58.8 °C; o , 63.7 °C; ♦ , 69.0 °C; □ ,73.0 °C.

denaturation or enzyme inactivation, as discussed in Section 1.5.
5.3.2 Studies on the drying rate and enzyme activity retent ion
This section discusses the results obtained for the vacuum drying experiments. In some cases the figures have been presented with the data points omitted to aid clarity. However, a complete set of the vacuum drying results for the 9 experiments performed are presented in Appendix A.2, and are indentified in the figure legends by a single letter, for example drying experiment A, etc. Note that the vacuum pressure is expressed in kPa of absolute pressure, so that 0 kPa is equivalent to a complete vacuum. Note also that reduced pressures approaching 0 kPa are referred to as high vacuum levels in the text.
5.3.2.1 Effect of heating temperature
The effect of the temperature of the heated plate, or heating temperature, on the moisture content and loss of enzyme activity is examined in Figure 5.9. A low vacuum level of 62.5 kPa and a high heating temperature were employed to induce a large degree of enzyme damage. In addition, a high precipitated protein concentration was used which, in combination with the low vacuum level, minimized product expansion and the product depth remained constant over the first 0.5 h drying. The percentage of enzyme activity remaining after drying or partial drying was related to a control sample of the feed material which was placed in the drying chamber, on the cooling plate, for the duration of the experiment. This ensured that the samples to be analysed for enzyme activity after drying, and the control sample, had been subjected to the same environmental conditions. However, within the limits of the accuracy of the enzyme assay, no non-thermal inactivation of the control samples was detected over the duration of each drying exper iment.
The drying rate profiles are typical of drying
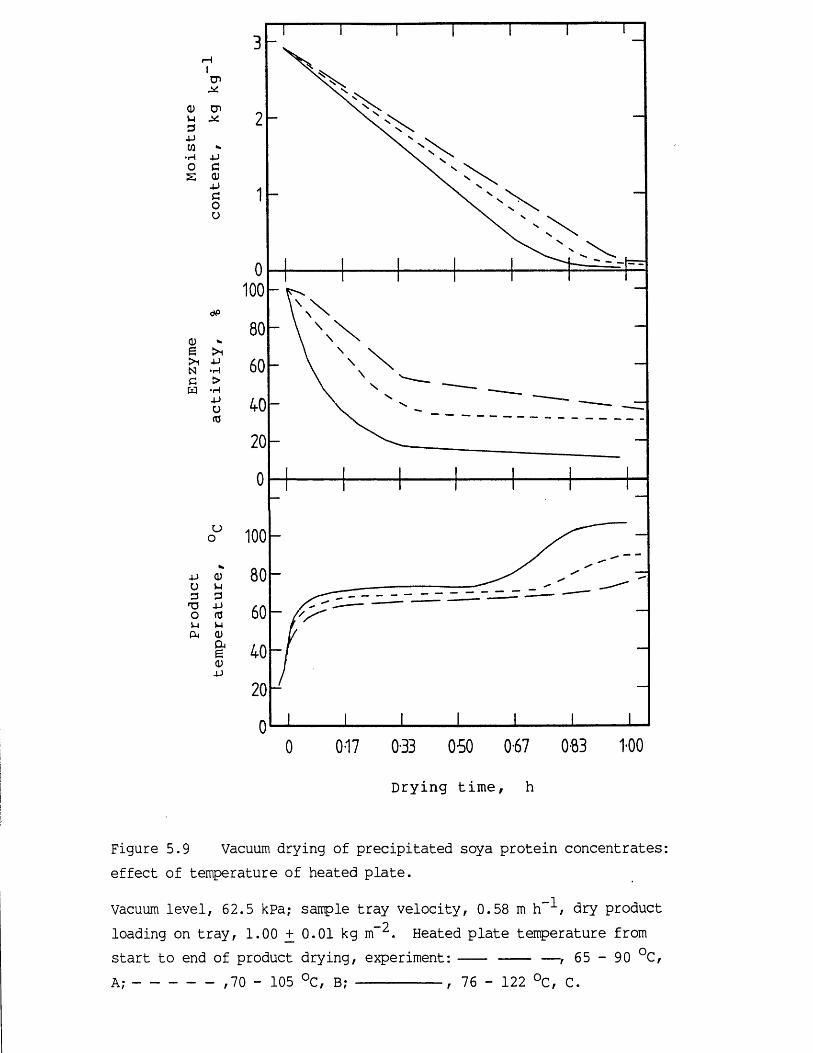
CP
to •*•H JJo c s oJJeou
100
<u » e >i> 1 4-1N -Hc >H «H -U U fO
tJ 100o
0V-l3JJfCu0cue0jj
0-17 0-33 0 50 0-67 053 1000
Drying time, h
Figure 5.9 Vacuum drying of precipitated soya protein concentrates effect of temperature of heated plate.
Vacuum level, 62.5 kPa; sample tray velocity, 0.58 m h”-*-, dry product_nloading on tray, 1.00 + 0.01 kg m . Heated plate temperature from
start to end of product drying, experiment:--- — , 65 - 90 °C,A;---------- ,70 - 105 °C, B; , 76 - 122 °C, C.
operations in general, exhibiting an apparently constant- rate period followed by a falling-rate period. Increasing the heating temperature increased the rate of moisture removal during the constant-rate period, although the simultaneous increase in product drying temperature implied that the process was mass transfer controlled. In vacuum drying the temperature of the drying solids approaches the temperature of liquid vaporization, which will in turn equal or exceed the saturated vapour temperature of the liquid at the system pressure. A reduced pressure of 62.5 kPa corresponds to a saturated vapour temperature of 86 °C. However, during the constant-rate period the highest temperature of the drying product, measured adjacent to the tray surface, did not exceed 74 °C, for the highest heating temperature studied. Hence, there was an inadequate supply of heat rather than mass transfer control.
The retention of enzyme activity similarly varied according to the heating temperature employed, with the greatest loss observed at the highest heating temperature. The inactivation curves consisted of an initial rapid loss of activity, an intermediate curved portion at a corresponding moisture content of 1.8 kg kg--*- and a final relatively constant inactivation stage. At 1.8 kg kg--*- the availability of mobile or unbound water may have diminished sufficiently to prevent further enzyme inactivation, and hence the final period of the activity curve corresponds to a thermostable dry state of the native enzyme. Figure 5.10 shows the enzyme activity replotted logarithmically as a function of the drying time. The data presented in Figure 5.10 referring to the constant-rate period may be compared to the enzyme inactivation profiles obtained independently using the heated metal bar experiment, the results of which are shown in Figure 5.8. For instance, during the constant-rate period the drying time may be equated to the incubation time in the heated metal bar, and the steady state heating temperature in the metal bar may be equated to the temperature of the product measured adjacent to the heated tray surface, comparing Figures 5.8 and 5.10, the magnitude of enzyme inactivation after a drying time, td' at a temperature, Tp, approximately equals the magnitude

100o-
2400200016001200800400
Drying time, s
Figure 5.10 Relationship between the residual glucose oxidase activity and the vacuum drying time.
Enzyme, dilution, 25 IU mL-1. Mean-average temperature (+ 1.0 °C) at tray surface between drying times of 300 - 1000 s, mean-average product temperature (+ 2.0 °C) 2 mm above tray surface, experiment (see Appendix A.2 for details): A , 70 °C, 63 °C, D; □ , 67 °C, 60 °C, A;0 , 64 °C, 58 °C, B; O , 62 °C, 56 °C, C.
of enzyme inactivation obtained using the heated metal bar for an incubation time equal to t^ at a heating temperature of, Tp - 3. For example, in Figure 5.10 consider the drying experiment which led to the greatest loss of enzyme activity during drying. Between the drying times of 300 and 1000 s the mean-average temperature of the product adjacent to the heated surface, Tp , was 70 °C. The temperature profile is shown in Figure 5.11. The total extent of enzyme inactivation after 1000s drying is approximately equal to the total extent of enzyme inactivation observed after 1000 s heating in the heated metal bar at a steady state heating temperature of 73 °C. When heating the enzyme suspensions using a water bath the temperature of the suspensions relatively quickly approached the steady state heating temperature compared to the heated metal bar. Similarly, the approach to steady state heating in the metal bar was faster than compared to the temperature profiles obtained for the drying solids. This is shown in Figure 5.11 for the example cited above. It would be expected that if the heating temperature profiles were the same for the heated metal bar and the drying experiments then the magnitude of enzyme inactivation after a given time would be similar. The temperature of the product at the heated tray surface represents the highest temperature at which the product dries whereas the major portion of the drying material remains 5 to 10 °C cooler (see Appendix A.2). Thus, although it was not possible to measure accurately the temperature distribution across the depth of the product, the actual extent of enzyme inactivation appears to correlate to the measured temperature of the product at the heated surface rather than the average temperature across the depth of the drying product. This suggests there was some drainage of the enzyme, together with solvent, down towards the heated surface where evaporation occurs during the constant-rate period. This process would continue until the amount of interparticle water reached some critical value corresponding, in this case, to a total moisture content of 1.8 kg kg”-*- at which the enzymes ceased to move relative to the precipitated soya protein. Thus, at this transition
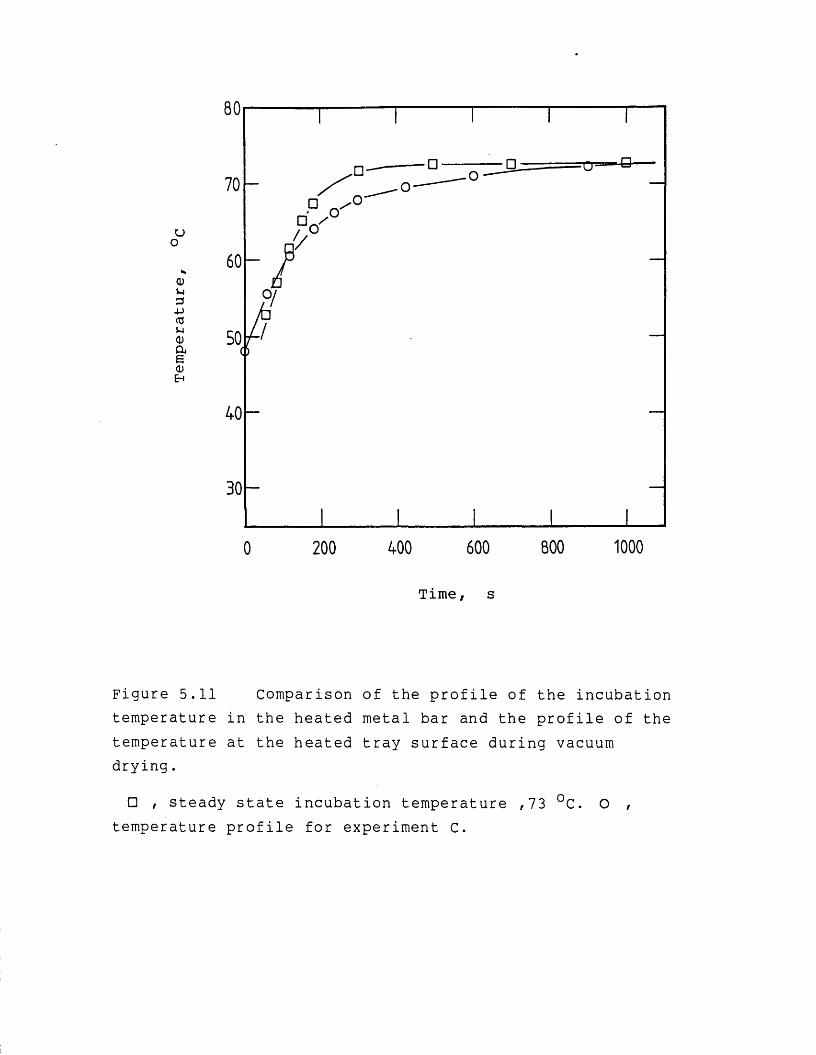
uo
<Du3-P03MQ)CuS<DEh
1000800600400200Time, s
Figure 5.11 Comparison of the profile of the incubation temperature in the heated metal bar and the profile of the temperature at the heated tray surface during vacuum drying.
□ , steady state incubation temperature ,73 °C. O , temperature profile for experiment C.

point the bulk movement of the enzyme within the drying bed had ceased rather than there being insufficient water to facilitate inactivation. Alternatively the temperature profile through the product could be more complex than suggested here. However, further evidence to support the hypothesis of the enzyme draining or migrating down to the heated surface is provided by examining the effect of initial moisture content of the feed material on the retention of enzyme activity during drying. This isdiscussed in the following section.
5.3.2.2 Effect of vacuum level and initial moisture content
The effect of the vacuum level on the drying rate and the extent of enzyme damage is shown in Figure 5.12. The vacuum level, or pressure, was varied from 62.5 kPa, which is a relatively poor vacuum such as may be obtained using asimple condenser, down to 4.25 kPa, which is more typical ofindustrial vacuum drying operations. At this high vacuum level some predrying of the product, before it passed on to the heated surface, led to the apparent lower initial moisture content.
Raising the vacuum level generally increased the drying rate by lowering the product temperature, and thereby increasing the temperature difference available for heat transfer between the heated plate and the product. Conversely, the extent of enzyme damage decreased. At the highest vacuum level studied and the next vacuum level presented here, 20 kPa, no loss of enzyme activity was observed. As in Figure 5.10, the product temperature measured adjacent to the tray surface correlated to the inactivation curves determined using the heated metal bar (Figure 5.8). At 20 kPa this temperature was 54 °C and coincidently corresponded to the so-called thermal transition temperature at which inactivation of glucose oxidase in the presence of soya protein just began to occur. Operating at pressures greater than 20 kPa resulted in product damage.
It was noted in Section 5.3.1.1 that product expansion
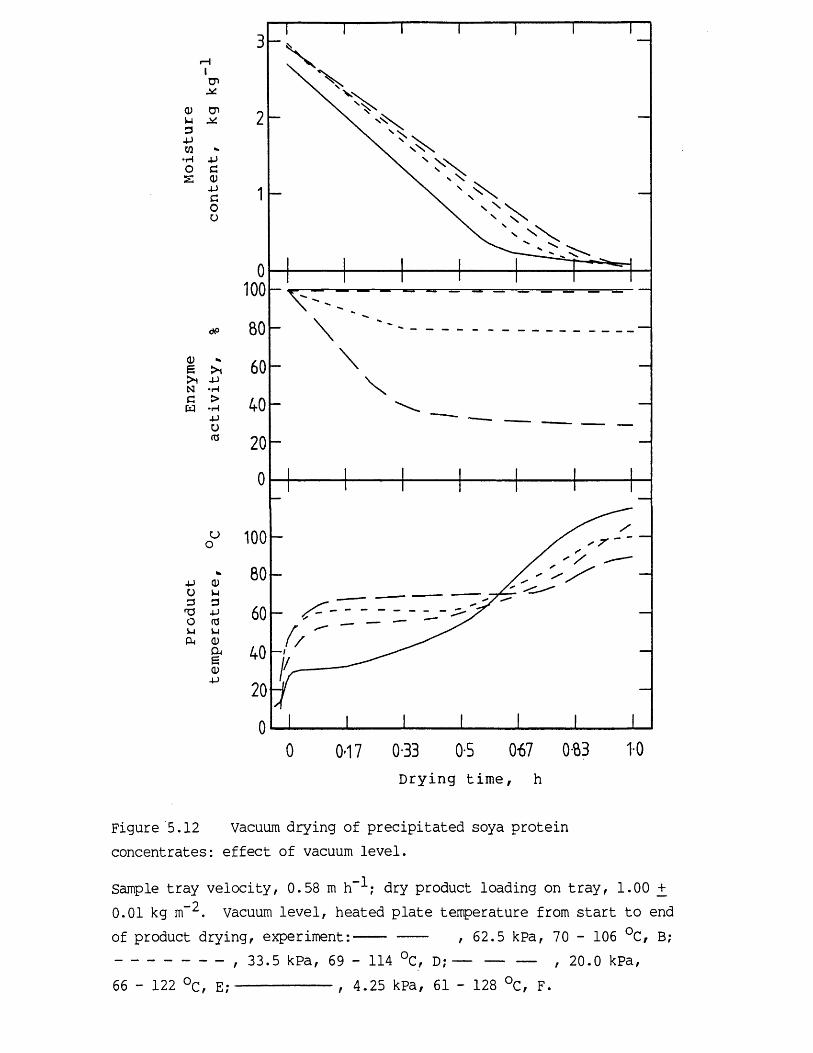
tr><D OiU M 3 4->W• H 4-> O G2 Cl) 4-3GOO
CDENGW
dP
> 14J•H>•H4-3u<u
Oo*
4-3 CDo u3 3
T3 4->O cdu uCM CD
a .ECD4->
0*17 0*33 0-5 0*67 0fl3 1-0Drying time, h
Figure 5.12 Vacuum drying of precipitated soya protein concentrates: effect of vacuum level.
Sample tray velocity, 0.58 m h” *; dry product loading on tray, 1.00 +0.01 kg m- 2 Vacuum level, heated plate temperature from start to endof product drying, experiment:--- , 62.5 kPa, 70 - 106 C, B;------------- , 33.5 kPa, 69 - 114 °C, D;— --------, 20.0 kPa,66 - 122 °c, E;----------- , 4.25 kPa, 61 - 128 °C, F.
may occur provided the feed material is not too viscous and a high vacuum level is employed. The shear rheology of the protein concentrates reported here is given by the top curve in Figure 5.2 and the shear moduli were approximately
_ o5000 + 500 N m . The variation in product depth with vacuum level is shown in Figure 5.13. Except where indicated otherwise, the product depth was measured after the drying experiment had been completed, the vacuum released and the sample tray removed from the drying chamber. No product expansion during drying was observed until the pressure was reduced to 10 kPa, and in some cases the product actually shrank with decreasing moisture content. The product expanded considerably at 4.25 kPa, by up to a factor of 5, and reached a maximum depth, estimated visually while drying under reduced pressure, just as it passed on to the heated surface. Upon releasing the vacuum the product regained approximately its original depth. Expansion arose from the initially rapid vaporization at the start of drying, and subsequently increased shrinkage occurred as the thin product layers lost their moisture. At these high vacuum levels the beneficial effect of increasing the temperature difference between the heated surface and the product was offset by the product expanding, which considerably lessened the drying rate during the falling- rate period. In the falling-rate period the drying rate often follows an inverse-square relationship to the product depth (Keey, 1978) and this, combined with the low thermal conductivity of the expanded dried product through which heat must be conducted, was responsible for markedly reducing the drying rate. Product expansion increases the active surface area available for drying by "puffing-up" the material into thin layers, and is particuarly desirable when a suitable radiating heat source is present. However, in this case, as with many drying operations, the main heat transfer mechanism is conduction from the heated plate, and, ideally, the feed material should be viscous enough to prevent excessive expansion.
Drying conditions leading to a large degree of enzyme inactivation were employed to examine the effect of the initial moisture content on the drying rate and the extent

JS-p&(U’U4-)oaOv-i&4
0-830670-33017
Drying time, h
Figure 5.13 Effect of the vacuum level on the product depth during vacuum drying.
Product depth, + 0 . 2 mm, measured after vacuum released and sample tray removed from heated surface, except wherestated otherwise. Vacuum level, experiment: --- ,62.5 kPa, B;-------------, 33.5 kPa, D;— ------— ,20.0 kPa, E;............., 4.25 kPa, F. ------------- ,product depth estimated visually for experiment F whilst product drying under reduced pressure.

of product damage. This is shown in Figure 5.14. In rheological terms, the range of moisture contents examined corresponded to the latter stages of membrane dewatering (Figure 5.2) through to batch centrifuge dewatered concentrates (prepared as described in Chapter 2). Higher drying rates during the constant-rate period were observed with feed materials of greater initial moisture content but were also accompanied by a greater loss of enzyme activity. The variation with drying time of the highest product temperature measured adjacent to the tray surface and the product temperature measured approximately 2.0 mm above the tray surface, were in close agreement for the different initial moisture contents. The congruency in these product temperatures supports the theory that a proportion of the enzyme migrates, together with the interparticle water, to the heated tray surface during the initial drying stages whilst a large amount of interparticle water is still present. The interparticle water for the feed material examined with the lowest initial moisture content would have been depleted more rapidly, the opportunity for migration would have diminished, and thereby less enzyme damage was observed. Further support to this enzyme migration hypothesis was provided by examining the extent of enzyme inactivation. For the most concentrated feed material the inactivation kinetics corresponded more closely to the estimated average drying temperature of the product across the product depth, whereas enzyme inactivation for the more dilute feed materials correlated to the product temperature at the heated tray surface.
The higher drying rates of the dilute feed materials were accompanied by a greater degree of shrinkage and cracking of the slab of material once the moisture content was reduced below 1 kg kg--'-. This led to faster drying rates in the falling-rate period. The final dried product was crystalline in form and was difficult to redisperse in water without initially reducing the dried product to a powder. At higher vacuum levels the material tended not to clump together in a crystalline mass, was more friable in the dried form and could be more easily redispersed.

u34JW•Hos
CPCP
4-)c0)4Jcou
<ug>1NCW
dP
>i4->•tH>•H4JU<C
4->o3TJOv-iCU
uo
<1)U34J<3V-i<uCug0)4-)
0*17 0*33 0*5 0*67 083 10Drying time, h
Figure 5.14 Vacuum drying of precipitated soya protein concentrates: effect of initial total solids content.
Sample tray velocity, 0.58 m h”1; dry product loading on tray,1.00 +_ 0.01 kg m . Initial total solids content, heated plate temperature from start to end of product drying, experiment:
3.05 kg kg71 - 105 °c, B;
1 74 - 115 °C, H;---------- , 2.90 kg kg— , 2.62 kg kg"1, 73 - 110 °C, G.
-1

5.3.2.3 Evaluation of vacuum contact drying theory
The data presented in Figures 5.9 and 5.12 were used to assess the vacuum drying theory derived in Section 5.1.Table 5.1 shows the parameters used to evaluate the drying rate for the constant-rate period between 120 s to 0.5 h drying, or less depending on the extent of the period. The first 120 s were ignored as the drying process was not at steady state.
A value for the overall heat transfer coefficient, o.h.t.c., was determined by vacuum drying deionized water in the absence of protein. A known mass of water was evaporated from the sample tray over a period of 1 h at a constant vacuum level and heating temperature. During this experiment the sample tray remained stationary. The o.h.t.c. is given by Equation 5.18, which may be obtained by combining Equations 5.1 and 5.3:
P AHVU = ----------- ^---- (5.18)A (Tpl " Tf) fcd
where p is the mass of water evaporated and A is the heatedarea covered by the sample tray. At a reduced pressure of62.5 kPa the average temperature difference between theheating plate and the water adjacent to the tray surface was9.0 °C, and, using Equation 5.18, the o.h.t.c. was evaluated
— 9 — 1as 0.26 kw m K . On repeating the experiment at a higher vacuum level of 6.7 kPa a value of 0.18 kW m“ K--*- was obtained. One possible reason for obtaining this lower value could be the increased number of vaporization sites and larger vapour bubbles which formed on the tray surface to reduce the effective area for heat transfer. For the case of evaporating deionized water, the o.h.t.c. evaluated for a stationary tray represents an upper limit. Kumazawa et al. (1980) showed that the o.h.t.c. could be reduced by a factor of 3 upon doubling the conveyor band speed in a continuous band vacuum drier. They also calculated the o.h.t.c. for fish meal protein to vary from 0.005 to
— 9 — 10.03 kW m K , depending on the band speed employed. Although these values include heat transfer by radiation,
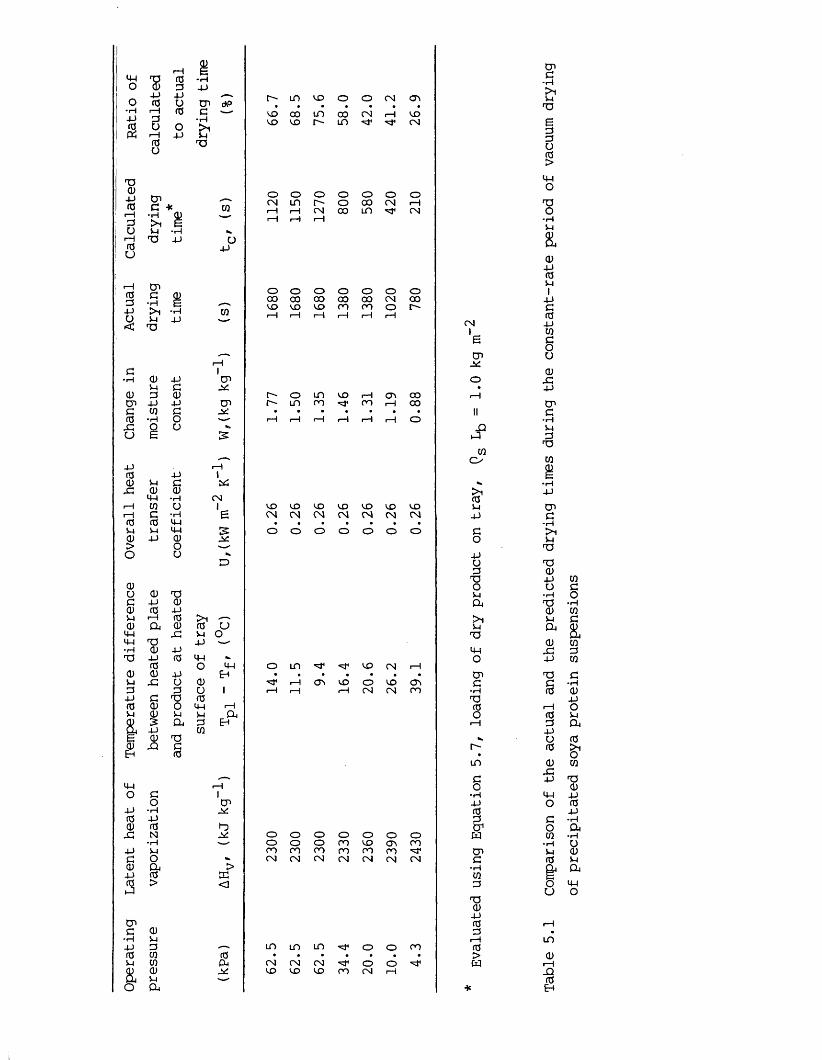
o• H-pto
13Q)4-JtOi—I3 U ■—Itou
to3-P
13 i— 1to -rHQJ 3 4-J4-J 4-> *—-fO U c n dPr-H to G —3 • HD o > i■— 1 4-J PIfO 1 3O
tjlc *• P < > 1 fP V
13 4
CQ
U
CnG•rH>iPi13
•rH4-J
G•rH QJ 4-JPi GQJ 3 QJc n 4-> 4-JG cn Gto •rH O-G Q Oo e
CQ
cnr- o m <o r— 1 cn 00cn r-~ in CO p CO i— I 00• • • • • • •■— ■ ■— i i—i ■— i r H i— 1 ■— I o
4-J ■— i(0 4-> iQJ P G-G QJ 0ip •rH CNi— 1 CQ o 1i— 1 C ■H eto to *PPi p <P 3:qj -p QJ> O '— -o U
d
(DU a;G -p ajQJ to 4-JPi r—1 to >i(1) Qi QJ to u<P -G P 0<4-1 13 -P ’— ✓•rH QJ 4-J13 -P fO <PfO O 4-1QJ <D 4-J EhPi -C U <u3 3 u 1-P G 13 (0to QJ O ip l— 1Pi 0) P p a1 5-P CLi 3
cnEh
E QJ 13QJ J Q GEh fO
ip 1— 1O GO 1cn-P •rH -V
to 4-JQJ fO *3-G N•rH -V-PGqj-P(O•J
cnG•H4-)fOPi8.O
Pio&(0>
>S3<]
PiCL.
r - in i d 0 0 CN <T\• • • • • • •<40 00 in 0 0 CN 1— 1 i n
I D ID p " in p P C N
0 O 0 0 0 0 0CN in r - 0 00 CN 1— 11—1 1— 1 C N 00 in p C N1— 1 ■— 1 1— 1
O 0 0 0 0 0 000 00 00 00 00 CN 0010 10 10 CO CO 0 l"-1— 1 1— I 1— 1 1— 1 r-H 1— 1
10 ID ID ID ID ID IDCN CN CN CN CN CN CN
• • • • • • •O O O O O O O
O in p p I D CN 1— 1• • • • • • •P 1— 1 cn ID O ID cn1—1 1—1 i~l C N CN CO
0 O O O O O O0 O O CO ID cn COCO CO CO CO CO CO pCN CN CN CN CN CN CN
3 in in in P 0 O COcn to • • • • • •cn P4 CN CN CN P 0 O pQJ ID I D ID CO CN P
CN1cn
i2cqo
<oPi4-)
GO4->u313OPiDi> iPi
13M-4Ocnc•rH13fOO
r -LOGO
•rH4-JfO3cnwcnG
•rHCQ3
13QJ4->(03i—IfO>w
cnc-p>1p13
E33Uto>ipO13O•rHu&QJ4-Jtop114->GfO4-JcnGOUaj-C-pcnc■ rHP3
13
cn•p-pcnG•rH> 1p13
13QJ-P cnO c•rH 013 •rHQJ cnP Gp4 &QJ cn- G 3-P cn13 cG •rHfO QJ4-J1— 1 OfO P3 O i-PCJ tofO >10QJ cn- G-P 13QJip 4-JO to-pG • HO acn •rH•rH 0p QJto P& O i0 <pu O
in
qji—i-QfOE-»

they are more than an order of magnitude smaller than compared to the o.h.t.c. obtained for evaporating deionized water in the sample tray under vacuum. This may have partly resulted from poor contact between the heated plate and the conveyor band for the experiments performed by Kumazawa et al.
From Table 5.1 the drying experiments performed using precipitated soya protein at the lowest vacuum level are well described by Equation 5.7 considering the errors involved in using an o.h.t.c. determined by evaporating water in the absence of protein. As the absolute pressure was reduced the model considerably over-estimated the actual drying rate. Obviously the o.h.t.c. determined for deionized water cannot be employed and a different drying mechanism exists. At low pressures, or high vacuum levels, the expanded protein concentrate has a greater surface area available for drying accompanied by a smaller area for heat transfer by conduction. In addition, the drying product often formed a thin, approximately 0.05 mm, crystalline layer adjacent to the tray surface which would reduce the o.h.t.c. Thus, it appears that the o.h.t.c. depends on the vacuum level employed, and a prediction for the drying time would necessitate independent experimental determination of the o.h.t.c. in the presence of protein. Heat transfer by radiation may also be expected to have a significant effect on the drying process at high vacuum levels (Kumazawa et al., 1980). Heat transfer by radiation from the tray surface may be evaluated using Equation 5.19 which is given as follows:
Qr " Ah ep kB <Tpl4 - Tf4 ) <5-19>
where A^ is the area available for heat transfer, ep is the emissivity of the protein concentrate (assumed to be 0.5) and kB is the Stefan-Boltzmann constant. The temperatures of the heated plate and the product are absolute temperatures, expressed in the unit of| Kelvin. The amount of heat transferred by radiation was estimated to be typically less than 5 % of the total heat supplied for
evaporation. Therefore, the main heat transfer mechanism is conduction, even at high vacuum levels or low pressures.
The limited time course of the drying experiments meant that not enough experimental data, in terms of drying rate profiles, was available to assess the vacuum contact drying theory presented in Section 5.2 for the falling-rate period. The maximum experimental time course was limited by the lowest speed at which the sample tray could be conveyed across the heating plates.
5.4 Conclusions
Highly viscous, dewatered protein concentrates with a large yield stress and shear modulus were required for vacuum drying to prevent excessive expansion of the product at reduced pressures, even at relatively low vacuum levels of 62.5 kPa. Characterization of the shear rheology of these materials was difficult when using standard rheometric techniques, such as cone-and-plate viscometry, and the interpretation of the results was complicated by thixotropy, where the apparent viscosity is a time dependent variable.
The thermal inactivation of the enzyme glucose oxidase, under non-drying conditions, consisted of two, or possibly more, first-order inactivation reactions, each with a different rate constant. There was little effect of pH on the thermal stability of glucose oxidase. However, in the presence of dewatered soya protein, prepared from isolated soya protein, the thermal stability increased significantly, increasing the temperature at which a large amount of enzyme inactivation over a period of 0.5 h was first observed by approximately 10 °C.
Under relatively high vacuum levels, < 25 kPa, it was possible to dry glucose oxidase, in the presence of soya protein, with little or no loss of activity. At lower vacuum levels, > 25 kPa, significant amounts of enzyme inactivation were measured, and the extent of inactivation depended on the pressure and heating temperatures employed. Reducing the initial moisture content of the feed material reduced the extent of inactivation but increased the total drying time to low moisture levels. The extent of enzyme
inactivation could be determined from the drying time and the temperature of the product measured adjacent to the heated tray surface.
A simple vacuum contact drying model, which included a value of the o.h.t.c. evaluated for the vacuum drying of water, could be used to predict the drying rate at low vacuum levels for the constant-rate period. With increasing vacuum level the drying rate increased, although the apparent o.h.t.c. decreased, and the drying rate could not be predicted using the o.h.t.c. determined for water.
5.5 Recommendations for further work
The relationship between the rheological characteristics, such as apparent viscosity, yield stress and shear modulus, and the expansion of material under reduced pressure and heating should be examined for dewatered precipitated protein suspensions. This would enable the dewatering operation to be designed and operated to produce a feed material for vacuum drying which yielded the desired degree of expansion under reduced pressure. The rheology of the highly dewatered precipitated soya protein suspensions was particuarly sensitive to small changes in the water content, and hence the rheological characteristics may be employed to more closely define the desired feed material for drying. The effect of the depth of product on the drying rate should be assessed in order to determine whether drying thin layers of material quickly at high temperatures would be more desirable than drying thick layers of material more slowly at lower heating temperatures. Similarly, the effect of heating the exposed face of the product by radiation in order to increase the drying rate, especially if the material is highly expanded, should be investigated.

6 Process Design for Membrane Filtrationand Vacuum Drying of precipitated ProteinSuspensions
6.1 Introduction
The main objective of this thesis was to examine the application of membrane filtration and vacuum drying for producing an active, dry protein or enzyme product. In Chapters 4 and 5 some empirical relationships between the physical properties of precipitated soya protein suspensions and the performance of the dewatering and drying unit operations were established. Using these relationships this final chapter proposes a basis for the integrated process design for the optimization of these two unit operations, with particular reference to the operating costs for different membrane configurations.
Integration is of particular importance in identifying the protein concentration at which dewatering should terminate and drying be initiated. It was noted in Chapter 5 that the vacuum drying operation requires a highly viscous protein feed material to prevent excessive expansion under vacuum and to enhance the drying rate, especially during the latter drying stages. In the latter drying drying stages, or falling-rate period, the drying rate depends on the product depth to the power-squared (Equation 5.12), and hence a highly expanded product with a subsequently large product depth will be slow to dry in this period. At an industrial scale, vacuum evaporation is often employed prior to vacuum drying to attain the desired feed concentration. This additional operation may be omitted either by designing the membrane filtration operation to produce a more highly concentrated viscous material, or by reducing the vacuum level during drying to minimize expansion and increasing the size of the drier to accept a more dilute feed material. The precipitated protein concentrates produced by short length - large diameter hollow-fibre membranes, typically 0.3 m in length and 2.0 mm in diameter, may be successfully vacuum dried using moderate vacuum levels ( > 10 kPa(abs)). Higher feed concentrations would enable higher vacuum levels ( < 10 kPa(abs)) to be
employed, and thereby achieve faster drying rates and reduce the size of the drier required.
Although the final decision on the dewatered product - vacuum drier feed concentration will be an economic one, it is subject to the physical limitations of the dewatering and drying equipment to be employed and, where possible, this is discussed in the text. Overall, suitable specification of the membrane filtration equipment will ensure that the potentially expensive additional step of vacuum evaporation will become redundant.
To assess the economic viability of the unit operations, estimates of the capital investment and operating costs are required. The estimation of these costs will depend on many factors which vary according to the scale of operation and the product to be processed. For instance, larger production volumes may enable the introduction of energy saving designs, such as low-grade heat recovery from the vacuum raising pumps on the vacuum drier, or continuous operation may reduce labour costs and enable easier control and a high degree of automation. However, this chapter shall only be concerned with optimizing the operating conditions in order to reduce the size of the equipment and the process energy requirements.
6.2 Results and discussion
For the purpose of illustration it is proposed to dewater 10 m^ per day of a 5 % w/w total solids precipitated soya protein suspension. As the quantity of feed is relatively small, a batch system would be appropriate for membrane filtration whereas a continuous feed system from a holding tank is to be employed for vacuum drying. The problem now remains to determine the dewatered product concentration, membrane filter dimensions, membrane area, temperature and pressure, retentate recirculation rates and the vacuum drier capacity and energy consumption.

6.2.1 Membrane filtration
6.2.1.1 Process and equipment design
During membrane filtration higher permeate flux rates and lower retentate viscosities are obtained at higher temperatures. Consequently, high temperature operation is very desirable. Similarly, for proteins and enzymes the operating temperature should be above 50 °C, or below 4 °C, to inhibit unwanted microbial growth or product damage due to reactions with proteases. To retain a more general approach to the analysis, the process design example presented here shall only refer to membrane filtration at 25 °C, since high temperature operation is system specific and is subject to thermal damage of particuarly heat labile proteins and enzymes, and may be subject to membrane damage. For example, the modacryl polymer (XM) type membranes (manufactured by Romicon Inc., Woburn, Mass., USA) have a recommended maximum operating temperature of 45 °C.Operating at higher temperatures would reduce the life expectancy of such membranes. The effect of using higher temperatures on the permeate flux rate for precipitated soya protein suspensions has been previously examined by Devereux et al. (1986b) where higher operating temperatures were observed to yield higher permeate flux rates.
Highly concentrated retentates are often processed using large diameter tubular membranes. Unfortunately, to minimize membrane polarization effects, tubular membrane modules require high recirculation flow rates. This subsequently incurs high pumping costs, especially for viscous materials which,in turbulent flow, exhibit large pressure drops in the membrane channels and in the pipe-work associated with the membrane cartridges. Conversely, hollow- fibre membranes and other thin channel membrane configurations exhibit comparatively low recirculation costs, and are more suited to concentrating dilute feed streams where large quantities of material may have to be processed. Although thin membrane channels are prone to blockage by lumps of material and other large foreign particles this should not be a problem for protein or enzyme

feed suspensions which would have already undergone several purification steps. Thus, the tendency is to use thin channel membranes.
The diameters of hollow-fibre membranes are typically of the order 0.5 to 1 mm but for the experimental work larger diameters up to 2.7 mm were available which enabled high retentate concentrations to be produced, suitable for feeding to a vacuum drier operated at relatively high vacuum levels. For precipitated soya protein these concentrations were of the order of 33 % w/w total solids. Hollow-fibre diameters less than 1.9 mm could not process the protein suspensions to a sufficient solids content, or viscosity, since high transcartridge pressure drops limited the retentate flow rate which led to flow stagnation and fibre blockage even for the short length, 0.315 m, fibres. Flow stagnation will be most pronounced in the cartridge header where the pipe-work expands to join on to the membrane cartridge. Although comparatively high membrane shear rates were observed in the small diameter hollow-fibres, the corresponding shear rates in the associated pipe-work and cartridge header were several orders of magnitude smaller.To prevent flow stagnation low shear rates should be avoided, particuarly in view of the shear thinning pseudoplastic behaviour and large yield stresses exhibited by concentrated precipitated protein suspensions.
Figure 6.1 shows the predicted performance of a PM50 hollow-fibre type membrane for dewatering precipitated soya protein. The assumed hollow-fibre length and diameter were respectively 0.315 m and 1.9 mm and the hollow-fibres were operated at the maximum inlet pressure of 172 kPa. The transcartridge pressure drop was assumed to equal the cross- flow pressure drop', and was evaluated using rheological data interpolated from Figure 4.13 and the following expression for the shear rate at the membrane surface:
Yw (4.38)
The application of this method for estimating the transcartridge pressure drop, and hence the length-averaged

3000
2000
1000
CO
C NICO
V OIo
<U4-JcduxPr-HU-\<D4->cd0)eu<p04
<0-05
150
4
3 100
2□ -
0
Total solids w/w
Figure 6.1 Predicted membrane shear rate, permeate flux rate and operating pressures during membrane filtration of a precipitated soya protein suspension.
Operating temperature, 25 °C; membrane type, PM50? hollow- fibre length, 0.315 m, inner diameter, 1.9 mm. Cartridge inlet pressure, 172 kPa. 0 r membrane shear rate. □ ,permeate flux rate. O , length-averaged transmembrane pressure drop. • , transcartridge or cross-flow pressuredrop .
transmembrane pressure drop, and the derivation of Equation 4.38, has already been assessed in Section 4.3.2.2.
To minimize the membrane area required, the permeate flux rate was maximized by operating in the pre-gel polarized region, and to minimize the recirculation costs, the retentate flow rate, and the corresponding membrane shear rate, was adjusted to the critical value at the transition point between the pre-gel- and gel-polarized regions. Using the membrane filtration data presented in Figure 4.23a the permeate flux rate, J, may be expressed empirically in terms of the critical membrane shear rate,Yw ', as follows:
J = 1.89 xlO-8 (Yw ')°*69 (6.1)
The permeate flux rate is expressed in m8 m” s--*-, and the membrane shear rate in s” -. in the pre-gel polarized region the permeate flux rate was also dependent on the length- averaged transmembrane pressure drop and, from Figure 4.23a, may be also expressed empirically as:
J = 2.14 xlO'11 APtm (6.2)
The transmembrane pressure drop is expressed in N m- . Equations 6.1 and 6.2 are valid over the range of membrane shear rates from 400 to 3000 s”1, and the range of transmembrane pressure drops from 1 xlO8 to 2 xlO8 N m” . Outside these ranges the application of Equations 6.1 and6.2 has not been assessed experimentally. The permeate flux rate given by Equation 6.2 represents the maximum flux rate, with all the membrane surface operated under pre-gel polarized conditions, whereas the flux rate determined at the transition point, using Equation 6.1, was slightly lower. This was derived from using the length-averaged transmembrane pressure drop instead of a summation of the local transmembrane pressure drops along the hollow-fibre length. At the transition point suggested by the extrapolated intersection of the gel- and pre-gel polarized regions in Figure 4.23a the membrane is already partially

gel-polarized at the hollow-fibre inlet where the local transmembrane pressure drop is greater than the length- averaged value. This is shown diagrammatically in Figure 6.2 where the economic analysis presented here is based on operating line A. If operating line B were adopted, higher permeate flux rates would be attained but at the expense of requiring higher membrane shear rates, and hence higher retentate flow rates. However, the difference in the magnitude of the flux rate determined from Equations 6.1 and 6.2 was small, especially for relatively dilute protein concentrations where the transcartridge pressure drop was also small, and may be ignored.
Combining Equations 6.1 and 6.2 gives the critical shear rate at the membrane surface as follows:
Yw ' = 5.4 XlO-5 (APt m )1<45 (6.3)
Equations 4.38 and 6.3 were solved for the outlet cartridge pressure, assuming an inlet pressure of 172 kPa, to yield the minimum cross-flow pressure drop, and hence maximize the length-averaged transmembrane pressure drop at Yw '. The permeate flux rate is then given by Equation 6.2 and the membrane shear rate by Equation 4.38 or 6.1.Figure 6.1 shows how these predicted operating parameters typically vary during membrane filtration.
If higher shear rates were employed, by increasing the cross-flow pressure drop, then the transmembrane pressure drop, and subsequently the flux rate, diminishes.Similarly, if the shear rate is maintained lower than the critical value the membrane becomes gel-polarized and the flux rate decreases according to Equation 6.1.
It can be seen in Figure 6.1 that the maximum flux rate, given by the open square symbols, is fairly constant up to 20 % w/w total solids, then rapidly declines as the retentate becomes increasingly more viscous with each successive membrane pass. Eventually the outlet cartridge pressure is adjusted to zero, assuming no back-pressure exists due to low flow rates in the retentate return line, and the cross-flow pressure drop is maintained constant at 172 kPa by reducing the retentate flow rate through the

w0)-UcduX3i—I M-l<D4Jcda)6Wl<v
Figure 6.2 Diagrammatic representation of the log-log relationship between the permeate flux rate and the membrane shear rate at different transmembrane pressure drops.
Length-averaged transmembrane pressure drop, (/\PTM)'*' >(APipyj) > ( Ap tm)3 • Critical membrane shear rate, Yw ": Opoints of extrapolated intersection between pre-gel- and gel-polarized regions, operating line A; 0 / points ofonset of gel-polarization, operating line B.
A /
(Afjm)
Membrane shear rate Y
hollow-fibres. Thus, the transmembrane pressure drop is also maintained constant. At this point the membrane is gel- polarized. To remove the polarizing layer and increase the flux rate would necessitate raising the maximum inlet pressure so as to achieve a higher membrane shear rate.
The predicted effects on the permeate flux rate of varying the hollow-fibre diameter and length are shown in Figures 6.3 and 6.4. The flux rates were evaluated using the same procedure employed to determine the data in Figure 6.1. At low precipitated protein concentrations reducing the fibre length or increasing the fibre diameter increases the flux rate negligibly. This is derived from the low apparent viscosity of the dilute suspensions, and hence the low transcartridge pressure drop or high transmembrane pressure drop. For instance, although increasing the fibre length by a factor of 2 will similarly increase the transcartridge pressure drop by a factor of 2, the magnitude of the transcartridge pressure drop compared to the transmembrane pressure drop is still small, as shown by the example in Figure 6.1. As the total solids content of the retentate increases beyond 20 % w/w the apparent viscosity increases significantly and the transcartridge pressure drop for the small diameter - long length hollow- fibres cannot be maintained at a low level. Thus, the transmembrane pressure drop and the permeate flux rate decreases. However, from Figures 6.3 and 6.4 it can be seen that the flux rate at high concentrations is improved by increasing the fibre diameter or by reducing the fibre length, in addition, as expected from Equation 4.38, increasing the fibre diameter or reducing the fibre length by the same magnitude will have the same effect on -the flux rate.
Fell et al. (1986) suggested that the optimum design for the expensive thin channel membrane configurations required high percentage recoveries of permeate per membrane pass in excess of 25 % to achieve the lowest permeate removal costs. Thus, the optimum design would require an approach towards maximizing the ratio of permeate to retentate flow rate. Using the data in Figure 6.1, the time required to dewater to any protein concentration may be
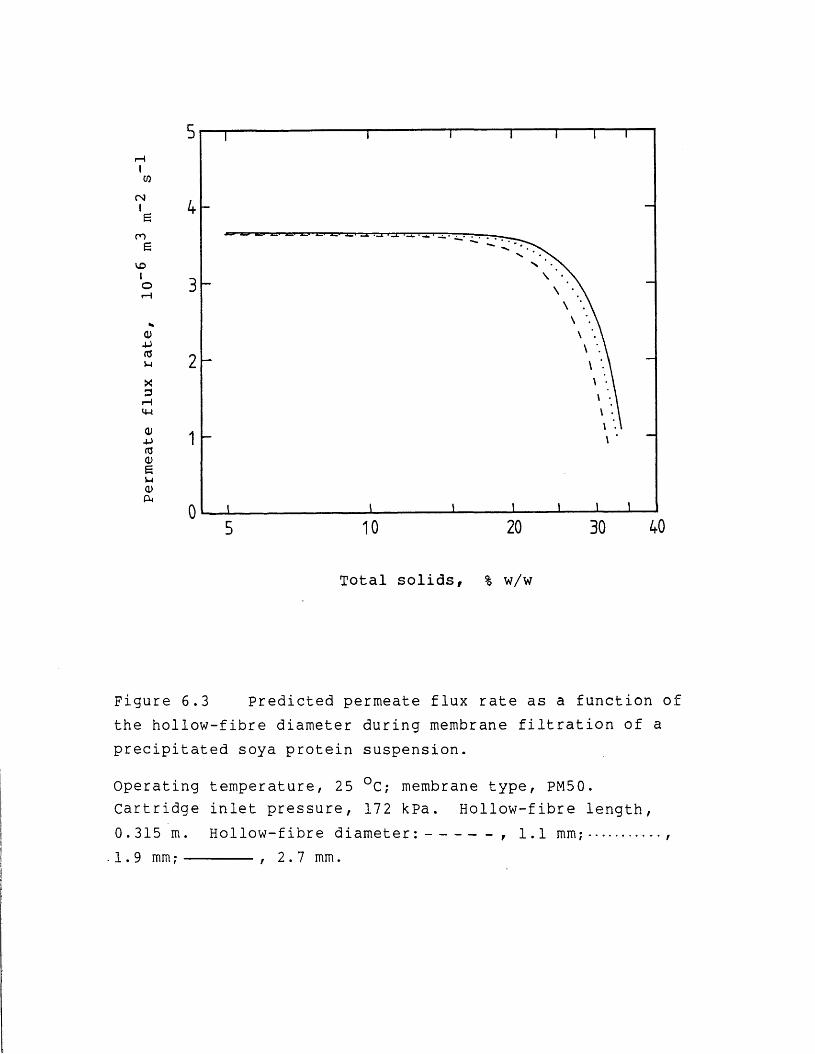
Total solids, % w/w
Figure 6.3 Predicted permeate flux rate as a function of the hollow-fibre diameter during membrane filtration of a precipitated soya protein suspension.
Operating temperature, 25 °C; membrane type, PM50.Cartridge inlet pressure, 172 kPa. Hollow-fibre length, 0.315 m. Hollow-fibre diameter:-------- , 1.1 mm;........ ,

Total solids
Figure 6.4 Predicted permeate flux rate as a function of the hollow-fibre length during membrane filtration of precipitated soya protein suspensions.
Operating temperature, 25 °C; membrane type, PM50.Cartridge inlet pressure, 172 kPa. Hollow-fibre diameter,2.7 mm. Hollow-fibre length:-------- , 0.315 m?......... ,0.635 m ;-------- , 1.00 m.
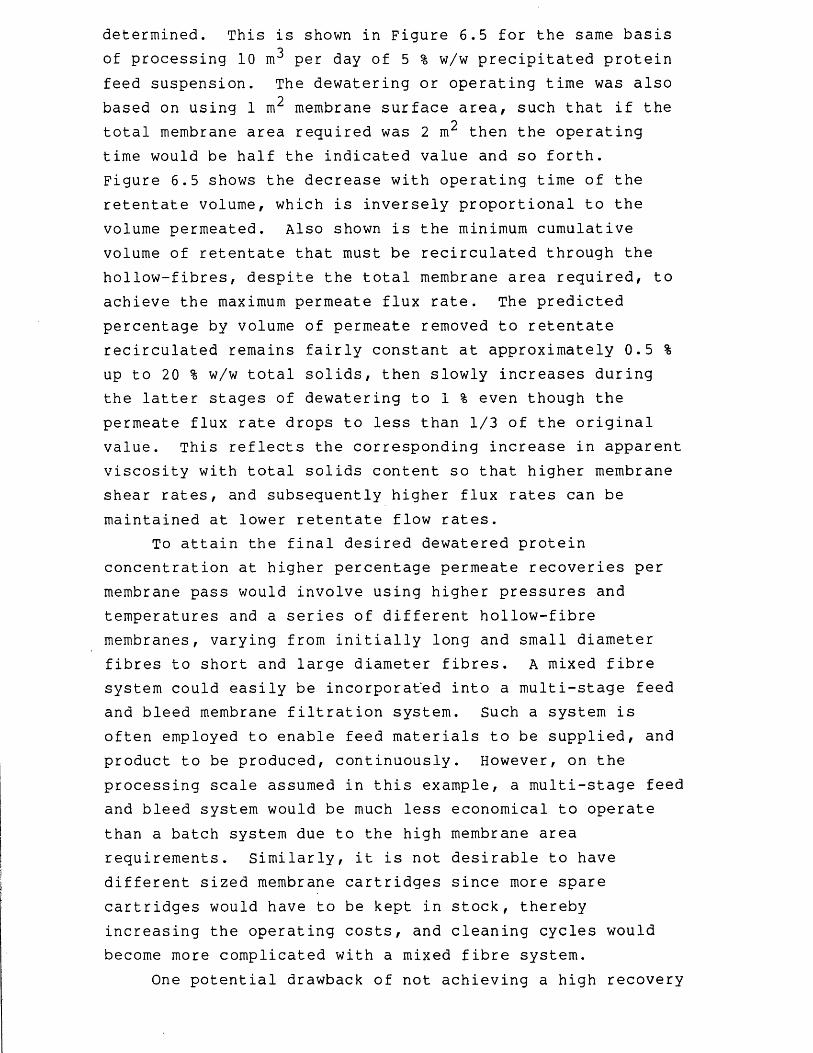
determined. This is shown in Figure 6.5 for the same basis of processing 10 m3 per day of 5 % w/w precipitated protein feed suspension. The dewatering or operating time was also based on using 1 m membrane surface area, such that if the total membrane area required was 2 m then the operating time would be half the indicated value and so forth.Figure 6.5 shows the decrease with operating time of the retentate volume, which is inversely proportional to the volume permeated. Also shown is the minimum cumulative volume of retentate that must be recirculated through the hollow-fibres, despite the total membrane area required, to achieve the maximum permeate flux rate. The predicted percentage by volume of permeate removed to retentate recirculated remains fairly constant at approximately 0.5 % up to 20 % w/w total solids, then slowly increases during the latter stages of dewatering to 1 % even though the permeate flux rate drops to less than 1/3 of the original value. This reflects the corresponding increase in apparent viscosity with total solids content so that higher membrane shear rates, and subsequently higher flux rates can be maintained at lower retentate flow rates.
To attain the final desired dewatered protein concentration at higher percentage permeate recoveries per membrane pass would involve using higher pressures and temperatures and a series of different hollow-fibre membranes, varying from initially long and small diameter fibres to short and large diameter fibres. A mixed fibre system could easily be incorporated into a multi-stage feed and bleed membrane filtration system. Such a system is often employed to enable feed materials to be supplied, and product to be produced, continuously. However, on the processing scale assumed in this example, a multi-stage feed and bleed system would be much less economical to operate than a batch system due to the high membrane area requirements. Similarly, it is not desirable to have different sized membrane cartridges since more spare cartridges would have to be kept in stock, thereby increasing the operating costs, and cleaning cycles would become more complicated with a mixed fibre system.
One potential drawback of not achieving a high recovery
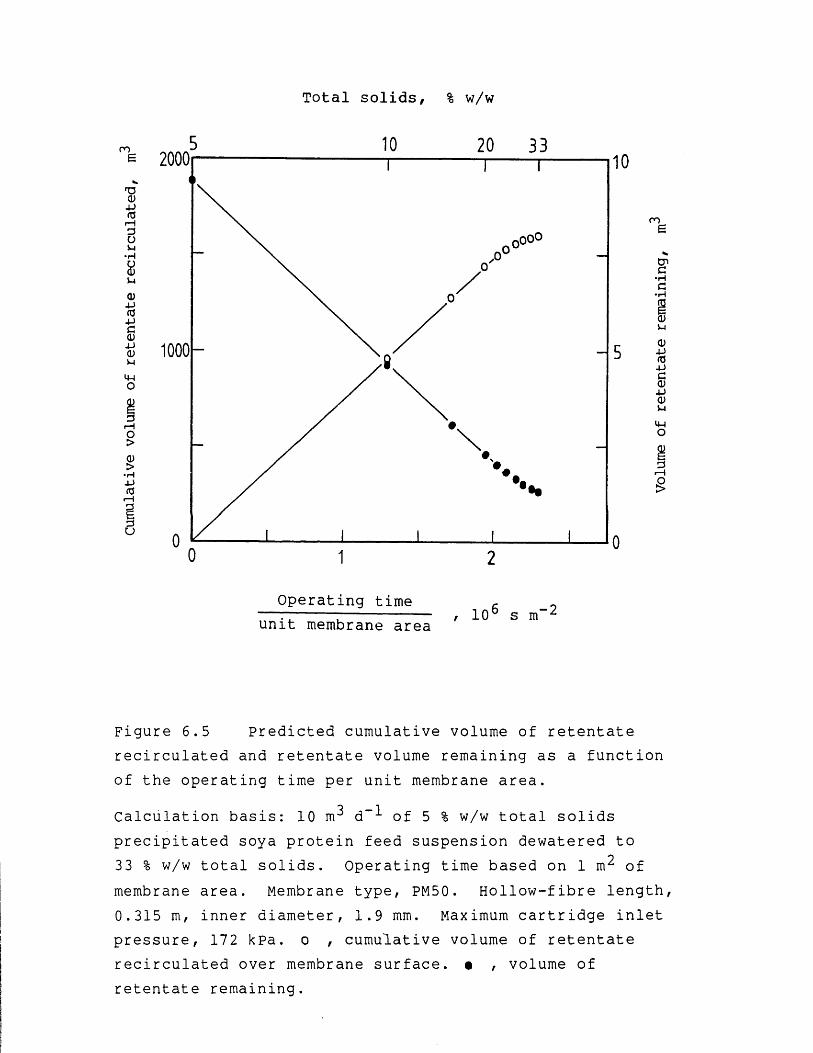
Total solids, % w/w
au•rHo0U04->(04->C04->0U44O
1000
r Ho>>• H4->asr— I
su
10
ro
CPC• HG
004Jflj4-)C04->0U44O
§
Operating time unit membrane area , 10 s m“^
Figure 6.5 Predicted cumulative volume of retentate recirculated and retentate volume remaining as a function of the operating time per unit membrane area.
Calculation basis: 10 m^ d” of 5 % w/w total solids precipitated soya protein feed suspension dewatered to 33 % w/w total solids. Operating time based on 1 m^ of membrane area. Membrane type, PM50. Hollow-fibre length, 0.315 m, inner diameter, 1.9 mm. Maximum cartridge inlet pressure, 172 kpa. o , cumulative volume of retentate recirculated over membrane surface. • , volume ofretentate remaining.

per membrane pass is the increase in protein aggregate disruption which varies according to the time of exposure and the mechanical shear conditions experienced within the recirculation pump (Hoare et al., 1982). Increasing the number of passes through the recirculation pump may further increase particle disruption to reduce the particle size, which has previously been shown by Devereux et al. (1986a) to affect adversely the flux rate for precipitated protein suspensions. For the 1.9 mm diameter and 0.315 m long membrane fibres approximately 300 to 400 passes through the recirculation pump were predicted to occur to dewater the precipitated soya protein suspensions to the high concentrations indicated in Figure 6.1. Increasing the hollow-fibre diameter or reducing the fibre length will increase the retentate flow rate and the number of passes through the pump. However, after 400 passes through a positive displacement mono screw pump there is little further reduction in particle size (Hoare et al., 1982). Therefore, for the system under consideration here, adopting larger diameter - shorter length hollow-fibres would be expected to increase only slightly particle disruption.
6.2.1.2 Operating costs
The operating or running costs for membrane filtration may be determined using such data as shown in Figures 6.1 and 6.5. This has been done for a range of PM50 type hollow- fibre membrane dimensions. The predicted annual operating costs are shown in Figure 6.6. The final dewatered concentration is taken as 33 % w/w total solids which corresponds to an approximate 6.5 fold concentration of the 5 % w/w total solids protein feed material. The annual operating cost includes the recirculation or pumping cost and the replacement cost of the membranes, which are assumed to be replaced at a cost of £400 m“2 once every year, regardless of the total processing time. This is an oversimplification of a real membrane filtration process since employing higher operating pressures would be expected to shorten the membrane life. Similarly, the cost of the membrane cartridges per m2 of membrane surface area would

Annual
cost,
£(10
000)
Operating time, 10 s
Figure 6.6 Influence of hollow-fibre dimensions and cartridge inlet pressure on the predicted annual operating costs for the membrane filtration of a precipitated soya protein suspension.
Calculation basis: see Figure 6.5. Operating temperature,25 °C; membrane type, PM50. Temperature, 25 °C. Cartridgeinlet pressure, hollow-fibre length and diameter:-------- ,276 kPa, 0.315 m, 2.7 mm;— — — , 172 kPa, 1.00 m, 5.0 mm; -, 172 kPa, 0.315 m, 2.7 mm;-------- , 27 6 kPa,0.315 m, 1.9 mm;......., 172 kPa, 0.635 m, 2.7 mm;------- , 172 kPa, 0.315 m,. 1.9 mm;— ------, 172 kPa,0.315 m, 1.9 mm (data obtained by operating at a cross-flowpressure drop of 7 kPa up to 17.5 % w/w total solids and at172 kPa thereafter).
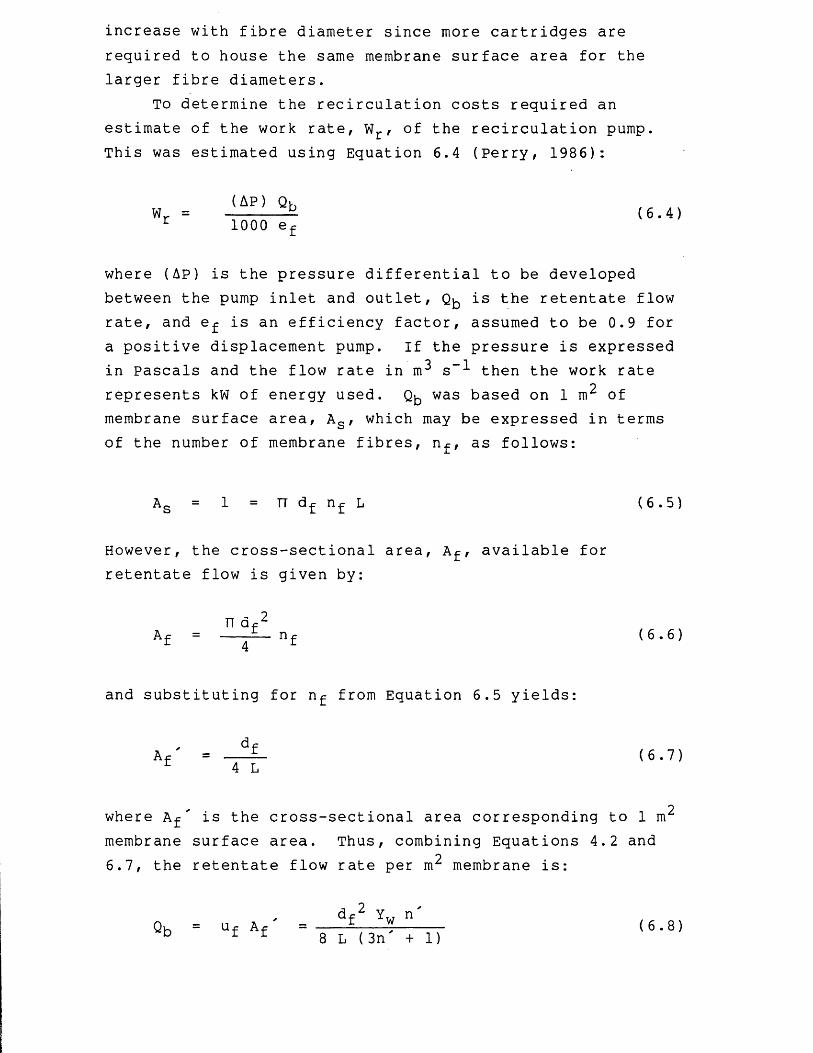
increase with fibre diameter since more cartridges are required to house the same membrane surface area for the larger fibre diameters.
To determine the recirculation costs required an estimate of the work rate, wr , of the recirculation pump. This was estimated using Equation 6.4 (Perry, 1986):
AP QhWr = ------— (6.4)r 1000 ef
where (AP) is the pressure differential to be developed between the pump inlet and outlet, Qb is the retentate flow rate, and e^ is an efficiency factor, assumed to be 0.9 for a positive displacement pump. If the pressure is expressed in Pascals and the flow rate in m2 s~^ then the work rate represents kW of energy used. Qb was based on 1 m2 of membrane surface area, As , which may be expressed in terms of the number of membrane fibres, nf, as follows:
As = 1 = TT df nf L (6.5)
However, the cross-sectional area, Af, available for retentate flow is given by:
n df 2A f = ----- n f (6.6)r 4 £
and substituting for n^ from Equation 6.5 yields:
dfa _ - I i a i \
where A f ' is the cross-sectional area corresponding to 1 m membrane surface area. Thus, combining Equations 4.2 and 6.7, the retentate flow rate per m^ membrane is:

Assuming (see Table 6.1): electricity at 7 p kw- h“l; 20 h d and; 250 d year--*- operation, then the annual recirculation costs, c, are given as follows:
0.07C = Wr t ---- 250 ( 6 . 9)r 3600
9where t is the operating time based on 1 irr membrane surface area.
The annual recirculation cost is independent of the membrane area used since, say, for 2 m^ of membrane area the retentate flow rate will equal 2Qb , the operating time per9m , t, will be halved and the recirculation cost calculated from Equation 6.9 will remain unaltered. The value of Qb is taken as the initial maximum value, assuming lower recirculation rates through the membrane cartridges during the latter dewatering stages will be achieved using recycle rather than variable speed pumping. Typically, a variable speed pump would save about 5 % of the recirculation costs for a 1.9 mm diameter, 0.315 m long hollow-fibres operated from 5 to 33 % w/w total solids.
At a fixed inlet pressure Figure 6.5 and Table 6.2 demonstrate that the small diameter - long length hollow- fibres yield the lowest operating costs for a 20 h (7.2 xlO4 s) batch operation. If a shorter operating time or greater membrane area were required then the larger diameter - shorter length membranes may become more economical to operate since higher flux rates can be maintained without exceeding the maximum inlet pressure (see Figures 6.3 and 6.4). In addition, the small diameter - long length fibres operate at lower retentate flow rates and are more prone to fibre blockage and flow stagnation in the pipe-work, and practically, rather than economically, larger diameter - shorter length fibres may be preferred.
A more intrinsic advantage of using longer membrane channels derives from the effective membrane area lost at the mountings at either end of the membrane cartridge.Thus, a longer membrane cartridge will have a greater effective area per unit length and, moreover, per m^ membrane surface area longer membrane cartridges are cheaper

Table 6.1 Assumptions for economic assessment
Parameters
Precipitated soya protein feed concentration
Throughput of feed
Process duty
Electricity cost
Steam cost (6 bar, gauge)
Membrane filtration:
membrane type and configuration
flow hydrodynamics
membrane cost
membrane life
recirculation pump and efficiency factor
temperature of operation
Vacuum drying:
equipment
throughput
Assumptions
5 % w/w total solids
10 m 3 d*"1
20 h d""1, 250 d year”1 7.0 p kW-1 h”11.6 p kg-1
batch process
PM50, hollow-fibre
laminar_ o *£400 m *
1 yearpositive displacement, 0.9
25 °C
continuous process
continuous band vacuum drier
_ i * *500 kg d dry product
Based on Romicon (Romicon Inc., 100 Cummings Park,
Woburn, MA 01801, U.S.A.) hollow-fibre PM50 type
membrane, approximate cost in 1988★ k Assumes negligible protein loss in permeate

to manufacture.The operating cost has also been predicted for a 5 mm
diameter PM50 type membrane which would normally be classified as a small diameter tubular membrane rather than a hollow-fibre type membrane. The indicated cost may be an underestimate since the retentate flow was turbulent during the initial stages which would lead to a higher transcartridge pressure drop than predicted by Equation 4.38, and thereby a lower transmembrane pressure drop and permeate flux rate. Similarly, the application of the permeate flux rate data has not been assessed for a turbulent flow system.
Not operating at the critical membrane shear rate could be a costly mistake. This is demonstrated in Figure 6.6 and by the first and last entries in Table 6.2. Here the predicted operating costs are compared for a 1.9 mm diameter, 0.315 m length PM50 type membrane operated at: (i) the critical membrane shear rate, and; (ii) a cross-flow pressure drop of 7 kPa up to 17.5 % w/w total solids, and thereafter at 172 kPa. The latter case refers to a set of nominal operating conditions which were chosen to represent how the filtration process might be operated as an industrial process. In the initial dewatering stages the retentate flow velocity is 1.9 m s”1, which is not unrealistic for hollow-fibre membrane filtration, but the corresponding membrane shear rate is much greater than the critical value. Therefore, the dewatering operation is being run inefficiently and a lower transcartridge pressure drop should be employed.
Equation 4.38 and Figures 6.3 and 6.4 demonstrate that increasing the hollow-fibre diameter or reducing the fibre length by the same magnitude will have the same effect on the flux rate. However, from the optimum economic operating view-point, Equation 6.8 and Figure 6.6 demonstrate that the hollow-fibre dimensions should be varied according to the ratio (df )/L. For instance, if the fibre diameter - fibre length combination of 2.7 mm - 0.635 m could not be used to attain the desired final concentration then the fibre length should be reduced, say, by a factor of 2, rather than the fibre diameter increased by a factor of 2, which would

Cartridge
inlet
Hollow-fibre dimensions
Operating
Initial
recirculation
Annual
cnc•rH- P<05-4&o
0 3
0 3
CO4->COOU
O O O O i—I
GO•rH U4-3co *. -— »r H He o3 CO ou 4-) o5-4 CO 1— 1•rH o uiu U -_cu5-1
S-l<vC M04->CO5-4
8 I—I <44
5-1004•rH
05-13 CO CO 0 5-404
O<u COa " e54jQ POcu 'oe i—i
<4-1<3
CO
U04->0•rHTS
XJ4->CDGCD
nlo
<ucn3cOcnroCm
O l O C O t ^ O l ^ H V O t N
0 3
^oo3oi<ocNiriro^o>i H c o r o r H i o r o r o i o c o
^cooior-ooo-t'"r^^ir>0'0>voir)cr>coO <— I i— I O 0 3 i— I i— I 0 3 0 3
0 5 r o C O C O i— 1 C N r o 140 r -c o CN C N r o r o r o i no . . • . • . . . .r— 1 CM ■— I C N CN i— 1 C N C N i— 1 C N
C T i C T i O O O O O O C T i
i— I i— I CN CN IN in CN CN i— 1
in L O m in i n i n i n i n■— i i— i i— i r o <— i o i— i i— i •— ir o r o r o C O r o o r o r o r o• • . . . . . . •o o o o o 1— 1 o o o
C N C O C N C N C O C N CN C O CNP - p ~ p - P " p " P ~ P - p - P -r— 1 C N i— i i— 1 C N i— 1 i— 1 C N i— 1
O04-3 CO u8i—I<44GO•r44JCOi—I3U5-1 •rHocu5-1CO•rH4->•rHG•rHGOTOCUCOCOCQ
COOi—IX03r~
o03
COCO(0<C3GCOCO4-3COooGO•rH4-3 CO r H 3 U5-1 •rHocu5-1TDC(044G(UOCOrH04CU5-1a>ccoV-l
COcu3i—HuG-i— Ir—co<UGcococococu5-43cn•rH6-Ieo5-4Cz-4
CO COrO•rH •rHi— l f— 1o oCO COi— 1 1— 1CO CO4-3 4-3O o4-3 4-3£ \£<*> <##>ro i n
SZ ro r oo4-» O OCO 4-3 4->- Q cn c n5-i G G8.
-1— i 5-1 •rH54CU 0CU 4-3 4-3e CO (U• H ?4-3 0 0TJ T JCnG G C• H O O4-3CO TJ ' O5-1 0 0&
CO COO CQ CQ
CO JZ Table
6.2
Predicted
annual operating
costs
for the membrane filtration of
precipitated soy
a protein
suspensions

achieve the same effect but would double the recirculation costs.
Increasing the maximum cartridge inlet pressure from 172 kPa to 276 kPa as shown in Figure 6.6 for the short length, 0.315 m, 1.9 and 2.7 mm diameter hollow-fibres, is predicted to considerably reduce the annual operating costs. In this example, using the higher inlet pressure yields a 25 % saving in the annual operating costs for the 1.9 mm diameter hollow-fibres operated over a 20 h batch time.Thus, ceramic membranes, which may be fabricated to similar channel dimensions and can withstand operating pressures up to 700 kPa, appear economically very attractive. Unfortunately, it is not possible to assess the economic potential of operating at cartridge inlet pressures higher than 276 kPa using this analysis since the retentate flow is predicted to become turbulent in the initial stages of dewatering and, as mentioned earlier, this analysis is only valid for laminar flow. Note that operating at a higher inlet pressure enables a higher transmembrane pressure drop, and hence a higher permeate flux rate, to be maintained. However, to operate the filtration process at a higher flux rate and, as this analysis requires, at the critical membrane shear rate, requires a higher transcartridge pressure drop. Eventually, upon increasing the transcartridge pressure drop to attain the critical membrane shear rate for very high flux rates, the retentate flow rate in the hollow-fibres becomes turbulent. The log-log relationship between the permeate flux rate and the critical membrane shear rate is shown in Figure 4.23a.
Larger hollow-fibre diameters and higher cartridge inlet pressures increase the retentate flow rate and eventually the recirculation costs become comparable to the membrane replacement costs. At this point reducing the retentate flow rate at the expense of achieving the maximum flux rate may yield lower operating costs. This often occurs when optimizing tubular membrane systems (Le &Howell, 1985). It is envisaged that if any savings could be realized they would be greatest at low protein concentrations where the permeate flux rate dependence on membrane shear rate is apparently lower (see

Section 4.3.3.3) and the retentate flow rate is high. If the flux rate dependence on shear rate were high then a large drop in flux rate would occur for a correspondingly small change in the retentate flow rate. To optimize the membrane filtration of precipitated proteins by examining the effect of varying the recirculation flow rate, instead of operating at the critical membrane shear rate, would necessitate further experimentation on establishing the shear rate dependence of the permeate flux rate at low protein concentrations.
Dewatering to higher concentrations has to utilize short length - large diameter hollow-fibres, or possibly a mixed fibre system whereby long length - small diameter fibres are used initially followed by short length - large diameter fibres to process the retentate to high concentrations. The mixed fibre system saves on recirculation costs but has a greater membrane area requirement and does not appear financially viable since the membranes are assumed to be replaced once every year rather than according to the actual total processing time per membrane cartridge.
It should be noted that the analysis depends on the unit cost of electricity and the cost of the membrane cartridges which may vary independently. In addition, the analysis has made no provision for protein fouling of the membranes since this process is still poorly understood and is often peculiar to the particular product and membrane used. Protein fouling during the membrane filtration of precipitated soya protein using a PM50 type membrane appeared to reach a constant level after a total of 20 h processing and several washing procedures (see Section 4.3.3.1). The experimental results upon which this analysis was based refer to the permeate flux rate characteristics observed after a total of 30 h processing and several washing procedures.
Another topic which has not been considered previously is the effect on the permeate flux rate of the protein precipitation procedure employed. It has already been noted that larger precipitate particles increase the flux rate and this has been observed for other membrane filtration systems
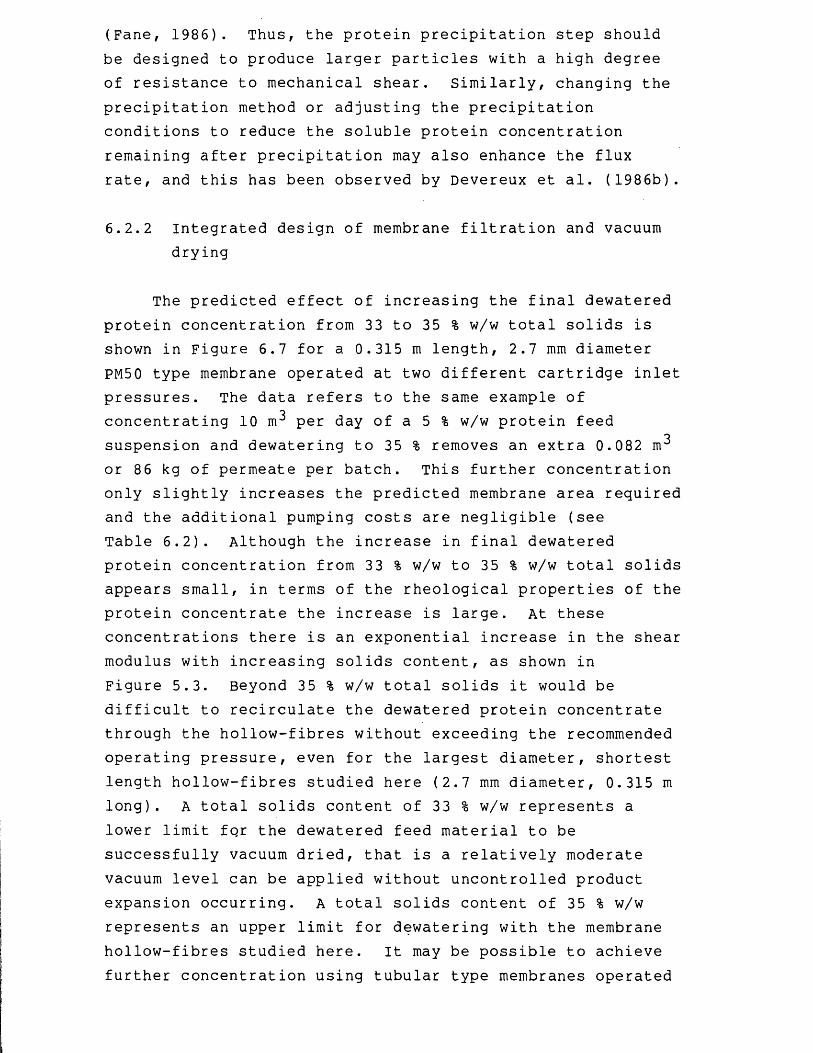
(Fane, 1986). Thus, the protein precipitation step should be designed to produce larger particles with a high degree of resistance to mechanical shear. Similarly, changing the precipitation method or adjusting the precipitation conditions to reduce the soluble protein concentration remaining after precipitation may also enhance the flux rate, and this has been observed by Devereux et al. (1986b).
6.2.2 Integrated design of membrane filtration and vacuum drying
The predicted effect of increasing the final dewatered protein concentration from 33 to 35 % w/w total solids is shown in Figure 6.7 for a 0.315 m length, 2.7 mm diameter PM50 type membrane operated at two different cartridge inlet pressures. The data refers to the same example of concentrating 10 m^ per day of a 5 % w/w protein feed suspension and dewatering to 35 % removes an extra 0.082 mJ or 86 kg of permeate per batch. This further concentration only slightly increases the predicted membrane area required and the additional pumping costs are negligible (see Table 6.2). Although the increase in final dewatered protein concentration from 33 % w/w to 35 % w/w total solids appears small, in terms of the rheological properties of the protein concentrate the increase is large. At these concentrations there is an exponential increase in the shear modulus with increasing solids content, as shown in Figure 5.3. Beyond 35 % w/w total solids it would be difficult to recirculate the dewatered protein concentrate through the hollow-fibres without exceeding the recommended operating pressure, even for the largest diameter, shortest length hollow-fibres studied here (2.7 mm diameter, 0.315 m long). A total solids content of 33 % w/w represents a lower limit fqr the dewatered feed material to be successfully vacuum dried, that is a relatively moderate vacuum level can be applied without uncontrolled product expansion occurring. A total solids content of 35 % w/w represents an upper limit for dewatering with the membrane hollow-fibres studied here. It may be possible to achieve further concentration using tubular type membranes operated
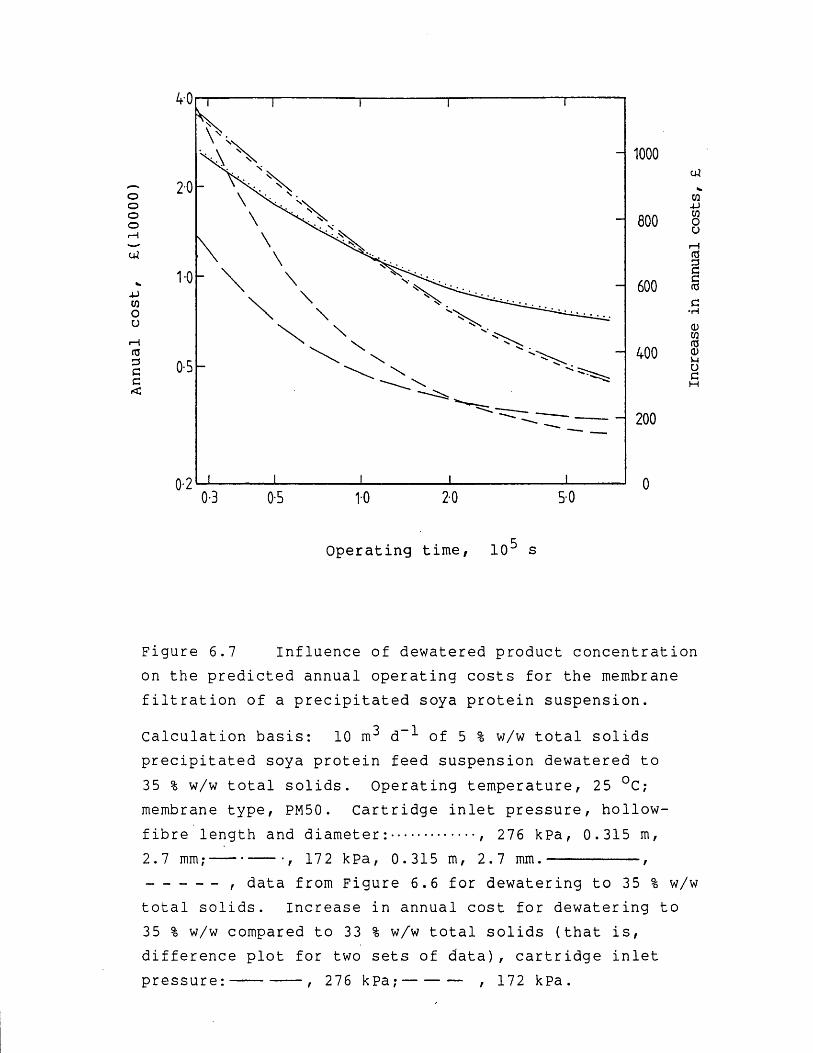
Annual
cost,
£,( 10
000)
40
20
1-0
0-5
0-20-3 0-5 1-0 2-0 50
cOperating time, 10 s
Figure 6.7 Influence of dewatered product concentration on the predicted annual operating costs for the membrane filtration of a precipitated soya protein suspension.
Calculation basis: 10 d” of 5 % w/w total solidsprecipitated soya protein feed suspension dewatered to 35 % w/w total solids. Operating temperature, 25 °C; membrane type, PM50. Cartridge inlet pressure, hollow-fibre length and diameter:......... , 276 kPa, 0.315 m,2.7 mm;--------•, 172 kPa, 0.315 m, 2.7 mm.----------,-------- , data from Figure 6.6 for dewatering to 35 % w/wtotal solids. Increase in annual cost for dewatering to 35 % w/w compared to 33 % w/w total solids (that is, difference plot for two sets of data), cartridge inlet pressure:--------, 276 kPa;------- , 172 kPa.
1000
800
600
400
200
w4->01ourcDccajC•Ha>01(V<Dj-iuc
at higher pressures but this shall not be considered here.Removing additional water during vacuum drying
increases the steam (or electrical) heating costs and the required drier capacity, and hence the equipment costs. Industrial continuous band vacuum driers typically use2.2 kg steam per kg water evaporated (see Chapter 3) and, assuming a value of 1.6 p kg--*- for producing steam, the annual heating costs saved using a 35 % compared to a 33 % w/w total solids feed material will be about £750.From Figure 6.7 it would appear profitable to dewater to higher concentrations since the extra operating cost for dewatering only exceeds £750 for very large membrane areas or short operating times. However, to attain the higher dewatered concentration requires less economic larger diameter and shorter length hollow-fibres and the overall saving for the integrated dewatering and drying operations of employing a higher drier feed concentration would be small. To assess the overall saving in more detail would require more than a preliminary estimation of the equipment costs for vacuum drying which is beyond the scope of this analysis.
Instead of reducing the heating costs it is more important to improve the drying rate. It has previously been noted that a highly viscous dewatered feed product will minimize bed expansion during drying under vacuum (see also Chapter 5). Generally, depending on the particular end-use of the product, vacuum driers are operated to produce dry materials of a certain bulk density, which may be adjusted by varying the vacuum level and the feed concentration. In the absence of product expansion, the fastest drying rates will be obtained at the highest vacuum levels, usually of the order of 3 kpa(abs), since the product temperature decreases, and thereby the temperature difference between the heated plates and the product increases, with vacuum level. In addition to being pumpable, the feed concentration should be adjusted to attain the desired dry bulk density at high vacuum levels rather than seeking an uneconomical compromise by reducing the vacuum level to accept a lower feed concentration. Note that increasing the vacuum level incurs a negligible increase in the power input

and capital cost for raising a vacuum, and the drying chamber is usually, for insurance purposes, overdesigned to withstand more than a complete vacuum.
It is not possible with the experimental data available to examine the effect at high vacuum levels of varying the feed concentration independently of product expansion. However, despite excessive product expansion, increasing the vacuum level from 62.5 to 4.25 kPa(abs) increased the drying rate during the apparent constant-rate period by a factor of 1.25 (see Figure 5.12) which would increase the drier capacity, or reduce the drier size required, and represent a considerable saving in equipment costs. The average temperature difference between the heated plates and the product at the heated tray surface was approximately 10 °C at an operating pressure of 62.5 kPa whereas at 4.25 kPa the temperature difference increased to 40 °C during the constant-rate period. If the feed material had been more concentrated and remained in contact with the tray surface, instead of expanding, the overall heat transfer coefficient would have remained approximately constant and, provided sufficient heat were supplied, increasing the temperature difference from 10 to 40 °C would have improved the drying rate by a factor of 4. Obviously this depends on the drying process not becoming mass transfer controlled. To verify this would require further experimentation.
Apart from increasing the drying rate, operating at high vacuum levels reduces product loss for heat labile proteins and enzymes since drying occurs at lower temperatures. For the enzyme glucose oxidase no inactivation was observed at product drying temperatures less than 50 °C and, in terms of the magnitude of product loss, if a suitably high vacuum level were maintained, no advantage would be gained by dewatering the product to a higher concentration. However, using high heating temperatures may lead to some product damage depending on the thermal stability of the product and the moisture content. During the initial drying stages when the moisture content is high the product is particuarly susceptible to thermal damage and careful attention should be paid to the heating temperatures employed.

In summary, although increasing the concentration of the feed material to the vacuum drier may not represent anoverall saving in the operating costs for the integrateddesign of the dewatering and drying operations, potentially large capital cost savings for the drying equipment may be made by producing a protein concentrate which will not expand significantly at high vacuum levels. The feed concentration required to produce the desired extent of expansion, and hence the bulk density of the dried product, may be established by examining the relationship between the rheological properties of the dewatered material, such as yield stress or shear modulus, and the drying rates at high vacuum levels. The yield stress and shear modulus gives an indication of the resistance to movement from rest of amaterial. The structure of the dewatered proteinconcentrate at rest in the vacuum drying chamber experiences internal forces due to dissolved gases and water vapour expanding. The strength of the structure of the protein concentrate in resisting these internal forces would be expected to correlate to such rheological parameters as the yield stress and shear modulus. With the experimental data available it is not possible to determine the optimum feed concentration. However, it is expected that the largest diameter, 2.7 mm, and shortest length, 0.315 m, hollow-fibre membranes, operated at high inlet pressures, 276 kPa, could produce the desired dewatered precipitated protein concentrates.
Whatever the optimum dewatered product - drier feed concentration is, the economic analysis demonstrates that there is a need to understand and to be able to predict the onset of gel-polarization and establish the relationships between polarization and the operating conditions. The permeate flux rate characteristics of the membrane filtration of precipitated protein suspensions lend themselves to simple process control techniques. Knowledge of the relationships between the permeate flux rate, membrane shear rate and transmembrane pressure drop would enable a simple computer program to be written to receive process data on the flux rate, and thereby maintain the optimum flux rate by suitably adjusting the cartridge outlet
pressure and the retentate flow rate.
6.3 Conclusions
The production of an active, dry product from an initially dilute protein or enzyme suspension may be achieved using membrane filtration and vacuum drying.
I To reduce the process energy requirements the membrane filtration channels should be long, to maximize the recovery of permeate per membrane pass, and narrow to minimize holdup volume and the recirculation costs, similarly, high retentate flow rates should be maintained and low shear rates avoided to prevent flow stagnation and blockages in the pipe-work and membrane channels. Given these constraints the membrane channel dimensions should be specified to obtain a highly viscous dewatered suspension which may be dried at high vacuum levels without expanding significantly.
The minimum dewatering time is achieved by operating at flow rates corresponding to the critical membrane shear rate for the product. This minimizes the membrane area required but may not achieve the lowest operating costs which also depend on the membrane replacement costs and the recirculation costs.
The vacuum drying operation should be performed at high vacuum levels and high heating temperatures and the rheological properties of the feed material should be adjusted to attain a suitable product expansion to yield the desired bulk density of the dried product.
6.4 Recommendations for further work
This chapter has demonstrated the use of a relatively simple procedure for choosing the mosteconomic, in terms of capital and operating costs, membrane filtration system for dewatering precipitated protein suspensions. The : method is limited by nothaving sufficient experimental data on several important parameters, such as membrane fouling, membrane type, and the effect on the permeate flux rate of the precipitate particle
size, the soluble protein content and the hollow-fibre dimensions. The effect of some of these parameters on the performance of the filtration process could be assessed by further developing the models for predicting the permeate flux rate. Predictive models based on the shear-induced particle diffusion hypothesis (chapter 4) would be expected to provide a good foundation on which to construct an improved procedure for reducing operating costs. To assess these predictivemodels further experimentation, under more closely controlled experimental conditions than applied for the work presented in this thesis, is required perhaps obtained using laboratory-scale equipment.
The generation of more experimental data and the use of more complex predictive models would require the procedure for reducing process energy requirements to be computerized. This would also enable an examination of the effect of making more subtle changes to the process parameters such as varying the hollow-fibre length and diameter and the flow rate of the retentate. Similarly, changes in long term membrane fouling, precipitate particle size and high pressure operation could be assessed. High pressure operation requires relatively high retentate flow rates to minimize concentration polarization, which is more predominant due to the increased flux rate. At these high retentate flow rates the energy costs of recirculating the retentate becomes comparable to the membrane replacement costs. An optimization procedure would then have to relax the constraint of operating at the onset of gel- polar ization. Again this could easily be achieved within the framework of a computer program.
A procedure for optimizing the final dewatered protein concentrate prior to vacuum drying requires further work to establish a predictive method for determining the extent of product expansion under vacuum, the depth of the drying product having a large effect on the total drying time.This may be achieved by further rheological studies on the dewatered protein concentrates to establish a relationship between the structural strength (yield stress and shear modulus) of the precipitated material and its resistance to expansion under vacuum drying conditions.
Nomenclature
a constant, Equation 4.17, -aw water activity, -A constant, Equation 4.30, mAf sum of cross-sectional areas of hollow-fibres of
fibre bundle, m2„ 9Af area, Af, corresponding to 1 m of membrane
9surface area, m^A^ constant, Equation 5.19, m2An cross-sectional area of membrane filtration pipe
work, m^As surface area of membranes, m2AA^ rate of change of absorbance for reagent blank,
Equation 2.4, - AAS rate of change of absorbance for sample,
Equation 2.4, - b constant, Equation 4.17, -B constant, Equation 4.31, -c constant, Equation 4.17, -C concentration, kg m-2Cc annual recirculation costs, Equation 6.9, £Cn volume fraction of particles, -ITCpk dimensionless particle concentration in the bulk
of suspension, - CpW dimensionless particle concentration at surface
of membrane, - df inner diameter of pipe or hollow-fibre, mdn diameter of particle, m
, 9 _ 1Dd diffusion coefficient of particles, m^ s ±9 — 1Ds diffusion coefficient of macrosolutes, m^ s ±
ef pump efficiency factor, -e emissivity of protein concentrate, -yE porosity of bed of drying material, -f friction factor, -g acceleration due to gravity, m s-2
_ 9G shear modulus, N mAHy latent heat of vaporization, kJ kg“^
3 — 9 — 1J permeate flux rate, m J m * s ±
k consistency index, constant for power-law model,
Equation 4.5, N sn m-2 k' consistency index, constant for power-law
relationship derived from pipe flow experiment, Equation 4.3, N sn m-2
-1 — 4kB Stefan-Boltzmann constant, W m Kkm mass transfer coefficient, m s--*-kostw Ostwald correction factor, Equation 4.37, -kt thermal conductivity, W m“ K”-*-L length o.f pipe or hollow-fibre, m
depth of bed of material to be dried, m AL^ depth of bed of material dried, mLc length of pipe required to attain a steady state
concentration profile, Equation 4.23, m Lv length of pipe required to attain a fully
developed laminar flow velocity profile,Equation 4.22, m
m proportionality constant, Equation 4.34, -n flow behaviour index, exponent for power-law
model, Equation 4.5, - n' flow behaviour index, exponent for power-law
relationship derived from pipe flow experiment, Equation 4.3, -
_ 9N mass flux, kg mn r number of hollow-f ibres , -p mass of water evaporated, Equation 5.18, kg
_ 9Pw equilibrium vapour pressure of water, N mPw° vapour pressure of pure water, N m”2AP differential pressure, N m“2
_ 9APCF cross-flow pressure drop, N mAPE pressure drop due to contraction and expansion at
the fittings at both ends of a membrane cartridge, N m~2
AP^ transcartridge pressure drop, N m“2AP -*- transcartridge pressure drop of long hollow-
fibres, N m“2APm s transcartridge pressure drop of short hollow-
_ 9fibres, N mAPtm transmembrane pressure drop, N m”2
_ 9q heat flux, W m *Q flow rate, m^ S-1

Qr heat input due to radiation, Equation 5.19, Wr radius of pipe, mR resistance to flux, m”^
inner radius, m Ra outer radius, mRrx shear stress at radius, r, in direction, x, N m”Rwx shear stress at wall or membrane surface, in
_ 9direction x , N m Rea axial Reynolds numberRea* generalized axial Reynolds numberRer radial Reynolds numbert time, st^ drying time, sTf temperature of vaporization at evaporating front
°C 'Tp temperature of protein concentrate adjacent to
heated tray surface, °c Tp- temperature at the surface of heating source, °CTsmax maximum temperature of dry solids, °cU overall heat transfer coefficient, W m”2 K-1u^ mean-average velocity of fluid in pipe or hollow
fibre, m s--*-velocity of fluid in direction, x, m s“ velocity of propagation of shear wave, m s”
w dimensionless moisture contentW moisture content, kg kg~^Wr work rate, Wx distance in axial direction during pipe flow, my constant, Equation 4.31, -Y shear rate, s_1Yw ' critical shear rate at point of onset of gel-
polarization of a membrane, s~^-1
uxV
Yc corrected shear rate, sz constant, Equation 4.30, -Z dimensionless particle flux, -

Greek symbols
n relative viscosity, -
P apparent viscosity, Ne density, kg itT^
<?s bulk dens ity of dry s<?ds density of dry solidso- reject ion coefficient
Subscripts
b bulk of solution or suspensionc constant-rate period of dryingcr criticalds dissolved solidsf falling-rate period of dryingfi finalg geli initialo solventp permeates soluble proteinss suspended solidst timew wall of pipe or inner surface of membrane

References
Acker, L.W. 1969. Food Technology, 2_3, pp 1257-.
Aimer, P. 1987. In 'separations for Biotechnology', Eds. M.S. Verrall & M.J. Hudson, Ellis Horwood Ltd., Chichester, UK. pp 360-.
Altena, F.W. & Belfort, G. 1984 . Chem. Eng. Sci. , 39_, pp 343-.
Barrow, G.M. 1974. 'physical Chemistry for the Life Sciences', McGraw-Hill Book Comp., London.
Bauser, H., Chmiel, H., Stroh, N. & Walitza, E. 1982. J. Membrane Sci., _11, pp 321-.
Belcher, D.W., Smith, D .A. & Cook, E.M. 1977. Chemical Engineering, 112, pp 81-.
Belfort, G. & Nagata, N. 1985 . Desalination, 53 , pp 57-.
Bell, D.J. 1982. 'The Physical Characteristics of Protein Precipitates and Their Centrifugal Recovery' Ph.D. Thesis, University College London.
Bell, D.J. & Dunnill, P. 1982a. Biotechnol. Bioeng., XXIV, pp 2319-.
Bell, D.J. & Dunnill, P. 1982b. Ibid., pp 1271-.
Bell, D.J., Hoare, M. & Dunnill, P. 1983. In 'Advances in Biochemical Engineering / Biotechnology', 2J5, Ed. A. Fletcher, Berlin: Springer Verlag, Berlin.
Bemberis, I. & Neely, K. 1986. AIChemE. Symp. Series, 82(250), pp 65-.
Bentham, A.C., Ireton, M.J., Hoare, M. & Dunnill, P. 1989. Biotechnol. Bioeng., XXXI, pp 984-.
Beveridge, G.S.G. & Lyne, C.W. 1976. The Chemical Engineer, July/August, pp 513-.
Blatt, W.F., Dravid, A., Michaels, A.S. & Nelsen, L. 1970. In 'Membrane Science and Technology', Ed. J.E.Flynn, Plenum Press, New York, pp 47-.

Boeh-Ocansey, 0. 1984. Drying Tech., 2{3) , pp 389-.
Brandts, J.F. 1967. In 'Thermobiology', Ed. A.H. Rose, Academic Press, New York, pp 25-.
Catsimpoolas, N. & Meyer, E.W. 1970 . Cereal Chemistry, £7 pp 559-.
Cheryan, M. 1986. 'ultrafiltration Handbook', Technomic Publishing Comp. Inc., New York.
Chiang, B.H. & Cheryan, M. 1987. J. Food Eng., (5, pp 241-
Coulson, J.M. & Richardson, J.F. 1979. 'chemical Engineering.' Vol. Ill, Pergamon Press Ltd., Oxford, UK.
Daeman, A.L.H. 1981. Neth. Milk Dairy J., 3_5, pp 133-,
Daeman, A.L.H. & van der Stege, H.J. 1982. Neth. Milk Dairy J., _36, pp 211-.
Davis, R.H. & Birdsell, S.A. 1987. Chem. Eng. Commun., £9 pp 217-.
Davis, R.H. & Leighton, D.T. 1987. Chem. Eng. Sci., 42(2), pp 275-.
Day, A .T . & Lyne, C.W. 1972. Chemical Processing, 18(7) , PP 77-.
Decareau, R.V. 1986. Food Tech., £0(6), pp 99-.
Dervisoglu, M. & Kokini, J.L. 1986 . J. Food Sci., 51(3) , pp 541-.
Devereux, N., Hoare, M., Dunnill, P. & Bell, D.J. 1984. I 'Solid-Liquid Separation', Ed. J. Gregory, Ellis Horwood Ltd., Chichester, pp 143-.
Devereux, N., Hoare, M. & Dunnill, P. 1986a. Chem. Eng. Commun., £5, pp 255-.
Devereux, N., Hoare, M. & Dunnill, P. 1986b. Biotechnol. Bioeng., XXVIII, pp 88-.
Devereux, N. & Hoare, M. 1986. Biotechnol. Bioeng., XXVIII, pp 422-.

Dittman, F.W. 1977. Chemical Engineering, 112, pp 106-.
Eckstein, E.C., Bailey, D.G. & Shapiro, A.H. 1977. J. Fluid. Mech., _79, pp 191-.
Eduardo, B.G., Klibanov, A.M. & Karel, M. 1986. In 'DRYING '86', 1, Ed. A.S. Mujumdar, Hemisphere Publishing Corp., Washington, pp 428-.
Ernst, R.C., Ridgeway, J.W. & Tiller, F.M. 1938.Industrial and Engng. Chemistry, 3_0, pp 1122-.
Fane, A.G., Fell, C.J.D. & Nor, M.T. 1982. I.Chem.E. Jubilee Symp., T 3 , Cl.
Fane, A.G. 1986. In 'Progress in Filtration and Separation', Ed. R. J. Wakeman, Elsevier, Amsterdam, pp 101-.
Feeney, R.E. 1980. In 'chemical Deterioration of Proteins', Eds. J. Whitaker & M. Fujimaki, A.C.S. Symp. Series, 123, pp 1-.
Fell, C.J.D., Wiley, D.E. & Fane, A.G. 1986. Presented at the World Congress III of Chemical Engineering, Tokyo, 1986, pp 266-.
Fennema, 0. 1977. In 'Food Proteins', Eds. J. Whitaker &S. Tannenbaum, A.V.I. Publishing Comp., Westport, Connecticut, pp 50-.
Finch, A. & Ledward, D .A . 1973. Biochem. Biophys. Acta.,295 , pp 296-.
Fukushima, D. 1980. In 'chemical Deterioration of Proteins', Eds. J. Whitaker & M. Fujimaki, A.C.S. Symp. Series, 123, pp 211-.
Gardner, D.R. & Butler, J.L. 1982. In 'DRYING '82', Ed.A.S. Mujumdar, Hemisphere Publishing Corp., Washington, pp 248-.
Geankoplis, C.J. 1983. 'Transport Processes and Unit Operations', Pergamon Press, New York.
Gornall, A.G., Bardawill, C.J. & David, M.M. 1949. J.

Biol. Chem., 177, pp 751-.
Gray, P.P., Dunnill, P. & Lilly, M .D . 1973. Biotechnol.Bioeng., X V , pp 309-.
Green, G. & Belfort, G. 1980. Desalination, 3S_, pp 129-.
Gupta, R. & Mujumdar, A.S. 1983. In 'Advances in Drying', 2, Ed. A.S. Mujumdar, pp 155-.
Hansen, J.R. 1978. J. Agr. Food Chem., £6, pp 297-.
Hartmeier, W. 1977. German Patent, No. 2515029.
Hatefi, Y. & Hanstein, W.G. 1969. Proc. Natl. Acad. Sci., 62!, pp 1129-.
Henry, J.D. 1972. In: 'Recent Developments in SeparationsScience', 2, Ed. N.N.Li, CRC Press, Cleveland, Ohio, pp 205-.
Hertzendorf, M.S. & Moshy, R.J. 1970. Critical Reviews In Food Technology, 1, pp 25-.
Higgins, J.J., Lewis, D.J., Daly, W.H., Mosqueira, F.G., Dunnill, P. & Lilly, M.D. 1978. Biotechnol. Bioeng., XX, pp 159-.
Hill, E .A . & Hirtenstein, M.D. 1983. Advances in Biotechnological Processes, 2, pp 31-.
Hoare, M., Narendranathan, T.J., Flint, J.R., Heywood- Waddington, D., Bell, D.J. & Dunnill, P. 1982. Ind. Eng. Chem. Fundam. , 2_1, pp 402-.
Jeffery, D.J. & Acrivos, A. 1976. AIChemE J., 22(3), pp 417-.
Kapsalis, J.G. 1981. In 'water Activity: Influence on Food Quality', Eds. L.B. Rockland & G.F. Stewart, Academic Press, New York, pp 143-.
Kawamura, Y., Shinagawa, H. & Kiyama, H. 1977.International Chemical Engng., £7(2), pp 271-.
Keey, r .b . 1978. 'introduction to Industrial Drying Operations', pergamon Press, New York.

Kinsella, J.E. 1976. Crit. Rev. Food Sci. and Nutrition, 4, pp 219-.
Kinsella, J.E. 1983. Research in Food Science & Nutrition 5_, pp 226-.
Kjaergaard, O.G. 1974. In 'Advances in Preconcentration and Dehydration of Foods', Ed. A. Spicer, Applied Science Publishers, London, pp 321-.
Kumazawa, E., Saiki, Y. , Ishioka, Y. , Taneya, S. &Hayashi, H. 1980. In 'DRYING '80', 2, Ed. A.S. Mujumdar, Hemisphere Publishing Corp., Washington, pp 244-.
Kuntz Jr., I.D. & Kauzmann, W. 1974. Adv. Prot. Chem., 2_8 pp 239-.
Lapanje, S. 1978. 'Physiochemical Aspects of Protein Denaturation', J. Wiley and Sons, New York.
Le, M.S. & Atkinson, T. 1985. Process Biochemistry, 20,pp 26-.
Le, M.S. & Howell, J.A. 1985. In 'comprehensive Biotechnology', 2{2) , Ed. M.Moo-Young, Pergamon Press Ltd., London, pp 383-.
Leighton, D.T. & Acrivos, A. 1987. J. Fluid Mech., 181, pp 415-.
Leveque, M .A . 1928. Ann. Mines, L3, pp 201-.
Lewin, S. 1974. 'Displacement of Water and its Control of Biochemical Reactions', Academic Press, London.
Lillford, p. 1978. In 'plant Proteins', Ed. G. Norton, Butterworths, London, pp 289-.
Liou, J.K. 1981. 'First International Conference and Exhibition - Applied Modelling and Simulation' Sept. 1981, Lyon, France.
Litchfield, R.J. & Liapis, A.I. 1982. Presented at the AIChemE Summer National Meeting, Cleveland, Ohio.
Luyben, K.Ch.A.M., Liou, J.K. & Bruin, S. 1980. In 'Food Process Engineering: Enzyme Engineering in Food Processing'

Eds. P. Linko & J. Larinkari, 2, pp 192-.
Lyne, C.W. , Young, M. & Beveridge, G.S.G. 1974. In 'Drying of Solids', Institution of Chem. Engineers, London & S.E. Branch, London Chem. Eng. Congress, May 1974, paper C2.
Ma, Y.H. & Arsen, H. 1982 . In 'DRYING '82', Ed. A.S. Mujumdar, Hemisphere Publishing Corp., Washington, pp 196-.
Masters, K. 1985. 'spray Drying', 5th Edition, J. Wiley & Sons Inc., New York.
Mellor, J.D. 1978. 'Fundamentals of Freeze Drying', Academic Press, New York.
Michaels, A.S. 1968 . Chem. Eng. Prog., 6_4(12), pp 31-.
Muir, D.D., Abbot, J. & Sweetsur, A.W.M. 1978. J. Food Tech . , _13 , pp 45- .
Multon, J.L. & Guilbert, A. 1975. In 'Water Relations of Foods', Ed. R.B. Duckworth, Academic Press, New York, pp 379-.
Nakao, S.I., Nomura, T. & Kimura, S. 1979. AIChEJ, 25, pp 615-.
Narendranathan, T.J., 1981. 'Effect of Shear on Protein With Respect to Their Ultrafiltration', PhD Thesis, University College London.
Narendranathan, T.J. & Dunnill, P. 1982. Biotechnol. Bioeng., XXIV, pp 2103-.
Ofsthun, N.J. & Colton, C.K. 1987. ASAIO, 10(3), pp 510-.
Papamichael, N., Hoare, M. & Leslie, R.B. 1982. ThirdInternational Drying Symposium, 1_, Ed. J. c. Ashworth, pp 298-.
Perry, R.H. & Chilton, C.H. 1986. 'chemical Engineers Handbook', 6th Edition. McGraw-Hill Book comp., New York.
Perutz, M.F. 1974. Nature, 247, pp 341-.
Porter, M.C. 1972. Ind. Eng. Chem. Prod. Res. Develop.,11, pp 234-.

Privalov, P.c. 1979. Adv. Prot. Chem., 3_3' pp 167-.
Probstein, R.F., Chen, J.S. & Leung, W.F. 1978. Desalination, 2j4, pp 1-.
Ruegg, M ., Moor, Y. & Blanc, B. 1977. J. Dairy Research,44, pp 509-.
Sapakie, S.E. & Renshaw, T .A . 1983. In 'Engineering and Food Processing Applications', 2, Ed. B. M. McKenna, pp 927-.
Sapakie, S.E., Milhalik, D.R. & Hallstrom, C.H. 1979.Chem. Eng. Prog., 75(4), pp 44-.
Schlunder, E.U. 1980. In 'DRYING '80', 1, Ed. A. S. Mujumdar, Hemisphere Publishing Comp., Washington, pp 184-.
Sochava, I.V., Belopolskaya, T.V. & Smirnova, O.I. 1985. Biophysical Chemistry, 2_2, pp 323-.
Strek, F. & Nastaj, J. 1980. In 'DRYING '80', 2, Ed. A. S. Mujumdar, Hemisphere Publishing Corp., Washington, pp 126-.
Tanford, C. 1960. 'physical Chemistry of Macromolecules', J. Wiley & Sons, New York.
Tanford, C. 1968 . Adv. Prot. Chem., 2_3, ppl21-.
Tanner, R.I. & Pipkin, A.C. 1969. Trans. Soc. Rheol., 13, pp 471-.
Thijssen, H.A.C. & Kerkhof, P.J.A.M. 1977. J. Food Process Engng., 1, pp 129-.
Tombs, M.P. 1974. Faraday Discuss. Chem. Society, 57, pp 158-.
Tutunjian, R.S. 1985. Bio/technology, _3 ( 7 ) , pp 615-.
van der Beek, M.J, & Gerlsma, S.Y. 1960. Neth. Milk Dairy J . , 23_, pp 46-.
Van Wazer, J.R., Lyons, J.W., Kim, K.Y. & Colwell, R.E.1963. 'viscosity and Flow Measurement', John Wiley & Sons, New York.
Verhey, J.G.P. 1973. Neth. Milk Dairy J., 27, pp 3-
Virkar, P.D., Narendranathan, T.J., Hoare, M. & Dunnill, P. 1981. Biotechnol. Bioeng., XXIII, pp 425-.
Whitaker, J. 1977. In 'Food Proteins', Eds. J. Whitaker & S. Tannenbaum, A.V.I. Publishing Comp., Westport, Connecticut, pp 14-.
Wijlhuizen. A.E., Kerkhof, P.J.A.M., & Bruin, S. 1979. Chem. Engng. Sci., 34, pp 651-.
Wijmans. J.G., Nakao, S. & Smolders, C.A. 1984. J.Membrane Sci., 2_0(2), pp 115-
Zimmerman, K. & Bauer, W. 1985. Presented at the Fourth International Congress on Engineering and Food, Edmonton, Canada.
Zydney, A .L . & Colton, C.K. 1982. Trans. Am. Soc. Artif.Intern. Organs, 2_8, pp 408-.
Zydney, A .L . & Colton, C.K. 1986. Chem. Eng. Commun., 47,PP I"-
Labuza, T.P. 1968. Food Tech., 22, pp 263-.
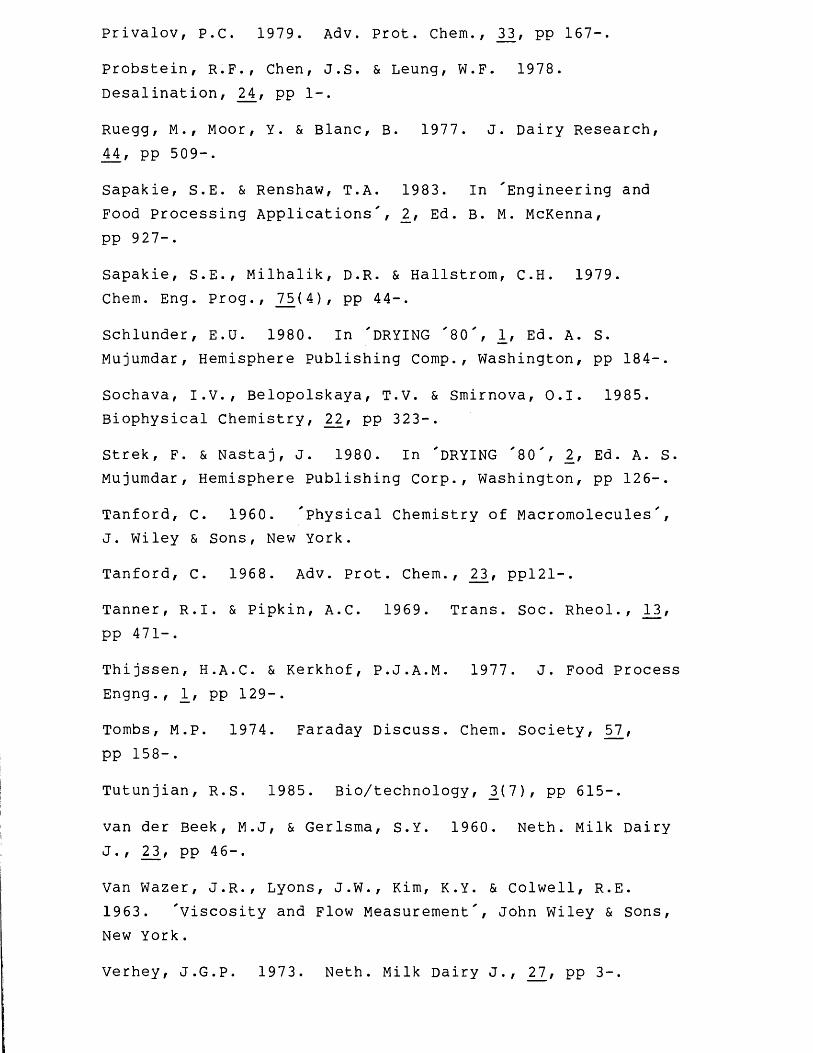
Privalov, P.C. 1979 . Adv. Prot. Chem., 3J3, pp 167-.
Probstein, R.F., Chen, J.S. & Leung, W.F. 1978. Desalination, 2_4, pp 1-.
Ruegg, M., Moor, Y. & Blanc, B. 1977. J. Dairy Research,44, pp 509-.
Sapakie, S.E. & Renshaw, T .A . 1983. In 'Engineering and Food Processing Applications', 2, Ed. B. M. McKenna, pp 927-.
Sapakie, S.E., Milhalik, D.R. & Hallstrom, C.H. 1979.Chem. Eng. Prog., 7_5 (4) , pp 44-.
Schlunder, E.U. 1980. In 'DRYING '80', 1., Ed. A. S. Mujumdar, Hemisphere Publishing Comp., Washington, pp 184-.
Sochava, I.V., Belopolskaya, T.V. & Smirnova, O.I. 1985. Biophysical Chemistry, 22_, pp 323-.
Strek, F. & Nastaj, J. 1980. In 'DRYING '80', 2, Ed. A. S. Mujumdar, Hemisphere Publishing Corp., Washington, pp 126-.
Tanford, C. 1960. 'physical Chemistry of Macromolecules',J. Wiley & Sons, New York.
Tanford, C. 1968 . Adv. Prot. Chem., 2_3, ppl21-.
Tanner, R.I. & Pipkin, A.C. 1969. Trans. Soc. Rheol., 13, pp 471-.
Thijssen, H.A.C. & Kerkhof, P.J.A.M. 1977. J. Food Process Engng., 1, pp 129-.
Tombs, M.P. 1974. Faraday Discuss. Chem. Society, 57,pp 158-.
Tutunjian, R.S. 1985. Bio/technology, 3(7), pp 615-.
van der Beek, M.J, & Gerlsma, S.Y. 1960. Neth. Milk Dairy J . , 2_3, pp 46-.
Van Wazer, J.R., Lyons, J.W., Kim, K.Y. & Colwell, R.E.1963. 'viscosity and Flow Measurement', John Wiley & Sons, New York.
Verhey, J.G.P. 1973. Neth. Milk Dairy J., 27, pp 3-

Virkar, P.D., Narendranathan, T.J., Hoare, M. & Dunnill, P. 1981. Biotechnol. Bioeng., XXIII, pp 425-.
Whitaker, J. 1977. In 'Food Proteins', Eds. J. Whitaker & S. Tannenbaum, A.V.I. Publishing Comp., Westport, Connecticut, pp 14-.
Wijlhuizen. A.E., Kerkhof, P.J.A.M., & Bruin, S. 1979. Chem. Engng. Sci., 3_4' pp 651-.
Wijmans. J.G., Nakao, S. & Smolders, C.A. 1984. J.Membrane Sci., 2_0 ( 2) , pp 115-
Zimmerman, K. & Bauer, W. 1985. Presented at the Fourth International Congress on Engineering and Food, Edmonton, Canada.
Zydney, A.L. & Colton, C.K. 1982. Trans. Am. Soc. Artif.Intern. Organs, 2_8, pp 408-.
Zydney, A.L. & Colton, C.K. 1986. Chem. Eng. Commun., 47,PP 1” •
Labuza, T.P. 1968. Food Tech., 22, pp 263-.

a p m s - ( A P m 1 APjyjS ) = A P e S (A. 8)
or,
2APm s - AP M = AP, AP, (A.9)

A.2 Vacuum drying of precipitated soya proteinconcentrates
The results for the 9 vacuum drying experiments performed using the modified experimental technique of drying the protein concentrate in a specially constructed tray (see chapter 2) are presented here. To demonstrate the reproducibility of the experimental method, drying experiment B, Figures A2.2 and A2.3, was repeated using the same operating conditions. Comparing the data in Figures A2.2 and A2.3, in the constant-rate drying period, the drying temperature profiles correspond to within 1 °C, apart from the initial stages of drying experiment B. For this experiment the measured temperature of the product at the heated surface was slightly lower than compared to the repeated experiment, B , at the corresponding drying time. This difference, coupled with the initial moisture content of the feed material for experiment B being lower, accounts for the slower decline in the residual enzyme activity observed for experiment B compared to B*.

<Dua-UCQ•Hos
CP
-Pc<u■Pcou
<ue>1NCpa
dP
>14-)•H>•Hjju03
•PU3T3OPiOt
Vo
<ypD-P03P<UCU6(U-p
0100
80
60
40
200
: \
80
60
40
20
CL□\ □ \
\ □\ □
\ d
JO
o— o— o— v— o— o--0_,
-A- -A- -A- --- ”0 0oOOOOOOOOOOOOOOO°°
« •
000 0-17 033 0-50 0-67 063 1-00
Drying time, h
Figure A2.2 vacuum drying of precipitated soya protein concentrates.
Drying experiment B: vacuum level, 62.5 kPa. Temperatureduring drying: A , heated plate; o , product on traysurface; • , product 2 + 0.2 mm above surface of tray.
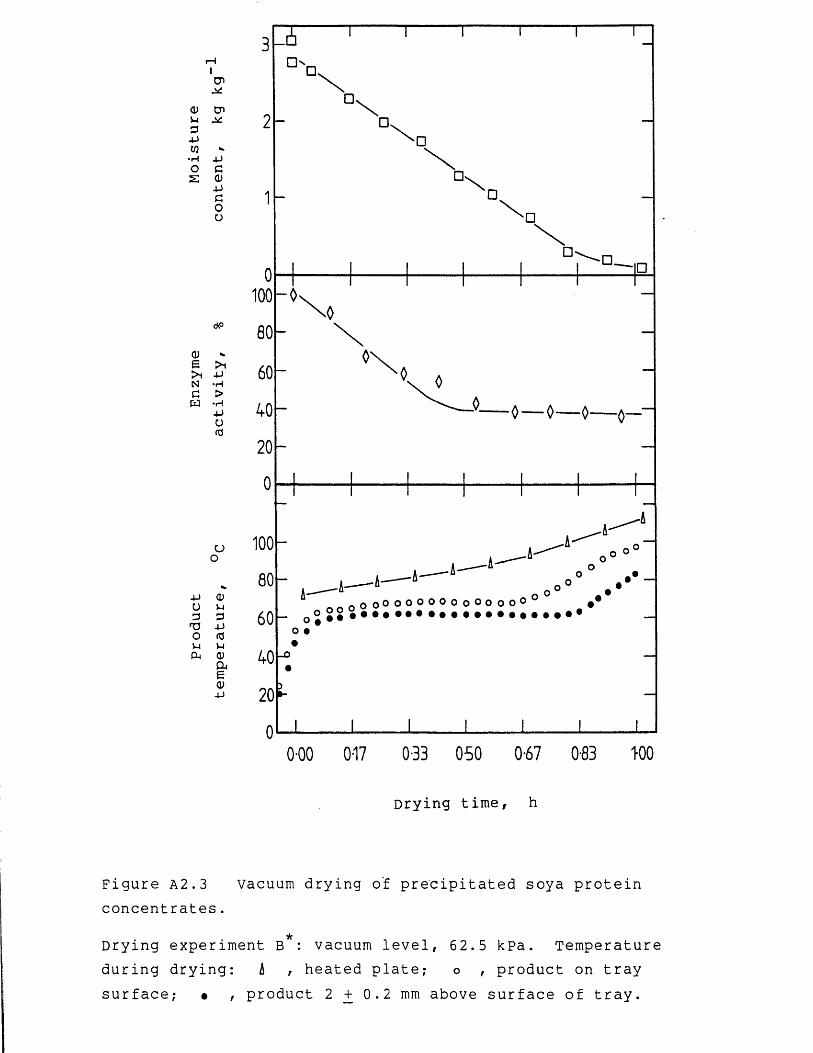
<1>P3PW
•Hos
CPpCP
pGCDPGOU
CDe>iNGW
dP
>iP•H>•Hpoto
pu3op04
uo
<up3PKJP<DCUe<up
3 1 5□-
2 -
1 -
■D
■O
0100
80
60
40
200
100
80
60
40
20
in
N o
< N
;— 0— 0— 0— o -
-A- •A- ■A-OOOOOOOOOOOOOO®
— oj • • • • • • • • • • • • • • • • • • • • • • •o •
Lo
000 0-17 0-33 050 0-67 0-83 1-00
Drying time, h
Figure A2.3 Vacuum drying o'f precipitated soya protein concentrates.
Drying experiment B : vacuum level, 62.5 kPa. Temperatureduring drying: A , heated plate; o , product on traysurface; • , product 2 + 0.2 mm above surface of tray.
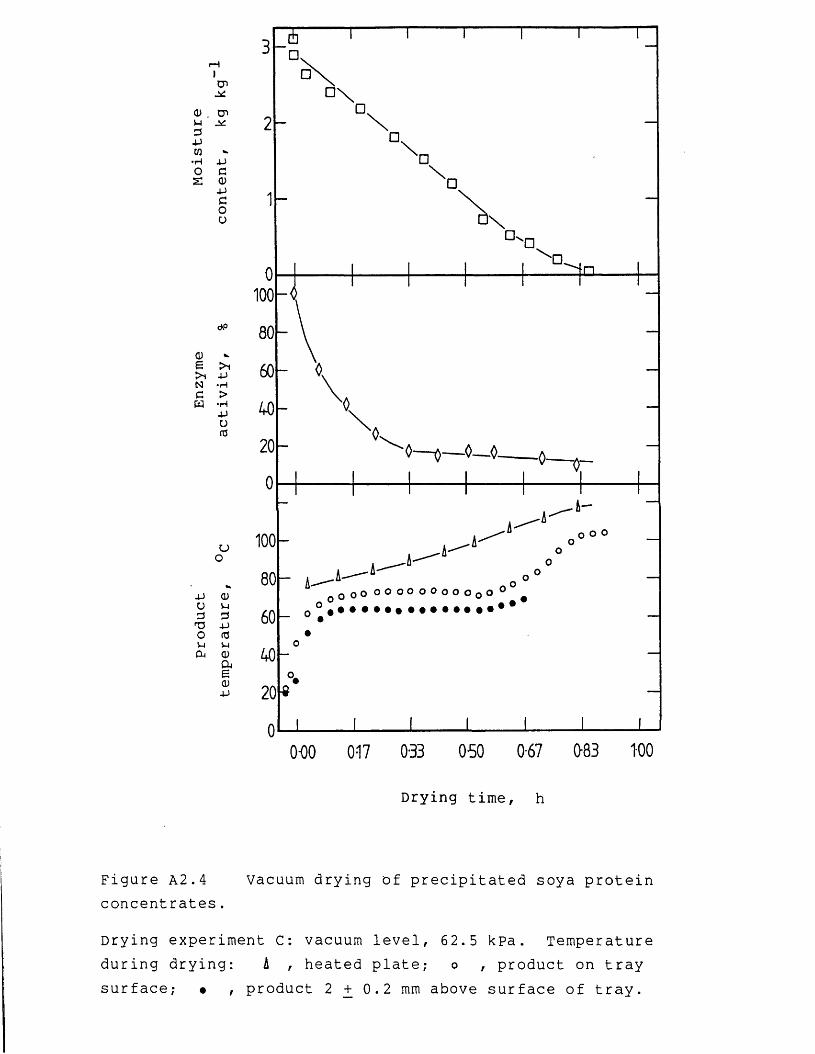
Oud4->C/3•Hos
CP
CP,i>£
4Jc(U4->coo
<ug> 1NcH
<#P
> 14->• H>•H4JUfO
4JUdT5OJ-iCn
uo
<uV-id4->fCi-l<uOug<L)4J
3 -cf
2 -
1 -
n□\ □\ □
\ □>
0100
8 0604 0200
o.
'0— o— 0— 0-
100 —
8 0 ~ A-60 _ 0
•40 0
20 *
0 I
. A ^A-o o o
0o 0o O O o o o o o o o Qo 0 #!»•••••••••••••*'
0 0 0 0 1 7 0 3 3 0 5 0 0-67
Drying time, h
0-83 1 0 0
Figure A2.4 Vacuum drying of precipitated soya protein concentrates.
Drying experiment C: vacuum level, 62.5 kpa. Temperatureduring drying: A , heated plate; o , product on traysurface; • , product 2 + 0.2 mm above surface of tray.
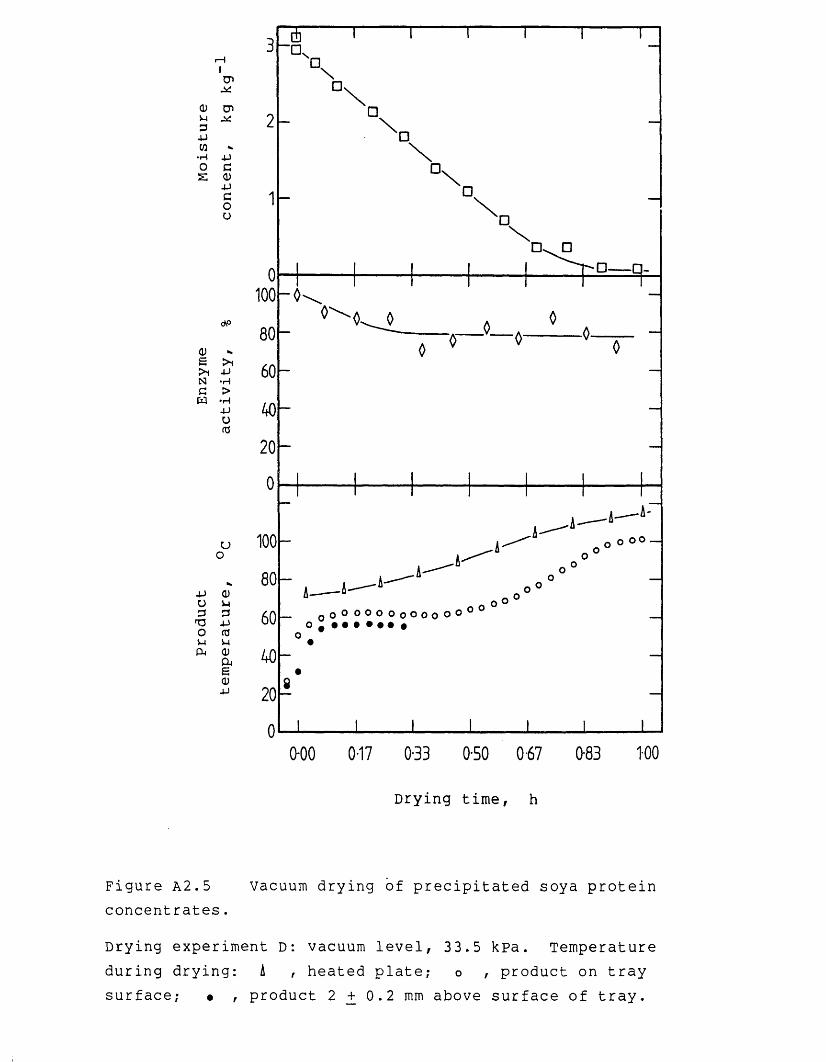
“Q
CP
•H JJo cS <U4-1cou
■<r— ~ «•
100 o OO _u
0*00 0-17 0*33 0-50 067 0-83 100
Drying time, h
Figure A2.5 Vacuum drying of precipitated soya protein concentrates.
Drying experiment D: vacuum level, 33.5 kpa. Temperatureduring drying: A , heated plate; o , product on traysurface; • , product 2 + 0.2 mm above surface of tray.

Q)U34JW• I " Io2
CP
CPJ*'
-PcQJ4JcOU
<*P
d) - E > 1 >1 -P N -HC > M -H -PU(T3
CJO
■P U 3 HD O pPL| 0)
e<u-p
<uPI3-P3P
3 - 5 ”a □
\2 -
1 -
□\
□\ □
□0
100
80
60
40
200
100
80
60
40
20*
n = g- H — o— o— o— ■0— 0 A—
■ A -
A- ■A-r t O O S O O O O Oo o O o oO O
0-00 0-17 0-33 0-50 0-67 0-83 1*00
Drying time, h
Figure A2.6 Vacuum drying of precipitated soya protein concentrates.
Drying experiment E: vacuum level, 20.0 kPa. Temperatureduring drying: A , heated plate; o , product on traysurface; • , product 2 + 0.2 mm above surface of tray.

a;p34JW•HO2
i—IICn4*Cn
4J30JJ3ou
<DE>iN3H
<*P
4->•H>•H4-4u(0
0100
80
60
40
200
4JO3HDOPiPU
uo
(V p 34->3pa>cuE0)4-1
100
80
60
40
200
- A- o •o •o •« ° • o •
_09
0-00 017 0-33 0-50 0-67 0-83 1-00
Drying time, h
Figure A2.7 Vacuum drying of precipitated soya protein concentrates.
Drying experiment F: vacuum level, 4.25 kPa. Temperatureduring drying: A , heated plate; o , product on traysurface; • , product 2 + 0.2 mm above surface of tray.
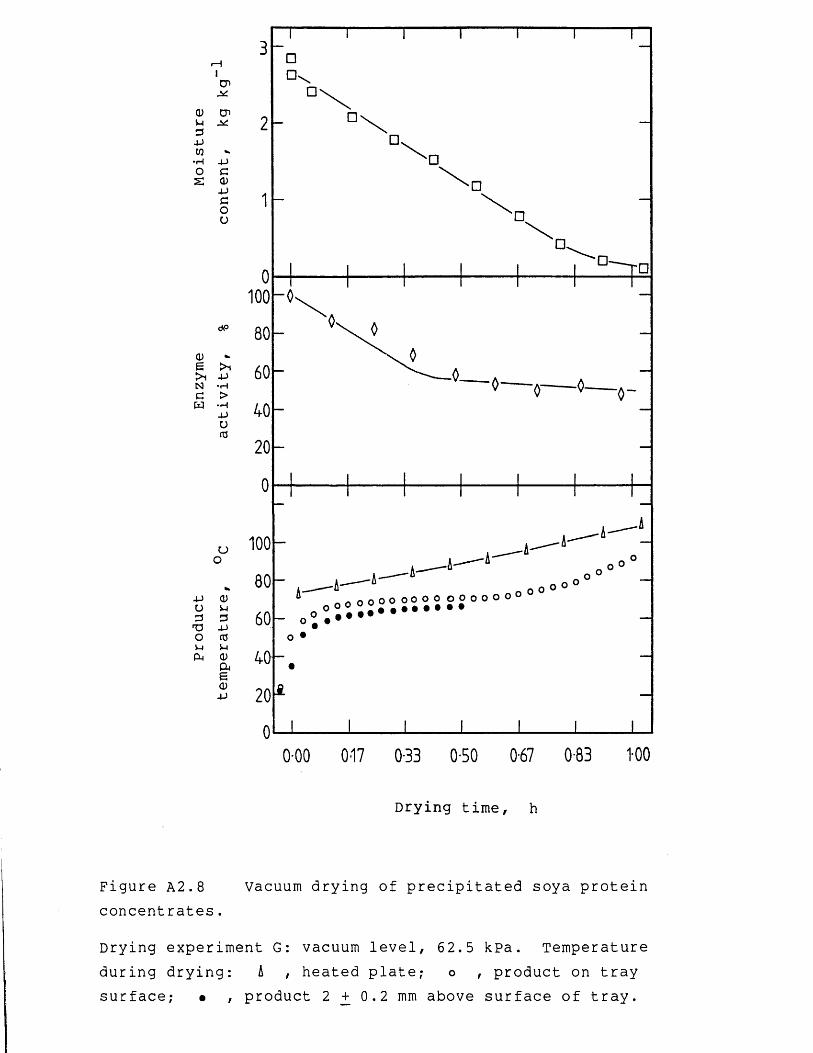
rHcncn
•H 4->O Cs <v4Jcou
0___
100CJo
<Du3-u>(0UQ)0£<U4-J
o o oo
0-00 0-17 0*33 0-50 0-67 0*83 1-00
Drying time, h
Figure A2.8 Vacuum drying of precipitated soya protein concentrates.
Drying experiment G: vacuum level, 62.5 kPa. Temperatureduring drying: A , heated plate; o , product on traysurface; • , product 2 + 0.2 mm above surface of tray.

CDU3A-iW■Hos
CP
CP
JJc04Jcou
0)e>1NCw
dP
>14-)*H>•H4-JU(0
uo
4J O 3O MCU (1)
6<D-P
Q)U3J->(CJV-l
100
80
o°° ‘0 o O 0 o O O O o O O O o o O o O ^90 , # • • • • • • • • • • • • • • # # • • • •
Drying time, h
Figure A2.9 Vacuum drying of precipitated soya protein concentrates.
Drying experiment H: vacuum level, 62.5 kPa. Temperatureduring drying: A , heated plate; o , product on traysurface; • , product 2 + 0.2 mm above surface of tray.