Simulation of the Great Bay Estuarine System: Tides with tidal flats wetting and drying
Proceedings of International Conference on Problematic Soils, 25-27 May 2005,
Eastern Mediterranean University, Famagusta, N. Cyprus
1
Suction Controlled Wetting-Drying Cycles on a
Compacted Scaly Clay
C. Airò Farulla1, C. Jommi
2
1Dept. of Structural and Geotechnical Engineering, Università degli Studi di Palermo, Italy2Dept. of Structural Engineering, Politecnico di Milano, Italy
Abstract
Due to their structural features and natural water content, scaly clays are being used in Sicily
in the construction of earth dams and waste isolation fills. A reliable design of the earth
constructions requires the characterisation of the behaviour of the compacted scaly clay in
unsaturated conditions. Experimental data from oedometer tests on compacted samples, in
suction controlled wetting-drying cycles are presented. The compacted specimens swell
moderately upon wetting, but they experience a relevant irreversible volume reduction upon
the first drying. The overall behaviour appears to result from the structural arrangement of the
compacted material. The interpretation of the oedometer data is supported by a microstructure
study, performed by both SEM and MIP investigations. The study provides a first insight in
the role of the natural microstructure features of the clay on its overall response.
Keywords: scaly clays, compacted soils, cyclic drying-wetting, suction controlled oedometer,
microstructure.
1 Introduction
Tectonised clays are over-consolidated and highly fissured, due to their complex geological
history. A thick network of discontinuities subdivides the clays in tightly interlocked hard
clayey fragments or scales. The size of the scales ranges most frequently from 1 to 20 mm.
The natural water content of the clays varies, usually, from 0.10 to 0.20 down to a notable
depth from the ground surface, and in their upper part they are frequently unsaturated (Airò
Farulla and Valore, 1993).
Independently from their geological origin and age, and from their physical and mineralogical
properties, the mechanical behaviour of the different natural formations is similar, as it is
governed mainly by the structural pattern. Hence, tectonised clays usually share the same
difficulties in being characterised for the analysis of geotechnical problems. Extensive
experimental studies have already demonstrated that the structural arrangement is responsible
of a significant variability of the geotechnical characteristics of the scaly clays determined
from standard laboratory investigations, as for both the classification parameters and the
hydraulic and mechanical properties (Airò Farulla and Nocilla, 1984).

GEOPROB 2005
2
Nevertheless, owing to the same structural features and natural water content, these clays may
be placed and compacted as excavated, to obtain a material with low permeability and
appreciable shear strength and stiffness, suitable as core material in earth dams and as barrier
in waste isolation fills. For this reason, in the early 60’s these scaly clays were adopted in the
construction of the cores of the Scanzano and Rossella dams near to Palermo. The soil for the
construction was retrieved from borrow pits close to the dams, and the foundation soil itself
belongs to the same scaly clay formation (Airò Farulla and Valore, 1993).
Owing to the widespread extension of these formations in the south of Italy and in Sicily, and
due to their technical interest as construction materials, extensive field and laboratory
geotechnical investigations have been carried out at the Università di Palermo in the last forty
years, to characterise the mechanical behaviour of the scaly clays.
Previous investigations had been carried out on samples compacted in the laboratory or
collected from the core dams, but saturated before testing (Airò Farulla and Valore, 1993). A
more reliable determination of the material properties would require taking into account that
unsaturated conditions prevail in the service life of the earth constructions. In fact, the soil is
compacted in unsaturated conditions and, after compaction, it will experience a number of
drying and wetting cycles, due to the impounding and draw-down operations, and due to the
climatic changes.
For this reasons, an experimental study on the hydro-mechanical behaviour of the compacted
scaly clays in unsaturated conditions was initiated recently at the Università di Palermo,
which laboratory is now equipped with two suction-controlled oedometers and a suction
controlled triaxial apparatus (Di Mariano et al., 2000; Airò Farulla, 2004).
In this paper the attention is focused on the evolution of the behaviour in wetting-drying
cycles, performed at constant vertical stress in a suction controlled oedometer, which simulate
the wetting-drying cycles that the compacted soil will experience during the earth
constructions service life. The oedometer investigation is supported by an analysis of the
microstructure of the as-compacted material, in order to provide an insight in the possible
microstructure mechanisms governing the overall hydro-mechanical response. Both scanning
electron microscopy (SEM) and mercury intrusion porosimetry (MIP) were adopted for the
microstructure investigation. A first interpretation is proposed on the microstructure
mechanisms, which tend to govern the overall hydro-mechanical behaviour in the wetting and
drying cycles.
2 Testing Equipment and Experimental Programme
The soil used in the investigation was prepared from the same scaly clay used in the
construction of the Scanzano and Rossella dams. The material is a kaolinitic-illitic clay with a
small quantity of smectite. The liquid limit is wl = 0.58, and the plasticity index Ip = 30. The
specific gravity is Gs = 2.78.
The air-dried material, with a hygroscopic water content, wh = 0.05, was ground with a rubber
pestle, and the material passing at n° 4 ASTM sieve was selected. The moulding water
content, w0, was chosen in the range 0.15 ÷ 0.17. Distilled water was sprayed over the soil,
and carefully mixed. A curing time of 24 hours was adopted for homogenisation of the water
content. The soil was dynamically compacted with modified Proctor energy to the target dry
density γd = 16.7 ÷ 17.6 kN/m3. Both the mixing water content and the target dry density were
chosen in order to reproduce the corresponding mean values of the material compacted in situ,
determined from the control measurements performed during the construction. After
C. Airò Farulla, C. Jommi
3
compaction, specimens were trimmed for the oedometer tests and for the SEM and MIP
investigation.
A suction controlled oedometer apparatus, designed at the UPC Barcelona (Di Mariano et al.,
2000; Airò Farulla, 2004) was used in the investigation. Displacements were measured with a
resolution of 1µm. The resolution of the water volume variation device was 0.02 cm3. The
tests were performed at a constant temperature of T=22° ± 1° C. Suction was imposed by
means of the axis translation technique, keeping a constant air pressure, ua = 1000 kPa, and
varying the applied water pressure, uw, according to the air overpressure technique. The
oedometer is equipped with a porous ceramic disk with an air entry value AEV = 1500 kPa.
Due to the high values of the control air pressure and of the degree of saturation of the tested
samples, the axis translation technique must be carefully applied in order to minimise the
volumetric deformation of the soil skeleton and the variation of the initial matric suction of
the specimen (Romero, 2001; Airò Farulla, 2004). The displacements measured during the
axis translation step were in the order of few µm and the variations in the degree of saturation
were negligible.
The suction of the as-compacted samples was measured by means of the filter paper
technique. The measurements showed a linear dependence of the logarithm of suction on the
moulding water content (Airò Farulla, 2004). The data gave a mean value of 800 kPa, which
was chosen as a standard reference value.
Two series of tests were programmed. In the first series, denoted by SL, the specimens,
prepared with a moulding water content of w0 = 0.17, were loaded up to the target vertical net
stress, (σv - ua) = 200 or 400 kPa, at constant water content. A suction s = ua - uw = 800 kPa
was then imposed, and a sufficient time was left for equalisation. In the second test series, LP,
the speciemens were prapered at a slightly lower water content of w0 = 0.15. The loading step
was performed nearly in undrained conditions for the water phase, but after a first equalisation
step at a suction s = 800 kPa. By reducing and increasing the water pressure in steps, one or
more wetting and drying cycles were then performed for all the specimen, at constant net
stress. In the following, the data of two specimens, SL24 and LP6, belonging to these series of
tests are presented and compared, with reference to the first wetting-drying-wetting cycle
performed at a constant vertical net stress of (σv - ua) = 200 kPa. The relevant state parameters
of the as-compacted samples are summarised in Table 1.
Table 1. Sample properties.
Sample ID w0
(-)γγd0
(kN/m3)
e0
(-)
Sr0
(-)
LP6 0.15 18.1 0.502 0.85
SL24 0.17 17.8 0.538 0.89
3 Microstructure Study
Previous studies had already highlighted that wetting induces significant changes in the
mechanical properties of the investigated tectonised clay (Airò Farulla and Valore, 1993). In
order to provide an insight in the microstructure features, which may be responsible of these
irreversible changes observed upon wetting, a combined SEM and MIP investigation was
initiated, starting from the as-compacted material.
SEM investigation was performed by progressively increasing the magnifications from 64x
up to 2000x. Due to the limited space availability, only the micrographs relative to the sample

GEOPROB 2005
4
SL24 will be presented and discussed in the following. As already pointed out in previous
investigations, compaction of a de-structured natural soil does not eliminate some of the
natural features of the original soil. Hence, after compaction, the soil may present different
structure levels, which in turn are typical of natural or compacted materials (Jommi and
Sciotti, 2003). The frameworks outlined by Al-Rawas and McGown (1999) for expansive
soils and by Romero (1999) for compacted soils will be adopted to describe briefly the
qualitative microstructure features observed in the analysis of the compacted scaly clay.
Different structure levels appear from the micrographs presented in Figure 1, and different
types of assemblages are evident. Compaction of the de-structured clay does not eliminate the
scales, which still may appear as distinct units (Figure 1a). Inter-assemblage macro-pores,
with a characteristic dimension of the order of 100 µm, may be observed. Some of the largest
pores seem to have a fissure-like geometry. By increasing the magnification up to 1000x or
more, it can be observed that the scales are composed by very dense aggregates of oriented
elementary particle arrangements, which units are not distinguishable at the magnification
adopted (Figure 1b). The pores inside the scales are hardly discernible.
At the same magnification (1000x), a completely different structural arrangement may be
observed in other portions of the same sample (Figure 1c). Aggregates composed of different
particle arrangements and scale fragments, leaving some inter-aggregate pores of
characteristic dimensions of the order of 10µm, may be observed. An intra-aggregate pore
system, with characteristic dimensions of the order of 1µm or less, is clearly evident from the
micrographs in Figures 1c and 1d. The microstructure arrangement of these portions of the
sample presents typical features of clays compacted on the dry side of the optimum moisture
content.
Figure 1. SEM micrographs of SL24: (a) 64x; (b) 1000x; (c) 1000x; (d) 2000x.
A better insight in the pore structure levels can be provided by the MIP data. Mercury
intrusion porosimetry is based on the principle that mercury will not intrude the pore space of
a porous medium unless a pressure pm is provided. The pressure required for intrusion
C. Airò Farulla, C. Jommi
5
depends on the surface tension of mercury, tm, the contact angle between the fluid and the
particles, θm, and the pore size. Pores that are intruded under a given pressure pm are usually
referred to as having an equivalent entrance diameter D = - 4 tm cos θm / pm. During the test
the voids of the soil sample are intruded by gradually increasing the mercury pressure, while
the cumulative volume of intruded mercury is recorded. By assimilating the soil pore system
to a bundle of capillary tubes of different diameters an inferred pore size distribution is
provided.
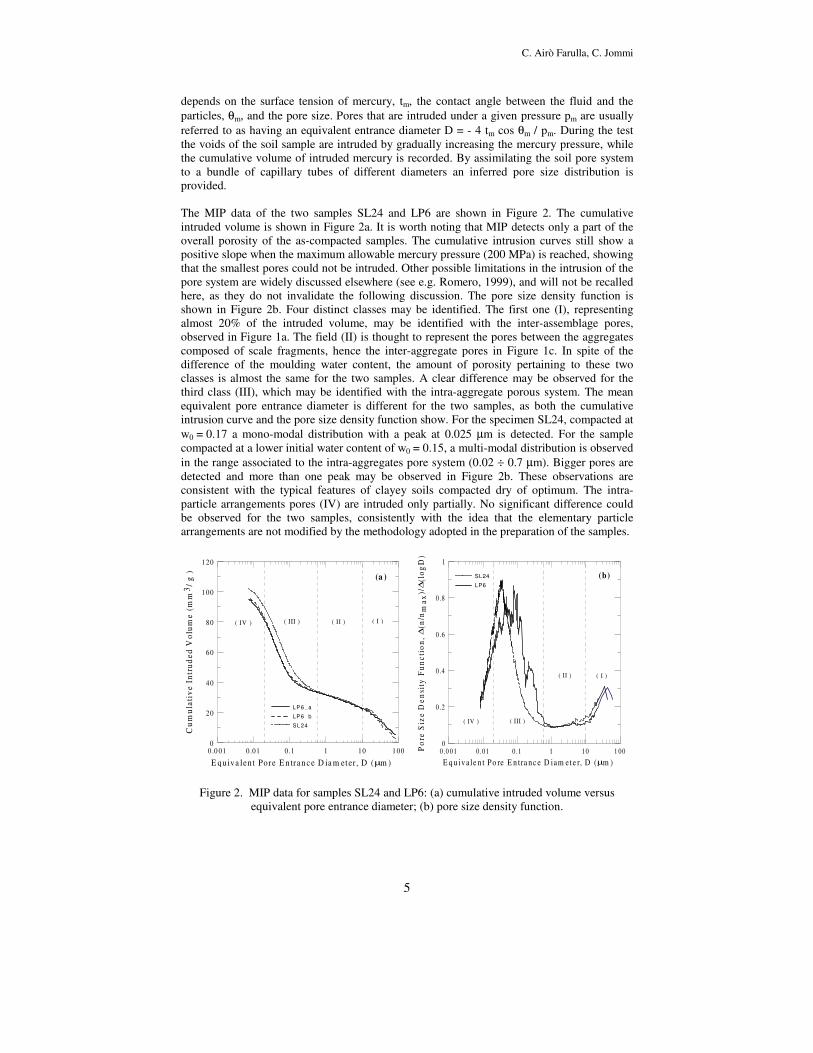
The MIP data of the two samples SL24 and LP6 are shown in Figure 2. The cumulative
intruded volume is shown in Figure 2a. It is worth noting that MIP detects only a part of the
overall porosity of the as-compacted samples. The cumulative intrusion curves still show a
positive slope when the maximum allowable mercury pressure (200 MPa) is reached, showing
that the smallest pores could not be intruded. Other possible limitations in the intrusion of the
pore system are widely discussed elsewhere (see e.g. Romero, 1999), and will not be recalled
here, as they do not invalidate the following discussion. The pore size density function is
shown in Figure 2b. Four distinct classes may be identified. The first one (I), representing
almost 20% of the intruded volume, may be identified with the inter-assemblage pores,
observed in Figure 1a. The field (II) is thought to represent the pores between the aggregates
composed of scale fragments, hence the inter-aggregate pores in Figure 1c. In spite of the
difference of the moulding water content, the amount of porosity pertaining to these two
classes is almost the same for the two samples. A clear difference may be observed for the
third class (III), which may be identified with the intra-aggregate porous system. The mean
equivalent pore entrance diameter is different for the two samples, as both the cumulative
intrusion curve and the pore size density function show. For the specimen SL24, compacted at
w0 = 0.17 a mono-modal distribution with a peak at 0.025 µm is detected. For the sample
compacted at a lower initial water content of w0 = 0.15, a multi-modal distribution is observed
in the range associated to the intra-aggregates pore system (0.02 ÷ 0.7 µm). Bigger pores are
detected and more than one peak may be observed in Figure 2b. These observations are
consistent with the typical features of clayey soils compacted dry of optimum. The intra-
particle arrangements pores (IV) are intruded only partially. No significant difference could
be observed for the two samples, consistently with the idea that the elementary particle
arrangements are not modified by the methodology adopted in the preparation of the samples.
0 .0 01 0.01 0.1 1 10 1 00
E quiva lent Pore E n tran ce D ia m eter , D (µm )
0
20
40
60
80
1 00
1 20
Cu
mu
lati
ve
In
tru
de
d V
olu
me
(m
m3
/ g
)
LP 6_ a
LP 6_ b
SL 24
( I )( II )( III )( IV )
(a )
0 .0 01 0 .01 0 .1 1 10 1 00
E q u iv a le n t Po re E n tra nc e D iam et e r, D (µm )
0
0 .2
0 .4
0 .6
0 .8
1
Po
re S
ize
De
nsi
ty F
un
cti
on
, ∆
(n/n
ma
x)/
∆(l
og
D)
SL24
LP6
( II ) ( I )
( III )( IV )
(b )
Figure 2. MIP data for samples SL24 and LP6: (a) cumulative intruded volume versus
equivalent pore entrance diameter; (b) pore size density function.

GEOPROB 2005
6
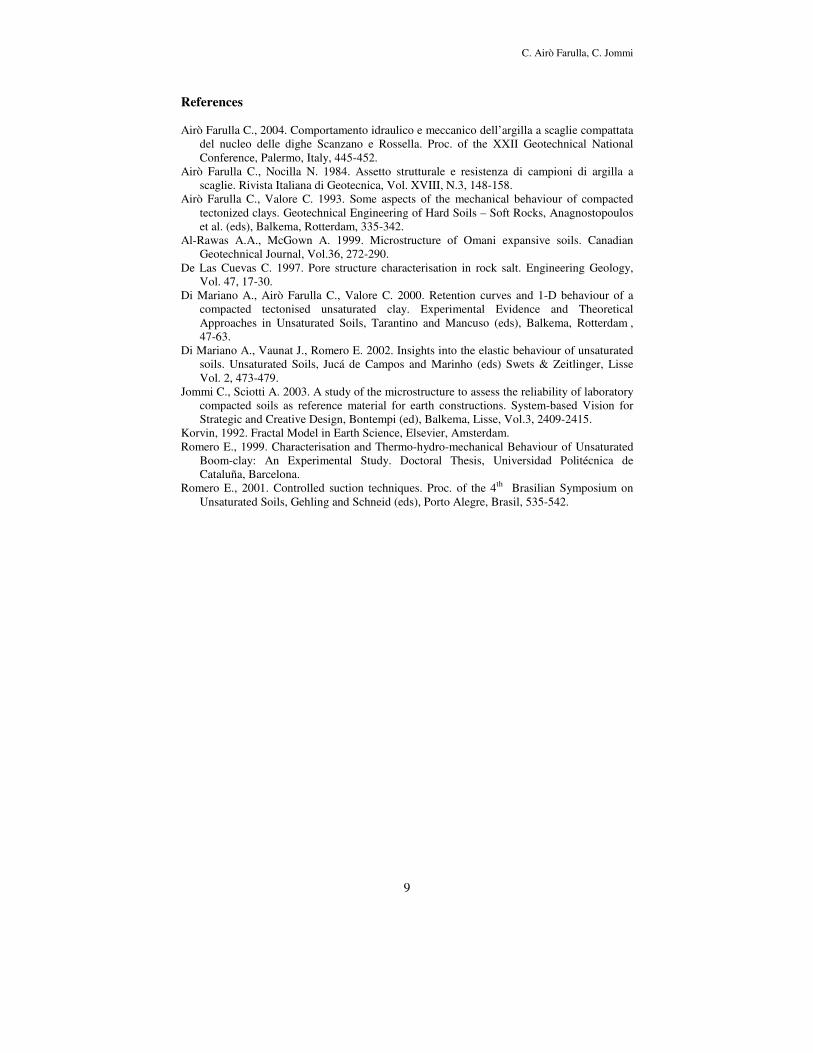
A further insight in the pore structure may be provided following fractal interpretations of the
MIP data (Korvin, 1992; De Las Cuevas, 1996; Romero, 1999; Jommi and Sciotti, 2003). The
interpretation is based on the concept that a portion of the pore space, which presented similar
geometrical characteristics irrespective of the scale of observation, might be identified with a
single fractal dimension, describing a repeatable, self-similar, geometrical structure. Hence, a
constant fractal dimension should be observed in a certain range of intrusion pressures if
pores of decreasing size but of the same geometrical type are being intruded.
According to Korvin (1992), the porous surface fractal dimension, Ds, of the pores can be
usefully adopted to classify the different possible pore structures on the basis of MIP data, as
it is related to the derivative of the cumulative intruded volume with respect to the intrusion
pressure:
( )*
*s
-dVlog D log p
dp*
4
≈ − (1)
where the non-dimensional variables V* = V(pm)/Vmax and p* = pm/pmax (where V(pm) is the
cumulative volume intruded for a given pressure pm, and Vmax is the total volume intruded for
the maximum applied pressure pmax) have been introduced.
0.00 01 0 .0 01 0.01 0.1 1A pplied P re ssure / M axim um A pplied P res sure , pm / pm ax
0.01
0.1
1
10
1 00
10 00
d(V
(pm
) /
Vm
ax
) /
d(p
m /
pm
ax
)
L P 6 _ a
L P 6 _ b
S L 2 4
Ds - 4 = - 1 .8 8
Ds - 4 = -1 .1 0
Ds - 4 = - 1 .9 0
( I ) ( II ) ( III ) ( IV )
Figure 3. MIP data for samples SL24 and LP6: fractal description of the pore structures.
The intervals of self-similarity or scale invariance of the different pore types characterising
the compacted soils can be inferred from the log-log plot presented in Figure 3. The linear
parts of the plots identify self-similar pore structures (Romero, 1999). According to De Las
Cuevas (1996), a surface fractal dimension Ds = 2 characterises a fissure-like porosity, while
Ds = 3 describes a more space-filling volumetric pore structure.
The data presented in Figure 3 show that except for the range (III), a fractal structure may be
inferred for the different pore structures already delimited on the basis of the pore size density
function. The biggest pores (I), corresponding to the inter-assemblage (inter-scales) pores,
have a fractal dimension of Ds = 2.12, tending to a fissure-like type of porosity. In the range
(II), the surface fractal dimension, Ds = 2.90, seems to describe well the increasing roughness
of the surface of the inter-aggregate pores shown in Figure 1c. The intra-aggregate pores,

C. Airò Farulla, C. Jommi
7
associated to the range (III), representing nearly half of the total detected porosity, do not
have a fractal character. The micrograph shown in Figure 1c highlights that this porosity
system is composed of pores of different dimensions and shapes, depending on the different
form of aggregations of the scale fragments. This observation seems to be consistent with the
different modal distribution observed in the pore size-density function. A fractal, fissure-like,
type of porosity is recovered for the intra-particle arrangement pores (IV), where Ds = 2.10.
4 Oedometer Data
In Figure 4 the data of the first steps of the oedometer tests performed on the two samples at
(σv - ua) = 200 kPa, are presented. In Figure 4a the stress path followed by the samples is
described in the net stress-suction plane. The data presented in the following plots refer to the
suction controlled wetting-drying-wetting cycle performed after the equalisation stage. The
data are represented in terms of the state variables void ratio, e, and water ratio,
ew = w Gs = Sr e.
1 0 10 0 1 00 0
N et S tre s s , σv - u a (k P a)
1 0
10 0
1 00 0
Su
ctio
n,
s (k
Pa
)
(a )
firs
t w
ett
ing
se
co
nd
we
ttin
g80 0 kPa
LP6
SL24
0 .3 6 0 .4 0 0 .4 4 0 .4 8 0 .5 2
W a te r R a ti o , e w
1 0
10 0
1 00 0
Su
cti
on
, s
(k
Pa
)
LP6
SL24
(c)
1 0 10 0 1 0 0 0
S u c ti o n , s ( k P a )
0 .4 4
0 .4 6
0 .4 8
0 .5 0
0 .5 2
Vo
id R
atio
, e
LP6
SL24
(b )
0 .4 0 0 .4 4 0 .4 8 0 .5 2
W a te r R a ti o , e w
0 .4 4
0 .4 6
0 .4 8
0 .5 0
0 .5 2
Vo
id R
ati
o,
e
LP 6
SL24
Sr = 0.8 S r = 0.9 Sr = 1(d )
Figure 4. Oedometer data: (a) σv-ua – s; (b) s – e; (c) ew – s; (d) ew – e.
In the first wetting path, despite the compaction had been performed on the dry side or near to
the optimum water content (Airò Farulla, 2004), the samples swell, although moderately
(Fig. 4b). It is worth noting that swelling upon first wetting has been observed for the scaly
clay in a wider range of applied vertical net-stress, (σv - ua) = 200 ÷ 800 kPa (Di Mariano et

GEOPROB 2005
8
al., 2000; Airo’ Farulla, 2004). The samples undergo a relevant increase in the water ratio
(Fig. 4c), and they apparently reach full saturation for a suction of 10 kPa.
At the beginning of the first drying path, the response of the material is very stiff, both in
terms of void ratio and water ratio, until a suction of 200 kPa is reached. A yielding point may
be observed at this stage, where the stiffness decreases and a significant reduction in the water
ratio is observed. At the end of the first wetting-drying cycle, an appreciable net reduction of
the volume may be recorded. On the contrary, the exchanged volumes of water are mostly
reversible over the first cycle.
On the onset of the second wetting path, the samples swell again, although only a limited
portion of the accumulated volume reduction is recovered, highlighting the irreversible nature
of the volume reduction experienced during the first drying step. On the contrary, the second
wetting path follows the first wetting branch of the retention curve, until the suction attains a
value of 200 kPa. The last portion of the wetting curve is different, due to the volume
reduction previously experienced. Comparing the two wetting paths, it may be inferred that
shrinkage affected the retention characteristics only of those pores, which can exchange water
in the suction range between 10 and 200 kPa. The minimum dimension of these pores may be
deduced by means of the Laplace equation D = 4 tw / (ua - uw ), where tw is the surface tension
of water. A value of the order of 1 µm is obtained, indicating that the irrecoverable void ratio
reduction might be associated to the inter-aggregate pore system.
In Figure 4d the evolution of the state variables e and ew is represented. The slope of the
interpolating curves represents the ratio between the change in void ratio and the change in
water ratio for the same suction variation. The plot clearly shows that a suction decrease
mainly affects the water ratio along the wetting paths. The slope of the e – ew lines describing
the wetting paths of both samples is almost constant (de/dew = 0.24), highlighting that
reversible wetting mechanisms take place (Di Mariano et. al, 2002), except for the first
wetting of the sample LP6, which undergoes saturation at nearly constant void ratio.
5 Discussion
The data presented compare well with previous experimental data on similar soils (e.g.
Romero, 1999) and suggest that the overall response of the compacted scaly clay be governed
by the interplay at the micro-scale of the different structure levels resulting from compaction.
During the first wetting path, the swelling nature of the aggregates might compensate the
tendency to collapse of the inter-aggregate pore system, typical of clayey soils compacted dry
of optimum. The two effects result in an overall moderate volume increase, which is almost
inhibited for the sample compacted at the lowest water content. The first wetting path
probably induces a sort of softening of the aggregates, which experience a significant
irreversible volume decrease upon the following drying. The expansive nature of the scaly
clay seems to be due to the aggregates structure, more than to the clay minerals themselves.
Scanning electron microscopy and mercury intrusion porosimetry highlighted the multiple
microstructure levels resulting from the compaction of the natural scaly clay, and may help in
the interpretation of the oedometer test data. The pore structure geometry may be useful
investigated by means of a fractal interpretation of the MIP data. The description presented in
this work is limited to the as-compacted material, but the effects of the wetting-drying cycles
on the microstructure of the compacted soil are being investigated. The ongoing experimental
activity is now aiming at studying how further drying-wetting cycles will affect both the
compacted soil microstructure and its overall hydro-mechanical response.
C. Airò Farulla, C. Jommi
9
References
Airò Farulla C., 2004. Comportamento idraulico e meccanico dell’argilla a scaglie compattata
del nucleo delle dighe Scanzano e Rossella. Proc. of the XXII Geotechnical National
Conference, Palermo, Italy, 445-452.
Airò Farulla C., Nocilla N. 1984. Assetto strutturale e resistenza di campioni di argilla a
scaglie. Rivista Italiana di Geotecnica, Vol. XVIII, N.3, 148-158.
Airò Farulla C., Valore C. 1993. Some aspects of the mechanical behaviour of compacted
tectonized clays. Geotechnical Engineering of Hard Soils – Soft Rocks, Anagnostopoulos
et al. (eds), Balkema, Rotterdam, 335-342.
Al-Rawas A.A., McGown A. 1999. Microstructure of Omani expansive soils. Canadian
Geotechnical Journal, Vol.36, 272-290.
De Las Cuevas C. 1997. Pore structure characterisation in rock salt. Engineering Geology,
Vol. 47, 17-30.
Di Mariano A., Airò Farulla C., Valore C. 2000. Retention curves and 1-D behaviour of a
compacted tectonised unsaturated clay. Experimental Evidence and Theoretical
Approaches in Unsaturated Soils, Tarantino and Mancuso (eds), Balkema, Rotterdam ,
47-63.
Di Mariano A., Vaunat J., Romero E. 2002. Insights into the elastic behaviour of unsaturated
soils. Unsaturated Soils, Jucá de Campos and Marinho (eds) Swets & Zeitlinger, Lisse
Vol. 2, 473-479.
Jommi C., Sciotti A. 2003. A study of the microstructure to assess the reliability of laboratory
compacted soils as reference material for earth constructions. System-based Vision for
Strategic and Creative Design, Bontempi (ed), Balkema, Lisse, Vol.3, 2409-2415.
Korvin, 1992. Fractal Model in Earth Science, Elsevier, Amsterdam.
Romero E., 1999. Characterisation and Thermo-hydro-mechanical Behaviour of Unsaturated
Boom-clay: An Experimental Study. Doctoral Thesis, Universidad Politécnica de
Cataluña, Barcelona.
Romero E., 2001. Controlled suction techniques. Proc. of the 4th Brasilian Symposium on
Unsaturated Soils, Gehling and Schneid (eds), Porto Alegre, Brasil, 535-542.
Copyright © 2022 FDOKUMEN