
Gamma ray computed tomography to evaluate wetting/drying soil structure changes
19
Abstract Wetting and drying (W-D) cycles can cause strong modifications of the structure of a soil, especially in pore distribution, which reflects the temporal and spatial distribution of soil water and, consequently, these processes can affect soil water and nutrient retention and movement. These alterations have important practical consequences when calculating soil water storages and matric potentials, widely used in irrigation management. The present paper has as objective to use gamma ray computed tomography (GCT) as a tool to investigate possible modifications in soil structure induced by W-D cycles and to analyze how these alterations can affect soil water retention. The GCT scanner used was a first generation system with a fixed source- detector arrangement, with a radioactive gamma ray source of 241 Am. Soil samples were taken from profiles of three different soils characterized as Xanthic Ferralsol (Fx), Eutric Nitosol (Ne) and Rhodic Ferralsol (Fr). Eighteen samples (50 cm 3 ), six from each soil, were submitted to none (T 0 ), three (T 1 ), and nine (T 2 ) wetting/drying cycles. Based on image analysis it was possible to detect modifications in soil structure in all samples after wetting/drying cycles for all treatments. Tomographic unit profiles of the samples permitted to identify an increase on soil porosity with the increase in the number of wetting/drying cycles and it was also possible to quantify the average porosity values. The statistical test (Duncan test) indicates that there are significant differences between treatments for all samples at the 5% significance level. Keywords: computed tomography; wetting/drying cycles; soil water retention; soil structure; gamma radiation.
-
Upload
independent -
Category
Documents
-
view
3 -
download
0
Transcript of Gamma ray computed tomography to evaluate wetting/drying soil structure changes

Abstract
Wetting and drying (W-D) cycles can cause strong modifications of the structure of a
soil, especially in pore distribution, which reflects the temporal and spatial distribution
of soil water and, consequently, these processes can affect soil water and nutrient
retention and movement. These alterations have important practical consequences when
calculating soil water storages and matric potentials, widely used in irrigation
management. The present paper has as objective to use gamma ray computed
tomography (GCT) as a tool to investigate possible modifications in soil structure
induced by W-D cycles and to analyze how these alterations can affect soil water
retention. The GCT scanner used was a first generation system with a fixed source-
detector arrangement, with a radioactive gamma ray source of 241
Am. Soil samples were
taken from profiles of three different soils characterized as Xanthic Ferralsol (Fx),
Eutric Nitosol (Ne) and Rhodic Ferralsol (Fr). Eighteen samples (50 cm3), six from each
soil, were submitted to none (T0), three (T1), and nine (T2) wetting/drying cycles. Based
on image analysis it was possible to detect modifications in soil structure in all samples
after wetting/drying cycles for all treatments. Tomographic unit profiles of the samples
permitted to identify an increase on soil porosity with the increase in the number of
wetting/drying cycles and it was also possible to quantify the average porosity values.
The statistical test (Duncan test) indicates that there are significant differences between
treatments for all samples at the 5% significance level.
Keywords: computed tomography; wetting/drying cycles; soil water retention; soil
structure; gamma radiation.
2
Introduction
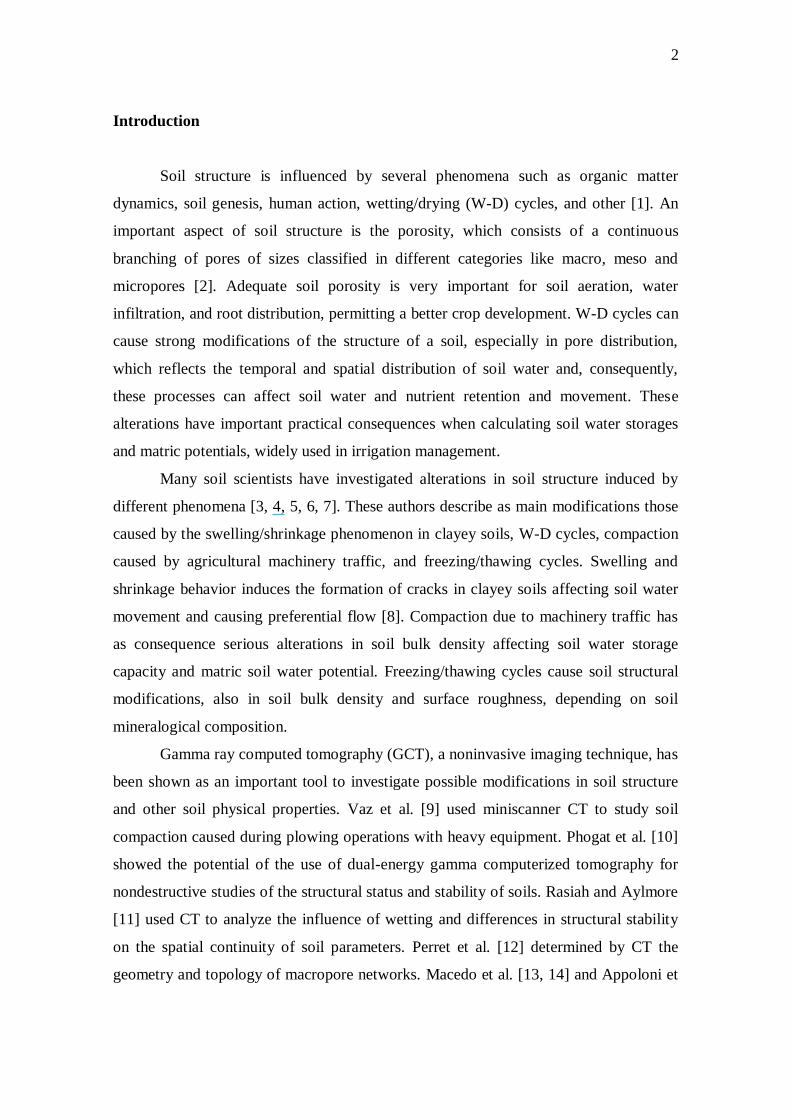
Soil structure is influenced by several phenomena such as organic matter
dynamics, soil genesis, human action, wetting/drying (W-D) cycles, and other [1]. An
important aspect of soil structure is the porosity, which consists of a continuous
branching of pores of sizes classified in different categories like macro, meso and
micropores [2]. Adequate soil porosity is very important for soil aeration, water
infiltration, and root distribution, permitting a better crop development. W-D cycles can
cause strong modifications of the structure of a soil, especially in pore distribution,
which reflects the temporal and spatial distribution of soil water and, consequently,
these processes can affect soil water and nutrient retention and movement. These
alterations have important practical consequences when calculating soil water storages
and matric potentials, widely used in irrigation management.
Many soil scientists have investigated alterations in soil structure induced by
different phenomena [3, 4, 5, 6, 7]. These authors describe as main modifications those
caused by the swelling/shrinkage phenomenon in clayey soils, W-D cycles, compaction
caused by agricultural machinery traffic, and freezing/thawing cycles. Swelling and
shrinkage behavior induces the formation of cracks in clayey soils affecting soil water
movement and causing preferential flow [8]. Compaction due to machinery traffic has
as consequence serious alterations in soil bulk density affecting soil water storage
capacity and matric soil water potential. Freezing/thawing cycles cause soil structural
modifications, also in soil bulk density and surface roughness, depending on soil
mineralogical composition.
Gamma ray computed tomography (GCT), a noninvasive imaging technique, has
been shown as an important tool to investigate possible modifications in soil structure
and other soil physical properties. Vaz et al. [9] used miniscanner CT to study soil
compaction caused during plowing operations with heavy equipment. Phogat et al. [10]
showed the potential of the use of dual-energy gamma computerized tomography for
nondestructive studies of the structural status and stability of soils. Rasiah and Aylmore
[11] used CT to analyze the influence of wetting and differences in structural stability
on the spatial continuity of soil parameters. Perret et al. [12] determined by CT the
geometry and topology of macropore networks. Macedo et al. [13, 14] and Appoloni et

3
al. [15] applied X-ray microtomography to investigate thin layers of soil clod particulate
systems and porous microstructures. Rogasik et al. [16], through X-ray CT, made 3-D
analysis of macropores and Pires et al. [17, 18] investigated through GCT soil
compaction induced by agricultural machinery traffic and modifications in soil structure
caused by soil sampler devices.
The present paper has as objective to use GCT as a tool to investigate possible
modifications in soil structure induced by W-D cycles and to analyze how these
alterations can affect soil water retention.
Material and Methods
CT scanner
The CT scanner is a first generation system with a fixed source-detector
arrangement, with translation/rotational movements of the sample. The radioactive
gamma ray source consists of 241
Am with an activity of 3.7 GBq emitting
monoenergetic photons of energy 59.54 keV. Circular lead collimators of 1 mm
diameter were adjusted and aligned between source and detector. Angular sample
rotation steps were 2.25° until completing a scan of 180°, with linear steps r of
0.14 cm. The pixel size was 1.14 x 1.14 mm, calculated by the ratio between the inner
diameter of the soil sample and number of pixels of the reconstruction matrix. Acquired
data were stored in a PC and a reconstruction algorithm called Microvis [19] developed
by Embrapa Agricultural Instrumentation (CNPDIA – São Carlos, Brazil) was used to
obtain GCT images. The calibration of the GCT system was obtained through linear
correlation between linear attenuation coefficients and tomographic units of different
materials [20]. The tomographic images of the soil samples were taken on vertical
planes crossing the center of each cylindrical sample.
Since GCT was performed on soil samples with constant water content, the soil
porosity () was obtained combining the equations used to calculate soil bulk density by
CT [20], and utilized to evaluate soil porosity by traditional methods [1]:

4
pmwms ).U..(
TU1 (1)
where represents the correlation coefficient between and TU; ms and mw (cm2.g
-1)
the mass attenuation coefficients of soil and water, respectively; p (g.cm-3
) the soil
particle density; U (g.g-1
) the soil water content; and TU1 the tomographic unit.
In order to avoid effects of possible artifacts or fluctuations in the images the
quantitative analyses to determine the soil porosity was made selecting areas inside the
cylinder smaller than the real soil sample size.
Soil preparation
Core samples were taken from profiles of three soils, different in texture,
characterized as: Xanthic Ferralsol (soil 1), Eutric Nitosol (soil 2) and Rhodic Ferralsol
(soil 3) from an experimental field of ESALQ/USP, Piracicaba, SP, Brazil (22°4’ S;
47°38’ W; 580 m above sea level). Eighteen samples (3.0 cm high, 4.8 cm i.d., 55 cm3
volume), six from each soil were collected at the soil surface (0 – 10 cm) with
aluminum cylinders. The chosen wetting process was the capillary rise, which is used
during soil water retention determinations. The procedure of wetting consisted initially
in maintaining a level of water 0.3 cm from the bottom of the cylinder during 2 hours
and after this water was applied at a level just below the top of the cylinder. Twenty
four hours were necessary to obtain complete saturation of soil samples by capillary rise
in order to avoid entrapped air bubbles, which can cause slaking of soil aggregates,
changing soil structure. The procedure used to dry samples was the application of 4.0
MPa of pressure (P) on the saturated soil sample, driving away soil water retained at
pressures below P [21]. Soil samples were submitted to none (Treatment T0), three (T1),
and nine (T2) W-D cycles. GCT images were obtained at fixed water contents, to avoid
differences in soil images due to differences in the residual water content after each
treatment. The procedure used to obtain fixed water contents, after W-D cycles, was to
maintain samples in contact with air until a residual value of U was reached. When
1 TU takes the air as the media with the minimum possible value. It is linearly related to Hounsfield Unit (HU) that takes the water as a reference media for which HU=0.

5
samples, after T0, T1, and T2, reached this residual water content they were involved in
plastic film, to minimize water loss, and submitted to tomography.
Results and Discussion
Table 1 presents some soil characteristics for the three soils used in the
experiment.
Table 1. Physical characteristics of the 0-10 cm soil layer for Xanthic Ferralsol (soil 1),
Eutric Nitosol (soil 2) and Rhodic Ferralsol (soil 3).
Characteristic
1
Soil
2
3
Sand (%) 66 24 26
Silt (%) 6 33 26
Clay (%) 28 43 48
Particle density (g.cm-3
) 2.55 2.68 2.54
Bulk density (g.cm-3
)* 1.56 1.62 1.33
Organic matter (g.dm-3
) 16.0 20.2 27.0
pH (in CaCl2) 3.9 5.3 4.9
Ca (molc.m-3
) 13.0 29.0 27.0
Mg (molc.m-3
) 4.0 20.0 15.0
K (molc.m-3
) 2.6 4.3 3.4 * Soil bulk density was obtained through the traditional gravimetric method [1].
Mass attenuation coefficients were obtained using the method described in
Ferraz and Mansell [22]: 0.24922 0.00001 (soil 1), 0.32752 0.00288 (soil 2),
0.30639 0.00034 (soil 3), and 0.19890 0.00071 cm2.g
-1 (water). The calibration of
GCT presented a high correlation coefficient of 0.999.
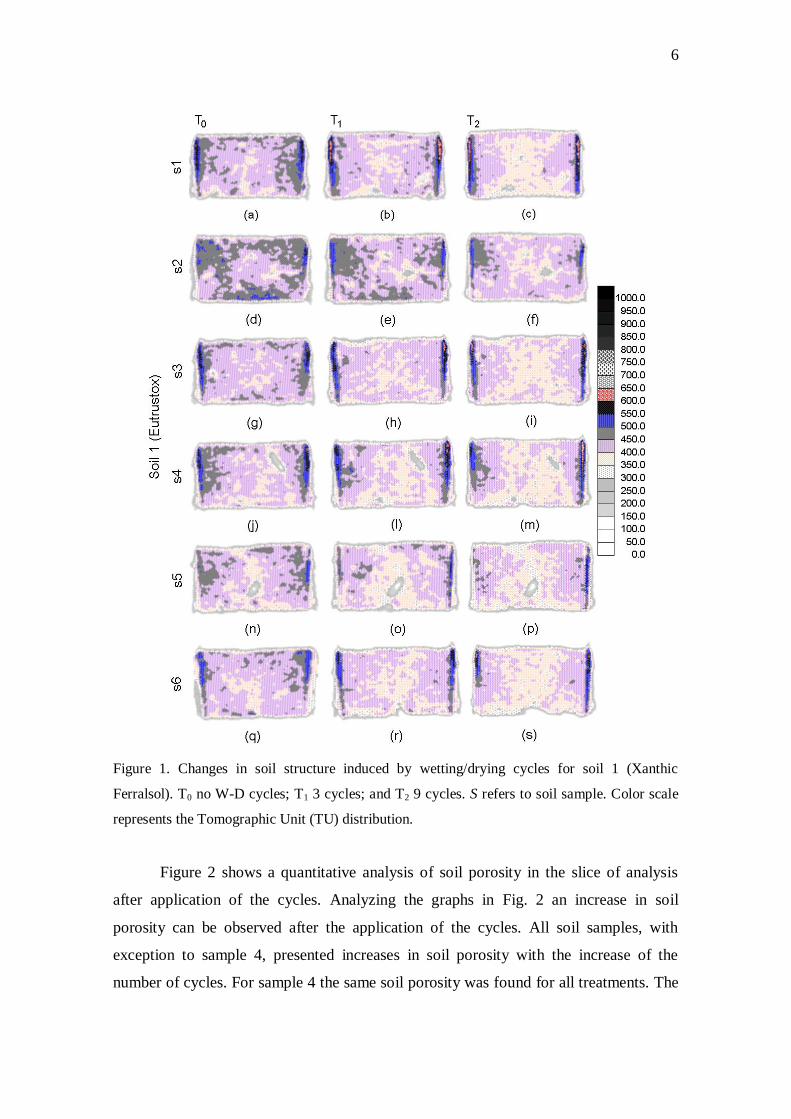
Figure 1 shows the tomographic images of soil 1 (Xanthic Ferralsol) submitted
to different numbers of W-D cycles. These images reveal a clear tendency of
modifications in soil structure after these cycles. Between the treatments T0 and T1 the
alteration in soil structure does not present variations, but comparing T0 and T2 the
modifications become more evident. The W-D cycles probably caused variations in pore
distribution for this soil.
6
Figure 1. Changes in soil structure induced by wetting/drying cycles for soil 1 (Xanthic
Ferralsol). T0 no W-D cycles; T1 3 cycles; and T2 9 cycles. S refers to soil sample. Color scale
represents the Tomographic Unit (TU) distribution.
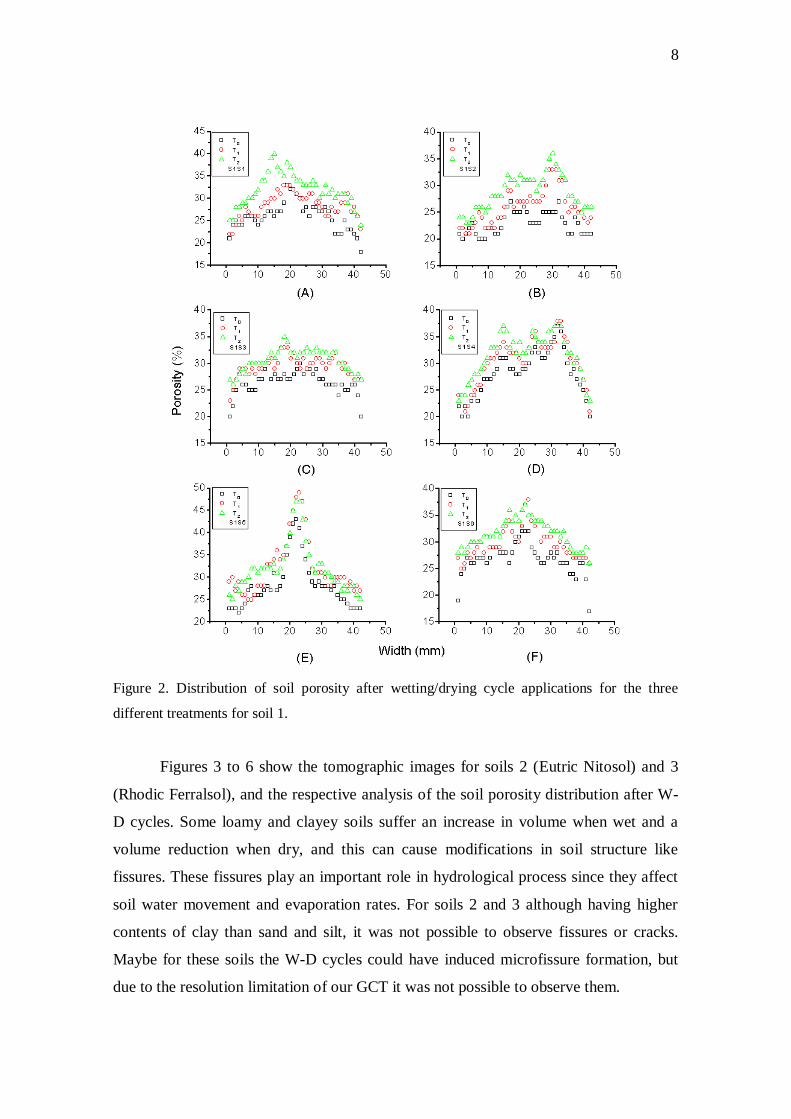
Figure 2 shows a quantitative analysis of soil porosity in the slice of analysis
after application of the cycles. Analyzing the graphs in Fig. 2 an increase in soil
porosity can be observed after the application of the cycles. All soil samples, with
exception to sample 4, presented increases in soil porosity with the increase of the
number of cycles. For sample 4 the same soil porosity was found for all treatments. The

7
increase in soil porosity probably occurred due to modifications in soil volume during
wetting and drying. During wetting an increase in the height of the soil column was
observed and after drying a decrease. Therefore, during wetting and after drying the
process of friction between soil column and cylinder wall can occur influencing the
adequate settlement of the sample. For soil 1 an increase was observed after the W-D
cycles in the height of the soil column near the cylinder wall, for samples 1, 2, 5, and 6.
This increase was about 1 mm and occurred only after T1. For sample 1 after T2 it is
possible to observe (Figs. 1 and 2) one hole (macropore) with an area of 6.44 mm2. For
sample 2 the area of the observed hole is 3.41 mm2 for T1 and it increased to 4.31 mm
2
for T2. For sample 5 the size of the hole increased from 15.38 to 23.70 mm2 between T0
and T1 and decreased to 21.89 mm2 after 9 W-D cycles. These increases in hole areas
could be due to the influence of the friction between the soil column and the cylinder
wall. This behavior could explain the increase in soil porosity after W-D cycles.
Hussein and Adey [23] found a progressive increase in soil porosity with successive W-
D cycles. These authors observed modifications in soil structure changing from massive
in plowed (disturbed) soil to complex crumb, block and platy structures after successive
cycles. In this work [23] the proportion of voids found in the disturbed soil was lower
than 11.3 %, and after a fast capillary wetting the observable porosity increased to 23.9
% after only one cycle. The authors called the observable porosity that in which large
external pores, cracks, and small voids were excluded and would, therefore, be less than
the true soil porosity. Pardini et al. [4] also indicated possible variations of surface
roughness, porosity, and pore size distribution during W-D cycles. They found after
three W-D cycles an increase in soil porosity induced by the formation of big cracks and
fissures. The presence of cracks was not observed in our soil samples, although W-D
cycles could promote the formation of microfissures. Another process influenced by W-
D cycles is soil aggregation, because hydration and dehydration action produces cycles
of contact and retraction of clay particles and aggregates. Li et al. [24] observed that W-
D cycles can change aggregate sizes affecting pore size distribution. In this experiment
[24] the authors observed the formation of small, shallow cracks at the soil surface after
W-D cycles. Our soil 1 is composed mostly by sand, and because of this, swelling and
shrinking were not present. Generally this kind of behavior occurs in some clayey soils
in which it is common to observe soil cracks or fissures [8].
8
Figure 2. Distribution of soil porosity after wetting/drying cycle applications for the three
different treatments for soil 1.
Figures 3 to 6 show the tomographic images for soils 2 (Eutric Nitosol) and 3
(Rhodic Ferralsol), and the respective analysis of the soil porosity distribution after W-
D cycles. Some loamy and clayey soils suffer an increase in volume when wet and a
volume reduction when dry, and this can cause modifications in soil structure like
fissures. These fissures play an important role in hydrological process since they affect
soil water movement and evaporation rates. For soils 2 and 3 although having higher
contents of clay than sand and silt, it was not possible to observe fissures or cracks.
Maybe for these soils the W-D cycles could have induced microfissure formation, but
due to the resolution limitation of our GCT it was not possible to observe them.

9
Figure 3. Changes in soil structure induced by wetting/drying cycles for soil 2 (Eutric Nitosol).
Figures 3 and 4 exhibit similar results in comparison to those of soil 1, with
exception of samples 3, 5 and 6. These practically do not present differences in soil
porosity between T1 and T2. Alterations induced after 3 cycles of W-D became constant
with time until the application of 9 cycles. The process of W-D disperses and re-
organizes clay particles causing modifications in soil structure. This process could have
occurred with soil 2 (Fig. 3) affecting soil pore distributions, and increasing soil
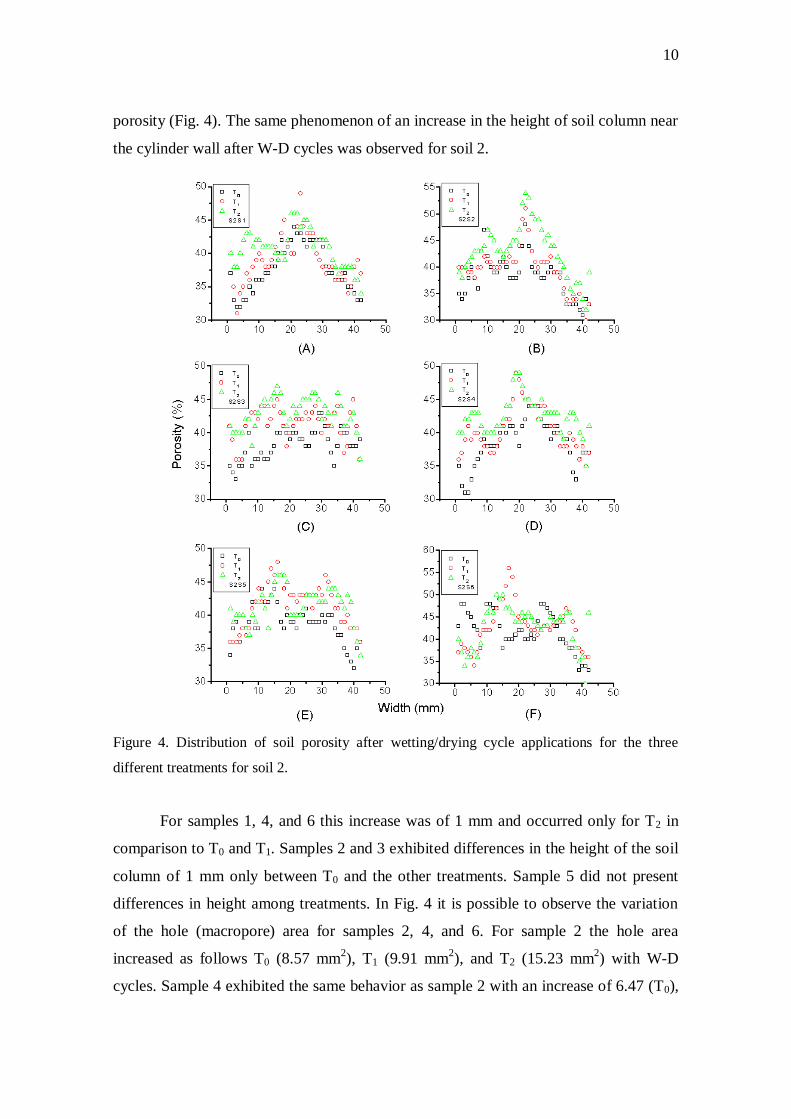
10
porosity (Fig. 4). The same phenomenon of an increase in the height of soil column near
the cylinder wall after W-D cycles was observed for soil 2.
Figure 4. Distribution of soil porosity after wetting/drying cycle applications for the three
different treatments for soil 2.
For samples 1, 4, and 6 this increase was of 1 mm and occurred only for T2 in
comparison to T0 and T1. Samples 2 and 3 exhibited differences in the height of the soil
column of 1 mm only between T0 and the other treatments. Sample 5 did not present
differences in height among treatments. In Fig. 4 it is possible to observe the variation
of the hole (macropore) area for samples 2, 4, and 6. For sample 2 the hole area
increased as follows T0 (8.57 mm2), T1 (9.91 mm
2), and T2 (15.23 mm
2) with W-D
cycles. Sample 4 exhibited the same behavior as sample 2 with an increase of 6.47 (T0),
11
8.68 (T1), and 10.96 mm2 (T2). For sample 6 only after successive wetting and drying
the existence of a hole with decreasing area from 9.26 to 4.83 mm2 was observed. For
soil 2 the increase in the height of the soil column with W-D cycles probably caused the
increase in soil porosity.
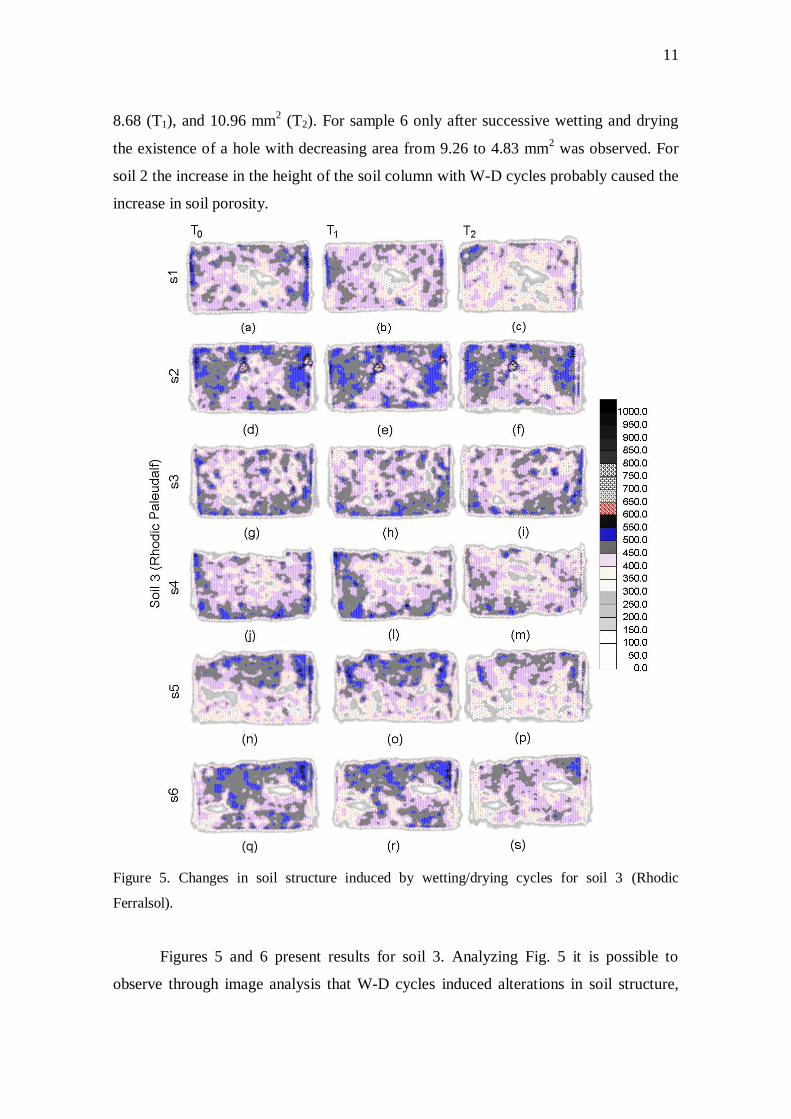
Figure 5. Changes in soil structure induced by wetting/drying cycles for soil 3 (Rhodic
Ferralsol).
Figures 5 and 6 present results for soil 3. Analyzing Fig. 5 it is possible to
observe through image analysis that W-D cycles induced alterations in soil structure,

12
but the modifications for some soil samples were smaller when compared with soils 1
and 2.
Figure 6. Distribution of soil porosity after wetting/drying cycle applications for the three
different treatments for soil 3.
In Fig. 6 samples 2 and 3 practically do not present differences in soil porosity
between treatments and samples 1, 5, and 6 have almost the same value of porosity
between T0 and T1. For soil 3 samples 1, 4, 5, and 6 presented increases in the height of
the soil column among treatments of 1.5 mm (sample 1) and 1 mm (samples 4, 5, and
6), and occurred only for T2 in comparison to the other treatments. All soil samples,
with exception of samples 2 and 4, presented holes (macropores) in their structure.
Samples 1, 5, and 6 exhibit the evolution in the size of the holes with the increase in the
13
number of W-D cycles. For sample 1 it is possible to observe one hole for T0 and T1
with areas of 18.54 and 23.66 mm2, respectively, and two holes with areas of 6.47 and
34.67 mm2 for T2. For sample 3 the size of the hole remained the same between T0 and
T1 (10.21 mm2) and presented a small increase for T2 (12.89 mm
2). For sample 5 the
size of the hole decreased between T0 (9.69 mm2) and T1 (4.31 mm
2), and for T2 the
area of the same hole was of 6.81 mm2. It is possible to observe a new hole for T2 with
an area of 7.61 mm2 for sample 5. Sample 6 presents two holes for each treatment with
areas of 23.60 and 15.01 mm2 (T0), 35.45 and 17.29 mm
2 (T1), and 38.81 and 30.57
mm2 (T2). The evolution in the size of the holes with the increase of the number of W-D
cycles can explain the increase in soil porosity for soil 3. The oscillation in soil porosity
values for samples 2 and 5 can be explained because soil 3 has not a well-defined
structure, and possible alterations in soil structure due to W-D cycles could be a random
process. Therefore, soil wetting or drying can allow increases or decreases in soil
porosity.
Table 2 shows the values of soil porosity obtained for the three soils used in the
experiment.
Table 2 reveals a tendency of an increase in soil porosity for soil 1 with
exception of sample 4 that did not present statistical differences between treatments. All
samples of this soil exhibit statistical differences at the 5 % probability level, through
the Duncan test. These results confirm and quantify the alterations in soil structure
induced by W-D cycles. The increase in soil porosity between T0 and T2, for soil 1, was
approximately 6 %. In the case of soil 2 the increase in soil porosity was of
approximately 7 % between T0 and T2. For soil 3 samples 2 and 3 did not present
statistical differences between treatments, and samples 2 and 5 demonstrated a decrease
in soil porosity after 3 W-D cycles indicating a random behavior of modifications in soil
structure when this soil was wetted and dried. The increase in soil porosity for soil 3
was approximately 4 %, and between T0 and T1 the soil porosity remained the same.
The results presented in Table 2 ratify that W-D cycles, dominated by the soil friction
between soil column and core cylinder wall, influence the inner structure of the soil and
can affect soil water distribution or retention (Figure 7).

14
Table 2. Soil porosity for the different treatments for the soils submitted to
wetting/drying cycles.
Soil samples
Xanthic Ferralsol
T0
Soil porosity (%)
T1
T2
1 33 4 (12)a
34 3 (9)a 36 4 (11)
b
2 30 2 (7)a
30 3 (10)a 33 3 (9)
b
3 33 2 (6)a
33 3 (9)a 35 2 (6)
b
4 35 4 (11)a
35 4 (11)a 36 5 (14)
a
5 35 4 (11)a
36 5 (14)a,b
37 6 (16)b
6 34 2 (6)a
34 3 (9)a 36 4 (11)
b
Average 33 2 (6)
34 2 (6) 35 2 (6)
Eutric Nitosol
1 38 5 (13)a
37 4 (11)a 40 3 (8)
b
2 39 4 (10)a
39 4 (10)a 43 4 (9)
b
3 38 3 (8)a
41 2 (5)b 42 2 (5)
b
4 39 3 (8)a
39 2 (5)a 41 2 (5)
b
5 40 3 (8)a
41 3 (7)a,b
42 3 (7)b
6 40 3 (8)a
43 5 (12)b 43 5 (12)
b
Average 39 1 (3)
40 2 (5) 42 1 (2)
Rhodic Ferralsol
1 51 5 (10)a
51 5 (10)a 55 6 (11)
b
2 45 4 (9)a
44 3 (7)a 45 4 (9)
a
3 48 4 (8)a
48 5 (10)a 49 4 (8)
a
4 47 4 (9)a
49 4 (8)b 50 4 (8)
b
5 50 5 (10)a
49 4 (8)a 53 4 (8)
b
6 46 4 (9)a
47 4 (9)a 51 4 (8)
b
Average 48 2 (4)
48 3 (6) 50 3 (6) Different letters are statistically different (P=0.05) through the Duncan test. The test only was applied between samples of same soil, but it was not applied between soils. Values between parentheses represent the coefficient of variation (%).
It is very important have in mind that soil sampling procedures can affect soil
structure causing compaction near the cylinder wall. Pires et al. [25] evaluated the
influence of different cylinder sizes in soil structure, showing a density gradient from
the center to the edge of the samples indicating a clear tendency of compaction near the
edge. In this work [25] the authors indicated that cylinders with volume of 100 cm3
caused the lowest impact in soil structure in comparison to other of dimensions of 25,
50 and 55 cm3. Having this influence of sampling in mind, to calculate soil porosity we
used areas smaller than the real sample size inside the cylinder, eliminating the
compacted borders. These areas were selected at least 7 mm away from the edges of
cylinder and 5 mm away from the bottom and the top of the samples. Cautious

15
procedures were also adopted during sampling to avoid friction between soil core and
the inner wall of cylinder. Rogasik et al. [26] and Baveye et al. [27] present two
important reports about the effect of sampling volume on some soil physical properties.
These authors [26, 27] try to determine the smallest instrumental volume of influence
that leads to low variance values when measurements are performed at different regions
in a certain area of soil samples.
Table 3 and Figure 7 ratifies the hypothesis that alterations in soil structure cause
modifications in soil water retention. This result has important consequences in
agricultural applications because these modifications in soil structure can affect plant
and root development, and the evaluation of soil water retention curves [21]. For soil 1
it was observed that after the application of 3 and 9 W-D cycles a higher amount of
water remained inside the soil samples. This result is important because this water can
be used by the plant and the root. Fig. 7A shows that for high matric potentials there is
no difference between T1 and T2 for soil 1 (Table 3), however after 60 cm of water
column (mesopore region) statistical differences (Student test) occur between
treatments. Soils 2 and 3 (Figs. 7B and 7C) exhibit the same behavior between T1 and
T2, however, for the former, only after 800 cm of water column (small mesopore region)
there are statistical differences between treatments and, for the latest, it is possible to
identify statistical differences for all matric potentials (Table 3). This difference in soil
water retention was probably caused by modifications in soil structure induced by W-D
cycles. Sarmah et al. [28] found a decrease in water infiltration rate after W-D cycles
probably due to the slaking and collapse of microaggregates. This collapse alters the
inner structure of the soil affecting its porosity. Modifications in the pore shape and in
the ratio between micro and mesoporosities are probably induced after W-D cycles
having an impact on water retention characteristics. Phogat and Aylmore [29] showed
changes in soil macroporosity distribution on wetting and subsequent drying process,
with the macroporosity decreasing after W-D cycles. This result indicates instability in
the system upon wetting. In our case an increase in the number of micropores and
mesopores with subsequent W-D cycles probably occurred, because a larger quantity of
water remained inside the mesopores and micropores for T2 in soils 1, 2, and 3. Sartori
et al. [30] and Pagliai et al. [31] discussed the influence of W-D cycles in soil porosity,
pore shape, and pore size distribution. Their results [30, 31] demonstrate an increase in

16
soil porosity for pores in the range of 30 m to 1 mm and strong modifications in the
shape and pore size distribution after W-D cycles.
(A)
(B)
(C)
Figure 7. Soil water retention curves obtained for treatments T1 (3 cycles) and T2 (9 cycles of
wetting/drying) for: (A) Xanthic Ferralsol, (B) Eutric Nitosol, and (C) Rhodic Ferralsol.
Xanthic Ferralsol
0.1
1
10
100
1000
0.1 0.15 0.2 0.25 0.3 0.35 0.4
m3.m
-3
m
m o
f H
2O
T0
T1
T2
Eutric Nitosol
0.1
1
10
100
1000
0.2 0.25 0.3 0.35 0.4 0.45
m3.m
-3
m (
m o
f H
2O
)
T0
T1
T2
Rhodic Ferralsol
0.1
1
10
100
1000
0.2 0.25 0.3 0.35 0.4 0.45 0.5
m3.m
-3
m (
m o
f H
2O
)
T0
T1
T2

17
Table 3. Matric potential (m) and soil water content () for each applied pressure for
the Xanthic Ferralsol, Eutric Nitosol, and Rhodic Ferralsol.
Xanthic Ferralsol Eutric Nitosol Rhodic Ferralsol
T1 T2 T1 T2 T1 T2
m
(m of H2O)
(m3.m
-3)
(m
3.m
-3)
(m
3.m
-3)
(m
3.m
-3)
(m
3.m
-3)
(m
3.m
-3)
0.0 0.3617a
0.3704a
0.4309a
0.4325a
0.4873a
0.5124b
0.1 0.3380a
0.3442a
0.3959a
0.3970a
0.4343a
0.4635b
0.2 0.3099a
0.3147a
0.3761a
0.3780a
0.4138a
0.4394b
0.6 0.2441a
0.2521a
0.3448a
0.3469a
0.3810a
0.3988b
1.2 0.2060a
0.2188b
0.3277a
0.3292a
0.3619a
0.3754b
2.0 0.1837a
0.2002b
0.3161a
0.3176a
0.3490a
0.3599b
3.3 0.1666a
0.1862b
0.3056a
0.3074a
0.3372a
0.3462b
4.3 0.1591a
0.1802b
0.3004a
0.3024a
0.3314a
0.3395b
6.0 0.1511a
0.1739b
0.2941a
0.2966a
0.3244a
0.3316b
8.0 0.1452a
0.1693b
0.2890a
0.2919a
0.3187a
0.3252b
15.0 0.1351a
0.1616b
0.2786a
0.2827b
0.3070a
0.3126b
40.0 0.1248a
0.1539b
0.2645a
0.2707b
0.2912a
0.2962b
80.0 0.1202a
0.1506b
0.2559a
0.2637b
0.2814a
0.2865b
120.0 0.1182a
0.1492b
0.2513a
0.2601b
0.2762a
0.2816b
150.0 0.1173a
0.1486b
0.2489a
0.2583b
0.2735a
0.2790b
Different letters are statistically different (P=0.05) through the Student test. The test only was applied between
samples of same soil and treatments, but it was not applied between soils.
Bresson and Moran [32] evaluated structural changes induced by wetting and
drying showing the changes in porosity for coarse and fine seedbeds after W-D cycles
along the height of samples. These authors [32] show, for coarse seedbed after drying, a
structural degradation of the bottom of the sample mainly due to coalescence and
formation of many 20-50 m pores due to slaking (or physical dispersion) in fine and
few coarse aggregates. For fine seedbed the main process involved in the structural
degradation was the agglomeration of the particles and/or microfragments of the dust
fraction changing soil porosity. Unfortunately the GCT scanner used by us has a
resolution not sufficient to investigate micrometric scales and to show possible
modifications in pore shape or number of micropore and mesopores. In spite of this
limitation, the results obtained in this study confirm the effect of W-D cycles on soil
porosity and its impact in soil structure.
Acknowledgements

18
To FAPESP (grant no. 02/05066-5) for financial support.
References
[1] M. Kutílek, D.R. Nielsen, Soil hydrology, Catena Verlag, Germany, 1984.
[2] J.C.M. Oliveira, C.R. Appoloni, M.M. Coimbra, K. Reichardt, O.O.S. Bacchi, E.
Ferraz, S.C. Silva, W. Galvão Filho, Soil Till. Res. 48 (1998) 127.
[3] D. Regüés, G. Pardini, F. Gallart, Catena 25 (1995) 199.
[4] G. Pardini, G. Vigna Guidi, R. Pini, D. Regüés, F. Gallart, Catena 27 (1996) 149.
[5] A. Marsili, P. Servadio, M. Pagliai, N. Vignozzi, Soil Till. Res. 49 (1998) 185.
[6] E.J. Lundquist, L.E. Jackson, K.M. Scow, Soil Biol. Bioch. 31 (1999) 1031.
[7] K. Denef, J. Six, K. Paustian, R. Merckx, Soil Biol. Bioch. 33 (2001) 2145.
[8] V.Y. Chertkov, I. Ravina, Theor. Appl. Frac. Mech. 34 (2000) 61.
[9] C.M.P. Vaz, S. Crestana, S. Mascarenhas, P.E. Cruvinel, K. Reichardt, R, Stolf, Soil
Techn. 2 (1989) 313.
[10] V.K. Phogat, L.A.G. Aylmore, R.D. Schuller, Soil Sci. Soc. Am. J. 55 (1991) 908.
[11] V. Rasiah, L.A.G. Aylmore, Aust. J. Soil Res. 36 (1998) 485.
[12] J. Perret, S.O. Prasher, A. Kantzas, C. Langford, Soil Sci. Soc. Am. J. 63 (1999)
1530.
[13] A. Macedo, S. Crestana, C.M.P. Vaz, Soil Till. Res. 49 (1998) 249.
[14] A. Macedo, C.M.P. Vaz, J.M. Naime, P.E. Cruvinel, S. Crestana, Powder Techn.
101 (1999) 178.
[15] C.R. Appoloni, A. Macedo, C.P. Fernandes, P.C. Philippi, in: M.I. Bueno (Ed),
Proceedings of SARX-2000, Resumos expandidos, 2000.
[16] H. Rogasik, I. Onasch, J. Brunotte, D. Jegou, O. Wendroth, in: F. Mees, R.
Swennen, M. van Geet, P. Jacobs (Eds), Applications of X-ray computed tomography in
the geosciences, Geological Society, London, Special Publications, 215, 2003, pp.151-
165.
[17] L.F. Pires, J.R. Macedo, M.D. Souza, O.O.S. Bacchi, K. Reichardt, Appl. Radiat.
Isot. 59 (2003) 17.
[18] L.F. Pires, R.C.J. Arthur, R.P. Camponez do Brasil, V. Correchel, O.O.S. Bacchi,
K. Reichardt, Brazilian J. Physics 34 (2004) 728.
19
[19] MICROVIS, Microvis – Programa de Reconstrução e Visualização de Imagens
Tomográficas, Guia do Usuário, EMBRAPA/CNPDIA, São Carlos, Brasil, 2000.
[20] L.F. Pires, J.R. Macedo, M.D. Souza, O.O.S. Bacchi, K. Reichardt, Appl. Radiat.
Isot. 57 (2002) 375.
[21] L.F. Pires, O.O.S. Bacchi, K. Reichardt, Soil Till. Res. (2004). (in press)
[22] E.S.B. Ferraz, R.S. Mansell, Technical Bulletin, n° 807. IFAS, Flórida, USA, 1979,
p.51.
[23] J. Hussein, M.A. Adey, Geoderma 85 (1998) 63.
[24] D. Li, B. Velde, T. Zhang, Geoderma 118 (2004) 191.
[25] L.F. Pires, O.O.S. Bacchi, K. Reichardt, Aust. J. Soil Res. 42 (2004) 857.
[26] H. Rogasik, J.W. Crawford, O. Wendroth, I.M. Young, M. Joschko, K. Ritz, Soil
Sci. Soc. Am. J. 63 (1999) 741.
[27] P. Baveye, H. Rogasik, O. Wendroth, I. Onasch, J.W. Crawford, Meas. Sci.
Technol. 13 (2002) 775.
[28] A.K. Sarmah, U. Pillai-McGarry, D. McGarry, Soil Till. Res. 38 (1996) 17.
[29] V.K. Phogat, L.A.G. Aylmore, Aust. J. Soil Res. 27 (1989) 313.
[30] G. Sartori, G.A. Ferrari, M. Pagliai, Soil Sci. 139 (1985) 523.
[31] M. Pagliai, M. La Marca, G. Lucamante, Soil Sci. 144 (1987) 128.
[32] L.M. Bresson, C.J. Moran, Eur. J. Soil Sci. 46 (1995) 205.