A molecular dynamics study of temperature dependent wetting ...
107
Scholars' Mine Scholars' Mine Doctoral Dissertations Student Theses and Dissertations Fall 2020 A molecular dynamics study of temperature dependent wetting in A molecular dynamics study of temperature dependent wetting in alkane-water systems alkane-water systems Pauf Neupane Follow this and additional works at: https://scholarsmine.mst.edu/doctoral_dissertations Part of the Physics Commons Department: Physics Department: Physics Recommended Citation Recommended Citation Neupane, Pauf, "A molecular dynamics study of temperature dependent wetting in alkane-water systems" (2020). Doctoral Dissertations. 2930. https://scholarsmine.mst.edu/doctoral_dissertations/2930 This thesis is brought to you by Scholars' Mine, a service of the Missouri S&T Library and Learning Resources. This work is protected by U. S. Copyright Law. Unauthorized use including reproduction for redistribution requires the permission of the copyright holder. For more information, please contact [email protected].
-
Upload
khangminh22 -
Category
Documents
-
view
3 -
download
0
Transcript of A molecular dynamics study of temperature dependent wetting ...

Scholars' Mine Scholars' Mine
Doctoral Dissertations Student Theses and Dissertations
Fall 2020
A molecular dynamics study of temperature dependent wetting in A molecular dynamics study of temperature dependent wetting in
alkane-water systems alkane-water systems
Pauf Neupane
Follow this and additional works at: https://scholarsmine.mst.edu/doctoral_dissertations
Part of the Physics Commons
Department: Physics Department: Physics
Recommended Citation Recommended Citation Neupane, Pauf, "A molecular dynamics study of temperature dependent wetting in alkane-water systems" (2020). Doctoral Dissertations. 2930. https://scholarsmine.mst.edu/doctoral_dissertations/2930
This thesis is brought to you by Scholars' Mine, a service of the Missouri S&T Library and Learning Resources. This work is protected by U. S. Copyright Law. Unauthorized use including reproduction for redistribution requires the permission of the copyright holder. For more information, please contact [email protected].
A MOLECULAR DYNAMICS STUDY OF TEMPERATURE DEPENDENT WETTING
IN ALKANE-WATER SYSTEMS
by
PAUF NEUPANE
A DISSERTATION
Presented to the Graduate Faculty of the
MISSOURI UNIVERSITY OF SCIENCE AND TECHNOLOGY
In Partial Fulfillment of the Requirements for the Degree
DOCTOR OF PHILOSOPHY
in
PHYSICS
2020
Approved by
Dr. Gerald Wilemski, Advisor Dr. Julia Medvedeva
Dr. Paul Parris Dr. Thomas Vojta
Dr. Barbara Wyslouzil

Copyright 2020
PAUF NEUPANE
All Rights Reserved

PUBLICATION DISSERTATION OPTION
iii
This dissertation consists of the following three articles which have been submitted
for publication, or will be submitted for publication as follows:
Paper I: Pages 17-46 are intended for submission to Journal of Chemical Physics.
Paper II: Pages 47-72 are intended for submission to Physical Chemistry Chemical
Physics.
Paper III: Pages 73-85 are intended for submission to Physical Chemistry Chemical
Physics.

iv
ABSTRACT
The wetting behavior of aqueous organic systems is of great importance in several
environmental and industrial processes such as the formation and growth of atmospheric
aerosols, crude oil recovery from an oil field, onsite cleaning of natural gas, and clean-up of
oil spills. In this work, we employed molecular dynamics (MD) simulations to explore the
temperature dependent wetting behavior of octane and nonane on water in planar interfaces
as well as in nanodroplets using PYS alkane and SPC/E and TIP4P/2005 water models.
For planar interfaces, we found unusual wetting behavior of octane and nonane on
SPC/E water, but generally not on TIP4P/2005 water, at lower temperatures, where the
spreading coefficient decreased and the contact angle increased with increasing tempera
ture. At higher temperatures, these contact angles were found to decrease with increasing
temperatures as the usual high temperature wetting transition was approached.
For nanodroplets, the contact angle of octane and nonane on both SPC/E and
TIP4P/2005 water was found to unusually increase with increasing temperature. Configu
rational fluctuations of the nanodroplets were found to be greatly reduced for larger values
of the potential cut-off radius. Moreover, the contact angles were calculated for different
ratios of octane and water and found to be nearly independent of the liquid species ratio.
In addition, we also studied the physical properties as well as molecular orientations
of octane and nonane using PYS, NERD and a modified TraPPE-UA alkane model. Molec
ular orientations were found to be temperature dependent in the liquid-vapor interface, but
not in the bulk region. At lower temperatures, the mean molecular orientation was more
perpendicular to the surface on the liquid side of the Gibbs dividing surface and more
parallel to the surface on the vapor side. These orientational trends were mirrored in the
freezing of NERD octane and nonane at 195 K and 210 K, respectively, with the oriented
surface layer freezing first.

v
ACKNOWLEDGMENTS
First and foremost, I would like to express my sincere gratitude to my advisor,
Dr. Gerald Wilemski, for patiently and tirelessly guiding me in this exciting research
field. It is my privilege to be his graduate student, and I truly enjoyed each moment spent
together. This work would not have been possible without his intense guidance, support
and encouragement. I am heartily thankful for his tireless efforts that helped me to grow as
a researcher.
I am indebted to my advisory committee members Dr. Barbara Wyslouzil, Dr. Julia
Medvedeva, Dr. Paul Parris and Dr. Thomas Vojta for accessibility and fruitful discussions.
I would like to thank Dr. George D. Waddill, Dr. Jerry L. Peacher, Dr. Alexey Yamilov,
Pamela J. Crabtree, Janice Gargus, Russell L. Summers and Andrew L. Stubbs for their help
during my Ph.D. study. I am thankful to my friends at the Physics department for all the
enjoyable times created and spent together. I would also like to thank Dr. Bijay Shrestha,
Nancy Uri, and my fellow friends from Nepal for making me feel at home.
I am very thankful to my mother for her unconditional love, support, and guidance.
I have no words to acknowledge my late father who always dreamt of me becoming a
successful scientist. To my sister Muna, thank you for supporting me. I am also thankful to
my relatives and friends who have helped me directly or indirectly during my Ph. D. study.
Finally, I would like to express my gratitude to my beloved wife Kamala for her
endless love, care and support.

vi
TABLE OF CONTENTS
Page
PUBLICATION DISSERTATION OPTION....................................................................... iii
ABSTRACT............................................................................................................................ iv
ACKNOWLEDGMENTS......................................................................................................... v
LIST OF ILLUSTRATIONS.................................................................................................. ix
LIST OF TABLES..................................................................................................................... xiv
SECTION
1. INTRODUCTION............................................................................................................. 1
1.1. OVERVIEW OF WETTING PHYSICS ............................................................. 1
1.2. MOLECULAR DYNAMICS................................................................................ 4
1.3. INTEGRATION SCHEME................................................................................... 6
1.4. FORCE FIELDS .................................................................................................... 7
1.5. RESULTS OF PAPER I ........................................................................................ 11
1.6. RESULTS OF PAPER II ........................................................................................ 13
1.7. RESULTS OF PAPER III...................................................................................... 15
PAPER
I. PROPERTIES AND FREEZING AT THE LIQUID-VAPOR INTERFACE OF n-OCTANE AND n-NONANE FROM MOLECULAR DYNAMICS SIMULATIO N S................................................................................................................................ 17
ABSTRACT...................................................................................................................... 17
1. INTRODUCTION ................................................................................................. 18

2. M OD ELS............................................................................................................... 20
3. SIMULATION DETAILS..................................................................................... 22
4. RESULTS ............................................................................................................... 24
4.1. CUTOFF AND TIMESTEP DEPENDENCE OF SURFACE TENSIO N ........................................................................................................... 24
4.2. DENSITY PROFILES AND INTERFACIAL W IDTHS.................... 25
4.3. VAPOR-LIQUID COEXISTENCE........................................................ 28
4.4. TEMPERATURE DEPENDENT SURFACE TEN SIO N................... 30
4.5. ORIENTATION AND FREEZING ....................................................... 31
5. SELECTED RESULTS FOR m-TraPPE-UA NONANE................................... 38
6. CONCLUSIONS.................................................................................................... 41
ACKNOWLEDGEMENTS ............................................................................................. 42
REFERENCES ................................................................................................................. 42
II. MOLECULAR DYNAMICS STUDY OF TEMPERATURE DEPENDENT WETTING IN ALKANE-WATER SYSTEMS....................................................................... 47
ABSTRACT...................................................................................................................... 47
1. INTRODUCTION ................................................................................................. 48
2. SIMULATION DETAILS..................................................................................... 50
3. RESULTS ............................................................................................................... 54
3.1. EFFECT OF CUTOFF RADIUS ON INTERFACIAL TENSIONS .. 54
3.2. TEMPERATURE DEPENDENCE OF THE INTERFACIAL TENSIONS......................................................................................................... 56
3.3. TEMPERATURE DEPENDENT W ETTIN G ...................................... 60
4. CONCLUSIONS.................................................................................................... 65
ACKNOWLEDGEMENTS ............................................................................................. 66
APPENDIX....................................................................................................................... 67
REFERENCES ................................................................................................................. 68
vii

III. TEMPERATURE DEPENDENT WETTING AND STRUCTURE OF ALKANE- WATER NANODROPLETS............................................................................................ 73
ABSTRACT...................................................................................................................... 73
1. INTRODUCTION ................................................................................................. 73
2. METHOD ............................................................................................................... 76
2.1. FORCE FIELDS........................................................................................ 76
2.2. SIMULATION DETAILS ....................................................................... 76
3. RESULTS ............................................................................................................... 77
3.1. EFFECT OF THE LJ CUTOFF RADIUS ON W ETTINGE............. 77
3.2. VARYING OCTANE/WATER RATIO................................................. 80
3.3. TEMPERATURE DEPENDENT WETTING STUDIES................... 81
4. CONCLUSIONS.................................................................................................... 82
REFERENCES ................................................................................................................. 83
SECTION
2. SUMMARY AND CONCLUSIONS............................................................................. 86
REFERENCES ......................................................................................................................... 88
viii
VITA 92

ix
LIST OF ILLUSTRATIONS
Figure Page
1.1. Two possible wetting configurations for alkane on water in bulk system: (a)perfect wetting (left) and (b) partial wetting (right).................................................. 2
1.2. Two possible structure of aqueous organic nanodroplet: (a) Core-shell (CS)structure (left) and (b) Russian-doll (RD) structure (right)...................................... 2
1.3. Temperature dependence of contact angle 0 for: (a) hexane on brine in planarinterface (left), figure taken from Ref. [11] by permission of APS and (b) nonane on water in nanodroplet (right). Markers and line in the left panel represent experimental [9] and theoretical [11] results, respectively. MD simulation results are shown in the right panel [13] by permission of A /P .......... 3
1.4. Two types of non-bonded interactions ( ^ ) in united atom (UA) octane............... 8
1.5. Bonded interactions. From left to right, bond stretching, bond angle vibrationand torsional interactions.............................................................................................. 8
1.6. Water models. From left to right, 3-site, 4-site, 5-site and 6-site water m odels... 9
1.7. (Left) The angle 0 made by the alkane end-to-end vector with the normal to the interface. Pink spheres are CH3 groups, and green spheres are CH2 groups.(Right) Temperature dependent mean molecular orientation of PYS nonane,as a function of position................................................................................................ 11
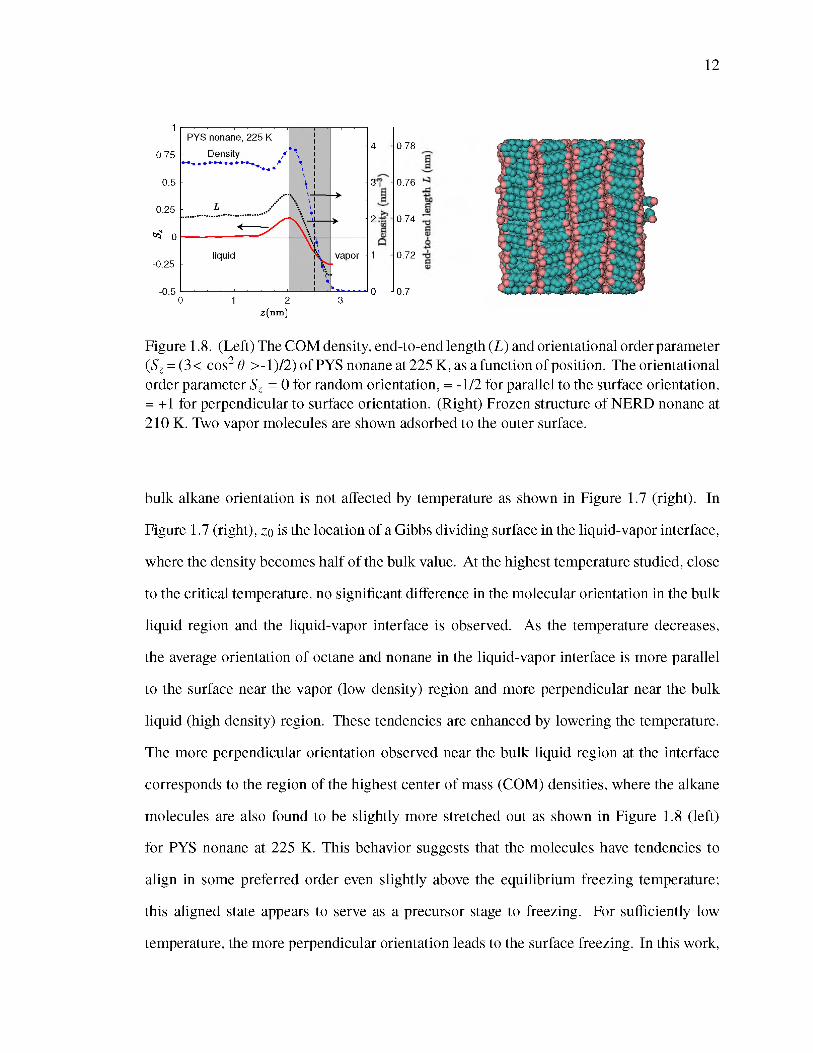
1.8. (Left) The COM density, end-to-end length (L) and orientational order parameter (Sz = (3< cos2 0 >-1)/2) of PYS nonane at 225 K, as a function of position. The orientational order parameter Sz = 0 for random orientation, =-1/2 for parallel to the surface orientation, = +1 for perpendicular to surface orientation. (Right) Frozen structure of NERD nonane at 210 K. Two vapor molecules are shown adsorbed to the outer surface.................................................. 12
1.9. Experimental spreading coefficients S of octane and heptane on water.[4, 5]Figure reprinted from Ref. [5] with permission from Elsevier................................ 13
1.10. Spreading coefficient of octane on water (left) and nonane on water (right) in planar interface. Circles and diamonds are for SPC/E water and TIP4P/2005 water, respectively. Lines are obtained from fits to the simulated interfacial tension values. Asterisk and star are calculated using experimental values ofthe interfacial tensions................................................................................................... 14
x
1.11. Contact angle formed by octane on water (left) and nonane on water (right) in planar interface. Circles and diamonds are for SPC/E water and TIP4P/2005 water, respectively. Lines are obtained from fits to the simulated interfacial tension values. Asterisk and star are calculated using experimental values ofthe interfacial tensions................................................................................................... 15
1.12. Contact angle formed by octane on water (left) and nonane on water (right)in nanodroplets. Circles and diamonds are for SPC/E water and TIP4P/2005 water, respectively.......................................................................................................... 16
PAPER I
1. Surface tensions of PYS nonane for different LJ cutoff radii rc and scaled radii r* at 295 K (upper figure) and 225 K (lower figure). Squares, triangles, and circles represent the surface tensions for 1 fs, 2 fs and 5 fs time steps, respectively. The filled markers represent tail corrected surface tensions, andthe corresponding open markers are their counterparts without tail corrections. . 25
2. Molecular number density profiles of PYS (upper panel) and NERD (lower panel) nonane for different temperatures. Points are calculated using the binsize of 0.1 nm. Lines are the fitted profiles, calculated using Eq. 2....................... 26
3. Comparision of molecular density profiles (large points) and density profiles calculated from center of mass (small points) of PYS nonane for 225 K (blue)and 375 K (magenta) temperatures.............................................................................. 27
4. The “10-90” interfacial thickness of PYS (squares) and NERD (circles) nonanefor different temperatures.............................................................................................. 27
5. Liquid vapor coexistence curve for PYS (squares) and NERD (circles) octane (upper figure) and nonane (lower figure). Dashed line shows NIST results,with the critical point represented by a star................................................................ 29
6. Vapor pressure plotted on log scale versus inverse temperature for PYS (squares)and NERD (circles) octane (left figure) and nonane (right figure). Dashed line represents NIST results................................................................................................. 29
7. Temperature dependent surface tension plotted for PYS (squares) and NERD(circles) octane (upper figure) and nonane (lower figure) and compared with NIST surface tension values (dashed line). The enlarged view of low temperature surface tension values of octane are shown in the inset.................................. 31
8. Average orientations of PYS octane (upper panel) and PYS nonane (lowerpanel) molecules............................................................................................................ 32
9. Order parameter Sz (red line, left scale), COM number density (blue line andmarkers, right scale) and end-to-end length L (black dotted line, right scale, where Lmax = 1 nm) of PYS nonane at 225 K........................................................... 33

xi
10. Time evolution of Sz and orientation angle of NERD nonane at 210 K................. 35
11. COM density profiles of PYS and NERD nonane at 210 K averaged over thetime period 2.0-2.2 ns. Snapshot shows the molecular configuration at 2.1 ns.... 36
12. COM density profiles of NERD octane at 195 K after surface freezing in both liquid-vapor interfaces. Snapshot shows the molecular configuration at 25 ns.... 36
13. Snapshot of frozen NERD nonane at 210 K. Two vapor molecules are shownadsorbed on the outer surface....................................................................................... 37
14. COM density profile of frozen NERD nonane at 200 K.......................................... 37
15. Liquid vapor coexistence curve for PYS nonane (squares) and m-TraPPE-UAnonane (diamonds). Dashed line shows NIST results, with the critical point represented by a star....................................................................................................... 39
16. Vapor pressure plotted on log scale versus inverse temperature for PYS nonane(squares) and m-TraPPE-UA nonane (diamonds). Dashed line represents NIST results............................................................................................................................... 39
17. Temperature dependent surface tension plotted for PYS nonane (squares) andm-TraPPE-UA nonane (diamonds) and compared with NIST surface tension values (dashed line). Circles are the surface tension values for the rigid bond TraPPE-UA model, taken from Ref. [56]................................................................... 40
18. Average molecular orientations of m-TraPPE-UA nonane........................................ 41
PAPER II
1. Simulated surface tensions of SPC/E water (diamonds), PYS octane (squares)and the octane-water interfacial tensions (circles) plotted as a function of LJ cutoff at 300 K. Filled markers account the long range tail corrections to the interfacial tensions, while the open markers do not.................................................. 55
2. Density profiles (molecular) of SPC/E water (left) and PYS octane (right) plotted for different temperatures. Points are the densities calculated using binsize of 0.1 nm. Dotted and solid lines represent the profiles fitted using Eq. 2. .. 57
3. Density profiles (molecular) of SPC/E water and PYS octane in the octane-water system at 215 K (diamonds) and at 400 K (circles) temperatures. Points are the densities calculated using bin size of 0.1 nm. The fitted profiles for water and octane are represented by the dotted and solid lines, respectively......... 57

4. Surface tension of SPC/E water (left) and TIP4P/2005 water (right) as a function of temperature. Our results (diamonds) are compared with two previous studies.[51, 55] The plus signs and the solid lines represent experimental results.[32, 49] In the inset, the dashed line is obtained by fitting the surface tension values at higher temperatures T > 275K ...................................................... 58
5. Surface tensions of octane (upper panel) and nonane (lower panel) are plotted as a function of temperature. Our PYS model results (squares) are comparedwith NIST surface tension values (solid lines).[33] ................................................. 59
6. Octane-water (left) and nonane-water (right) interfacial tension for PYS alkane with TIP4P/2005 water (diamonds) and SPC/E water (circles). Our results are compared with experimental octane - water interfacial tensions (asterisk -Ref. [1], star-R ef. [2])................................................................................................. 60
7. Spreading coefficient (S) of octane on water (left) and nonane on water (right).The diamonds are for TIP4P/2005 water, and the circles are for SPC/E water.Lines are obtained from fits to the simulated interfacial tension values. The asterisk and star represent values calculated using experimental values of the interfacial tensions......................................................................................................... 61
8. The contact angle formed by octane on water (left) and nonane on water (right).The diamonds are for TIP4P/2005 water, and the circles are for SPC/E water.Lines are obtained from fits to the simulated interfacial tension values. The asterisk and star represent values calculated using experimental values of the interfacial tensions......................................................................................................... 62
9. Wetting transition temperatures for different n-alkane on water. Calculatedvalues from Ref. [17] are in excellent agreement with experiment......................... 63
10. Temperature dependence of the contact angle formed by nonane on SPC/E water when eOC=0.66 kJ/mol. Filled circles represent contact angles calculated using interfacial tensions. Open circles are the counter-part of the filled circles without long-range tail corrections to the interfacial tensions. Asterisk andstar are calculated using experimental values of the interfacial tensions............... 64
PAPER III
1. Center of mass distance of octane and SPC/E water dow versus simulationtime for rc= 1.25 nm (upper panel) and 2.50 nm (lower panel). Dashed lines separate the regions of partial wetting and perfect wetting configurations............ 78 2
2. Average contact angle versus rc for octane-water nanodroplets (upper panel -SPC/E water, lower panel - TIP4P/2005 water). Diamonds and squares are calculated using all configurations and excluding partial wetting configurations, respectively..................................................................................................................... 79
xii
xiii
3. The contact angle 6c was calculated using the geometry shown in the figureand the equation cos Qc = (r2 + R2 - d2)/(2rR); R and r are, respectively, the water and alkane droplet radii, and d is the distance between the centers............. 80
4. contours plot for octane-water nanodoplets for 210 K. The lower panel showsthe fitted contours........................................................................................................... 80
5. Contact angle for different octane num bers............................................................... 81
6. Temperature dependence of contact angle formed by octane (left) and nonane(right) on SPC/E water (squares) and on TIP4P/2005 water (circles).................... 82

xiv
LIST OF TABLES
Table Page
1.1. Comparision of Tm, Tc and yw for some popular water models with experimental results.................................................................................................................. 10
PAPER I
1. Interaction parameters for PYS, NERD and m-TraPPE-UA models....................... 21
PAPER II
1. Comparision of spreading coefficient for alkane on water for different eoc (&oc= 0.36 nm)....................................................................................................................... 51 2
2. Wetting transition temperatures, Tw from MD simulations and experiments........ 63

SECTION
1. INTRODUCTION
1.1. OVERVIEW OF WETTING PHYSICS
Alkane-water interfaces are widespread in nature and are commonly found in oil
fields and in atmospheric aerosols. These interfaces are also important participants in
numerous industrial processes, such as crude oil recovery process, onsite cleaning of nat
ural gas, and clean-up of oil spills. In atmospheric aerosols, alkanes form droplets with
water along with other organic molecules, inorganic particles and impurities. These aque
ous organic droplets play vital roles in important environmental processes such as cloud
condensation, climate change, ozone layer depletion, and acid rain deposition.[1] These
aerosols can also deteriorate health by causing several respiration related health issues.
One common feature of these planar (bulk) and curved (droplet) interfacial systems
is the wetting of water by the alkane. Alkane and water form a highly immiscible pair of
liquids, and two wetting configurations for alkane on water are possible: (a) a perfect wetting
configuration, in which alkane completely covers the water surface with zero contact angle,
and (b) a partial wetting configuration, in which alkane partially covers the water surface.
As illustrated in Figure 1.1, in planar interfaces, the former configuration is equiv
alent to complete spreading of alkane over the water surface, and the latter configuration
corresponds to a lens-like structure of the alkane drop on the slightly deformed water surface
with a contact angle 6, given by cos 6 = (yW - Ya - Yaw)/(2YaYaw).[2] Here, yw and y a
represent the surface tension of pure water and alkane, respectively and y aw is the interfacial
tension between them.

2
Alkane
W ater
Figure 1.1. Two possible wetting configurations for alkane on water in bulk system: (a) perfect wetting (left) and (b) partial wetting (right).
In aqueous organic nanodroplets, the wetting behavior of the liquid species deter
mines the structure. Perfect wetting corresponds to the complete engulfing of the water
droplet by the alkane and is referred to as a core-shell (CS) structure (left, Figure 1.2),
whereas partial wetting corresponds to the partial engulfing of a water droplet by alkane
and the structure is named a Russian-doll (RD) structure (right, Figure 1.2).
Figure 1.2. Two possible structure of aqueous organic nanodroplet: (a) Core-shell (CS) structure (left) and (b) Russian-doll (RD) structure (right).
The wetting behavior is characterized by the spreading coefficient S, defined as
S = y w - (ya + Jaw) for the alkane on water system.[2, 3] Usually, S is negative, implying
that y w < (ya + yaw). Thus, the free energy per unit area of the uncovered water surface is
less than the free energy per unit area of the remaining surfaces (alkane surface + alkane-
water interface). In such case, alkane partially wets water surface with a finite contact angle
B. As S increases, the free energy per unit area of the uncovered water surface increases
in comparision to the remaining surfaces, which increases the spreading tendency of the
alkane drop. Alkanes perfectly wet water when S = 0.

3
Figure 1.3. Temperature dependence of contact angle 6 for: (a) hexane on brine in planar interface (left), figure taken from Ref. [11] by permission of APS and (b) nonane on water in nanodroplet (right). Markers and line in the left panel represent experimental [9] and theoretical [11] results, respectively. MD simulation results are shown in the right panel[13] by permission of AIP.
A few experiments on the temperature dependence of the spreading coefficient of
octane and hexane on water in the planar interfaces showed that the S value increases towards
zero with increasing temperature.[4,5] Consistent with these studies, at higher temperatures,
several experimental studies have shown the wetting transition of different alkanes on
aqueous ionic solutions.[6-9] In addition, Rafai et al. also showed a decreasing trend of
contact angle (6) formed by hexane on brine (2.5 M) with increasing temperature, until
the system reaches the wetting transition.[9] The decreasing contact angle with increasing
temperature and the occurrence of the wetting transition at the higher temperatures observed
in the experiments have also been supported theoretically [10-12] (see Figure 1.3, left).
On the other hand, using molecular dynamics (MD) simulations, Hrahsheh and
Wilemski [13] showed a wetting behavior of nonane on water in a nanodroplet that is
contrary to that just described. They found a positive correlation of the contact angle with
temperature at lower temperatures, where nanodroplet simulations are feasible (see Figure
1.3, right).

4
Usually, the positive correlation of contact angle with temperature occurs for a pair of
partially miscible liquids having a lower consolute temperature.[14, 15] The components of
these partially miscible liquids become miscible below the consolute temperature. In these
systems, the wetting transition is also achieved somewhat above the consolute temperature
as the temperature is lowered. Since alkane and water are highly immisible, no consolute
temperature exists and the positive correlation of the contact angle with temperature is not
expected. Thus, the unusual temperature dependent behavior of the contact angle found in
the nonane-water nanodroplet simulations needs to be explored in order to understand how
this unusual behavior depends on the molecular models used, as well as to ascertain how
the structure of the nanodroplet depends on temperature.
In this work, we explored the temperature dependent wetting behavior of octane
and nonane on water at bulk interfaces as well as in nanodroplets. For this purpose, we
performed MD simulations for pure liquids (octane, nonane, water) as well as for pairs of
immiscible liquids (octane-water, nonane-water) for a wide range of temperatures.
1.2. MOLECULAR DYNAMICS
Molecular dynamics (MD) simulation is a numerical approach to generate time
evolved atomic trajectories by solving the Newtonian equations of motions (EOM) with
assumed interatomic interactions. These trajectories are then used to extract information
regarding the properties of the system such as temperature, pressure, density, surface tension,
etc.
For a system of N particles, the force Fi experienced by particle i located at ri
interacting with the other N - 1 particles is derived from the potential energy function V
Fi = -V iV (71, 72,...., 7N), (1.1)

5
that depends on the positions fj of all N particles. The potential energy function can be
expressed as the sum of potentials for non-bonded and bonded interaction sites,
V (rl, f2, . . . . ?N) = Vnon-bonded (fl, f2,...., Tn ) + Vbonded (fl, f2,...., Tn ). (1.2)
Interactions between bonded sites include bond vibration (2-body interaction), bond angle
vibration (3-body interaction) and torsional interaction (4-body interaction). Functional
forms of these interactions will be presented shortly. The non-bonded interactions are the
intermolecular or intramolecular interactions not covered by the bonded interactions. The
simplest form of the non-bonded interaction potential assumes only pair-wise interactions
and is given by1 N
Vnon-bonded(fl, f2, ...., Tn ) = ^ ^ ^ Vij(fi - f j ), (1.3)i j+i
where Vij is the potential energy of interaction between sites i and j located at Cartesian
position vectors f and f j , respectively. The Lennard Jones (LJ) potential VLJ is one of the
most commonly used non-bonded interaction potentials. It is a function of only the scalar
separation distance r between sites i and j :
Vlj (r) = 4ea \ 12r
a \ 6r ) (1.4)
In Eq. 1.4, e represents the depth of the potential well that defines the strength of the
interaction and a is the separation of the interacting sites for which VLJ = 0. Another
example is the Coulomb potential Vcouiomb
Vcouiomb(r) = ~ T ^ , (1.5)4ne0r 2
used for charged particle interactions. Here, q1 and q2 represent charges separated by a
distance r , and e0 is the permittivity of free space.

6
1.3. INTEGRATION SCHEME
In MD simulations, Newton’s equation of motion (Eq. 1.1) are solved for many
particle systems. The integration schemes are based on finite difference approaches, for
which time is discretized. Usually, the discrete timestep (St) is of the order of a femtosecond
(fs). One of the most commonly used integration scheme is the Verlet algorithm. It consists
of two Taylor series expansions for rt at times t + St and t - St as
r (t + St) = r (t) + vt (t )st + 2 a (t )s t2 + O(St3),
r ( t - St) = rt(t) - vt(t)St + 1 at(t)St2 + O(St3),(1.6)
where, vt and at are the velocity and acceleration of particle t. Addition yields the expression
for rt (t + St) as
rt(t + St) = 2rt(t) - rt(t - St) + a t(t)St2 + O(St4). (1.7)
The truncation error in the position is of the order of St4. Eq. 1.7 is independent of velocities.
The velocities can be calculated as
vt(t)rt(t + St) - rt(t - St)
2 St (1.8)
However, the truncation error for the velocity is of the order of St2. The velocity version
of the Verlet algorithm, also known as velocity Verlet algorithm,[16] features an improved
velocity calculation. The velocity Verlet algorithm can be expressed as
vt (t + St/2) = vt (t) + at (t )St /2,
rt (t + St) = rt (t) + St vt (t + St/2),
vt (t + St) = vt (t + St/2) + at (t + St )St/2.
(1.9)

7
Here, velocities are updated in two steps. First, the velocities are calculated at mid-step
(t + St/2). Then forces and accelerations are computed at time (t + St) to update velocities
at time (t + St).
In this work, all MD simulations were performed using the LAMMPS (Large-scale
Atomic/Molecular Massively Parallel Simulator) package.[17]
1.4. FORCE FIELDS
Alkanes are treated using the so-called united atom approximation, in which the
hydrogen atoms bonded to each carbon are not treated individually. Rather each methyl
(CH3) and methylene (CH2) group represents a single effective interaction site. Many
different alkane models have been developed. These models differ primarily in the numerical
values chosen for the physical parameters used in the potential energy functions. In this
work, we use the PYS (Paul, Yoon, Smith),[18-21] NERD (Nath, Escobedo, and de Pablo
revised) [22, 23] and a modified form of the TraPPE-UA (Transferable Potentials for Phase
Equilibria - United Atom) [24] alkane models. The m-TraPPE-UA nonane is a slightly
modified version of TraPPE-UA nonane, in which the originally rigid bonds are allowed
to vibrate in order to address the incompatibility of the fixed alkane bond lengths with
the algorithms used in LAMMPS. Such an approach was also used previously, but with
different bond stretching parameters.[25, 26] All intermolecular site-site interactions and
intramolecular interactions between sites separated by more than three bonds are treated as
non-bonded interactions described by a LJ potential.
Bonded interactions include bond stretching, bond angle vibration and torsional
interactions. A bond stretching potential is used to account for the change in bond length,
usually harmonically,
Vb = kb(l - lo)2 . (1.10)

8
Figure 1.4. Two types of non-bonded interactions ( ^ ) in united atom (UA) octane.
Figure 1.5. Bonded interactions. From left to right, bond stretching, bond angle vibration and torsional interactions.
The equilibrium bond length lo is 1.53 A for PYS and 1.54 A for NERD and m-TraPPE-UA.
The angle vibrations are governed by the harmonic potential
K, = ka(0 - 0o)2, (1.11)
with the equilibrium angle 9o of 109.526° (PYS) and 114° (NERD, m-TraPPE-UA). The
torsional potential for the PYS model is described by the function,
3Vtors = z cn[ 1 - cos(n4>)]. (1.12)
n=1

9
For the NERD model, we use the torsional potential of the form previously given in Ref. [27]
but with corrected values of the coefficients, cn .[23] The torsional potential of m-TraPPE-UA
nonane is identical to that of NERD nonane.
4Vtors = J CnCOSn~l ((p). (1.13)
n=l
The values of the force field parameters are listed in paper I (page 21).
For water, several computer model exists and most of these models belong to one
of the 3, 4, 5, or 6 site models.[28] A negatively charged oxygen atom is bonded with two
positively charged hydrogen atoms in a 3-site model. The higher site models consist of
massless point(s) that contain all the negative charges as illustrated in Figure 1.6. Besides
these, a monoatomic water model has also been developed that assumes water is a single
interacting site, but is treated with tetrahedral geometry.[29] In addition, several other
coarse-grained (CG) water models have been proposed.[30] All the multi-site and CG
models employ classical forcefields.
Figure 1.6. Water models. From left to right, 3-site, 4-site, 5-site and 6-site water models.
An alternative to the classical approach, ab initio molecular dynamics (AIMD)
simulations of water have also been reported.[31-34] The AIMD is based on the Schrodinger
equation, and potentially features more physically realistic force fields. However, the
quantum approach is computationally demanding, and compared to the fully classical
approach, is limited to smaller numbers of molecules as well as shorter simulation times
with the available computational resources.

10
Table 1.1. Comparision of Tm, Tc and yw for some popular water models with experimental results.
Water Tm (K) Tc (K) Yw (mN/m)Expt. 273.15 647.1 72.0SPC 191.0 579.0 54.0SPC/E 213.0 625.3 62.7TIP3P 146.0 573.7 51.6TIP4P 229.0 574.0 56.5TIP4P/2005 249.0 636.3 68.8TIP5P 271.0 530.6 53.1
The properties are taken from Ref. [28], * T « 298 K.
In this work, we will use only classical force fields for water. A comparision of
the melting temperature (Tm), critical temperature (Tc) and the surface tension (yw) near
298 K of several popular classical water models with the experimental results is presented
in Table 1.1. The TIP4P/2005 water [35] is a more realistic water model that predicts the
surface tension and the critical temperature more accurately, whereas SPC/E water [36]
is the most commonly used water model. The SPC/E water is a 3 site model, whereas
TIP4P/2005 water is a 4 site model water that has negatively charged massless point (M) in
addition to two hydrogens (H) and an oxygen (O). Both SPC/E and TIP4P/2005 are rigid
water models, in which the oxygens interact with a LJ potential, and charged sites interact
with Coulomb potentials. The force field parameter values are found in Ref. [36] and Ref.
[35] for SPC/E water and TIP4P/2005 water, respectively.
In this work, the PYS model of octane and nonane is used to study the wetting
behavior of these alkanes on SPC/E and TIP4P/2005 water. The PYS model is known to
reproduce accurately the properties of melts of n-alkane chains and, in particular the melting
temperatures of octane and nonane crystals.[37-39] This alkane model has also been used in
several computational studies of crystallization,[19, 20, 40-43] nucleation,[37, 44] alkane-

11
water interfaces,[39] and nanodroplet structure [13, 45-47] in recent years. However, apart
from a few isolated calculations,[37-39] the thermophysical properties of PYS octane and
nonane have not been studied systematically before.
1.5. RESULTS OF PAPER I
In Paper I, we perform a systematic and comparative study of coexistence densities,
vapor pressure, interfacial thickness, and surface tension of the PYS and NERD models
of octane and nonane for a wide range of temperature. Surface tension values of the pure
octane and nonane have been calculated over a very wide range of temperatures from the
supercooled region to near the critical point. In addition to the physical properties, we also
study the temperature dependence of the mean molecular orientation of octane and nonane
at the liquid-vapor interface and explore how the observed orientational preferences lead to
the surface freezing of octane and nonane at lower temperatures.
z(nm)
Figure 1.7. (Left) The angle 0 made by the alkane end-to-end vector with the normal to the interface. Pink spheres are CH3 groups, and green spheres are CH2 groups. (Right) Temperature dependent mean molecular orientation of PYS nonane, as a function of position.
The molecular orientation is given by the angle 0 of the ene-to-end vector of the
alkane with respect to the normal to the interface (see Figure 1.7 (left)). The mean molecular
orientation is found to be temperature dependent at the liquid-vapor interface, although the
12
i
0.75
0.5
0.25
^ 0
-0.25
-0.50 1 2 3
z(nm )
4 0.78
3 0.76
2 0.74
1 0.72
0 J 0.7
Figure 1.8. (Left) The COM density, end-to-end length (L) and orientational order parameter (Sz = (3< cos2 6 >-1)/2) of PYS nonane at 225 K, as a function of position. The orientational order parameter Sz = 0 for random orientation, = -1/2 for parallel to the surface orientation, = +1 for perpendicular to surface orientation. (Right) Frozen structure of NERD nonane at 210 K. Two vapor molecules are shown adsorbed to the outer surface.
bulk alkane orientation is not affected by temperature as shown in Figure 1.7 (right). In
Figure 1.7 (right), zo is the location of a Gibbs dividing surface in the liquid-vapor interface,
where the density becomes half of the bulk value. At the highest temperature studied, close
to the critical temperature, no significant difference in the molecular orientation in the bulk
liquid region and the liquid-vapor interface is observed. As the temperature decreases,
the average orientation of octane and nonane in the liquid-vapor interface is more parallel
to the surface near the vapor (low density) region and more perpendicular near the bulk
liquid (high density) region. These tendencies are enhanced by lowering the temperature.
The more perpendicular orientation observed near the bulk liquid region at the interface
corresponds to the region of the highest center of mass (COM) densities, where the alkane
molecules are also found to be slightly more stretched out as shown in Figure 1.8 (left)
for PYS nonane at 225 K. This behavior suggests that the molecules have tendencies to
align in some preferred order even slightly above the equilibrium freezing temperature;
this aligned state appears to serve as a precursor stage to freezing. For sufficiently low
temperature, the more perpendicular orientation leads to the surface freezing. In this work,

13
we have observed surface freezing of NERD octane and NERD nonane at 195 K and 210
K, respectively. We have also observed complete freezing of NERD nonane at 200 K: a
nonane crystal of four layers was formed with some molecules trapped between the layers.
After raising the temperature to 210 K and removing the trapped molecules, a nicely layered
structure free of defects was obtained (see Figure 1.8, right).
1.6. RESULTS OF PAPER II
In Paper II, we explore the wetting behavior of PYS octane and PYS nonane on
SPC/E water, as well as on TIP4P/2005 water for planar interfaces. We compute the
surface tension of water, alkanes, and the alkane-water interfacial tensions to determine
the spreading coefficient S and the contact angle 0 of octane and nonane on water defined
earlier in Section 1.1.
£co-cO*0<D8aic■532?<n
■0.5 ■
-1 -
- 1.5
, ? !
■ aV „ f i t
o O g 0 y qCo o<b
8
l- 8 *
•’ «
•m □ n-Heplane • 0 ft-Oetarte
50 100Temperature T. *C
150
Figure 1.9. Experimental spreading coefficients S of octane and heptane on water.[4, 5] Figure reprinted from Ref. [5] with permission from Elsevier.
The S values of octane and heptane on water determined experimentally [4, 5]
increase with increasing temperature T (see Figure 1.9). In this work, the behavior of the
spreading coefficient (S) of the PYS octane and the PYS nonane on TIP4P/2005 water
is qualitatively consistent with the experimental results except at two lowest temperatures

14
1
0
-1
^ -2^ 3
-3Co -4
. Nonane - WaterPficlecLwelting_
t A J w * Goebel T„„ (1997)-5 Mitrinovic 7 0I0 (2000)O S P C /E (sim ulated 7 )
-6 ■ ♦ ^ T IP 4P /2005 (simulated 7 )
200 250 300 350 400 450 500r(K) T(K )
Figure 1.10. Spreading coefficient of octane on water (left) and nonane on water (right) in planar interface. Circles and diamonds are for SPC/E water and TIP4P/2005 water, respectively. Lines are obtained from fits to the simulated interfacial tension values. Asterisk and star are calculated using experimental values of the interfacial tensions.
studied in the nonane-water system as shown in Figure 1.10. In contrast for SPC/E water,
the S value of both PYS octane and PYS nonane shows unusual T dependence behavior at
lower T , where S initially decreases with increasing T.
The contrasting temperature dependence of S value of octane and nonane on SPC/E
water is also reflected in the contact angle calculations as seen in Figure 1.11. Starting from
the lowest temperature studied, the contact angle of octane and nonane on SPC/E water
is initially found to increase with increasing temperature. This behavior is qualitatively
in good agreement with the previous nanodroplets simulation results of Hrahsheh and
Wilemski.[13] On the other hand, such unusual behavior of the contact angle is not observed
for PYS octane-TIP4P/2005 water, though PYS nonane-TIP4P/2005 water shows some sign
of such behavior at the two lowest temperatures studied (220 K and 225 K). At the higher
temperatures, all four alkane-water systems are consistent with the usual decrease of contact
angle with increasing temperature as each system reaches a transition to perfect wetting at
a higher temperature.

15
200 250 300 350
n k )400 450 200 250 300 350 400 450 500
T(K)
Figure 1.11. Contact angle formed by octane on water (left) and nonane on water (right) in planar interface. Circles and diamonds are for SPC/E water and TIP4P/2005 water, respectively. Lines are obtained from fits to the simulated interfacial tension values. Asterisk and star are calculated using experimental values of the interfacial tensions.
1.7. RESULTS OF PAPER III
In Paper III, to explore further the wetting behavior of octane and nonane on water
and to examine the applicability of planar interface wetting results to nanodroplets, we
perform molecular dynamics simulations of alkane-water binary nanodroplets. As for the
planar interface wetting studies, octane and nonane are modeled with the PYS forcefield
and SPC/E water and TIP4P/2005 water are considered.
First, we study the effect of the Lennard-Jones (LJ) cutoff radius on the wetting
behavior of the nanodroplet. Pronounced configurational fluctuations of the nanodroplets
are observed for smaller cutoff radii (1.25 nm). The fluctuations are reduced by increasing
the LJ cutoff radius. Second, the structure of the nanodroplet is studied for different
octane/water ratios for a reasonably large value of the LJ cutoff radius (2.5 nm). The contact
angles are found to depend only weakly on the ratio of the liquid species. Finally, the
effect of temperature on the structure of the nanodroplets is studied using the 2.5 nm cutoff
radius. The contact angles formed by alkane on water on all four systems (octane+SPC/E
water, nonane+SPC/E water, octane+TIP4P/2005 water, nonane+TIP4P/2005 water) are

16
40
bOCDT330
'hbacfi20
"3oo
10
♦ ♦ ♦
• •
♦
• •
♦ ♦
210 240 270 300T( K)
50
CDT340
boClcfi+203"SOo
30
20
o SP C /E 480 octane + 480 water o SP C /E4 T IP4P/2005
bb4 T IP4P/2005
480 nonane + 480 water
* ♦
• •♦ ♦
♦ ♦
210 240 270 300T( K)
Figure 1.12. Contact angle formed by octane on water (left) and nonane on water (right) in nanodroplets. Circles and diamonds are for SPC/E water and TIP4P/2005 water, respectively.
found to increase with increasing temperature in the lower temperature region, where the
nanodroplets simulations are feasible as shown in Figure 1.12. These results are consistent
with the previous nonane-water nanodroplet results of Hrahsheh and Wilemski,[13] but so
far they fail to illuminate the physical reasons underlying this behavior. Some possibilities
for future investigation include line tension effects [48] and the inhomogeneous structure
[49] of nano-sized water droplets.

17
PAPER
I. PROPERTIES AND FREEZING AT THE LIQUID-VAPOR INTERFACE OF n-OCTANE AND n-NONANE FROM MOLECULAR DYNAMICS SIMULATIONS
Pauf Neupane and Gerald Wilemski
Department of Physics
Missouri University of Science and Technology
Rolla, MO 65409, USA
ABSTRACT
The PYS model [W. Paul, D. Y. Yoon, and G. D. Smith, J. Chem. Phys. 103, 1702
(1995)] was originally developed to simulate polymethylene melts. In recent years, it has
been used for short chain liquid alkanes to study nucleation and crystallization and wetting
of water nanodroplets. Despite this effort, the temperature-dependent interfacial and two
phase coexistence properties of PYS octane and nonane have not yet been systematically
studied. Here we report a comparative study of these properties using molecular dynamics
simulations of the PYS and NERD [S. K. Nath, F. A. Escobedo, and J. J. de Pablo, J. Chem.
Phys. 108, 9905 (1998)] alkane models. We studied the interfacial thickness, coexistence
densities, vapor pressure, surface tension, and the position-dependent average orientation
of n-octane and n-nonane. The coexistence densities of PYS octane and nonane are in
close agreement with the NERD model. The surface tension and the vapor pressure of both
PYS and NERD alkanes are in close agreement with the experimental results. The average
orientation of the octane and nonane molecules at the liquid-vapor interface is temperature-
dependent. At lower temperature, molecules on the liquid side of the Gibbs dividing surface

18
tend to align more perpendicularly to the interface, whereas the molecules on the vapor side
tend to orient more parallel to the interface. These tendencies diminish considerably as
the temperature increases. We found that these orientational trends anticipated the freezing
behavior observed at the liquid-vapor interface for NERD nonane at 210 K and for NERD
octane at 195 K.
1. INTRODUCTION
Octane and nonane are saturated hydrocarbons that commonly occur in crude oil
and natural gas. They are mainly used as components in gasoline, aviation fuel, as well as in
organic solvents. Experimentally, several properties of these liquid alkanes have been widely
studied in pure form and in mixtures.[1-5] They have also been the subject of numerous
theoretical and experimental investigations of phenomena such as adsorption, nucleation,
and wetting. In nucleation experiments, nonane has been one of the most commonly
investigated alkanes (see Ref. [6] for an extensive literature survey). The structure of
nonane-water nanodroplets has been studied theoritically [7-9] and experimentally [10]. A
few experiments on octane nucleation have also been reported.[11, 12]
Computer simulation is a powerful and increasingly popular tool to study molecular
interactions. Several computer models of alkanes have been proposed in the literature.[13-
18] Here, we focus on exploring the physical properties of the PYS model [18-21] of
octane and nonane. Originally proposed by Paul, Yoon, and Smith [18] and modified
by Waheed et al.,[19, 20] this force field is known to reproduce accurately the properties
of melts of n-alkane chains and, in particular, the melting temperatures of octane and
nonane crystals.[21-23] In recent years, this alkane model has been extensively used in
several computational studies of crystallization,[19, 20, 24-27] nucleation,[21, 28] alkane-
water interfaces,[23] and nanodroplet structure.[7, 8, 29, 30] Yi and Rutledge [21] studied
nucleation and crystallization of octane using the PYS force field. Liang et al. [31]
performed non-equilibrium molecular dynamics simulations to study thermal resistance at

19
the crystal-melt interface of PYS octane. Modak et al. [30] performed molecular dynamics
simulations of PYS octane nanodroplets to support their experimental findings of surface
freezing in supercooled n-alkane nanodroplets. Modak et al. [22] also studied the crystal-
vapor surface free energy of PYS octane. Hrahsheh, Wilemski, and Obeidat also used the
PYS force field to model nonane in several previous studies of the structure of nonane-water
nanodroplets.[7, 8 , 29] Recently, Qiu and Molinero [23] used the PYS and OPLS [13]
alkane models to study freezing of nonane, hexadecane, and eicosane at the alkane-vacuum
and alkane-water interfaces. In addition, the PYS force field has also recieved considerable
attention in studying long n-alkane chains.[32]
Despite all this recent work based on the PYS force field, it is surprising that,
aside from a few reports of isolated calculations,[21-23] there are no published systematic
studies of the thermophysical properties of PYS alkanes. Notably lacking are studies of the
temperature dependence of properties such as surface tension, density, and vapor pressure
that are of particular importance for nucleation, crystalization and wetting phenomena. Until
ab initio methods become capable of treating large numbers of complicated chain molecules
such as octane and nonane, we must rely on empirical potential energy surfaces such as
PYS. Comparision of computer simulated property values with experiments provides one
important measure of the quality of the potential energy surface. Here we present such
comparisons for the following properties: coexistence densities, vapor pressure, interfacial
thickness, and surface tension. To examine the effectiveness of the PYS model, we will
also present comparisons of these properties with those of the NERD model [15, 33]
as well as with experimental results. A more limited comparision between PYS and
a modified version of the TraPPE model [14] (m-TraPPE-UA) is also presented. The
properties of the NERD alkanes, including octane and nonane, have been previously studied
to some extent.[15, 17] Besides exploring the temperature dependence of these properties,
we examine the temperature dependent molecular orientation of octane and nonane at

20
the liquid-vapor interface. We show how the orientational preference at low temperature
is correlated with the initiation of freezing at the surface of the NERD alkanes in the
supercooled state.
Our second goal is to investigate the role of the interaction potential cut-off distance
and the integration timestep on computer simulations of molecular properties of these linear
chain molecules. Computer simulation results are known to be sensitive to these parameters,
and we want to see if previous results for the cut-off dependence of simple Lennard-Jones
(LJ) liquids [34-40] agree with our results for linear alkanes.
2. MODELS
In this work, octane and nonane are modeled primarily using two different force-
fields: PYS and NERD. Some limited results for m-TraPPE-UA nonane are also presented.
We use the PYS model parameters specified by Yi and Rutledge,[21] and later used by
Modak et al. [30]. For each model, the methyl and methylene groups of alkane are
treated in the united atom approximation, with each group representing a single interaction
site. Non-bonded interactions in both models are described by Lennard-Jones 12-6 (LJ)
potentials
V (rij) = HOij \ 12 _ ( T1rij) ' rij
( 1)
where rij represents the separation distance of sites i and j and eij and Tij are the respective
LJ energy and LJ size parameters. We note that the PYS model is unusual in one respect
compared to other alkane models in that the nonbonded methyl and methylene interactions
are identical. This feature presumably derives from the model’s original application to
polymethylene melts in which methyl concentrations would be extremely small. The unlike
pair interaction parameters are computed using Lorentz-Berthelot combining rules [41, 42]
Tii + Tjjeij - (eiiej j )1/2, Tij - 2
(2 )

21
Table 1. Interaction parameters for PYS, NERD and m-TraPPE-UA models.
Interactions Parameters PYS NERD m-TraPPENonbondedCH3 e (kcal/mol) 0.112094 0.206602 0.194746
^ (A) 4.01 3.91 3.75CH2 e (kcal/mol) 0.112094 0.090984 0.091411
^ (A) 4.01 3.93 3.95Bonded
kb (kcal/mol A2) 349 96 96lo (A) 1.53 1.54 1.54ka (kcal/mol rad2) 60.0 62.1 62.1do (deg.) 109.526 114 114c1 (kcal/mol) 0.7995 2.0070 2.0070c2 (kcal/mol) -0.4338 -4.0120 -4.0120c3 (kcal/mol) c4 (kcal/mol)
1.6205 0.27106.2901
0.27106.2901
Bonded interactions include bond stretching, bond angle vibrating, and torsional interac
tions. The harmonic bond stretching potential is given by
V = kb(l - lo)2, (3)
where l0 is the equilibrium bond length. The angle vibrations are governed by the harmonic
potential
V = ka(6 - do)2, (4)
where d0 is the equilibrium bond angle. The torsional potential for PYS model is described
by3
Vtors = Cn[1 - COs(n<p)]. (5)n= 1

22
For the NERD model, we use the torsional potential of the form previously given in Ref.
[17] but with corrected coefficient values.[33, 43]
4Vtors = ^ CnCOSn~\<p). (6 )
n=1
The force field parameter values are listed in Table 1.
3. SIMULATION DETAILS
In most of our simulations, a slab of 620 octane or 550 nonane molecules was kept
in the middle of the simulation box with cross-sectional area of 5.5 x 5.5 nm2 such that
liquid occupied one-third the volume of the simulation cell. The thickness of the slab at the
desired temperature was determined from a 0.5 ns long constant-NPNAT simulation at 1
atm, where PN and A represent the normal pressure and the cross-sectional area, respectively.
Some molecules were added in the vapor region based on preliminary calculations of vapor
densities to prevent the depletion of the liquid slab at three highest temperatures studied for
each model and liquid species.
All initial configurations were built using PACKMOL,[44] and Moltemplate [45]
software and the simulations were carried out using the LAMMPS [46] molecular dynamics
simulation package. Periodic boundary conditions were applied in all directions. The
velocity Verlet algorithm [47] was used to solve the equation of motion using a timestep of
2 fs, unless otherwise noted. After 0.5 ns of constant-NPN AT simulation to determine the
size of the simulation cell, the system was simulated in a N V T ensemble for 22 ns of which
the initial 2 ns is for equilibration, and the remaining 2 0 ns is used for averaging the results.
In all simulations, the temperature was controlled using the Nose-Hoover [48,49] thermostat
with a time constant 0.2 ps. For simulations in the NPn AT ensemble, the pressure was
controlled using a Nose-Hoover barostat with a time constant of 2.0 ps. Unless otherwise
stated, the force fields were subjected to a cutoff radius of 1.75 nm.

23
We studied the thermodynamic behavior of octane and nonane for a wide range
of temperatures. At each temperature, the time-averaged density profiles were fitted to a
hyperbolic tangent function [50]
p (z) = 2 + Pv) (pi - p v) tanh z - zo(7)
where p i and p v are densities in the bulk liquid and vapor phases, respectively. In Eq. 2, z0
represents the position of a Gibbs dividing surface, at which the density becomes half of the
bulk liquid value, and d is an interfacial thickness parameter which is related to the “10-90”
thickness t as d = t /2.1972.[51] The interfacial tensions were determined by integrating
the differences of the normal (PN(z)) and tangential (PT(z)) pressure components along the
direction normal to the interface
1 /*“Y = 2 dz[PN(z) - Pt (z)]. (8 )
2
The factor of 1 /2 accounts for the presence of two such interfaces in our simulation cell.
For our geometry, PN(z) = Pzz(z) and Pt (z) = (Pxx(z) + Pyy(z))/2. The contribution
of the long-range tail correction (LRTC) to the liquid-vapor interfacial tension yt was also
calculated following the formula given by Chapela et al. [50] and later modified by Blokhuis
et al..[52, 53]
Ytv v ( " i f
12n(pi - Pv)2 ^ Y j 6iJ a i6j dsi=1 j =1 Jo Jrc
drr 3 (3s3 - s) coth(rs/d), (9)
where v is the number of interacting sites per molecule, and the sums are over sites on
different molecules. The pressure tensor is calculated using the virial theorem.[54] The tail
correction to the pressure for a two-atom type fluid, such as a NERD alkane, is given by
Pt =-1 6 n
I T T(£1 (T1 n1 + £2(T2n\ + 2612 12 «1 II2 ). (1 0 )

24
where n is the number density of atom type i. For homogeneous system, Eq. 10 is consistent
with results in Allen and Tildesley,[55] and Lundberg and Edholm.[40]
4. RESULTS
4.1. CUTOFF AND TIMESTEP DEPENDENCE OF SURFACE TENSION
We studied the dependence of the surface tension of PYS nonane on the LJ cutoff
radius at 295 K and 225 K for different timesteps (1 fs, 2 fs and 5 fs). In Figure 1, the filled
and the open markers represent the respective surface tension values with and without the
contribution of the long-range tail corrections (LRTC) The tail correction, y t, to the surface
tension was computed using Eq. 9 and added to the simulated surface tension value. For
all the timesteps studied, the tail corrected surface tension values were initially found to
increase with the cutoff and become nearly constant at higher cutoff values (> 1.75 nm). We
found that y t varied with the cutoff value and the timestep. The timestep dependence enters
implicitly through small variations in the bulk densities and in the thickness parameter d.
For example, at 295 K y t ranged from an 8 % contribution at a cutoff of 2.5 nm up to 46%
at a 1.0 nm cutoff for a 2 fs timestep, and from 9% to 47% for a 5 fs timestep. For all the
LJ cutoff values studied, the tail corrected surface tensions for a 5 fs timestep were found
to be significantly lower (« 6-10%) than those at 1 fs or 2 fs timesteps. On the other hand,
the surface tensions calculated using 1 fs and 2 fs timesteps were found to be very close
(differing by < 2%). So, we decided to use a 1.75 nm LJ cutoff and a 2 fs timestep for
our temperature varying simulations as a compromise between accuracy and computational
time. Moreover, even for the largest cutoff value studied, a significant contribution of the
LRTC to the surface tension was observed, which should not be neglected. Our results are
consistent with those found in previous studies of the dependence of the LRTC on cutoff
radius.[34-40]

25
27(a)
21
I f15
a
934
d
28
JS!-l22
*O
16
(b)
-S7-
■f- * * t*o o o § e
6 °y o
OO
oPYS nonane 295 K
t ▼
1 5 / \2rc (nm)
*o
□ 1fs 2 fs 5 fs
f ? W tt7 * ^
PYS nonane 225 K □ 1 fs
V 2 fs
2.5__i____ _____i____.____i____.____i____.____i____i ___i____.-i__ i____i____i____i____i____i____i____
2 2.5 3 3.5 4 4.5 5 5.5 6 6.5
Tc/o-
Figure 1. Surface tensions of PYS nonane for different LJ cutoff radii rc and scaled radii r* at 295 K (upper figure) and 225 K (lower figure). Squares, triangles, and circles represent the surface tensions for 1 fs, 2 fs and 5 fs time steps, respectively. The filled markers represent tail corrected surface tensions, and the corresponding open markers are their counterparts without tail corrections.
4.2. DENSITY PROFILES AND INTERFACIAL WIDTHS
Spatial profiles of the molecular number density (defined as total sites/9 per unit
volume) of both PYS and NERD nonane are shown in Figure 2 for temperatures ranging
from 225 K to 525 K at intervals of 75 K. Points represent number densities calculated
using a bin size of 0.1 nm, and solid lines are the fitted profiles calculated using Eq. 2.
For better statistics, the left half of the simulation boxes have been mirrored and merged to
the right half. In the inset, the density profiles have been shifted so all the Gibbs dividing
surfaces (z0) lie at 2.5 nm. This method presents better visualization of the widening of the
liquid-vapor interface with increasing temperature.

26
o 2 4 6 8
Figure 2. Molecular number density profiles of PYS (upper panel) and NERD (lower panel) nonane for different temperatures. Points are calculated using the bin size of 0.1 nm. Lines are the fitted profiles, calculated using Eq. 2.
Number density profiles have also been calculated using the center of mass (COM)
locations of the nonane molecules. In Figure 3, density profiles of PYS nonane obtained
from both approaches (large points - total site approach, small points - COM approach)
are shown for 225 K and 375 K temperatures. The molecular density profile of nonane
contain a peak in the liquid-vapor (l - v) interfacial region near the melting temperature.
This feature is more pronounced in the COM representation of the density profile, and it
decreases and disappears as the temperature increases. The peaks at the lower temperatures
are due to the tendency of nonane molecules to align with a preferred orientation, which we
will explore further in Sec. 4.5.

27
CO
Q
4
3
2
1
00 1 2 3 4 5 6
PYS nonane 225 k 375 K
*:%
f t
v*v\v v
z(nm)
Figure 3. Comparision of molecular density profiles (large points) and density profiles calculated from center of mass (small points) of PYS nonane for 225 K (blue) and 375 K (magenta) temperatures.
■H-a
5
4
3
2
1
0200 250 300 350 400 450 500 550
T ( K)
Figure 4. The “10-90” interfacial thickness of PYS (squares) and NERD (circles) nonane for different temperatures.
The density profiles allow us to calculate the vapor-liquid interfacial thickness
as well as the coexistence curve. The interfacial thickness is an important parameter
of the vapor-liquid system that provides information regarding the stability limits of the
system,[56] and it is needed to compute the LRTC using Eq. (10). It increases with
increasing temperature and tends to diverge near the critical temperature. A comparison
of the “10-90" interfacial thickness (t) of the nonane-vapor system for both nonane models
studied is shown in Figure 4. It is inferred from Figure 4 that PYS and NERD models of

28
nonane have essentially the same interfacial thickness for T < 400 K. As the temperature
increases, the vapor-liquid interface of NERD nonane becomes wider than that of the PYS
model, and the differences become significant for T > 450 K. This behavior implies that the
NERD nonane reaches its critical temperature at a somewhat lower temperature than does
PYS nonane. On the other hand, we have found no significant differences in the interfacial
thickness for the two octane models studied (not shown here).
4.3. VAPOR-LIQUID COEXISTENCE
In Figure 5, vapor-liquid coexistence curves are shown for octane (upper figure)
and nonane (lower figure). The coexistence densities for PYS octane and NERD octane
are nearly identical and are consistently inside the NIST [57] values by a small amount.
It should be noted that earlier Monte-Carlo results [15] showed better agreement with the
NIST values than these MD results. For nonane, the coexistence densities of both PYS
and NERD model agree fairly well with the NIST [57] coexistence densities. The vapor
and liquid densities of NERD nonane agree very well with the PYS nonane values for T <
400 K, but at higher temperatures the NERD liquid densities are somewhat smaller and the
vapor densities are a bit larger. Thus, PYS nonane reproduces the coexistence curve and the
critical point somewhat more accurately than does NERD nonane based on our MD results.
The vapor pressure has also been determined for both PYS and NERD octane and
nonane models from the pressure tensor calculation. It is compared with available NIST data
in Figure 6 using a log scale versus the inverse temperature for better visualization. Both the
PYS and NERD octane models are found to slightly overestimate the NIST values. Their
differences with the NIST vapor pressure values decrease as the temperature increases. The
vapor pressure of NERD nonane is generally found to be higher than that of PYS nonane
(except at 300 K) as well as the NIST vapor pressure values. The PYS model of nonane is
found to predict the vapor pressure very well at higher temperatures (T > 400 K), but for T
< 400 K, PYS nonane is also found to overestimate the vapor pressure, although to a lesser

29
500
400
300
2 0 0
E-h600
500
400
300
2 0 0
600
f&
- - -*k--- ^
O cta ne
p y s
O n e r d — n is t
® \• s • s
On • n ax ax
B Xaxax
A .0.2 0.4 0.6 0.80
----- ★ ------ •>
£>J®
N onane T0*s C«s
CBsm
a*»
p y s O n e r d
— n is t
s» ■ as as
0 0 .2 0 .4 0 .6 0.8p(g/cm3)
Figure 5. Liquid vapor coexistence curve for PYS (squares) and NERD (circles) octane (upper figure) and nonane (lower figure). Dashed line shows NIST results, with the critical point represented by a star.
i=i
p y s * p y s
O n e r d ■ 0 O n e r dn is t ■o
B .— n is t
sfq O c ta ne
s •S*\
\ 0s\
0.002 0.003
N o na ne
'b\ »
' O'B
\ « \
0.002 0.003
T _1 (K_1)
3 3
1
1 1
3 3
5 5
Figure 6 . Vapor pressure plotted on log scale versus inverse temperature for PYS (squares) and NERD (circles) octane (left figure) and nonane (right figure). Dashed line represents NIST results.

30
extent than NERD nonane. We also calculated the vapor pressure from the simulated nonane
vapor densities using the ideal gas equation pV = N k T , and found, to no surprise, that at
higher temperatures (T > 425 K), it deviates considerably from the previous simulated vapor
pressure values. This is expected as the vapor density increases at the higher temperatures,
and the intermolecular forces of attraction can not be neglected. So, as is well-known, the
ideal gas equation cannot be used at higher temperatures to estimate the vapor pressure.
4.4. TEMPERATURE DEPENDENT SURFACE TENSION
We also studied the temperature-dependent surface tension of octane and nonane.
At each temperature, the surface tension values (y + y t) were determined using Eqs. 3, 9. In
Figure 7, a comparison of our results with available NIST surface tension data is presented.
Standard errors in the simulated surface tension values were determined using the block
average method. They are smaller than the size of the markers (± 0.3 mN/m). Our PYS
octane surface tension values are in good agreement with a previous study performed at low
temperatures (205-215K).[58] In comparision to the NIST values, the PYS octane surface
tension values are slightly larger (3-5%) for T < 450 K, but are lower by 0.5 mN/m (12%)
and 0.7 mN/m (28%) at 500 K and 525 K temperatures, respectively. On the other hand,
the PYS nonane surface tension is consistently larger than the NIST values. The difference
between PYS and NIST surface tension values of nonane range from 0.4 mN/m (550 K)
to 2.2 mN/m (225 K). Both NERD octane and nonane models are found to overpredict
somewhat the surface tension for T < 400 K and underpredict slightly the surface tension
for T > 450 K.
Previously, the surface tension of PYS nonane had been simulated at 295 K,[23]
apparently without including the contribution of long-range tail corrections. That result (14
mN/m for 5 fs timestep and 1.2 nm LJ cutoff) falls on the locus of our surface tension values
calculated using a 5 fs timestep when LRTC is not applied, as shown by the open circles in
Figure 1(a). Also, the temperature-dependent surface tension of NERD octane and nonane

31
sapio• i-HCOPiCD
CDCJ_o35-1-1PiPiCO
35
30
25
20
15
10
5
0200 250 300 350 400 450 500 550
35
30
25
20
15
10
5
0200 250 300 350 400 450 500 550
T (K )
\ Nonane
p y s
O n e r d - - n is t
33s5 s .C^i
Figure 7. Temperature dependent surface tension plotted for PYS (squares) and NERD (circles) octane (upper figure) and nonane (lower figure) and compared with NIST surface tension values (dashed line). The enlarged view of low temperature surface tension values of octane are shown in the inset.
has been reported in Ref. [17]. Those values were generally in good agreement with the
NIST values, but because of the differences in the torsional potential noted earlier,[43] and
because the simulation timesteps and LJ cutoffs differ from those used in our work, we do
not reproduce their results in Figure 7.
4.5. ORIENTATION AND FREEZING
To explore the temperature dependence of the octane and nonane orientation, we
have calculated the average orientation (6 ) of the octane and nonane molecules for different
temperatures (see Figure 8 ). Following Qiu and Molinero,[23] we have defined 6 to be the

32
70
65 -
60
55
50
75
450
75
70
65
60
55
50
450 2
z(nm)43
Figure 8 . Average orientations of PYS octane (upper panel) and PYS nonane (lower panel) molecules.
angle made by the end-to-end (methyl-to-methyl) vector of an alkane molecule with the
normal to the liquid nonane surface. This means 0 = 0o when the molecule is perpendicular
to the surface, and 0 = 90o when the molecule is parallel to the surface. We have also
calculated the order parameter Sz,[59] defined by Sz = (3 (cos2 0) - 1) /2. Sz = 0 for random
orientation, -1 /2 when the molecule is parallel to the surface, and +1 when the molecule
is perpendicular to the surface. Note that our choice of 0 makes our order parameter Sz
different from that used by previous authors.[17, 59]
We found identical orientational preferences for the PYS and NERD alkane (octane,
nonane) models, consequently only the results for the PYS model are shown in Figure 8 .
The molecular orientation is found to be independent of temperature in the bulk liquid
region, but not at the liquid-vapor (l - v) interface. At the highest temperature studied, no

33
a
J}
XSaCD6
S3(0
z (n m )
Figure 9. Order parameter Sz (red line, left scale), COM number density (blue line and markers, right scale) and end-to-end length L (black dotted line, right scale, where Lmax = 1 nm) of PYS nonane at 225 K.
orientational difference was observed between the bulk and the l - v interfacial regions. As
the temperature decreases, the octane and nonane orientations become more parallel to the
surface near (zo), the Gibbs dividing surface (GDS) (see Figure 8 ). A bit deeper into the
bulk liquid side at ~ -0.5 nm from z0, the opposite orientational preference can be seen.
Here, the molecules tend to be somewhat more perpendicular to the surface. Similar results
have been reported for PYS nonane at the single temperature, 240 K.[23] This tendency
grows as T decreases.
To better understand this orientational preference at low temperatures, we have
plotted Sz, the COM number density profile, and the RMS end-to-end (methyl-to-methyl)
length, L , of PYS nonane at 225 K (see Figure 9). The Sz results show that nonane is
randomly oriented in the bulk liquid. As the interfacial zone is approached from the bulk
liquid, the orientational order of the nonane molecules gradually varies as the l - v transition
region is traversed. In Figure 9, the shaded portion shows the region in which the average
nonane orientation transitions from being more perpendicular to the liquid surface to one
that is more parallel to it. The more perpendicular orientation to the surface, observed at

34
— 0.5 nm from z0, corresponds to the peak in the density profile. The occurrence of a
similar peak in the COM density profile has been previously reported by Hernandez and
Dominguez [17] for several models of decane. The peaks in density and Sz also coincide
with a peak in L, showing that all three measures are highly correlated. This location also
marks the last point at which the molecular number density is still at its bulk value. The
behavior of L shows that, relative to the bulk, the nonane molecules are slightly stretched
out when they are in the more perpendicular orientation to the surface while they are more
compactly configured when they are more parallel to the surface in the lower density side
of the interfacial zone.
The occurrence of the peaks in the COM density, L , and Sz profiles at the same
location in the interface suggests that the nonane molecules may be forming a layer acting
as a precursor state for freezing (melting occurs at 219 K for a cutoff radius of 1.2 nm).[23]
As we saw in Figure 8 this ordering tendency strengthened for PYS nonane when T was
dropped below the melting temperature. Hernandez and Dominguez [17] have previously
made a similar suggestion regarding this ordered layer, but they did not observe strongly
ordered layer formation for the short alkanes (hexane, octane, and decane) that they studied.
To explore this idea further, simulations were performed in the supercooled region
down to 180 K for 22 ns, but we did not observe surface freezing of PYS nonane. In contrast,
Modak et al. [30] found that a n-octane nanodroplet with 3840 molecules froze at 190 K
over the course of several hundred ns long run, although surface freezing occured earlier
after a few ns. Also, Yi and Rutledge [21] observed crystal growth following homogeneous
nucleation in the bulk phase PYS n-octane at 170 K.
The situation was dramatically different for NERD octane and nonane at 195 K and
210 K, respectively for which we observed the rapid formation of ordered surface layers at
each liquid-vapor interface with different formation rates. To our knowledge, the melting
temperatures of NERD octane and nonane have not yet been reported, but based on our
simuation results they are likely somewhat greater than 210 K for NERD nonane and 195

35
-3 -2 -1 0 1 2 3
zfnml
Figure 10. Time evolution of Sz and orientation angle of NERD nonane at 210 K.
K for NERD octane. The time evolution of the orientation angle 6 and the order parameter
(Sz) for NERD nonane is shown in Figure 10. The curves represent averages over time
periods 0 .2 ns long ( 1 0 0 frames) taken at times 1 .0 ns, 1 .6 ns, and 2 .0 ns after starting the
simulation. They depict the surface freezing process on the right side of the simulation cell.
The left side froze at a somewhat later time, although progress toward the frozen state is
also visible in this figure. The two earlier time curves show features similar to those seen
in Figure 8 and Figure 9 for PYS nonane at 225 K, but the third curve, the heavy dark line
in each frame, clearly reflects the presence of the frozen surface layer. In this layer, the
molecules are nearly perpendicular to the surface with an average orientation angle of about
13.5°, and the order parameter has increased to about 0.87 in the layer. In Figure 11, the
COM density profiles of PYS and NERD nonane are averaged over a period of 0.2 ns (100
frames) starting at 2 ns. The NERD density profile shows a sharp peak at the frozen layer
that is clearly absent in the PYS density profile. The snapshot in Figure 11 shows a frozen
layer of NERD nonane at the liquid-vapor interface (towards the right).

36
CO
Q
12
8
4
0-3 -2 -1 0 1 2 3
z(nm)
Figure 11. COM density profiles of PYS and NERD nonane at 210 K averaged over the time period 2.0-2.2 ns. Snapshot shows the molecular configuration at 2.1 ns.
CO
16
a 12a.
8cc£a>Q 4
0
M P R D O r t a no
-23 1 0 2 3
z(nm)
Figure 12. COM density profiles of NERD octane at 195 K after surface freezing in both liquid-vapor interfaces. Snapshot shows the molecular configuration at 25 ns.
In Figure 12, the COM density profile of NERD octane at 195 K is shown. The
density profile was averaged over 5 ns after 25 ns of simulation time. The first frozen layer
formed on one liquid-vapor interface after 6 ns, and the second layer was fully developed at
about 23.5 ns of simulation time. We did not observe freezing in the interior at 195 K even
for a 44 ns long run simulation. Also, we did not lower the temperature below 195 K to try
to completely freeze the system.

37
Figure 13. Snapshot of frozen NERD nonane at 210 K. Two vapor molecules are shown adsorbed on the outer surface.
,z(nm)
Figure 14. COM density profile of frozen NERD nonane at 200 K.
To obtain a completely frozen NERD nonane crystal, we first lowered the temperature
of the well equilibrated nonane slab of 648 molecules from 225 K to 210 K. At 210 K, two
frozen surface layers formed at different times (2 ns and 8 ns). After 20 ns at 210 K, the
temperature was lowered to 205 K. We did not observe freezing in the interior for 20 ns
at 205 K. Then the temperature was lowered to 200 K, for which a sign of freezing in the
interior was observed after 4 ns. After a total of 40 ns at 200 K, two imperfect layers with
a distribution of a few randomly oriented crystallites were present in the interior. Upon
warming to 210 K for 20 ns, the interior layers were observed to orient almost perfectly,

38
except for one defect with trapped molecules between the layers. After removing the 28
trapped molecules, a nicely layered structure free of defects was obtained. Figure 13 shows
a snapshot of the frozen NERD nonane at 210 K with two vapor molecules adsorbed on the
outer surface at 3 ns after the removal of the defect and the trapped molecules. The cooling
or heating rates were 10 K/ns. In Figure 14, the COM density profile of the frozen nonane
(Figure 13) is averaged for 1 ns at 210 K. The peaks in Figure 14 correspond to the centers
of the frozen layers. The two outer peaks at the left and right liquid-vapor interfaces contain
155 and 157 nonane molecules, respectively. Each interior peak contains 153 molecules.
The crystal density is 4.09 nm -3 compared to the liquid density of 3.64 nm -3 at the same
temperature.
5. SELECTED RESULTS FOR m-TraPPE-UA NONANE
The united atom (UA) TraPPE alkane model was originally developed as a rigid bond
model.[14] To address the incompatibility of the fixed alkane bond lengths with LAMMPS,
in this work, the rigid bonds of the TraPPE-UA nonane are modified to vibrate with a force
constant taken from the NERD model.[15, 33] Such approach was also used previously, but
with different bond stretching parameters.[60, 61]
The bonded interaction parameters of m-TraPPE-UA nonane are identical to those of
the NERD model. The nonbonded interaction parameters are those of the original TraPPE
model.[14] They are listed in Table 1.
The temperature dependence of the density profiles and the average orientation of
the m-TraPPE-UA nonane is similar to that of PYS and NERD nonane. Here, we present
the coexistence curve as well as temperature dependent vapor presure and surface tension
of the m-TraPPE-UA nonane compared to PYS nonane. Moreover, temperature dependent
molecular orientation of m-TraPPE-UA nonane is also shown.

39
Figure 15. Liquid vapor coexistence curve for PYS nonane (squares) and m-TraPPE-UA nonane (diamonds). Dashed line shows NIST results, with the critical point represented by a star.
cS
£S3
3
1
-1
-3
-51.5 2 2.5 3 3.5
■£<> p y s
m-TraPPE-UA -----n is t
VM
\ 0
Y 0
\ 2
r - ^ K - 1) x1 Q -3
Figure 16. Vapor pressure plotted on log scale versus inverse temperature for PYS nonane (squares) and m-TraPPE-UA nonane (diamonds). Dashed line represents NIST results.
In Figure 15, vapor-liquid coexistence curves are shown for both PYS and m-
TraPPE-UA nonane models. The bulk liquid densities of m-TraPPE-UA nonane are found
to be slightly (< 3%) higher than that of PYS nonane for T < 400 K. But, the density of
PYS nonane exceeds that of m-TraPPE-UA for T > 450 K. The densities of m-TraPPE-UA
nonane agree very well with the NIST [57] densities for T < 400 K. However, at the higher
temperatures (T > 450 K), the densities of m-TraPPE-UA nonane differ significantly from

40
T ( K)
Figure 17. Temperature dependent surface tension plotted for PYS nonane (squares) and m-TraPPE-UA nonane (diamonds) and compared with NIST surface tension values (dashed line). Circles are the surface tension values for the rigid bond TraPPE-UA model, taken from Ref. [56].
the NIST values in both the liquid and vapor regions. On the other hand, the coexistence
curve of PYS nonane is consistently lower than that given by NIST, but the difference is
generally small. Thus, PYS nonane reproduces the coexistence curve and the critical point
somewhat more accurately than does m-TraPPE-UA nonane.
The vapor pressure of m-TraPPE-UA nonane is found to be higher than that of PYS
nonane as well as the NIST vapor pressure values as shown in Figure 16. In general,as
seen in Figure 17, the surface tension of m-TraPPE-UA is slightly smaller than that of PYS
nonane and closer to the NIST values at low temperatures. At higher temperatures, T > 475
K, the deviation from the PYS and NIST values increases. To gauge the effect of vibrating
bonds in m-TraPPE-UA nonane on the surface tension, we have also included a few surface
tension values determined with the original rigid TraPPE-UA nonane.[56] The two models
produce values that are in very close agreement indicating that the replacement of rigid
bonds by vibrating bonds has very little effect on the surface tension.
The average molecular orientation of m-TraPPE-UA nonane is shown in Figure 18.
The behavior is very similar to that found for PYS nonane and NERD nonane.
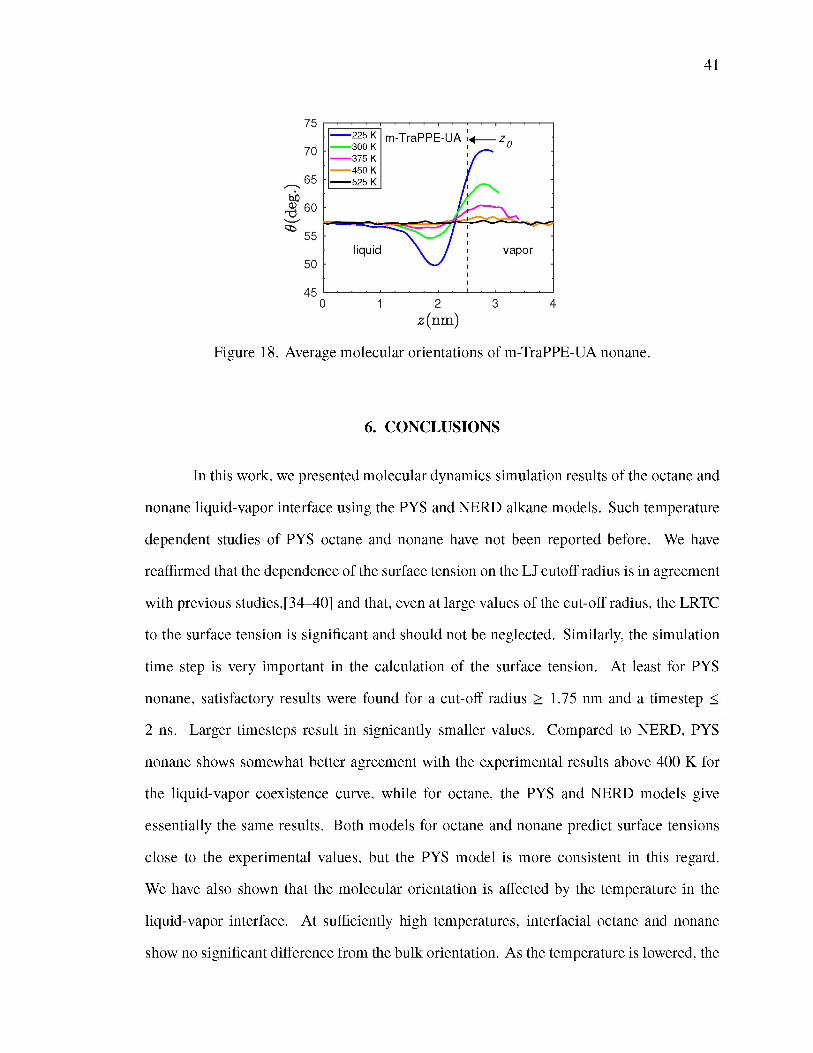
41
z(nm)
Figure 18. Average molecular orientations of m-TraPPE-UA nonane.
6. CONCLUSIONS
In this work, we presented molecular dynamics simulation results of the octane and
nonane liquid-vapor interface using the PYS and NERD alkane models. Such temperature
dependent studies of PYS octane and nonane have not been reported before. We have
reaffirmed that the dependence of the surface tension on the LJ cutoff radius is in agreement
with previous studies,[34-40] and that, even at large values of the cut-off radius, the LRTC
to the surface tension is significant and should not be neglected. Similarly, the simulation
time step is very important in the calculation of the surface tension. At least for PYS
nonane, satisfactory results were found for a cut-off radius > 1.75 nm and a timestep <
2 ns. Larger timesteps result in signicantly smaller values. Compared to NERD, PYS
nonane shows somewhat better agreement with the experimental results above 400 K for
the liquid-vapor coexistence curve, while for octane, the PYS and NERD models give
essentially the same results. Both models for octane and nonane predict surface tensions
close to the experimental values, but the PYS model is more consistent in this regard.
We have also shown that the molecular orientation is affected by the temperature in the
liquid-vapor interface. At sufficiently high temperatures, interfacial octane and nonane
show no significant difference from the bulk orientation. As the temperature is lowered, the
42
molecules at the interface tend to be more parallel to the surface near the Gibbs dividing
surface (z0) and more perpendicular to the surface a little deeper into the l - v transition
zone at the location of the highest density, where the molecules were also more elongated as
well. These tendencies grew more pronounced as the melting temperature was approached.
These orientational trends anticipated the freezing behavior observed at the liquid-vapor
interface for NERD nonane at 210 K and for NERD octane at 195 K.
ACKNOWLEDGEMENTS
The authors acknowledge the assistance of Prof. T. Vojta with the Pegasus IV
computing cluster and thank Prof. B. Wyslouzil for helpful comments on alkane freezing.
Simulations were also performed at the Forge hpc computer facility located at Missouri
S&T.
REFERENCES
[1] L. M. Shipman and J. P. Kohn, ‘Heterogeneous Phase and Volumetric Equilibrium in the Methane-n-Nonane System.’ J. Chem. Eng. Data, 1966,11(2), pp. 176-180.
[2] A. Goebel and K. Lunkenheimer, ‘Interfacial Tension of the Water/n-Alkane Interface,’ Langmuir, 1997, 13(2), pp. 369-372.
[3] D. M. Mitrinovic, A. M. Tikhonov, M. Li, Z. Huang, and M. L. Schlossman, ‘Noncapillary-Wave Structure at the water-Alkane Interface,’ Phys. Rev. Lett., 2000, 85(3), p. 582.
[4] Z.-F. Wang, L.-S. Wang, and T.-B. Fan, ‘Densities and Viscosities of Ternary Mixtures of Heptane, Octane, Nonane, and Hexyl Benzene from 293.15 K to 313.15 K,’ J. Chem. Eng. Data, 2007, 52(5), pp. 1866-1871.
[5] M. Ramos-Estrada, G. A. Iglesias-Silva, K. R. Hall, and F. Castillo-Borja, ‘Experimental Liquid Densities of n-Pentane, n-Octane, and n-Nonane and Their Binary Mixtures from (273.15 to 363.15) K at 0.1 MPa,’ J. Chem. Eng. Data, 2011, 56(12), pp. 4461-4465.
[6 ] B. E. Wyslouzil and J. Wolk, ‘Overview: Homogeneous nucleation from the vapor phase-The experimental science,’ J. Chem. Phys., 2016,145(21), p. 211702.

43
[7] F. Hrahsheh and G. Wilemski, ‘Fluctuating structure of aqueous organic nanodroplets,’ in ‘AIP Conference Proceedings,’ Vol. 1527, AIP, 2013 pp. 63-66.
[8 ] A. Obeidat, F. Hrahsheh, and G. Wilemski, ‘Scattering Form Factors for Russian Doll Aerosol Droplet Models,’ J. Phys. Chem. B, 2015,119(29), pp. 9304-9311.
[9] Y. Qiu and V. Molinero, ‘Morphology of Liquid-Liquid Phase Separated Aerosols,’ J. Am. Chem. Soc, 2015,137(33), pp. 10642-10651.
[10] H. Pathak, A. Obeidat, G. Wilemski, and B. Wyslouzil, ‘The structure of D2O-nonane nanodroplets,’ J. Chem. Phys., 2014, 140(22), p. 224318.
[11] G. J. Doster, J. L. Schmitt, and G. L. Bertrand, ‘Binary nucleation of n-octane and i-octane,’ J. Chem. Phys., 2000, 113(17), pp. 7197-7203.
[12] D. Ghosh, D. Bergmann, R. Schwering, J. Wolk, R. Strey, S. Tanimura, and B. E. Wyslouzil, ‘Homogeneous nucleation of a homologous series of n-alkanes (Q H 2i+2, i= 7-10) in a supersonic nozzle,’ J. Chem. Phys., 2010, 132(2), p. 024307.
[13] W. L. Jorgensen, J. D. Madura, and C. J. Swenson, ‘Optimized intermolecular potential functions for liquid hydrocarbons,’ J. Am. Chem. Soc., 1984,106(22), pp. 6638-6646.
[14] M. G. Martin and J. I. Siepmann, ‘Transferable Potentials for Phase Equilibria. 1. United-Atom Description of n-Alkanes,’ J. Phys. Chem. B, 1998, 102(14), pp. 25692577.
[15] S. K. Nath, F. A. Escobedo, and J. J. dePablo, ‘On the simulation of vapor-liquid equilibria for alkanes,’ J. Chem. Phys., 1998, 108(23), pp. 9905-9911.
[16] J. R. Errington and A. Z. Panagiotopoulos, ‘A New Intermolecular Potential Model for the n-Alkane Homologous Series,’ J. Phys. Chem. B, 1999,103(30), pp. 6314-6322.
[17] D. A. Hernandez and H. Dominguez, ‘Structural and thermodynamic behavior of alkane chains at the liquid/vapor interface,’ J. Chem. Phys., 2013,138(13), p. 134702.
[18] W. Paul, D. Y. Yoon, and G. D. Smith, ‘An optimized united atom model for simulations of polymethylene melts,’ J. Chem. Phys., 1995, 103(4), pp. 1702-1709.
[19] N. Waheed, M. Lavine, and G. Rutledge, ‘Molecular simulation of crystal growth in n-eicosane,’ J. Chem. Phys., 2002,116(5), pp. 2301-2309.
[20] N. Waheed, M. J. Ko, and G. Rutledge, ‘Molecular simulation of crystal growth in long alkanes,’ Polymer, 2005, 46(20), pp. 8689-8702.
[21] P. Yi and G. C. Rutledge, ‘Molecular simulation of crystal nucleation in n-octane melts,’ J. Chem. Phys., 2009,131(13), p. 134902.
[22] V. P. Modak, B. E. Wyslouzil, and S. J. Singer, ‘On the determination of the crystal- vapor surface free energy, and why a gaussian expression can be accurate for a system far from gaussian,’ J. Chem. Phys., 2016, 145(5), p. 054710.

44
[23] Y. Qiu and V. Molinero, ‘Strength of Alkane-Fluid Attraction Determines the Interfacial Orientation of Liquid Alkanes and Their Crystallization through Heterogeneous or Homogeneous Mechanisms,’ Crystals, 2017, 7(3), p. 8 6 .
[24] A. J. Bourque and G. C. Rutledge, ‘Kinetic Model for Layer-by-Layer Crystal Growth in Chain Molecules,’ Macromolecules, 2016, 49(10), pp. 3956-3964.
[25] A. Bourque, C. R. Locker, and G. C. Rutledge, ‘Molecular Dynamics Simulation of Surface Nucleation during Growth of an Alkane Crystal,’ Macromolecules, 2016, 49(9), pp. 3619-3629.
[26] M. Anwar, F. Turci, and T. Schilling, ‘Crystallization mechanism in melts of short n-alkane chains,’ J. Chem. Phys., 2013, 139(21), p. 214904.
[27] P. Yi and G. C. Rutledge, ‘Molecular simulation of bundle-like crystal nucleation from n-eicosane melts,’ J. Chem. Phys., 2011,135(2), p. 024903.
[28] A. J. Bourque, C. R. Locker, and G. C. Rutledge, ‘Heterogeneous Nucleation of an n-alkane on Tetrahedrally Coordinated Crystals,’ J. Phys. Chem. B, 2017, 121(4), pp. 904-911.
[29] G. Wilemski, A. Obeidat, and F. Hrahsheh, ‘Form factors for Russian doll droplet models,’ in ‘AIP Conference Proceedings,’ volume 1527, AIP, 2013 pp. 144-147.
[30] V. P. Modak, H. Pathak, M. Thayer, S. J. Singer, and B. E. Wyslouzil, ‘Experimental evidence for surface freezing in supercooled n-alkane nanodroplets,’ Phys. Chem. Chem. Phys., 2013,15(18), pp. 6783-6795.
[31] Z. Liang, W. J. Evans, and P. Keblinski, ‘Thermal resistance at an interface between a crystal and its melt,’ J. Chem. Phys., 2014, 141(1), p. 014706.
[32] D. A. Nicholson and G. C. Rutledge, ‘Flow-induced inhomogeneity and enhanced nucleation in a long alkane melt,’ Polymer, 2020, p. 122605.
[33] S. K. Nath and R. Khare, ‘New forcefield parameters for branched hydrocarbons,’ J. Chem. Phys., 2001,115(23), pp. 10837-10844.
[34] A. Trokhymchuk and J. Alejandre, ‘Computer simulations of liquid/vapor interface in Lennard-Jones fluids: Some questions and answers,’ J. Chem. Phys., 1999, 111(18), pp. 8510-8523.
[35] D. Duque and L. F. Vega, ‘Some issues on the calculation of interfacial properties by molecular simulation,’ J. Chem. Phys., 2004, 121(17), pp. 8611-8617.
[36] F. J. Blas, L. G. MacDowell, E. deMiguel, and G. Jackson, ‘Vapor-liquid interfacial properties of fully flexible Lennard-Jones chains,’ J. Chem. Phys., 2008, 129(14), p. 144703.

45
[37] R. E. Isele-Holder, W. Mitchell, and A. E. Ismail, ‘Development and application of a particle-particle particle-mesh Ewald method for dispersion interactions,’ J. Chem. Phys., 2012, 137(17), p. 174107.
[38] F. Goujon, A. Ghoufi, P. Malfreyt, and D. J. Tildesley, ‘Controlling the Long-Range Corrections in Atomistic Monte Carlo Simulations of Two-Phase Systems,’ Journal of Chemical Theory and Computation, 2015, 11(10), pp. 4573-4585.
[39] A. Ghoufi, P. Malfreyt, and D. J. Tildesley, ‘Computer modelling of the surface tension of the gas-liquid and liquid-liquid interface,’ Chem. Soc. Rev., 2016, 45(5), p p .1387-1409.
[40] L. Lundberg and O. Edholm, ‘Dispersion Corrections to the Surface Tension at Planar Surfaces,’ J. Chem. Theory Comput., 2016, 12(8), pp. 4025-4032.
[41] H. A. Lorentz, ‘Ueber die Anwendung des Satzes vom Virial in der kinetis- chen Theorie der Gase,’ Annalen der Physik, 1881, 248, pp. 127-136, doi: 10.1002/andp.18812480110.
[42] D. Berthelot, ‘Sur le melange des gaz,’ Compt. Rendus, 1898,126, pp. 1703-1706.
[43] Note that the torsional potential parameter values for NERD model are different from those used in Ref. [17]. As mentioned in Ref. [33], the typographical error in the V3 torsional potential coefficient in Ref. [15] is propagated in Ref. [17]. The original NERD force field takes the torsional potential from Ref. [13].
[44] L. Martinez, R. Andrade, E. G. Birgin, and J. M. Martinez, ‘Packmol: a package for building initial configurations for molecular dynamics simulations,’ J. Comput. Chem., 2009, 30(13), pp. 2157-2164.
[45] A. I. Jewett, Z. Zhuang, and J.-E. Shea, ‘Moltemplate a coarse-grained model assembly tool,’ Biophys. J., 2013, 104(2), p. 169a.
[46] S. Plimpton, ‘Fast Parallel Algorithms for Short-Range Molecular Dynamics,’ J. Comput. Phys., 1995,117(1), pp. 1-19.
[47] W. C. Swope, H. C. Andersen, P. H. Berens, and K. R. Wilson, ‘A computer simulation method for the calculation of equilibrium constants for the formation of physical clusters of molecules: Application to small water clusters,’ J. Chem. Phys., 1982, 76(1), pp. 637-649.
[48] S. Nose, ‘A unified formulation of the constant temperature molecular dynamics methods,’ J. Chem. Phys., 1984, 81(1), pp. 511-519.
[49] W. G. Hoover, ‘Canonical dynamics: Equilibrium phase-space distributions,’ Phys. Rev. A, 1985, 31(3), p. 1695.
[50] G. A. Chapela, G. Saville, S. M. Thompson, and J. S. Rowlinson, ‘Computer simulation of a gas-liquid surface. part 1,’ J. Chem. Soc. Faraday Trans. II, 1977, 8 , p. 133.

46
[51] G. C. Lie, S. Grigoras, L. X. Dang, D.-Y. Yang, and A. D. McLean, ‘Monte Carlo simulation of the liquid-vapor interface of water using an ab initio potential,’ J. Chem. Phys., 1993, 99(5), pp. 3933-3937.
[52] E. Blokhuis, D. Bedeaux, C. Holcomb, and J. Zollweg, ‘Tail corrections to the surface tension of a Lennard-Jones liquid-vapour interface,’ Mol. Phys., 1995, 85(3), pp. 665-669.
[53] J. Alejandre, D. J. Tildesley, and G. A. Chapela, ‘Fluid phase equilibria using molecular dynamics: the surface tension of chlorine and hexane,’ Mol. Phys., 1995, 85(3), pp. 651-663.
[54] A. P. Thompson, S. J. Plimpton, and W. Mattson, ‘General formulation of pressure and stress tensor for arbitrary many-body interaction potentials under periodic boundary conditions,’ J. Chem. Phys., 2009,131(15), p. 154107.
[55] M. P. Allen and D. J. Tildesley, Computer simulation o f liquids, Oxford university press, 2017.
[56] S. Braun, A. Imre, and T. Kraska, ‘Stability limits of n-nonane calculated from molecular dynamics interface simulations,’ J. Chem. Phys., 2013,138(24), p. 244710.
[57] P. J. Linstrom and W. G. Mallard, editors, NIST Chemistry WebBook, NIST Standard Reference Database Number 69, National Institute of Standards and Technology, 2019.
[58] V. P. Modak, Surface Freezing in n-Alkanes: Experimental and Molecular Dynamics Studies, Ph.D. thesis, The Ohio State University, 2015.
[59] A. R. vanBuuren, S. J. Marrink, and H. J. Berendsen, ‘A Molecular Dynamics Study of the Decane/Water Interface,’ J. Phys. Chem., 1993, 97(36), pp. 9206-9212.
[60] F. N. Mendoza, R. Lopez-Rendon, J. Lopez-Lemus, J. Cruz, and J. Alejandre, ‘Surface tension of hydrocarbon chains at the liquid-vapour interface,’ Molecular Physics, 2008, 106(8), pp. 1055-1059.
[61] E. Wang and F. A. Escobedo, ‘Mechanical properties of tetrapolyethylene and tetrapoly (ethylene oxide) diamond networks via molecular dynamics simulations,’ Macromolecules, 2016, 49(6), pp. 2375-2386.

47
II. MOLECULAR DYNAMICS STUDY OF TEMPERATURE DEPENDENT WETTING IN ALKANE-WATER SYSTEMS
Pauf Neupane and Gerald Wilemski
Department of Physics
Missouri University of Science and Technology
Rolla, MO 65409, USA
ABSTRACT
To explore the wetting behavior of alkanes on water at bulk interfaces, molecular
dynamics simulations have been carried out to determine the temperature dependence of (1)
the surface tension of alkanes (octane, nonane) and water, and (2 ) the interfacial tensions
of the alkane-water systems. We used a united-atom PYS alkane model, and SPC/E and
TIP4P/2005 water models. The Lennard-Jones cross-interaction parameters between unlike
atoms in the alkane-water interactions were optimized to match the experimentally observed
spreading coefficient (S). We found generally contrasting wetting behavior for alkanes on
SPC/E and TIP4P/2005 water models at lower temperatures. Our results show that at lower
temperatures, in contrast to the conventional expectations, the contact angle formed by either
PYS alkane on SPC/E water decreases with a decrease in the temperature. On the other
hand, such unusual wetting behavior has not been observed in the PYS octane - TIP4P/2005
water system, although there is a hint of such behavior at the lowest two temperatures (2 2 0
and 225 K) for the PYS nonane and TIP4P/2005 water system. At higher temperatures,
the contact angle formed by octane and nonane on both water models is found to decrease
with increasing temperature, as the systems approach the usual high-temperature wetting
transition.

48
1. INTRODUCTION
Aqueous organic systems play an important role in many environmental andin-
dustrial processes, such as the formation and growth of atmospheric aerosols, crude oil
recovery from an oil-field, on-site cleaning of natural gas, and clean-up of oil spills. One of
the common features underlying these processes is how well the water surface is wetted by
the organic compound. When an oil droplet is present on the water surface in the presence
of vapor, the wetting behavior is determined by the surface free energies, or equivalently the
interfacial tensions. Usually, the sum of the free energies of the oil surface and the oil-water
interface exceeds the free energy of the water surface, leading to the partial wetting of water
by the oil droplet with a finite contact angle. Oil completely wets water when the free energy
of the water surface exactly balances the sum of free energies of the remaining surfaces.
Although vapor-liquid surface tension values for pure alkanes (oil) and water are commonly
available in the literature, to date, experimental information regarding temperature depen
dent oil-water interfacial tensions is quite limited. A few experimental results have been
reported for alkane-water interfacial tensions. Goebel and Lunkenheimer,[1] and Mitri-
novic et al. [2 ] reported the interfacial tension of several alkane-water systems at a single
temperature. Matsubara et al. [3] studied the temperature dependence of the pentane-water
interfacial tension. Aveyard and Haydon,[4] and Zeppieri et al. [5] studied the temperature
dependent interfacial tension of several alkane-water systems. Still, the interfacial tension
values in the latter two studies are consistently lower than those reported in Refs. [1, 2]
for the identical system and temperature, perhaps due to low levels of surface-active con
taminants. Computationally, several molecular dynamics (MD) studies have focussed on
the interfacial tensions of oil-water systems.[6-12] Out of these works, only two studies
reported the temperature dependent behavior.[8 , 9] It is worth noting that the outcomes of
such studies will depend upon the details of the simulations, such as boundary conditions,
force field parameters, the cutoff range of the potentials, and simulation timestep, even when
nominally identical models are used.

49
Previously, the temperature dependence of the contact angle and the wetting behavior
of several alkanes on aqueous ionic solutions has also been studied experimentally [13
16] as well as theoretically [17-19] to some extent. All these studies find a decreasing
contact angle with increasing temperature until the system undergoes a wetting transition
at a higher temperature. On the other hand, Hrahsheh and Wilemski [20] found a highly
unusual increase of contact angle with the rise in temperature in their MD simulations
of nonane-water nanodroplets. Such a positive correlation between the contact angle and
the temperature is known to occur only for a pair of partially miscible liquids having a
lower consolute temperature.[21, 22] Below the consolute temperature, the components of
these partially miscible liquids become miscible, and the system exhibits a low temperature
wetting transition somewhat above the consolute temperature.
Alkanes and water have very limited miscibility and no lower consoute temperature,
so the positive correlation of the contact angle with temperature is not expected. Therefore,
it is important to explore the unusual behavior of the contact angle found in the nonane-water
nanodroplets simulations in order to understand further how this unusual behavior depends
on the molecular models used and, perhaps, on other details of the simulations.
In this work, we use MD simulations to study the temperature dependent wetting
behavior of octane and nonane on water. We determine the surface tension of alkanes,
water, and alkane-water interfacial tensions at planar interfaces. The computed interfacial
tension values are then used to calculate the contact angles formed by the alkanes on
water. Further, we also explore the effect of the potential cutoff radius on the interfacial
tensions, and examine the significance for wetting behavior of long-range tail corrections
to the interfacial tensions. We are unaware of any previous study of temperature dependent
wetting in alkane-water systems using MD techniques.

50
2. SIMULATION DETAILS
To determine the temperature dependent interfacial tensions, the simulation systems
were typically constructed as follows: (i) an alkane slab containing 620 octane molecules
or 550 nonane molecules was placed at the middle of a rectangular box of cross-section of
5.5 x 5.5x nm2 such that liquid occupies one third the volume of the box, (ii) a slab of 990
water molecules was kept at the middle of 3.1 x 3.1 x 9 nm3 rectangular box, and (iii) a
slab of 990 water molecules was sandwiched between a pair of identical alkane slabs, each
containing 105 octane molecules or 100 nonane molecules. The volume of the liquid-liquid
simulation boxes varies with the temperature. All the dimensions were chosen to satisfy the
minimum image criterion.
In this work, the alkanes were treated with a united-atom PYS forcefield.[23-26]
Two water models were studied: SPC/E [27] and TIP4P/2005 [28]. Charged atoms in the
water molecules interact with Coulomb’s potential. All intermolecular interactions and
intramolecular interactions separated by four or more bonds within like atoms interact with
Lennard-Jones (LJ) potential
Vlj = 4ea \ 12
ra \ 6
r )(1)
where e, a are LJ energy and size parameters, respectively. The interactions between
unlike atoms (carbon, oxygen) were also described by the LJ potential with the interaction
parameters eoc, a oc optimized to fit the experimentally determined spreading coefficient (S)
of alkane on water near 300 K temperature.
The spreading coefficient [29] is defined as the following difference of the interfacial
tensions: S = yw- ( y a+yaw), where ya (yw) denote the surface tension of pure alkane (water)
and yaw represents the alkane-water interfacial tension. Since the computer models of pure
water and alkanes do not reproduce experimental values of the surface tensions perfectly,
we found it preferable to match the S values rather than the liquid-liquid interfacial tensions

51
Table 1. Comparision of spreading coefficient for alkane on water for different eoc (a oc = 0.36 nm).
Model 6oc (kJ/mol) T (K) S (mN/m)octane-waterExpt. 295 -1.5 a, b, cExpt. 298 -1.0 a,b, dPYS-SPC/E 0.55 300 -12.1PYS-SPC/E 0.65 300 -1.2PYS-TIP4P/2005 0.66 300 -1.9nonane-waterExpt. 295 -2.7 a,b, cExpt. 298 -2.9 a, b, dPYS-SPC/E 0.55 300 -14.9PYS-SPC/E 0.65 300 -3.7PYS-SPC/E 0.66 300 -2.7PYS-TIP4P/2005 0.66 300 -4.8
a y w from Ref. [32], b y a from Ref. [33],c y aw from Ref. [1], d y aw from Ref. [2]
with the hope of balancing the inaccuracies of the three interfacial tensions to achieve
realistic predictions of wetting. As seen in Table 1, the S values obtained using the usual
Lorentz-Berthelot (L-B) combining rules [30, 31] for eoc, a oc for the alkane - SPC/E water
interactions (eoc = 0.55 kJ/mol, <roc = 0.36 nm) in our simulations deviated greatly from
the the S values determined using experimental interfacial tensions [1,2, 32, 33] near 300
K. The large discrepancies in the S values determined experimentally and computationally,
while using L-B combining rules, were reduced by suitably parameterizing eoc, keeping
a oc = 0.36 nm. Unless otherwise stated, our simulations used eoc = 0.65 kJ/mol and 0.66
kJ/mol for the alkane-SPC/E water and alkane-TIP4P/2005 water interactions, respectively.
With these eoc and <roc parameters, the calculated S values at 300 K were found to be in
better agreement with the experimentally determined S values than those based on the L-B
combining rules.
All initial configurations were built using PACKMOL [34] and moltemplate [35]
software. Simulations over a wide range of temperatures were performed with the LAMMPS
[36] molecular dynamics simulation package. All the simulations were carried out in a

52
canonical (N V T ) ensemble for pure liquids and in a constant-NPNAT ensemble at 1 atm.
for the two-liquid systems, where PN and A represent the normal pressure and the cross
sectional area, respectively. Periodic boundary conditions were applied in all directions.
The time step was chosen to be 2 fs. The equations of motion were solved using the velocity
Verlet integrator.[37] After 3 ns of equilibration, the interfacial tensions were determined
from multiple (3-10) 30-40 ns long runs. To control the temperature, the Nose-Hoover
[38, 39] thermostat was used with a coupling time constant of 0.2 ps. The pressure was
controlled using a Nose-Hoover barostat with a coupling time of 2.0 ps where applicable.
The SHAKE algorithm [40] was used to keep the water molecule rigid. The electrostatic
interactions were handled using a particle-particle particle-mesh (pppm) solver.[41] The
intermolecular interactions and the intramolecular interactions separated by four or more
bonds were handled with LJ potentials. The LJ potential cutoff for our simulations is
determined from the study of the interfacial tensions for different cutoffs, which we will
explore in Sec. 3.1.
At each temperature, the time-averaged density profiles were fitted to a hyperbolic
tangent function [42]
p (z ) = 2 (Pa + Pb ) - 2 (p a - Pb ) tanh (Z - zo (2)
where pA and pB represent the density in the liquid phase and in the vapor phase, far from
the interface, respectively for a vapor-liquid interface. For a liquid-liquid interface, p(z)
represents the density profile of liquid A, with pA and pB being its densities in the liquid A
rich region and in the liquid B rich region, respectively. In Eq. 2, z0 represents the position
of a Gibbs dividing surface, at which the density becomes half of the bulk value, and d is the
interfacial thickness parameter which is related to the“10-90" thickness t as d = t/2.1972.
The interfacial tensions were determined by integrating the difference of the normal (PN(z))

53
and tangential (PT(z)) pressure components along the direction normal to the interfaces
1 r “Y = 2 dz[PN(z) — Pt (z)], (3)
2 J —TO
where the factor of 1 /2 accounts for the presence of two such interfaces in our simulation
cell. For our geometry, PN(z) = Pzz(z) and PT(z) = (Pxx(z) + Pyy (z))/2. The contribution
of long-range tail corrections y t to the interfacial tensions were also calculated following the
formula given by Chapela et al. [42] and later modified by Blokhius et al. [43]. Following
Li, et al. [44] and Lundberg and Edholm [45], the tail correction can be compactly expressed
as
Yt = 3n(A pD/fc)2 gt (rc/d) (4)
where gt is a dimensionless integral that depends on rc/d,
f ds fJ 0 J 0
gt (fc/d) dxx (3s3 — s) coth(s(rc/ d ) / x ) (5)
and where the dispersion density difference ApD depends on the type of interface. For a
vapor-liquid interface of molecules with only a single type of interaction site, it is given by
(A pD )2 = 4 6(t 6(p a — PB )2 (6)
and for a liquid-liquid interface it can be written most generally as
(A PD )2 = 4 (ei (T-f p \ + €2 (r( p 22 — 2 e i2 o f 2p i p2) (7)

54
where eu o i are the LJ parameters for pure liquid i and p i is its bulk density. The latter
expression differs from those found in Refs [44] and [45] because we explicitly avoid using
the geometric mean approximation for epsilon and sigma. It is generally valid irrespective
of the combining rules used for eij and o ij . Finally, the contact angles formed by alkane
on water were calculated using the rigorous thermodynamic formula [29]
cos 6 = YW - Ta - Y2aw
2Ya yaw(8)
3. RESULTS
In this work, we studied: (i) the effect of LJ cutoff radius on the interfacial tensions,
(ii) the temperature dependence of the interfacial tensions, and (iii) the temperature de
pendent wetting of PYS alkanes (n-octane and n-nonane) on SPC/E and TIP4P/2005 water
models.
3.1. EFFECT OF CUTOFF RADIUS ON INTERFACIAL TENSIONS
First, we studied the surface tensions of PYS octane, SPC/E water, and the PYS
octane-SPC/E water interfacial tension for LJ cutoffs ranging from 1.0 nm to 2.5 nm at 300
K temperatures. The volume of the simulation boxes and the number of molecules were
adjusted for higher cutoff values to satisfy the minimum image convention. A typical system
with 2.5 nm cutoff consisted of 380 octane molecules in a box of dimensions 5.1 x 5.1 x 12.0
nm3 or 2680 water molecules in 5.1 x 5.1 x 9.0 nm3 box or 550 octane and 2680 water
molecules in a box of approximate dimensions 5.1 x 5.1 x 8.9 nm3.
In Figure 1, the interfacial tensions are plotted versus the LJ cutoff radius (rc). The
filled and the open markers represent the respective interfacial tensions with and without
including the long range tail correction (LRTC) y t. It is inferred from Figure 1, that the
surface tension (y + yt) of octane initially increases with an increase in rc and become nearly

55
70
60J ,
50ao• rH 40CO
CD 30
20o
Sh 10CD
'ShH 0
—i---■
---1--
-■---1
---■--
-1---■
---1--
-■--
i *o
■
■ «D
<>♦
1 ■
CD
<
♦ ■
□ ■
•>
<3*
--■--1---■--1---■--1--■--1---■--1—
■ «>
•
■
- «
>€
)■
□
□' □
0 water-vapor O octane-water □ octane-vapor
1 1.5 2 2.5
r c ( n m )
Figure 1. Simulated surface tensions of SPC/E water (diamonds), PYS octane (squares) and the octane-water interfacial tensions (circles) plotted as a function of LJ cutoff at 300 K. Filled markers account the long range tail corrections to the interfacial tensions, while the open markers do not.
constant for rc > 1.75 nm. A similar cutoff dependence of the PYS nonane surface tension
is also observed in our simulations. On the other hand, the surface tension of water and the
octane-water interfacial tension ( y + y t) are found to be independent of the cutoff radius.
Hence, we decided to use rc = 1.75 nm for pure alkanes, and rc = 1.5 nm for pure water
and the alkane-water systems in our simulations at different temperatures as a compromise
between accuracy and computational time.
The contribution of the LRTC y t should not be neglected in determining the in
terfacial tensions from MD simulations. Even at the highest cutoff value studied, the
contributions of y t to the total surface tension of octane and water are found to be roughly
9% and 2%, respectively. The contribution of y t is higher for smaller rc values. It is
interesting to note that, with the optimized eoc, a oc values for the octane-water interaction
in our simulations, the uncorrected interfacial tensions are found to be overestimated, and
the tail correction values are negative. The negative tail correction is due to not using

56
geometric mean rule (Berthelot rule) in determining eoc. With the geometric mean rule for
eoc, yt would be 0.2 mN/m instead of -1.2 mN/m at the 1.5 nm cutoff value. (Of course, y
would also be quite different.)
3.2. TEMPERATURE DEPENDENCE OF THE INTERFACIAL TENSIONS
We studied the effect of temperature on the surface tension of water, alkane (octane,
nonane), and on the alkane-water interfacial tension. To evaluate the LRTC, the interfacial
thickness parameter d must be determined from the simulated density profiles. In Figure 2,
molecular density profiles for SPC/E water and octane are plotted for 210 K, 350 K, and
400 K temperatures. Dashed lines and solid lines represent the fitted density profiles of
water and octane, respectively, calculated using Eq. 2. For better statistics, the left half of
the simulation box is mirrored and averaged with the right half during the calculation of the
density profiles. It is noteworthy that the lowest temperature density profile contains the
apophysis, the high density, compact water surface layer similar to that found by Wang et
al..[46] Density profiles for the octane-SPC/E water system at temperatures 210 K and 400
K are shown in Figure 3. Here as well, there is an apophysis in the water density profile at
210 K and the peak in the alkane profile is an indication of some kind of favorable alignment
at the interface.
The surface tension of water has been extensively studied both experimentally and
computationally. Hacker’s experimental data from 1951 show an anomaly in the surface
tension of water at lower temperatures.[47] The surface tension increases more rapidly
with decreasing temperature in the supercooled region, where liquid exists below freezing
temperature, with a possible second inflection point (SIP) on the surface tension curve.
Based upon these data, Holten, Labetski, van Dongen in 2005 had suggested a fit with a
SIP at 267.5 K.[48] However, later in 2014, experiments performed by Hruby et al. showed
the absence of a SIP in the water surface tension data.[49] This result has been supported
by recent experimental results in 2017, measured down to 250 K.[50] Several water models

57
40
32
2 4
fl16TJ
a>8
0
SPC/E
liquid
si*i\\\\\\ \ *
♦ 2 10 K ■ 3 50 K• 4 25 K
vapor
\ \ \\ \ \ t v,
0 0.5 1 1.5 2 2.5 3z(nm)
0 0.5 1 1.5 2 2.5 3 3.5 4 4.5z(nm)
Figure 2. Density profiles (molecular) of SPC/E water (left) and PYS octane (right) plotted for different temperatures. Points are the densities calculated using bin size of 0.1 nm. Dotted and solid lines represent the profiles fitted using Eq. 2.
4 £33 'a!ao « 2
<0
5
0
Figure 3. Density profiles (molecular) of SPC/E water and PYS octane in the octane-water system at 215 K (diamonds) and at 400 K (circles) temperatures. Points are the densities calculated using bin size of 0.1 nm. The fitted profiles for water and octane are represented by the dotted and solid lines, respectively.
have been used to study the surface tension of water computationally. MD simulations
of many common water models and their comparison with previous studies have been
presented in Ref. [51]. A few simulations, performed at sufficiently low temperatures, have
shown the presence of the SIP in the SPC/E and TIP4P/2005 water models.[46, 52] Another
effect of the SIP is to enhance the density of the water at the liquid-vapor interface well
above the bulk value as shown in Fig. 2 and Fig. 3. SPC/E is the most commonly used water

58
200 250 300 350 400 450 500T( K)
ao• rHccav+=a>uat4-H!h2m
+ H ruby (2014)IAPW S (2014)
o S akam aki (2011)■ S ega (2017)
♦ T h is w o rk
TIP4P/2005 water
80
70
60
50
40
30
200 250 300 350 400 450 500T(K)
Figure 4. Surface tension of SPC/E water (left) and TIP4P/2005 water (right) as a function of temperature. Our results (diamonds) are compared with two previous studies.[51, 55] The plus signs and the solid lines represent experimental results.[32, 49] In the inset, the dashed line is obtained by fitting the surface tension values at higher temperatures T > 275K.
model, whereas the TIP4P/2005 water model is known to predict the surface tension more
accurately. Our simulation results for the surface tension of the SPC/E and TIP4P/2005
water models are in close agreement with the previous studies of these models [46, 51-57]
as seen in Figure 4. The inset figures show the surface tension for lower temperatures.
The dashed lines are obtained by fitting the surface tension values at higher temperatures,
T > 275 K. We see from the insets of Figure 4 and that the surface tension values at
lower temperatures deviate from the high-temperature fits to the surface tension values.
The deviation is a maximum at the lowest temperature studied. This behavior supports the
presence of the SIP in the surface tension of the SPC/E and TIP4P/2005 water models. As
we will discuss later, the simulated wetting behavior observed at very low temperatures
seems to be affected by the presence of the SIP. Since our primary goal is to study the
wetting behavior of alkanes on water, we have not bothered to determine the location of the
SIP from our results.

59
Figure 5. Surface tensions of octane (upper panel) and nonane (lower panel) are plotted as a function of temperature. Our PYS model results (squares) are compared with NIST surface tension values (solid lines).[33]
In Figure 5, the surface tension of PYS octane and PYS nonane are plotted versus
temperature and are compared with the respective NIST surface tension values.[33] Plots
covering wider temperature ranges (210 K - 525 K for octane and 210 K - 550 K for nonane)
have previously been presented.[58]
The alkane-water interfacial tensions are shown in Figure 6. Circles represent
simulation results, and the asterisk and star represent experimental alkane - water interfacial
tensions from Ref. [1] and Ref. [2], respectively. All computed interfacial tensions at 300 K
are lower than the experimental interfacial tension values, although the TIP4P/2005 results
are much closer to the experimental values than are the SPC/E results. For the same water
model, the nonane-water interfacial tension is usually slightly higher than the octane-water
interfacial tension. The alkane-water interfacial tension is also found to decrease with an
increase in temperature. The rate of change in interfacial tension with temperature is similar
in alkane - SPC/E water and alkane - TIP4P/2005 water at higher temperatures. However,
we have noticed that, at lower temperatures (T < 250 K) the interfacial tension of alkane -

60
55
50
45
40 [p— <
• Sh35*+Hu0)30
♦♦ % Octane - water
COo,• •
Goebel expt, (1997)- f a Mitrioovic expt. (2000) ^ TTP4P/2005 water O SPC /E water
200 250 300 350T( K)
400 450
a50
j ,40
« l-H
30« l-Ho& on20"31-1 200 250 300 350 400 450 500
r(K )
\ i *
♦ ♦
Nonane - water
♦
♦
•
••
/
♦• ♦
• ♦•• ♦
* ♦
$ (r Goebel expt. (1997) * ♦Mitrinovic expt. (2000) •
4 T IP 4P /2005 waterO S P C /E water •
J __l__l__l__l__I__l__l__l__l__I__l__l__l__l__I__l__l__l__l__I__l__l__l__l__L
Figure 6. Octane-water (left) and nonane-water (right) interfacial tension for PYS alkane with TIP4P/2005 water (diamonds) and SPC/E water (circles). Our results are compared with experimental octane - water interfacial tensions (asterisk - Ref. [1], star - Ref. [2])
TIP4P/2005 water changes more rapidly than that of alkane - SPC/E water. Moreover, each
of these curves displays a change of curvature similar to that resulting from the SIP for the
pure water models.
3.3. TEMPERATURE DEPENDENT WETTING
Based on the simulation results presented in Section 3.2, we have calculated the
spreading coefficient S for PYS octane and nonane on SPC/E water and TIP4P/2005 water
and the corresponding contact angles 0 for each of these four systems. The spreading
coefficients (S) are shown in Figure 7, and the contact angles (0) are shown in Figure 8. The
circles and diamonds are the results obtained using the simulated interfacial tensions. The
spreading coefficients, and the contact angles are found to be quiteanother point sensitive
to the simulated interfacial tension values. To reduce the fluctuations, 0 and S have also
been calculated using polynomial fits to the simulated interfacial tensions (solid lines).
Moreover, 0 and S are also calculated based on experimental values of the interfacial
tensions,[1, 2, 32, 33] and these values are represented by the asterisk and star. We note
that for both S and 0 the SPC/E model is in better ageement with these results.

61
0.5
0
Octane - Water Perfect wetting
• / • / *-05
-1
♦ / ♦ ■
• • ☆• /
/ ♦
S H O / ♦-1.5 • • * ;
1
0
-1
-2£s -3
CO -4-2 * Goebel 7 ™ (1997) -5 * Goebel 7 ™ (1997)
♦ ^ — ☆ Mitrinovic 7 ^ (2000) ☆ Mitrinovic 7 0I0 (2000)
2.5 ♦ /* • S P C /E (simulated 7 ) • S P C /E (simulated 7 )
♦ T IP 4P /2005 (simulated 7 ) -6 ■ ♦ ♦ T IP 4P /2005 (simulated 7 )
Nonane - Water PerfecLwetting_
200 250 300 350T(K)
400 450 200 250 300 350 400T(K)
450 500
Figure 7. Spreading coefficient (S) of octane on water (left) and nonane on water (right). The diamonds are for TIP4P/2005 water, and the circles are for SPC/E water. Lines are obtained from fits to the simulated interfacial tension values. The asterisk and star represent values calculated using experimental values of the interfacial tensions.
When an alkane perfectly wets water, S = 0 and 6 = 0. S < 0 or 6 > 0 imply
partial wetting. The behavior of each property, S and 6, is similar at higher temperatures
for both water models, but dissimilar at lower temperatures. First, let us note that the
positive S values seen in Figure 7 are artifacts of our simulation methodology. According
to Rowlinson and Widom,[29] positive S values are unphysical. They occur typically when
the interfacial tension values are inconsistent. These values should be properly determined
using liquids that are fully equilibrated with each component, but because the mutual
solubilities of alkanes and water are so low, these conditions are impossible to satisfy given
the relatively small system sizes and simulation times that are practical. Beginning at the
high temperature point, the wetting transition temperature Tw, where S=0 or 6=0, we would
have perfect wetting at all higher temperatures. As the temperature is reduced from Tw, S is
seen to grow increasingly more negative and 6 increases, and partial wetting ensues. These
trends are in qualitative (or semi-quantitative) agreement with experimental results for the
octane-water system.[59] For octane-TIP4P/2005 water, these trends continue down to the
lowest temperatures simulated, deep into the supercooled water region for this model, T <
249 K. For nonane-TIP4P/2005 water, these trends continue down to only 250 K. the two

62
Figure 8. The contact angle formed by octane on water (left) and nonane on water (right). The diamonds are for TIP4P/2005 water, and the circles are for SPC/E water. Lines are obtained from fits to the simulated interfacial tension values. The asterisk and star represent values calculated using experimental values of the interfacial tensions.
points calculated at 225 K and 220K show a reversal of these trends. If real, this reversal is
likely connected to the behavior of the interfacial tensions of water and water-nonane below
the SIP temperature. This behavior warrants a much more detailed investigation, but it is
beyond the scope of the present work.
For octane-SPC/E water, below roughly 270 K, the normal trends, just described, are
reversed: S begins to increase, and 0 begins to decrease, as if the system were approaching
a low temperature transition to perfect wetting. For nonane-SPC/E water similar trend
reversals occur, but at higher temperatures: roughly 325 K for S and 375 K for 0.
The presence of the low-temperature wetting transition and the increasing value
of the contact angle with increasing temperature is highly unusual. To the best of our
knowledge, such behavior has not yet been reported for a bulk system of two liquids with
such limited miscibility. The increase of contact angle formed by PYS nonane on SPC/E
water with an increase in temperature at lower temperatures seen in Figure 8 is consistent
with the behavior found in a previous study of wetting on nanodroplets.[20] We did not run
the simulations at low enough temperature to observe a potential low-temperature wetting
transition in the alkane - SPC/E water systems.

63
Table 2. Wetting transition temperatures, Tw from MD simulations and experiments
Alkane Water Model Tw (K)Octane SPC/E 365Nonane SPC/E 498-500Octane TIP4P/2005 395Nonane TIP4P/2005 506-509Octane Experiment * 456Nonane Experiment * 500
by extrapolation. See Figure 9.
Figure 9. Wetting transition temperatures for different n-alkane on water. Calculated values from Ref. [17] are in excellent agreement with experiment.
At higher temperatures, both octane and nonane with TIP4P/2005 water show a
decreasing contact angle with increasing temperature, leading to the occurrence of the
usual high-temperature wetting transition. We estimated the Tw values of octane-water
and nonane-water by extrapolating the experimental transition temperatures of shorter
alkanes[18] versus carbon number (see Figure 9). The estimated Tw values are 456 K
for octane and 500 K for nonane. These are in fair agreement with our simulated transition
temperatures of about 395 K for PYS octane-TIP4P/2005 water and 510 K for PYS nonane-
TIP4P/2005 water. The corresponding Tw values for SPC/E water are 365 K for octane and
498-500 K for nonane.

64
50
40T30) i lfcuOcd+3c3"3OO
30
20
10
0
o
9 0
Nonane - SPC/E Water = 0.66 kJ/mol
o c
^ Goebel 7 „„ (1997) i t Mitrinovic ' f ml (2000) O simulated 7
200 250 300 350r(K)
Figure 10. Temperature dependence of the contact angle formed by nonane on SPC/E water when 6 o c=0.66 kJ/mol. Filled circles represent contact angles calculated using interfacial tensions. Open circles are the counter-part of the filled circles without long-range tail corrections to the interfacial tensions. Asterisk and star are calculated using experimental values of the interfacial tensions.
Another point to note is that the liquid-liquid (l - l ) interfacial tensions, and the
contact angles are found to be quite sensitive to the values of the LJ cross-interaction
parameters. For PYS nonane - SPC/E water, the l - l interfacial tension and the contact
angle are found to be decreased by ~2.5% and ~14% respectively at 300 K by changing eoc
to 0.66 kJ/mol from 0.65 kJ/mol, while keeping a oc constant. With eoc=0.66 kJ/mol, the
contact angle formed by nonane on the water is found to match nearly perfectly with that
calculated using experimental interfacial tension values (see Figure 10).
We have also explored the importance of the tail correction y t on the wetting behav
ior. In Figure 10, the contact angles formed by nonane on SPC/E water are represented by
open circles when the tail correction y t is not applied in the interfacial tension calculations.
For T < 250 K, when y t is excluded from the interfacial tensions, the contact angle is found
to decrease more rapidly, and can be extrapolated to a wetting transition at somewhat lower
T (< 210 K). However, the tail-corrected values extrapolate to a wetting transition at lower
T than was computationally studied.

65
4. CONCLUSIONS
Using molecular dynamics simulations, we have studied the surface tension of SPC/E
and TIP4P/2005 water, PYS alkanes (octane, nonane), and the corresponding alkane-water
interfacial tensions to explore the temperature dependent wetting behavior of these alkanes
on water.
As the temperature decreases, the interfacial tension increases. In the supercooled
region, the surface tensions of the SPC/E and TIP4P/2005 water models are found to
increase more rapidly with decreasing temperature, thereby showing the presence of the
SIP in the surface tension curves. We also simulated the temperature dependent behavior of
the interfacial tensions for PYS alkane (octane, nonane) and SPC/E or TIP4P/2005 water by
choosing values for the LJ cross-interaction parameters eoc and <roc between unlike atoms
that would yield experimentally observed spreading coefficients S near 300 K.
We have studied the temperature dependent wetting behavior of PYS alkane (octane,
nonane) with SPC/E water and TIP4P/2005 water. PYS octane was found to perfectly wet
water (SPC/E, TIP4P/2005) at higher temperatures (365 K for SPC/E based on either S=0
or theta = 0 and 390 K (S=0)or 395 K (theta =0) for TIP4P/2005), which is consistent with
the experimental findings although the transition temperature does not match our estimate
of 456 K for the experimental value. PYS nonane behaved similarly to octane on both water
models, yielding appropriately larger wetting transition temperatures. On SPC/E these were
500 K (S=0 and 0 =0) and on TIP4P/2005, the transition temperatures were 506 K (S=0)
and 509 K for theta extrapolated to 0.
However, at lower temperatures, contrasting wetting behavior of PYS alkane with
SPC/E and TIP4P/2005 water models was found. At the lower temperatures, both PYS
octane and nonane show unusual wetting behavior on SPC/E water, in which the contact
angle decreases with a decrease in temperature. If carried to sufficiently low temperatures,
this behavior would lead to the occurence of a low-temperature wetting transitions in each
system. On the other hand, PYS octane does not show such unusual low-temperature wetting
66
behavior with TIP4P/2005 water, but there is a hint of this unusual behavior in the two lowest
temperature points studied. The wetting behavior depends on how the liquid-vapor (l - v)
and the liquid-liquid (l - l) interfacial tensions change with the temperature. There is a
change in curvature in the alkane - water interfacial tension curves at lower temperatures for
both water models, such that the interfacial tension increases more rapidly with decrease in
temperature below roughly 225 K. Similar increases in the surface tensions of the pure water
models were also found. Thus, we may conclude that the unusual behavior of the spreading
coefficient and contact angle at low temperature is a consequence of the competing rates of
change of the water surface tension and the alkane-water interfacial tension. When y w is
dominant, S increases and theta decreases; when y aw is dominant, the reverse occurs and
normal behavior is observed.
The occurence of low temperature perfect wetting of alkanes on water is not justified
physically, although it may be inferred from the results shown for the octane and nonane -
SPC/E water simulations. Previously, the unusual positive correlation of the contact angle
formed by nonane on SPC/E water was also observed in nanodroplet simulations in which
the geometric mean approach was used to determine the LJ energy parameter between unlike
atoms. [20] Based on our results, it may be questionable to use the SPC/E water model
in the study of wetting at lower temperature, close to the melting temperature and in the
supercooled region. While the idea of a low temperature wetting transition in alkane-water
systems is intriguing, we are far from convinced that such a transition could occur in a real
system.
ACKNOWLEDGEMENTS
We acknowledge the assistance of Thomas Vojta with the Pegasus IV cluster. We
thank Julia Medvedeva, Paul Parris, Thomas Vojta, Barbara Wyslouzil for reading the
manuscript and providing any feedback.

67
APPENDIX
In this work, the surface/interfacial tension values are subjected to polynomial fits.
The fitting parameters are shown in Table A1. The surface tension of water fits to the 4th
order polynomial as yw = aT4 + bT3 + cT2 + dT + e.
£J ,
O• l-Hma<D<DUfH3m
ao« l-HKflCD
CD
CO200 250 300 350 400 450 500
T(K) T(K)
Figure A1. Surface tension of SPC/E water (left) and TIP4P/2005 water (right). The dotted line is the fit to the simulated values (markers).
The surface tension of alkane y a fits to the 2nd order polynomial as ya = cT2 + dT + e.
30
20£j ,'P
10
0
Octane30
Nonane■ x
v
‘ X /m)
rv> o
V .V .
■**■**
£
' PX
V 10
_._.__i__i__i__i__i__i__i__i__i__i__i__i__i__i__i__i__i__i__i__i__i__i__i__i__i__i__i__i__i__ 0 __1_1__1_1__1__1__1__1__1__1__1__1__1__1__1__,__,__,__,__1__,__,__,__,__1__,__,__,__,__1__,__l_200 250 300 350 400 450 500
T{ K )
200 250 300 350 400 450 500T ( K )
Figure A2. Surface tension of octane (left) and nonane (right). The dotted line is the fit to the simulated values (markers).

68
Table A1. Fitting parameters for surface/interfacial tension values
System a b c d eSPC/E water 3.06382*10-9 -4.69769* 10-6 2.49264*10-3 -0.71141 152.6408TIP4P/2005 water 9.18658*10-9 -1.36805* 10-5 7.29547*10-3 -1.82105 252.6465Octane 4.07142*10-5 -0.12418 48.4992Nonane 4.01526*10-5 -0.12097 56.8409Octane-SPC/E water 1.36796*10-8 -1.74352* 10-5 7.96350*10-3 -1.60969 167.0396Nonane-SPC/E water 4.82497*10-9 -7.25805* 10-6 3.72964*10-3 -0.85533 118.8931Octane-TIP4P/2005 water 2.30611*10-8 -3.13672* 10-5 1.55197*10-2 -3.38713 327.5105Nonane-TIP4P/2005 water 1.74295*10-9 -2.91846* 10-6 1.51383*10-3 -0.37675 90.0333
The alkane-water interfacial tension yaw fits to the 4th order polynomial as yaw =
aT4 + bT3 + cT2 + dT + e.
55
50 i
45 i03P)CD
40
35 I-U-iu CD
30
H Octane - waterH ,
-»
m.^ TTP4P/2005 water O S P C /E water •
H -l _ . 20 4 ^
+ T IP 4P /2005 water O SP C /E water
50 ■
a 40[O13CD
30« l-Hu
Nonane - water
•••- :.xX
200 250 300 350T{ K)
400 450 200 250 300 350 400 450 500T(K)
Figure A3. Octane-water(left)and nonane-water(right)interfacial tensions. The diamonds are for TIP4P/2005 water, and the circles are for SPC/E water. The dotted line is the fit to the simulated values.
REFERENCES
[1] A. Goebel and K. Lunkenheimer, ‘Interfacial Tension of the Water/n-Alkane Interface,’ Langmuir, 1997, 13(2), pp. 369-372.
[2] D. M. Mitrinovic, A. M. Tikhonov, M. Li, Z. Huang, and M. L. Schlossman, ‘Noncapillary-Wave Structure at the Water-Alkane Interface,’ Phys. Rev. Lett., 2000, 85(3), p. 582.

69
[3] H. Matsubara, M. Murase, Y. Mori, and A. Nagashima, ‘Measurement of the Surface Tensions and the Interfacial Tensions of n-Pentane-Water and R 113-Water Systems,’ Int. J. Thermophys., 1988, 9(3), pp. 409-424.
[4] R. Aveyard and D. Haydon, ‘Thermodynamic Properties of Aliphatic Hydrocar- bon/Water Interfaces,’ Trans. Faraday Soc., 1965, 61, pp. 2255-2261.
[5] S. Zeppieri, J. Rodriguez, and A. Lopez deRamos, ‘Interfacial Tension of Alkane + Water Systems,’ J. Chem. Eng. Data, 2001, 46(5), pp. 1086-1088.
[6] A. R. Van Buuren, S. J. Marrink, and H. J. Berendsen, ‘A molecular dynamics study of the decane/water interface,’ J. Phys. Chem., 1993, 97(36), pp. 9206-9212.
[7] Y. Zhang, S. E. Feller, B. R. Brooks, and R. W. Pastor, ‘Computer simulation of liquid/liquid interfaces. I. Theory and application to octane/water,’ J. Chem. Phys., 1995,103(23), pp. 10252-10266.
[8] J. Nicolas and N. De Souza, ‘Molecular dynamics study of the n-hexane-water interface: Towards a better understanding of the liquid-liquid interfacial broadening,’ J. Chem. Phys., 2004, 120(5), pp. 2464-2469.
[9] H. Xiao, Z. Zhen, H. Sun, X. Cao, Z. Li, X. Song, X. Cui, and X. Liu, ‘Molecular dynamics study of the water/n-alkane interface,’ Sci. China Chem., 2010, 53(4), pp. 945-949.
[10] J.-C. Neyt, A. Wender, V. Lachet, A. Ghoufi, and P. Malfreyt, ‘Quantitative Predictions of the Interfacial Tensions of Liquid-Liquid Interfaces through Atomistic and Coarse Grained Models,’ J. Chem. Theory Comput., 2014,10(5), pp. 1887-1899.
[11] J. L. Rivera, C. McCabe, and P. T. Cummings, ‘Molecular simulations of liquid-liquid interfacial properties: Water-n-alkane and water-methanol-n-alkane systems,’ Phys. Rev. E, 2003, 67(1), p. 011603.
[12] Y. Qiu and V. Molinero, ‘Strength of Alkane-Fluid Attraction Determines the Interfacial Orientation of Liquid Alkanes and Their Crystallization through Heterogeneous or Homogeneous Mechanisms,’ Crystals, 2017, 7(3), p. 86.
[13] K. Ragil, J. Meunier, D. Broseta, J. O. Indekeu, and D. Bonn, ‘Experimental Observation of Critical Wetting,’ Phys. Rev. Lett., 1996, 77(8), p. 1532.
[14] N. Shahidzadeh, D. Bonn, K. Ragil, D. Broseta, and J. Meunier, ‘Sequence of Two Wetting Transitions Induced by Tuning the Hamaker Constant,’ Phys. Rev. Lett., 1998, 80(18), p. 3992.
[15] E. Bertrand, H. Dobbs, D. Broseta, J. Indekeu, D. Bonn, and J. Meunier, ‘First-Order and Critical Wetting of Alkanes on Water,’ Phys. Rev. Lett., 2000, 85(6), p. 1282.
[16] S. Rafai, D. Bonn, E. Bertrand, J. Meunier, V. C. Weiss, and J. O. Indekeu, ‘Long- Range Critical Wetting: Observation of a Critical End Point,’ Phys. Rev. Lett., 2004, 92(24), p. 245701.

70
[17] V. C. Weiss, ‘Theoretical description of the adsorption and the wetting behavior of alkanes on water,’ J. Chem. Phys., 2006,125(8), p. 084718.
[18] V. C. Weiss, ‘Calculation of the surface pressure and the contact energy in the adsorption of alkanes on water,’ Fluid Ph. Equilibria, 2007, 256(1-2), pp. 145-150.
[19] V. C. Weiss, E. Bertrand, S. Rafai, J. O. Indekeu, and D. Bonn, ‘Effective exponents in the long-range critical wetting of alkanes on aqueous substrates,’ Phys. Rev. E, 2007, 76(5), p. 051602.
[20] F. Hrahsheh and G. Wilemski, ‘Fluctuating structure of aqueous organic nanodroplets,’ in ‘AIP Conference Proceedings,’ volume 1527, AIP, 2013 pp. 63-66.
[21] D. Pohl and W. Goldburg, ‘Wetting Transition in Lutidine-Water Mixtures,’ Phys. Rev. Lett., 1982, 48(16), p. 1111.
[22] H. T. Davis, Statistical Mechanics o f Phases, Interfaces, and Thin Films, Wiley-VCH, 1996.
[23] W. Paul, D. Y. Yoon, and G. D. Smith, ‘An optimized united atom model for simulations of polymethylene melts,’ J. Chem. Phys., 1995, 103(4), pp. 1702-1709.
[24] N. Waheed, M. Lavine, and G. Rutledge, ‘Molecular simulation of crystal growth in n-eicosane,’ J. Chem. Phys., 2002,116(5), pp. 2301-2309.
[25] N. Waheed, M. J. Ko, and G. Rutledge, ‘Molecular simulation of crystal growth in long alkanes,’ Polymer, 2005, 46(20), pp. 8689-8702.
[26] P. Yi and G. C. Rutledge, ‘Molecular simulation of crystal nucleation in n-octane melts,’ J Chem. Phys., 2009,131(13), p. 134902.
[27] H. Berendsen, J. Grigera, and T. Straatsma, ‘The Missing Term in Effective Pair Potentials,’ J. Phys. Chem., 1987, 91(24), pp. 6269-6271.
[28] J. L. Abascal and C. Vega, ‘A general purpose model for the condensed phases of water: TIP4P/2005,’ J. Chem. Phys., 2005,123(23), p. 234505.
[29] J. S. Rowlinson and B. Widom, Molecular Theory o f Capillarity, Dover Publication, Mineola, NY, 2002.
[30] H. A. Lorentz, ‘Ueber die Anwendung des Satzes vom Virial in der kinetis- chen Theorie der Gase,’ Annalen der Physik, 1881, 248, pp. 127-136, doi: 10.1002/andp.18812480110.
[31] D. Berthelot, ‘Sur le melange des gaz,’ Compt. Rendus, 1898,126, pp. 1703-1706.
[32] T. Petrova and R. Dooley, ‘Revised release on surface tension of ordinary water substance,’ Proceedings of the International Association for the Properties of Water and Steam, Moscow, Russia, 2014, pp. 23-27.

71
[33] P. J. Linstrom and W. G. Mallard, editors, NIST Chemistry WebBook, NIST Standard Reference Database Number 69, National Institute of Standards and Technology, 2019.
[34] L. Martinez, R. Andrade, E. G. Birgin, and J. M. Martinez, ‘Packmol: a package for building initial configurations for molecular dynamics simulations,’ J. Comput. Chem., 2009, 30(13), pp. 2157-2164.
[35] A. I. Jewett, Z. Zhuang, and J.-E. Shea, ‘Moltemplate a coarse-grained model assembly tool,’ Biophys. J., 2013, 104(2), p. 169a.
[36] S. Plimpton, ‘Fast parallel algorithms for short-range molecular dynamics,’ J. Comput. Phys., 1995, 117(1), pp. 1-19.
[37] W. C. Swope, H. C. Andersen, P. H. Berens, and K. R. Wilson, ‘A computer simulation method for the calculation of equilibrium constants for the formation of physical clusters of molecules: Application to small water clusters,’ J. Chem. Phys., 1982, 76(1), pp. 637-649.
[38] S. Nose, ‘A unified formulation of the constant temperature molecular dynamics methods,’ J. Chem. Phys., 1984, 81(1), pp. 511-519.
[39] W. G. Hoover, ‘Canonical dynamics: Equilibrium phase-space distributions,’ Phys. Rev. A, 1985, 31(3), p. 1695.
[40] J.-P. Ryckaert, G. Ciccotti, and H. J. Berendsen, ‘Numerical Integration of the Cartesian Equations of Motion of a System with Constraints: Molecular Dynamics of n-Alkanes,’ J. Comput. Phys., 1977, 23(3), pp. 327-341.
[41] R. W. Hockney and J. W. Eastwood, Computer Simulation using Particles, Adam Hilger, Bristol, 1989.
[42] G. A. Chapela, G. Saville, S. M. Thompson, and J. S. Rowlinson, ‘Computer simulation of a gas-liquid surface. part 1,’ J. Chem Soc. Faraday Trans. II, 1977, 73(7), pp. 11331144.
[43] E. Blokhuis, D. Bedeaux, C. Holcomb, and J. Zollweg, ‘Tail corrections to the surface tension of a Lennard-Jones liquid-vapour interface,’ Mol. Phys., 1995, 85(3), pp. 665-669.
[44] Z. Li, F. Yuan, K. A. Fichthorn, S. T. Milner, and R. G. Larson, ‘Molecular View of Polymer/Water Interfaces in Latex Paint,’ Macromolecules, 2014, 47(18), pp. 64416452.
[45] L. Lundberg and O. Edholm, ‘Dispersion Corrections to the Surface Tension at Planar Surfaces,’ J. Chem. Theory Comput., 2016, 12(8), pp. 4025-4032.
[46] X. Wang, K. Binder, C. Chen, T. Koop, U. Poschl, H. Su, and Y. Cheng, ‘Second inflection point of water surface tension in the deeply supercooled regime revealed by entropy anomaly and surface structure using molecular dynamics simulations,’ Phys. Chem. Chem. Phys., 2019, 21(6), pp. 3360-3369.

72
[47] P. T. Hacker, ‘Experimental Values of the Surface Tension of Supercooled Water,’ Technical report, National Advisory Committee for Aeronautics, Washington, 1951.
[48] V. Holten, D. Labetski, and M. Van Dongen, ‘Homogeneous nucleation of water between 200 and 240 K: New wave tube data and estimation of the tolman length,’ J. Chem. Phys., 2005,123(10), p. 104505.
[49] J. Hruby, V. Vins, R. Mares, J. Hykl, and J. Kalova, ‘Surface Tension of Supercooled Water: No Inflection Point down to -25 °C,’ J. Phys. Chem. Lett., 2014, 5(3), pp. 425-428.
[50] V. Vins, J. Hosek, J. Hykl, and J. Hruby, ‘Surface Tension of Supercooled Water: Inflection Point-Free Course down to 250 K Confirmed Using a Horizontal Capillary Tube,’ J. Chem. Eng. Data, 2017, 62(11), pp. 3823-3832.
[51] R. Sakamaki, A. K. Sum, T. Narumi, and K. Yasuoka, ‘Molecular dynamics simulations of vapor/liquid coexistence using the nonpolarizable water models,’ J. Chem. Phys., 2011, 134(12), p. 124708.
[52] Y. Lu and B. Wei, ‘Second inflection point of water surface tension,’ Appl. Phys. Lett., 2006, 89(16), p. 164106.
[53] C. Vega and E. De Miguel, ‘Surface tension of the most popular models of water by using the test-area simulation method,’ J. Chem. Phys., 2007, 126(15), p. 154707.
[54] V. Vins, D. Celny, B. Plankova, T. Nemec, M. Duska, and J. Hruby, ‘Molecular Simulations of the Vapor-Liquid Phase Interfaces of Pure Water Modeled with the SPC/E and the TIP4P/2005 Molecular Models,’ in ‘EPJ Web of Conferences,’ volume 114, EDP Sciences, 2016 p. 02136.
[55] M. Sega and C. Dellago, ‘Long-Range Dispersion Effects on the Water/Vapor Interface Simulated Using the Most Common Models,’ J. Phys. Chem. B, 2017, 121(15), pp. 3798-3803.
[56] A. E. Ismail, G. S. Grest, and M. J. Stevens, ‘Capillary waves at the liquid-vapor interface and the surface tension of water,’ J. Chem. Phys., 2006, 125(1), p. 014702.
[57] F. Chen and P. E. Smith, ‘Simulated surface tensions of common water models,’ J. Chem. Phys., 2007, 126(22), p. 221101.
[58] P. Neupane and G. Wilemski, ‘Properties and freezing at the liquid-vapor interface of n-octane and n-nonane from molecular dynamics simulations,’ 2020, paper I of this thesis. To be submitted.
[59] S.-Y. Akatsuka, H. Yoshigiwa, and Y. H. Mori, ‘Temperature Dependencies of Spreading Coefficients of Hydrocarbons on Water,’ J. Colloid Interface Sci., 1995, 172(2), pp. 335-340.
III. TEMPERATURE DEPENDENT WETTING AND STRUCTURE OF ALKANE-WATER NANODROPLETS
73
Pauf Neupanea, Gerald Wilemskia and Fawaz Hrahsheha,b,c
aDepartment of Physics, Missouri University of Science and Technology, Rolla, MO
65409, USA
bHigher Colleges of Technology, ETS, MZWC, Abu Dhabi, 58855, United Arab Emirates
cAl al-Bayt University, Department of Physics, Faculty of Science, Al-Mafraq, Jordan
ABSTRACT
Molecular dynamics simulations of alkane-water nanodroplets were performed to
study the temperature dependent wetting behavior of octane and nonane on water nan
odroplets. The PYS model was used for the alkanes, and both the SPC/E and TIP4P/2005
models were used for water. We also varied the Lennard-Jones (LJ) cutoff distance and the
alkane-water ratio at a fixed temperature to determine their effects on the wetting behavior
of the nanodroplets. Our results show that configurational fluctuations of nanodroplets
are more pronounced for smaller LJ cutoff values and diminish as the LJ cutoff distance
increases. The contact angle of the alkanes on water is not affected by varying the alkane-
water ratio. In contrast to the conventional expectation, the contact angle of the alkanes on
water, for both water models, is found to increase with increasing temperature for the low
temperatures (<310K) studied here.
1. INTRODUCTION
The oil-water interfacial system has been an active research area for many decades
because of its multiple environmental and technological applications. In particular, aqueous
organic nanodroplets are abundant in the atmospheric aerosols that play a vital role in

74
important environmental processes such as cloud condensation, climate change, ozone
layer depletion, and acid rain deposition. They also can cause respiration-related health
issues. It is well known that the structure of the nanodroplets, in addition to their chemical
composition, affects their growth rates as well as their influence on the climate. The structure
of the nanodroplet relates to the spatial distribution, or equivalently the wetting behavior, of
its liquid species. Two possible structures for nanodroplets formed by a pair of immiscible
liquids are (a) a completely engulfing core-shell (CS) structure (complete wetting of one
liquid species by another) and (b) a partially engulfing Russian-doll (RD) structure (partial
wetting with non-zero contact angle).
The first experimental study of the internal structure of an aqueous organic nan
odroplet using small angle neutron scattering (SANS) provided direct evidence for a spheri
cal core-shell structure of the nanodroplet, in which a water core was completely surrounded
by a butanol shell.[1] Such core-shell structures of aqueous organic nanodroplets have also
been observed in other experimental work,[2] density functional theory (DFT) calculations
[3, 4] as well as in molecular dynamics (MD) studies [4-7]. In addition, Hrahsheh and
Wilemski also observed the nanodroplet’s fluctuating structure with the frequent transition
between spherical core-shell structures and non-spherical Russian-doll structures.[5]
The existence of the RD structure for nanodroplets comprised of highly immiscible
liquids is also supported by a small angle X-ray scattering (SAXS) experiment performed
in a supersonic nozzle,[8] and computer simulation studies [9-11]. Despite these efforts,
the temperature dependent behavior of nanodroplet structure is still poorly understood.[5,
9] Temperature is known to affect thermodynamic properties, such as surface tension,
that strongly influence nanodroplet structure. Using MD simulations of nonane-water
nanodroplets, Hrahsheh and Wilemski found a positive correlation of the contact angle for
nonane on water with temperature.[5] This contrasts with the far more common behavior in
which the contact angle decreases with increasing temperature. Moreover, the contact angle

75
found by Hrahsheh and Wilemski at 300 K was far larger than that based on experimental
surface tensions.[12] These observations highlight the need to further explore and better
understand this unusual behavior.
Previously, the temperature dependence of the contact angle and the wetting behavior
of several alkanes on aqueous ionic solutions has been studied experimentally [13-16] as
well as theoretically [17-19] for planar interfaces. These studies find a decreasing contact
angle with increasing temperature until the system undergoes a wetting transition to perfect
wetting at a higher temperature. On the other hand, our recent MD study shows contradictory
wetting behavior for alkanes on two different molecular models of water, SPC/E [20] and
TIP4P/2005, [21] at lower temperatures.[12] The contact angle for alkanes on SPC/E water
decreases with decreasing temperature, which is similar to the earlier nanodroplet simulation
results.[5] In contrast, on TIP4P/2005 water this unusual wetting behavior was not observed
for octane whose contact angle increased monotonically as T was decreased. For nonane
on TIP4P/2005 water the contact angle was essentially flat over a wide range of decreasing
temperature until the final two temperatures studied, 220 and 225 K, for which the contact
angle decreased. To further explore this contradictory wetting behavior and to examine the
applicability of planar interface results to the behavior of nanodroplets, we perform MD
simulations of alkane-water nanodroplets in this work.
The goals of this work are threefold. First, we will explore the effect of the Lennard-
Jones (LJ) cutoff radius on the wetting of binary nanodroplets when using molecular
dynamics (MD) simulations. To our knowledge, such a study has not been performed
before. Then we will study the wetting behavior of binary nanodroplets for different ratios
of the liquid species. Finally, we will explore the temperature dependent wetting behavior
of the alkane (octane, nonane) on SPC/E water, as well as on the more realistic TIP4P/2005
water model.
76
2. METHOD
2.1. FORCE FIELDS
In this work, the alkanes were treated with a united-atom PYS forcefield.[12, 22-25]
Water was modeled with two different forcefields: (a) SPC/E,[20] and (b) TIP4P/2005
[21]. SPC/E is one of the most commonly used water models, whereas TIP4P/2005 water
is known to predict the surface tension of water more accurately. Unlike in the work of
Hrahsheh and Wilemski,[5] the Lennard-Jones (LJ) interaction parameters between unlike
atoms were optimized here to fit the experimentally determined spreading coefficient (S)
of octane on water near 300 K temperature using planar interfaces. Details are provided in
our previous work.[12]
2.2. SIMULATION DETAILS
In this work, we studied three different cases: (a) LJ cutoff varying octane-water nan
odroplets simulations at T = 210 K, (b) octane number varying octane-water nanodroplets
simulations at T = 210 K, and (c) temperature varying alkane-water nanodroplets simula
tions. Accordingly, we used different system sizes. First, to study the LJ cutoff dependent
wetting and structure of octane-water nanodroplet at T = 210 K, a droplet was constructed
with 240 octane and 240 water molecules. Second, octane number varying octane-water
nanodroplets simulations at T = 210 K were performed with 480 water molecules and 60,
120, 240, or 480 octane molecules. Third, temperature dependent alkane-water nanodroplet
simulations were performed with 480 alkane molecules and 480 water molecules.
All initial configurations were built using PACKMOL [26] and moltemplate [27]
software, and simulations were performed with LAMMPS [28] molecular dynamics sim
ulation packages in a canonical ensemble. Periodic boundary conditions were applied in
all directions. The equations of motion were solved using velocity Verlet integrator [29]

77
and 2 fs timestep. Nose-Hoover [30, 31] thermostat with a coupling time constant of 0.2 ps
was used to control the temperature. SHAKE algorithm [32] was implemented to keep the
water molecule rigid. The electrostatic interactions were handled using a particle-particle
particle-mesh (pppm) solver.[33] All short-range intermolecular interactions and the in
tramolecular interactions separated by four or more bonds were handled with LJ potentials.
Before we chose the LJ potential cutoff for our octane number varying, and temperature
varying simulations to be 2.5 nm, we performed octane-water nanodroplet simulations for
several values of the LJ cutoff radius, which we will explore in Sec. 3.1.
In all simulations, the starting configurations of the nanodroplet were core-shell,
where water was confined to the interior of alkane. All simulations were carried out for 50
ns, out of which the last 40 ns were used to analyze the results.
3. RESULTS
3.1. EFFECT OF THE LJ CUTOFF RADIUS ON WETTINGE
First, octane-water nanodroplet simulations were performed for several values of the
LJ cutoff radius (rc), ranging from 1.25 nm to 5 nm, at T = 210 K. For this study, the nan
odroplets were prepared with 240 octane molecules and 240 water (SPC/E or TIP4P/2005)
molecules in a cubic simulation box of volume equals 10.4 x 10.4 x 10.4 nm3.
There are two possible configurations of the alkane-water nanodroplets, namely, (a)
a perfect wetting state in which the water droplet is surrounded by a layer of alkane, and (b)
a partial wetting state in which an alkane lens is formed on the water droplet with a finite
contact angle. The structure of the nanodroplets correlates with the distance between the
center of mass (daw) of alkane and water. Perfect wetting configurations have smaller d aw
values, whereas the the larger d aw values correspond to the partial wetting configurations.

78
0 10 20 30 40 50
r = 2.5 nmc
2
perfect wetting
00 10 20 30 40 50
£(ns)
Figure 1. Center of mass distance of octane and SPC/E water dow versus simulation time for rc= 1.25 nm (upper panel) and 2.50 nm (lower panel). Dashed lines separate the regions of partial wetting and perfect wetting configurations.
Here, we observed the fluctuating structure of the nanodoplets with the occurrence of
both partial and perfect wetting configurations at any rc value. Perfect wetting configurations
were found to be more common than the partial wetting configurations for the smaller rc
values (1.25 nm - SPC/E water and 1.25 nm, 1.5 nm - TIP4P/2005 water), while the opposite
is true for larger rc . This behavior is illustrated in Figure 1, where the center of mass distance
of octane and SPC/E water (dow) is plotted versus the simulation time for rc= 1.25 nm and
2.5 nm. Dashed lines separate the regimes of partial wetting and perfect wetting. Below the
dashed line, the droplets are in perfect wetting configurations. The fluctuations are reduced
for larger rc . Also, we did not find significant difference in the fluctuating dow curve for 2.5
nm and 5.0 nm rc values.
Out of 50 ns long runs, we used the trajectories from the last 40 ns to calculate the
average contact angle formed by octane on water droplets (Figure 2). The contact angles are
calculated using the Fletcher model [34, 35] as described in the caption of Figure 3 using
contours similar to those in Figure 4. In Figure 2, the average contact angles are represented
by diamonds for all configurations, and squares when perfect wetting configurations are

79
30
20
bD10
a>00c6
30o3tl
20
10
I " •
240 octane + 240 water (SPC/E)
■ Perfect wetting excluded 0 All configurations
♦ ♦ 240 octane + 240 water (TIP4P/2005)
■ Perfect wetting excluded ^ All configurations
2 3rc (nm)
1 2 3 4 5
01 4 5
Figure 2. Average contact angle versus rc for octane-water nanodroplets (upper panel - SPC/E water, lower panel - TIP4P/2005 water). Diamonds and squares are calculated using all configurations and excluding partial wetting configurations, respectively.
excluded. The differences between these markers (diamonds and squares) are significant
for smaller rc values, and insignificant for larger values, rc > 2.0 nm. Thus fluctuations
of the nanodroplet configurations are reduced for higher rc values. Moreover, the contact
angle is also seen to be sensitive to the choice of rc . It initially increases with an increase
in rc but becomes nearly constant for rc > 2.0 nm.
The presence of larger fluctuations of the droplets and the occurrence of relatively
smaller contact angles for smaller rc values suggests that the nanodroplet simulations using
smaller rc may not produce reliable results. This is because the limited interaction range
precludes the mutual interaction of most of the molecules in the droplet. Hence, we decided
to use rc = 2.5 nm, a value of the LJ cutoff radius large enough to allow most of the
molecules to interact in our remaining simulations with varying octane number and varying
temperature.

80
Figure 3. The contact angle 6c was calculated using the geometry shown in the figure and the equation cos 6c = (r2 + R2 - d 2)/(2 rR ); R and r are, respectively, the water and alkane droplet radii, and d is the distance between the centers.
3.2. VARYING OCTANE/WATER RATIO
Next, we studied the structure of octane-water nanodroplets for different octane/water
ratios at T = 210 K. We fixed the number of water molecules to be 480 and varied the number
of octane molecules. The simulation box size was 15.0 x 15.0 x 15.0 nm3.
z(nm)
Figure 4. contours plot for octane-water nanodoplets for 210 K. The lower panel shows the fitted contours.

81
30
20
bOO)3 -<u
I— (bOflcS
i o ltsoo
octane + 480 water (SPC/E)
f
T = 210 Kr = 2.5 nm
c
■ Perfect wetting excluded t All configurations
60 120 240 480 960Octane number
Figure 5. Contact angle for different octane numbers
0
The contour plots of the octane-SPC/E water nanodroplets at half of the maximum
densities are shown in Figure 4, upper panel. The solid straight lines represent the axis
through the centers of mass (COM) of octane and water. This symmetry axis is rotated
to overlay the octane lens termini. These contours can be subjected to the circular fits as
shown in Figure 4, lower panel. The water contour consists of two circular arcs having
different radii of curvature towards the octane (solid curves) and the vapor (dashed curves)
regions. The radii differ because the pressure drops across the water-octane and water-vapor
interfaces are different, as governed by the Laplace equation. In Figure 5, the contact angle
formed by the octane lens for different ratios of octane and water is plotted. These contact
angles do not differ significantly, implying the weak dependence of contact angle with the
octane/water ratio.
3.3. TEMPERATURE DEPENDENT WETTING STUDIES
Finally, we studied the temperature dependent wetting behavior of binary alkane-
water nanodroplets with 480 molecules of each species inside a simulation box of size 15.0
x 15.0 x 15.0 nm3. The temperature dependence of the contact angle formed by octane on
water and nonane on water is shown in Figure 6. Squares and circles represent the contact

82
40 50
210 240 270 300T(K)
40
bO 0>3JBHo§
3° b "SoO
20210 240 270 300
r(K )
Figure 6. Temperature dependence of contact angle formed by octane (left) and nonane (right) on SPC/E water (squares) and on TIP4P/2005 water (circles).
angles formed by alkane on SPC/E water and TIP4P/2005 water, respectively. The contact
angle values are averaged over partial wetting configurations for the last 40 ns simulation
time after 10 ns of equilibration.
The contact angles formed by octane and nonane on both SPC/E water and TIP4P/2005
water are found to increase with increasing temperature in the temperature range studied.
These results resemble the previous nonane-water nanodroplets results.[5]
We note that, in every simulation run, there were a few attempts to form an unstable
thin layer of alkane surrounding the water droplet. Except at T = 210 K, these attempts
to achieve a perfect wetting configuration were very rare in the octane-water nanodroplets
simulations. In the nonane-water nanodroplets simulations, almost all the configurations
were partial wetting configurations.
4. CONCLUSIONS
We have performed molecular dynamics simulations of octane-water and nonane-
water nanodroplets to study the effect of temperature on the structure and wetting behavior
of the nanodroplets. To get realistic prediction of wetting, we have used optimized Lennard-
Jones cross-interaction parameters to match the experimentally determined spreading co-

83
efficient. We have explored the effect of the potential cutoff radius on the nanodroplets
simulation and found that configurational fluctuations of the nanodroplets are found to be
enhanced for smaller value of the cutoff radius. For example, octane-SPC/E water at 210
K is found to prefer perfect wetting configuration over the partial configuration for 1.25
nm potential cutoff radius, although the partial wetting configuration is preferred for a 2.5
nm cutoff radius as seen in Figure 1. For a resonable cutoff radius (2.5 nm), the contact
angle formed by octane on water was studied for different compositions and was found to
be only weakly dependent on the ratio of the liquid species. The contact angle formed by
these liquid alkanes on water models was found to decrease unusually as the temperature is
lowered. This behavior is consistent with our previous nonane-water nanodroplets results
obtained using the Lorentz-Berthelot mixing rule for the unlike atom interactions [5] and
not used in this work.
REFERENCES
[1] B. E. Wyslouzil, G. Wilemski, R. Strey, C. H. Heath, and U. Dieregsweiler, ‘Experimental evidence for internal structure in aqueous-organic nanodroplets,’ Phys. Chem. Chem. Phys., 2006, 8(1), pp. 54-57.
[2] J. Buajarern, L. Mitchem, and J. P. Reid, ‘Characterizing the Formation of Organic Layers on the Surface of Inorganic/Aqueous Aerosols by Raman Spectroscopy,’ J. Phys. Chem. A, 2007, 111(46), pp. 11852-11859.
[3] J.-S. Li and G. Wilemski, ‘A structural phase diagram for model aqueous organic nanodroplets,’ Phys. Chem. Chem. Phys., 2006, 8(11), pp. 1266-1270.
[4] A. Obeidat, F. Hrahsheh, and G. Wilemski, ‘Scattering Form Factors for Russian Doll Aerosol Droplet Models,’ J. Phys. Chem. B, 2015,119(29), pp. 9304-9311.
[5] F. Hrahsheh and G. Wilemski, ‘Fluctuating structure of aqueous organic nanodroplets,’ in ‘AIP Conference Proceedings,’ volume 1527, AIP, 2013 pp. 63-66.
[6] Y. Qiu and V. Molinero, ‘Morphology of Liquid-Liquid Phase Separated Aerosols,’ J. Am. Chem. Soc, 2015,137(33), pp. 10642-10651.
[7] F. Hrahsheh, Y. S. Wudil, and G. Wilemski, ‘Confined phase separation of aqueous- organic nanodroplets,’ Phys. Chem. Chem. Phys., 2017, 19(39), pp. 26839-26845.

84
[8] H. Pathak, A. Obeidat, G. Wilemski, and B. Wyslouzil, ‘The structure of D2O-nonane nanodroplets,’ J. Chem. Phys., 2014, 140(22), p. 224318.
[9] A. Clarke, R. Kapral, and G. Patey, ‘Structure of two-component clusters,’ J. Chem. Phys., 1994, 101(3), pp. 2432-2445.
[10] M. E. McKenzie and B. Chen, ‘Unravelling the Peculiar Nucleation Mechanisms for Non-Ideal Binary Mixtures with Atomistic Simulations,’ J. Phys. Chem. B, 2006, 110(8), pp. 3511-3516.
[11] R. B. Nellas, S. J. Keasler, and B. Chen, ‘Molecular content and structure of aqueous organic nanodroplets from the vapor- liquid nucleation study of the water/n-nonane/1- alcohol series,’ The Journal of Physical Chemistry A, 2008, 112(13), pp. 2930-2939.
[12] P. Neupane and G. Wilemski, ‘Molecular dynamics study of temperature dependent wetting behavior of alkanes on water,’ 2020, Paper II of this thesis. To be submitted.
[13] K. Ragil, J. Meunier, D. Broseta, J. O. Indekeu, and D. Bonn, ‘Experimental Observation of Critical Wetting,’ Phys. Rev. Lett., 1996, 77(8), p. 1532.
[14] N. Shahidzadeh, D. Bonn, K. Ragil, D. Broseta, and J. Meunier, ‘Sequence of Two Wetting Transitions Induced by Tuning the Hamaker Constant,’ Phys. Rev. Lett., 1998, 80(18), p. 3992.
[15] E. Bertrand, H. Dobbs, D. Broseta, J. Indekeu, D. Bonn, and J. Meunier, ‘First-Order and Critical Wetting of Alkanes on Water,’ Phys. Rev. Lett., 2000, 85(6), p. 1282.
[16] S. Rafai', D. Bonn, E. Bertrand, J. Meunier, V. C. Weiss, and J. O. Indekeu, ‘Long- range critical wetting: Observation of a critical end point,’ Phys. Rev. Lett., 2004, 92(24), p. 245701.
[17] V. C. Weiss, ‘Theoretical description of the adsorption and the wetting behavior of alkanes on water,’ J. Chem. Phys., 2006,125(8), p. 084718.
[18] V. C. Weiss, ‘Calculation of the surface pressure and the contact energy in the adsorption of alkanes on water,’ Fluid Ph. Equilibria, 2007, 256(1-2), pp. 145-150.
[19] V. C. Weiss, E. Bertrand, S. Rafai, J. O. Indekeu, and D. Bonn, ‘Effective exponents in the long-range critical wetting of alkanes on aqueous substrates,’ Phys. Rev. E, 2007, 76(5), p. 051602.
[20] H. Berendsen, J. Grigera, and T. Straatsma, ‘The Missing Term in Effective Pair Potentials,’ J. Phys. Chem., 1987, 91(24), pp. 6269-6271.
[21] J. L. Abascal and C. Vega, ‘A general purpose model for the condensed phases of water: TIP4P/2005,’ J. Chem. Phys., 2005,123(23), p. 234505.
[22] W. Paul, D. Y. Yoon, and G. D. Smith, ‘An optimized united atom model for simulations of polymethylene melts,’ J. Chem. Phys., 1995, 103(4), pp. 1702-1709.

85
[23] N. Waheed, M. Lavine, and G. Rutledge, ‘Molecular simulation of crystal growth in n-eicosane,’ J. Chem. Phys., 2002,116(5), pp. 2301-2309.
[24] N. Waheed, M. J. Ko, and G. Rutledge, ‘Molecular simulation of crystal growth in long alkanes,’ Polymer, 2005, 46(20), pp. 8689-8702.
[25] P. Yi and G. C. Rutledge, ‘Molecular simulation of crystal nucleation in n-octane melts,’ J. Chem. Phys., 2009,131(13), p. 134902.
[26] L. Martinez, R. Andrade, E. G. Birgin, and J. M. Martinez, ‘Packmol: a package for building initial configurations for molecular dynamics simulations,’ J. Comput. Chem., 2009, 30(13), pp. 2157-2164.
[27] A. I. Jewett, Z. Zhuang, and J.-E. Shea, ‘Moltemplate a coarse-grained model assembly tool,’ Biophys. J., 2013, 104(2), p. 169a.
[28] S. Plimpton, ‘Fast parallel algorithms for short-range molecular dynamics,’ J. Comput. Phys., 1995, 117(1), pp. 1-19.
[29] W. C. Swope, H. C. Andersen, P. H. Berens, and K. R. Wilson, ‘A computer simulation method for the calculation of equilibrium constants for the formation of physical clusters of molecules: Application to small water clusters,’ J. Chem. Phys., 1982, 76(1), pp. 637-649.
[30] S. Nose, ‘A unified formulation of the constant temperature molecular dynamics methods,’ J. Chem. Phys., 1984, 81(1), pp. 511-519.
[31] W. G. Hoover, ‘Canonical dynamics: Equilibrium phase-space distributions,’ Phys. Rev. A, 1985, 31(3), p. 1695.
[32] J.-P. Ryckaert, G. Ciccotti, and H. J. Berendsen, ‘Numerical Integration of the Cartesian Equations of Motion of a System with Constraints: Molecular Dynamics of n-Alkanes,’ J. Comput. Phys., 1977, 23(3), pp. 327-341.
[33] R. W. Hockney and J. W. Eastwood, C om puter S im u la tio n using P artic les, Adam Hilger, Bristol, 1989.
[34] N. Fletcher, ‘Size Effect in Heterogeneous Nucleation,’ J. Chem. Phys., 1958, 29(3), pp. 572-576.
[35] K.-Y. Yoo, ‘Morphology of Sub-Microscale Atmospheric Aerosols composed of Two Liquid Phases According to the Loading Ratio of Organics/Water,’ Korean Chemical Engineering Research, 2017, 55(1), pp. 130-134.

86
SECTION
2. SUMMARY AND CONCLUSIONS
This dissertation comprises manuscripts of three projects carried out using molecular
dynamics (MD) simulation. First, we studied the thermophysical properties and molecular
orientations of octane and nonane liquids over a wide temperature range. Next, we explored
the temperature dependent wetting behavior of octane and nonane on water for planar
interfaces. Finally, the effect of temperature on the structure and wetting of octane-water
and nonane-water nanodroplets was explored.
In paper I, the mean molecular orientation of the alkanes was found to be temperature
dependent at the liquid-vapor interface. At lower temperatures, the average molecular
orientation at the interface near the bulk liquid region became more perpendicular to
the surface. This orientational preference anticipates surface freezing at an even lower
temperature. We observed the surface freezing of the NERD octane at 195 K and NERD
nonane at 210 K. By lowering the temperature to 200 K, complete freezing of the NERD
nonane was achieved. However, the freezing of PYS octane and PYS nonane was not
observed in this work, possibly due to insufficient simulation run time.
In paper II, we reported the first MD-based studies of temperature-dependent wetting
for liquid-liquid planar interfaces. We studied the wetting behavior of the PYS octane and the
PYS nonane on both SPC/E water and TIP4P/2005 water. At higher temperatures, all four
systems behaved qualitatively in accord with experiment. With increasing temperature, the
spreading coefficient increased, the contact angle decreased, and a high temperature wetting
transition to a state of perfect wetting was found. However, at lower temperatures, PYS
octane and nonane showed contradictory wetting behavior on SPC/E and TIP4P/2005 water.
For SPC/E water, in contrast to the conventional expectations,[4, 5, 9-12] the spreading

87
coefficient and the contact angle of octane and nonane on water showed reversed temperature
dependent behavior: the spreading coefficient decreased and the contact angle increased
with increasing temperature from the lowest temperatures studied. For TIP4P/2005 water, in
general, such an unusual temperature dependence of the wetting behavior was not observed,
except for the two lowest temperatures studied in the nonane system. The unusual low
temperature wetting behavior observed on the alkane-SPC/E water systems and the two
low temperature points for nonane-TIP4P/2005 water appears to arise from increases in the
water surface tension and the alkane-water interfacial tensions associated with the presence
of a so-called second inflection point (SIP) in the surface tension of certain water models.
The anomalous low temperature wetting behavior is not justified physically for systems of
immiscible pairs of liquids. These results suggest that SPC/E, and possibly TIP4P/2005
water may not be reliable models for wetting studies at low temperatures near the melting
temperature (213 K) and in the supercooled region.
In paper III, we performed molecular dynamics simulations of octane-water and
nonane-water nanodroplets to complement our planar interfaces wetting studies. We showed
that the configurational fluctuations of the nanodroplets are reduced by using larger potential
cutoff values. For a reasonable cutoff value, the average structure of the octane-water
nanodroplet was observed to only weakly depend on the liquid species ratio. The contact
angle 6c formed by the PYS octane and the PYS nonane on both SPC/E and TIP4P/2005
water was found to increase with increasing temperature. These results agree qualitatively
with the previous PYS nonane-SPC/E water nanodroplets results.[13] Contrary to planar
interface results, Qc for SPC/E water was generally larger than for TIP4P/2005 water. In
this work, the effect of line tension on the structure of the nanodroplet was not explored.
In the future, the effect of line tension as well as that of nanodroplet inhomogeneity will
be explored in the hope of explaining the unusual temperature dependent behavior of the
contact angle.

88
REFERENCES
[1] M. Kanakidou, J. Seinfeld, S. Pandis, I. Barnes, F. J. Dentener, M. C. Facchini, R. vanDingenen, B. Ervens, A. Nenes, C. Nielsen, e ta l . , ‘Organic aerosol and global climate modelling: a review,’ Atmos. Chem. Phys., 2005, 5, pp. 1053-1123.
[2] J. S. Rowlinson and B. Widom, M o lec u la r T heory o f C apillarity , Dover Publication, Mineola, NY, 2002.
[3] S. Ross and P. Becher, ‘The history of the spreading coefficient,’ J. Colloid Interface Sci., 1992,149(2), pp. 575-579.
[4] T. Takii and Y. H. Mori, ‘Spreading Coefficients of Aliphatic Hydrocarbons on Water,’ J. colloid Interface Sci., 1993,161(1), pp. 31-37.
[5] S.-Y. Akatsuka, H. Yoshigiwa, and Y. H. Mori, ‘Temperature Dependencies of Spreading Coefficients of Hydrocarbons on Water,’ J. Colloid Interface Sci., 1995, 172(2), pp. 335-340.
[6] K. Ragil, J. Meunier, D. Broseta, J. O. Indekeu, and D. Bonn, ‘Experimental Observation of Critical Wetting,’ Phys. Rev. Lett., 1996, 77(8), p. 1532.
[7] N. Shahidzadeh, D. Bonn, K. Ragil, D. Broseta, and J. Meunier, ‘Sequence of Two Wetting Transitions Induced by Tuning the Hamaker Constant,’ Phys. Rev. Lett., 1998, 80(18), p. 3992.
[8] E. Bertrand, H. Dobbs, D. Broseta, J. Indekeu, D. Bonn, and J. Meunier, ‘First-Order and Critical Wetting of Alkanes on Water,’ Phys. Rev. Lett., 2000, 85(6), p. 1282.
[9] S. Rafai, D. Bonn, E. Bertrand, J. Meunier, V. C. Weiss, and J. O. Indekeu, ‘Long- range critical wetting: Observation of a critical end point,’ Phys. Rev. Lett., 2004, 92(24), p. 245701.
[10] V. C. Weiss, ‘Theoretical description of the adsorption and the wetting behavior of alkanes on water,’ J. Chem. Phys., 2006,125(8), p. 084718.
[11] V. C. Weiss, E. Bertrand, S. Rafai, J. O. Indekeu, and D. Bonn, ‘Effective exponents in the long-range critical wetting of alkanes on aqueous substrates,’ Phys. Rev. E, 2007, 76(5), p. 051602.
[12] V. C. Weiss, ‘Calculation of the surface pressure and the contact energy in the adsorption of alkanes on water,’ Fluid Ph. Equilibria, 2007, 256(1-2), pp. 145-150.
[13] F. Hrahsheh and G. Wilemski, ‘Fluctuating structure of aqueous organic nanodroplets,’ in ‘AIP Conference Proceedings,’ volume 1527, AIP, 2013 pp. 63-66.
89
[14] D. Pohl and W. Goldburg, ‘Wetting Transition in Lutidine-Water Mixtures,’ Phys. Rev. Lett., 1982, 48(16), p. 1111.
[15] H. T. Davis, S ta tis tica l M ech a n ics o f P hases, In terfaces, a n d T hin F ilm s, Wiley-VCH, 1996.
[16] W. C. Swope, H. C. Andersen, P. H. Berens, and K. R. Wilson, ‘A computer simulation method for the calculation of equilibrium constants for the formation of physical clusters of molecules: Application to small water clusters,’ J. Chem. Phys., 1982, 76(1), pp. 637-649.
[17] S. Plimpton, ‘Fast parallel algorithms for short-range molecular dynamics,’ J. Comput. Phys., 1995, 117(1), pp. 1-19.
[18] W. Paul, D. Y. Yoon, and G. D. Smith, ‘An optimized united atom model for simulations of polymethylene melts,’ J. Chem. Phys., 1995, 103(4), pp. 1702-1709.
[19] N. Waheed, M. Lavine, and G. Rutledge, ‘Molecular simulation of crystal growth in n-eicosane,’ J. Chem. Phys., 2002,116(5), pp. 2301-2309.
[20] N. Waheed, M. J. Ko, and G. Rutledge, ‘Molecular simulation of crystal growth in long alkanes,’ Polymer, 2005, 46(20), pp. 8689-8702.
[21] P. Yi and G. C. Rutledge, ‘Molecular simulation of crystal nucleation in n-octane melts,’ J Chem. Phys., 2009,131(13), p. 134902.
[22] S. K. Nath, F. A. Escobedo, and J. J. dePablo, ‘On the simulation of vapor-liquid equilibria for alkanes,’ J. Chem. Phys., 1998, 108(23), pp. 9905-9911.
[23] S. K. Nath and R. Khare, ‘New forcefield parameters for branched hydrocarbons,’ J. Chem. Phys., 2001,115(23), pp. 10837-10844.
[24] M. G. Martin and J. I. Siepmann, ‘Transferable potentials for phase equilibria. 1. united-atom description of n-alkanes,’ J. Phys. Chem. B, 1998, 102(14), pp. 25692577.
[25] F. N. Mendoza, R. Lopez-Rendon, J. Lopez-Lemus, J. Cruz, and J. Alejandre, ‘Surface tension of hydrocarbon chains at the liquid-vapour interface,’ Mol. Phys., 2008, 106(8), pp. 1055-1059.
[26] E. Wang and F. A. Escobedo, ‘Mechanical properties of tetrapolyethylene and tetrapoly (ethylene oxide) diamond networks via molecular dynamics simulations,’ Macromolecules, 2016, 49(6), pp. 2375-2386.
[27] D. A. Hernandez and H. Dominguez, ‘Structural and thermodynamic behavior of alkane chains at the liquid/vapor interface,’ J. Chem. Phys., 2013,138(13), p. 134702.
[28] R. Sakamaki, A. K. Sum, T. Narumi, and K. Yasuoka, ‘Molecular dynamics simulations of vapor/liquid coexistence using the nonpolarizable water models,’ J. Chem. Phys., 2011, 134(12), p. 124708.
90
[29] V. Molinero and E. B. Moore, ‘Water Modeled As an Intermediate Element between Carbon and Silicon,’ J. Phys. Chem. B, 2008, 113(13), pp. 4008-4016.
[30] K. R. Hadley and C. McCabe, ‘Coarse-grained molecular models of water: a review,’ Mol. simul., 2012, 38(8-9), pp. 671-681.
[31] Y. Nagata, T. Ohto, M. Bonn, and T. D. Kuhne, ‘Surface tension of a b in itio liquid water at the water-air interface,’ J. Chem. Phys, 2016, 144(20), p. 204705.
[32] M. J. Gillan, D. Alfe, and A. Michaelides, ‘Perspective: How good is DFT for water?’ J. Chem. Phys, 2016,144(13), p. 130901.
[33] M. Galib, T. T. Duignan, Y. Misteli, M. D. Baer, G. K. Schenter, J. Hutter, and C. J. Mundy, ‘Mass density fluctuations in quantum and classical descriptions of liquid water,’ J. Chem. Phys, 2017, 146(24), p. 244501.
[34] T. Ohto, M. Dodia, S. Imoto, and Y. Nagata, ‘Structure and Dynamics of Water at the Water-Air Interface Using First-Principles Molecular Dynamics Simulations within Generalized Gradient Approximation,’ J. Chem. Theory Comput., 2019, 15(1), pp. 595-602.
[35] J. L. Abascal and C. Vega, ‘A general purpose model for the condensed phases of water: TIP4P/2005,’ J. Chem. Phys., 2005,123(23), p. 234505.
[36] H. Berendsen, J. Grigera, and T. Straatsma, ‘The Missing Term in Effective Pair Potentials,’ J. Phys. Chem., 1987, 91(24), pp. 6269-6271.
[37] P. Yi and G. C. Rutledge, ‘Molecular simulation of crystal nucleation in n-octane melts,’ J. Chem. Phys., 2009,131(13), p. 134902.
[38] V. P. Modak, B. E. Wyslouzil, and S. J. Singer, ‘On the determination of the crystal- vapor surface free energy, and why a Gaussian expression can be accurate for a system far from Gaussian,’ J. Chem. Phys., 2016, 145(5), p. 054710.
[39] Y. Qiu and V. Molinero, ‘Strength of Alkane-Fluid Attraction Determines the Interfacial Orientation of Liquid Alkanes and Their Crystallization through Heterogeneous or Homogeneous Mechanisms,’ Crystals, 2017, 7(3), p. 86.
[40] A. J. Bourque and G. C. Rutledge, ‘Kinetic Model for Layer-by-Layer Crystal Growth in Chain Molecules,’ Macromolecules, 2016, 49(10), pp. 3956-3964.
[41] A. Bourque, C. R. Locker, and G. C. Rutledge, ‘Molecular Dynamics Simulation of Surface Nucleation during Growth of an Alkane Crystal,’ Macromolecules, 2016, 49(9), pp. 3619-3629.
[42] M. Anwar, F. Turci, and T. Schilling, ‘Crystallization mechanism in melts of short n-alkane chains,’ J. Chem. Phys., 2013, 139(21), p. 214904.
[43] P. Yi and G. C. Rutledge, ‘Molecular simulation of bundle-like crystal nucleation from n-eicosane melts,’ J. Chem. Phys., 2011,135(2), p. 024903.

91
[44] A. J. Bourque, C. R. Locker, and G. C. Rutledge, ‘Heterogeneous Nucleation of an n-alkane on Tetrahedrally Coordinated Crystals,’ J. Phys. Chem. B, 2017, 121(4), pp. 904-911.
[45] G. Wilemski, A. Obeidat, and F. Hrahsheh, ‘Form factors for Russian doll droplet models,’ in ‘AIP Conference Proceedings,’ volume 1527, AIP, 2013 pp. 144-147.
[46] A. Obeidat, F. Hrahsheh, and G. Wilemski, ‘Scattering Form Factors for Russian Doll Aerosol Droplet Models,’ J. Phys. Chem. B, 2015,119(29), pp. 9304-9311.
[47] V. P. Modak, H. Pathak, M. Thayer, S. J. Singer, and B. E. Wyslouzil, ‘Experimental evidence for surface freezing in supercooled n-alkane nanodroplets,’ Phys. Chem. Chem. Phys., 2013,15(18), pp. 6783-6795.
[48] Y. Qiu and V. Molinero, ‘Morphology of liquid-liquid phase separated aerosols,’ J. Am. Chem. Soc, 2015,137(33), pp. 10642-10651.
[49] S. M. Malek, P. H. Poole, and I. Saika-Voivod, ‘Thermodynamic and structural anomalies of water nanodroplets,’ Nature communications, 2018, 9(1), pp. 1-9.
92
VITA
Pauf Neupane was born in Gorkha, Nepal. He received his Bachelor’s degree in Sci
ence with a Physics major from Amrit Science Campus, Tribhuvan University, Kathmandu,
Nepal, in 2007. Then he joined the Central Department of Physics (CDP), Tribhuvan Uni
versity at Kritipur, Nepal, for his further studies and obtained a Master’s degree of Science
in 2011.
In 2012, he moved to Rolla, MO to start doctoral studies at the Physics department
of Missouri University of Science and Technology. He joined the group of Dr. Gerald
Wilemski in 2015. Under the supervision of Dr. Wilemski, he performed molecular
dynamics simulations of pure liquids as well as immiscible liquid systems to explore their
thermophysical properties and their behavior at the interfaces. In December 2020, he
received the Ph. D. degree in Physics from Missouri University of Science and Technology.
Pauf received competitive travel grants from the American Physical Society (APS)
and the Missouri University of Science and Technology to present his research in scientific
meetings. He has been a member of the American Physical Society since 2013.