
Modelling of semi-solid processing using a modified temperature-dependent power-law model
22
INSTITUTE OF PHYSICS PUBLISHING MODELLING AND SIMULATION IN MATERIALS SCIENCE AND ENGINEERING Modelling Simul. Mater. Sci. Eng. 11 (2003) 553–574 PII: S0965-0393(03)63246-8 Modelling of semi-solid processing using a modified temperature-dependent power-law model L Org´ eas 1,3,4 , J-P Gabathuler 2 , Th Imwinkelried 2 , Ch Paradies 1,5 and M Rappaz 1 1 Laboratoire de M´ etallurgie Physique, Ecole Polytechnique F´ ed´ erale de Lausanne MX-G, CH-1015 Lausanne, Switzerland 2 Alusuisse T & M Ltd, Technology Center, Badische Bahnhofstrasse 16, CH-8212 Neuhausen-am-Rheinfall, Switzerland E-mail: [email protected] Received 15 January 2003, in final form 4 May 2003 Published 13 June 2003 Online at stacks.iop.org/MSMSE/11/553 Abstract A fairly simple one-phase rheological model has been implemented into a commercial fluid flow finite element software to simulate mould filling during the semi-solid processing (thixoforming) of aluminium alloys. This model is of purely viscous nature. Its temperature-dependent viscosity is a power-law function of the shear rate with a shear rate cut-off. The constitutive parameters of this model were determined for a rheocast A356 alloy. For that purpose, simulation results were compared with instrumented thixoforming experiments performed on a production-scale injection machine. The selected configuration was that of a transient flow near a bifurcation, i.e. obstruction of an established Poiseuille-type flow by a shaft placed at the centre of a tube. Using these parameters, the model was then further validated by comparing the simulation of an axisymmetric reservoir mould filling with the shape of solidified shells obtained after interrupted injection experiments. 1. Introduction In order to produce high security and near net-shape metal components with reduced porosity and shrinkage, processing of metals in the semi-solid state is viewed as an attractive and promising manufacturing method. Among several advantages, the increased viscosity of semi- solid alloys makes the flow much more laminar during the injection stage, thus reducing the entrapment of oxide skins. However, the complex shear-thinning behaviour of metallic alloys 3 Author to whom correspondence should be addressed. 4 Present address: Laboratoire Sols—Solides—Structures, CNRS—Institut National Polytechnique de Grenoble— Universit´ e Joseph Fourier, BP. 53, 38 041 Grenoble Cedex 9, France. 5 Present address: Ostrolenk, Faber, Gerb & Soffen LLP, 1180 av. of the Americas, NY 10036-8403, USA. 0965-0393/03/040553+22$30.00 © 2003 IOP Publishing Ltd Printed in the UK 553
Transcript of Modelling of semi-solid processing using a modified temperature-dependent power-law model
INSTITUTE OF PHYSICS PUBLISHING MODELLING AND SIMULATION IN MATERIALS SCIENCE AND ENGINEERING
Modelling Simul. Mater. Sci. Eng. 11 (2003) 553–574 PII: S0965-0393(03)63246-8
Modelling of semi-solid processing using a modifiedtemperature-dependent power-law model
L Orgeas1,3,4, J-P Gabathuler2, Th Imwinkelried2, Ch Paradies1,5 andM Rappaz1
1 Laboratoire de Metallurgie Physique, Ecole Polytechnique Federale de Lausanne MX-G,CH-1015 Lausanne, Switzerland2 Alusuisse T & M Ltd, Technology Center, Badische Bahnhofstrasse 16,CH-8212 Neuhausen-am-Rheinfall, Switzerland
E-mail: [email protected]
Received 15 January 2003, in final form 4 May 2003Published 13 June 2003Online at stacks.iop.org/MSMSE/11/553
AbstractA fairly simple one-phase rheological model has been implemented into acommercial fluid flow finite element software to simulate mould filling duringthe semi-solid processing (thixoforming) of aluminium alloys. This model isof purely viscous nature. Its temperature-dependent viscosity is a power-lawfunction of the shear rate with a shear rate cut-off. The constitutive parametersof this model were determined for a rheocast A356 alloy. For that purpose,simulation results were compared with instrumented thixoforming experimentsperformed on a production-scale injection machine. The selected configurationwas that of a transient flow near a bifurcation, i.e. obstruction of an establishedPoiseuille-type flow by a shaft placed at the centre of a tube. Using theseparameters, the model was then further validated by comparing the simulationof an axisymmetric reservoir mould filling with the shape of solidified shellsobtained after interrupted injection experiments.
1. Introduction
In order to produce high security and near net-shape metal components with reduced porosityand shrinkage, processing of metals in the semi-solid state is viewed as an attractive andpromising manufacturing method. Among several advantages, the increased viscosity of semi-solid alloys makes the flow much more laminar during the injection stage, thus reducing theentrapment of oxide skins. However, the complex shear-thinning behaviour of metallic alloys
3 Author to whom correspondence should be addressed.4 Present address: Laboratoire Sols—Solides—Structures, CNRS—Institut National Polytechnique de Grenoble—Universite Joseph Fourier, BP. 53, 38 041 Grenoble Cedex 9, France.5 Present address: Ostrolenk, Faber, Gerb & Soffen LLP, 1180 av. of the Americas, NY 10036-8403, USA.
0965-0393/03/040553+22$30.00 © 2003 IOP Publishing Ltd Printed in the UK 553

554 L Orgeas et al
is also associated with flow instabilities and segregation during the non-uniform loading of aninjection process such as thixoforming. Therefore, the optimization of semi-solid metal (SSM)processes requires many trials whenever a new design has to be produced. Accurate simulationof thixoforming could possibly reduce the number of casting trials required prior to determiningthe optimal process parameters for a given component. However, numerical simulation requiresa fairly accurate knowledge of both the boundary conditions and SSM rheological behaviour.As for many casting or forging processes, mechanical and thermal boundary conditions betweenthe mould and the material are extremely complex and interdependent during thixoforming[1]. On the other hand, the time-, strain rate- and temperature-dependent rheological behaviour[2–4] of SSM has been rarely measured under the very high strain-rates encountered inindustrial conditions. Segregation between the solid and liquid phases also encountered inindustrial conditions [5–7], induced either during the non-uniform mechanical loading of thebillet or near the highly sheared periphery zone of a SSM flow, is a further complication in aconsistent modelling approach.
In this work, the modelling of the thixoforming process of a rheocast aluminium A356alloy has been attempted under conditions close to industrial production. In a first step, thebifurcation of a Poiseuille-type flow near a shaft inserted inside a tube is investigated duringinstrumented thixocasting experiments (section 2). A fairly simple phenomenological modelsuitable to reproduce the rheological behaviour of the SSM under such conditions is proposedand implemented in the commercial finite element software ProCASTTM. This model, whichis based on a modified one-phase power-law model with a shear cut-off (PLCO), is describedin section 3. By comparing the simulation results with the shaft experiments, the parametersof the PLCO model are determined (see section 4). The model is then further validated bycomparing the calculated flow during filling of a reservoir with the solidified shells obtainedafter interrupted injection experiments (section 5). Finally, this modelling methodology isdiscussed and analysed in section 6.
2. Experiments
The alloy used for the experiments was an Al—7 wtpct Si—0.3 wtpct Mg alloy (A356)produced semi-continuously by rheocasting by Alusuisse [8]. Its initial microstructure wasmade of fairly homogeneous fine spheroidal Al grains surrounded by a fine eutectic phase.The 75 mm diameter billets of this alloy were then cut and heated up to a given initial volumefraction of solid fs,ini by inductive heating. The SSM billet was then inserted into the shot-sleeve of a Buhler industrial shot-controlled pressure die casting machine (inner diameter ofthe shot-sleeve φram: 78 mm). Two series of experiments, which are described in the followingsubsections, were carried out for the determination of the rheological behaviour of the A356alloy in the semi-solid state [1].
2.1. Axisymmetric Poiseuille-type experiments
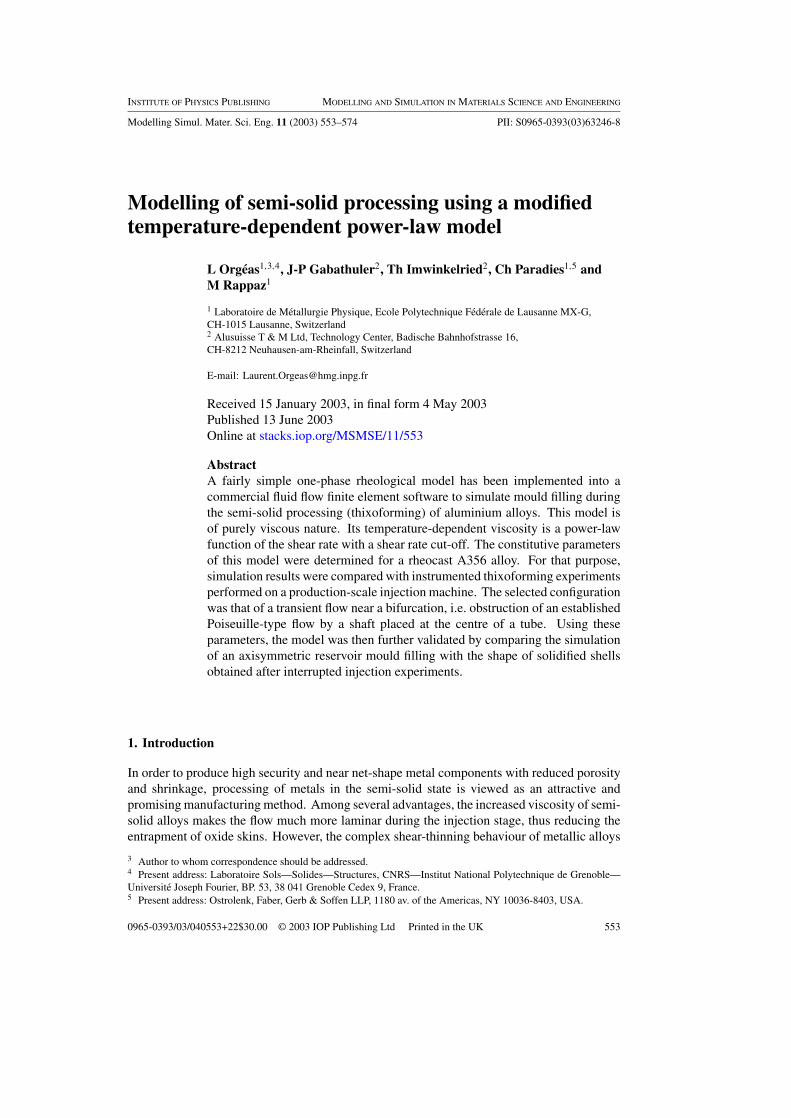
In these first tests, the axisymmetric horizontal mould was simply made of a 350 mm long tubeof constant diameter, φtube, connected to an axisymmetric reservoir at the end (see figure 1(a)).During the experiments, the pressure and temperature were measured at different positions bysensors and thermocouples. After filling the entire tube, the piston was abruptly stopped in aposition such that the end reservoir was only partially filled. The shape of the material thathad solidified at the surface of the reservoir material was then analysed. The main parameterswhich were varied in these experiments were the initial volume fraction of solid fs,ini (≈0.73,0.58 and 0.52), the diameter of the long tube φtube (=10, 20, 25, and 40 mm), and the velocity
Modelling of semi-solid processing 555
ram = 78 mm
206 mm 350 mm
Piston/RAM Reservoir
Shot sleeve
zVram
r
Tube Shaft
10 mmp2
Vram
r
z
T3
φram = 78 mm
206 mm 350 mm(a)
(b) Piston/RAM Reservoir
φ
tube
Shot sleeve
zVram
r
Tube Shaft
10 mmp2
Vram
r
z
T3
φshaft
Figure 1. Experimental set-up used for the Poiseuille-type flow (a) and for the bifurcation of aPoiseuille-type flow near the parabolic tip of an axisymmetric shaft (‘shaft experiment’) (b).
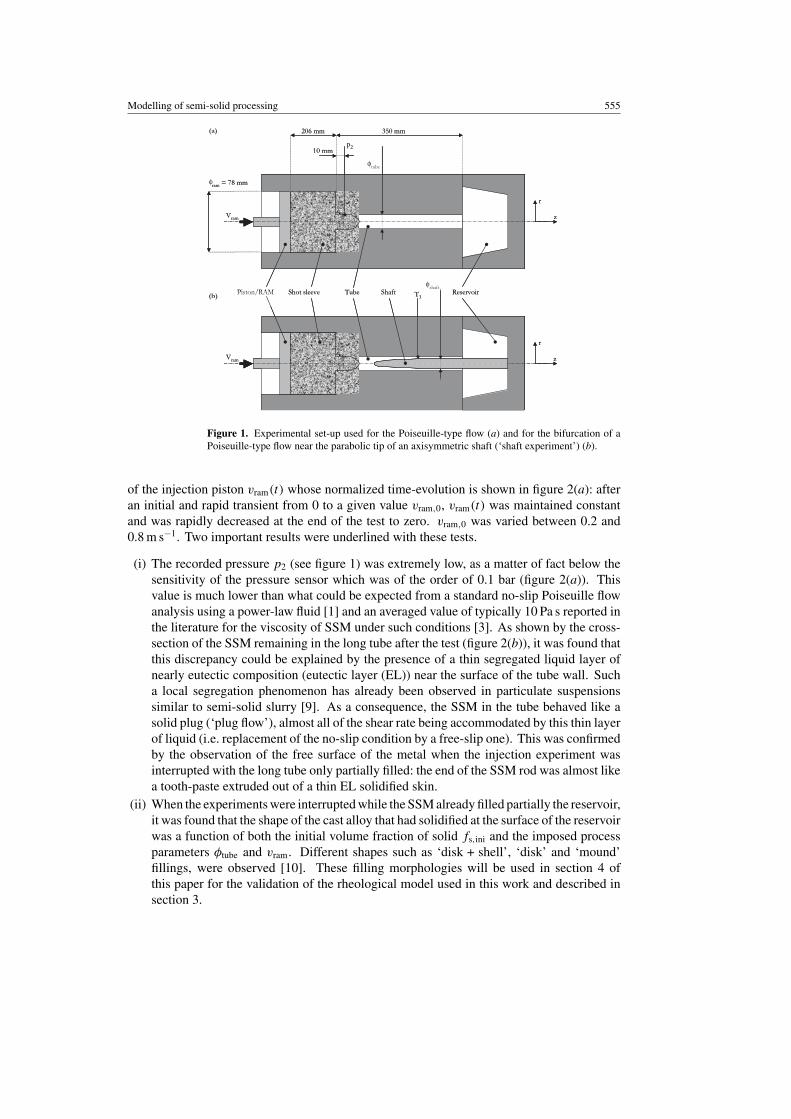
of the injection piston vram(t) whose normalized time-evolution is shown in figure 2(a): afteran initial and rapid transient from 0 to a given value vram,0, vram(t) was maintained constantand was rapidly decreased at the end of the test to zero. vram,0 was varied between 0.2 and0.8 m s−1. Two important results were underlined with these tests.
(i) The recorded pressure p2 (see figure 1) was extremely low, as a matter of fact below thesensitivity of the pressure sensor which was of the order of 0.1 bar (figure 2(a)). Thisvalue is much lower than what could be expected from a standard no-slip Poiseuille flowanalysis using a power-law fluid [1] and an averaged value of typically 10 Pa s reported inthe literature for the viscosity of SSM under such conditions [3]. As shown by the cross-section of the SSM remaining in the long tube after the test (figure 2(b)), it was found thatthis discrepancy could be explained by the presence of a thin segregated liquid layer ofnearly eutectic composition (eutectic layer (EL)) near the surface of the tube wall. Sucha local segregation phenomenon has already been observed in particulate suspensionssimilar to semi-solid slurry [9]. As a consequence, the SSM in the tube behaved like asolid plug (‘plug flow’), almost all of the shear rate being accommodated by this thin layerof liquid (i.e. replacement of the no-slip condition by a free-slip one). This was confirmedby the observation of the free surface of the metal when the injection experiment wasinterrupted with the long tube only partially filled: the end of the SSM rod was almost likea tooth-paste extruded out of a thin EL solidified skin.
(ii) When the experiments were interrupted while the SSM already filled partially the reservoir,it was found that the shape of the cast alloy that had solidified at the surface of the reservoirwas a function of both the initial volume fraction of solid fs,ini and the imposed processparameters φtube and vram. Different shapes such as ‘disk + shell’, ‘disk’ and ‘mound’fillings, were observed [10]. These filling morphologies will be used in section 4 ofthis paper for the validation of the rheological model used in this work and described insection 3.
556 L Orgeas et al
00.1
0.20.3
0.40.5
0.60.7
0.80.9
11.1
-0.5 -0.3 -0.1 0.1 0.3 0.5
p2 [bar]
vram(t)/vram,0
t [s]
00.1
0.20.3
0.40.5
0.60.7
0.80.9
11.1
-0.5 -0.3 -0.1 0.1 0.3 0.5
p2 [bar]
vram(t)/vram,0
t [s]
(b)
(a)
Figure 2. (a) Time-evolutions of the pressure p2 and of the normalized piston velocityvram(t)/vram,0 in the Poiseuille-type experiment (figure 1(a)) performed with fs,ini = 0.73,φtube = 25 mm and vram,0 = 0.8 m s−1. (b) Corresponding cross-section of the SSM cylindersolidified in the tube showing the segregation of a thin eutectic liquid layer (EL) near the surfaceof the tube.
2.2. Bifurcation of a Poiseuille-type flow near a shaft (‘shaft experiment’)
The experimental set-up shown in figure 1(a) was modified in order to study the bifurcationof a Poiseuille-type flow in the long tube near an obstacle. For that purpose, a parabolic-tipshaft was fixed to the back of the reservoir so that it entered the tube in an axisymmetricconfiguration, as shown in figure 1(b). The shaft, whose diameter φshaft was 18 mm, wasinserted in the 25 mm diameter tube over a length of approximately 150 mm.
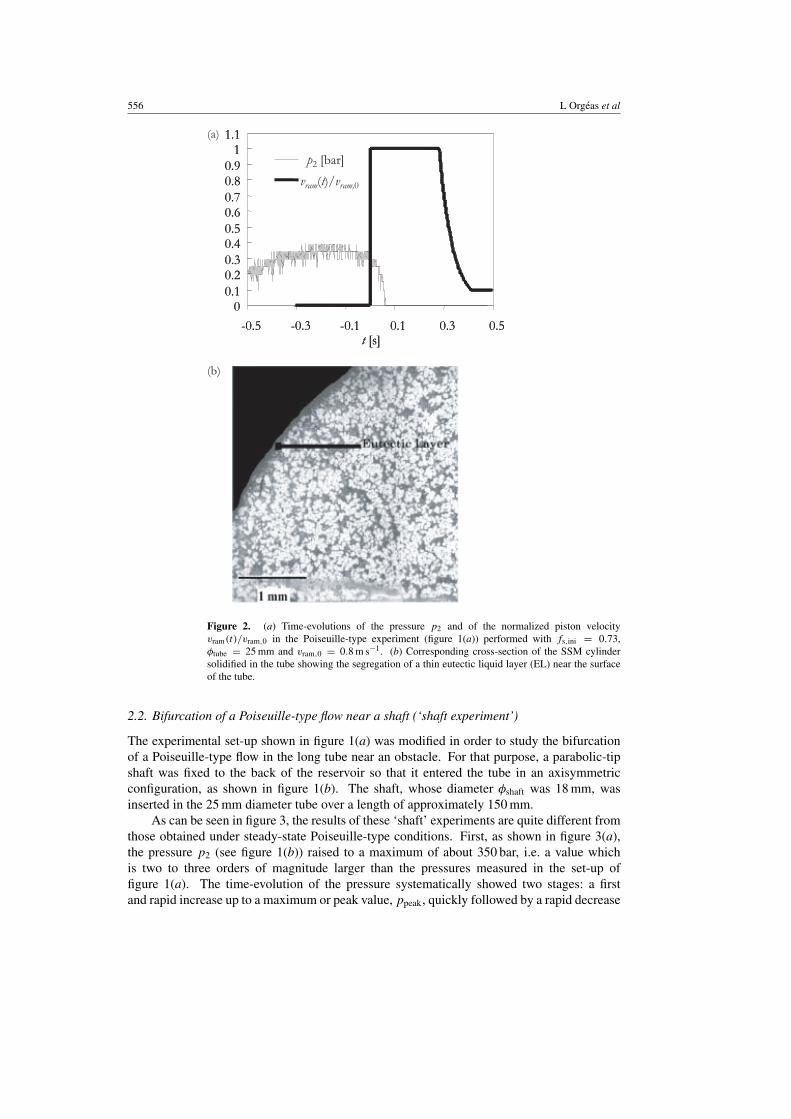
As can be seen in figure 3, the results of these ‘shaft’ experiments are quite different fromthose obtained under steady-state Poiseuille-type conditions. First, as shown in figure 3(a),the pressure p2 (see figure 1(b)) raised to a maximum of about 350 bar, i.e. a value whichis two to three orders of magnitude larger than the pressures measured in the set-up offigure 1(a). The time-evolution of the pressure systematically showed two stages: a firstand rapid increase up to a maximum or peak value, ppeak, quickly followed by a rapid decrease

Modelling of semi-solid processing 557
(a) (b)
0
500
t [s]
p steady
p peak
p 2[b
ar]
0
0.20 0 1
500
t [s]
p steady
p peak
p 2[b
ar]
0
550psteady
ppeak
p 2[b
ar]
vram,0 [m s-1]
0
550psteady
ppeak
p 2[b
ar]
vram,0 [m s-1]
Figure 3. Time-evolution of the pressure, p2, measured during the shaft experiment performedat vram,0 = 0.8 m s−1 (a); maximum pressure, ppeak, and pressure measured in the nearly steady-state regime, psteady, as a function of the piston ram velocity, vram,0 (b). Other conditions are:fs,ini = 0.58, φtube = 25 mm and φshaft = 18 mm.
to a ‘steady-state’ pressure, psteady (the final pressure drop near 0.2 s in figure 3(a) correspondsto the end of the injection process). As illustrated in figure 3(b), both the peak and steady-state pressures are decreasing functions of the velocity of the piston vram,0. For each ofthe three velocities investigated here (0.2, 0.4 and 0.8 m s−1), two sets of experiments wereperformed: the scattering of the points (as much as 50% difference for the same experimentalconditions) illustrates the uncertainty of these in situ tests. Nevertheless, the decrease of p2
with an increasing vram,0 is surprising, even for a shear-thinning material: when the shear rate(and thus piston velocity) is increased, the viscosity decreases but the stress level (and thusmeasured pressure) should increase. It will be shown that the opposite trend seen in figure 3(b)is due to thermal effects which affect the volume fraction of solid of the SSM and thus itsviscosity, this effect dominating in this situation is associated with a shear rate variation.
3. Theoretical and numerical background
Modelling and simulation of SSM processing have been achieved with essentially two differentapproaches: two-phase [11–17] and one-phase approaches [18–22]. In the first category, theSSM is considered as a saturated two-phase medium, i.e. made of the liquid and solid phases.Each phase has its own behaviour, which can be influenced by the presence of the other phasevia interfacial contributions. The conservation equations can be written within a mixturetheory background [23] and the solid phase (solid skeleton) can be modelled as a purelyviscous and compressive medium [11, 13]. Momentum exchanges between the solid and theNewtonian liquid are handled by a Darcy-type term appearing in momentum equations [24].These models are very attractive because they are able to predict phase separation arisingduring thixoforming [12, 16, 17]. However, the determination of the associated rheologicalconstitutive parameters they require is not straightforward: intensive experimental studiesachieved on specific rheometers are often needed (e.g. drained tests for the study of the rheologyof the solid skeleton, [11, 13]). Moreover, two-phase models usually require the simultaneouscalculation of a solid fraction field, a pressure field, two velocity fields (for the liquid and thesolid), and a temperature field (in most cases isothermal simulation is performed), so that the
558 L Orgeas et al
simulation needs very high computation time. For these reasons, such models have never beenused in three-dimensional industrial simulation software yet, to the best of our knowledge.
In the second approach, the SSM is supposed to behave like a homogeneous mediumin which the solid and liquid phases move at the same velocity. Although such a strongassumption limits the validity domain of one-phase models and does not allow to accountfor phase separation, some of these one-phase models can be sophisticated. Using internalvariables [25], they can simulate thixotropic effects induced by structural evolutions of thesolid phase such as agglomeration and disagglomeration phenomena.
The PLCO model that has been developed and used in this work belongs to this secondcategory. Although simpler than the model of Kumar et al [18], it has the advantage that it canbe applied to a wider solidification interval, i.e. from fs = 0 to 1, at least theoretically. Themajor assumption of the PLCO model are that the material is seen as a purely viscous isotropicand incompressible fluid.
In order to perform the mould filling simulation of SSM industrial parts, this model hasbeen implemented in the commercial finite element code ProCASTTM. Within the frameworkof a Eulerian description, this software is capable of solving simultaneously three-dimensionaltransient thermal and fluid flow problems with free surfaces. The set of partial differentialequations to be solved is briefly summarized below:
• Mass balance:
∂
∂tρ + div(ρv) = 0 (1)
where ρ and v are the volumetric mass and the velocity of the fluid, respectively.• Momentum balance:
∂
∂t(ρv) + div(ρv ⊗ v) = −grad p + div σv + ρg (2)
where g is the gravitation vector, p the fluid pressure, and σv the viscous stress tensor.• Energy balance, written as an enthalpy formulation:
∂
∂t(ρh) + div(ρhv) = div(κ grad T ) + Qmech (3)
In this equation, Qmech is a volumetric heat source that accounts for mechanically induceddissipation effects, T is the temperature, κ is the thermal conductivity of the medium andh its specific enthalpy. Please note that the entire enthalpy is transported with the velocityof the fluid, i.e. that the solid and liquid phases composing the SSM have the same velocity.In order to account for solidification, ρh is written as follows:
ρh =∫ T
0ρcp(θ) dθ + ρL(1 − fs) (4)
where cp and L are the specific heat and latent heat of fusion, respectively, and fs is thevolume fraction of solid of the SSM.
• Free surface modelling, achieved with a scalar variable, Φ, describing the local volumefraction of the SSM fluid (i.e. Φ = 0
1 if the ‘point’ is empty/full of SSM). Previous balanceequations are averaged with this variable, which is advected according to:
∂
∂tΦ + v · grad Φ = 0 (5)
Modelling of semi-solid processing 559
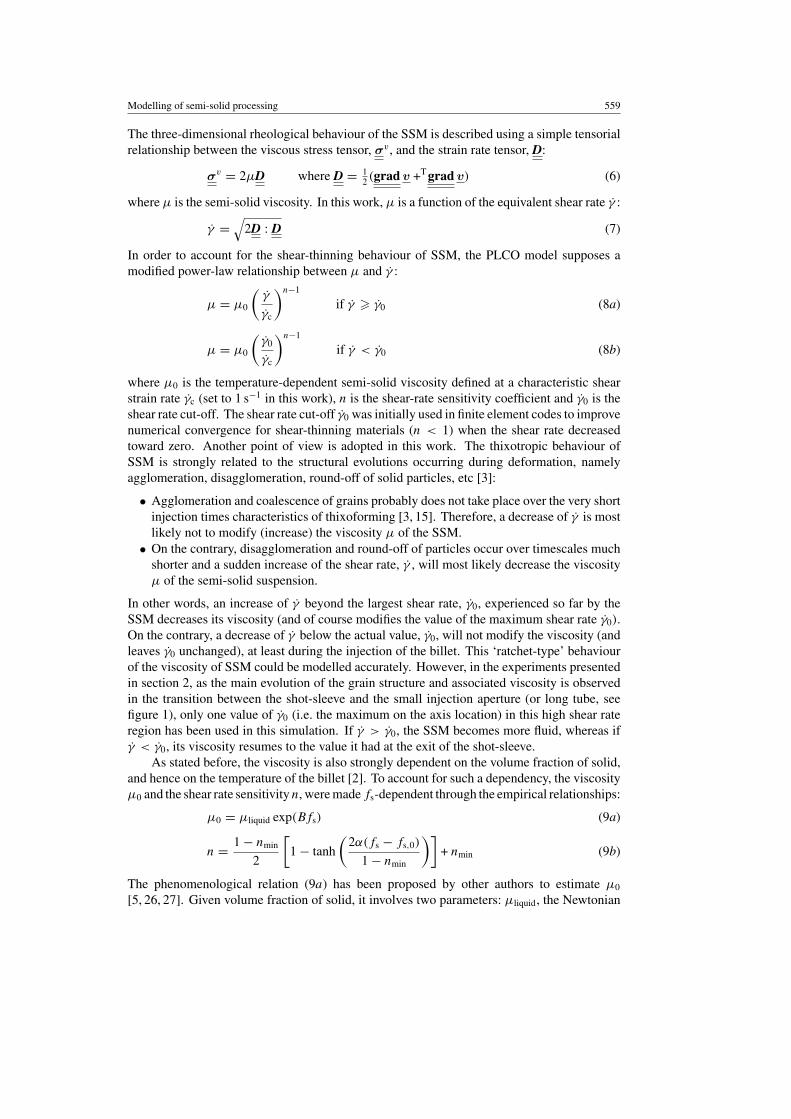
The three-dimensional rheological behaviour of the SSM is described using a simple tensorialrelationship between the viscous stress tensor, σv , and the strain rate tensor, D:
σv = 2µD where D = 12 (grad v +T grad v) (6)
where µ is the semi-solid viscosity. In this work, µ is a function of the equivalent shear rate γ :
γ =√
2D : D (7)
In order to account for the shear-thinning behaviour of SSM, the PLCO model supposes amodified power-law relationship between µ and γ :
µ = µ0
(γ
γc
)n−1
if γ � γ0 (8a)
µ = µ0
(γ0
γc
)n−1
if γ < γ0 (8b)
where µ0 is the temperature-dependent semi-solid viscosity defined at a characteristic shearstrain rate γc (set to 1 s−1 in this work), n is the shear-rate sensitivity coefficient and γ0 is theshear rate cut-off. The shear rate cut-off γ0 was initially used in finite element codes to improvenumerical convergence for shear-thinning materials (n < 1) when the shear rate decreasedtoward zero. Another point of view is adopted in this work. The thixotropic behaviour ofSSM is strongly related to the structural evolutions occurring during deformation, namelyagglomeration, disagglomeration, round-off of solid particles, etc [3]:
• Agglomeration and coalescence of grains probably does not take place over the very shortinjection times characteristics of thixoforming [3, 15]. Therefore, a decrease of γ is mostlikely not to modify (increase) the viscosity µ of the SSM.
• On the contrary, disagglomeration and round-off of particles occur over timescales muchshorter and a sudden increase of the shear rate, γ , will most likely decrease the viscosityµ of the semi-solid suspension.
In other words, an increase of γ beyond the largest shear rate, γ0, experienced so far by theSSM decreases its viscosity (and of course modifies the value of the maximum shear rate γ0).On the contrary, a decrease of γ below the actual value, γ0, will not modify the viscosity (andleaves γ0 unchanged), at least during the injection of the billet. This ‘ratchet-type’ behaviourof the viscosity of SSM could be modelled accurately. However, in the experiments presentedin section 2, as the main evolution of the grain structure and associated viscosity is observedin the transition between the shot-sleeve and the small injection aperture (or long tube, seefigure 1), only one value of γ0 (i.e. the maximum on the axis location) in this high shear rateregion has been used in this simulation. If γ > γ0, the SSM becomes more fluid, whereas ifγ < γ0, its viscosity resumes to the value it had at the exit of the shot-sleeve.
As stated before, the viscosity is also strongly dependent on the volume fraction of solid,and hence on the temperature of the billet [2]. To account for such a dependency, the viscosityµ0 and the shear rate sensitivity n, were made fs-dependent through the empirical relationships:
µ0 = µliquid exp(Bfs) (9a)
n = 1 − nmin
2
[1 − tanh
(2α(fs − fs,0)
1 − nmin
)]+ nmin (9b)
The phenomenological relation (9a) has been proposed by other authors to estimate µ0
[5, 26, 27]. Given volume fraction of solid, it involves two parameters: µliquid, the Newtonian
560 L Orgeas et al
viscosity of the pure liquid phase, and B, a parameter that mainly depends on the microstructureof the SSM. Equation (9b) is proposed in this work on the basis of two asymptotic limits. Athigh volume fractions of solid, the SSM shear rate sensitivity n should tend to the value nmin
characteristics of the creep behaviour of the solid phase (∼0.2–0.25), whereas, at low fs, theSSM behaviour should be that of a Newtonian liquid (i.e. n = 1). The transition between thesetwo well-known deformation modes is achieved at a ‘critical’ value of the solid fraction, fs,0,with a ‘slope’ dn/dfs equal to α.
Finally, the PLCO model being a purely viscous fluid model, the volumetric heat sourceterm Qmech becomes:
Qmech = σv : D = 2µD : D (10)
In ProCASTTM, the subsets of equations {(1), (2), (6), (7), (8), (9)}, {(3), (4), (10)} and {(5)},whose nodal unknowns are, respectively, (v, p), (h, T ) and (Φ), are solved successively [28].A streamline upwinding (SU) method is used to compute all the advection terms appearingin these equations. A Newton–Raphson scheme is employed to solve non-linear subsets ofequations {(1), (2), (6), (7), (8), (9)} and {(3), (4), (10)}. A segmented solution algorithm,similar to the SIMPLE algorithm, allows the calculation of v and p. At last, the free surfacemotion algorithm used to solve (5) is a continuum advection scheme [28].
In summary, the PLCO model requires the knowledge of few constitutive parameters: theshear rate cut-off γ0, which is mainly dependent on the geometry of the considered problem,the viscosity of the liquid phase µliquid, and the parameter B, both used to define the viscosityµ0 as a function of fs (cf equation (9a)), and the three parameters nmin, α and fs,0, that givethe evolution of the shear rate sensitivity n (cf equation (9b)). The following section gives themethodology adopted to determine these parameters.
4. Modelling
In order to reproduce the behaviour of the rheocast A356 alloy during the injection of SSM,different steps were performed. First, assumptions were made on the material properties.Second, two rheological parameters were determined using both the simulation and theexperiments presented in section 2. Unless otherwise specified, the common numericalassumptions for the results presented below were: no gravity effects, axisymmetric thermo-mechanical calculations, rheological behaviour of the material given by the temperature-dependent PLCO model and free-slip boundary conditions between the mould and the SSM(see figure 2(b)).
4.1. Material properties
The values of the material parameters given in this section correspond to those of theAl—7 wtpct Si—0.3 wtpct Mg (A356) alloy used in the experiments. The evolution of thevolume fraction of solid fs as a function of the temperature was determined by thermal analysisand is illustrated in figure 4(a). In this figure, the three initial solid fractions fs,ini, that wereused in the experiments are also indicated by small dots. The other thermo physical propertiesof this alloy are given in table 1. Using the specific heat cp, the specific latent heat l, and thefs evolution plotted in figure 4(a), the volumetric enthalpy ρh was calculated according toequation (4).
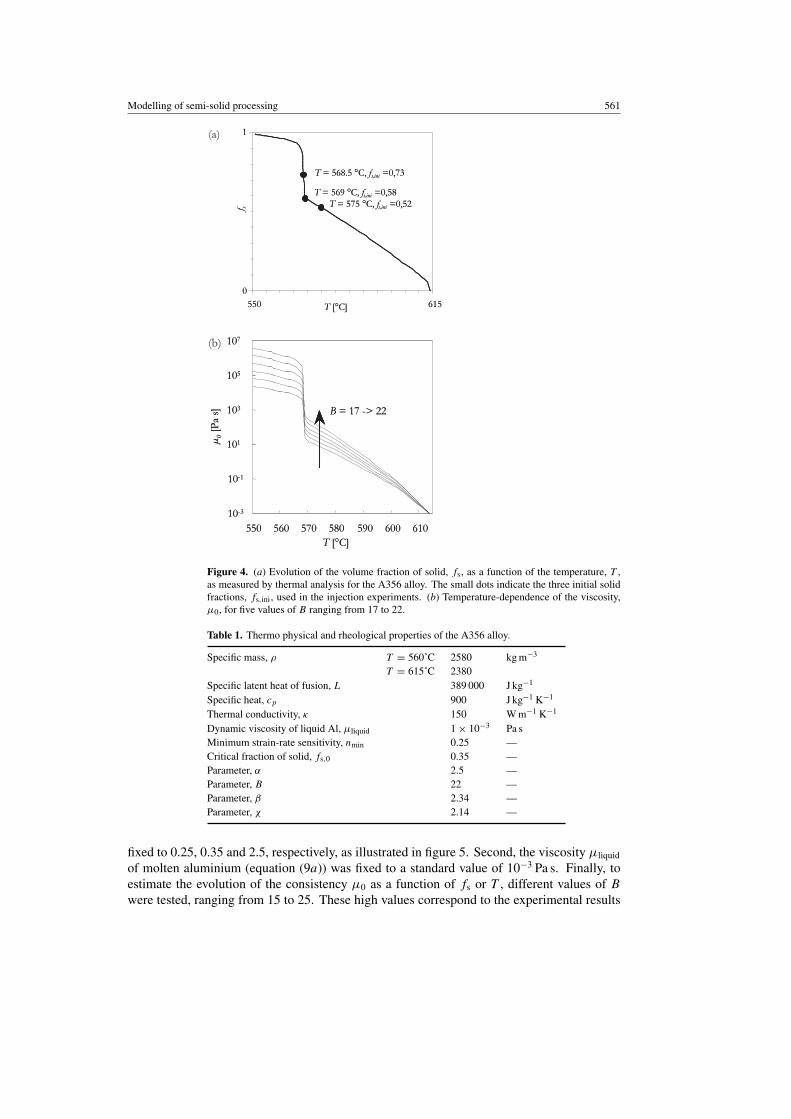
To run the simulation some assumptions were made on the constitutive parameters of thePLCO model. First, the shear-rate sensitivity n was supposed to obey to equation (9b). Basedon the experimental results obtained for the same alloy by Nguyen [29], nmin, fs,0 and α were
Modelling of semi-solid processing 561
(a)
(b)
0
1
550 615T [°C]
T = 568.5 °C, fs,ini =0,73
T = 569 °C, fs,ini =0,58T = 575 °C, fs,ini =0,52f s
0
1
550 615T [°C]
T = 568.5 °C, fs,ini =0,73
T = 569 °C, fs,ini =0,58T = 575 °C, fs,ini =0,52f s
10-3
10-1
101
103
105
107
550 560 570 580 590 600 610
T [°C]
B = 17 -> 22
µ0
[Pa
s]
10-3
10-1
101
103
105
107
550 560 570 580 590 600 610
T [°C]
B = 17 -> 22
µ0
[Pa
s]
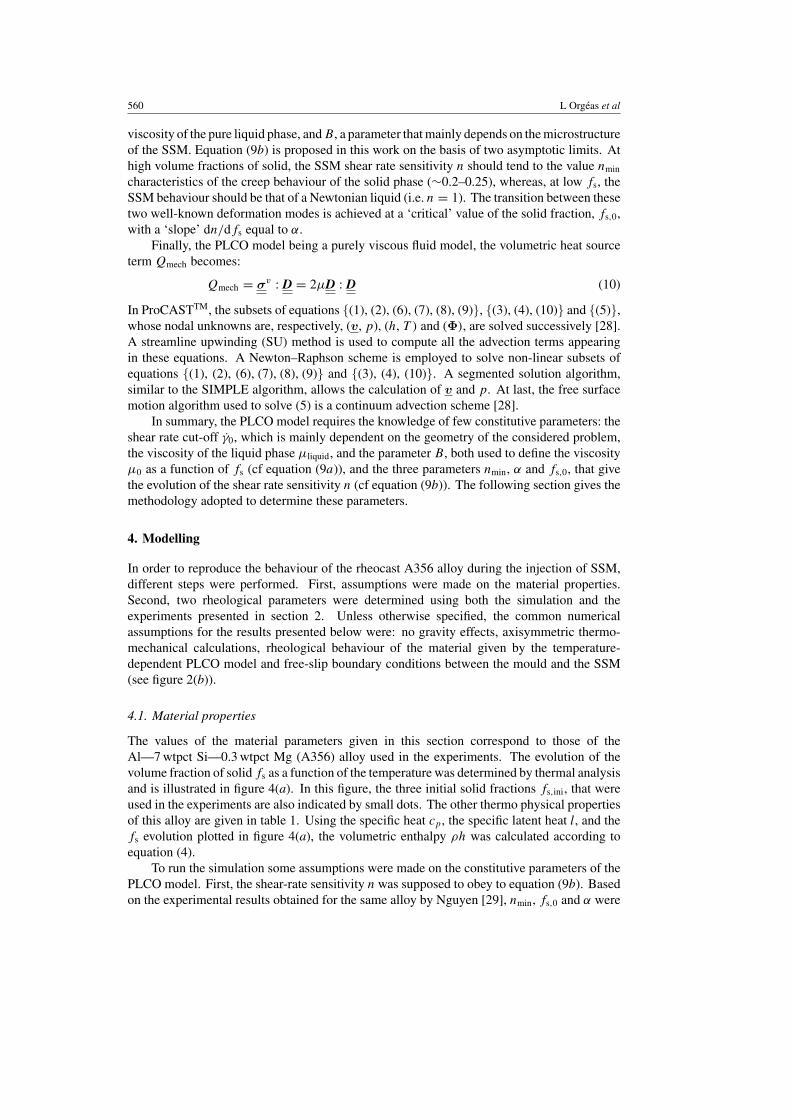
Figure 4. (a) Evolution of the volume fraction of solid, fs, as a function of the temperature, T ,as measured by thermal analysis for the A356 alloy. The small dots indicate the three initial solidfractions, fs,ini, used in the injection experiments. (b) Temperature-dependence of the viscosity,µ0, for five values of B ranging from 17 to 22.
Table 1. Thermo physical and rheological properties of the A356 alloy.
Specific mass, ρ T = 560˚C 2580 kg m−3
T = 615˚C 2380Specific latent heat of fusion, L 389 000 J kg−1
Specific heat, cp 900 J kg−1 K−1
Thermal conductivity, κ 150 W m−1 K−1
Dynamic viscosity of liquid Al, µliquid 1 × 10⁻³ Pa sMinimum strain-rate sensitivity, nmin 0.25 —Critical fraction of solid, fs,0 0.35 —Parameter, α 2.5 —Parameter, B 22 —Parameter, β 2.34 —Parameter, χ 2.14 —
fixed to 0.25, 0.35 and 2.5, respectively, as illustrated in figure 5. Second, the viscosity µliquid
of molten aluminium (equation (9a)) was fixed to a standard value of 10−3 Pa s. Finally, toestimate the evolution of the consistency µ0 as a function of fs or T , different values of B
were tested, ranging from 15 to 25. These high values correspond to the experimental results
562 L Orgeas et al
0
0.2
0.4
0.6
0.8
1
0 0.2 0.4 0.6 0.8 1f s
n
equation (9b)
A356 (Nguyen [28])
Figure 5. Evolution of the shear-rate sensitivity n as a function of the solid volume fraction fs forthe A356 alloy—comparison between data obtained by Nguyen [28] and the fit of equation (9b)with nmin = 0.25, fs,0 = 0.35 and α = 2.5.
given in the literature for SSM [5, 26]. As examples, the evolution of µ0 as a function of T isplotted in figure 4(b) when B ranges from 17 to 22: all the curves start at µliquid at the liquidustemperature (i.e. for fs = 0). Regardless of the value selected for B, very large variations ofµ0 are expected, especially during eutectic solidification.
4.2. Determination of the cut-off value
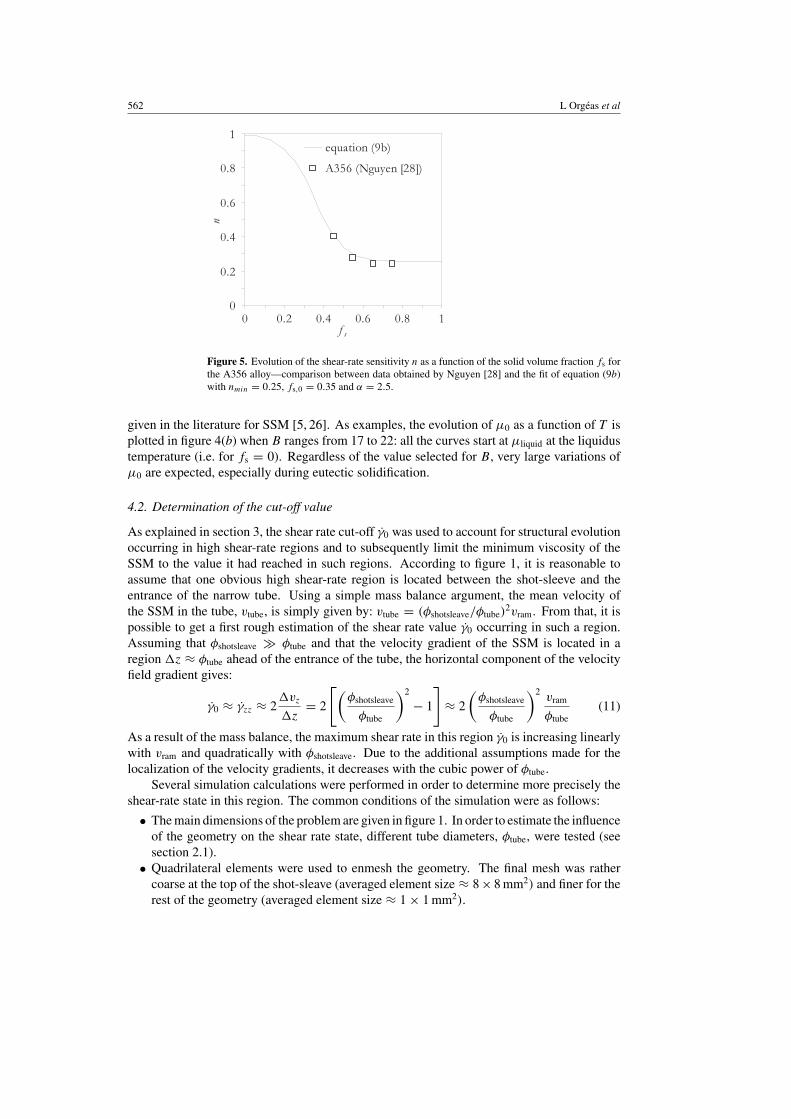
As explained in section 3, the shear rate cut-off γ0 was used to account for structural evolutionoccurring in high shear-rate regions and to subsequently limit the minimum viscosity of theSSM to the value it had reached in such regions. According to figure 1, it is reasonable toassume that one obvious high shear-rate region is located between the shot-sleeve and theentrance of the narrow tube. Using a simple mass balance argument, the mean velocity ofthe SSM in the tube, vtube, is simply given by: vtube = (φshotsleave/φtube)
2vram. From that, it ispossible to get a first rough estimation of the shear rate value γ0 occurring in such a region.Assuming that φshotsleave � φtube and that the velocity gradient of the SSM is located in aregion z ≈ φtube ahead of the entrance of the tube, the horizontal component of the velocityfield gradient gives:
γ0 ≈ γzz ≈ 2vz
z= 2
[(φshotsleave
φtube
)2
− 1
]≈ 2
(φshotsleave
φtube
)2vram
φtube(11)
As a result of the mass balance, the maximum shear rate in this region γ0 is increasing linearlywith vram and quadratically with φshotsleave. Due to the additional assumptions made for thelocalization of the velocity gradients, it decreases with the cubic power of φtube.
Several simulation calculations were performed in order to determine more precisely theshear-rate state in this region. The common conditions of the simulation were as follows:
• The main dimensions of the problem are given in figure 1. In order to estimate the influenceof the geometry on the shear rate state, different tube diameters, φtube, were tested (seesection 2.1).
• Quadrilateral elements were used to enmesh the geometry. The final mesh was rathercoarse at the top of the shot-sleave (averaged element size ≈ 8 × 8 mm2) and finer for therest of the geometry (averaged element size ≈ 1 × 1 mm2).
Modelling of semi-solid processing 563
(a) (b)
2600 0.5 0.50
310
t [s]
T3
[°C
]
injection
0
9000
t [s]
h [W
m-2 K
-1]
injection
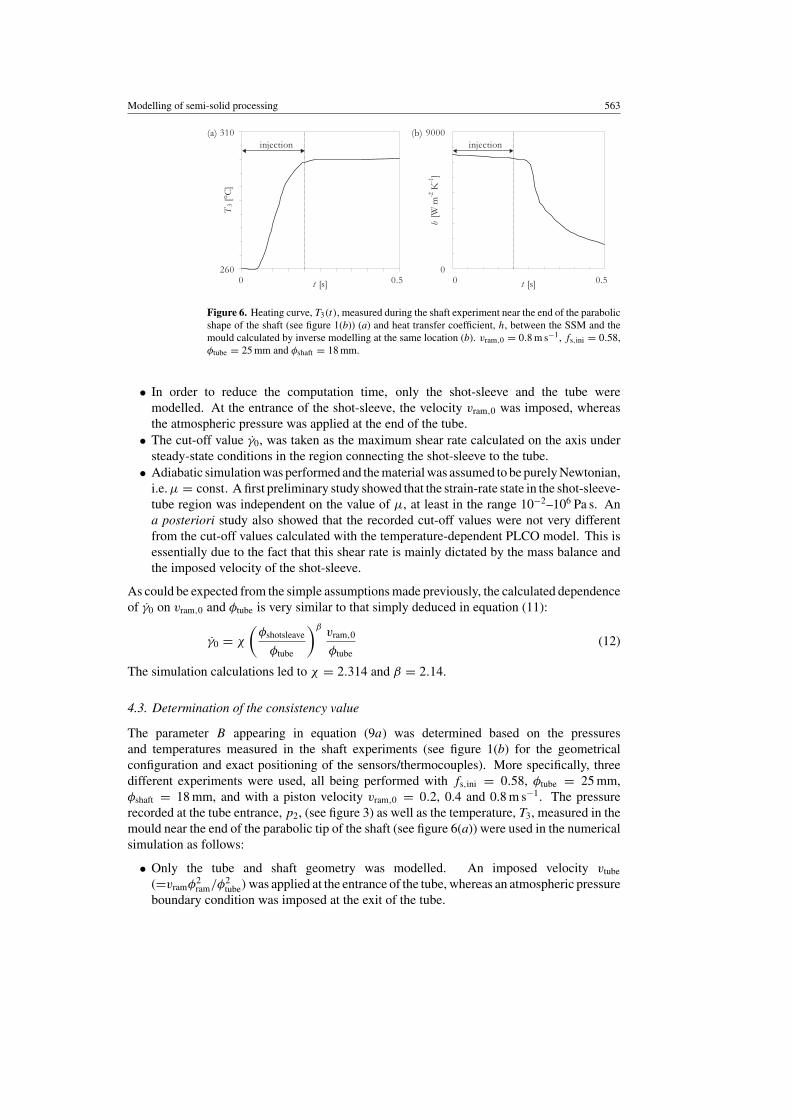
Figure 6. Heating curve, T3(t), measured during the shaft experiment near the end of the parabolicshape of the shaft (see figure 1(b)) (a) and heat transfer coefficient, h, between the SSM and themould calculated by inverse modelling at the same location (b). vram,0 = 0.8 m s−1, fs,ini = 0.58,φtube = 25 mm and φshaft = 18 mm.
• In order to reduce the computation time, only the shot-sleeve and the tube weremodelled. At the entrance of the shot-sleeve, the velocity vram,0 was imposed, whereasthe atmospheric pressure was applied at the end of the tube.
• The cut-off value γ0, was taken as the maximum shear rate calculated on the axis understeady-state conditions in the region connecting the shot-sleeve to the tube.
• Adiabatic simulation was performed and the material was assumed to be purely Newtonian,i.e. µ = const. A first preliminary study showed that the strain-rate state in the shot-sleeve-tube region was independent on the value of µ, at least in the range 10−2–106 Pa s. Ana posteriori study also showed that the recorded cut-off values were not very differentfrom the cut-off values calculated with the temperature-dependent PLCO model. This isessentially due to the fact that this shear rate is mainly dictated by the mass balance andthe imposed velocity of the shot-sleeve.
As could be expected from the simple assumptions made previously, the calculated dependenceof γ0 on vram,0 and φtube is very similar to that simply deduced in equation (11):
γ0 = χ
(φshotsleave
φtube
)βvram,0
φtube(12)
The simulation calculations led to χ = 2.314 and β = 2.14.
4.3. Determination of the consistency value
The parameter B appearing in equation (9a) was determined based on the pressuresand temperatures measured in the shaft experiments (see figure 1(b) for the geometricalconfiguration and exact positioning of the sensors/thermocouples). More specifically, threedifferent experiments were used, all being performed with fs,ini = 0.58, φtube = 25 mm,φshaft = 18 mm, and with a piston velocity vram,0 = 0.2, 0.4 and 0.8 m s−1. The pressurerecorded at the tube entrance, p2, (see figure 3) as well as the temperature, T3, measured in themould near the end of the parabolic tip of the shaft (see figure 6(a)) were used in the numericalsimulation as follows:
• Only the tube and shaft geometry was modelled. An imposed velocity vtube
(=vramφ2ram/φ2
tube) was applied at the entrance of the tube, whereas an atmospheric pressureboundary condition was imposed at the exit of the tube.
564 L Orgeas et al
• Very fine quadrilateral elements were used to enmesh the geometry, so that whatever theaxis position, more than ten nodes were present in the radial direction to represent wellthe boundary layer at the shaft position.
• The initial SSM temperature at the tube entrance was fixed to a constant valuecorresponding to fs,ini = 0.58 (see figure 4(a)). At the end of the tube, an adiabaticboundary condition was imposed.
• The heat transfer coefficient h between the SSM and the tube and between the SSMand the shaft was assumed to be temperature-dependent, but spatially uniform. It wasestimated from the temperature T3 measured in the mould (see figures 1(b) and 6(a))using inverse modelling [1, 30, 31]. The calculated time-evolution of h for the particularcase vram,0 = 0.8 m s−1 is also shown in figure 6(b). As can be seen, h is very high(close to 8000 W m−2 K−1 for this experiment) during the short injection time; the flowingSSM contacts and quickly heats up the mould from its initial temperature (260˚C) to astationary value of 300˚C. At the end of injection (≈0.2 s), the mould temperature remainsapproximately constant and the heat transfer coefficient h quickly decreases by nearly oneorder of magnitude (h ≈ 800 W m−2 K−1).
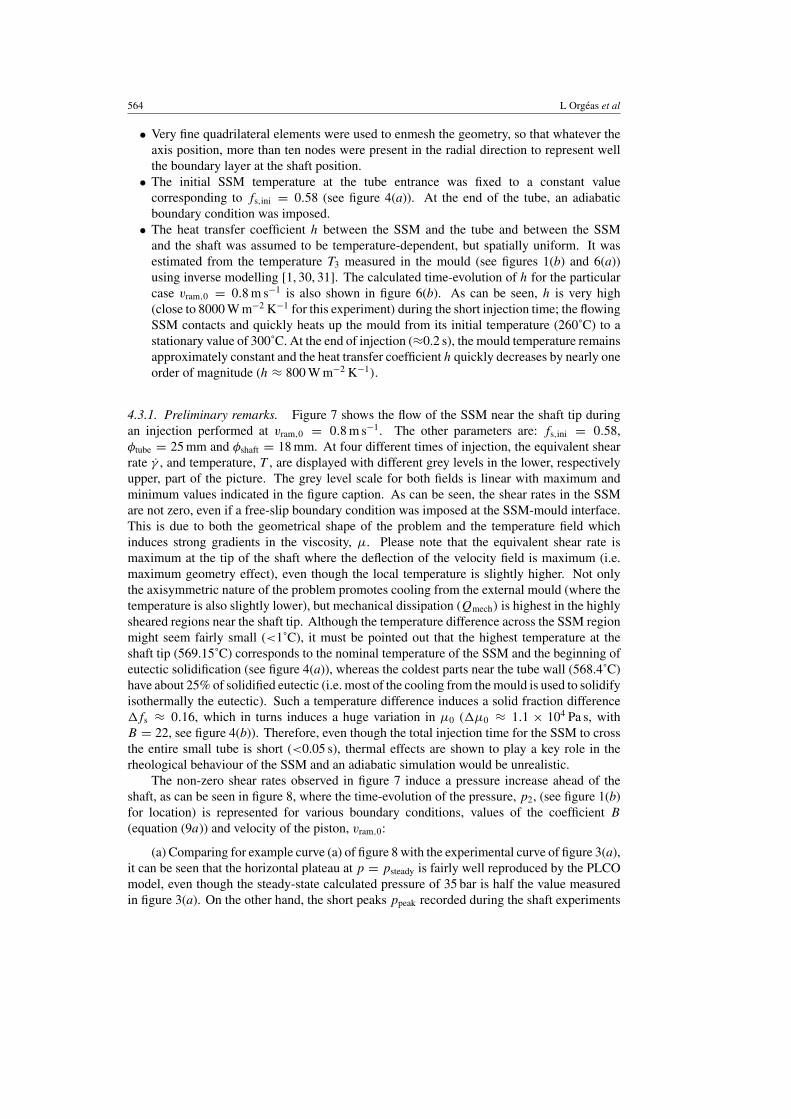
4.3.1. Preliminary remarks. Figure 7 shows the flow of the SSM near the shaft tip duringan injection performed at vram,0 = 0.8 m s−1. The other parameters are: fs,ini = 0.58,φtube = 25 mm and φshaft = 18 mm. At four different times of injection, the equivalent shearrate γ , and temperature, T , are displayed with different grey levels in the lower, respectivelyupper, part of the picture. The grey level scale for both fields is linear with maximum andminimum values indicated in the figure caption. As can be seen, the shear rates in the SSMare not zero, even if a free-slip boundary condition was imposed at the SSM-mould interface.This is due to both the geometrical shape of the problem and the temperature field whichinduces strong gradients in the viscosity, µ. Please note that the equivalent shear rate ismaximum at the tip of the shaft where the deflection of the velocity field is maximum (i.e.maximum geometry effect), even though the local temperature is slightly higher. Not onlythe axisymmetric nature of the problem promotes cooling from the external mould (where thetemperature is also slightly lower), but mechanical dissipation (Qmech) is highest in the highlysheared regions near the shaft tip. Although the temperature difference across the SSM regionmight seem fairly small (<1˚C), it must be pointed out that the highest temperature at theshaft tip (569.15˚C) corresponds to the nominal temperature of the SSM and the beginning ofeutectic solidification (see figure 4(a)), whereas the coldest parts near the tube wall (568.4˚C)have about 25% of solidified eutectic (i.e. most of the cooling from the mould is used to solidifyisothermally the eutectic). Such a temperature difference induces a solid fraction differencefs ≈ 0.16, which in turns induces a huge variation in µ0 (µ0 ≈ 1.1 × 10⁴ Pa s, withB = 22, see figure 4(b)). Therefore, even though the total injection time for the SSM to crossthe entire small tube is short (<0.05 s), thermal effects are shown to play a key role in therheological behaviour of the SSM and an adiabatic simulation would be unrealistic.
The non-zero shear rates observed in figure 7 induce a pressure increase ahead of theshaft, as can be seen in figure 8, where the time-evolution of the pressure, p2, (see figure 1(b)for location) is represented for various boundary conditions, values of the coefficient B
(equation (9a)) and velocity of the piston, vram,0:
(a) Comparing for example curve (a) of figure 8 with the experimental curve of figure 3(a),it can be seen that the horizontal plateau at p = psteady is fairly well reproduced by the PLCOmodel, even though the steady-state calculated pressure of 35 bar is half the value measuredin figure 3(a). On the other hand, the short peaks ppeak recorded during the shaft experiments
Modelling of semi-solid processing 565
Figure 7. Temperature field (above the shaft) and equivalent shear-rate map (below the shaft)as calculated with the PLCO model implemented in ProCASTTM during the shaft experimentperformed at: vram,0 = 0.8 m s−1, fs,ini = 0.58, φtube = 25 mm and φshaft = 18 mm. The fourfigures correspond to various injection times: t = 0.009 s (a), 0.015 s (b), 0.018 s (c) and 0.049 s (d).For the sake of visibility, the radius (vertical) scale has been expanded by a factor 4. The lineargrey scale used for the temperature ranges between 568.4˚C (white) and 569.15˚C (black), whereasthat used for the shear rate goes from 0 s−1 (white) to 1500 s−1 (black).
(see, e.g. figure 3(a)) does not at all appear in figure 8. These pressure peaks are believed to beinduced by the solidifying-consolidated advancing mushy front which moves towards the shaftwithout being well pre-sheared at the entrance of the small tube. Once this front meets theshaft, it has to be broken, thus inducing a high overpressure ppeaks. The subsequent part of thefeeding, with a material well pre-sheared at the entrance of the tube and with a lower volumefraction of solid, produces lower pressure levels psteady. The very simple PLCO model usedin this work is not refined enough to catch these short transient regimes. More sophisticated

566 L Orgeas et al
0.10 0.05
1
10
100
t [s]
p2
[bar
]
(a)
(b)
(c)
(d)
(e)
(f)
Figure 8. Influence of the heat transfer coefficient, h, ram velocity, vram,0 and constitutiveparameter, B, on the evolution of the calculated pressure, p2, during the shaft experimentsperformed with φtube = 25 mm and φshaft = 18 mm. The other parameters for each curveare: (a) vram,0 = 0.8 m s−1, h given by figure 6(b), B = 22; (b) vram,0 = 0.8 m s−1, h = 0,B = 22; (c) vram,0 = 0.4 m s−1, h given by figure 6(b), B = 22; (d) vram,0 = 0.4 m s−1, h = 0,B = 22; (e) vram,0 = 0.8 m s−1, h given by figure 6(b), B = 20; (f) vram,0 = 0.8 m s−1, h givenby figure 6(b), B = 18.
thixotropic models could account for such complex phenomena, with, in return, an increaseof the computation time, since additional internal variables associated with their constitutiveequations would be generally required to complete the whole set of involved equations [18–22].
(b) As seen in this figure, some instability occurs in the calculation, especially duringthe transient regime. These oscillations correspond to the transient time when the flow in thetube reaches the tip of the shaft (i.e. filling of this region), for which the free surface modelused to solve equation (5) is certainly not accurate enough. In some way, this corresponds alsoto the time when a pressure peak is experimentally observed. Once this region is filled, thecode then calculates the flow around the shaft (i.e. pseudo-stationary state) and gives muchmore reliable results. In the subsequent comparisons, only the calculated pressure plateau iscompared with the measured value.
4.3.2. Influence of boundary conditions. As can be seen in figure 8, the mechanical andthermal boundary conditions defined for the SSM-mould interface play a crucial role in thenumerical results. For the same injection speed (vram,0 = 0.8 m s−1) and parameter B, thereplacement of the heat transfer coefficient, h, given by figure 6(b) (curve (a)) by an adiabaticcondition (curve (b)) drastically decreases the pressure, p2, by a factor 20. On the other hand,it was shown in section 2.2 that an increase in the recorded pressure p2 with a decrease inthe piston ram, vram,0, could be a consequence of thermal effects. Such an observation isconfirmed by the simulation results shown in figure 8, providing the heat transfer between theSSM and the mould is ‘turned on’. Comparing curves (a) and (c) in figure 8, it can be seenthat a variation of the ram velocity, vram,0, from 0.8 to 0.4 m s−1 almost doubles the pressure,p2, at steady state. Moreover, using purely adiabatic boundary conditions, the other trend isobserved (compare curves (b) and (d) for which the same decrease in vram,0 now decreases thepressure p2 by almost a factor 2).
Modelling of semi-solid processing 567
0
100
200
300
400
500Exp n°1
Exp n°2
Simul
t [s]
p 2[b
ar]
00 0.3
0 0.2
0 0.25
100
200
300
400
500(a) (b)
(c) (d)
Exp n°1
Exp n°2
Simul
t [s]
p 2[b
ar]
0
100
200
300
400
500Exp 1
Exp 2
Simul
t [s]
p 2[b
ar]
0
100
200
300
400
500Exp 1
Exp 2
Simul
t [s]
p 2[b
ar]
0
100
200
300
400
500Exp n°1
Exp n°2
Simul.
t [s]
p 2[b
ar]
0
100
200
300
400
500Exp n°1
Exp n°2
Simul.
t [s]
p 2[b
ar]
0
40
80
120
160
200
0 0.25 0.5 0.75 1
Exp.
Simul.
vram,0 [m s-1]
p 2[b
ar]
0
40
80
120
160
200
0 0.25 0.5 0.75 1
Exp.
Simul.
vram,0 [m s-1]
p 2[b
ar]
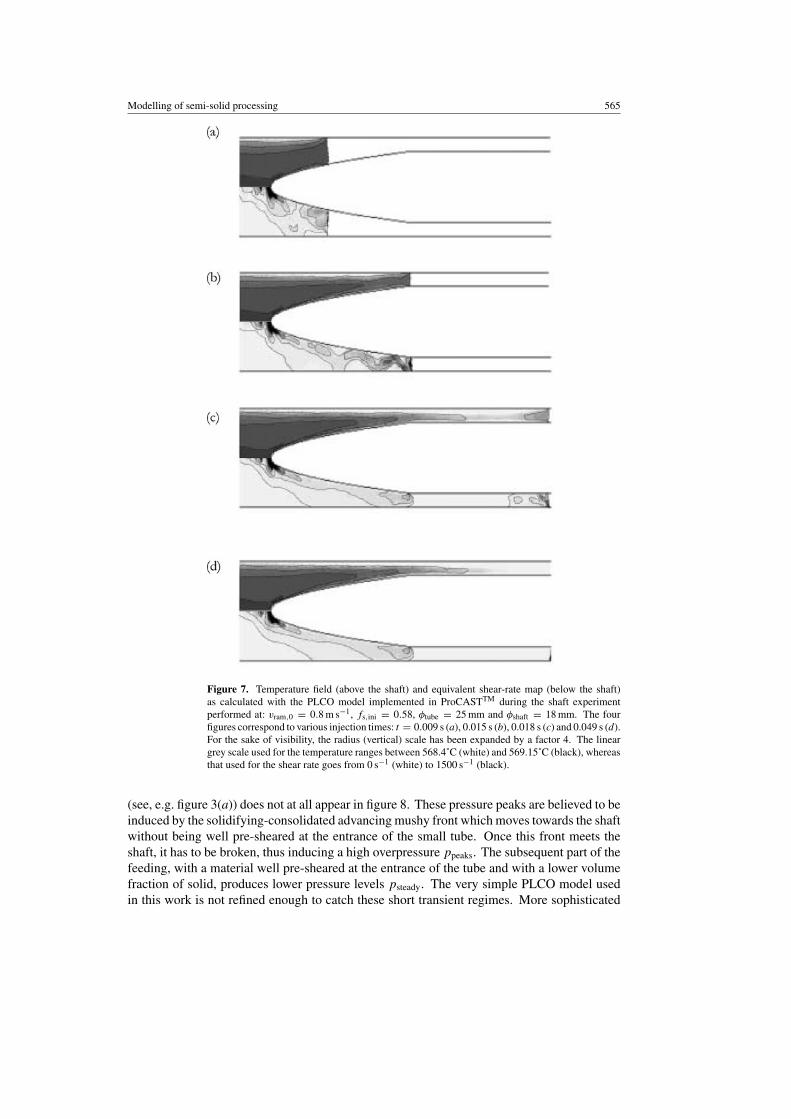
Figure 9. Time-evolution of the measured and simulated pressures, p2, for vram,0 = 0.2 m s−1 (a),0.4 m s−1 (b) and 0.8 m s−1 (c). The measured and computed pressures, p2, at ‘steady-state’ arecompared as a function of vram,0 in (d).
4.3.3. Results. The goal of the shaft experiment simulation is to ultimately determine themissing constitutive parameter B appearing in equation (9a). All other conditions remainingthe same, the dependence of the calculated pressure, p2, on this parameter is shown in figure 8(compare curves (a), (e) and (f)). When B is decreased from 22 to 18, the pressure, p2, isdecreased by one order of magnitude (from 35 to 1.5 bar). Increasing this value beyond 22 couldhave allowed to match the calculated steady state pressure, psteady, with the value measuredfor vram,0 = 0.8 m s−1 (see figure 3(b) where psteady = 70 bar). However, when consideringall the initial piston velocities (0.2, 0.4 and 0.8 m s−1), it was found that B = 22 could bestreproduce the six experiments. The simulated results are compared with the experiments infigures 9(a)–(c) for vram,0 = 0.2 m s−1, 0.4 m s−1 and 0.8 m s−1, respectively. In each figure,the pressure evolution for the two experiments are clearly identified by the presence of a peak,whereas the simulation performed with B = 22 does not. These results are summarized in
568 L Orgeas et al
figure 9(d), where the simulated ‘steady-state’ pressure is compared with the experimentalresult as a function of the piston ram velocity. Considering both the large scattering ofthe experimental points and the strong assumptions made for the simulation, the agreementis satisfactory and more important, the trend is well reproduced (decrease of psteady withincreasing vram,0).
5. Validation
In the previous section, two constitutive parameters of the PLCO model (equations (6), (8)and (9)) were determined on the basis of the pressures and temperatures measured during theshaft experiments: the cut-off value, γ0 (equation (12)), and the value of B (equation (9a)). Thevalues of all the PLCO model parameters are summarized in table 1. In this section, this PLCOmodel is now used to simulate the filling of the reservoir in the Poiseuille-type experiments(see figure 1(a)) and to check whether this model is capable of reproducing the various fillingbehaviours observed when varying in particular the initial volume fraction of solid, fs,ini [10].Fixing φtube and vram,0 to 25 mm and 0.8 m s−1, respectively, three simulations were performedunder the following conditions:
• Only the long tube and the reservoir were modelled in order to reduce the computationtime. A vtube(vram(t)) boundary condition was applied at the entrance of the tube.
• Fine quadrilateral elements were used to enmesh the geometry (averaged meshsize ≈ 1.5 × 1.5 mm2).
• For the three experiments, the temperature at the tube entrance was fixed to a constantvalue corresponding to fs,ini = 0.73, 0.58 and 0.52 (see figure 4(a)).
• The temperature of the mould (i.e. tube and reservoir) and the heat transfer coefficientbetween the SSM and the mould were set constant and equal to 250˚C and 500 W m−2 K−1,respectively. The last value was lowered as compared with that found in the shaftexperiments because of the much lower pressure level.
• The end of each experiment was supposed to be reached after 1 s, corresponding to a stopof the SSM deformation in the reservoir.
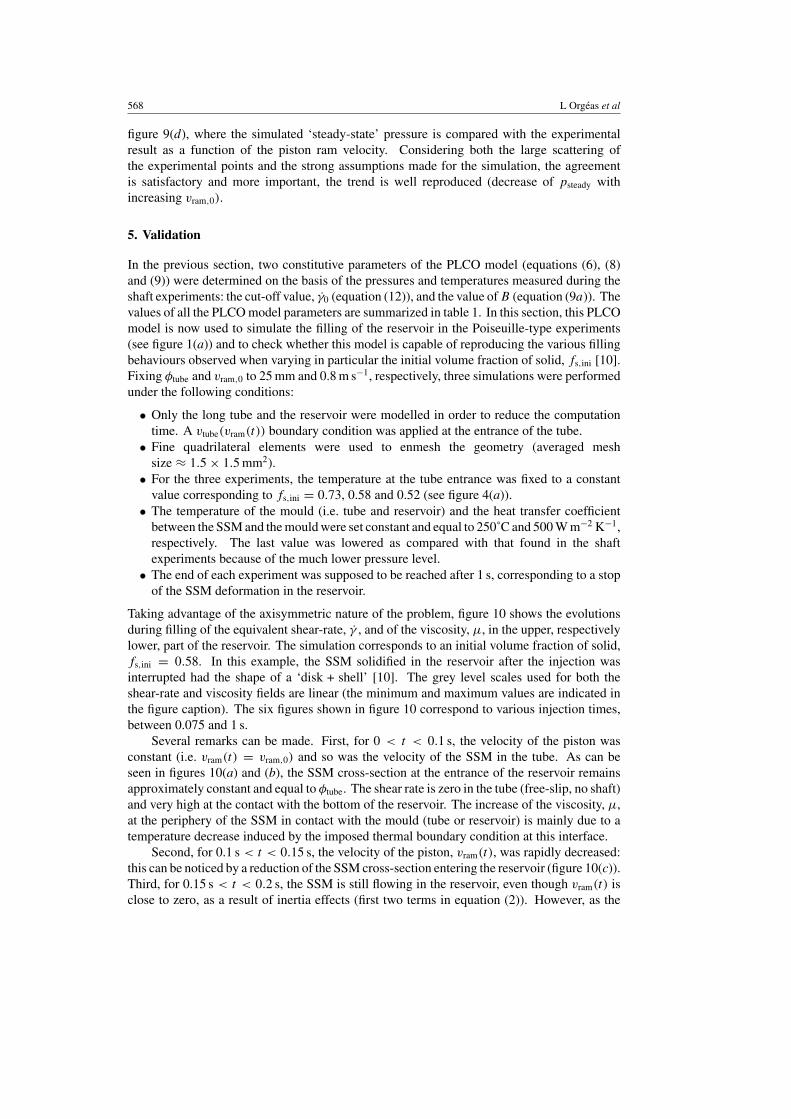
Taking advantage of the axisymmetric nature of the problem, figure 10 shows the evolutionsduring filling of the equivalent shear-rate, γ , and of the viscosity, µ, in the upper, respectivelylower, part of the reservoir. The simulation corresponds to an initial volume fraction of solid,fs,ini = 0.58. In this example, the SSM solidified in the reservoir after the injection wasinterrupted had the shape of a ‘disk + shell’ [10]. The grey level scales used for both theshear-rate and viscosity fields are linear (the minimum and maximum values are indicated inthe figure caption). The six figures shown in figure 10 correspond to various injection times,between 0.075 and 1 s.
Several remarks can be made. First, for 0 < t < 0.1 s, the velocity of the piston wasconstant (i.e. vram(t) = vram,0) and so was the velocity of the SSM in the tube. As can beseen in figures 10(a) and (b), the SSM cross-section at the entrance of the reservoir remainsapproximately constant and equal to φtube. The shear rate is zero in the tube (free-slip, no shaft)and very high at the contact with the bottom of the reservoir. The increase of the viscosity, µ,at the periphery of the SSM in contact with the mould (tube or reservoir) is mainly due to atemperature decrease induced by the imposed thermal boundary condition at this interface.
Second, for 0.1 s < t < 0.15 s, the velocity of the piston, vram(t), was rapidly decreased:this can be noticed by a reduction of the SSM cross-section entering the reservoir (figure 10(c)).Third, for 0.15 s < t < 0.2 s, the SSM is still flowing in the reservoir, even though vram(t) isclose to zero, as a result of inertia effects (first two terms in equation (2)). However, as the
Modelling of semi-solid processing 569
Figure 10. Simulation of the reservoir filling during the Poiseuille-type experiment performed atvram,0 = 0.8 m s−1, φtube = 25 mm and fs,ini = 0.58, at six different times. In each figure, theequivalent shear rate and the SSM viscosity are displayed in the upper, respectively lower, part ofthe reservoir with various grey levels. The grey scales are linear and spread from 0 s−1 (white) to3000 s−1 (black) for the equivalent shear rate, and from 0 Pa s (white) to 150 Pa s (black) for theviscosity.
SSM part in contact with the end of the reservoir has further solidified and thickened, it doesnot move any more during this time interval. Consequently, the section of the inner part ofthe SSM becomes wider (cf figures 9(c) and (d)). Finally, for 0.2 s < t < 0.5 s, inertia effectsvanish and further solidification of the SSM increases its viscosity. Since the SSM has nearlystop to move, the equivalent shear rate is reduced almost to zero.
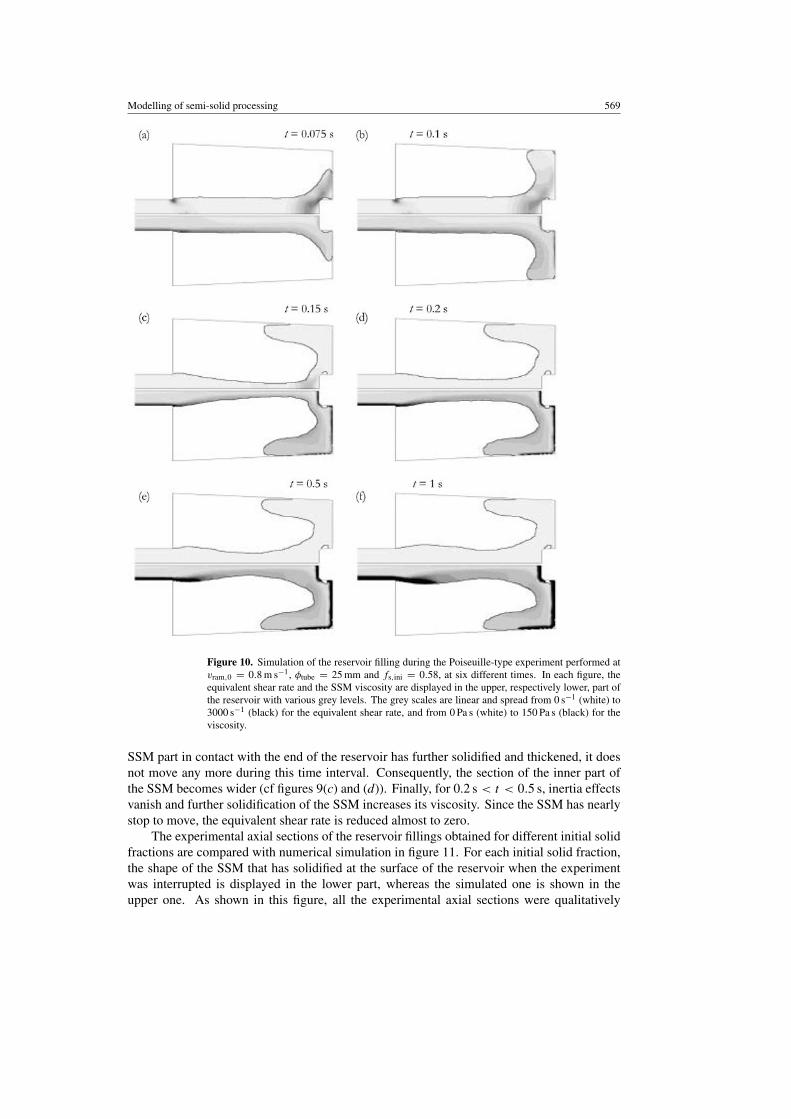
The experimental axial sections of the reservoir fillings obtained for different initial solidfractions are compared with numerical simulation in figure 11. For each initial solid fraction,the shape of the SSM that has solidified at the surface of the reservoir when the experimentwas interrupted is displayed in the lower part, whereas the simulated one is shown in theupper one. As shown in this figure, all the experimental axial sections were qualitatively
570 L Orgeas et al
Figure 11. Comparison between experimental and simulated reservoir fillings when vram,0 =0.8 m s−1, φtube = 25 mm and for fs,ini = 0.52 (a), 0.58 (b) and 0.73 (c). In each figure, thesimulated and the experimental filling are displayed in the upper, respectively lower, part of thereservoir.
well reproduced by the simulation: ‘disk’ filling is obtained for high initial solid fraction(fs,ini = 0.73, figure 11(c)), a ‘disk + shell’ forms when fs,ini = 0.58 (figures 11(b) and 10),whereas a thin ‘shell’ follows the surface of the reservoir at the lowest initial solid fraction(fs,ini = 0.52, figure 11(a)). Please note the drastic change in the reservoir filling morphologywhen fs,ini is only varied from 0.58 to 0.52!
6. Discussion and conclusion
The aim of this work was to model the industrial thixocasting process using a PLCO modelimplemented in a commercial numerical software. A first part consisted in performingPoiseuille-type experiments, with or without a parabolic shaft inserted in the tube. During theseexperiments, different process parameters were varied in order to determine the constitutive
Modelling of semi-solid processing 571
parameters of the PLCO model. To reach such a goal, strong assumptions were made, both onthe constitutive parameters and on the boundary conditions. As a matter of fact, most of theparameters of the PLCO model were given by previously published data and only the shearcut-off value, γ0, and the parameter, B, of equation (9a) were determined by the simulation.The cut-off value is an extrinsic parameter depending mainly on the geometry and mechanicalboundary conditions. The intrinsic parameter B dictates the solid fraction-dependence of theviscosity. Since the thermal boundary condition between the SSM and the mould cannot beconsidered as adiabatic, the value of this parameter was shown to have a strong influenceon the mould filling simulation. Based on the shaft experiment simulations, a B-value of22 seemed to best reproduce the steady-state pressure measured ahead of the shaft. Usingthe values summarized in table 1, the PLCO model was then capable of reproducing fairlyaccurately the shape of the SSM part that had solidified in the reservoir during interruptedinjection experiments.
These results are encouraging, even though they are still semi-quantitative. In particular,the importance of the thermal effects on the SSM flow was clearly evidenced for the industrialprocess, even with a short injection time (<1 s). This issue has been rarely addressed inlaboratory-scale experiments, which have essentially focused on the shear-rate (and time)dependence of the viscosity under isothermal conditions. Likewise, the use of the PLCOmodel is very simple, since only six rheological parameters are involved. However, theseresult should still be viewed as preliminary since many hypotheses have been made in thesimulation (e.g. free-slip, uniform heat transfer coefficient). In order to give more quantitativeresults, several limitations of this methodology should be removed:
(a) The Poiseuille-type experiments, with or without shaft, were performed on aproduction-scale injection machine and are thus very close to industrial thixocasting conditions.Hence, from an industrial point of view, they brought a valuable understanding of the process:the injection process cannot be considered as isothermal, deformation is fast and heterogeneous.However, from a modelling point of view, such a complex loading mixes also the various aspectsof the problem. For instance, a perfect knowledge of the mechanical boundary condition isrequired if an accurate knowledge of the rheological behaviour is to be obtained. Such is not thecase in this work. From a mechanical point of view, free-slip was assumed at the SSM-mouldinterface, owing to the presence of a thin liquid of eutectic composition (figure 2(b)). Althoughit appears realistic to consider this liquid layer as a perfect lubricant (and not model it), it wouldbe more realistic to introduce a boundary layer approach in the simulation in a way similar toaerodynamics calculations. From a thermal point of view, the heat transfer coefficient betweenthe mould and the SSM is certainly not a unique function of time (figure 6): it also dependson the position, local pressure, volume fraction of solid, etc. As this study clearly revealed theimportance of the thermal exchanges during mould filling, heat transfer between the SSM andthe mould should be further investigated using inverse modelling.
(b) In future investigations, the mechanical boundary conditions and rheological behaviourof the SSM should be investigated separately, but under conditions close to the industrialprocess. Laboratory-scale isothermal investigations of the SSM behaviour performed underno-slip condition are certainly very valuable, but they should be extended to the very highshear rates encountered in the industrial process (typically 103 s−1). Using then a well-definedrheological law for the SSM, instrumented experiments combined with numerical simulationwill allow to determine more accurately the boundary conditions prevailing in the industrialprocess.
(c) SSM are thixotropic materials, i.e. their structure can evolve during loading. Theintroduction of a cut-off value in the power-law model is a first, and very simple attempt to
572 L Orgeas et al
(a)
(b)
rz
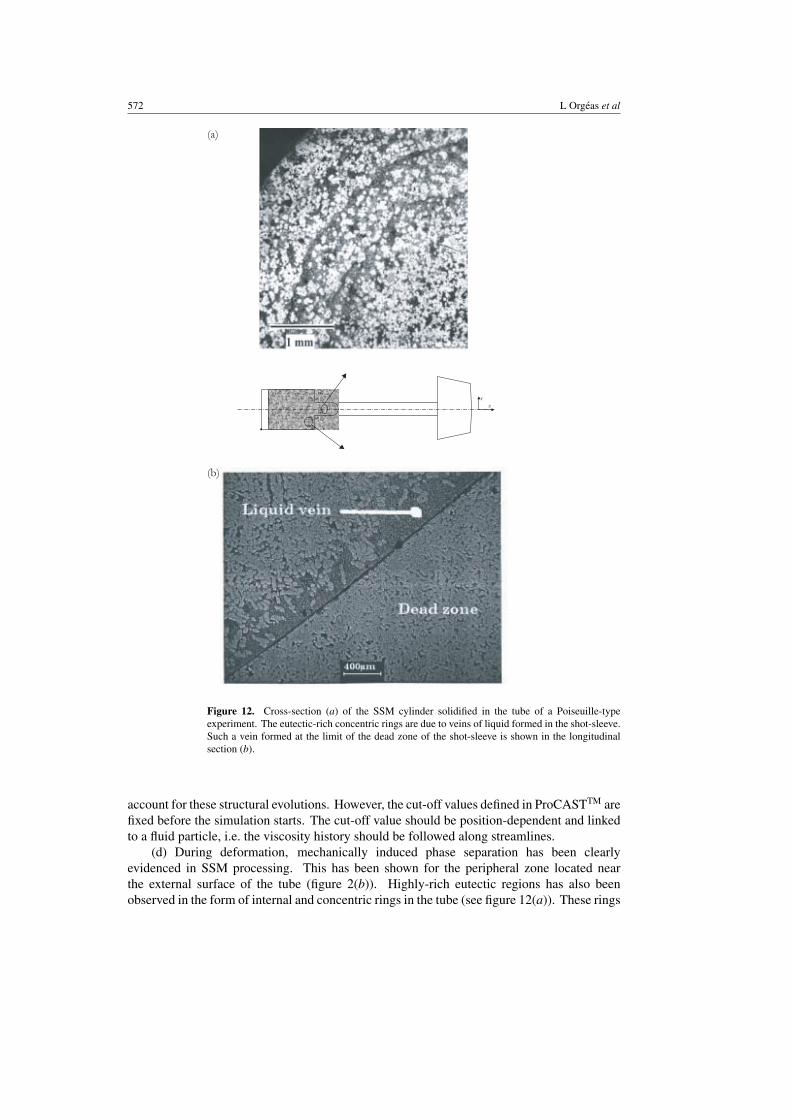
Figure 12. Cross-section (a) of the SSM cylinder solidified in the tube of a Poiseuille-typeexperiment. The eutectic-rich concentric rings are due to veins of liquid formed in the shot-sleeve.Such a vein formed at the limit of the dead zone of the shot-sleeve is shown in the longitudinalsection (b).
account for these structural evolutions. However, the cut-off values defined in ProCASTTM arefixed before the simulation starts. The cut-off value should be position-dependent and linkedto a fluid particle, i.e. the viscosity history should be followed along streamlines.
(d) During deformation, mechanically induced phase separation has been clearlyevidenced in SSM processing. This has been shown for the peripheral zone located nearthe external surface of the tube (figure 2(b)). Highly-rich eutectic regions has also beenobserved in the form of internal and concentric rings in the tube (see figure 12(a)). These rings
Modelling of semi-solid processing 573
could be correlated to veins of liquid formed early in the shot-sleeve (see figure 12(b)). Theseveins result from mechanical instabilities generated in a solid skeleton which is not uniformlysheared. In figure 12(b), the vein of eutectic liquid at 45˚ was shown to be due to the ‘dead’zone at the bottom right corner of the shot-sleeve, i.e. a zone which is almost not sheared andonly compressed. The compression of the dead zone induces a ‘sponge-like’ effect, i.e. theintergranular liquid is expulsed of the zone and flows in the vein. Please note that the volumefraction of primary aluminum phase is much higher in this zone. Obviously, such a complexbehaviour cannot be predicted with a one-phase model. Two-phases models could possiblyaddress this issue, providing damage mechanisms and solid skeleton break-up criteria will beincluded in such approaches, which is not yet the case.
Acknowledgments
The authors would like to thank Alusuisse (now Alcan) Technology Management, Neuhausen-am-Rheinfall, and the Commission pour la Technologie et l’Innovation, Bern, Switzerland, fortheir financial support within the framework of the projects CTI 2942.1 and 3753.1.
References
[1] Paradies C, Rappaz M, Imwinkelried T and Gabathuler J-P 1997 Proc. EPD Congress ed Mishra, p 725[2] Flemmings M C 1991 Behavior of metal alloys in the semi-solid state Metall. Trans. B 22 269–93[3] Martin C L, Kumar P and Brown S 1994 Constitutive modelling and characterization of the flow behavior
of semi-solid metal alloy slurries—II. Structural evolution under shear deformation Acta Metall. Mater. 423603–14
[4] Salvo L, Loue W and Suery M 1995 Influence of prior solidifications on the structure and rheological behaviorof partially remelted Al–Si alloy ISIJ Int. 35 798–804
[5] Loue W 1992 Evolution microstructurale et comportement rheologique d’alliage Al–Si a l’etat semi-solidePhD Thesis Institut National Polytechnique de Grenoble, Grenoble, France
[6] Liechti T, Chen Z W, Davidson C J and Dahle A K 1998 Casting defects and tensile properties of semi-solidcast AZ91 Proc. 5th Int. Conf. on SS Processing of Alloys and Composites ed A Kumar Bashin et al (USA:Colorado School of Mines) pp 505–12
[7] Cho W G and Kang CG 2000 Mechanical properties and their microstructure evaluation in the thixoformingprocess of semi-solid aluminium alloys J. Mater. Process. Technol. 105 269–77
[8] Gabathuler J-P, Barra D, Krahenbuhl Y and Weber J C 1990 Proc. 2nd Int. Conf. on SS Processing of Alloys andComposites (Cambridge, MA, USA: MIT Press) p 119
[9] Koke J, Hufschmidt M, Modigell M, Heine C, Han S, Stapf S and Petera J 2000 Segregation and wall slip insemi-solid alloys: measurement, modelling and simulation Proc. 6th Int. Conf. on SS Processing of Alloysand Composites ed G L Chiarmetta and M Rosso (Italy: Edimet) pp 623–8
[10] Paradies C, Rappaz M, Imwinkelried T and Gabathuler J-P 1998 Modeling the rheology of semi-solid metalalloys during die casting Proc. ICMCWASP (San Diego, USA) p 933
[11] Nguyen T Y, Favier D and Suery M 1994 Theoretical and experimental study of the isothermal behavior ofalloys in the semi-solid state Int. J. Plasticity 10 663–93
[12] Gebelin J-C, Favier D, Suery M and Guarneri C 1996 A FEM simulation of semi-solid material behavior Proc.4th Int. Conf. on SS Processing of Alloys and Composites ed D H Kirkwood and P Kapranos (UK: Universityof Sheffield) pp 126–31
[13] Martin C L, Favier D and Suery M 1997 Viscoplastic behaviour of porous metallic materials saturated withliquid—Part I. Constitutive equations—Part II. Experimental identification on a Sn–Pb alloy Int. J. Plasticity13 237–59
[14] Burgos G R, Alexandrou A N and Entov V 1998 Two-phase flow of semi-solid materials Proc. 5th Int. Conf.on SS Processing of Alloys and Composites ed A Kumar Bashin et al (USA: Colorado School of Mines)pp 217–24
[15] Modigell M, Koke J and Petera J 1998 Two-phase model for metal alloys in the semi-solid state Proc. 5th Int.Conf. on SS Processing of Alloys and Composites ed A Kumar Bashin et al (USA: Colorado School of Mines)pp 317–26

574 L Orgeas et al
[16] Kang C G, Jung H K and Jung K W 1999 Finite Element analysis with deformation behavior modelling ofglobular microstructure in forming process of semi-solid materials J. Mater. Process. Technol. 41 1423–45
[17] Ko D-C, Min G-S, Kim B-M and Choi J-C 2000 Finite Element analysis for the semi-solid state forming ofaluminium alloy considering induction heating J. Mater. Process. Technol. 100 95–104
[18] Kumar P, Martin C L and Brown S 1994 Constitutive modelling and characterization of the flow behavior ofsemi-solid metal alloy slurries—I. The flow response Acta Metall. Mater. 42 3595–602
[19] Quaak C J, Katgerman L and Kool W H 1996 Viscosity evolution of partially solidified aluminium slurries aftera shear rate jump Proc. 4th Int. Conf. on SS Processing of Alloys and Composites ed D H Kirkwood andP Kapranos (UK: University of Sheffield) pp 35–9
[20] Alexandrou A N, Burgos G R and Entov V 1999 Mathematical and computational modelling of die filling insemi-solid metal processing J. Mater. Process. Technol. 96 59–72
[21] Wahlen A 2000 Modeling the thixotropic flow behavior of semi-solid aluminium alloys Proc. 6th Int. Conf. onSS Processing of Alloys and Composites ed G L Chiarmetta and M Rosso (Italy: Edimet) pp 565–70
[22] Modigell M and Koke J 2001 Rheological modelling on semi-solid metal alloys and simulation of thixocastingprocesses J. Mater. Process. Technol. 111 53–8
[23] Bowen R M 1976 Continuous Physics. III, Mixture and EM Field Theories (New York, USA: Academic)[24] Gebelin J-C, Geindreau C, Orgeas L, Royer P, Favier D and Auriault J-L 2000 Influence of liquid flow through
the solid skeleton on the overall deformation of metallic alloys in semi-solid state Proc. 6th Int. Conf. on SSProcessing of Alloys and Composites ed G L Chiarmetta and M Rosso (Italy: Edimet) pp 155–60
[25] Cheng D C and Evans F 1965 Phenomenological characterization of the rheological behavior of inelasticreversible thixotropic and antithixotropic fluids Br. J. Appl. Phys. 16 1599–617
[26] Laxmanan V and Flemmings M C 1980 Deformation of a semi-solid Sn15%Pb alloy Metall. Trans. A 11 1927–37[27] Suery M and Flemmings M C 1982 Effect of strain rate on deformation behavior on semi-solid dendritic alloys
Metall. Trans. A 13 1809–19[28] 1995 ProCastTM User Manual version 3.0, UES Inc[29] Nguyen T Y 1991 Modelisation du comportement rheologique d’alliages a l’etat semi-solide PhD Thesis Institut
National Polytechnique de Grenoble, Grenoble, France[30] Rappaz M, Desbiolles J-L, Drezet J-M, Gandin C-A, Jacot A and Thevoz P 1995 Proc. ICMCWASP VII
ed M Cross and J Campbell (USA: Warrendale) p 449[31] Rappaz M, Bellet M and Deville M 2003 Modeling in Materials Science and Engineering (Berlin: Springer)
p 447