
Thinning effects on the net ecosystem carbon exchange of a Sitka spruce forest are...
10
Agricultural and Forest Meteorology 157 (2012) 1–10 Contents lists available at SciVerse ScienceDirect Agricultural and Forest Meteorology jou rn al h om epa g e: www.elsevier.com/locate/agrformet Thinning effects on the net ecosystem carbon exchange of a Sitka spruce forest are temperature-dependent M. Saunders a,∗ , B. Tobin b , K. Black b,c , M. Gioria a , M. Nieuwenhuis b , B.A. Osborne a a University College Dublin, UCD School of Biology and Environmental Science, Belfield, D4, Dublin, Ireland b University College Dublin, UCD Forestry, School of Agriculture and Food Science, Belfield, D4, Dublin, Ireland c FERS Ltd. 117 East Courtyard, Cabinteely, Dublin 18, Ireland a r t i c l e i n f o Article history: Received 5 July 2011 Received in revised form 4 January 2012 Accepted 10 January 2012 Keywords: Sitka spruce Forest thinning Carbon stocks and fluxes Net primary productivity Eddy covariance Net ecosystem exchange Gross primary productivity Ecosystem respiration a b s t r a c t Commercial forest plantations need to be actively managed, through tree removal, in order to improve wood quality, maintain productivity and provide an economic return, although this could compromise an important role for forests in carbon sequestration and greenhouse gas mitigation. The impact of for- est thinning on net primary productivity (NPP) and net ecosystem exchange (NEE) was assessed using a combination of biometric and eddy covariance (EC) techniques. Two thinning operations were per- formed in close succession, which reduced the basal area of the stand by 17% and 11% and removed a timber volume of 48 m 3 ha −1 and 50 m 3 ha −1 , respectively. Annual rates of NPP ranged from 13.24 (±3.96) to 18.94 (±4.88) t C ha −1 and 13.22 (±3.72) to 17.77 (±5.30) t C ha −1 for the pre- and post-thinning peri- ods, respectively. Estimates of NEE varied between 8.44 (±1.34) to 8.87 (±1.48) t C ha −1 and 6.75 (±1.19) to 10.33 (±1.41) t C ha −1 in the pre- and post-thinning periods. Forest thinning did not have a significant impact on carbon stocks or fluxes when pre-thinning (2002–2006) and post-thinning (2007–2009) esti- mates of NPP and NEE were compared, however the range of inter-annual variability in NEE increased after thinning. The partitioning of annual NEE carbon budgets into gross primary productivity (GPP) and ecosystem respiration (R eco ) together with an analysis of key physiological parameters suggested that the impacts of forest thinning are largely dependent on temperature. An expected decrease in GPP after the initial thinning in 2007 was not observed due, in part, to the higher mean annual air temperatures and incident photosynthetic active radiation (PAR) and a compensatory increase in photosynthesis by the remaining trees. A continual decline in R eco , was observed in the years subsequent to the first thinning and was attributed to both biomass removal and climatic factors. Inter-annual variations in climate had a significant impact on NEE, GPP and R eco . Annual mean air temperature, total precipitation and total incident PAR were all shown to influence the processes driving CO 2 exchange. Overall, these results suggest that the impacts of the thinning practices, as implemented in this study, are dependent on climate and under similar conditions are unlikely, in the short-term, to compromise a role for forest ecosystems in carbon sequestration and greenhouse gas mitigation. © 2012 Elsevier B.V. All rights reserved. 1. Introduction Forest ecosystems represent a significant terrestrial carbon store, where the majority of carbon sequestered is held within the woody biomass (Scott et al., 2004). Current forest manage- ment strategies that involve variable thinning regimes have been designed to enhance the timber yield and economic returns over the length of the forest rotation. In addition, policy-driven research has identified a potential for using forests to mitigate and off- set greenhouse gas (GHG) emissions through increased carbon sequestration and the utilisation of forest products and residues. ∗ Corresponding author. Tel.: +353 1 7162245; fax: +353 1 7161152. E-mail address: [email protected] (M. Saunders). For example, the replacement of carbon intensive construction materials with timber-based products and the use of forests or for- est residues for bioenergy production may reduce anthropogenic carbon dioxide (CO 2 ) emissions (Eriksson, 2006). Forest planta- tions, therefore, have the ability to play an important role in the mitigation of, and adaptation to, global climate change. However, management strategies, such as thinning that reduce the amount of standing biomass, may in the short-term compromise rates of car- bon assimilation and negate a dual role for forests for both timber production and carbon sequestration. In Europe, Sitka spruce (Picea sitchensis (Bong.) Carr.) represents an important commercial tree species due mainly to its high pro- ductivity (Berhofer et al., 2003). This is particularly the case in Ireland where Sitka spruce accounts for approximately 50% of the total forest area as either mono-species or mixed stands (National 0168-1923/$ – see front matter © 2012 Elsevier B.V. All rights reserved. doi:10.1016/j.agrformet.2012.01.008
Transcript of Thinning effects on the net ecosystem carbon exchange of a Sitka spruce forest are...

Ta
Ma
b
c
a
ARRA
KSFCNENGE
1
stmdthss
0d
Agricultural and Forest Meteorology 157 (2012) 1– 10
Contents lists available at SciVerse ScienceDirect
Agricultural and Forest Meteorology
jou rn al h om epa g e: www.elsev ier .com/ locate /agr formet
hinning effects on the net ecosystem carbon exchange of a Sitka spruce forestre temperature-dependent
. Saundersa,∗, B. Tobinb, K. Blackb,c, M. Gioriaa, M. Nieuwenhuisb, B.A. Osbornea
University College Dublin, UCD School of Biology and Environmental Science, Belfield, D4, Dublin, IrelandUniversity College Dublin, UCD Forestry, School of Agriculture and Food Science, Belfield, D4, Dublin, IrelandFERS Ltd. 117 East Courtyard, Cabinteely, Dublin 18, Ireland
r t i c l e i n f o
rticle history:eceived 5 July 2011eceived in revised form 4 January 2012ccepted 10 January 2012
eywords:itka spruceorest thinningarbon stocks and fluxeset primary productivityddy covarianceet ecosystem exchangeross primary productivitycosystem respiration
a b s t r a c t
Commercial forest plantations need to be actively managed, through tree removal, in order to improvewood quality, maintain productivity and provide an economic return, although this could compromisean important role for forests in carbon sequestration and greenhouse gas mitigation. The impact of for-est thinning on net primary productivity (NPP) and net ecosystem exchange (NEE) was assessed usinga combination of biometric and eddy covariance (EC) techniques. Two thinning operations were per-formed in close succession, which reduced the basal area of the stand by 17% and 11% and removed atimber volume of 48 m3 ha−1 and 50 m3 ha−1, respectively. Annual rates of NPP ranged from 13.24 (±3.96)to 18.94 (±4.88) t C ha−1 and 13.22 (±3.72) to 17.77 (±5.30) t C ha−1 for the pre- and post-thinning peri-ods, respectively. Estimates of NEE varied between 8.44 (±1.34) to 8.87 (±1.48) t C ha−1 and 6.75 (±1.19)to 10.33 (±1.41) t C ha−1 in the pre- and post-thinning periods. Forest thinning did not have a significantimpact on carbon stocks or fluxes when pre-thinning (2002–2006) and post-thinning (2007–2009) esti-mates of NPP and NEE were compared, however the range of inter-annual variability in NEE increasedafter thinning. The partitioning of annual NEE carbon budgets into gross primary productivity (GPP) andecosystem respiration (Reco) together with an analysis of key physiological parameters suggested that theimpacts of forest thinning are largely dependent on temperature. An expected decrease in GPP after theinitial thinning in 2007 was not observed due, in part, to the higher mean annual air temperatures andincident photosynthetic active radiation (PAR) and a compensatory increase in photosynthesis by theremaining trees. A continual decline in Reco, was observed in the years subsequent to the first thinning
and was attributed to both biomass removal and climatic factors.Inter-annual variations in climate had a significant impact on NEE, GPP and Reco. Annual mean airtemperature, total precipitation and total incident PAR were all shown to influence the processes drivingCO2 exchange. Overall, these results suggest that the impacts of the thinning practices, as implementedin this study, are dependent on climate and under similar conditions are unlikely, in the short-term, tocompromise a role for forest ecosystems in carbon sequestration and greenhouse gas mitigation.
. Introduction
Forest ecosystems represent a significant terrestrial carbontore, where the majority of carbon sequestered is held withinhe woody biomass (Scott et al., 2004). Current forest manage-
ent strategies that involve variable thinning regimes have beenesigned to enhance the timber yield and economic returns overhe length of the forest rotation. In addition, policy-driven research
as identified a potential for using forests to mitigate and off-et greenhouse gas (GHG) emissions through increased carbonequestration and the utilisation of forest products and residues.∗ Corresponding author. Tel.: +353 1 7162245; fax: +353 1 7161152.E-mail address: [email protected] (M. Saunders).
168-1923/$ – see front matter © 2012 Elsevier B.V. All rights reserved.oi:10.1016/j.agrformet.2012.01.008
© 2012 Elsevier B.V. All rights reserved.
For example, the replacement of carbon intensive constructionmaterials with timber-based products and the use of forests or for-est residues for bioenergy production may reduce anthropogeniccarbon dioxide (CO2) emissions (Eriksson, 2006). Forest planta-tions, therefore, have the ability to play an important role in themitigation of, and adaptation to, global climate change. However,management strategies, such as thinning that reduce the amount ofstanding biomass, may in the short-term compromise rates of car-bon assimilation and negate a dual role for forests for both timberproduction and carbon sequestration.
In Europe, Sitka spruce (Picea sitchensis (Bong.) Carr.) represents
an important commercial tree species due mainly to its high pro-ductivity (Berhofer et al., 2003). This is particularly the case inIreland where Sitka spruce accounts for approximately 50% of thetotal forest area as either mono-species or mixed stands (National
2 nd Fo
Frittwtaaartrs1atmvh
elioCidt1tatdmCStpaEoelCoei2i(boGp
stwlinutct
M. Saunders et al. / Agricultural a
orest Inventory, 2007). Plantation forests such as these receiveegular management, including thinning, throughout the rotation,n order to maximise the value of the timber produced. In Irelandhe most common thinning practice used in Sitka spruce planta-ions for the first timber removal is the line and selection technique,here initially every seventh row of trees are harvested followed by
he removal of selected trees on each side of the thinning line (Joycend O’Carroll, 2002). This type of combined selective and system-tic thinning is undertaken for economic reasons and to facilitateccess into the stand while also improving the timber quality of theemaining trees. Subsequent thinnings are purely selective, usinghe access routes created during the first thinning. The thinningegimes applied are commonly derived from the Forestry Commis-ion yield models for forest management (Edwards and Christie,981) and also increasingly from Irish dynamic yield models (Broadnd Lynch, 2006). There are however, site-specific instances wherehe thinning guidelines are not adhered to, such as in areas that
ay be susceptible to windthrow or where it is not economicallyiable to thin. Such instances of low or no-thin management mayave further implications for long-term carbon sequestration.
Biomass removal through forest thinning represents an earlyconomic return that discounts the net profit of the stand over theength of the rotation and increases the volume and economic qual-ty of the remaining trees as a consequence of the re-distributionf resources, such as light, water and nutrients (Thornley andannell, 2000). The thinning process opens the forest canopy result-
ng in modifications in air and soil temperature, vapor pressureeficit, light penetration, intercepted rainfall and soil water con-ent (Norman and Jarvis, 1974; Black et al., 1980; Wang and Jarvis,990; Hale, 2003; Ma et al., 2004; Vesala et al., 2005). Many prac-ical investigations into the silvicultural response of tree growthnd yield to different thinning regimes have been undertaken overhe past two centuries (Nilsson et al., 2010), although the resultsiffer considerably depending on species, geographic location, cli-ate and the timing and intensity of forest thinning (Thornley and
annell, 2000; Homyack et al., 2004; Makinen and Isomaki, 2004;ullivan et al., 2006; Nilsson et al., 2010). In addition, the predic-ion of growth and yield responses to forest management may beroblematic as many models may not be adequately calibrated for
particular management practice (Roberts and Harrington, 2008).ven fewer studies have investigated the impacts of forest thinningn both the long-term carbon pools as well as the more transientcosystem scale fluxes between these pools. The establishment ofong-term monitoring networks, such as Fluxnet, Ameriflux andarboEurope-IP, have considerably improved our understandingf ecosystem scale carbon fluxes (Baldocchi et al., 2001; Dolmant al., 2008). Several flux based studies have reported on the signif-cant impacts of forest disturbance through harvest (Amiro et al.,006; Payeur-Poirier et al., 2011) fire (Mkhabela et al., 2009) insect
nfestation (Brown et al., 2011) and extreme climatic variabilitySchwalm et al., 2010; Keith et al., 2011) on ecosystem scale car-on budgets. However, there is a need to further assess the impactsf forest management practices on both timber production andHG mitigation given the potential multi-functional role of forestlantations.
Forest thinning is initially expected to have a negative impact ontand-level productivity, as the removal of aboveground photosyn-hetic material may reduce potential rates of carbon assimilation,hile the decomposition of woody debris may increase carbon
osses from the ecosystem (Nilsson et al., 2010). The extent of thiss, however, likely to depend on the intensity and type of thin-ing management applied and how rapidly the growth and carbon
ptake of the remaining trees can compensate for any reduction inhe productivity of the stand. Furthermore, the role of inter-annuallimatic variability on the physiological response of a forest stando thinning is also of particular importance. Year to year variationsrest Meteorology 157 (2012) 1– 10
in key climatic parameters, such as temperature, photosyntheticactive radiation (PAR) and precipitation that drive rates of net standcarbon uptake and respiratory carbon losses, may alter the responseof a forest to thinning.
Additional information is also needed on the key physiologi-cal and biochemical processes that underpin the carbon cycle inforests and how they are affected by management practices. Notonly are decreases in net canopy photosynthesis and thus grossprimary productivity (GPP) likely with such disturbance, but theautotrophic (Ra) and heterotrophic (Rhet) components of ecosys-tem respiration (Reco) may also be altered due to a reduction inmaintenance respiration, decomposition of harvest residues andchanging litterfall and root exudate supply (Amiro et al., 2006;Kowalski et al., 2004). Furthermore, changes in nutrient availabilityand input after thinning (Vesterdal et al., 1995; Blanco et al., 2009)may modify the contribution of both GPP and Reco to net ecosys-tem carbon exchange (NEE). The temporal scale over which theseprocesses change will also influence both the short and long termcarbon sequestration potential of forests and may have additionalimplications for forest management. Other flux-based studies havereported conflicting effects of forest thinning, with neutral (Vesalaet al., 2005) or negative (Kolari et al., 2004; Scott et al., 2004)impacts on ecosystem scale carbon fluxes immediately after thin-ning, while Sullivan et al. (2008) reported a decrease in soil CO2efflux in the first year following thinning.
In this paper, we assess the impacts of forest thinning onthe carbon budget through both biometric and micrometeorologi-cal measurement techniques. Measurements of standing biomass,biomass increment and canopy phenological traits are reportedin addition to the surface exchange of CO2 measured using eddycovariance (EC) techniques. Our principal hypothesis was that for-est thinning and the associated removal of biomass would resultin a decrease in both the CO2 sink strength and the net primaryproductivity (NPP) of the ecosystem. It was also expected that theapplication of two thinning cycles in relatively close successionwould limit the recovery of net canopy photosynthesis and carbonaccumulation when compared to pre-thinning levels. The informa-tion presented in this paper provides an assessment of the impactof forest thinning on C-sequestration and addresses the potentialconsequences of the multifunctional role of forests in both GHGmitigation and timber production.
2. Materials and methods
2.1. Study site
Micrometeorological and biometric measurements have beenmade since 2002 on a Sitka spruce first rotation plantation (DooaryForest), growing on a wet mineral soil located in Co. Laois in the Irishmidlands (52◦57′N, 7◦15′W; 30-year mean temperature 9.3 ◦C; 30-year mean precipitation 850 mm; altitude 260 m). The forest is stateowned and managed by Coillte, a semi-state company involvedin forest-based land management. The forest stand was plantedin 1988 with a stocking density of 2300 stems per hectare and ismade up of two adjacent compartments covering an approximatetotal area of 42 ha. All site-specific characteristics and measuredvariables can be found in Table 1.
The first thinning event took place between December 2006and January 2007 using a line and selection technique. Trees fromall size classes were harvested and a thinning ratio of 0.85 wasapplied, based on the mean basal area of trees harvested in relation
to the mean basal area of trees remaining in the stand. Trees werefelled, de-limbed and sectioned using a mechanical harvester. A for-warder was then used to collect the harvested timber, which wastransported to the forest edge from where it was removed from the
M. Saunders et al. / Agricultural and Forest Meteorology 157 (2012) 1– 10 3
Table 1Biometric and micrometeorological flux characteristics of the Dooary forest stand (2002–2009).
Measured variables 2002 2003 2004 2005 2006 2007 2008 2009
Tree density (number ha−1) 2367 2367 2367 2367 2367 1768 1768 1345Basal area (m2 ha−1) 31.34 33.64 40.29 46.83 48.16 39.82 43.90 39.25Leaf area index (m2 m−2) 4.09 4.41 5.11 5.77 5.94 4.85 5.28 4.61Tree height (m) 7.6 8.9 9.7 11.3 11.9 13.1 13.7 14.6EC measurement height (m) 15 15 15 18 18 18 21 21Live biomass increment (t C ha−1) n.d. 10.26 15.54 10.65 15.99 −13.03 11.29 −11.13Dead biomass increment (t C ha−1) n.d. −1.00 0.87 0.6 −0.03 −2.45 −0.36 −0.45Litterfall (t C ha−1) n.d. 3.55 2.10 2.23 1.81 1.71 1.21 1.33Fine Root Production (t C ha−1) n.d. 0.43 0.43 0.48 0.49 0.44 1.08 1.08Thinning removal (t C ha−1) 0 0 0 0 0 9.92 0 10.49Thinning residuea (t C ha−1) 0 0 0 0 0 17.82 0 16.45NPP (t C ha−1 yr−1)b,c n.d. 13.24 (±3.96) 18.94 (±4.88) 13.96 (±7.73) 18.26 (±7.32) 14.41 (±5.09) 13.22 (±3.72) 17.77 (±5.30)NEE (t C ha−1 yr−1)d,e 8.45 (±1.66) 8.87 (±1.48) 8.44 (±1.34) 8.72 (±1.60) 8.81 (±1.09) 10.33 (±1.41) 6.75 (±1.19) 8.14 (±1.94)GPP (t C ha−1 yr−1)d 21.22 22.68 22.65 23.97 25.02 24.75 19.49 19.04Reco (t C ha−1 yr−1)d 12.77 13.81 14.21 15.25 16.21 14.42 12.74 10.90
a Includes litter associated with thinning residues.b Data derived from biometric measurements.
lation
ssocia
stdahNttvdl
2
(o((cMNmqiibsWsabiomsac
2
oe
c Values in parenthesis indicate the standard error associated with the NPP calcud Data derived from EC measurements.e Values in parenthesis indicate the range based on the 95% confidence interval a
ite and taken to the local sawmill. Residues produced during eachhinning operation (all non-timber material that was not removeduring the harvest) were placed in the harvested rows to produce
brash mat that was used to reduce soil disturbance due to thearvesting machinery. A second, selective thinning took place inovember 2008 where generally larger trees were removed from
he stand resulting in a thinning ratio of 1.37. During the secondhin the harvester and forwarder accessed the stand using the pre-iously created thinning lines in order to minimise any further soilisturbance and compaction, as is normal practice on soils of low
oad bearing capacity (Booth et al., 2009).
.2. Meteorological measurements
An automated weather station controlled by a CR10X dataloggerCampbell Scientific, Shepshed, England) was used to record mete-rological parameters, including air temperature, relative humidityHMP45C, Vaisala, Helsinki, Finland), wind speed and directionWind Monitor, RM Young, Traverse City, Michigan, USA), pre-ipitation (Tipping bucket rain gauge, RM Young, Traverse City,ichigan, USA), net radiation (NR-Lite, Kipp & Zonen, Delft, Theetherlands), incident irradiance (Quantum sensor, Skye Instru-ents, Llandrindod, Wales), canopy reflected irradiance (Skye
uantum sensor, installed facing the forest canopy), transmittedrradiance (measured using an array of Skye quantum sensorsnstalled at the forest floor, located within the remaining forestlock between the thinning rows), total, direct and diffuse photo-ynthetically active radiation (BF3, Skye Instruments, Llandrindod,
ales), soil heat flux (HFP01 Hukseflux, Delft, The Netherlands),oil temperature (105E, Campbell Scientific, Shepshed, England)nd soil moisture content (CS616 Water Reflectometer, Camp-ell Scientific, Shepshed, England). All atmospheric sensors were
nstalled above the forest canopy and were maintained at a heightf approximately 2 m below the EC sensors. Soil temperature waseasured using thermocouples buried at 10 cm intervals from the
oil surface to a depth of 1 m. Soil heat flux plates were buried at depth of 5 cm, and soil water reflectometers measured the waterontent of the soil between 0 and 20 cm.
.3. Biometric measurements
Biometric surveys were undertaken annually during winterr non-growing periods (November–March) on four permanentlystablished 0.05 ha plots within the footprint of the EC flux tower.
.
ted with the sampling uncertainty.
Tree and crown height were measured using a laser hypsometer(Laser Technology Inc., CO, USA) and stem diameter at 1.3 m (dbh)was calculated from the circumference measured using a 1 m girthtape. During the establishment of the biomass plots all measuredtrees were marked with paint at 1.3 m to ensure that subsequentdbh measurements were made at the same point on the stem ofindividual trees. The change in living biomass (�B; Eq. (1)) wasdetermined from annual biometric surveys of the fixed plots withinthe forest stand, where the tree height and diameter at breast heightof individual trees were measured and the living biomass was cal-culated using site-specific biomass equations for Sitka spruce (Blacket al., 2007; Tobin and Nieuwenhuis, 2007). Total stand biomassincluded all aboveground biomass and belowground root materialto a minimum diameter of 2 mm. Attached dead branch biomass(AGD) was calculated from a model derived from data in Tobin et al.(2006), supplemented with more recent site-specific data. Fine rootdata from 2002 to 2007 were taken from Saiz et al. (2006) and Blacket al. (2007) while estimates for 2008 and 2009 were determinedusing in-growth cores sampled during the current study. Litterfalldata were derived from monthly collections made at the site since2003.
Estimates of leaf area index (LAI) were determined by convertingneedle biomass to a projected stand level leaf area using a meanhalf-surface specific leaf area from scanned branches taken fromdestructive biomass samples located outside of the inventory plots(Tobin et al., 2006). Inventory based estimates of annual NPP wasdetermined as:
NPP = �B + �AGD + Da + Db + Threm + Thres (1)
where �B is the change in the living biomass, �AGD is the changein dead material still attached to the tree, Da is aboveground lit-terfall, Db is belowground fine root production, Threm accounts forthe removal of biomass in harvested wood and Thres represents theharvest residues remaining in the forest. Losses due to herbivory,volatile organic compound emissions, or dissolved carbon losseswere not accounted for in this study.
2.4. Micrometeorological measurements
Measurements of NEE were made using the closed path EC
technique. The instrumentation consisted of a three dimensionalsonic anemometer (Solent R3, Gill Instruments, Lymington, UK)and a closed path infra-red gas analyser (LI-7000, LI-COR Lin-coln, Nebraska, USA). The EC data were collected using the Edisol
4 nd Fo
sCo1ndtfbFtctH
talo(sciwflhtaatafmt9x4ffcc
s(ntt
wffladm
2
opGm(Tm
M. Saunders et al. / Agricultural a
ystem as described by Moncrieff et al. (1997) and the fluxes ofO2 (Fc), water vapor, latent and sensible heat were calculatedver 30 minute periods using the EdiRe software (Moncrieff et al.,997). The gas analyser was calibrated bi-weekly, using oxygen freeitrogen to set the zero calibration and a 401 �mol mol−1 CO2 stan-ard to set the span of the gas analyser. Additional information onhe instrumentation, data processing and flux calculations can beound in Black et al. (2007). Net ecosystem exchange of CO2 (FNEE)etween the forest and the atmosphere was calculated as the sum ofc and the change in CO2 storage within the forest canopy beneathhe EC instrumentation. In this study, canopy CO2 storage was cal-ulated from the change in the mixing ratio of CO2 measured athe height of the EC instrumentation (Morgenstern et al., 2004;umphreys et al., 2006).
The study site used for EC measurements is comprised ofwo adjacent forest compartments. The first compartment haspproximate dimensions of 516 m × 500 m (∼25.8 ha), with theongest edge orientated in the east-west direction, while the sec-nd compartment has approximate dimensions of 650 m × 250 m∼16.2 ha), with the longest edge orientated in the north-outh direction. The flux tower is located in the north-easternorner of the first compartment in order to avail of the max-mum possible fetch from the predominant south westerly
ind direction. Footprint analyses were applied based on theux footprint model of Kormann and Meixner (2000) and thealf-hourly flux measurements were discarded when greaterhan 10% of the measured flux was derived from outside therea of interest. The peak location of the flux footprint (xmax)nd the scaled cumulative flux footprint, representing the dis-ance from which 90% of the flux was derived (xR90), werelso determined for a range of wind vectors based on theootprint parameterisation model of Kljun et al. (2004). The
aximum possible fetch, xmax, and xR90 for each wind vec-or are as follows; 0–90◦ (250 m; xmax 173 m; xR90 470 m),0–180◦ (930 m; xmax 171 m; xR90 467 m), 180–270◦ (585 m;max 189 m; xR90 516 m), 270–365◦ (250 m; xmax 170 m; xR9066 m). The greatest amount of data rejection based on theootprint analyses occurred when the flux data were derivedrom a northerly wind direction; however such conditions onlyonstituted a relatively small amount (∼8%) of the total dataollected.
The influence of friction velocity (u*) on nocturnal NEE mea-urements was assessed using the methodology of Humphreys et al.2006) and a u* threshold for each dataset was determined. Noctur-al NEE data were rejected when the measured u* was lower thanhe assigned u* threshold as these data were assumed to underes-imate nocturnal ecosystem respiration.
The quality control procedures associated with the EC flux dataere derived from the CarboEurope-IP directive and included tests
or stationarity and integral turbulence. In both cases the data wereagged according to the QA/QC directive as being of good, accept-ble or poor quality. Poor quality data were not rejected from theata set but were not included in the parameterisation of gap-fillingodels.
.5. Flux analysis and gap-filling
Short gaps of 0.5–3 h in duration within the EC data as a resultf data rejection, equipment calibration, power loss and foot-rint analysis were filled using linear interpolation techniques.aps greater than 3 h in duration were filled using semi-empirical
odels as described in Falge et al. (2001) and Moffat et al.2007). Ecosystem respiration was modeled using the Lloyd andaylor (1994) model (Eq. (2)) describing the relationship betweeneasured nocturnal NEE and the corresponding air temperature.
rest Meteorology 157 (2012) 1– 10
Daytime ecosystem respiration was determined using this relation-ship and daytime air temperatures.
Reco = R10eE0[(1/(283.15−T0))−(1/(T−T0))] (2)
where R10 is the respiration rate at 10 ◦C, E0 is a derived coefficientfor ecosystem respiration, T is air temperature (K) measured abovethe forest canopy and T0 is a best-fit temperature value (K). Thisrelationship was fitted to the data using sum of squares non-linearoptimisation.
GPP was derived by initially subtracting the daytime ecosystemrespiration from the daytime measured NEE. The daytime GPP wasthen subdivided into 5 ◦C temperature classes and modeled usingthe light response function described in Eq. (3) (Leverenz, 1995).
GPP = {(˛Q + Amax) − √[(˛Q + Amax)2 − (4�Q˛Amax)]}
2�(3)
where Q is the incident photon irradiance (�mol [photon] m−2 s−1), ̨ is the net stand quantum (photon) yield based on incident
irradiance (mol [photons] mol [CO2]−1), Amax is the maximumassimilation rate (�mol [CO2] m−2 s−1) and � is the convexity coef-ficient. This relationship was fitted to the data using the sum ofsquares non-linear optimisation function.
In order to reduce the uncertainty associated with the parame-terisation of the gap-filling models due to the thinning events, thedata used to constrain the gap filling models were derived fromindividual annual data sets and specific pre- and post-thin peri-ods. For example, in 2006 the gap filling model parameters werefitted and applied to the EC data collected between January andNovember in the pre-1st thin period, while the gap filling modelparameters applied to EC data collected in December 2006 werederived from post-1st thin data collected in 2007. In 2008, thegap filling model parameters were fitted to the EC data collectedbetween January and October 2008 (data collected prior to the 2ndthin) while the gap-filling parameters applied to the EC data col-lected in November and December were derived from the 2009 fluxdata (post-2nd thin).
The net stand physiological characteristics, such as quantumyield (˛), convexity coefficient (�) and maximum CO2 assimila-tion rate (Amax) were determined by fitting the Leverenz (1995)light response relationship (Eq. (3)), using the sum of squares non-linear optimisation function applied to the high quality flux datameasured during the growing season, where the air temperatureranged between 5 and 10 ◦C. The apparent and inherent quantumyields were determined using incident and absorbed irradiance,respectively.
2.6. Uncertainty estimates associated with NEE measurements.
The sources of uncertainty within annual estimates of NEE forthis site are detailed in Black et al. (2007) and are based on theuniform systematic, selective systematic and sampling uncertaintyerrors presented by Goulden et al. (1996).
2.7. Statistical analysis
The impacts of forest thinning on the response variables NEE,GPP, Reco and NPP were analyzed using a Chi square test for gener-alised linear models (GLMs). Replicated control and treatment plotswith respect to the forest thinning management and the EC tech-nique were not available during this study, so the data were divided
into two treatment periods, a “pre-thinning” (2002–2006) and a“post-thinning” (2007–2009) period, for subsequent analyses.The effects of inter-annual climatic variation on the responsevariables (NEE, GPP, Reco and NPP) were also tested using GLMs, in

M. Saunders et al. / Agricultural and Forest Meteorology 157 (2012) 1– 10 5
Fig. 1. Annual variation in GPP, Reco and NEE (a), mean annual air temperature (b),total annual photosynthetic active radiation (c), and total annual precipitation (d),at the Dooary forest site from 2002 to 2009. The dashed and dotted horizontallr
wt
C
3
3
oprctea
pdmy
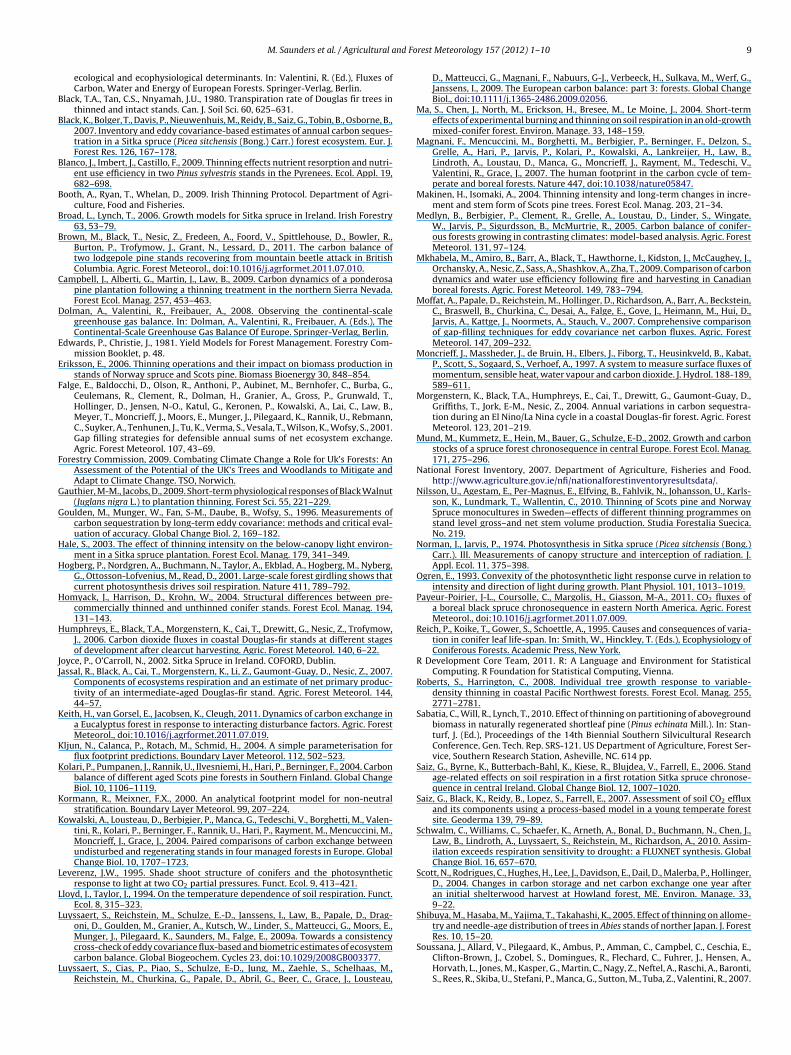
Fig. 2. The relationship between mean annual air temperature and NEE (a) [pre-thin: y = 0.467x + 4.005: R2 = 0.37; post-thin: y = 3.295x − 24.209: R2 = 0.81], GPP (b),
in a smaller reduction in GPP (3.7%) compared to the reduction in
ines (graphs b–d) represent the pre- and post-thinning mean for each variable,espectively.
hich mean annual air temperature, total annual precipitation andotal incident PAR were tested separately in relation to each factor.
All analyses were conducted using R software (R Developmentore Team, 2011).
. Results
.1. Climate variations from 2002 to 2009
Mean annual air temperature (Fig. 1b) ranged from 9.6 to 10.5 ◦Cver the duration of this study. The mean air temperature for there-thinning period (2002–2006) was 10.0 ± 0.2 ◦C with a smalleduction (1%) for the post-thinning period (2007–2009). The fluxomponents, GPP, Reco and NEE (Fig. 1a) followed a similar patterno the inter-annual fluctuations in mean air temperature. The high-st values for NEE, were associated with the highest mean annualir temperatures (Fig. 1b) and total incident PAR (Fig. 1c).
Total incident PAR (Fig. 1c) showed similar annual values in there-thinning years (6192–6258 mol m−2) with greater inter-annual
ifferences in the post-thinning years (5135–6414 mol m−2). Theean incident PAR was, on average 7.3% lower in the post-thinningears with a considerable reduction (17.5%) in 2008 relative to the
[pre-thin: y = 5.176x − 28.495: R2 = 0.89; post-thin: y = 6.422x − 42.483: R2 = 0.99]and Reco (c), [pre-thin: y = 4.709x − 32.500: R2 = 0.87; post-thin: y = 3.127x − 18.274:R2 = 0.77] for the pre-thin (circles) and post-thin (stars) periods.
pre-thinning mean. Transmitted radiation increased by 51% and55% after the first and second thinning events, respectively (Fig. 5).
There was considerable variability in the total annual precipita-tion (Fig. 1d), which ranged from 742.6 mm to 1132.1 mm, with anaverage increase of 15.2% in the post-thinning years.
3.2. Inter-annual climatic control on NEE, GPP and Reco
The components of NEE, GPP and Reco increased progressivelyup to the first thinning event (Table 1; Fig. 1a) and were associatedwith increasing air temperatures (Fig. 1b). Inter-annual climaticvariability had a significant effect on NEE, GPP and Reco in both thepre and post-thinning years. Temperature had a significant effecton all flux components, NEE (P = 0.003), GPP (P < 0.001), and Reco
(P = 0.001). Variations in PAR also had a significant effect on NEE(P < 0.001) and GPP (P = 0.001), while precipitation only influencedReco (P = 0.006).
In order to compare the role of inter-annual temperature vari-ability on the response of the forest stand to thinning, linearregression between the flux components (NEE, GPP and Reco) andmean air temperatures were used (Fig. 2). The measured post-thindata were compared with the linear extrapolation of the pre-thinrelationship between the net stand carbon dioxide flux compo-nents and the mean annual air temperature, given the absence ofthinning. Based on the magnitude of the difference between themeasured post-thin data and the predicted response of the foreststand in the absence of thinning, the first thinning event resulted
Reco (13.9%), leading to a 16.2% increase in NEE in this year (2007).In the year subsequent to the first thinning event (2008), GPP wasreduced by 8.9% and was associated with lower air temperatures

6 M. Saunders et al. / Agricultural and Forest Meteorology 157 (2012) 1– 10
Fig. 3. Annual variation in NPP (circles), NEE (triangles), dead biomass (squares),fi(fi
aiiRo
3
mtN((awfvw
1apeiNwwpti
wae1p
pst
Fig. 4. Net ecosystem carbon exchange at the Dooary forest stand from 2002 to2009. Black shading denotes the daily loss of carbon through ecosystem respiration,gray shading denotes carbon uptake through GPP. The solid black line indicates thecumulative NEE-based carbon sink, while the dashed line indicates the cumulative
ne root turnover (diamonds), litterfall (hexagons) and heterotrophic respirationstars) for the Dooary forest stand. The vertical lines indicate the years in which therst (dashed) and second (dotted) thinning events were applied.
nd a lower incident PAR (Fig. 1). However, only a small reductionn Reco was observed (1.2%) resulting in a reduction in NEE of ∼21%n this year. After the second thinning event, both GPP (9.9%) andeco (13.9%) were further reduced, resulting in a reduction in NEEf 4.1%.
.3. Thinning effects on net ecosystem exchange
The Dooary forest acted as a net carbon sink during the experi-ental period with the NEE sink strength ranging from 6.75 (±1.19)
o 10.33 (±1.41) t C ha−1 yr−1 (Table 1; Fig. 3). Prior to thinningEE showed little inter-annual variation, and ranged from 8.44
± 1.34) to 8.81 (±1.09) t C ha−1 yr−1, with a mean NEE of 8.66±1.43) t C ha−1 yr−1. After thinning NEE showed increased vari-bility, ranging from 6.75 (±1.19) to 10.33 (±1.41) t C ha−1 yr−1,ith a mean value of 8.41 (±1.42) t C ha−1 yr−1. No significant dif-
erences were detected between the mean pre and post-thinningalues of NEE, however the range of inter-annual variability in NEEas enlarged during the post-thinning period (Fig. 3).
Net primary productivity ranged between 13.22 (±3.72) and8.94 (±4.88) t C ha−1 yr−1 across all years (Table 1; Fig. 3),lthough no significant differences were detected between there (16.10 ± 5.97 t C ha−1) and post thinning (15.13 ± 4.70 t C ha−1)stimates of mean NPP. The inter-annual variability in NPP andts constituent components are shown in Fig. 3 in addition toEE and estimates of heterotrophic respiration (Rhet), whichas determined as the difference between NPP and NEE. Thereas considerable inter-annual variability in NPP and Rhet in there-thinning years, the dead biomass attached to the tree and lit-erfall both declined after thinning while fine root turnover (FRT)ncreased considerably after thinning.
Seasonal patterns of NEE were similar across all years (Fig. 4),ith peak values for carbon uptake between 14 and 19 g C m−2 d−1
ssociated with maximum mean daily temperatures and the high-st irradiances. The highest carbon losses ranged between 7 and3 g C m−2 d−1 and were associated with higher temperatures anderiods of peak plant productivity (Fig. 4).
The cumulative annual carbon sink showed distinct seasonalatterns with net carbon gains during the summers/growing sea-ons and carbon losses dominating winter periods. An estimate ofhe net biome productivity (NBP) of the forest over the study period
NBP-based carbon sink, post thinning. The dashed vertical line indicates the timingof the first thin and the dotted vertical line indicates the timing of the second thin.
was determined by offsetting the carbon losses associated withtimber removal from the site after thinning. The carbon removals,shown in Fig. 4, reduced the carbon sink strength of the forest from68.51 t C ha−1 to 48.1 t C ha−1 over the study period.
The apparent and inherent quantum yield (˛) and the convexitycoefficient (�) of the stand for a 5–10 ◦C temperature range weredetermined by fitting the Leverenz (1995) light response function(Eq. (3)) to the high quality daytime (GPP) flux data. Prior to thin-ning ˛apparent varied from 0.031 to 0.038 mol CO2 mol−1 photon butincreased to 0.060 mol CO2 mol−1 photon after the first thin (Fig. 5).The inherent quantum yield followed a similar inter-annual patternand showed little variation from the ˛apparent values in any givenyear. In 2008 ˛apparent decreased to 0.051 mol CO2 mol−1 photonand in 2009 returned to pre-thin levels (0.035 mol CO2 mol−1 pho-ton). The convexity coefficient prior to thinning varied from 0.46 to0.49, increasing to 0.58 after the first thinning event (Fig. 5).
Values for ecosystem respiration at a temperature of 10 ◦C(Reco10), determined by fitting the Lloyd and Taylor (1994) modelto the nocturnal flux data, ranged from 2.94 �mol CO2 m−2 s−1
to 4.24 �mol CO2 m−2 s−1 across all years, with the higher valuesobserved prior to the thinning event. Values of temperature-dependent Reco10 followed a similar inter-annual pattern to anumber of biometric parameters, including LAI (Fig. 5).
4. Discussion
The ability of commercial forest plantations to sequester car-bon may be reduced under active management strategies, suchas thinning, which are designed to maintain timber productionthroughout the length of the forest rotation. Estimates of both NEEand NPP for the Dooary study site are broadly comparable to othersimilar forest types across Europe (Berhofer et al., 2003; Medlynet al., 2005; Forestry Commission, 2009), however, they representone of the most productive forest types so far reported for thisregion (Van Dijk and Dolman, 2004; Luyssaert et al., 2009a,b). Theaverage NEE at the Dooary forest stand over the eight year studyperiod was 8.39 (±1.46) t C ha−1, approximately 9% higher than theaverage NEE reported for a Sitka spruce forest in Scotland of sim-ilar age and management (Forestry Commission, 2009). Althoughthe Scottish site was of a lower yield class and associated with a
different soil type, it highlights the significant potential for carbonsequestration through Sitka spruce afforestation in Ireland and theUnited Kingdom.
M. Saunders et al. / Agricultural and Fo
Fig. 5. Annual variation in ecosystem respiration normalised to 10 ◦C (stars),leaf area index (diamonds), transmitted irradiance (circles), convexity coefficient(crosses), net stand apparent quantum yield (triangles) net stand inherent quantumys
sccrhire2tsd
tibtat
Sakhalin fir plantation (Shibuya et al., 2005) and increased shoot
ield (squares). The vertical lines indicate the years in which the first (dashed) andecond (dotted) thinning events were applied.
The impacts of thinning practices on both NEE and NPP at thetand level will depend on the thinning intensity, site-specificlimatic factors and the extent to which the remaining treesan compensate, in terms of enhanced carbon uptake, for thoseemoved. Previous reports have indicated that forest thinning canave both a positive or neutral effect on net stand productiv-
ty and can also alter biomass allocation, as the removal of treeseduces intraspecific competition for resources, such as light, nutri-nts and water (Valinger, 1993; Mund et al., 2002; Shibuya et al.,005; Vesala et al., 2005; Sabatia et al., 2010). In the current study,he thinning managements applied reduced the cumulative carbonink of the stand due to the export of carbon in timber (Fig. 4), butid not significantly affect NPP, NEE, GPP or Reco.
It might have been expected that the removal of biomass fromhe stand and the disturbance of the forest canopy would resultn significant changes in NEE by altering both GPP and Reco as haseen observed in forests (Amiro et al., 2010) and grassland ecosys-
ems (Soussana et al., 2007) when clear-fell harvest and silage cutsre taken, for example. In this study inter-annual variability inemperature was, in fact, shown to have a greater impact on therest Meteorology 157 (2012) 1– 10 7
components of NEE than any changes in the physical structure ofthe stand due to thinning (Fig. 2). Both GPP and Reco were positivelycorrelated with air temperature in the pre and post-thinning peri-ods (Fig. 2), and the relative impact of forest thinning was shownto be temperature dependant. For example, based on the slope ofthe linear regressions (Fig. 2) there is evidence that the magnitudeof the reduction in GPP is greatest at low temperatures after thin-ning. A possible explanation for this is that thinning results in theincreased exposure of a greater proportion of the canopy foliage tosub-optimal temperatures, which in turn results in a reduction instand level GPP.
The greatest reductions in Reco were observed directly after eachthinning event, which may be due to the changing contribution ofboth autotrophic and heterotrophic respiration to Reco, associatedwith both biomass removal (Anderson-Teixeira et al., 2011) and acombined reduction in GPP (Woodward et al., 2010).
In this study, the impact of thinning could have either a neu-tral, negative or positive effect on NEE depending on temperature,which is the most important climatic factor at this forest site (Fig. 2).More information is required to adequately evaluate the influenceof this type of forest management on net stand carbon assimilationacross a broader geographical range, as the impacts of inter-annualclimatic variability need to be identified first, especially wheremulti-year eddy-covariance data are considered.
Forest thinning practices are designed to open up the forestcanopy, increasing light penetration and reducing the proportion ofphotosynthetically competent material that was previously light-limited. In this study the increase in transmitted light after thinning(Fig. 5) was consistent with similar studies on Sitka spruce (Hale,2003). The first thinning event resulted in an increase in both theapparent and inherent quantum yield and the convexity coefficientof the stand, for a particular temperature class (Fig. 5), but didnot alter the difference between the apparent and inherent quan-tum yield for any given year (Fig. 5). This indicates that changesin photosynthetic efficiency were not due to an increase in lightabsorption but due to an inherent change in the photosyntheticefficiency of the remaining trees. The increase in the inherent quan-tum yield and the convexity coefficient of the stand (Fig. 5) maybe due to an increase in the photosynthesis of both existing andnew needles (Leverenz, 1995; Ogren, 1993; Reich et al., 1995) and acorresponding reduction in intraspecific competition for resourcessuch as light, nitrogen and water coupled with the improved micro-climatic conditions, including an increase in air temperature withinthe forest canopy (Vesala et al., 2005). Increases in leaf level photo-synthesis after thinning have also been reported for a paper birchstand (Wang et al., 1995) and a black walnut stand (Gauthier andJacobs, 2009), and were attributed to an increase in light penetra-tion and foliar nitrogen concentrations within the canopy.
The second thinning event did not stimulate a similar photo-synthetic response (Fig. 5) that, we suggest, is a consequence of theway in which the thinning operations were undertaken. The first,predominantly systematic thinning event, removed entire rows oftrees increasing the availability of resources to a greater number oftrees in comparison to the second, selective thinning, where onlyselect individual trees within the stand would have been affected.
The increased availability of resources after thinning has alsobeen shown to alter tree allometry and contribute to the enhancedNPP of forest ecosystems (Valinger, 1993; Aber et al., 1998; Mundet al., 2002; Magnani et al., 2007; Campbell et al., 2009). Anincrease in light penetration and nitrogen availability after thin-ning enhanced growth in the lower crown of a Scots pine forest(Valinger, 1993), increased needle survival and production in a
expansion and total leaf area in a loblolly pine plantation (Tanget al., 1999). In addition, thinning may alter the needle-age distribu-tion of a forest canopy favoring the production of new needles lower

8 nd Fo
itHml
odcrbbbratsARv(ew(ycacsotbctrtwts(d
rn2ysbta4ss5sDmtdmpwtnce
M. Saunders et al. / Agricultural a
n the canopy that could contribute to a compensatory increase inhe photosynthetic response at the stand level (Reich et al., 1995).owever, such responses were not directly observed in the bio-etric surveys undertaken and might be expected to occur over a
onger timeframe than reported in the present study.Estimates of NPP were consistently higher than NEE through-
ut this study, but the year-to-year trends of both were markedlyifferent (Table 1; Fig. 3). The differences between NPP and NEEan be attributed to carbon losses through heterotrophic respi-ation (Rhet) and, based on this definition, the data suggest thatoth prior to thinning and after the thinning managements hadeen applied, there was a large degree of variability in Rhet. Car-on losses through Rhet have been shown to vary significantly inesponse to both changing environmental variables and seasonalnd annual variations in photosynthesis, carbon substrate produc-ion and utilisation, and total above and below ground carbontocks (Hogberg et al., 2001; Jassal et al., 2007; Saiz et al., 2007;nderson-Teixeira et al., 2011). In addition, carbon losses througheco have been shown to be more sensitive to inter-annual climaticariability than photosynthetic assimilation in coniferous forestsMorgenstern et al., 2004; Jassal et al., 2007). In this study the great-st variation in Rhet prior to thinning was observed in the yearshere the largest increment in total live biomass was recorded
2004 and 2006) resulting in the variation in NPP observed in theseears (Table 1; Fig. 3). Climate-dependent increases in biomass,oupled with changing above and below ground phenological char-cteristics and variation in the mobilisation and utilisation of storedarbohydrates, may have stimulated an increase in the decompo-ition of soil organic carbon in these years. The reduction in Rhetbserved in the year after the first thinning event is most likely dueo changing biometric components, such as the reduction in liveiomass associated with a systematic thinning event, rather thanlimate, as the highest mean annual temperatures were recorded inhis year, which might otherwise have been expected to increaseespiratory carbon losses (Fig. 2). Furthermore, the second selec-ive thinning event did not stimulate a similar response, and Rhetas observed to continually increase in the years after the first
hinning event, possibly due to both the recovery of live biomasstocks, including an increase in fine root production after thinningTable 1; Fig. 3) and also because of short-term increases in theecomposition of the residual material left after thinning.
The beneficial influence of forest thinning on tree growthesponses in coniferous forest stands has been highlighted in aumber of studies (Makinen and Isomaki, 2004; Sullivan et al.,006; Roberts and Harrington, 2008). The Forestry Commissionield models (Edwards and Christie, 1981) suggest that a Sitkapruce stand with a yield class of 24 would produce a total tim-er volume of approximately 84 m3 ha−1 in the first and secondhinning events, respectively. In this study, the first thinning eventpplied to the Dooary forest stand removed a timber volume of8 m3 ha−1 (42% lower than prescribed by the Forestry Commis-ion yield models), while the second thinning, applied in closeuccession to the first, removed a timber volume of approximately0 m3 ha−1 (40% lower than prescribed by the Forestry Commis-ion yield models). The reduced thinning intensity applied at theooary forest represents the site-specific prescriptive manage-ent associated with highly productive sites in Ireland, where light
hinnings are applied at a greater frequency as dictated by theegree of forest productivity. In addition, lighter initial thinningsaintain the material to supply brash mat construction ensuring
rotection against soil damage during future management eventshile also minimising the risks associated with windthrow. Both
he biometric and micrometeorological data suggest that the thin-ing activities applied in this study had little impact on short-termarbon sequestration, while climatic variables had a stronger influ-nce on carbon uptake at this site. The reduction in the cumulative
rest Meteorology 157 (2012) 1– 10
carbon sink strength of these forests due to the carbon exported intimber may, however, be offset by the utilisation of thinning prod-ucts or residues as a replacement for fossil fuels or more carbonintensive building materials.
5. Conclusions
This study investigated the impacts of forest thinning on stand-ing carbon stocks and surface to atmosphere carbon fluxes. Thethinning events did not have a significant effect on rates of car-bon sequestration at this site, when pre and post thinning datawere compared, however thinning increased the range of inter-annual variability in NEE. The cumulative carbon sink strengthwas reduced when carbon exports through timber removal wereaccounted for and any increases in dissolved carbon losses, forinstance, that may be associated with forest thinning would needto be considered when calculating a more accurate estimate of theNBP of this ecosystem.
The impacts of the thinning events applied in this study weredependant particularly on temperature, although all climatic vari-ables examined were shown to have a greater impact on themeasured carbon pools and fluxes when compared to the distur-bance associated with biomass removal through forest thinning.The expected decrease in NEE after thinning was not observed,due largely to the magnitude of the thinning management appliedand the redistribution of carbon sources and sinks within the for-est ecosystem, in particular the temperature related compensatoryincrease in photosynthesis by the remaining trees within the stand.The continuation of flux measurements at this site will providemore detailed information regarding the impacts of inter-annualclimatic variability on a modified forest stand.
Acknowledgments
The authors would like to thank the National Council for ForestResearch and Development (COFORD) for providing funding for thisresearch, Coillte for providing land access and forest managementinformation, MET Eireann for additional meteorological data andMr. D. Farrell for his continual logistical support in the field. Theauthors would also like to acknowledge the extensive contributionmade to this paper by the review panel of Agricultural and ForestMeteorology.
References
Aber, J., McDowell, W., Nadelhoffer, K., Magill, A., Berntson, G., Kamakea, M.,McNulty, S., Currie, W., Rustad, L., Fernandez, I., 1998. Nitrogen saturation intemperate forest ecosystems. Bioscience 48, 921–934.
Amiro, B., Barr, A., Black, T., Iwashita, H., Kljun, N., McCaughey, J., Morgenstern, K.,Murayama, S., Nesic, Z., Orchnsky, A., Saigusa, N., 2006. Carbon, energy and waterfluxes at mature and disturbed forest sites, Sakatchewan, Canada. Agric. ForestMeteorol. 136, 237–251.
Amiro, B., Barr, A., Barr, J., Black, T., Bracho, R., Brown, M., Chen, J., Clark, K., Davis,K., Desai, A., Dore, S., Engel, V., Fuentes, J., Goldstein, A., Goulden, M., Kolb, T.,Lavigne, M., Law, B., Margolis, H., Martin, T., McCaughey, J., Misson, L., Montes-Helu, M., Noormets, A., Randerson, J., Starr, G., Xiao, J., 2010. Ecosystem carbondioxide fluxes after disturbance in forests of North America. J. Geophys. Res. 11,5, doi:10.1029/2010JG001390.
Anderson-Teixeira, K., Delong, J., Fox, A., Brese, D., Litvak, M., 2011. Differentialresponses of production and respiration to temperature and moisture drive thecarbon balance across a climatic gradient in New Mexico. Global Change Biol.17, 410–424.
Baldocchi, D., Falge, E., Lianhong, G., Olson, R., Hollinger, D., Running, S., Anthoni, P.,Bernhofer, C., Davis, K., Evans, R., Fuentes, J., Goldstein, A., Katul, G., Law, B., Lee,X., Mahli, Y., Meyers, T., Munger, W., Oechel, W., Paw, K., Pilegaard, K., Schmid,H., Valentini, R., Verma, S., Vesala, T., Wilson, K., Wofsy, S., 2001. FLUXNET: anew tool to study the temporal and spatial variability of ecosystem-scale carbon
dioxide, water vapour and energy flux densities. Bull. Am. Meteorol. Soc. 82,2415–2424.Berhofer, C., Aubinet, M., Clement, R., Grelle, A., Grunwald, T., Ibrom, A., Jarvis, P.,Rebmann, C., Schulze, E.-D., Tenhunen, J., 2003. Spruce forests (Norway andSitka Spruce, including Douglas Fir): carbon and water fluxes and balances,
nd Fo
B
B
B
B
B
B
C
D
E
E
F
F
G
G
H
H
H
H
JJ
K
K
K
K
K
L
L
L
L
M. Saunders et al. / Agricultural a
ecological and ecophysiological determinants. In: Valentini, R. (Ed.), Fluxes ofCarbon, Water and Energy of European Forests. Springer-Verlag, Berlin.
lack, T.A., Tan, C.S., Nnyamah, J.U., 1980. Transpiration rate of Douglas fir trees inthinned and intact stands. Can. J. Soil Sci. 60, 625–631.
lack, K., Bolger, T., Davis, P., Nieuwenhuis, M., Reidy, B., Saiz, G., Tobin, B., Osborne, B.,2007. Inventory and eddy covariance-based estimates of annual carbon seques-tration in a Sitka spruce (Picea sitchensis (Bong.) Carr.) forest ecosystem. Eur. J.Forest Res. 126, 167–178.
lanco, J., Imbert, J., Castillo, F., 2009. Thinning effects nutrient resorption and nutri-ent use efficiency in two Pinus sylvestris stands in the Pyrenees. Ecol. Appl. 19,682–698.
ooth, A., Ryan, T., Whelan, D., 2009. Irish Thinning Protocol. Department of Agri-culture, Food and Fisheries.
road, L., Lynch, T., 2006. Growth models for Sitka spruce in Ireland. Irish Forestry63, 53–79.
rown, M., Black, T., Nesic, Z., Fredeen, A., Foord, V., Spittlehouse, D., Bowler, R.,Burton, P., Trofymow, J., Grant, N., Lessard, D., 2011. The carbon balance oftwo lodgepole pine stands recovering from mountain beetle attack in BritishColumbia. Agric. Forest Meteorol., doi:10.1016/j.agrformet.2011.07.010.
ampbell, J., Alberti, G., Martin, J., Law, B., 2009. Carbon dynamics of a ponderosapine plantation following a thinning treatment in the northern Sierra Nevada.Forest Ecol. Manag. 257, 453–463.
olman, A., Valentini, R., Freibauer, A., 2008. Observing the continental-scalegreenhouse gas balance. In: Dolman, A., Valentini, R., Freibauer, A. (Eds.), TheContinental-Scale Greenhouse Gas Balance Of Europe. Springer-Verlag, Berlin.
dwards, P., Christie, J., 1981. Yield Models for Forest Management. Forestry Com-mission Booklet, p. 48.
riksson, E., 2006. Thinning operations and their impact on biomass production instands of Norway spruce and Scots pine. Biomass Bioenergy 30, 848–854.
alge, E., Baldocchi, D., Olson, R., Anthoni, P., Aubinet, M., Bernhofer, C., Burba, G.,Ceulemans, R., Clement, R., Dolman, H., Granier, A., Gross, P., Grunwald, T.,Hollinger, D., Jensen, N-O., Katul, G., Keronen, P., Kowalski, A., Lai, C., Law, B.,Meyer, T., Moncrieff, J., Moors, E., Munger, J., Pilegaard, K., Rannik, U., Rebmann,C., Suyker, A., Tenhunen, J., Tu, K., Verma, S., Vesala, T., Wilson, K., Wofsy, S., 2001.Gap filling strategies for defensible annual sums of net ecosystem exchange.Agric. Forest Meteorol. 107, 43–69.
orestry Commission, 2009. Combating Climate Change a Role for Uk’s Forests: AnAssessment of the Potential of the UK’s Trees and Woodlands to Mitigate andAdapt to Climate Change. TSO, Norwich.
authier, M-M., Jacobs, D., 2009. Short-term physiological responses of Black Walnut(Juglans nigra L.) to plantation thinning. Forest Sci. 55, 221–229.
oulden, M., Munger, W., Fan, S-M., Daube, B., Wofsy, S., 1996. Measurements ofcarbon sequestration by long-term eddy covariance: methods and critical eval-uation of accuracy. Global Change Biol. 2, 169–182.
ale, S., 2003. The effect of thinning intensity on the below-canopy light environ-ment in a Sitka spruce plantation. Forest Ecol. Manag. 179, 341–349.
ogberg, P., Nordgren, A., Buchmann, N., Taylor, A., Ekblad, A., Hogberg, M., Nyberg,G., Ottosson-Lofvenius, M., Read, D., 2001. Large-scale forest girdling shows thatcurrent photosynthesis drives soil respiration. Nature 411, 789–792.
omyack, J., Harrison, D., Krohn, W., 2004. Structural differences between pre-commercially thinned and unthinned conifer stands. Forest Ecol. Manag. 194,131–143.
umphreys, E., Black, T.A., Morgenstern, K., Cai, T., Drewitt, G., Nesic, Z., Trofymow,J., 2006. Carbon dioxide fluxes in coastal Douglas-fir stands at different stagesof development after clearcut harvesting. Agric. Forest Meteorol. 140, 6–22.
oyce, P., O’Carroll, N., 2002. Sitka Spruce in Ireland. COFORD, Dublin.assal, R., Black, A., Cai, T., Morgenstern, K., Li, Z., Gaumont-Guay, D., Nesic, Z., 2007.
Components of ecosystems respiration and an estimate of net primary produc-tivity of an intermediate-aged Douglas-fir stand. Agric. Forest Meteorol. 144,44–57.
eith, H., van Gorsel, E., Jacobsen, K., Cleugh, 2011. Dynamics of carbon exchange ina Eucalyptus forest in response to interacting disturbance factors. Agric. ForestMeteorol., doi:10.1016/j.agrformet.2011.07.019.
ljun, N., Calanca, P., Rotach, M., Schmid, H., 2004. A simple parameterisation forflux footprint predictions. Boundary Layer Meteorol. 112, 502–523.
olari, P., Pumpanen, J., Rannik, U., Ilvesniemi, H., Hari, P., Berninger, F., 2004. Carbonbalance of different aged Scots pine forests in Southern Finland. Global ChangeBiol. 10, 1106–1119.
ormann, R., Meixner, F.X., 2000. An analytical footprint model for non-neutralstratification. Boundary Layer Meteorol. 99, 207–224.
owalski, A., Lousteau, D., Berbigier, P., Manca, G., Tedeschi, V., Borghetti, M., Valen-tini, R., Kolari, P., Berninger, F., Rannik, U., Hari, P., Rayment, M., Mencuccini, M.,Moncrieff, J., Grace, J., 2004. Paired comparisons of carbon exchange betweenundisturbed and regenerating stands in four managed forests in Europe. GlobalChange Biol. 10, 1707–1723.
everenz, J.W., 1995. Shade shoot structure of conifers and the photosyntheticresponse to light at two CO2 partial pressures. Funct. Ecol. 9, 413–421.
loyd, J., Taylor, J., 1994. On the temperature dependence of soil respiration. Funct.Ecol. 8, 315–323.
uyssaert, S., Reichstein, M., Schulze, E.-D., Janssens, I., Law, B., Papale, D., Drag-oni, D., Goulden, M., Granier, A., Kutsch, W., Linder, S., Matteucci, G., Moors, E.,
Munger, J., Pilegaard, K., Saunders, M., Falge, E., 2009a. Towards a consistencycross-check of eddy covariance flux-based and biometric estimates of ecosystemcarbon balance. Global Biogeochem. Cycles 23, doi:10.1029/2008GB003377.uyssaert, S., Cias, P., Piao, S., Schulze, E-D., Jung, M., Zaehle, S., Schelhaas, M.,Reichstein, M., Churkina, G., Papale, D., Abril, G., Beer, C., Grace, J., Lousteau,
rest Meteorology 157 (2012) 1– 10 9
D., Matteucci, G., Magnani, F., Nabuurs, G-J., Verbeeck, H., Sulkava, M., Werf, G.,Janssens, I., 2009. The European carbon balance: part 3: forests. Global ChangeBiol., doi:10.1111/j.1365-2486.2009.02056.
Ma, S., Chen, J., North, M., Erickson, H., Bresee, M., Le Moine, J., 2004. Short-termeffects of experimental burning and thinning on soil respiration in an old-growthmixed-conifer forest. Environ. Manage. 33, 148–159.
Magnani, F., Mencuccini, M., Borghetti, M., Berbigier, P., Berninger, F., Delzon, S.,Grelle, A., Hari, P., Jarvis, P., Kolari, P., Kowalski, A., Lankreijer, H., Law, B.,Lindroth, A., Loustau, D., Manca, G., Moncrieff, J., Rayment, M., Tedeschi, V.,Valentini, R., Grace, J., 2007. The human footprint in the carbon cycle of tem-perate and boreal forests. Nature 447, doi:10.1038/nature05847.
Makinen, H., Isomaki, A., 2004. Thinning intensity and long-term changes in incre-ment and stem form of Scots pine trees. Forest Ecol. Manag. 203, 21–34.
Medlyn, B., Berbigier, P., Clement, R., Grelle, A., Loustau, D., Linder, S., Wingate,W., Jarvis, P., Sigurdsson, B., McMurtrie, R., 2005. Carbon balance of conifer-ous forests growing in contrasting climates: model-based analysis. Agric. ForestMeteorol. 131, 97–124.
Mkhabela, M., Amiro, B., Barr, A., Black, T., Hawthorne, I., Kidston, J., McCaughey, J.,Orchansky, A., Nesic, Z., Sass, A., Shashkov, A., Zha, T., 2009. Comparison of carbondynamics and water use efficiency following fire and harvesting in Canadianboreal forests. Agric. Forest Meteorol. 149, 783–794.
Moffat, A., Papale, D., Reichstein, M., Hollinger, D., Richardson, A., Barr, A., Beckstein,C., Braswell, B., Churkina, C., Desai, A., Falge, E., Gove, J., Heimann, M., Hui, D.,Jarvis, A., Kattge, J., Noormets, A., Stauch, V., 2007. Comprehensive comparisonof gap-filling techniques for eddy covariance net carbon fluxes. Agric. ForestMeteorol. 147, 209–232.
Moncrieff, J., Massheder, J., de Bruin, H., Elbers, J., Fiborg, T., Heusinkveld, B., Kabat,P., Scott, S., Sogaard, S., Verhoef, A., 1997. A system to measure surface fluxes ofmomentum, sensible heat, water vapour and carbon dioxide. J. Hydrol. 188-189,589–611.
Morgenstern, K., Black, T.A., Humphreys, E., Cai, T., Drewitt, G., Gaumont-Guay, D.,Griffiths, T., Jork, E-M., Nesic, Z., 2004. Annual variations in carbon sequestra-tion during an El Nino/La Nina cycle in a coastal Douglas-fir forest. Agric. ForestMeteorol. 123, 201–219.
Mund, M., Kummetz, E., Hein, M., Bauer, G., Schulze, E-D., 2002. Growth and carbonstocks of a spruce forest chronosequence in central Europe. Forest Ecol. Manag.171, 275–296.
National Forest Inventory, 2007. Department of Agriculture, Fisheries and Food.http://www.agriculture.gov.ie/nfi/nationalforestinventoryresultsdata/.
Nilsson, U., Agestam, E., Per-Magnus, E., Elfving, B., Fahlvik, N., Johansson, U., Karls-son, K., Lundmark, T., Wallentin, C., 2010. Thinning of Scots pine and NorwaySpruce monocultures in Sweden—effects of different thinning programmes onstand level gross–and net stem volume production. Studia Forestalia Suecica.No. 219.
Norman, J., Jarvis, P., 1974. Photosynthesis in Sitka spruce (Picea sitchensis (Bong.)Carr.). III. Measurements of canopy structure and interception of radiation. J.Appl. Ecol. 11, 375–398.
Ogren, E., 1993. Convexity of the photosynthetic light response curve in relation tointensity and direction of light during growth. Plant Physiol. 101, 1013–1019.
Payeur-Poirier, J-L., Coursolle, C., Margolis, H., Giasson, M-A., 2011. CO2 fluxes ofa boreal black spruce chronosequence in eastern North America. Agric. ForestMeteorol., doi:10.1016/j.agrformet.2011.07.009.
Reich, P., Koike, T., Gower, S., Schoettle, A., 1995. Causes and consequences of varia-tion in conifer leaf life-span. In: Smith, W., Hinckley, T. (Eds.), Ecophysiology ofConiferous Forests. Academic Press, New York.
R Development Core Team, 2011. R: A Language and Environment for StatisticalComputing. R Foundation for Statistical Computing, Vienna.
Roberts, S., Harrington, C., 2008. Individual tree growth response to variable-density thinning in coastal Pacific Northwest forests. Forest Ecol. Manag. 255,2771–2781.
Sabatia, C., Will, R., Lynch, T., 2010. Effect of thinning on partitioning of abovegroundbiomass in naturally regenerated shortleaf pine (Pinus echinata Mill.). In: Stan-turf, J. (Ed.), Proceedings of the 14th Biennial Southern Silvicultural ResearchConference, Gen. Tech. Rep. SRS-121. US Department of Agriculture, Forest Ser-vice, Southern Research Station, Asheville, NC. 614 pp.
Saiz, G., Byrne, K., Butterbach-Bahl, K., Kiese, R., Blujdea, V., Farrell, E., 2006. Standage-related effects on soil respiration in a first rotation Sitka spruce chronose-quence in central Ireland. Global Change Biol. 12, 1007–1020.
Saiz, G., Black, K., Reidy, B., Lopez, S., Farrell, E., 2007. Assessment of soil CO2 effluxand its components using a process-based model in a young temperate forestsite. Geoderma 139, 79–89.
Schwalm, C., Williams, C., Schaefer, K., Arneth, A., Bonal, D., Buchmann, N., Chen, J.,Law, B., Lindroth, A., Luyssaert, S., Reichstein, M., Richardson, A., 2010. Assim-ilation exceeds respiration sensitivity to drought: a FLUXNET synthesis. GlobalChange Biol. 16, 657–670.
Scott, N., Rodrigues, C., Hughes, H., Lee, J., Davidson, E., Dail, D., Malerba, P., Hollinger,D., 2004. Changes in carbon storage and net carbon exchange one year afteran initial shelterwood harvest at Howland forest, ME. Environ. Manage. 33,9–22.
Shibuya, M., Hasaba, M., Yajima, T., Takahashi, K., 2005. Effect of thinning on allome-try and needle-age distribution of trees in Abies stands of norther Japan. J. Forest
Res. 10, 15–20.Soussana, J., Allard, V., Pilegaard, K., Ambus, P., Amman, C., Campbel, C., Ceschia, E.,Clifton-Brown, J., Czobel, S., Domingues, R., Flechard, C., Fuhrer, J., Hensen, A.,Horvath, L., Jones, M., Kasper, G., Martin, C., Nagy, Z., Neftel, A., Raschi, A., Baronti,S., Rees, R., Skiba, U., Stefani, P., Manca, G., Sutton, M., Tuba, Z., Valentini, R., 2007.

1 nd Fo
S
S
T
T
T
T
0 M. Saunders et al. / Agricultural a
Full accounting of the greenhouse gas (CO2, N2O, CH4) budget of nine Europeangrassland sites. Agric. Ecosyst. Environ. 121, 121–134.
ullivan, P., Sullivan, D., Lindgren, P., Ransome, D., 2006. Long-term responses ofecosystem components to stand thinning in young lodgepole pine forest. III.Growth of crop trees and coniferous stand structure. Forest Ecol. Manag. 228,69–81.
ullivan, B., Kolb, T., Hart, S., Kaye, J., Dore, S., Montes-Helu, M., 2008. Thinningreduces soil carbon dioxide but not methane flux from southwestern USA pon-derosa pine forests. Forest Ecol. Manag. 225, 4047–4055.
ang, Z., Chambers, J., Guddanti, S., Yu, S., Barnett, J., 1999. Seasonal shoot and needlegrowth of loblolly pine responds to thinning, fertilization, and crown position.Forest Ecol. Manag. 120, 117–130.
hornley, J., Cannell, M., 2000. Managing forests for wood yield and carbon storage:a theoretical study. Tree Physiol. 20, 477–484.
obin, B., Black, K., Osborne, B., Reidy, B., Bolger, T., Nieuwenhuis, M., 2006.
Assessment of allometric algorithms for estimating leaf biomass, leaf areaindex and litterfall in different-aged Sitka spruce forests. Forestry 79,453–465.obin, B., Nieuwenhuis, M., 2007. Biomass expansion factors for Sitka spruce (Piceasitchensis (Bong.) Carr.) in Ireland. Eur. J. Forest Res. 126, 189–196.
rest Meteorology 157 (2012) 1– 10
Valinger, E., 1993. Crown development of Scots pine trees following thinning andnitrogen fertilisation. Forestalia Suecica. No. 188.
Van Dijk, A., Dolman, H., 2004. Estimates of CO2 uptake and release among Europeanforests based on eddy covariance data. Global Change Biol. 10, 1445–1459.
Vesala, T., Suni, T., Rannik, U., Keronen, P., Markkanen, T., Sevanto, S., Gronholm,T., Smolander, S., Kulmala, M., Ilvesniemi, H., Ojansuu, R., Uotila, A., Levula, J.,Makela, A., Pumpanen, J., Kolari, P., Kulmala, L., Altimir, N., Berninger, F., Nikin-maa, E., Hari, P., 2005. Effect of thinning on surface fluxes in a boreal forest.Global Biogeochem. Cycles 19, GB2001, doi:10.1029/2004GB002316.
Vesterdal, L., Dalsgaard, M., Felby, C., Raulund-Rasmussen, K., Jorgensen, B., 1995.Effects of thinning and soil properties on accumulation of carbon, nitrogen andphosphorus in the forest floor of Norway spruce stands. Forest Ecol. Manag. 77,1–10.
Wang, Y., Jarvis, P., 1990. Influence of crown structural properties on PAR absorp-tion, photosynthesis and transpiration in Sitka spruce: application of a model
(MAESTRO). Tree Physiology. 7, 297–316.Wang, J., Simard, S., Kimmins, J., 1995. Physiological responses of paper birch tothinning in British Columbia. Forest Ecol. Manag. 73, 177–184.
Woodward, I., Quaife, T., Lomas, M., 2010. Changing climate and the Irish landscape.Biol. Environ.: Proc. R. Irish Acad. 110, 1–16.