
Observations of enhanced thinning in the upper reaches of Svalbard glaciers

Thinning, fire, and oak regeneration across a heterogeneous
landscape in the eastern U.S.: 7-year results
Louis R. Iverson *, Todd F. Hutchinson, Anantha M. Prasad, Matthew P. Peters
Northern Research Station, U.S.D.A. Forest Service, 359 Main Road, Delaware, OH 43015, USA
Received 14 June 2007; accepted 11 September 2007
Abstract
We document an increase in oak and hickory advance regeneration, depending on landscape position, in the sixth year following mechanical
thinning and repeated prescribed fires in southern Ohio, USA. Oak-dominated communities provide a multitude of human and natural resource
values throughout the eastern United States, but their long-term sustainability is threatened throughout the region by poor regeneration. This study
was established to assess regeneration following midstory thinning (late 2000) and prescribed fire application (2001 and 2005) at two sites in
southern Ohio. Each of the four 20+ ha treatment units (two thin and burn, two untreated controls) were modeled for long-term moisture regime
using the integrated moisture index (IMI), and a 50 m grid of sampling points was established throughout the units. Vegetation and canopy
openness were sampled at each gridpoint before and after treatments, in 2000, 2001, 2004, and 2006. The thin and burn treatment generally resulted
in more advance regeneration (>50 cm height) of oak and hickory. The second fires in 2005 created additional landscape heterogeneity by causing
variable tree mortality, and thus canopy openness, across the IMI gradient. The drier landscape positions generally had more intense fires, more
canopy openness, and more oak and hickory advance regeneration; several other tree species also exhibited marked landscape variation in
regeneration after treatments. Though advance regeneration of several competing species became abundant after the initial treatments, the second
fires reduced the high densities of the two major competitors, Acer rubrum and Liriodendron tulipifera. Two simple models were developed: (1) a
model of oak ‘‘competitiveness’’ based on the plot data related to advance regeneration of oaks and competitors and (2) a model estimating the
probability of a plot becoming ‘competitive for oak’ based on canopy openness, IMI class, and number of oak and hickory seedlings present. For
dry or intermediate sites with at least 5000 oak and hickory seedlings/ha, opening the canopy to 8.5–19% followed by at least two fires should
promote oak and hickory to be ‘competitive’ over about 50% of the area. However, no appreciable oak and hickory regeneration developed on
mesic sites. Overall, these results suggest promise for partial harvesting and repeated fires as a management strategy to reverse the accelerating loss
of oak dominance in the central hardwoods region.
Published by Elsevier B.V.
Keywords: Oak regeneration; Central hardwoods region; Thinning; Prescribed fire; Topography; Ohio; Oak (Quercus); Hickory (Carya); Maple (Acer); Yellow-
poplar (Liriodendron tulipifera); Integrated moisture index
1. Introduction
A large portion of the central hardwoods region (CHR) of
eastern U.S. forests is undergoing a conversion from dominance
by oak–hickory (Quercus and Carya) to maple (Acer) and other
shade-tolerant and/or mesophytic species (Abrams, 2003). U.S.
Forest Service forest inventories of Ohio from 1968 and 1991
(Kingsley and Mayer, 1970; Dennis and Birch, 1981; Griffith
et al., 1993) indicate that the proportion of total volume in oak
and hickory has declined substantially relative to maple,
yellow-poplar (Liriodendron tulipifera), and black cherry
(Prunus serotina). The relative importance of several oak
and hickory species in Ohio declined by at least 22% during this
same period while maple and yellow-poplar increased by at
least 38% in total volume. In Pennsylvania, forest types
dominated by red maple increased 22% between 1989 and 2000
(McWilliams et al., 2004). This trend is evident throughout
much of the CHR (Iverson et al., 1989; Nowacki and Abrams,
1992; SAMAB, 1996).
Mature closed-canopied forests in the CHR are usually
characterized by an oak-dominated canopy, even in relatively
mesic landscape positions, and small oak seedlings are often
relatively abundant, at least on drier sites. However, oak
advance regeneration (large seedlings and saplings) is typically
www.elsevier.com/locate/foreco
Available online at www.sciencedirect.com
Forest Ecology and Management 255 (2008) 3035–3050
* Corresponding author at: Tel.: +1 740 368 0097; fax: +1 740 368 0152.
E-mail address: [email protected] (L.R. Iverson).
0378-1127/$ – see front matter. Published by Elsevier B.V.
doi:10.1016/j.foreco.2007.09.088

sparse. These compositionally unstable oak forests have been
documented thoroughly across the eastern United States (e.g.,
Abrams, 2003). Though oak regeneration has been an object of
concern and study for several decades, increasingly poor oak
regeneration continues to prompt large scientific efforts to
assess the problem and search for management solutions (e.g.,
Loftis and McGee, 1993; Johnson et al., 2002; McShea and
Healy, 2002; Spetich, 2004), including a better understanding
of the historic role of fire and the use of prescribed fire in oak
forests (Brose et al., 1999, 2001; Iverson et al., 2004a;
Dickinson, 2006).
Several factors contribute to poor oak regeneration. In the
pervasive closed-canopy conditions, the shade-intolerant oaks
are out-competed by more shade-tolerant species (Hilt, 1985;
Loftis and McGee, 1993). When light is not limiting (e.g., after
a clearcut), faster-growing species such as yellow-poplar often
out-compete oak, particularly on higher-quality sites (Beck,
1990; Marquis, 1990). The success of oak regeneration after a
canopy-opening disturbance usually varies across a soil
moisture gradient, with oak regeneration competitive only
under dry conditions (Iverson et al., 1997). Thus, a landscape-
level approach to assessing treatment effects across a moisture
gradient is important to provide an evaluation at the scale of
typical forest management units (Boerner, 2006).
Prior to Euro-American settlement (ca. 1800), oaks were the
dominant tree species across most of the Allegheny Plateau of
southern Ohio (Beatley and Bartley, 1959; Dyer, 2001).
Dendrochronology fire history studies from the period ca.
1870–1935 have shown that fire occurred frequently (�10-year
fire interval) as forests were regenerating after widespread and
exploitive timber harvesting in the 1800s (Sutherland, 1997;
McEwan et al., 2007). Fire control was instituted in 1923 and
became very effective by the mid-1930s (Leete, 1938). It has
been hypothesized that the dramatic decrease in fire frequency
has created large aberrations in several facets of forest ecology,
including the widespread establishment of maples and other
fire-sensitive species that now threaten the sustainability of oak
dominance (Sutherland and Hutchinson, 2003).
A previous study (Hutchinson et al., 2005) in southern Ohio
showed that after many years of fire exclusion, simply returning
several low-intensity prescribed fires to mature oak forests did
not consistently increase canopy openness and generally did not
stimulate the development of oak advance regeneration.
Therefore, we initiated a study to assess the effects of
mechanical thinning in addition to prescribed fire as a
management tool to improve oak regeneration in our region.
As one site (The Ohio Hills) of the national Fire and Fire
Surrogates Study (FFS) (Youngblood et al., 2005), we are
assessing these treatments as possible means of reducing the
abundance of shade-tolerant species and developing oak
advance regeneration (Iverson et al., 2004a; Rebbeck et al.,
2004). Albrecht and McCarthy (2006) evaluated regeneration
on plots for four post-treatment years after the thinning and the
initial prescribed fire. They found that oak and hickory
seedlings (<140 cm) responded neither positively nor nega-
tively to any treatment (burn only, thin only, thin + burn) during
that period. However, the abundant sprouting and establishment
of competitors (e.g., Acer rubrum, L. tulipifera, Nyssa sylvatica,
Sassafras albidum) into the advance regeneration layer further
reduced the competitive status of oak and hickory. Albrecht and
McCarthy (2006) suggested that additional fire(s) would likely
be necessary to reduce the abundance and size of competitors,
and thus potentially favor oak and hickory regeneration.
Microclimatic factors, such as solar radiation, air tempera-
ture, humidity, soil temperature, and soil moisture, vary
substantially across landscapes with heterogeneous topography
(Kang et al., 2000). In turn, these factors influence the structure
and composition of forest vegetation (Iverson et al., 1997;
Boerner, 2006). Human-controlled factors, such as timber
harvesting, also can have profound influences on microclimate
(Chen et al., 1999; Zheng et al., 2000).
The primary objective of this study, as a component of the
FFS Ohio Hills study, is to measure the effects of thinning and
repeated prescribed fires (2001 and 2005) on canopy openness
and tree regeneration over a 7-year period, with emphasis on the
response of oaks and hickories relative to competing species.
We stratified our sites by the integrated moisture index (IMI;
Iverson et al., 1997) to describe landscape variation on the
effects of thinning and burning. We sampled canopy openness
and regeneration four times in a 50 m grid across the
heterogeneous landscapes. We used the resultant information
to map the potential for oak and hickory regeneration success
based on the advance regeneration present 6 years after
treatments began.
2. Methods
2.1. Site description
Our study is located in Vinton County, Ohio, at two of the
three Ohio Hills FFS replicates. The Raccoon Ecological
Management Area (REMA) replicate site (3981204100N,
8282300900W) is located within the Vinton Furnace Experi-
mental Forest, which has been the site of silviculture and forest
ecology studies and demonstrations since the early 1950s. The
Zaleski (ZAL) replicate site (3982101700N, 8282200600W) lies
within Zaleski State Forest and is managed by the Ohio
Department of Natural Resources, Division of Forestry.
The area lies in the unglaciated Allegheny Plateau
physiographic region and is characterized by dissected
topography (narrow ridges and valleys) and less than 100 m
of local relief. The upland forests are mostly a complex mosaic
of mixed-oak and oak-hickory forests, grading into mixed-
mesophytic communities in ravines and other sheltered
locations (Beatley and Bartley, 1959). The current overstory
regenerated ca. 1850–1900 after being harvested for charcoal to
fuel nearby iron furnaces.
The most abundant oak and hickory species are white oak
(Quercus alba), chestnut oak (Q. prinus), black oak (Q.
velutina), scarlet oak (Q. coccinea), red oak (Q. rubra), pignut
hickory (Carya glabra), and mockernut hickory (C. tomen-
tosa). Oaks are much less abundant in the midstory and
understory layers, and species composition in these layers is
more strongly influenced by topographic characteristics. In all
L.R. Iverson et al. / Forest Ecology and Management 255 (2008) 3035–30503036

but the most dry landscape positions, red maple (A. rubrum) and
other shade-tolerant species, such as blackgum (N. sylvatica),
American beech (Fagus grandifolia), and sugar maple (Acer
saccharum), dominate the midstory and understory strata,
while oak and hickory advance regeneration is typically sparse
(Sutherland and Hutchinson, 2003).
2.2. Study design
The overall FFS study design consists of four treatments on
each of three replicate sites, resulting in 12 treatment units of
20–25 ha each. The four treatments are untreated control (C),
mechanical thinning, prescribed burning, and a combination of
thinning and burning (TB). Vegetation and soils have been
sampled on ten 0.1 ha permanent plots per treatment unit (e.g.,
Albrecht and McCarthy, 2006). For the present study, we
restricted sampling to only the C and TB units on the ZAL and
REMA sites (four treatment units), but systematically sampled
these units more intensively across the landscape. Gridpoints
were established every 50 m throughout the units using a global
positioning system (GPS). The number of gridpoints sampled
per unit was 45 at ZAL C, 60 at ZALTB, 66 at REMA C, and 71
at REMA TB. These 242 points are the basis of all analyses
reported in this paper.
The integrated moisture index (IMI) was used to estimate the
influence of varying topography and soils across the landscape
(Iverson et al., 1997). The IMI is a GIS model (0–100 scale) of
long-term moisture availability based on solar radiation
(‘‘hillshade’’), position on the slope (‘‘flow accumulation’’),
curvature of the landscape, and water-holding capacity of the
soils. IMI is related to soil moisture (Iverson et al., 2004b) and
has been used to predict forest site productivity and
composition, understory vegetation, soil nutrients, and bird
distributions (Iverson et al., 1996; Hutchinson et al., 1999;
Dettmers and Bart, 1999; Boerner et al., 2000; Dyer, 2001).
Here we categorized gridpoints into one of three IMI classes for
ease in interpretation: dry (score < 35), intermediate (35–50),
and mesic (>50).
2.3. Treatments
Thinning occurred from December 2000 to February 2001
and removals were concentrated in the midstory (trees 15–
30 cm dbh); oaks and hickories were favored for retention.
Stumps were not treated with herbicides following cutting. For
the ZAL TB site, basal area was reduced from 25.5 to 18.5 m2/
ha. The density of overstory (dominant and codominant) trees
was reduced from 192 to 142 stems/ha; the midstory
(intermediate and suppressed) from 255–150 stems/ha. On
the REMA TB unit, thinning reduced basal area from 28.0 to
22.6 m2/ha; overstory and midstory densities were reduced
from 133 to 103 and from 239 to 194 trees/ha, respectively
(Daniel Yaussy, unpublished data).
The first prescribed fires were conducted on 4 (ZAL) and 5
(REMA) April 2001, several months after the mechanical
thinning had occurred. Trees had not yet begun to leaf out. The
entire 20+ ha units were burned. Flame lengths were generally
0.5–1 m. Thermocouples placed at every gridpoint, 25 cm
above ground, were used to monitor the degree and duration of
temperature increase across the landscape during those fires
(Iverson et al., 2004b). The mean maximum thermocouple
temperatures for ZAL TB and REMATB were 140 and 144 8C,
respectively. Animated recreations of these two fires, based on
GIS extrapolation of thermocouple data across the landscapes,
are available at www.fs.fed.us/ne/delaware/4153/ffs/prescri-
bed_burn.html. These fires caused very little overstory tree
mortality (Daniel Yaussy, U.S. Forest Service, unpublished
data). Fine fuels (1 h) burned completely in most areas, but
coarse fuels (100 and 1000 h) were generally not consumed.
The second prescribed fires were conducted in 2005, at ZAL
TB on 5 April and at REMA TB on 11 April. Again, trees had
not yet begun to leaf out. Drier weather conditions, coupled
with the coarse fuels having cured from the thinning 4 years
earlier, resulted in higher-intensity fires, with flame lengths
often 1–2 m, occasionally more. At ZAL TB, the average
maximum temperature recorded by the thermocouples was
211 8C and these temperatures were relatively homogeneous
across the landscape. At REMA TB, the average maximum
temperature was 169 8C, but fire behavior varied dramatically
across the landscape from very low intensity (flame lengths
0.25 m) on the north-facing slope to very high-intensity (flame
lengths often >2 m) on the southwest-facing slope, resulting in
significant overstory mortality.
2.4. Canopy openness sampling
To estimate understory light transmission levels, hemi-
spherical photographs were taken at each gridpoint in July
2000, July 2001, and July 2006, with a digital camera leveled
1.5 m above the forest floor. At each point four photographs
were taken at different exposure level increments due to
variability in cloud cover and canopy cover conditions. For
each gridpoint, we selected one image with the best (in our
opinion) exposure for analysis purposes. We then analyzed the
photographs with the Gap Light Analyzer program (GLA,
version 2.0; Frazer et al., 1999) to calculate canopy openness,
which is the percentage of open sky seen from beneath a forest
canopy given the additional influence of an effective horizon
that is less than 908 (Frazer et al., 1999). The analysis is affected
by variations in image thresholding (converting the color image
to black [cover] and white [open]) by the analyst. To minimize
analyst variations, one person performed all of the GLA
analyses within each year’s set of photos.
2.5. Vegetation sampling
Vegetation was sampled in all four units in 2000 (before
treatment), 2001 (first growing season after thinning and the
first prescribed fire), 2004 (fourth growing season after thinning
and the first fire), and 2006 (second growing season after the
second fire and 6 years after thinning). At each gridpoint, small
seedlings (<50 cm height) of all tree species were recorded
within four 2 m2 circular plots in the cardinal directions,
centered 2 m from the gridpoint. To increase the sample area for
L.R. Iverson et al. / Forest Ecology and Management 255 (2008) 3035–3050 3037

oak and hickory seedlings, we sampled an additional 8.5 m2
plot centered on the gridpoint.
The advance regeneration, in which we include large
seedlings (50–140 cm) and saplings (>140 cm height to
9.9 cm dbh) of all tree species, were recorded in a 78.5 m2
circular plot (5 m radius) centered on the gridpoint. By the
fourth growing season (2004) after the thin and burn treatment,
there were dense thickets of woody stems in many areas,
consisting of numerous large seedlings and saplings (e.g.,
yellow-poplar—L. tulipifera), stump sprouts (most notably red
maple), and shrubs (e.g., Rubus spp., Smilax rotundifolia).
Therefore, in 2004 and 2006, we were forced to reduce the area
in which we sampled large seedlings (50–140 cm) of non-
oak + hickory species to the four 2 m2 seedling plots at each
gridpoint; thus for those years we used different multipliers to
calculate stems/ha. Throughout the study, we continued to
sample large oak and hickory seedlings (50–140 cm) within
the 78.5 m2 plots. Also, for large seedlings and saplings in 2004
and 2006, we recorded each multiple-stemmed clump of
sprouts as a single individual rootstock but also noted the
number and size class of sprouts.
The species and basal area of overstory trees was recorded
with a 10-factor basal area prism at each gridpoint in each
sample year. In order to calculate overstory tree density on a
per-unit-area basis, we used additional data collected in the ten
0.1 ha plots in each treatment unit.
2.6. Data analysis
2.6.1. Statistical analysis
We used several methods to summarize, analyze, and
evaluate trends and treatment effects. Since the 242 gridpoints
are technically pseudoreplicates within only two replicates of
control and TB treatments, analysis of variance was not
appropriate. Therefore, we report means and standard errors
for comparative information. We graphed population trends
among IMI classes for several seedling and sapling size classes
of oak and hickory and also several of the major competitors.
Relative abundance composition plots were constructed that
showed the proportions of each species group by size class in
years 2000 (before treatment) and 2006 (after treatment with
thinning and burning), for the REMA and ZAL TB sites
combined. We also graphed the relationship between oak and
hickory advance regeneration and canopy openness by IMI
class.
We used regression tree analysis (RTA) to determine major
drivers affecting the abundance of oak and hickory small
(<50 cm height) and large seedlings (50–140 cm height) in
2006 on all control and TB gridpoints. Each gridpoint was
treated independently and the suite of categorical and
quantitative predictors included site and treatment, physical
variables (canopy openness, IMI, etc.), and vegetation (e.g.,
abundance of taller competition). The analysis was conducted
in SYSTAT (version 11.0) using the default settings. The
proportion of reduction in error (PRE) was used as the loss
function in terms of a goodness-of-fit statistic; the PRE is
basically equivalent to a multiple R2 statistic.
2.6.2. Potential for oak–hickory regeneration
To better understand competition between oak and hickory
and its competitors across the landscape, we developed a rule-
based system of classification for each gridpoint based on the
abundance and size classes of regeneration. Our objective was
to classify the likelihood of the current oak and hickory
regeneration to advance into the overstory of the next forest, if
the current overstory were removed.
We made several assumptions to simplify the rule-based
classification. First, we only evaluated the regeneration layer;
we did not incorporate the potential future of stump sprouts
from overstory trees (>10 cm) should the remaining overstory
be removed (though current sprouts after the TB treatments
were accounted for). Second, we treated all oak and hickory
species equally (lumped together), and all competition (non-
oak and hickory) species equally (lumped together). For
example, midstory trees, such as Carpinus caroliniana and
Oxydendrum arboreum were treated the same as species that
can attain overstory stature, such as red maple and yellow-
poplar. Third, we focused our classification on the advance
regeneration layer (stems 50 cm tall to 10 cm dbh), unless total
stem densities were below minimum thresholds for each size
class (see below). Fourth, the rules were weighted according to
the size class of the advance regeneration; e.g., stems in the
larger size class (3–10 cm dbh; large saplings) were weighted
more than stems 140 cm height to 3 cm dbh (small saplings),
which were, in turn, weighted more than the 50–140 cm height
class (large seedlings). Fifth, we assumed that, given the
capacity of oak and hickory to have greater root:shoot ratios
than competitors (Johnson et al., 2002), oak could be classified
as ‘‘competitive’’ even if outnumbered and outsized to some
degree by competing species.
Each gridpoint was assigned to one of eight competition
classes, depending on total density of advance regeneration and
seedlings of all species. Class assignments were based on
minimum thresholds established from natural breaks in the
data.
The advance regeneration classes (classes 1–4, Table 1) were
above the thresholds, for all species combined, of one or more
of the following criteria: (1) 2500 stems/ha in the large seedling
size class; (2) 300 stems/ha in the small sapling size class; (3)
300 stems/ha in the large sapling size class. Classes within the
advance regeneration group were assigned based on numbers of
seedlings or saplings of oak and hickory larger than 50 cm in
height and the competition load from other species. Competi-
tion load was defined as high, medium, and low based on the
number and sizes of the competing vegetation.
The seedling regeneration classes (classes 5–8, Table 1)
were below the thresholds, for all species combined, of all of
the same criteria. Classes within the seedling regeneration
group were assigned based on numbers of oak and hickory
small seedlings (<50 cm in height) present on the plot
(Table 1).
In this assessment, we assume the potential for oak
regeneration following overstory death or removal to be
proportional to the size and quantity of seedlings present, so
that class 4, followed by class 8, has the highest probability to
L.R. Iverson et al. / Forest Ecology and Management 255 (2008) 3035–30503038

develop into an oak stand should a canopy-opening event occur.
We might expect that, across the eight classes, the decreasing
order of probability for oak regeneration would be
4 > 8 > 3 > 7 > 2 > 6 > (5, 1). We mapped the classification
scheme by gridpoint to show variation across the landscape
before and after treatments.
3. Results
3.1. Canopy openness
On the ZAL and REMA control units, canopy openness was
constant between 2000 and 2001, but decreased by an average
of 2.6% (ZAL, decrease from 6.7% to 4.1%) to 3.6% (REMA,
decrease from 6.8% to 3.2%) by 2006 (Fig. 1a and b). Some of
the consistent decrease in openness from 2000 to 2006 was
likely due to variability in decision-making between the
analysts when they were thresholding the images (converting
from color to black and white [closed/open]) in the GLA
program. Though year-to-year variation in open sky can be
significant, we would not expect this degree of consistent
reduction in canopy openness over 6 years in a mature forest.
Therefore, we assume that the same differential in canopy
openness estimates (�2–4% decrease) was also likely to have
been manifested on the TB sites.
On the ZALTB unit, canopy openness averaged 7.0% before
TB treatment and increased to 12.0% in 2001, the first year after
thinning and the first fire (Fig. 1c). Our data suggest a decrease
to 9.6% by 2006, but if we factor in the differential of 2–4%,
there would be no difference or a slight increase in open sky
following the second fire in 2005.
The REMA TB unit averaged 6.1% open sky before
treatments and 12.7% after thinning and the first fire (Fig. 1d).
In 2006, after the second fire, open sky averaged 13.8% and
Table 1
Criteria for assigning potential for oak–hickory regeneration
Number of oak + hickory/ha by size Competition load
Class >50 cma <50 cmb
Advanced regeneration classesc
1 <127 na High
2 127–637 na High
3 >637 na Medium
4 >637 na Low
Seedling regeneration classesd
5 <127 <2500 na
6 <127 2500–5000 na
7 <127 5000–10,000 na
8 <127 >10,000 na
na: not applicable.a Based on number of plants per 78.5 m2 plot.b Based on number of plants per 8.5 m2 plot.c Gridpoint’s tree population exceeds at least one: (1) 2500 stems/ha of 50–
140 cm size; (2) 300 stems/ha of 140 cm height to 2.9 cm dbh or (3) 300 stems/
ha of 3.0–9.9 cm dbh.d Gridpoint’s tree population does not exceed criteria listed above.
Fig. 1. Estimates of canopy openness for 2000 (before treatment), 2001 (after thinning and first fire), and 2006 (second year after second fire) at ZAL and REMA
control and treated sites.
L.R. Iverson et al. / Forest Ecology and Management 255 (2008) 3035–3050 3039

varied considerably among IMI classes, from a mean of 21.8%
on dry plots, 13.9% on intermediate plots, and 7.6% on mesic
plots. Only one dry plot had <10% open sky in 2006, while
more than 70% of mesic plots had <10% open sky.
3.2. Sapling dynamics
For the control plots (all years) and the TB plots in 2000
(before treatment), the most abundant individual species in the
large sapling layer (stems 3–10 cm dbh) were red maple and
blackgum, which decreased from dry to mesic plots, and
American beech, which increased with IMI (Fig. 2). In addition
to beech, other shade-tolerant species, including Acer
saccharum, Carpinus caroliniana, and Asimina triloba, were
quite abundant in some mesic areas, particularly in the REMA
TB unit. The REMA TB unit contained a large north-facing
slope with higher IMI values than the other three units and thus
was somewhat of an outlier.
The TB treatments (REMA and ZAL combined) reduced red
maple density sharply between 2000 and 2006, particularly
where it had been most abundant on the dry and intermediate
plots; mean densities decreased from 181 to 7 stems/ha on dry
plots and from 140 to 11 stems/ha on intermediate plots
(Fig. 2a). Blackgum density decreased from a mean of 121 to
34 stems/ha on dry plots and from 87 to 23 stems/ha on
intermediate plots (Fig. 2b). Beech saplings were less abundant
on the two TB units prior to treatment and were largely
eliminated from dry and intermediate plots by 2006 (Fig. 2c).
The group of other mesic shade-tolerant species decreased from
a mean of 274 to 85 saplings/ha on mesic TB plots. On the
control units, large sapling densities of all species exhibited
relatively little change over the 7-year period, although beech
increased from about 50 to 90 saplings/ha on dry plots (Fig. 2c).
3.3. Tree regeneration response to thinning and burning
3.3.1. Oak and hickory
Before treatments on the TB units, mean densities of oak and
hickory seedlings (<50 cm) on dry and intermediate plots were
more than twice that found on mesic plots (Fig. 3). In 2001,
after the initial TB treatments, the numbers of taller oak and
hickory seedlings (10–50 and 50–140 cm height) were
diminished while the smaller (<10 cm) seedlings increased
after resprouting following the initial fire. But this was only a
temporary setback. By 2004, seedlings 10–50 cm height were
once again more abundant than seedlings <10 cm height, and
even the 50–140 cm seedling class numbers were greater than
the small seedlings at this time (Fig. 3).
An increase in mean seedling density (both size classes:<10
and 10–50 cm) was evident in 2006, the second year after the
second fire and the first year after a large acorn crop (primarily
Quercus prinus) fell in autumn 2005. Overall, mean densities of
Fig. 2. Changes in large saplings (3.0–10 cm dbh), by IMI class, for several competitors to oak, by treatment and IMI class for 2000, 2001, 2004, and 2006. Thinning
occurred in winter 2000–2001, with spring burns in 2001 and 2005. The ‘other’ category includes the following species: Acer saccharum, Carpinus caroliniana,
Asimina triloba, Cornus florida, Cercis canadensis, and Oxydendrum arboretum.
L.R. Iverson et al. / Forest Ecology and Management 255 (2008) 3035–30503040

oak and hickory seedlings (<50 cm) increased 32% from 2000
to 2006.
Prior to treatment, there were very few large seedlings
(50–140 cm height) of oak and hickory: densities ranged
from 315 ha�1 on dry plots to 54 ha�1 on mesic plots
(Fig. 3). However, large seedlings were much more abundant
in 2006, averaging 2240 ha�1 and 1640 ha�1 on dry and
intermediate plots, respectively. On mesic plots, however,
large oak and hickory seedling densities remained relatively
low by 2006, averaging 290 ha�1. Small saplings (140 cm
height to 3 cm dbh) of oak and hickory were nearly absent
before treatments and by 2006 their density had increased to
an average of 120 and 80 ha�1 on dry and intermediate plots,
respectively.
Detailed data on individual species of oak (Quercus alba,
Q. coccinea, Q. prinus, Q. rubra, Q. velutina) and Carya spp.
are presented in online Supplement 1. In general, density
shifts by year, IMI, and treatment for individual species are
fairly similar to the overall oak and hickory trends shown in
Fig. 3.
3.3.2. Red maple (A. rubrum)
Small seedlings (<10 cm) of red maple were reduced
dramatically after the 2001 and 2005 fires (Fig. 3). Due to the
sprouting of stems (large saplings and small trees) that were
topkilled after thinning and burning, there were substantial
increases in the density of large seedling (50–140 cm height)
and small sapling (140 to 3 cm dbh) stems by 2004. The highest
densities were on the dry plots for both large seedlings
(mean = 2040 ha�1) and small saplings (1110 ha�1). However,
in 2006, after the 2005 fires, the mean density of red maple
small saplings had been reduced to <20% of that in 2004.
3.3.3. Yellow-poplar (L. tulipifera)
Prior to treatments, yellow-poplar occurred at low densities
in all regeneration size classes (Fig. 3). Abundant seed
Fig. 3. Changes in seedlings and small saplings, 2000–2006, by IMI class on TB plots for oak and hickory, red maple, yellow-poplar, and sassafras. Thinning occurred
in winter 2000–2001, with spring burns in 2001 and 2005.
L.R. Iverson et al. / Forest Ecology and Management 255 (2008) 3035–3050 3041

germination after the 2001 thinning and burning treatments
resulted in dramatic increases in the abundance of small
(<10 cm) seedlings in 2001. These seedlings became
established at high densities across all IMI classes and reached
peak densities in mesic plots (mean = 123,000 ha�1). By 2004,
the fourth growing season after treatments, larger seedlings and
small saplings of yellow-poplar had become abundant in all IMI
classes; however, stem densities declined across all of these size
classes after the second fire in 2005. The mean density of
seedlings 10–50 cm height declined by 70–80% across all IMI
classes, from 2004 to 2006. In 2004, large seedlings (50–
140 cm height) were abundant on mesic plots (mean
density = 12,170 ha�1) and, though reduced by 2006, main-
tained an average density of 5420 ha�1, nearly 20 times that of
oak and hickory large seedlings on mesic plots. Averaged
across all dry and intermediate plots in 2006, oak and hickory
numbers exceeded yellow-poplar on the two smaller size
classes, but yellow-poplar densities exceeded those of oak and
hickory in the larger classes; substantially so for the small
saplings (Fig. 3).
3.3.4. Sassafras
Sassafras seedlings (<50 cm) were most abundant on dry
plots before treatment, averaging 14,800 ha�1 (Fig. 3). Large
seedlings (50–140 cm height) and small saplings were rare on
all IMI classes. Although the abundance of seedlings <50 cm
height remained relatively constant throughout the 7-year
period, large seedlings had increased substantially by 2004; on
dry plots mean densities increased from 17 ha�1 in 2000 to
4310 ha�1 in 2004 and on intermediate plots the increase was
from 11 to 2020 ha�1. Unlike red maple and yellow-poplar, the
density of sassafras large seedlings and small saplings
continued to increase after the second fire in 2005. On dry
plots, by 2006, the mean density of large sassafras seedlings
was 2.5 times that of oak and hickory, and small sapling
densities were more than seven times that of oak and hickory
(Fig. 3).
3.3.5. Other species
Data for eight other species (Acer saccharum, Carpinus
caroliniana, Corylus americana, F. grandifolia, Fraxinus sp.,
Hamamelis virginiana, N. sylvatica, and O. arboretum) are
presented in an online supplement. In general, all of these
species had major reductions in the small sapling (>140 cm
height to 3 cm dbh) class between 2000 and 2006 due to the
fires, but the density of seedlings generally recovered via
sprouting. O. arboretum, Fraxinus spp., Carpinus caroliniana,
and N. sylvatica were the most abundant of these species, both
before and after treatments.
3.4. Tree species relative abundance by size class
Prior to treatment, the oaks and hickories dominated the
overstory size classes, with 79% of the stems over 20 cm dbh
recorded being oaks or hickories (Fig. 4a). In contrast, red
maple was the most abundant species in all five size classes
between 1.4 m height and 20 cm dbh, up to 43.7% of the stems
in the 6–10 cm class. The small saplings (1.4 m height to 3 cm
dbh) were dominated by the other species group (O. arboretum,
Acer saccharum, Carpinus caroliniana, Asimina triloba, and
others) and then red maple, blackgum and beech. The small
seedling (10–50 cm height) layer was composed of 42.4% oaks
and hickories, while the 50–140 cm seedling layer had a mix of
species.
When data were collected in 2006, after thinning and two
fires, several shifts in relative abundances were apparent among
Fig. 4. Relative abundance of species by size class for ZAL and REMA combined in 2000 (before treatment) and 2006 (6 years after thinning and burning).
L.R. Iverson et al. / Forest Ecology and Management 255 (2008) 3035–30503042

species groups (Fig. 4b). The species composition of the
overstory (>20 cm dbh) was relatively unchanged, although the
relative abundance of oaks increased to 84%, while red maple
decreased from 8% to 4%. Preferential thinning to retain oak is
thus apparent. In the midstory (size classes 10–20 cm dbh) red
maple relative abundance decreased from 40% to 31% while
blackgum, hickory, and other shade tolerants concomitantly
increased. Due to the treatments, the densities were much lower
in this size class in 2006 than in 2000.
In the sapling layer (stems 3–10 cm dbh), red maple
exhibited the largest change, decreasing from a total of
276 stems/ha in 2000 to 18 stems/ha in 2006. From the much
smaller pool of total saplings present in 2006 (905 ha�1 in 2000
versus 181 ha�1 in 2006), red maple also decreased in relative
abundance while yellow-poplar and blackgum increased
(Fig. 4).
For the small saplings (140 cm height to 3 cm dbh) and the
large seedlings (50–140 cm), all species groups (except beech
for the saplings) increased in density between 2000 and 2006.
The most dramatic increases were for yellow-poplar and
sassafras, which also increased their relative abundance
substantially after treatment (Fig. 4). Total numbers of stems
in these classes increased nearly 12-fold from 2000 to 2006, to
more than 35,000 stems/ha. Among the smaller seedlings (10–
50 cm height), the relative abundance of oak and hickory
seedlings surpassed 50%, while yellow-poplar increased from
<1% to 9.1%, and the other species dropped from about 18% to
6% relative abundance after the treatments.
3.5. Regeneration of oak and hickory related to light and
IMI
Plotting the density of 2006 oak and hickory large seedlings
(50–140 cm) against canopy openness (for each of the 131 TB
gridpoints) reveals a pattern whereby a minimum of about 8.5%
canopy openness is required to achieve a density of 1800 ha�1
(Fig. 5). Furthermore, 45% of the dry and 32% of the
intermediate plots surpassed the 1800 stems/ha threshold,
compared to two mesic plots (6%).
3.6. Regression tree analysis: factors related to the
abundance of oak regeneration
For the abundance of large oak and hickory seedlings (50–
140 cm) in 2006, regression tree analysis (RTA) of all plots
(control and thin and burn) indicated three significant factors
(splits): (1) open sky in 2006 (percent reduction in error
[PRE] = 0.19); (2) oak and hickory seedling abundance before
treatment (PRE improved to 0.37); (3) the density of competing
saplings in 2004 (PRE improved to 0.50) (Fig. 6). Of the four
terminal nodes, the largest contained 182 plots with open sky
<11.3% and mean oak and hickory density (stems 50–140 cm)
of 524 ha�1 (S.D. = 960); this group included all 107 control
plots and 75 TB plots. Of the remaining 56 TB plots, with open
sky >11.3%, there were three nodes with mean densities of
1382 ha�1 (n = 38), 2776 ha�1 (n = 10), and 7996 ha�1 (n = 8).
Highest oak and hickory densities thus occurred where open
sky exceeded 11.3%, where there were at least 12,500 small
(10–50 cm) oak and hickory seedlings prior to treatments in
2000, and where the density of competing saplings (140 to 3 cm
dbh) is less than 2800 ha�1 (Fig. 6).
In contrast to the RTA of large seedling densities, open sky
did not emerge as a key RTA factor in the analysis of small (10–
50 cm) oak and hickory seedling abundance in 2006 (Fig. 7).
Rather, their abundance was primarily driven by seedling
abundance prior to treatment. The three significant factors
(splits) for the RTA were (1) oak seedling abundance greater or
Fig. 5. Scatterplot of the gridpoints (by IMI class) located on both REMA and
Zaleski thin and burn units, showing the density of large (50–140 cm height)
oak and hickory seedlings 6 years after initial thin and burn treatments. Density
is plotted against canopy openness at each gridpoint. The vertical dashed line
shows 10% canopy openness and the horizontal line indicates a density of
2000 seedlings/ha.
Fig. 6. Regression tree analysis diagram for the abundance of large oak and
hickory seedlings (50–140 cm) in 2006 on both control and TB units. The
number of seedlings was dependent on open sky, the number of large oak and
hickory seedlings in 2000, and the number of competing saplings in 2004.
L.R. Iverson et al. / Forest Ecology and Management 255 (2008) 3035–3050 3043

less than 23,750 ha�1 in 2000 (PRE = 0.26); (2) non-oak
sapling (140 cm height to 3 cm dbh) density greater or less than
2930 in 2004 (PRE improved to 0.32); (3) oak seedling
abundance greater or less than 8750 ha�1 (PRE improved to
0.40). Of the four terminal groups, the largest contained 140
plots that had <8750 seedlings/ha in 2000 and in 2006 had a
mean abundance of 4884 ha�1; this group contained 65% of
control plots and 53% of the TB plots. The second largest group
of plots (n = 74) had between 8750 and 23,750 seedlings/ha in
2000 and in 2006 the mean density was 13,733 ha�1. The
highest oak and hickory seedling (10–50 cm) densities occurred
when densities prior to treatment were >23,750 seedlings/ha.
This branch was split by the number of competing saplings in
2004: for 19 plots with <2930 competing stems, oak and
hickory seedling densities surpassed 38,000 ha�1; this number
was nearly quartered if the competing sapling densities
exceeded 2930 ha�1 (Fig. 7).
3.7. Potential oak–hickory regeneration
To conceptualize the landscape patterns of regeneration,
Figs. 8–10 show canopy openness, IMI, and competitive class
for the control units in 2006, the ZALTB unit in 2000 and 2006,
and the REMA TB unit in 2000 and 2006, respectively. The
circles plotted around each plot center represent the relative
proportion of canopy openness. All control plots (Fig. 8) have
values for open sky <8.7% regardless of IMI; most plots had
less than 5% canopy openness although some plots on the
REMA south-facing, low-IMI slopes had values >5%. On the
treated units, the effects of the TB treatments are apparent for
canopy openness at ZAL (Fig. 9) and REMA (Fig. 10). At
REMA, several plots on the southwest-facing slope (low IMI)
had very open canopies as a result of the intense fire in 2005,
and subsequent overstory mortality.
On the control plots in 2006, oak advance regeneration
(>50 cm height) was present and classified as competitive
(class 4) on 10% of plots at REMA and 12% of plots at Zaleski
(Fig. 8). These plots were located predominantly on dry sites.
On these plots, large (50–140 cm) oak and hickory seedling
densities averaged 2545 ha�1 at REMA and 1145 ha�1 at
Zaleski.
Prior to treatment (2000), only two plots at ZAL TB
contained any large oak seedlings (class 2, Fig. 9a). However,
13 plots (22%) were in class 8, meaning they contained
>10,000 ha�1 small oak and hickory seedlings (<50 cm). By
2006, thinning and burning had greatly increased the number of
Fig. 7. Regression tree analysis diagram for the abundance of small oak and
hickory seedlings (10–50 cm) in 2006 on both control and TB units. The
number of small oak and hickory seedlings was dependent on the number of
small oak and hickory seedlings in 2000 and the number of competing saplings
in 2004.
Fig. 8. Competition classes for control plots in 2006, with IMI as background. See Table 1 and text for details on the classes.
L.R. Iverson et al. / Forest Ecology and Management 255 (2008) 3035–30503044

plots containing oak advance regeneration (Fig. 9b). Thirty-five
of 60 plots had oak and hickory large seedlings present (classes
2–4), and 20 plots were classified as oak being competitive
(class 4). The class 4 plots were distributed throughout the unit
but nearly all were on dry or intermediate sites (IMI < 50). If
canopy openness was 8.5–19% and IMI was classed as dry or
intermediate, we found a 39.4% probability of having oak and
hickory classed as competitive. Of those plots matching the
light and IMI criteria, if at least 5000 oak and hickory small
seedlings (10–50 cm) were present in 2000, the probability for
the plot to become competitive for oak increases to 46.4%.
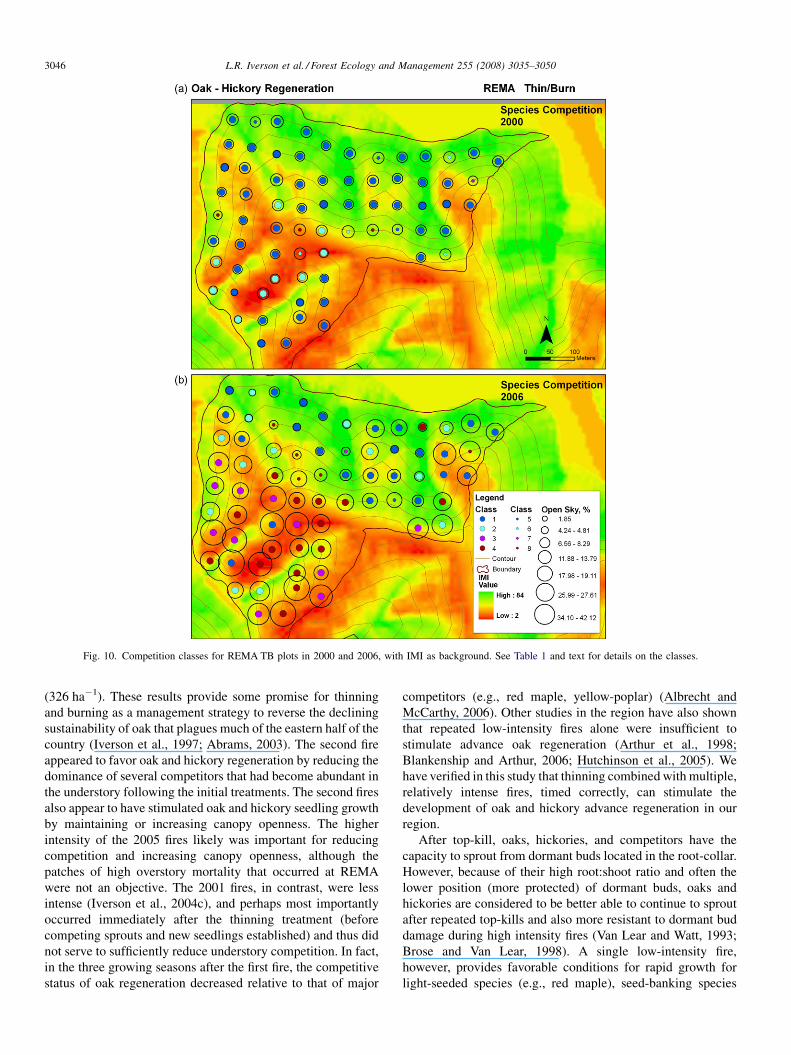
Similar to ZAL, only a few gridpoints on the REMATB unit
contained any large (>50 cm) oak seedlings prior to treatment
in 2000 (Fig. 10a). By 2006, overstory mortality resulting from
the 2005 fire was evident, as 14 plots had>20% open sky; 12 of
which were located on the southwest-facing slope (Fig. 10b).
Competition classes in 2006 were clearly different between the
southwest-facing slope and the north-facing slope. On the
north-facing slope, large oak seedlings were present on 11 of 36
plots but oak was classified as competitive (class 4) on only two
plots. On the southwest- and west-facing slope, large oak
seedlings were present on 29 of 34 plots and oak was classified
as competitive (class 4) on 14 plots. For REMA, when the
canopy openness fell between 8.5% and 19% and the IMI was
classed as dry or intermediate, 48% of the plots were classified
as competitive for oak. If we add the criteria of at least 5000 oak
and hickory small seedlings present in 2000, the probability of
the plot being competitive rises to 64.7%.
4. Discussion
4.1. Effects of thinning and burning
We found that a treatment combining thinning with multiple
burns was successful in increasing the density of large oak and
hickory seedlings (50–140 cm height). By year seven in this
experiment, the mean densities of large oak and hickory
seedlings (50–140 cm height) were more than 3� higher on TB
(1655 seedlings/ha) than C (507 ha�1) at REMA and more than
5� higher on the ZAL TB unit (1758 ha�1) than on the C unit
Fig. 9. Competition classes for ZAL TB plots in 2000 and 2006, with IMI as background. See Table 1 and text for details on the classes.
L.R. Iverson et al. / Forest Ecology and Management 255 (2008) 3035–3050 3045
(326 ha�1). These results provide some promise for thinning
and burning as a management strategy to reverse the declining
sustainability of oak that plagues much of the eastern half of the
country (Iverson et al., 1997; Abrams, 2003). The second fire
appeared to favor oak and hickory regeneration by reducing the
dominance of several competitors that had become abundant in
the understory following the initial treatments. The second fires
also appear to have stimulated oak and hickory seedling growth
by maintaining or increasing canopy openness. The higher
intensity of the 2005 fires likely was important for reducing
competition and increasing canopy openness, although the
patches of high overstory mortality that occurred at REMA
were not an objective. The 2001 fires, in contrast, were less
intense (Iverson et al., 2004c), and perhaps most importantly
occurred immediately after the thinning treatment (before
competing sprouts and new seedlings established) and thus did
not serve to sufficiently reduce understory competition. In fact,
in the three growing seasons after the first fire, the competitive
status of oak regeneration decreased relative to that of major
competitors (e.g., red maple, yellow-poplar) (Albrecht and
McCarthy, 2006). Other studies in the region have also shown
that repeated low-intensity fires alone were insufficient to
stimulate advance oak regeneration (Arthur et al., 1998;
Blankenship and Arthur, 2006; Hutchinson et al., 2005). We
have verified in this study that thinning combined with multiple,
relatively intense fires, timed correctly, can stimulate the
development of oak and hickory advance regeneration in our
region.
After top-kill, oaks, hickories, and competitors have the
capacity to sprout from dormant buds located in the root-collar.
However, because of their high root:shoot ratio and often the
lower position (more protected) of dormant buds, oaks and
hickories are considered to be better able to continue to sprout
after repeated top-kills and also more resistant to dormant bud
damage during high intensity fires (Van Lear and Watt, 1993;
Brose and Van Lear, 1998). A single low-intensity fire,
however, provides favorable conditions for rapid growth for
light-seeded species (e.g., red maple), seed-banking species
Fig. 10. Competition classes for REMA TB plots in 2000 and 2006, with IMI as background. See Table 1 and text for details on the classes.
L.R. Iverson et al. / Forest Ecology and Management 255 (2008) 3035–30503046

(e.g., yellow-poplar), and sprouters (e.g., red maple, blackgum,
sassafras, sourwood). To favor oak and hickory regeneration,
multiple fires will likely be needed in many areas to reduce the
first wave of resprouting competitors.
There was considerable variation in the oak and hickory
density across the landscape, both before and after treatment.
The differential success for oak regeneration on drier sites has
been known for a long time (e.g., Carvell and Tryon, 1961;
Johnson, 1993), but the GIS-derived IMI provides an easily-
produced gradient metric that can be mapped and linked to oak
regeneration suitability and prediction (Iverson et al., 1997,
2004a). The IMI effect was most apparent on the REMA TB
treatment (Fig. 9). The observed increases in oak advance
regeneration occurred almost exclusively on the dry or
intermediate IMI plots located across the southwest-facing
slope; these dry and intermediate IMI plots also exhibited much
greater canopy openness than the mesic plots on the north-
facing slope, a result of higher intensity fires. These results
support the possibility of promoting oak and hickory
regeneration on the dry and intermediate portions of the
landscape. However, these treatments will likely not be
effective, at least in the short-term, for developing oak and
hickory advance regeneration on mesic landscape positions.
Many studies have been conducted using fire, thinning, or
both to promote oak regeneration, with varying degrees of
success. Previously mentioned was our study (Hutchinson
et al., 2005) which found that multiple fires without thinning
did not sufficiently stimulate oak regeneration. However, Dey
and Hartman (2005) applied multiple fires to younger dry oak
forests in the Missouri Ozarks and found that oak and hickory
were favored relative to their competitors. Franklin et al. (2003)
reported that low intensity fire and shelterwood cutting in
Kentucky did not stimulate oak regeneration, and suggested
that ‘more severe disturbance techniques’ are likely needed for
sustainable oak forest management in the central hardwoods
region. Kruger and Reich (1997a,b) found that a single
prescribed fire applied to small openings in young, mesic oak
stands in Wisconsin favored red oak regeneration over
competitors. Brose and Van Lear (1998) showed that a
combination of shelterwood harvest with a single fire
(particularly effective were spring growing-season fires) favored
oak regeneration over red maple and yellow-poplar in the
Virginia Piedmont. Each of these studies varies in forest age and
structure, land-use history, site quality, treatments, and results;
however, all provide insights to build on in order to address some
of the difficulties associated with oak regeneration.
4.2. Oak competitiveness
Our metric of oak competitiveness follows a long line of
research showing that the ultimate success of oak regeneration
depends greatly on the number, size, and spatial distribution of
the oak advance reproduction present when the canopy is
removed. The advance regeneration present is largely a
function of site quality (IMI, fertility), intensity of competition,
and the structure and composition of the mid- and overstory,
which determine canopy openness (Carvell and Tryon, 1961;
Loftis, 1990; Johnson, 1993). An inspection of the maps of
competition class, IMI, and canopy openness (Figs. 9 and 10)
shows the interconnectedness among these factors. Those
places with drier IMI values tended to have greater canopy
openness (largely due to higher intensity fires), which in turn
supported the development of competitive oak and hickory
advance regeneration. Adequate light availability has been
shown to be critical for oak and hickory regeneration success.
However, high light levels can also stimulate shade-intolerant
species such as yellow-poplar (Loftis and McGee, 1993;
Hodges and Gardiner, 1993). In our study, the development of
significant numbers of taller oak regeneration (>1800 stems/ha
and >50 cm height) occurred almost exclusively on plots with
8.5–19% canopy openness (post-treatment average for 2001
and 2006). This canopy openness range is similar to that
reported in studies that showed an increase in oak advance
regeneration when stand basal area was reduced mechanically
(e.g., Loftis, 1993).
A simple model incorporating these trends shows that, at any
point on the landscape, if canopy openness can be increased to
8.5–19%, the IMI value is dry or intermediate (IMI < 50), and
sufficient seedlings (10–50 cm) were present prior to treatment
(>5000 ha�1), one can expect a 54% probability that the oak
and hickory component would become competitive according
to our rating scheme for the combined sites. This probability
was higher on REMA (65%) versus ZAL (46%) presumably
because of the higher intensity fires and greater canopy
openness on the dry and intermediate locations at REMA. If we
included class 3 (similar number of large oak seedlings present
but greater competition load, Table 1) along with class 4, the
probability rises to 67%. This simple model allows a quick,
practical method in targeting fire and thinning operations for
maximum benefit in regenerating oak communities: focus on
sites of dry or intermediate IMI (generally includes ridges and
upper slopes of all aspects and all south-facing slopes) with at
least one oak and hickory seedling every 2 m2, thin the stand to
increase canopy openness, and then burning at least twice over
the ensuing 5–10 years. However, our study suggests that
burning immediately after thinning provides only limited
control of competition, which has not yet developed in the
understory.
Small seedlings (<50 cm) of oak and hickory also increased
substantially between 2004 and 2006, much more so at the ZAL
TB than at REMA TB. The difference between sites can be
explained by two differences: a mast year for chestnut oak (Q.
prinus) in 2005 and the variation in fire severity between the
two sites. ZAL has a higher proportion of chestnut oak in the
canopy (most of the ‘white’ oak component, Fig. 4), whereas
REMA has a relatively larger white oak (Q. alba) and red oak
component. Chestnut oak’s large mast in autumn 2005, after the
spring 2005 fire, therefore resulted in greater seedling
establishment in 2006 at ZAL TB. At REMA, the high
intensity 2005 fires on the dry sites killed substantial patches of
overstory oaks, thus reducing seed sources; the open canopy
also stimulated extensive competition from Rubus spp. and
other species. In contrast, the burn at ZAL was generally of
moderate intensity throughout the unit and killed few overstory
L.R. Iverson et al. / Forest Ecology and Management 255 (2008) 3035–3050 3047

oaks. These oaks, dominated by chestnut oak, then produced a
large crop of acorns and new seedlings, which may also have
benefited from an improved seedbed for germination and
establishment.
4.3. Competitor species
Many of the species competing with oaks and hickories were
also greatly affected by the treatments over time. The species
with the largest dynamics over time were red maple, yellow-
poplar, and sassafras, though the ‘other species’ group was
abundant in certain locations (especially mesic sites). As is
apparent by now, the competition of non-oak species, along
with the site conditions (e.g., IMI, light) and the number and
size of oak and hickory plants in place prior to treatment
determines whether oak and hickory regeneration will be
successful.
The huge influxes of small seedlings on the TB-treated sites
are primarily new yellow-poplar seedlings that appeared after
the initial TB treatment. Small red maple seedlings were also
abundant across the landscape but were reduced by fire
treatments. The highest numbers of seedlings at any time were
found on the mesic sites in 2001, just after the initial treatment,
when the densities of non-oaks (predominantly yellow-poplar)
exceeded 120,000 (REMA) and 150,000 (ZAL) seedlings/ha
(equivalent to 12–15 seedlings/m2 across the entire landscape).
However, these densities were not sustained; after the second
burn in 2005, the density of small non-oak seedlings was
actually lower on the TB units than on the controls.
The density of non-oak seedlings in the 10–50 cm size class
peaked in 2004. This probably indicates that growth (and self-
thinning) ensued following the 2001 flush of germinants, and
that many of the germinants had grown into the 10–50 cm class
by 2004. The fires of 2005 produced heavy mortality so that the
densities in 2006 were again lower. The second fire was
critically important in this regard, altering the successional
progression apparent from the earlier work by Albrecht and
McCarthy (2006).
The advance regeneration (large seedling and small
saplings) of non-oak species was most abundant in 2004,
likely a result of a post-treatment stimulation of germinants
(e.g., yellow-poplar) and sprouts (e.g., red maple) resulting
from the initial thinning and burning treatment. For example,
red maple had as many as 30 stems sprouting from one cut 10–
15 cm tree. These stems were reduced by the 2005 burn,
especially in the dry and intermediate sites. However, the
density of sassafras advance regeneration, which was abundant
on dry sites, actually increased after the second burns.
Overall, we found that there was, and continues to be even
after our treatments, substantial competition for oak regenera-
tion across much of the landscape. This competition likely
reduced the size and number of oaks and hickories developing
into the advance regeneration layer. In drier landscape
positions, competition was greatest from red maple, sassafras,
yellow-poplar, and blackgum. Additional competition from
dense thickets of shrubs such as Smilax spp. and Rubus spp.,
was also prevalent across the landscape.
5. Conclusion
Despite receiving much attention in the last several
decades, regenerating oak continues to be difficult throughout
the eastern United States. The multitude of natural and human
values created by oak-dominated communities underscores
the need to develop better tools to sustain oak forests. Our
study of thinning and burning on relatively large (>20 ha)
treatment units shows some promise and also some of the
problems that managers face (management scale). Though
thinning and burning increased the density of oak advance
regeneration (large seedlings 50–140 cm), there also was
ample competition from species that had different strategies
in dealing with the new conditions brought about by the
thinning and burning. We found that there was a large spatial
variation in oak regeneration across these large sites because
topography, fire intensity, and canopy openness were also
highly variable. Our simple model for this region suggests
that if a mature forest on a dry or intermediate site with at
least 5000 oak and hickory seedlings/ha is thinned and burned
to reduce competition and sustain 8.5–19% canopy openness,
there is a 50% chance (or 50% of the treated area matching
these criteria) of success in oak and hickory becoming
competitive for a position in the next forest. We thus are
encouraged by the results of this study and intend to continue
to monitor the structure and composition of tree regeneration
on these sites.
Acknowledgements
The authors are indebted to a host of field workers that
helped make this possible, including Robert Ford, Aaron
Iverson, Rebecca Wells, Brian McCombs, Justin Prindle, Jeff
Mathews, David Hosack, Levi Miller, William Borovicka,
Kristy Tucker, and Brad Tucker. Rebecca Wells also
analyzed the hemispherical photographs for 2000 and
2001. Thanks also to Daniel Yaussy for oversight as manager
for the FFS study in Ohio, Mary Boda as project coordinator,
and Michael Bowden and the Ohio Division of Forestry for
their lead in conducting the burns and thinning. We thank
Matthew Albrecht, Ralph Boerner, John Stanovich, and
Lars Brudvig for reviews and Susan Wright for technical
edits, which greatly improved the manuscript. This is
contribution number 150 of the National Fire and Fire
Surrogate Research Project. Although the authors received
no direct funding from the U.S. Joint Fire Science Program
(JFSP), this research could not have been accomp-
lished without JFSP support of existing Fire and Fire
Surrogate project sites. This research was also supported in
part by the National Fire Plan through the Ohio Hills Fire
Behavior and Effects project administered by USFS Project
NRS-4151.
Appendix A. Supplementary data
Supplementary data associated with this article can be found,
in the online version, at doi:10.1016/j.foreco.2007.09.088.
L.R. Iverson et al. / Forest Ecology and Management 255 (2008) 3035–30503048

References
Abrams, M.C., 2003. Where has all the white oak gone? BioScience 53, 927–
939.
Albrecht, M.A., McCarthy, B.C., 2006. Effects of prescribed fire and thinning
on tree recruitment patterns in central hardwood forests. For. Ecol. Manage.
226, 88–103.
Arthur, M.A., Paratley, R.D., Blankenship, B.A., 1998. Single and repeated fires
affect survival and regeneration of woody and herbaceous species in an oak-
pine forest. J. Torrey Botan. Soc. 125 (3), 225–236.
Beatley, J.C., Bartley, F., 1959. The primeval forests of a periglacial area in the
Allegheny Plateau. Bull. Ohio Biolog. Survey 1, 25–166.
Beck, D.E., 1990. Liriodendron tulipifera L. Yellow-poplar. In: Burns, R.M.,
Honkala, B.H. (tech coords.), Silvics of North America: 2. Hardwoods.
U.S.D.A., Agricul. Handb. 654, pp. 406–416.
Blankenship, B.A., Arthur, M.A., 2006. Stand structure over 9 years in burned
and fire-excluded oak stands on the Cumberland Plateau, Kentucky. For.
Ecol. Manage. 225, 134–145.
Boerner, R.E.J., 2006. Unraveling the Gordian Knot: interactions among
vegetation, topography, and soil properties in the central and southern
Appalachians. J. Torrey Botan. Soc. 133, 321–361.
Boerner, R.E.J., Morris, S.J., Sutherland, E.K., Hutchinson, T.F., 2000. Spatial
variability in soil nitrogen dynamics after prescribed burning in Ohio
mixed-oak forests. Landsc. Ecol. 15, 425–439.
Brose, P.H., Van Lear, D.H., 1998. Responses of hardwood advance regenera-
tion to seasonal prescribed fires in oak-dominated shelterwood stands. Can.
J. For. Res. 28, 331–339.
Brose, P., Van Lear, D., Cooper, R., 1999. Using shelterwood harvests and
prescribed fire to regenerate oak stands on productive upland sites. For.
Ecol. Manage. 113, 125–141.
Brose, P., Schuler, T., Van Lear, D., Berst, J., 2001. Bringing fire back.
The changing regimes of the Appalachian mixed-oak forests. J. For. 99,
30–35.
Carvell, K.L., Tryon, E.H., 1961. The effect of environmental factors on
the abundance of oak regeneration beneath mature oak stands. For. Sci. 7,
98–105.
Chen, J., Saunders, S.C., Crow, T.R., Naiman, R.J., Brosofske, K.D., Mroz,
G.D., Brookshire, B.L., Franklin, J.F., 1999. Microclimate in forest eco-
system and landscape ecology. BioScience 49, 288–297.
Dennis, D.F., Birch, T.W., 1981. Forest statistics for Ohio-1979. U.S.D.A.
Forest Service, Northeastern Research Station, Resource Bulletin NE-68.
Dettmers, R., Bart, J., 1999. A GIS modeling method applied to predicting
forest songbird habitat. Ecol. Appl. 9, 152–163.
Dey, D.C., Hartman, G., 2005. Returning fire to Ozark Highland forest
ecosystems: effects on advance regeneration. For. Ecol. Manage. 217,
37–53.
Dickinson, M.B. (Ed.), 2006. Fire in eastern oak forests: delivering science to
land managers, Proceedings of a Conference; U.S.D.A. Forest Service,
Northern Research Station Gen. Tech. Rep. NRS-P-1.
Dyer, J.M., 2001. Using witness trees to assess forest change in southeastern
Ohio. Can. J. For. Res. 31, 1708–1718.
Franklin, S.B., Robertson, P.A., Fralish, J.S., 2003. Prescribed burning effects
on upland Quercus forest structure and function. For. Ecol. Manage. 184,
315–335.
Frazer, G.W., Canham, C.D., Lertzman, K.P., 1999. Gap Light Analyzer (GLA),
Version 2.0: Imaging software to extract canopy structure and gap light
transmission indices from true-colour fisheye photographs, users manual
and program documentation. Simon Fraser University and the Institute of
Ecosystem Studies, Burnaby, British Columbia and Millbrook, NY.
Griffith, D.M., DiGiovanni, D.M., Witzel, T.L., Wharton, E.H., 1993. Forest
statistics for Ohio, 1991. U.S.D.A. Forest Service, Northeastern Forest
Experiment Station, Resource Bulletin NE-128.
Hilt, D.E., 1985. Species composition of young central hardwood stands that
develop after clearcutting. In: Dawson, J.O., Majerus, K.A. (Eds.), Pro-
ceedings of the Fifth Central Hardwood Forest Conference. University of
Illinois, Department of Forestry, pp. 11–14.
Hodges, J., Gardiner, E., 1993. Ecology and physiology of oak regeneration. In:
Loftis, D.L., McGee, C.E. (Eds.), Oak regeneration: serious problems,
practical recommendations. U.S.D.A. Forest Service, Southeastern Forest
Experiment Station. General Technical Report SE-84, pp. 54–65.
Hutchinson, T.F., Boerner, R.E.J., Iverson, L.R., Sutherland, S., 1999. Land-
scape patterns of understory composition and richness across a moisture and
nitrogen mineralization gradient in Ohio (U.S.A.) Quercus forests. Plant
Ecol. 144, 179–189.
Hutchinson, T.F., Sutherland, E.K., Yaussy, D.A., 2005. Effects of repeated
prescribed fires on the structure, composition, and regeneration of mixed-
oak forests in Ohio. For. Ecol. Manage. 218, 210–228.
Iverson, L.R., Dale, M.E., Scott, C.T., Prasad, A., 1997. A GIS-derived
integrated moisture index to predict forest composition and productivity
in Ohio forests. Landsc. Ecol. 12, 331–348.
Iverson, L.R., Oliver, R.L., Tucker, D.P., Risser, P.G., Burnett, C.D., Rayburn,
R.G., 1989. Forest resources of Illinois: an atlas and analysis of spatial and
temporal trends. Ill. Nat. Hist. Survey Spec. Publ. 11, Champaign, IL.
Iverson, L.R., Prasad, A.M., Hutchinson, T.F., Rebbeck, J., Yaussy, D.A.,
2004a. Fire and thinning in an Ohio oak forest: grid-point analysis of fire
behavior, environmental conditions, and tree regeneration across a topo-
graphic moisture gradient. In: Spetich, M. (Ed.), Upland Oak Ecology
Symposium: History, Current Conditions, and Sustainability. U.S.D.A.
Forest Service, Southern Research Station, General Technical Report
SRS-73, pp. 190–197.
Iverson, L.R., Prasad, A.M., Rebbeck, J., 2004b. A comparison of the integrated
moisture index and the topographic wetness index as related to two years of
soil moisture monitoring in Zaleski State Forest, Ohio. In: Yaussy, D.A.,
Hix, D.M., Goebel, P.C., Long, R.P. (Eds.), Proceedings of the 14th Central
Hardwoods Conference. U.S. Forest Service, Northeastern Research Station
General Technical Report NE-316, pp. 515–517.
Iverson, L.R., Scott, C.T., Dale, M., Prasad, A.M.G., 1996. Development of an
integrated moisture index for predicting species composition. In: Kohl, M.,
Gertner, G.Z. (Eds.), Caring for the forest: research in a changing world.
Statistics, mathematics, and computers. Proceedings of the meeting of
IUFRO S.4.11-00. Swiss Federal Institute for Forest, Snow and Landscape
Research, Birmensdorf, Switzerland, pp. 101–116.
Iverson, L.R., Yaussy, D.A., Rebbeck, J., Hutchinson, T.L., Long, R., Prasad,
A.M., 2004c. A comparison of thermocouples and paints to monitor the
spatial and temporal distribution of fire behavior from prescribed fires. Int. J.
Wildland Fire 13, 311–322.
Johnson, P.S., 1993. Sources of oak reproduction. In: Loftis, D.L., McGee, C.E.
(Eds.), Oak regeneration: serious problems, practical recommendations.
U.S.D.A. Forest Service, Southeastern Forest Experiment Station, General
Technical Report SE-84, pp. 202–210.
Johnson, P.S., Shifley, S.R., Rogers, R., 2002. The Ecology and Silviculture of
Oaks. CABI Publishing, New York, NY.
Kang, S., Kim, S., Lee, D., 2000. Predicting spatial and temporal patterns of soil
temperature based on topography, surface cover and air temperature. For.
Ecol. Manage. 136 (1/3), 173–184.
Kingsley, N.P., Mayer, C.E., 1970. The timber resources of Ohio. U.S.D.A.
Forest Service, Northeastern Forest Experiment Station, Resource Bulletin
NE-19.
Kruger, E.L., Reich, P.B., 1997a. Responses of hardwood regeneration to fire in
mesic forest openings. I. Post-fire community dynamics. Can. J. For. Res.
27, 1822–1831.
Kruger, E.L., Reich, P.B., 1997b. Responses of hardwood regeneration to fire in
mesic forest openings. III. Whole-plant growth, biomass distributions, and
nitrogen and carbohydrate relations. Can. J. For. Res. 27, 1841–1850.
Leete, B.E., 1938. Forest fires in Ohio 1923 to 1935. Ohio Agricul. Exper. Sta.,
Bulletin 598.
Loftis, D.L., 1990. A shelterwood method for regenerating red oak in the
Southern Appalachians. For. Sci. 36, 917–929.
Loftis, D.L., 1993. Regenerating northern red oak on high-quality sites in the
Southern Appalachians. In: Loftis, D.L., McGee, C.E. (Eds.), Oak regen-
eration: serious problems, practical recommendations. U.S.D.A. Forest
Service, Southeastern Forest Experiment Station. General Technical Report
SE-84, pp. 202–210.
Loftis, D.L., McGee, C.E. (Eds.), 1993. Oak regeneration: serious problems,
practical recommendations. U.S.D.A. Forest Service, Southeastern Forest
Experiment Station. General Technical Report SE-84.
L.R. Iverson et al. / Forest Ecology and Management 255 (2008) 3035–3050 3049

Marquis, D., 1990. Prunus serotina Ehrh. Black cherry. In: Burns, R.M.,
Honkala, B.H. (tech coords.) Silvics of North America: 2. Hardwoods.
U.S. Department of Agriculture, Agric. Handbk 654, pp. 594–602.
McEwan, R.W., Long, R.P., Ford, R.D., Hutchinson, T.F., McCarthy, B.C.,
2007. Temporal and spatial patterns of fire occurrence during the estab-
lishment of mixed-oak forests in eastern North America. J. Veg. Sci. 18,
655–664.
McShea, W.J., Healy, W.H., 2002. Oak forest ecosystems. In: Ecology and
Management for Wildlife, The Johns Hopkins University Press, Baltimore.
McWilliams, W.H., Alerich, C.A., Devlin, D.A., Lister, A.J., Lister, T.W.,
Sterner, S.L., Westfall, J.A., 2004. Annual inventory report for Pennsylva-
nia’s forests: results from the first three years. U.S.D.A. Forest Service,
Northeastern Research Station, Resource Bulletin NE-159.
Nowacki, G.J., Abrams, M.D., 1992. Community, edaphic, and historical
analysis of mixed oak forests of the ridge and valley province in central
Pennsylvania. Can. J. For. Res. 22, 790–800.
Rebbeck, J., Long, R.P., Yaussy, D.A., 2004. Survival of hardwood seedlings
and saplings one year following a prescribed fire and overstory thinning in
southeastern Ohio. In: Yaussy, D.A., Hix, D.M., Long, R.P., Goebel, P.C.
(Eds.), Proceedings of the 14th Central Hardwood Forest Conference.
U.S.D.A. Forest Service, Northeastern Research Station, General Technical
Report NE-316, p. 210.
Southern Appalachian Man and the Biosphere (SAMAB), 1996. The Southern
Appalachian Terrestrial Technical Report. Report 5 of 5. U.S.D.A. Forest
Service, Southern Region.
Spetich, M.A. (Ed.), 2004. Upland oak ecology. Symposium: history, current
conditions, and sustainability. U.S.D.A. Forest Service, Southern Research
Station, General Technical Report SRS-73.
Sutherland, E.K., 1997. History of fire in a southern Ohio second-growth mixed-
oak forest. In: Pallardy, S.G., Cecich, R.A., Garrett, H.E., Johnson, P.S.
(Eds.), Proceedings of the 11th Central Hardwood Forest Conference.
U.S.D.A. Forest Service, North Central Forest Experiment Station, General
Technical Report NC-188, pp. 172–183.
Sutherland, E.K., Hutchinson, T.F. (Eds.), 2003. Characteristics of mixed-oak
forests in Ohio. U.S.D.A. Forest Service, Northeastern Research Station,
General Technical Report NE-299.
Van Lear, D.H., Watt, J.M., 1993. The role of fire in oak regeneration. In: Loftis,
D.L., McGee, C.E. (Eds.), Oak regeneration: serious problems, practical
recommendations. U.S.D.A. Forest Service, Southeastern Forest Experi-
ment Station, General Technical Report SE-84, pp. 66–78.
Youngblood, A., Metlen, K.L., Knapp, E.E., Outcalt, K.W., Stephens, S.L.,
Waldrop, T.A., Yaussy, D., 2005. Implementation of the fire and fire
surrogate study—a national research effort to evaluate the consequences
of fuel reduction treatments. In: Peterson, C.E., Maguire, D.A. (Eds.),
Balancing ecosystem values: innovative experiments for sustainable for-
estry: proceedings of a conference. U.S.D.A. Forest Service, Pacific North-
west Research Station, General Technical Report PNW-635, pp. 315–321.
Zheng, D.L., Chen, J.Q., Song, B., Xu, M., Sneed, P., Jensen, R., 2000. Effects
of silvicultural treatments on summer forest microclimate in southeastern
Missouri Ozarks. Clim. Res. 15, 45–59.
L.R. Iverson et al. / Forest Ecology and Management 255 (2008) 3035–30503050
Copyright © 2022 FDOKUMEN