Observations of enhanced thinning in the upper reaches of Svalbard glaciers
13
The Cryosphere, 6, 1369–1381, 2012 www.the-cryosphere.net/6/1369/2012/ doi:10.5194/tc-6-1369-2012 © Author(s) 2012. CC Attribution 3.0 License. The Cryosphere Observations of enhanced thinning in the upper reaches of Svalbard glaciers T. D. James 1 , T. Murray 1 , N. E. Barrand 2 , H. J. Sykes 1 , A. J. Fox 2 , and M. A. King 3 1 Department of Geography, Swansea University, Swansea, UK 2 British Antarctic Survey, Cambridge, UK 3 School of Civil Engineering and Geosciences, Newcastle University, Newcastle upon Tyne, UK Correspondence to: T. D. James ([email protected]) Received: 5 February 2012 – Published in The Cryosphere Discuss.: 15 March 2012 Revised: 1 November 2012 – Accepted: 2 November 2012 – Published: 20 November 2012 Abstract. Changes in the volume and extent of land ice of the Svalbard archipelago have been the subject of con- siderable research since their sensitivity to changes in cli- mate was first noted. However, the measurement of these changes is often necessarily based on point or profile mea- surements which may not be representative if extrapolated to a whole catchment or region. Combining high-resolution elevation data from contemporary laser-altimetry surveys and archived aerial photography makes it possible to mea- sure historical changes across a glacier’s surface without the need for extrapolation. Here we present a high spatial res- olution time-series for six Arctic glaciers in the Svalbard archipelago spanning 1961 to 2005. We find high variabil- ity in thinning rates between sites with prevalent elevation changes at all sites averaging -0.59 ± 0.04 m a -1 between 1961–2005. Prior to 1990, ice surface elevation was changing at an average rate of -0.52 ± 0.09 m a -1 which decreased to -0.76 ± 0.10 m a -1 after 1990. Setting the elevation changes against the glaciers’ altitude distribution reveals that signif- icant increases in thinning rates are occurring most notably in the glaciers’ upper reaches. We find that these changes are coincident with a decrease in winter precipitation at the Longyearbyen meteorological station and could reflect a de- crease in albedo or dynamic response to lower accumulation. Further work is required to understand fully the causes of this increase in thinning rates in the glaciers’ upper reaches. If on-going and occurring elsewhere in the archipelago, these changes will have a significant effect on the region’s future mass balance. Our results highlight the importance of under- standing the climatological context of geodetic mass balance measurements and demonstrate the difficulty of using index glaciers to represent regional changes in areas of strong cli- matological gradients. 1 Introduction The glaciers and ice caps of Svalbard (covering ca. 36 000 km 2 ) are considered to be an early indicator of Arc- tic cryospheric response to climate change due to their posi- tion at the northern extent of the warm North Atlantic cur- rents and consequent sensitivity to climatic trends (Flem- ing et al., 1997; Lefauconnier et al., 1999). Thus, there have been a number of important investigations into the mass bal- ance of the archipelago’s ice. Early reports of stake and pit records dating back to the 1950s found that several Sval- bard glaciers were in negative balance, and the authors hy- pothesized that this had probably been the case since their Little Ice Age maximum in the early 20th century (Hagen and Liestøl, 1990; Lefauconnier et al., 1999). The consis- tent negative balance suggested that Svalbard glaciers were not in balance with current climatic conditions. However, the lack of significant trend in the rates of mass loss indicated no response to atmospheric warming. A pan-Arctic study of mass balance also reported high rates of mass loss in Sval- bard at three glaciers between 1945 and 1995 (-0.55 m wa- ter equivalent (w.e.) a -1 ) but again without any signal of anthropogenic-driven warming suggesting any such signal could be lost in the high annual variability (Dowdeswell et al., 1997). Published by Copernicus Publications on behalf of the European Geosciences Union.
Transcript of Observations of enhanced thinning in the upper reaches of Svalbard glaciers

The Cryosphere, 6, 1369–1381, 2012www.the-cryosphere.net/6/1369/2012/doi:10.5194/tc-6-1369-2012© Author(s) 2012. CC Attribution 3.0 License.
The Cryosphere
Observations of enhanced thinning in the upperreaches of Svalbard glaciers
T. D. James1, T. Murray 1, N. E. Barrand2, H. J. Sykes1, A. J. Fox2, and M. A. King 3
1Department of Geography, Swansea University, Swansea, UK2British Antarctic Survey, Cambridge, UK3School of Civil Engineering and Geosciences, Newcastle University, Newcastle upon Tyne, UK
Correspondence to:T. D. James ([email protected])
Received: 5 February 2012 – Published in The Cryosphere Discuss.: 15 March 2012Revised: 1 November 2012 – Accepted: 2 November 2012 – Published: 20 November 2012
Abstract. Changes in the volume and extent of land iceof the Svalbard archipelago have been the subject of con-siderable research since their sensitivity to changes in cli-mate was first noted. However, the measurement of thesechanges is often necessarily based on point or profile mea-surements which may not be representative if extrapolatedto a whole catchment or region. Combining high-resolutionelevation data from contemporary laser-altimetry surveysand archived aerial photography makes it possible to mea-sure historical changes across a glacier’s surface without theneed for extrapolation. Here we present a high spatial res-olution time-series for six Arctic glaciers in the Svalbardarchipelago spanning 1961 to 2005. We find high variabil-ity in thinning rates between sites with prevalent elevationchanges at all sites averaging−0.59± 0.04 m a−1 between1961–2005. Prior to 1990, ice surface elevation was changingat an average rate of−0.52± 0.09 m a−1 which decreased to−0.76± 0.10 m a−1 after 1990. Setting the elevation changesagainst the glaciers’ altitude distribution reveals that signif-icant increases in thinning rates are occurring most notablyin the glaciers’ upper reaches. We find that these changesare coincident with a decrease in winter precipitation at theLongyearbyen meteorological station and could reflect a de-crease in albedo or dynamic response to lower accumulation.Further work is required to understand fully the causes ofthis increase in thinning rates in the glaciers’ upper reaches.If on-going and occurring elsewhere in the archipelago, thesechanges will have a significant effect on the region’s futuremass balance. Our results highlight the importance of under-standing the climatological context of geodetic mass balance
measurements and demonstrate the difficulty of using indexglaciers to represent regional changes in areas of strong cli-matological gradients.
1 Introduction
The glaciers and ice caps of Svalbard (covering ca.36 000 km2) are considered to be an early indicator of Arc-tic cryospheric response to climate change due to their posi-tion at the northern extent of the warm North Atlantic cur-rents and consequent sensitivity to climatic trends (Flem-ing et al., 1997; Lefauconnier et al., 1999). Thus, there havebeen a number of important investigations into the mass bal-ance of the archipelago’s ice. Early reports of stake and pitrecords dating back to the 1950s found that several Sval-bard glaciers were in negative balance, and the authors hy-pothesized that this had probably been the case since theirLittle Ice Age maximum in the early 20th century (Hagenand Liestøl, 1990; Lefauconnier et al., 1999). The consis-tent negative balance suggested that Svalbard glaciers werenot in balance with current climatic conditions. However, thelack of significant trend in the rates of mass loss indicatedno response to atmospheric warming. A pan-Arctic study ofmass balance also reported high rates of mass loss in Sval-bard at three glaciers between 1945 and 1995 (−0.55 m wa-ter equivalent (w.e.) a−1) but again without any signal ofanthropogenic-driven warming suggesting any such signalcould be lost in the high annual variability (Dowdeswell etal., 1997).
Published by Copernicus Publications on behalf of the European Geosciences Union.

1370 T. D. James et al.: Observations of enhanced thinning in the upper reaches of Svalbard glaciers
The difficulty in generalising volume or mass balancechanges to the archipelago from point or profile data isthat they do not necessarily account for the ice hypsomet-ric distribution or the strong climatic gradients that prevailin Svalbard (Førland and Hanssen-Bauer, 2003). The im-portance of these parameters was recognized by Hagen etal. (2003) who applied average net balance/altitude curvesderived from direct mass balance measurements, ice coresand ground penetrating radar (GPR) in 13 identified regionsaround the archipelago. Using data that covered the period1969 to 1999, they measured a “slightly negative” net bal-ance (−0.014± 0.003 m w.e. a−1) with the majority of losscoming from smaller mountain glaciers with higher elevationice caps closer to balance. Advances in airborne and space-borne surveying have significantly improved the distributionof mass balance measurements to better capture regionalvariability. Centreline airborne laser surveys in 1996 and2002 over 16 ice caps and glaciers revealed a complex patternof elevation change with mean changes of−0.19 m w.e. a−1
(Bamber et al., 2005). A historical context was provided us-ing old topographic maps and aerial photographs which gaveestimated mass changes of−0.30 m w.e. a−1 from the mid-1930s to 1990 in the west and southwest regions (Nuth etal., 2007); an average of−0.53 m w.e. a−1 for the ice caps ofthe island of Edgeøya between 1970–2002 (Kaab, 2008); and−0.36± 0.02 m w.e. a−1 between the 1960s and early 2000s(Nuth et al., 2010).
The mass balance results of the studies cited above varyconsiderably, and comparison is difficult due to differencesin methodology, study area and temporal coverage. How-ever, there is general agreement that the ice of the Svalbardarchipelago is significantly losing mass. While reports basedon data from the 1990s and earlier found no strong evidenceof atmospheric warming, more recent research suggests thatrates of mass loss are increasing and that this is likely at-tributable to local climate trends (Kohler et al., 2007). How-ever, mass balance studies have been hampered by a varietyof limitations including short time series, low spatial resolu-tion and/or poor distribution of sample sites. Recent evidencesuggests that sparse direct or indirect mass balance dataare not necessarily representative of regional-scale or evenglacier-wide mass changes (Barrand et al., 2010; Berthieret al., 2010). As yet, no study of Svalbard mass balancehas been able to provide the following simultaneously: (i) awidely spread sample of sites; (ii) multiple-decade time se-ries; (iii) over several epochs; and (iv) using high-resolution,full-width topographic data.
In this paper we combine historical aerial photographsand contemporary airborne laser altimetry (lidar) surveysto produce three to four epochs of high-resolution DEMsfor six sites around Svalbard. The resulting volume changemeasurements are produced from tens of thousands of in-dividual change measurements for each site that typicallycover the full glacier width without the need for extrapola-tion. This approach enables the detection of spatially vari-
able changes that are not necessarily represented by centre-line profiles or low-resolution studies and therefore will pro-vide improved understanding of glacier mass balance in theSvalbard archipelago.
2 Data and methods
2.1 Topographic modelling
We targeted a number of potential sites around the Sval-bard archipelago for topographic modelling. Site selectionwas based on spatial distribution, elevation range, aspect,and suitability for photogrammetry. Since photogrammetryis dependent on stable surfaces from which ground controlpoints (GCPs) can be measured, potential sites were lim-ited to those whose geometry provided a sufficient distri-bution of exposed bedrock and stable depositional features.This necessitated the exclusion of the large ice cap on theislands of Nordaustlandet and Kvitøya. Aerial photographiccoverage of Svalbard has been frequent but incomplete withonly the 1990 campaign offering near complete coverage ofthe archipelago. Thus, during the site selection process weidentified glaciers where at least two epochs of historic pho-tographs were available. However, because of the poor im-age quality and processing difficulty, we opted to exclude thehigh-oblique photographs from the 1930s. Since the meth-ods employed here cannot differentiate between climate-driven elevation changes and those from surge and tidewa-ter dynamics over these timescales, we limited sites to land-terminating, non-surge-type glaciers. Therefore, the resultspresented below do not account for any dynamically drivenchanges in glacier volume. We have also not accounted forany elevation errors due to date-offsets between the photo-graphic epochs since these errors (on the order of a meter)are negligible compared to the large changes expected oversuch long periods (upwards of 100 m).
Of the sites selected, high-resolution lidar surveys weresuccessfully undertaken for 6 glaciers including AustreBrøggerbreen (AB), Albrechtbreen (AL), Grønfjordbreen(GB), Gullfaksebreen (GF), Midtre Lovenbreen (ML) andSlakbreen (SB) (Fig. 1 and Table 1). Surveys were acquiredduring summer 2003 and 2005 by the Airborne Research andSurvey Facility (ARSF) of the UK’s Natural EnvironmentResearch Council (NERC) using an Optech ALTM 3033laser scanner that recorded first and last laser return and ac-companying 8-bit laser return intensity. Since AL and GFboth extend into large ice caps, which are inappropriate forphotogrammetry, these catchments could not be surveyed intheir entirety. We estimate that our surveys cover∼ 35 % ofthe area and 65 % of the elevation range of the AL catchmentbased on Hagen et al. (1993) estimates. For GF we estimate∼ 50 % of the area and 93 % of the elevation range. For bothglaciers our coverage includes the areas of greatest change
The Cryosphere, 6, 1369–1381, 2012 www.the-cryosphere.net/6/1369/2012/
T. D. James et al.: Observations of enhanced thinning in the upper reaches of Svalbard glaciers 1371
24
1
2
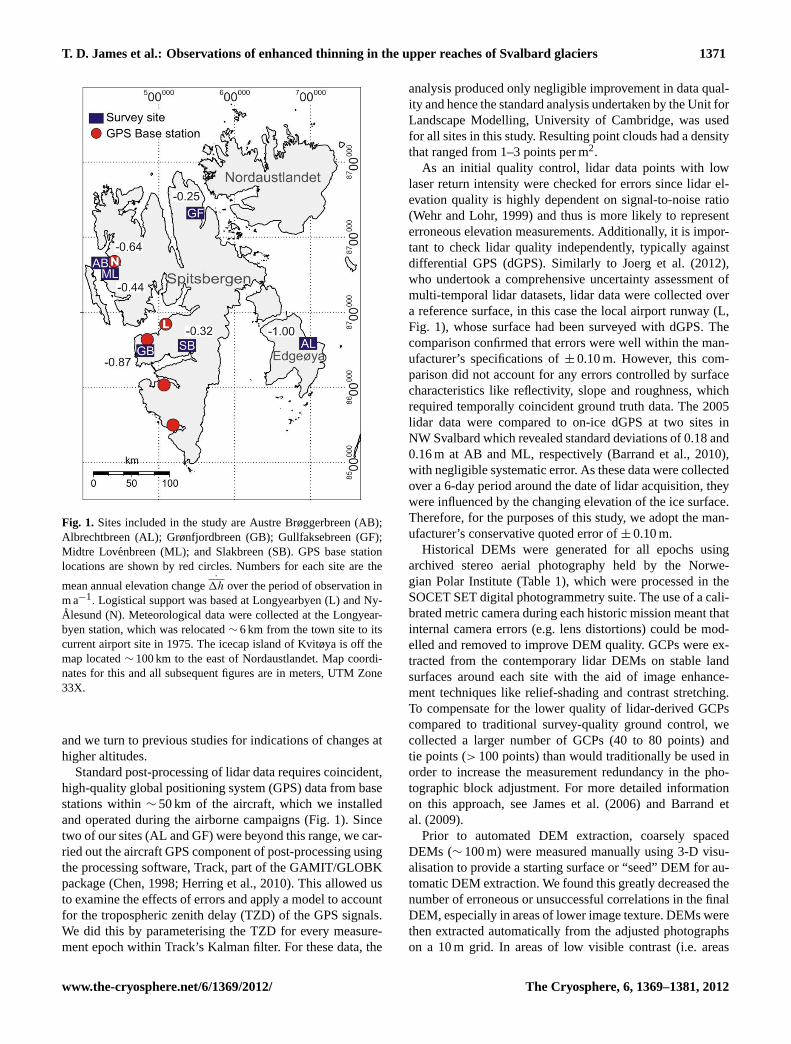
Fig. 1. Sites included in the study are Austre Brøggerbreen (AB); Albrechtbreen (AL); 3
Grønfjordbreen (GB); Gullfaksebreen (GF); Midtre Lovénbreen (ML); and Slakbreen (SB). 4
GPS base station locations are shown by red circles. Numbers for each site are the mean 5
annual elevation change .
h over the period of observation in ma-1
. Logistics support was 6
based at Longyearbyen (L) and Ny Ålesund (N). Meteorological data were collected at the 7
Longyearbyen station, which was relocated ~6 km from the town site to its current airport site 8
in 1975. The icecap island of Kvitøya is off the map located ~100 km to the east of 9
Nordauslandet. Map coordinates for this and all subsequent figures are in meters, UTM Zone 10
33X. 11
12
Fig. 1. Sites included in the study are Austre Brøggerbreen (AB);Albrechtbreen (AL); Grønfjordbreen (GB); Gullfaksebreen (GF);Midtre Lovenbreen (ML); and Slakbreen (SB). GPS base stationlocations are shown by red circles. Numbers for each site are the
mean annual elevation change.
1h over the period of observation inm a−1. Logistical support was based at Longyearbyen (L) and Ny-Alesund (N). Meteorological data were collected at the Longyear-byen station, which was relocated∼ 6 km from the town site to itscurrent airport site in 1975. The icecap island of Kvitøya is off themap located∼ 100 km to the east of Nordaustlandet. Map coordi-nates for this and all subsequent figures are in meters, UTM Zone33X.
and we turn to previous studies for indications of changes athigher altitudes.
Standard post-processing of lidar data requires coincident,high-quality global positioning system (GPS) data from basestations within∼ 50 km of the aircraft, which we installedand operated during the airborne campaigns (Fig. 1). Sincetwo of our sites (AL and GF) were beyond this range, we car-ried out the aircraft GPS component of post-processing usingthe processing software, Track, part of the GAMIT/GLOBKpackage (Chen, 1998; Herring et al., 2010). This allowed usto examine the effects of errors and apply a model to accountfor the tropospheric zenith delay (TZD) of the GPS signals.We did this by parameterising the TZD for every measure-ment epoch within Track’s Kalman filter. For these data, the
analysis produced only negligible improvement in data qual-ity and hence the standard analysis undertaken by the Unit forLandscape Modelling, University of Cambridge, was usedfor all sites in this study. Resulting point clouds had a densitythat ranged from 1–3 points per m2.
As an initial quality control, lidar data points with lowlaser return intensity were checked for errors since lidar el-evation quality is highly dependent on signal-to-noise ratio(Wehr and Lohr, 1999) and thus is more likely to representerroneous elevation measurements. Additionally, it is impor-tant to check lidar quality independently, typically againstdifferential GPS (dGPS). Similarly to Joerg et al. (2012),who undertook a comprehensive uncertainty assessment ofmulti-temporal lidar datasets, lidar data were collected overa reference surface, in this case the local airport runway (L,Fig. 1), whose surface had been surveyed with dGPS. Thecomparison confirmed that errors were well within the man-ufacturer’s specifications of± 0.10 m. However, this com-parison did not account for any errors controlled by surfacecharacteristics like reflectivity, slope and roughness, whichrequired temporally coincident ground truth data. The 2005lidar data were compared to on-ice dGPS at two sites inNW Svalbard which revealed standard deviations of 0.18 and0.16 m at AB and ML, respectively (Barrand et al., 2010),with negligible systematic error. As these data were collectedover a 6-day period around the date of lidar acquisition, theywere influenced by the changing elevation of the ice surface.Therefore, for the purposes of this study, we adopt the man-ufacturer’s conservative quoted error of± 0.10 m.
Historical DEMs were generated for all epochs usingarchived stereo aerial photography held by the Norwe-gian Polar Institute (Table 1), which were processed in theSOCET SET digital photogrammetry suite. The use of a cali-brated metric camera during each historic mission meant thatinternal camera errors (e.g. lens distortions) could be mod-elled and removed to improve DEM quality. GCPs were ex-tracted from the contemporary lidar DEMs on stable landsurfaces around each site with the aid of image enhance-ment techniques like relief-shading and contrast stretching.To compensate for the lower quality of lidar-derived GCPscompared to traditional survey-quality ground control, wecollected a larger number of GCPs (40 to 80 points) andtie points (> 100 points) than would traditionally be used inorder to increase the measurement redundancy in the pho-tographic block adjustment. For more detailed informationon this approach, see James et al. (2006) and Barrand etal. (2009).
Prior to automated DEM extraction, coarsely spacedDEMs (∼ 100 m) were measured manually using 3-D visu-alisation to provide a starting surface or “seed” DEM for au-tomatic DEM extraction. We found this greatly decreased thenumber of erroneous or unsuccessful correlations in the finalDEM, especially in areas of lower image texture. DEMs werethen extracted automatically from the adjusted photographson a 10 m grid. In areas of low visible contrast (i.e. areas
www.the-cryosphere.net/6/1369/2012/ The Cryosphere, 6, 1369–1381, 2012

1372 T. D. James et al.: Observations of enhanced thinning in the upper reaches of Svalbard glaciers
Table 1.Acquisition details of airborne laser altimetry (lidar) and photographic surveys.
Lidar Photography
Elevation Range(m a.s.l.)
Acquisition Date # of Points(×106)
Acquisition Date Scale
Austre Brøggerbreen (AB) 90–650 06-07-2005 31.828-07-1966 1:50 00005-08-1977 1:50 00020, 25-08-1990 1:50 000
Albrechtbreen (AL)1 50–300 14-08-2005 42.008-19712 1:30 00022, 27-07-1990 1:50 000
Grønfjordbreen (GB) 35–700 07-07-2005 54.419-08-1969 1:50 00002-07-1990 1:50 000
Gullfaksebreen (GF)1 65–890 09-07-2005 98.707, 09-07-19613 1:45 00030-07-1966 1:50 00022, 28-07-1990 1:50 000
Midtre Lovenbreen (ML) 75–65009-08-2003
23.528-07-1966 1:50 000
05-07-2005 05-08-1977 1:50 00020, 25-08-1990 1:50 000
Slakbreen (SB) 180–1000 08-08-2003 46.323-25-08-1961 1:40 00016-08-1977 1:20 00022-07-1990 1:50 000
1 Photographic and lidar coverage do not cover the whole catchment area of these glaciers whose highest elevations include featureless ice cap. Due to themethod’s reliance on the measurement of ground control points on stable features and the presence of image texture, these areas are unsuitable forphotogrammetry. For AL,∼ 35 % of the area and 65 % of the elevation range were surveyed. For GF∼ 50 % of the area and 93 % of the elevation range weresurveyed.2 Exact acquisition date unknown.3 Early epoch coverage was spread over two campaigns. Elevation differences over this period in the area of overlap were within the measurement error andthus the 1961 photographs were merged with the 1966 block of photographs.
of dark shadow or snow cover), DEM points were measuredmanually where possible at a spacing of∼ 50 m, using thesoftware’s 3-D-editing capabilities. These areas tended to begently sloped, and thus the coarser resolution was sufficientfor accurately representing these surfaces.
Since glacier surfaces are not stable over time, the as-sessment of glacier DEM quality from historical imagery isnot straightforward. Typically, DEM quality is measured interms of (i) the fit of measured points and camera calibrationparameters to the block adjustment solution given in root-mean-square error (RMSE) of GCP X, Y and Z coordinates;and (ii) the comparison of the DEM to an independent checkdataset (Wolf and Dewitt, 2000). As temporally coincidentvalidation data were not available for the historical imagery,we assessed the DEM quality by comparing the lidar DEM atthree off-ice test sites characterised as topographically stableand with similar textural and relief characteristics to the ice.This was carried out instead of a blanket comparison to alloff-ice points since we could not assume that (i) all off-iceareas had remained unchanged over the long period of study(i.e. slope erosion, ice-cored moraines and shifting outwashplains); and (ii) the suitability of the ice- and off-ice surfacefor photogrammetry was similar in terms of image textureand contrast.
Results of the photogrammetric block adjustment sug-gested a good fit of the measured parameters to the blocksolution with average RMSE of the ground control in X, Yand Z of 1.33, 1.50 and 0.43 m, respectively. Comparison tothe lidar at the test sites yielded low mean error of 0.21 mand standard deviation of± 1.55 m. Although we expect thequality of on ice points to be better than this, to compensatefor the degree of spatial autocorrelation of elevation errorsexpected in the differenced DEMs (Rolstad et al., 2009), weconservatively adopted the higher error estimate of± 1.55 mfor the photogrammetric DEM error in the following analy-sis.
2.2 Sequential DEM analysis
Two periods of elevation and volume change were measuredacross our sample glaciers using sequential DEM analysisapproximately covering the periods 1961–1990 and 1990–2005 (Table 1). These two periods, which were available atall six sites, were the main focus of this study. However,photographs from 1977 were also available at AB, ML andSB providing an intermediate period over which elevationand volume changes could be measured. The relatively high-resolution lidar DEMs were downsampled to the same grid
The Cryosphere, 6, 1369–1381, 2012 www.the-cryosphere.net/6/1369/2012/

T. D. James et al.: Observations of enhanced thinning in the upper reaches of Svalbard glaciers 1373
as the photogrammetric DEMs, and the surfaces were differ-enced on a pixel by pixel basis. Volume changes were cal-culated over the maximum area of ice coverage using pixelsummation (e.g. Etzelmuller et al., 1993; Kohler et al., 2007;Barrand et al., 2010).
Differencing DEMs for volume and mass change measure-ment, known as the geodetic method, is more accurate overlong periods than the glaciological method (Cox and March,2004) where DEM quality is high and errors due to changesin ice density are negligible compared to elevation changesover these time scales. Also, the geodetic method can pro-vide measurement of elevation and volume changes acrossa glacier’s full area where conditions allow. This approachreduces or eliminates the need for extrapolation of point orprofile measurements and is ideal in Svalbard where it hasbeen argued that climate-driven elevation changes are largecompared to changes in ice flow (Nuth et al., 2007) and icedensity (Kohler et al., 2007) over these long time periods.
To put our results in the context of the area-altitude dis-tribution of the archipelago’s ice, we compare the hypsome-try of the whole archipelago to the hypsometry of our sites.To produce the pan-Svalbard hypsometry, drainage basinswere digitized from Hagen et al. (1993) and geocoded to theNorwegian Polar Institute 100 m Svalbard DEM using mapgrid intersections. The digitized basins were converted to bi-nary masks and were applied to the DEM to identify on-icepoints. Results for the archipelago are provided in 50 m ele-vation bands with and without the ice caps of Nordaustlandetand Kvitøya. Hypsometry curves for our sites were producedboth as a sum total of all sites and as averages for each sitealso in 50 m elevation bands.
3 Results
Our sequential DEM analysis reveals changes that are con-sistent with glaciers adjusting to a warming climate withthinning greatest at the retreating termini and decreasing up-glacier (Schwitter and Raymond, 1993) (Fig. 2). Terminusposition data in Table 2 show that all six glaciers experiencedsignificant retreat over the period of observation. However,there is high variability in changes of frontal position and el-evation attributable to both the strong regional temperatureand precipitation gradients as well as local glacier geome-try. We discuss this below in the context of the glaciers’ ice-elevation distribution.
Elevation change statistics (Table 3; provided in ice equiv-alent units unless otherwise stated) show maximum elevationchanges (1hmax) between 1961–2005 were recorded at SBand GB, which both lost more than 90 m of elevation over thestudy period (∼ 2.3 m a−1) at their 2003 and 2005 termini,respectively. The northeast site (GF), an area thought to becloser to balance (Bamber et al., 2005; Moholdt et al., 2010;Nuth et al., 2010), experienced elevation losses of almost50 m (∼ 1.3 m a−1). The site with the highest mean annual
Table 2.Site terminus retreat relative to earliest epoch along dottedlines shown in Fig. 2.
Terminus Retreat (m a−1)
Data Coverage Whole Period Pre-1990 Post-1990
AB 1966–2005 22 25 35AL 1971–2005 42 33 64GB 1969–2005 30 38 29GF 1966–2005 12 11 19ML 1966–2005 12 13 10SB 1961–2003 32 20 59
elevation change (.
1h) was low-lying AL on the eastern is-land of Edgeøya, which lost an average of 1.00± 0.03 m a−1
over the surveyed portion of the glacier. SB lost an averageof only 0.32± 0.02 m a−1 despite high elevation losses at theterminus due to a significant portion of its area lying high onthe Gruvfonna ice cap. Elevation changes across all sites av-eraged−0.59± 0.04 m a−1 between 1961–2005. The frontalretreat and elevation losses we observe suggest that all sixof our sites have likely undergone significant negative massbalance over the period of observation.
Pre- and post-1990.
1h for each site are given in Table 4and reveal a significant increase of thinning between these
periods. Average.
1h accelerated from−0.52± 0.09 m a−1
before 1990 to−0.76± 0.10 m a−1 after 1990 representing a46 % increase in average thinning rate between the two peri-ods. Increases in thinning rates over these periods of similarmagnitude were previously reported on two of these glaciersin western Svalbard (Kohler et al., 2007). However, the inclu-sion of an intermediate epoch of photographs flown in 1977at AB, ML and SB illustrates the difficulty of interpretingelevation changes between two discrete points in time espe-cially when separated by long periods. The rates of eleva-tion change for AB, ML and SB from Table 4 imply a uni-form and significantly lower thinning rate before than after1990. However, elevation changes for the intermediate pe-riod (1977–1990; Fig. 3) show how these change statisticscan be misleading. At AB, the thinning rate in the first of thethree periods is not significantly different from the most re-cent period; only the middle period has significantly lowerthinning rates. This is not the case for ML where thinningrates in the first two periods are similar, whereas SB experi-enced a constant increase in thinning over all three periods.
Our analysis of these thinning rates by elevation revealsthe most significant finding from the study: Some of the
greatest increases in.
1h occurred in the higher reaches of theglaciers in areas typical of snow accumulation and mass gain.As expected, elevation changes were greatest at lower alti-tudes with maximum changes reaching almost−2.5 m a−1 at
SB (Fig. 4). However, plotting changes in.
1h against eleva-tion for each site emphasises how the glaciers’ upper reaches
www.the-cryosphere.net/6/1369/2012/ The Cryosphere, 6, 1369–1381, 2012

1374 T. D. James et al.: Observations of enhanced thinning in the upper reaches of Svalbard glaciers
25
1
2
3
4
5
25
1
2
3
4
5
26
1
2
3
4
Fig. 2. Contemporary DEMs and sequential DEM analysis results (showing1h) for: Austre Brøggerbreen (AB); Grønfjordbreen (GB);Midtre Lovenbreen (ML); Albrechtbreen (AL); Gullfaksebreen (GF); and Slakbreen (SB). Top and left-hand panels show the shaded-reliefDEMs of 2005 lidar (2003 for SB) with elevations plotted on a 5 m grid and glacier outline overlays. Contour interval is 50 m with boldcontour at 300 m. Elevations in meters above sea level. Bottom and right-hand pannels show accompanying elevation change map on 10 mgrid over the full period of data coverage. Plots for AL and GF show only the surveyed area of the glacier catchment (see Table 1).
at several sites are experiencing similar or indeed greater in-creases in thinning rates than at their termini (Fig. 5). Inter-estingly, an additional elevation change curve at ML fromtwo lidar surveys in 2003 and 2005 shows the same pattern
of enhanced thinning rates with elevation extending down to200 m where only bare ice is found (Fig. 4).
The Cryosphere, 6, 1369–1381, 2012 www.the-cryosphere.net/6/1369/2012/

T. D. James et al.: Observations of enhanced thinning in the upper reaches of Svalbard glaciers 1375
26
1
2
3
4
27
1
2
27
1
2
Fig. 2.Continued.
4 Discussion
Of the results presented in Fig. 1 and Tables 3 and 4, the moststriking is the apparent high variability between sites, espe-cially those located relatively close together. For example, ofadjacent AB and ML, the former thinned significantly more
over the whole period than ML but at the same time expe-rienced a smaller increase in thinning rates between the twoepochs. Similarly, on average GB underwent twice the thin-ning of SB despite these glaciers being only∼ 50 km apartand at similar latitude. However, looking at the elevation
www.the-cryosphere.net/6/1369/2012/ The Cryosphere, 6, 1369–1381, 2012

1376 T. D. James et al.: Observations of enhanced thinning in the upper reaches of Svalbard glaciers
Fig. 3. Average annual elevation change (.
1h) over all periods in-cluding the intermediate epoch at AB, ML and SB.
change by altitude curves and site hypsometry (Fig. 4), par-ticularly for AB and ML whose elevation changes by altitudeare fairly similar, these differences are less surprising. BothML and SB have a higher ice elevation distribution than theirfaster thinning neighbours. The large jump in thinning at MLbetween epochs can be explained by its greater ice area atelevations where higher increases in thinning rates were oc-curring. The comparatively small average elevation changeat SB, due to its large icecap between 700 and 800 m, dis-guises the very high rates of thinning (up to−2.4 m a−1 be-tween 1961 and 2003) that occurred at the glacier’s terminus.In contrast, the difference in thinning rates between AB andML when taking the intermediate epoch into account doesnot appear to be attributable to hypsometric differences andmust be due to some other yet unknown site-specific param-eter.
For glaciers farther afield the effect of Svalbard’s strongclimatic gradients becomes apparent. GF experienced signif-icantly lower mean thinning rates (−0.25± 0.03 m a−1) thanat other sites despite our survey missing some of the catch-ment’s higher elevations where thickening may be present.Nuth et al. (2010) found that the ice capAsgardfonna,which is linked to GF, underwent average elevation changesof −0.21± 0.07 m a−1 (after conversion from water equiv-alents) for the similar period, 1966–2007, which is withinthe margin of error of our measurement. On the other end ofthe spectrum, average changes at AL were highest of all oursites (−1.00± 0.03 m a−1). However, this glacier also hadthe lowest hypsometry and the highest third of the glacier’selevation range could not be included in the study. For thelarge but low-lying ice cap Edgeøyjøkulen, which containsthe AL catchment, Nuth et al. (2010) measured average el-evation changes of−0.63± 0.12 m a−1 between 1966 and2007 suggesting that our surveyed area is likely biased to-
wards the more negative changes at the lower elevations ofthe catchment. The high frontal thinning rates measured atAL are similar to the−2.0 m a−1 measured by Kaab (2008)on the other Edgeøya ice caps.
A strong link between net mass balance and both summertemperatures and winter precipitation has been demonstratedin Svalbard (Hagen and Liestøl, 1990; Lefauconnier et al.,1999), and thus we interpreted our results in the context ofthe local meteorology. The high variability in thinning ratesobserved at our sites supports the regional approach used pre-viously for archipelago-wide monitoring of Svalbard massbalance (i.e. Hagen et al., 2003b; Bamber et al., 2005; andNuth et al., 2010). While it is tempting to consult data fromall the meteorological stations around Svalbard to understandbetter the variation between sites, we argue the following:(i) the documented temperature and precipitation gradientsin Svalbard, caused by its position between warm and coldoceanic and atmospheric currents (Rotschky et al., 2011),and the different local geometries, are sufficient to accountfor the observed variability; (ii) none of the stations in Sval-bard are close enough to the sites to represent accurately localconditions; and (iii) temperature (and to a lesser extent pre-cipitation) at Longyearbyen is correlated with other stationsin Svalbard (Førland and Hanssen-Bauer, 2003) and only theLongyearbyen record covers our study period. Therefore, webase the following discussion on data from the Longyearbyen(Svalbard airport) meteorological station (L, Fig. 1).
Between 1961 and 2005, annual mean temperature atLongyearbyen increased by 1.8◦C. However, high interan-nual and decadal variability means long-term trends mustbe large in order to be statistically significant (Førland andHanssen-Bauer, 2003). Alternatively, the June, July, August(JJA) mean temperature at Longyearbyen increased signifi-cantly (with 95 % confidence) by 0.02◦C a−1 between 1961–2005 (Fig. 6). No significant trend was measured during1961–1990, but JJA temperatures after 1990 increased sig-nificantly by 0.07◦C a−1. These warming temperature trendsare likely driving the acceleration of thinning at low eleva-tions.
To investigate the intermediate period of lower thinningrates, we calculated the average annual sum of positive de-gree days (PDD) from the Longyearbyen mean daily tem-perature record for each period and compared them to themean PDD for the whole time series (Fig. 6). This compar-ison revealed that the 1980s were indeed a period of signif-icantly cooler summer temperatures at Longyearbyen thaneither the preceding or following period. While this accountsfor the mass loss at AB and ML during this period, this ap-pears not to have occurred further south at SB where there isno evidence of glacier response to this cooler period. This isindicative of the extreme regionality of Svalbard’s climateand the strong sensitivity of glaciers to even decadal me-teorological trends. Coincidentally, the Svalbard mass bal-ance research published in the 1990s (Hagen and Liestøl,1990; Dowdeswell et al., 1997; Lefauconnier et al., 1999)
The Cryosphere, 6, 1369–1381, 2012 www.the-cryosphere.net/6/1369/2012/

T. D. James et al.: Observations of enhanced thinning in the upper reaches of Svalbard glaciers 1377
30
1
Fig. 4. Elevation change curves for the six survey sites, shown in 50 m altitude bins (bottom 2
axis). Decreased thinning rates at lowest elevations reflect the thinning of the front to zero ice 3
thickness between epochs and thus terminal retreat. Right side of each panel provides relative 4
hypsometry of each site in percentage of total area (top axis; see Table 3). 5
6
Fig. 4. Elevation change curves for the six survey sites, shown in 50 m altitude bins (bottom axis). Decreased thinning rates at lowestelevations reflect the thinning of the front to zero ice thickness between epochs and thus terminus retreat. Right side of each panel providesrelative hypsometry of each site in percentage of total area (top axis; see Table 3).
Table 3.Glacier elevation and volume change statistics derived from DEM differencing over the full period of data coverage. Mean area (A);
maximum total elevation change (1hmax); mean elevation change (1h); mean annual elevation change (.
1h); total volume change (1V );
and total annual volume change (.
1V ).
Site Study A 1hmax 1h.
1h 1V.
1V
Period (km2) (m) (m) (m a−1) (×105 m3) (×104 m3 a−1)
AB 1966–2005 10.96± 0.04 −67± 1 −25± 1 −0.64± 0.03 −2.73± 0.11 −0.70± 0.03AL∗ 1971–2005 28.56± 0.09 −73± 1 −34± 1 −1.00± 0.03 −9.71± 0.29 −2.86± 0.09GB 1969–2005 35.83± 0.12 −94± 1 −31± 1 −0.87± 0.03 −11.3± 0.37 −3.13± 0.10GF∗ 1966–2005 42.98± 0.14 −38± 1 −10± 1 −0.25± 0.03 −4.17± 0.44 −1.07± 0.11ML 1966–2005 5.47± 0.02 −66± 1 −17± 1 −0.44± 0.03 −0.94± 0.06 −0.24± 0.01SB 1961–2003 40.18± 0.13 −102± 1 −13± 1 −0.32± 0.02 −5.34± 0.41 −1.27± 0.10
∗ Note the AL and GF catchments were not completely surveyed (see Table 1).
was based on time series that terminated around the end ofthis cold period, which would explain the lack of trend inrates of mass loss for many of these earlier studies. There isclearly a need to interpret geodetic volume and mass changesin the context of the prevailing meteorological conditions atthe time of each epoch in the time series.
We also performed an analysis of Longyearbyen precip-itation data. Due to the strong precipitation gradients in
Svalbard, the Longyearbyen station is likely only repre-sentative of the west coast (Hanssen-Bauer, 2002). How-ever, this is the only station that extends back to the be-ginning of our time series. Additionally, it is important tonote that precipitation measurements are notoriously proneto error, especially in Arctic conditions and, without site-specific correction factors, should be interpreted with cau-tion (Førland and Hanssen-Bauer, 2000). These data revealed
www.the-cryosphere.net/6/1369/2012/ The Cryosphere, 6, 1369–1381, 2012

1378 T. D. James et al.: Observations of enhanced thinning in the upper reaches of Svalbard glaciers
Table 4. Mean annual elevation change rates (.
1h) for pre-1990,post-1990 and whole period of data coverage.
.
1h (m a−1)
Whole Period Pre-1990 Post-1990
AB 1966–2005 −0.64± 0.03 −0.62± 0.09 −0.74± 0.10AL∗ 1971–2005 −1.00± 0.03 −0.95± 0.11 −1.21± 0.10GB 1969–2005 −0.87± 0.03 −0.74± 0.10 −1.15± 0.10GF∗ 1966–2005 −0.25± 0.03 −0.22± 0.09 −0.28± 0.10ML 1966–2005 −0.44± 0.03 −0.38± 0.09 −0.58± 0.10SB 1961–2003 −0.32± 0.03 −0.22± 0.07 −0.55± 0.12
∗ Note the AL and GF catchments were not completely surveyed (see Table 1).
31
1
2
Fig. 5. Differencing elevation change rates from pre-1990 and post-1990 periods by altitude 3
highlights the speedup in thinning is greatest at higher elevations with only GF in the far NE 4
as the exception. 5
6
7
Fig. 6. JJA Temperature data from the Longyearbyen station (L, Fig. 1). Trend for whole 8
period (black dotted line) is 0.02ºC a-1
whereas the trend for the post-1990 period was 0.07 ºC 9
a-1
(at 95% confidence). No significant trend was measured for the pre-1990 period. Average 10
PDD for each period and for the whole study period at Longyearbyen meteorological station 11
(L, Fig. 1) are given at the bottom of the main panel. 12
Fig. 5.Differencing elevation change rates from pre-1990 and post-1990 periods by altitude highlights the speedup in thinning is great-est at higher elevations with only GF in the far NE as the exception.
a strong post-1990 negative trend in total precipitation of4.4 mm a−1 (significant at 95 % confidence; standard error,2.2 mm) but no significant trend over the whole period.In contrast, solid precipitation decreased significantly since1961 (−0.9 mm a−1; standard error, 0.2 mm) with a strongernegative trend since 1990 (−3.0 mm a−1; standard error,1.4 mm). To put the precipitation decreases into context, atthese rates annual precipitation in 2005 was predicted to be∼ 45 mm less than it was in 1990 in a region with alreadyrelatively low accumulation rates of less than 1 m w.e. a−1
(Hagen et al., 2003a). This reduction in accumulation couldin several ways account for the increases in thinning rateswe have observed in the glaciers’ upper reaches. First, sucha loss of snow cover would decrease internal accumulationin these higher areas and potentially cause a redistributionof superimposed ice to lower elevations (e.g. Zwinger andMoore, 2009). At ML and likely elsewhere in Svalbard, su-perimposed ice is known to be a significant component ofmass balance (Wright et al., 2007) and this could be respon-sible for a non-linear ablation gradient. Second, there couldbe a dynamic component to these changes since it is likely
Fig. 6. JJA Temperature data from the Longyearbyen station (L,Fig. 1). Trend for whole period (black dotted line) is 0.02◦C a−1
whereas the trend for the post-1990 period was 0.07◦C a−1 (at 95 %confidence). No significant trend was measured for the pre-1990 pe-riod. Average PDDs for each period and for the whole study periodat Longyearbyen meteorological station (L, Fig. 1) are given at thebottom of the main panel.
that the submergence velocities are not in balance with thedecreasing trend in mass input in the accumulation areas. Fi-nally, in areas with a significant firn layer, elevation changescould have resulted from firm compaction. However, it is im-portant to note that the elevation change by altitude curve forML between 2003 and 2005 (Fig. 4) highlights that enhancedthinning occurs far down the glacier in areas where only bareice was measured in these two years.
Changes in surface albedo are also linked to decreasingtrends in winter precipitation and could explain the greaterincreases in thinning rates at higher elevations. Researchhas demonstrated the significant effect a decrease in glacieralbedo due to loss of snow cover has on enhancing ablation(Oerlemans et al., 2009), and such changes were identified asa major contributing factor in the large 2010 negative surfacemass balance anomaly of the Greenland Ice Sheet (Tedescoet al., 2011). In Svalbard, Kohler et al. (2007) hypothesizedthat indications of higher elevation thinning at two of thesesites might be explained by a decrease in albedo due to lossof snow cover, and our observations are consistent with thishypothesis. However, it is also possible that a localised de-crease in albedo could result from increased dust accumula-tion on snow and ice surfaces as a result of the exposure ofnew bedrock in areas of steep headwalls. In the imagery andduring flyovers, we observed substantial quantities of duston the snow surface at GB and SB, which are near activecoal mines, but not at the other sites. While studies mea-suring temporal/spatial changes in glacier albedo (Greuellet al., 2007) and snow cover/melt (Rotschky et al., 2011)on a widescale have been undertaken using satellite-deriveddata, the short time scale and spatial resolution of availabledata are not suitable for resolving the changes we observe.
The Cryosphere, 6, 1369–1381, 2012 www.the-cryosphere.net/6/1369/2012/

T. D. James et al.: Observations of enhanced thinning in the upper reaches of Svalbard glaciers 1379
This newly exposed bedrock in the headwall area could alsolocally influence the radiation budget at these higher eleva-tions, though these areas are relatively small. Without localdata on snow cover, changes in albedo and local energy bud-gets at our sites over the period of study, the cause of thesechanges remains uncertain.
Independent of their cause, the changes we have observedif widespread will have important implications on the massbalance of the archipelago. Critically, Svalbard’s ice is es-pecially sensitive to changes in the equilibrium line altitude(ELA) due to its hypsometric distribution which places thebulk of Svalbard’s ice close to the current estimated ELA.Consequently, even small changes in the ELA will have alarge impact on the mass balance of the archipelago (Hagenet al., 2003b). To illustrate, at its estimated average altitudeof ∼ 460 m a.s.l. and accumulation area ratio (AAR) of 0.44(calculated from our hypsometry data), a 50 m increase inthe ELA (or an equivalent surface lowering) would result ina loss of∼ 3000 km2 of accumulation area and a new AARof 0.36 – equal to∼ 8 % of Svalbard’s ice-covered area and∼ 18 % of the accumulation zone according to most recentestimates (Hagen et al., 1993). However, these hypsometryand ELA estimates are based largely on the 1990 aerial sur-vey and our results show that significant changes have takenplace since the 1990 survey was undertaken. This is demon-strated by the total area-altitude distribution for our sites dur-ing the early 1990 and 2003/5 epochs (Fig. 7) showing howthe ice area has lowered over this 44-yr period.
5 Conclusions
Our high-resolution time series of glacier DEMs derivedfrom archived aerial photographs and lidar reveal high vari-ability in elevation changes and retreat rates between oursites. This is indicative of the strong regionality of Svalbard’sclimate and highlights the difficulty of using a small numberof index glaciers to represent changes of a region. However,despite this variability there is a prevalent increase in thin-ning at all sites between the periods 1961–1990 and 1990–2005. Of particular note is an increase in thinning rates in theglaciers’ upper reaches of similar magnitude to that measuredat the glaciers’ termini. We find that these changes are co-incident with increasing trends in summer temperatures anddecreasing trends in winter precipitation. While their cause isnot yet clear, we suggest that the loss of snow cover could bealtering the albedo of these higher regions, causing changesto the distribution of superimposed ice and/or creating animbalance between mass input and submergence velocities.Clearly, more research is needed to determine the causes andextent of these changes.
Regardless of their cause, these high elevation changes,if widespread, could act to raise the ELA and decrease theAAR in an area whose mass balance is known to be highlysensitivity to such changes (Hagen et al., 2003b). However,
32
1
Fig. 7. Hypsometric context of elevation changes at our sites. (Left panel) Elevation change 2
with altitude is plotted to show annual changes before and after 1990 and over the whole 3
period of data coverage. Error estimates are represented by the shading around each curve. 4
The horizontal dashed line is the estimated average ELA of ~460 m a.s.l. from Hagen et al. 5
(2000b); (Right panel) Total hypsometry of the study sites for earliest, 1990 and 2003/5 6
epochs (bottom axis) overlaying the hypsometry of Svalbard (top axis) inclusive and 7
exclusive of the ice of Nordaustlandet and Kvitøya all calculated in 50 m elevation bands. 8
9
Fig. 7.Hypsometric context of elevation changes at our sites.(a) El-evation change with altitude is plotted to show annual changesbefore and after 1990 and over the whole period of data cover-age. Error estimates are represented by the shading around eachcurve. The horizontal dashed line is the estimated average ELAof ∼ 460 m a.s.l. from Hagen et al. (2003b);(b) Total hypsometryof the study sites for early 1990 and 2003/5 epochs (bottom axis)overlying the hypsometry of Svalbard (top axis) inclusive and ex-clusive of the ice of Nordaustlandet and Kvitøya all calculated in50 m elevation bands.
we have found that when measuring geodetic elevation andmass changes, the timing of photographic epochs within thedecadal climate variability can have a significant impact onimplied changes over the period. We advise caution when in-terpreting such results in the absence of reliable local climatedata, especially in regions with strong climate gradients likeSvalbard. Our findings highlight a need for continued high-resolution monitoring of Svalbard glaciers.
Acknowledgements.SLICES was funded by the UK NERC(NE/B505203/1). TDJ’s work was also supported by the GLIMPSEproject funded by The Leverhulme Trust (F/00391/J) and theClimate Change Consortium for Wales (C3W). NEB’s contributionwas supported by NERC studentship NER/S/A/2003/11279. Lidardata were flown by the NERC Airborne Research and SurveyFacility and processed by the Unit for Landscape Modelling,University of Cambridge. Access and facilities at the Ny-Alesund
www.the-cryosphere.net/6/1369/2012/ The Cryosphere, 6, 1369–1381, 2012

1380 T. D. James et al.: Observations of enhanced thinning in the upper reaches of Svalbard glaciers
geodetic observatory were provided by Statens Kartverk, Norway.The authors would like to thank: BAE Systems (SOCETSET),Applied Imagery (Quick Terrain Modeler) and Jack Kohler (Nor-wegian Polar Institute) for their support. Field assistants includedArtur Adamek, Trine Abrahamsen, Brian Barrett, Suzanne Bevan,Remko de Lange, Adrian Luckman and Irina Solovjanova. Finally,we would like to thank three anonymous reviewers, M. Pelto andthe editor for their constructive comments which helped to improvesignificantly this manuscript.
Edited by: A. Kaab
References
Bamber, J. L., Krabill, W., Raper, V., Dowdeswell, J. A., and Oer-lemans, J.: Elevation changes measured on Svalbard glaciers andice caps from airborne laser data, Ann. Glaciol., 42, 202–208,2005.
Barrand, N. E., Murray, T., James, T. D., Barr, S. L., and Mills, J. P.:Optimizing photogrammetric DEMs for glacier volume changeassessment using laser-scanning derived ground-control points,J. Glaciol., 55, 106–116, 2009.
Barrand, N. E., James, T. D., and Murray, T.: Spatio-temporal vari-ability in elevation changes of two high-Arctic valley glaciers, J.Glaciol., 56, 771–780, 2010.
Berthier, E., Schiefer, E., Clarke, G. K. C., Menounos, B.,and Remy, F.: Contribution of Alaskan glaciers to sea-levelrise derived from satellite imagery, Nat. Geosci., 3, 92–95,doi:10.1038/NGEO737, 2010.
Chen, G.: GPS Kinematic Positioning for the Airborne Laser Al-timetry at Long Valley, California, Ph.D. thesis, MassachusettsInstitute of Technology, Cambridge, 179 pp., 1998.
Cox, L. H. and March, R. S.: Comparison of geodetic and glaciolog-ical mass-balance techniques, Gulkana Glacier, Alaska, U.S.A.,J. Glaciol., 50, 363–370, 2004.
Dowdeswell, J. A., Hagen, J. O., Bjornsson, H., Glazovsky, A. F.,Harrison, W. D., Holmlund, P., Jania, J., Koerner, R. M., Lefau-connier, B., Ommanney, C. S. L., and Thomas, R. H.: The massbalance of circum-Arctic glaciers and recent climate change,Quaternary Res., 48, 1–14, 1997.
Etzelmuller, B., Vatne, G., Odegard, R. S., and Sollid, J. L.: Mass-balance and changes of surface slope, crevasse and flow patternof Erikbreen, Northern Spitsbergen – an application of a geo-graphical information system (GIS), Polar Res., 12, 131–146,1993.
Fleming, K. M., Dowdeswell, J. A., and Oerlemans, J.: Modellingthe mass balance of northwest Spitsbergen glaciers and responsesto climate change, Ann. Glaciol., 24, 203–210, 1997.
Førland, E. J. and Hanssen-Bauer, I.: Increased precipitation in theNorwegian Arctic: True or False?, Climate Change, 46, 485–509,2000.
Førland, E. J. and Hanssen-Bauer, I.: Past and future climate varia-tions in the Norwegian Arctic: overview and novel analyses, Po-lar Res., 22, 113–124, 2003.
Greuell, W., Kohler, J., Obleitner, F., Glowacki, P., Melvold,K., Bernsen, E., and Oerlemans, J.: Assessment of interan-nual variations in the surface mass balance of 18 Svalbardglaciers from the Moderate Resolution Imaging Spectrora-
diometer/Terra albedo product, J. Geophys. Res., 112, D07105,doi:10.1029/2006JD007245, 2007.
Hagen, J. O. and Liestøl, O.: Long-term glacier mass balance in-vestigations in Svalbard, 1950–88, Ann. Glaciol., 14, 102–106,1990.
Hagen, J. O., Liestøl, O., Roland, E., and Jørgensen, T.: Glacier atlasof Svalbard and Jan Mayen, Norsk Polarinstitutt, Oslo, 141 pp.,1993.
Hagen, J. O., Kohler, J., Melvold, K., and Winther, J. G.: Glaciersin Svalbard: mass balance, runoff and freshwater flux, Polar Res.,22, 145–159, 2003a.
Hagen, J. O., Melvold, K., Pinglot, F., and Dowdeswell, J. A.: Onthe net mass balance of the glaicers and ice caps in Svalbard,Norwegian Arctic, Arct. Antarct. Alp. Res., 35, 264–270, 2003b.
Hanssen-Bauer, I.: Temperature and precipitation in Svalbard 1912–2050: measurements and scenarios, Polar Rec., 38, 225–232,2002.
Herring, T. A., King, R. W., and McClusky, S. C.: Documentationfor the GAMIT GPS analysis software, version 10.40 Rep., Mas-sachusetts Institute of Technology, Cambridge, 2010.
James, T. D., Murray, T., Barrand, N. E., and Barr, S. L.: Extract-ing photogrammetric ground control from lidar DEMs for changedetection, Photogramm. Rec., 21, 310–326, 2006.
Joerg, P. C., Morsdorf, F., and Zemp, M.: Uncertainty assessment ofmulti-temporal airborne laser scanning data: a case study on analpine glacier, Remote Sens. Environ., 127, 118–129, 2012.
Kaab, A.: Glacier volume changes using ASTER satellite stereo andICESat GLAS laser altimetry. A test study on Edgeoya, East-ern Svalbard, IEEE T. Geosci. Remote Sens., 46, 2823–2830,doi:10.1109/TGRS.2008.2000627, 2008.
Kohler, J., James, T. D., Murray, T., Nuth, C., Brandt, O., Barrand,N. E., Aas, H. F., and Luckman, A. J.: Acceleration in thin-ning rate on western Svalbard glaciers, Geophys. Res. Lett., 34,L18502,doi:10.1029/2007GL030681, 2007.
Lefauconnier, B., Hagen, J. O., Ørbæk, J. B., Melvold, K., andIsaksson, E.: Glacier balance trends in the Kongsfjorden area,western Spitsbergen, Svalbard, in relation to climate, Polar Res.,18, 307–313, 1999.
Moholdt, G., Nuth, C., Hagen, J. O., and Kohler, J.: Recent elevationchanges of Svalbard glaciers derived from ICESat laser altimetry,Remote Sens. Environ., 114, 2756–2767, 2010.
Nuth, C., Kohler, J., Aas, H. F., Brandt, O., and Hagen, J. O.: Glaciergeometry and elevation changes on Svalbard (1936–90): a base-line dataset, Ann. Glaciol., 46, 106–116, 2007.
Nuth, C., Moholdt, G., Kohler, J., Hagen, J. O., and Kaab,A.: Svalbard glacier elevation changes and contributionto sea level rise, J. Geophys. Res.-Earth, 115, F01008,doi:10.1029/2008JF001223, 2010.
Oerlemans, J., Giesen, R. H., and van den Broeke, M. R.: Retreatingalpine glaciers: increased melt rates due to accumulation of dust(Vadret da Morteratsch, Switzerland), J. Glaciol., 55, 729–736,2009.
Rolstad, C., Haug, T., and Demby, B.: Spatially integrated geodeticglacier mass balance and its uncertainty based on geostatisticalanalysis: application to the western Svartisen ice cap, Norway, J.Glaciol., 55, 666–680, 2009.
Rotschky, G., Schuler, T. V., Haarpaintner, J., Kohler, J.,and Isaksson, E.: Spatio-temporal variability of snowmeltacross Svalbard during the period 2000–08 derived from
The Cryosphere, 6, 1369–1381, 2012 www.the-cryosphere.net/6/1369/2012/

T. D. James et al.: Observations of enhanced thinning in the upper reaches of Svalbard glaciers 1381
QuickSCAT/SeaWinds scatterometry, Polar Res., 30, 5963,doi:10.3402/polar.v30i0.5963, 2011.
Schwitter, M. P. and Raymond, C. F.: Changes in the longitudinalprofiles of glaciers during advance and retreat, J. Glaciol., 39,582–590, 1993.
Tedesco, M., Fettweis, X., van den Broeke, M. R., Van de Wal, R.S. W., Smeets, C. J. P. P., van de Berg, W. J., Serreze, M. C.,and Box, J. E.: The role of albedo and accumulation in the 2010melting record in Greenland, Environ. Res. Lett., 6, 014005,doi:10.1088/1748-9326/6/1/014005, 2011.
Wehr, A. and Lohr, U.: Airborne laser scanning – an introductionand overview, ISPRS J. Photogramm., 54, 68–82, 1999.
Wolf, P. R. and Dewitt, B. A.: Elements of Photogrammetry, withApplications in GIS, 3rd Edn., McGraw-Hill, New York, 608 pp.,2000.
Wright, A. P., Wadham, J. L., Siegert, M. J., Luckman, A.,Kohler, J., and Nuttall, A. M.: Modeling the refreezing ofmeltwater as superimposed ice on a high Arctic glacier: Acomparison of approaches, J. Geophys. Res., 112, F04016,doi:10.1029/2007JF000818, 2007.
Zwinger, T. and Moore, J. C.: Diagnostic and prognostic simula-tions with a full Stokes model accounting for superimposed iceof Midtre Lovenbreen, Svalbard, The Cryosphere, 3, 217–229,doi:10.5194/tc-3-217-2009, 2009.
www.the-cryosphere.net/6/1369/2012/ The Cryosphere, 6, 1369–1381, 2012