Observations of enhanced thinning in the upper reaches of Svalbard glaciers
ELSEVIER
J. Emirnll. Radiom tivity 25 (1994) 161 176 1994 Elsevier Science Limited
Printed in Ireland. All rights rcscr'~cd 0265-931X 94, $7.00
N a t u r a l and Art i f ic ia l Radioact iv i ty in the Sva lbard Glac iers
J. F. Pinglot," M. Pourchetfl B. Lefauconnier, ''> J. O. Hagen,/' R. Vaikmfie, ~ J. M. PunningJ O. Watanabe," S. Takahashi /
& T. Kameda ./
"Laboratoire de Glaciologie et G~ophysique de l'Environnement du CNRS, BP 96, 38402 Saint Martin d'Hares Cedex, France
~'Norsk Polar Institutt, Postboks 5072. N-0301 Oslo. Nor,aay
"Institute ot Geology, Academy of Sciences, Estonia PST 7, EE0105 Talinn, Estonia
alnstitute of Ecology, Estonian Academy of Sciences. Kevade Sir. 2. EE 0001, Talinn, Estonia
"National Institute of Polar Research, Kaga 1-9-10, ltabashi-ku, Tokyo 179, Japan
*Kilami Institute of Technology. 165 Koen-Cho. Kitami, Hokkaido, 090, Japan
A B S T R A C T
Natural and artiJi'cial radioactivity #7 the snow qf 10 Svalbard glaciers has been measured from 31 ice core samph,s, drilled between 1981 and 1993. O l these ice cores, seven exhibit the well-known k, vel arising.l)'om the /alhmt ol' the 1961-62 atmospheric thermonuclear tests. The second h, vel, clue to the Chernobyl accident (26 April 1986), has been detected in all the studied Glaciers, • the maximum ~S7Cs.fallout reaches 22 Bq kg i and shows a high variability. The natural radioaetivit.v, mostly due to :m Ph, shows an in- depth variation which is not governed by its ha(f l(le (22.2 years). These measurements serve many glaciological purposes: absolute dating o[ the snow layers; air-snow tran,s'l& and J'allout studies; the determination ol mean annual mass balances in the accumulation area q/'glaciers and their associated spatio-temporal variations.
161

162 r/. F. l'in,~101 eL al.
INTRODUCTION
The aim of this work is to determine the mean annual mass balances and the amount of natural and artificial radioactive fallout (~'mPb and ~( 's] . as well as the corresponding spatio-temporal variations for 1{t Svalbard glaciers. These determinations are fundamental in obtaining glacier regimc data for the last 3 decades in relation to the important climate change studies presently under way in the Arctic environment.
The determination of the glacial mass balance in the accumulation area requires the measurement of the water content of the snow mantle each year. To distinguish between successive annual snow layers, the radio- active fallout from atmospheric thermonuclear tests, conducted mainly in 1954 and 1961-62 (Picciotto & Wilgain, 1963), and more recently from the Chernobyl accident (Pourchet el al., 1986; 1988), which occurred on 2~ April 1986, provide well known radioactive levels in glaciers. The Chcr- nobyl horizon permits snow and ice dating of all northern hemisphere glaciers. In Svalbard, radioactivity in IYeshly fallen snow was detected at Ny-Alesund (West Spitsbergen) and Austfonna (Nordaustlandet).
METHODS
Ice core sampling
This work has been carried out on 31 ice cores drilled between 1981 and 1993 in the accumulation areas of 10 different Svalbard glaciers. Figs and 2. (In-depth temperature is 0 ( , )
Snow samples (0.8 m long. 72 mm diameter) were collected using a specially designed elcctromechanical ice-corer (down to 30 m), buih on ask> equipped sledge pulled by a snow scooter. The overall length of all the ice cores combined, was about 425 m, for a total prepared sample weight ol 800 kg. The length of each individual sample (about 20 cm) was based on the desired time accuracy, in general, about 6 samples per year were required. Also, for global-fl counting, at least 0-2 kg of snow was needed. For 7-spec- trometry, several global-fl samples had to be joined together because of the lower sensitivity of the ;-spectrometry (due to efficiency and branching ratio of 7 emitters). The total amounts of fl and 7 samples were 2200 and 200, respectively, which required 2 years of total fl counting and 1 year for ;'-ra3 spectrometry. After density measurements, the snow samples were melted and filtered (Delmas & Pourchet, 1977): then they were analysed in the laboratory (Pinglot & Pourchet. 1979) for global-fl and 7 radioactivity. The Chernobyl horizon is related to our measurements of ~7Cs and t~4(.

Natural and art([icial radioactivity in the Svalhard glaciers 63
Monacobreen A 1-3.8 O 80 • 5-18
Snofjella
A 2,3-10.2 O 133 79 • 10-14
Isachsenionna ~
m 2.1-6.1 O I 78 • 8-18 I ~
Kongsvegen
A 1.4-22.1 O 59 / • 6-11 }
Sveabreen
A 7.5-11.6 O
9 12 15 18 21 24°E
} 0 100km // _ _ I I _ I I I I I I I ~/
15 18 21 24
- - W e s t f o n n a 81 A O 132
8O°N • 6-14 (1962-81) ~ A u s t f o n n a 85-87
,~x 11.6 269 (85)
0 102 (87) 79 • 12-21 (1962-87) ~ G r u v f o n n a 93
A O 77
~8 • 1
Barlaupfonna
A 1.7-9.1
77 O I I 24-37
~ A m u n d s e n i s s e n
~0-10.8 O
• ~ 137 Cs (Chernobyl) O 137 Cs (Nuclear tests) • 210 Pb • 23-48
Fig. I. Dis t r ibut ion o f l 3 ; C s (Chernobyl . 1986 and nuclear tests. 1954 1961,2 (Bq m )) and :m Pb (since 1986 (Bq m = a n n m n ~)) fallout on Svalbard glaciers, at time of
measurement (I Jan. 1993).
Global-# radioactivity
Global-fi radioactivity was measured with solid state detectors (surlilce barrier, or ion-implanted-passivated silicon diodes: 200 mm ~, 300 Hm, 17 keY ct resolution), connected in anti-coincidence with a cosmic-ray detector. The background was about l0 counts per hour (above 150 keV) and the efficiency was 16% (for I)7Cs and '~°Sr). This measurement includes, but does not discriminate between, the total # radiation emitted by natural (cosmogenic and terrigeneous) and artificial isotopes (fission products from atmospheric nuclear tests, accidents in nuclear power stations, etc.). Some years after the emission of the fission products, the main artificial nuclear sources of # radiation are ~)"Sr and ~3VCs, the latter also emitting 7 radiation.
The total fl radioactivity profiles (kefauconnier et al., 1994) do not clearly show characteristic peaks which can be absolutely attributed to the fall-out of Chernobyl elements. This is due to the fact that the natural # radioactivity (mainly due to =mPb) is about 10 times the artificial radio- activity. All the following interpretations will be based on the low-level and high resolution 7-spectrometry measurements.

164
, i -
.I. I:. Pm,~,,Iol e! al.
6 9 12 15 18 21 24°E
(85) (87)
z3, 0.54-0.71 ~ . . . . . . . . i . . . . . . ~ L _ . . . . . i ~ _ ~ A 0 . 9 4 - ! 37 ' 5 18 21 24.
Z~ 137 CS (Chernoby0 O 137 C$ (Nuclear lesls)
v _ I _ . J
Fig. 2. l)islribution of mean annual mas~, balance on Svalbard glaciers (meter> x~ulc~ equi\'alent from 198;6 and for 1962 63 (65) Io 1996).
y-Spectrometry
; '-Spectrometry was carried out on the elements using a high-purit;> germanium diode (N Type}. This detector has a relative efficiency o[ 20",. It is made of materials free of all parasitic radioactivity. Special attention was paid to cosmic rays. radon emanations, 7-rays from building materi- als, etc.
This ;'-ray detector allows measurements over a wide range of energies from lower than 46.54 keV (emPb). up to several MeV. The resolution is 1.34 keV for l~r('s (at 661 keV, and 1.70 keV at 1.33 MeV). Fhc ; '-spectrometer efficiency curve, for the desired geometry of samples, wa,, determined using standard solutions from: LMRI-CEA, France, Amer-. sham, GB, and NBS. USA. Quantitative analysis software (dB Canberra Electronique. France) was used to compute the activity ,,t existing elements and the associated accuracy.
The blank values were regularly checked and reached about I disin- tegration h 1 (±0.3 d h ~1 for emPb (46.54 keV) and ~TCs (661.66 keV). The J~7('s and -~"Pb analyses present an accuracy of about ~5.10 ~ Bq (for a counting time of one day. and a 1 × a confidence level).

Natural and art(ficial radioactiviO, in the Svalhard glaciers 165
C H E R N O B Y L I D E N T I F I C A T I O N
Radioactivity from Chernobyl in freshly fallen snow
Soon after the accident, freshly fallen snow samples were collected in the Arctic, including Svalbard and Greenland. The initial radioactivity measurements were determined by global-fi counting (Pourchet et al., 1988). We noted a general decrease of the fi radioactivity, with an appar- ent half-life much smaller than that of ~~TCs. ;,-Ray spectrometry' measurements showed a 137Cs content less than 1 Bq kg i at the deposi- tion time (Table 1).
Chernobyl fall-out
The Chernobyl layer has been identified in almost all ice cores, excepted at two locations (AMUB, and SNOW which is located in a pass; see Table 2 for drilling site codes). Radioactive fallout from Chernobyl occurred for a short time over Svalbard glaciers so this new radioactive level in snow was originally quite narrow. After the next successive snow-falls, this radio- active snow-layer kept its initial position in depth. However, a part of this radioactivity (~~TCs) has since been propagated downwards at least several meters, due to melting and percolation processes, mainly during warm summers (with positive surface temperatures).
This phenomena is visible on almost all 1~7Cs distributions in ice cores (Figs 3 and 4): a clear downward movement appears for AMUA, for example. The 137Cs concentration, due to Chernobyl, never exceeds 26 × 10 3 Bq kg t. The accuracy of the initial appearance of the Cherno- byl layer depends on the total length of the filtered snow samples submit- ted to ;,-ray spectrometry.
The t~TCs concentration and fall-out depend on the studied glacier and the sampling location and show important spatial variations, even for
TABLE 1 Caesium-137 Concentration in Freshly Fallen Snow Samples at the Date of Deposition.
May 1986
Sampling Greenlamt Svalhard locations Station Nord Aust/bnna (525 m) Nv-Alesund
81' 36'N, 16'40'W 79'43'N. 2543'E 78 55'N. t l 56'E
Dates of 8 and 12 May 4 May 17 and 18 May 13 May deposition (1986) >TCs (Bq kg 1) 0.178 0-105 0.299 0.017
166 .I. 1". P ing lo l et al.
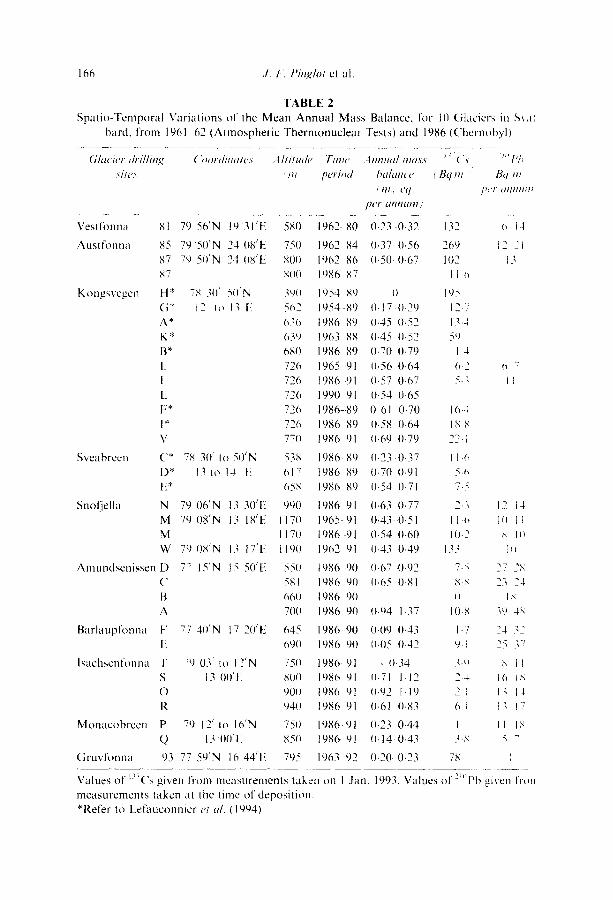
TABLE 2 Spat io-Temporal Varial ions of the Mean Annua l Mass Balance, lbr 10 (i laciers in Sxai
bard, from 1961 62 (Atmospher ic Thermonuc lea r Tests) and 1986 (Chernobyl t
Glac ier ehi l l ing ( "oordiua/e.s A l t i t u d e T i m e A n n u a l ma.ss ] + ( X V,, l,t~
s#e.~ r' m , per~m~ b a l a n c e ( Bq m Bq /H
/ II1~ ( 'q, p t 'F Hflt l l t lH
])( 'r HHtllIl l l j
Vestfonna
Aus l t bnna
K ongsvegen
8t 79 56'N 19 31'E
85 79 50 'N 24 08'E 87 79 5(fN 24 08'E 87
H* 78 3(f 50'N ( i* 12 tt~ i1 l{ A* K* B* L I. l. F* 1"
V
Sveabreen C* 78 30' 1o 50'N 1)* I~ Io 14 t! t!*
Snol]ella N 79 06 'N 13 30'[! M 79 08'N 13 18'E M W 7 9 0 8 ' N 13 17't"
A m u n d s e n i s s e n D 77 15'N 15 50'E (.
B A
Bar laupfonna F" 77 40'N 17 20'E f!
Isachsenfonna T "9 03' to 12'N S 13 (10' t: O R
Monacobreen P 79 12' lo 16'N Q 13 00'1:
Gruv lbnna 93 77 59'N 16 44'E
580 1962 80 0.23 0.32 132 6 I-4
751) 1962 84 0.37 0.56 269 12 2i 800 1962 86 0.50 0.67 102 13 8(10 1986 87 114~
39(I 1954 89 I) 195 5(+2 1954 89 t)-17 0.29 12.7 630 1986 89 0.45 0.52 13..4 639 1963 88 0.45 I)-52 59 680 1986 89 0.70 0.79 1.4 726 1965 91 0.56 0.64 6.2 o "7 726 1986 91 0.57 0.67 5.3 It 726 1990 91 0-54 0.65 726 1986 89 0 61 0-70 16.4 726 1986 89 (I-58 0.64 18-S 77(t 1986 91 (I.69 0.79 22.1
538 1986 89 0.23 0-37 t14, 617 t986 89 0.70.0.91 54, 658 1986 89 0-54 0.71 7.5
990 1986 91 0.63 0.77 2.3 12 i4 1170 1965 91 0.43 0.51 114, If) 11 117(I 1986 91 (1.54 0-60 10-2 ~ Ili 1190 1962 91 0.43 0-49 133 1~
55(t t986 90 0.67 0.92 7.5 27 2~ 581 1986 90 0.65 0.81 8.S 23 24 660 1986 90 0 I ,'< 70(I 1986 9(1 0.94 1-37 10.8 39 48
645 1986 90 0.(19 (I.43 I-7 24 32 69(1 1986 90 0.05 0-42 9.1 25 37
750 1986 91 ..0.34 ~,.~ S il 800 1986 91 0.71 1.12 2-4 16 l£ 900 1986 91 0.92 1.19 2 I I~ 14 940 1986 91 0.61 0-83 61 13 !7
750 1986 91 0.23 0.44 1 11 18 850 t986- 91 (I.14 0.43 3.S "~ "
795 1963 92 0.20 0.23 78 :
Values of ' ( s given from measurements taken on measurements taken at (he time of deposit ion. *Refer to Lefauconnier e; aL (t994)
HI 1 Jan. 1993. Valuesol "~ Pb given lYon

Natural and art!/icial radioactivity in the Svalhard glaciers 167
[1 _ _
1 0
0 I
Pi ,,n 0 ~ I I E
2
0
1 0
2
0 2 4 6
' l
,-,m
E E
i' 8 10 0 2 4
Depth (m w.eq.)
I I
I I
I
i 75
5O
50
] I 0
' I ~ 75
5O
0 6 8 10
5
0 g E
I ° ~50 ~
( I n - - • - • Fig. 3. WCs (['rom Chernobyl) and - vr~ actp~ t es. with depth (meters water equiwdent) for ice cores from Kongsvegen (KONV) , Snol]ella (SNON) . Monacobreen (M ON Q-P) and
|sachsenfonna (ISAO-R-S-T) glaciers. The arrows show the 1986 Chernobyl layer,
nearby ice cores (Table 3). This implies a surface redistribution of 137Cs, mainly due to eolian processes.
Measured ~)VCs profiles at Kongsvegen (ice cores: KONI and KONL separated by about 100 m and drilled respectively in 1990 and 1992), show variable concentration and fallout (fallout varies by a factor of 4). In the same way, there are great variations at the Snofjella glacier, for three nearby ice cores and there is n o 137Cs at SNOW, which may be due to an eolian effect at this pass. Also, at the Amundsenissen glar,er (AMUB) for 4 ice cores regularly spaced with respect to altitude, no '~TCs is detected. Fallout is well represented at higher locations on glaciers due to reduced melting and percolation. The maximum fallout for Svalbard is about 20 Bq m 2 recorded at Kongsvegen (KONI and KONV) and this value is

168
10: . . . . .
F
10,
g ~ g E :
4 ~ c~ g e b
0 i
,1. 1" I"m,£,lol et al.
J
' I i 2b
. . . . . . r . . . . . . . . . . .q
i 2 1 0 P b " E
' JO
i~o2
-~ 7 5
10 ~ -H i 2 5
i ,i | L ;o 0 I 0 2 4 6 8 10
Fig . 4 . A s lkw Fig .
i r ,~ V - 17s
i . 2,~i i t -
c . I "--T f T . . . . 2 r5
L. i
._ ~ - 5 0
l] b
i I I I ___ 0 2 4 6 8 10
Depth (m w.eq.)
bul for A m u n d s c n i s s e n ( A M U A-B-C- I ) ) and P, a r l aupfonn , !
( B A R t:-E} glaciers.
close to the values measured in Greenland (Davidson e t a/., 1987: l)ibb, 1989). Lower values arc encountered on all other glaciers and ranges from 5 up to 10 Bq m -~ (Fig. 1). The mean value, for locations above 700 m elevation, is 7.6 Bq m
These fallout wdues are less than in glaciers in the French Alps
[ A B L E 3 ( ' o m p a r i s o n o l ~ : ( ' ~ ( ' o n c e n t l a t i o n s and F a l l o u t f rom Chernoby l for ncarb' , Ice t ore ' , t,~
Differen! Glaciers
Glaci('r~ h'c ('Ol'C.s ler ('.S
,,~gdXiltllll*l COtlCCIIII'HIiOll l@/[ult[
, m B q kg 1.. ~Bq m
K o n g s v e g e n K O N I 17-5
K O N I , 7.2
Snofjclla S N O M 6.1
( H o h e d a h l f o n n a ) S N O W 0
S N O N 1.9
A m u n d s c n i s s e n A M U A 4-2
A M U B 0
I,S.S
5.';
10-2
2.3
lo'x o

Natural and artificial radioactiviO" in the Svalhard glaciers 169
(400 Bq m 2) (Pinglot & Pourchet, 1989), Switzerland and Austria (several 103 Bq m -2) (Ambach et al., 1987; Haeberli et al., 1988).
Mean annual mass balance since 1986
The comparison of mean annual mass balances, obtained by the glaciolo- gical method (measurements of stake emergence above surface), and by the determination of the Chernobyl layer shows that there is a close agreement between the two methods, as already demonstrated with vari- able altitude ice cores from Kongsvegen (Pinglot et al., 1992). This important fact leads to the conclusion that this Chernobyl layer does not migrate in totality to greater depths.
At Kongsvegen, the annual mass balances are directly proportional to the altitude on the glacier. From the equilibrium line, at about 520 m, the mass balance increases from 0 up to about 0-60 meters water equivalent per annum (row eq. per annum).
The Chernobyl layer allows the determination of the spatio-temporal variations of the annual mass balance in the accumulation area of the 10 studied glaciers. These glacier mass balances depend on the location, alti- tude and exposition of the glaciers. The mass balance increases with altitude. At the uppermost location of each glacier, this mass balance is about 1 mw eq. per annum (Amundsenissen and Isachsenfonna) 0.6 in,, eq. per annum (Kongsvegen), and about 0.2 mw eq. per annum (Barlaupfonna and Monacobreen) see Table 2 and Fig. 2.
ATMOSPHERIC THERMONUCLEAR TESTS: 1954 AND 1961 62
The Chernobyl accident (1986) and the atmospheric thermonuclear tests (1954 and 1961-62 are the most important) constitute two well-known radioactive layers in glaciers. Among all the above studied ice cores from Svalbard, eight also show ~37Cs from the thermonuclear tests, at much greater depths, and three of these eight 13VCs profiles also exhibit the Chernobyl event. These profiles enable us to determine the mean annual mass balances for different time scales, ranging from 1963 to 1986, 1986 to 1990 (91, or 92), 1963 to 1990 (91 or 92).
The profiles from SNOW, VEST 1981 and AUST 1985 87 (Fig. 5) (Punning el al., 1986; Vaikmiie & Punning, 1989; Vaikmfie et al., 1993: Takahashi et al., 1993) compare closely. From the surface and down to a given depth, a very significant increase of ~3:Cs activity begins at about 1965, reaching a maximum in 1962 63, corresponding to the nuclear tests, particularly from Novaya Zemlya (75~N, 55 E).

170 ,I. I.. l ' i n~ l , t c t a l .
50
40
30
20
10
0
50
40
30
20
g o
50
3O
2O
10 0
5O
40
30
20
10
0 0
~ P-F-T-~ ' - - - ' - - q
~_ 1,,~..~ t 21o m, I _~
L_ t * ~ ' ]
: ii
1 .~L~ r 1
10 2 0 3 0
}- 1~24a ('K6RR3 = 4~
1 9 8 6
- 191& ,,.s .~0
g. ~ - _ T - ~ - - W - r - F - 7 - i i ; ~ so
• i 1 9 8 6 _ : i ~
~ F - - ~ I I - . . . . . 50
~ _ • 3G
.; 1H
0 ";0 20 3n D e p t h (m w . e q . )
E
Fig. 5. ~r(., (From ('hcrnobvl and Ihermonuclear lcsls) and :~"Pb activities lot ice core>, from West Spitsbergc, n (Snol]clla (SNOW'-M t, Kongsvcgen (KONK-L)and (hu\l'olm:: (GRU 1993)) and Nordausllandcl ( VEST 198 I, AUST 1985 19871. wilh depth ~m.., cq ). lh~_
arrov~s~,t~ the 1986and 1962 63(1965)rudioaclivclavcrs.
F o r ice cores K O N K , K O N L and S N O M f rom nea rby glaciers, z~
significant increase ill ~ ( ' S occurs at dep ths ranging f rom 12.16 to 13.82 m,, eq., f rom 15-94 t o 17.84 in,, eq.. and f rom 12.20 to 14.28 m,, cq.. respectively. These dep ths c o r r e s p o n d to a b o u t 1962 63 ( K O N K ) a n d 1965 ( K O N L , S N O M ) , at the end o f the morator iun- | per iod fol lowing the 1961--62 t h e r m o n u c l e a r tests.
M e a n annual mass balance since 1962-63
The mean annua l mass ba lance covers the t ime scale [ 'rom 1962 (~3, up to 1981. 85. 87 or 91. and can be c o m p a r e d to the values deduced l'rom the

Natural and art(/icial radioactivity in the Svalhard glm'iers 171
T A B L E 4 Var ia t ions of Mean Annua l Mass Balances Over Three Difl'erent Timescales and for Three
Different Glaciers
Station,s Time scale Time .~~'a/e Time sca/e B t l l a l l t ' t ~ B t l / d l l t ' t ' l~(l/(lll( '('
[ I l l w (*q. pC'l" alql l l l l l l ) ( i l l n o q . ] ) c r d l l l l l l t l l ) f i l l , , C~/. p('l" {ll l l l l i l l l J
K O N L 1965-91 1986 9l 1965 86 0-56 0.64 0.57 I)-67 0-54 0.65
K O N K 1963-88 1986 88 1963 86 0.45 0.52 0-46 0.54
SNOM 1965-91 1986 91 1965 86 0-43 0.51 0.54 0.60 (I-39 0-50
Chernobyl layer (Table 4 and Fig. 5). One ice core (SNOM) shows a significant increase of the mean annual mass balance for the 1986 92 period, compared to the 1965-86 period. The increase in mean annual mass balance could be as much as 20%. Concerning ice core KONL, there is no significant difference in the mass balances and one time scale (1986- 88) is only 2 years for KONK.
For Nordaustlandet , the mean annual mass balance since 1962-63 is much smaller on the Vestfonna glacier (0.23 0.32 mw eq.), compared to Austfonna glacier (0.37 0.56 and 0.50-0-67 mw eq.).
137Cs fallout from nuclear tests
The I)TCs fallouts have been determined for ice cores SNOW, VEST 1981 and AUST 1985 and 1987. Computed at the mean time of deposition (from 1954 up to 1965), the atmospheric thermonuclear tests fallout is 260, 260, 540 and 200 Bq m 2 for Western Spitsbergen (ice core: SNOW) and Nordaust landet (ice cores: VEST 81, AUST 1985 and 1987) respectively. For measurements taken on 1 January 1993, it is 133. 132, 269 and 102 Bq m : respectively. This 137Cs fallout is of the same order l\~r Western Spitsbergen and Nordaust landet (Fig. 1). Note the high value for AUST 85 compared to AUST 87, located nearby. However, this fallout is greater than fallout over Antarctica (even for coastal areas), where the 13:Cs fallout reaches about 60 Bq m-2 (Bartarya et al., 1993). This fallout is almost 10 to 20 times above the Chernobyl fallout (20 Bq m e at Kongsvegen glacier: KON1 and KONV). The nuclear tests fallout for ice cores KONK, K O N L and SNOM does not include all of the period from 1954 up to 1965.
For the G R U 1993 ice core, there is a ~37Cs occurrence from the surface down to the bottom: the corresponding mass-balance (1963 1992) indi-

172 .I.F. Pin~lol et al.
cates that this ice core is close to the equilibrium line of the Gruvfonna glacier. For the drilling site H on the Kongsvegen glacier, in the ablatiot~ area, the specific : C s activity is about 10 times that of other ice core- (SNOW and AUST 19871.
N A T U R A L RADIOACTIVITY
As previously determined lk~r the Kongsvegen and Sveabrecn glacier, sampled in 1990 (Pinglo! ~,l a/.. 1992), the ice cores flom the other glaciers show a relatively high concentration of global-/'] radioactivit\ in the uppermost layers of snow, near the surface (Amundsenisscn and Barlaupfonna glaciers, respectively A M U A to D and BAR t:! and 1: ice cores) this corresponds to the winter precipitation, undisturbed bx summer melting. Measured by ;'-spectrometry, the only radio-isotope present is emPb (at 46.54 keV: half-life: _,.3 years). There is m~ equih- brium with -~lapb and -'HBi: the -'mPb content is not due to - Ra, but 1,, e-'eRn (Suzuki & I-@i. t992). Despite the high concentration of dust it~ these Svalbard glaciers, the main natural radioactivity comes from ::-~Rn This :l°Pb concentration, in the first few meters t'rom the surface, ~-, greater than the ~:( 's activity from Chernobyl in all ice cores (note th~ different scales on Figs 3 and 4). The emPb concentration is. hm~cxc~. always less than 0-1 Bq kg ~. The decrease of-~mPb with depth, expressed in meters of water equivalent, is not governed by its half-life.
Mean annual fallout of 2mPb
The mean annual fallout is determined using the Chernobyl layer datinkz between 1986 and the surtitce deposition date. This Fallout (expressed irt Bq m 2 per annum) has been computed for most of the studied glacier>+ The :mPb activities of samples have been corrected to the time ol deposi- tion. For the Western Spitsbergen area, including Kongsvegen. Snolliella. Isachserfl'onna and Monacobreen glaciers, the mean fallout i~, about 12 Bq m - per annum (Pinglot el a/., 199:) and 70 Bq m - bet~ccn 198¢+ and 1992. This fallout is close to values determined m Greenland (Nijampurkar & Clausen. 1990: Dibb, 1992): 10 and 7.4 Bq m per annum. For the southern Amundsenissen and Barlaupfonna ghtciers, this :J°Pb fallout is greater, about 28 Bq m -+ per annum. This may be due Io greater uncovered snow surfaces (Fig. 1). The :mPb fallout, from 1986 up to 1992 is about 5 times the 137Cs fallout from Chernobyl (100 Bq m compared to 20 Bq m -+). The in-depth catchment of 21°Pb differ,, notably

Natural and art([~cial radioactivity in the Svalbard glaciers 173
from that of ~3VCs, which is much more efficiently trapped. Due to fusion and percolation of the firn, the 21°pb has been washed out, possibly by solubilisation. This rapid 2~°Pb attenuation with depth leads to the diffi- culty of 21°Pb-dating of firn layers, as well as problems with seasonal variations of elements (Ambach et al., 1989). The mean annual fallout of -~°Pb has been determined for longer time scales, ['or several ice cores, including VEST 81, AUST 87, KONL, SNOM, SNOW, and G R U 93 (Table 2, Fig. 1). For the AUST 87 ice core, the :~°Pb fallout ranges from 300 to 516 Bq m -2 (1962-1987) leading to 12-21 Bq m 2 per annum. This value is very similar to the previous 12 Bq m -2 per annum determination for Western Spitsbergen (1986-1992). However at ice cores KONL, SNOM and SNOW, the fallout of 21°pb (1965-1992) is 6.5, 10.5 and 10 Bq m 2 per annum, respectively, values slightly lower than for AUST 1987. At ice core KONL, a large amount of 21°pb has been washed away (a water level exists at 26 m depth). For ice core G R U 93 (Fig. 5), the 21°pb fallout is as low as 1 Bq m -2 per annum, with a surprisingly low concentration. As mentioned previously, this ice core is close to the equilibrium line.
Concentration factor of 21°Pb in old layers of snow
Instead of a sudden event such as the Chernobyl accident, the production of 222Rn is continuous with time, as previously observed for different time scales. In ice cores SNOW and AUST 1985-1987, at dates before the first arrival (1954) of artificial radioactivity, some ice layers exhibit a great concentration of 2~°Pb, corresponding to melting and percolation proces- ses, and leading to the additional accumulation of several years of 21°Pb deposits.
As previously determined with the AUST 87 ice core, the mean annual fallout is 12 to 21 Bq m -2 per annum, from 1962 up to 1987. Concerning the AUST 87 (and 1985) ice layer (between 20.13 and 25.15 m~, eq., i.e. about 8 years of accumulation assuming a constant mean annual mass balance of 0-60 mw eq. as previously determined), the 21°Pb fallout is 216 Bq m 2. This means about 800 Bq m -2 at the time of deposition. So we can conclude that there is an excess of 21°Pb deposit, corresponding to about 30 years, inside this ice layer. A similar ~t°Pb enrichment exists for the SNOW ice core (between 21-97 and 23.55 mw eq.) where there is an excess of about 15 years of annual 21°Pb deposition. These 2~°Pb enriched snow layers may indicate that a multi-year period prevailed before 1954 (or around 1950), when summer temperatures above Svalbard glaciers were certainly higher than from 1954 to 1992, and might have led to smaller (or null) annual mass balances.

174 ,I. t". Pi#7,Cdot el al.
CONCLUSIONS
The atmospheric thermonuclear tests conducted mainly in 1954 and 1961 62, as well as the Chernobyl accident (1986). provide well known radio- active levels in the snow layers of the accumulation areas of the Svalbard glaciers.
All I(l studied glaciers have been marked by the Chernobyl accident. Moreover, this radioactive layer has been well preserved in dcpth. The distribution and fallout of ~3;Cs with depth is dependent upon the glaciers concerned, the altitude and the orientation. The Chernobyl l'allout ~ about 20 Bq m -~ per annnm, similar to the value found in Greenland. and smaller than that found in the French Alps (400 Bq m -" per annum).
The I~=(_'s fallout fronl the atmospheric thermonuclear tests rcachcs about 10 to 20 times the ( 'hernobyl fallout, a l 200- 540 and 20 Bq m . aI the deposition date. Near the equilibrium line of the glaciers, the specific activity of ice layers exhibits a concentration (10 times) of the isotopc- from the atmospheric tests. These radioactive levels enable the determi- nation of the mean annual mass balances of glaciers and their associated spatio-temporal variations. This mass balance, as for the l ~ ( s lallout. exhibits the same geographical variations and increases with altitude on any onc glacier.
At the highest location of each glacier (a clear relationship prevails between altitude and mass balance) the mass balance since 1986 xaries from about 1 meter of water equiwilent (m,~ eq.) per annum (Amundse- nissem lsachsenfonna glaciers), to (I.6 in,, eq. at Kongsvegen and (I-2 m.. eq. at Barhtupfonna and Monacobreen.
Comparing the mean annual mass balances of glaciers for different time scales, this important parameter seems to have increased since 1986. compared to the period 1963 86. For 1 ice core (among 3) where this comparison is possible, the increase could be as high as 20%. The global budget of Svalbard glaciers can be computed from the annual mass balance (and also other parameters). The global budget for the Kongsve- gen glacier is positive (t~,, =--0-11 m,, eq.) (Hagen & Liestol, 1790: Lefau- connier & Hagen. 1990: Lefauconnier el al., 1994).
The natural radioactivity (mainly -'mPb) is higher than the artificial deposits, but always less than 0.1 Bq kg i. The fallout of- 'mPb since 1986 is about 5 times the deposit of ~7Cs from Chernobyl. The decrease of -'i°pb with depth (in in,, eq.) is not governed by its halt-life. While the I~:Cs layers are well preserved in depth, the distribution of e>Pb is much disturbed by melting and percolation. Relatively highly' radioactive snmx. layers, with high concentrations of -q°Pb , result from the additional deposit which corresponds to tip to 30 years of annual 21°Pb fallout. 'mPb

Natural and artificial radioactivity in the Svalbard glaciers 175
analyses therefore show that seasonal variation of chemical or stable isotopic elements may not be assumed in the presently studied Svalbard glaciers.
A C K N O W L E D G E M E N T S
The field expedition in 1989 on the Kongsvegen and Sveabreen glaciers was made possible by the support of the 'Fondat ion Franco-Norv~gienne pour la Recherche Scientifique et Technique et le D~veloppement Indus- triel', represented by Dr M. Durand, at the French Embassy in Oslo.
The successive campaigns on Svalbard glaciers from 1990 to 1992 were made possible by E.C. Grant No. EPO C-CT91-0035 (DSCN), and co- ordinated by Dr M. Vallon. Extensive logistic and technical support was provided here by the Norsk Polar Institutt in Oslo, as well as in Long- yearbyen and Ny-Alesund. At the Ny-Alesund research station, we received continuous assistance from the Kings Bay Kull Company and Televerket.
R E F E R E N C E S
Ambach. W., Rehwald, W., Blumthaler, M. & Eisner, H. (1987). Chernobyl fall- out on alpine glaciers: A new reference horizon for dating. EOS, 68(45). 1577.
Ambach, W., Rehwald, W., Blumthaler, M., Eisner, H. & Brunner, P. (1989). Vertical dispersion of Chernobyl fall-out on Kesselwandferner, Oetzal Alps, Austria, J. Ghwiol., 35(120), 294.
Bartarya, S. K., Pourchet, M. & Pinglot, J. F. (1993). Distribution and fallout of n)TCs and other radionuclides over Antarctica. Int. Cot!f~ on Enviromne, tal Radioactivity #7 the Arctic and Antarctic, 23 27 August 1993. Kirkenes, Norway.
Davidson, C. I., Harrington, J. R., Stephenson, M. J., Monaghan, M. C., Pudy- kiewicz, W. R. & Schell, W. R. (1987). Radioactive caesium from the Chernobyl accident in the Greenland ice sheet. Sciem'e, 237(4815), 633 34.
Delmas, R. & Pourchet, M. (1977). Utilisation de filtres 6changeurs d'ions pour l'~tude de l'activitb b6ta globale d'un carottage glaciologique, l , t . As.sot. Hydrological Sciences. Publication 118 (Grenoble 1975), 159 163.
Dibb. J. (1989). The Chernobyl reference horizon in the Greenland Ice Sheet. Geophys. Res. Lett., 16(9), 987 990.
Dibb, J. (1992). The accumulation of 21c~pb at Summit, Greenland since 1855. Tellus, 44B, 72-79.
Hagen, J. O. & Liestol, O. (1990). Long term glacier mass balance investigations in Svalbard 1950 88. Ann. Glaciol., 14, 102-106.
Haeberli, W.. Gaggeler, H., Battensperger, U., Jost, D. & Schotterer. U. (1988). The signal from the Chernobyl accident in high-altitude firn areas of the Swiss Alps. Annals, 10, 48 51.

176 .I.F. PiHy, lot et al.
Holdsworth, G., Pourchet, M., Prantl. F. A. & Meyerhof, D. P. (19841. Radio- activity levels in a firn core f iom tile Yukon Territory, Canada..4tmo,,, Era'iron., 18(2), 461 6.
Lefauconnicr, B. & Hagen, ,I. O. (1990). Glaciers and climate in Svalbard. Statistical analysis and reconstruction of the Broggerbreen mass balance t~', the last 77 years. Anti. Glaciot., 14, 148 52.
Lefauconnier, B.. Hagen, J. O.. Pinglot, J. F. & Pourchet, M. (1994~ Ma,,,, balance estimates on the glacier complex Kongsvegcn and Sxcabreeu. Spitsbergen, Svalbard, using radioactive layers..1. Glaciol, 40(135), 368 376,
Nijampurkar. V. N. & Clausen. H. B. (1990). A century old record of lead-21o fallout on the Greenland ice sheet. Telh~s, 42B, 29 38.
Picciotto, E. & Wilgain, S. (1963). J. Geophys. Res., 68(21), 5965 72. Pinglot, J. F. & Pourchct, M. (1979). Low level beta counting with an automat~
sample changer. Nuclear btstruments and Methods, 166(3), 483 ~0. Pinglot. J. F. & Pourchet, M. (19891. Determination du bilan glaciairc en /olac
d'accumulation par mesure in situ de la radioactivit6 due a Tchcrnobxt. ( 'omple rendu de I'Acad&nie des Scie/u'es. Tome 309, s6rie !I, 365 37(1.
Pinglot, J. F.. Pourchet. M., Lefauconnicr, B. & Hagen, J. O. (1992L Chernob\i Fallout in Svalbard: Glaciological Applications. Proc. Ih'ench ,Vorweoi~;ti ,4rcli(" ,S'emimH'. Paris 15 16 October 1992.
Pinglot, J, F., Pourchet, M., [,cfauconniel, B., Hagen, ,I. O., Vaikmiic, R.. Punning, J. M., Watanabc, O,. Takahashi. S. & Kameda. T. t lt)~?31. NatuJ-~li and artificial radioactivities in the Swdbard glaciers. Inl. ('o~ll. i;),vif,)/~- IIl( ' l l l t l / Ratliorl~'livllt Itl llIc .'l/'{/ic tIlUt ,ttlltlrclic, 23 27 ,,'~t.l~l.l'~l ]t)t)~ Kirkcnes, Norw a'y.
Pourchct, M., Pinglot, .1. t-. & Gascard, J. C. (1986). The northerl\ c\tc~lt ,,~ ( 'hernobyl contaminalion. Natttre. 323(6090). 676.
Pourchel, M., Pinglot, J. |:.. Rcynaud. 1.. & Holdsworth, G. (1988). ldcntil]catlott of the Chernobyl fall-out as a new reference level in northern hemispherv glaciers..I. Gktciol.. 34. 183 7.
Punning, . t .M., Martma. T. A., T&ugu, K. E., Vaikmiie. R. A., Pourchcl. M. & Pinglol, J. I:. (19861. Stratification in all ice core froln Vcsllkqlll:t. Nordaustlandct. Polar. Geogr. Geol., 10. 39 43.
Suzuki, T. & Fujii. Y. (1992L Vertical profile of-~l"Pb in an ice core l lom Ihc Hoghetta ice dome in Spitsbergen. Proc. N I P R ,S~vmp. Polar llctcc,r,,/. Glacio.. 6, 84 S7.
Takahashi, S., Kobayashi, S. & Watanabe, O. (1993). Field acti,,'it~c~, ,7I the Japanese Arctic Glaciotogical Expedition to western Spilsbc,'gen h~ 1991 and 1992 (Jage 1991 19921. Bull. Glacier Re.~.. I I, 63-74.
Vaikmfie, R. A. & Punning. J. M. (1989). Stratification of ice cores Ir<m~ Spitsbergen in view of glacioclimatic reconstructions..~lat. Glva~.~,,/ Lye/c,/. 67, 97 103.
Vaikmlie. R., Punning, ,I. M.. Pinglot, J. F.. Pourchct, M. & Hebert. l). (1993L Arctic glaciers as archives of artificial radioactive contaminants. IHI. £~vmp o/i the Ecological El/eels O/ Arctic ,4irhor/w ('ot*tami/ltl/lt.~. Rcykjavik. Iceland, 4 8 October 1993.
Copyright © 2022 FDOKUMEN