Assessment of natural radioactivity in aquifer medium bearing uranium ores in Koprubasi, Turkey
10
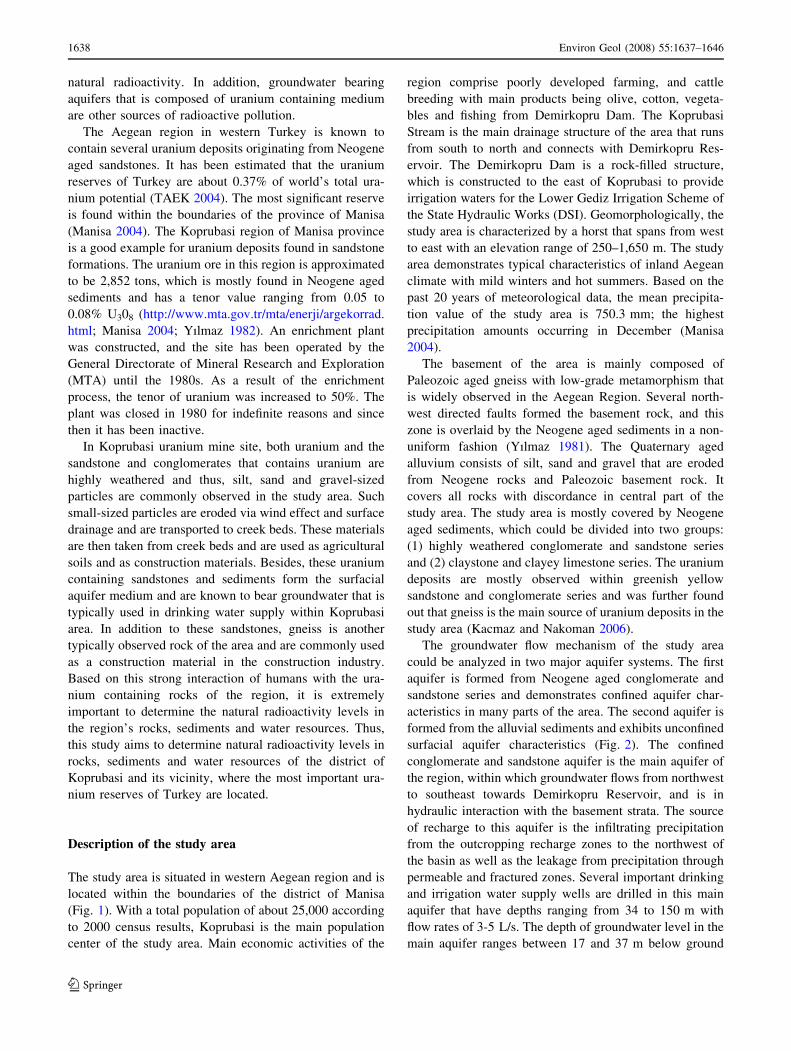
ORIGINAL ARTICLE Assessment of natural radioactivity in aquifer medium bearing uranium ores in Koprubasi, Turkey Celalettin Simsek Received: 29 June 2007 / Accepted: 29 October 2007 / Published online: 15 November 2007 Ó Springer-Verlag 2007 Abstract Koprubasi, located within Manisa Province near the Izmir, is the biggest uranium mine where uranium ores originate from Neogene aged altered sandstone and conglomerate layers. The main objective of this study is to determine the radiation hazard associated with radioactiv- ity levels of uranium ores, and the rocks and sediments around Koprubasi. In this regard, measured activity levels of 226 Ra, 232 Th and 40 K were compared with world aver- ages. The average activity levels of 226 Ra, 232 Th and 40 K were measured to be 5369.75, 124.78 and 10.0 Bq/kg in uranium ores, 24.32, 52.94 and 623.38 Bq/kg in gneiss, 46.24, 45.13 and 762.26 Bq/kg in sandstone and con- glomerate, 73.11, 43.15 and 810.65 Bq/kg in sediments, respectively. All samples have high 226 Ra and 40 K levels according to world average level. As these sediments are used as construction materials and in agricultural activities within the study area, the radiation hazard are calculated by using dose rate (D), annual effective dose rate (He), radium equivalent activity (Ra eq ) and radiation hazard index (I yr ). All the samples have Ra eq levels that are lower than the world average limit of 370 Bq/kg. On the other hand, D, He and I yr values are higher than world average values. These results indicate that the uranium ores in the Kopru- basi is the most important contributor to the natural radiation level. The radioactivity levels of sediments and rocks make them unsuitable for use as agricultural soil and as construction materials. Moreover, it is determined that shallow groundwater in sediments and deep groundwater in conglomerate rocks and also surface water sources in the Koprubasi have high 226 Ra content. According to envi- ronmental radioactive baseline, some environmental protection study must be taken in Koprubasi uranium site and the environment. Keywords Radioactivity Radiological hazard Uranium bearing sediments Aquifer medium Koprubasi Introduction Rocks and sediments around the world contain different levels of radioactivity controlled by geological structure and rock chemistry. Major sources of radioactivity in the environment are the elements of uranium, thorium and potassium. Among these elements, uranium is the most significant source of radioactivity and decay to form radium (Singh et al. 2006). Although presence of natural levels of these radioactive elements in rocks, sediments and water does not create health effects, elevated levels of radioactivity beyond permissible standards are known to be the most important cause of cancer in humans. High levels of radioactivity is taken into human body via air and water intake and cause cancers in bones, stomach, intestines and lungs (USEPA 1986; Zepecza and Szabo 1986). Further- more, uranium is also responsible for water and sediment pollutions and is known to emit radiation for long periods of time when found in construction materials that are used for dwellings (Sroor et al. 2002; Woo et al. 2002; Hayambu et al. 1995; Xinwei and Xiaolan 2006). Thus, presence of uranium ores in the vicinity of residential areas demon- strates significant problems. The use of radioactivity containing materials in construction and/or the use of radioactivity containing sediments in agricultural produc- tion are the major causes for humans to be exposed to C. Simsek (&) Department of Drilling, Torbali Technical Vocational School of Higher Education, Dokuz Eylul University, Izmir 35860, Turkey e-mail: [email protected] 123 Environ Geol (2008) 55:1637–1646 DOI 10.1007/s00254-007-1113-z
-
Upload
independent -
Category
Documents
-
view
1 -
download
0
Transcript of Assessment of natural radioactivity in aquifer medium bearing uranium ores in Koprubasi, Turkey
ORIGINAL ARTICLE
Assessment of natural radioactivity in aquifer medium bearinguranium ores in Koprubasi, Turkey
Celalettin Simsek
Received: 29 June 2007 / Accepted: 29 October 2007 / Published online: 15 November 2007
� Springer-Verlag 2007
Abstract Koprubasi, located within Manisa Province
near the Izmir, is the biggest uranium mine where uranium
ores originate from Neogene aged altered sandstone and
conglomerate layers. The main objective of this study is to
determine the radiation hazard associated with radioactiv-
ity levels of uranium ores, and the rocks and sediments
around Koprubasi. In this regard, measured activity levels
of 226Ra, 232Th and 40K were compared with world aver-
ages. The average activity levels of 226 Ra, 232Th and 40K
were measured to be 5369.75, 124.78 and 10.0 Bq/kg in
uranium ores, 24.32, 52.94 and 623.38 Bq/kg in gneiss,
46.24, 45.13 and 762.26 Bq/kg in sandstone and con-
glomerate, 73.11, 43.15 and 810.65 Bq/kg in sediments,
respectively. All samples have high 226Ra and 40K levels
according to world average level. As these sediments are
used as construction materials and in agricultural activities
within the study area, the radiation hazard are calculated by
using dose rate (D), annual effective dose rate (He), radium
equivalent activity (Raeq) and radiation hazard index (Iyr).
All the samples have Raeq levels that are lower than the
world average limit of 370 Bq/kg. On the other hand, D,
He and Iyr values are higher than world average values.
These results indicate that the uranium ores in the Kopru-
basi is the most important contributor to the natural
radiation level. The radioactivity levels of sediments and
rocks make them unsuitable for use as agricultural soil and
as construction materials. Moreover, it is determined that
shallow groundwater in sediments and deep groundwater in
conglomerate rocks and also surface water sources in the
Koprubasi have high 226Ra content. According to envi-
ronmental radioactive baseline, some environmental
protection study must be taken in Koprubasi uranium site
and the environment.
Keywords Radioactivity � Radiological hazard �Uranium bearing sediments � Aquifer medium � Koprubasi
Introduction
Rocks and sediments around the world contain different
levels of radioactivity controlled by geological structure
and rock chemistry. Major sources of radioactivity in the
environment are the elements of uranium, thorium and
potassium. Among these elements, uranium is the most
significant source of radioactivity and decay to form
radium (Singh et al. 2006). Although presence of natural
levels of these radioactive elements in rocks, sediments and
water does not create health effects, elevated levels of
radioactivity beyond permissible standards are known to be
the most important cause of cancer in humans. High levels
of radioactivity is taken into human body via air and water
intake and cause cancers in bones, stomach, intestines and
lungs (USEPA 1986; Zepecza and Szabo 1986). Further-
more, uranium is also responsible for water and sediment
pollutions and is known to emit radiation for long periods
of time when found in construction materials that are used
for dwellings (Sroor et al. 2002; Woo et al. 2002; Hayambu
et al. 1995; Xinwei and Xiaolan 2006). Thus, presence of
uranium ores in the vicinity of residential areas demon-
strates significant problems. The use of radioactivity
containing materials in construction and/or the use of
radioactivity containing sediments in agricultural produc-
tion are the major causes for humans to be exposed to
C. Simsek (&)
Department of Drilling,
Torbali Technical Vocational School of Higher Education,
Dokuz Eylul University, Izmir 35860, Turkey
e-mail: [email protected]
123
Environ Geol (2008) 55:1637–1646
DOI 10.1007/s00254-007-1113-z
natural radioactivity. In addition, groundwater bearing
aquifers that is composed of uranium containing medium
are other sources of radioactive pollution.
The Aegean region in western Turkey is known to
contain several uranium deposits originating from Neogene
aged sandstones. It has been estimated that the uranium
reserves of Turkey are about 0.37% of world’s total ura-
nium potential (TAEK 2004). The most significant reserve
is found within the boundaries of the province of Manisa
(Manisa 2004). The Koprubasi region of Manisa province
is a good example for uranium deposits found in sandstone
formations. The uranium ore in this region is approximated
to be 2,852 tons, which is mostly found in Neogene aged
sediments and has a tenor value ranging from 0.05 to
0.08% U308 (http://www.mta.gov.tr/mta/enerji/argekorrad.
html; Manisa 2004; Yılmaz 1982). An enrichment plant
was constructed, and the site has been operated by the
General Directorate of Mineral Research and Exploration
(MTA) until the 1980s. As a result of the enrichment
process, the tenor of uranium was increased to 50%. The
plant was closed in 1980 for indefinite reasons and since
then it has been inactive.
In Koprubasi uranium mine site, both uranium and the
sandstone and conglomerates that contains uranium are
highly weathered and thus, silt, sand and gravel-sized
particles are commonly observed in the study area. Such
small-sized particles are eroded via wind effect and surface
drainage and are transported to creek beds. These materials
are then taken from creek beds and are used as agricultural
soils and as construction materials. Besides, these uranium
containing sandstones and sediments form the surfacial
aquifer medium and are known to bear groundwater that is
typically used in drinking water supply within Koprubasi
area. In addition to these sandstones, gneiss is another
typically observed rock of the area and are commonly used
as a construction material in the construction industry.
Based on this strong interaction of humans with the ura-
nium containing rocks of the region, it is extremely
important to determine the natural radioactivity levels in
the region’s rocks, sediments and water resources. Thus,
this study aims to determine natural radioactivity levels in
rocks, sediments and water resources of the district of
Koprubasi and its vicinity, where the most important ura-
nium reserves of Turkey are located.
Description of the study area
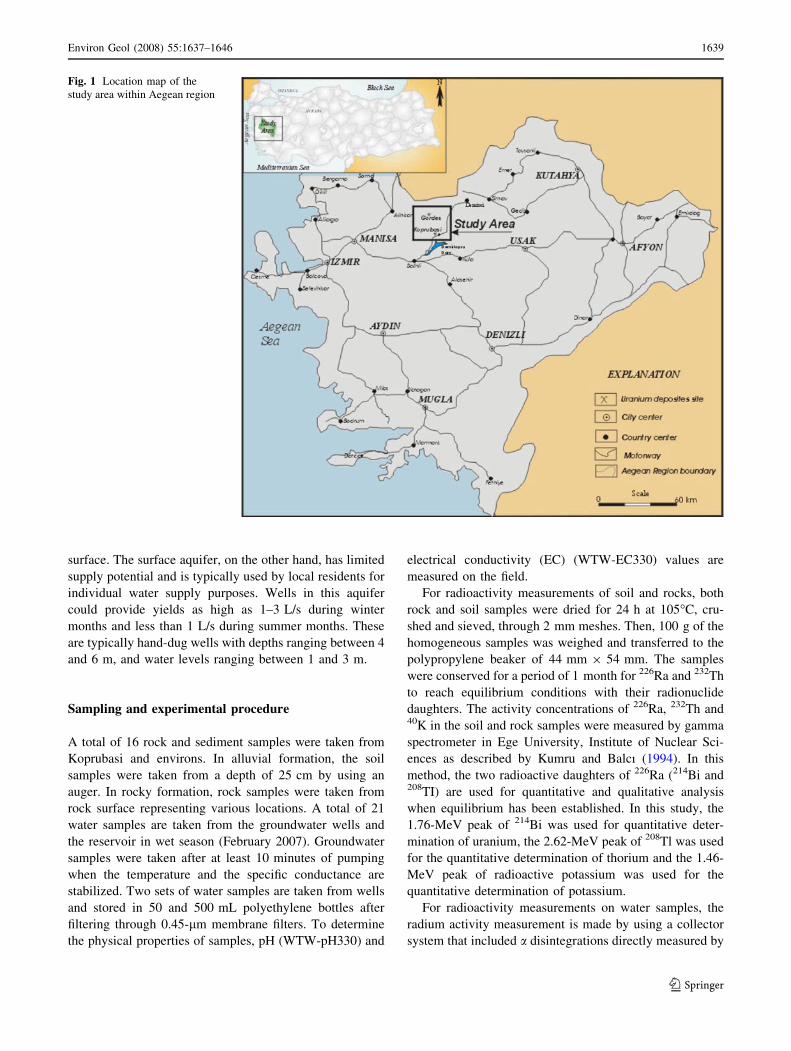
The study area is situated in western Aegean region and is
located within the boundaries of the district of Manisa
(Fig. 1). With a total population of about 25,000 according
to 2000 census results, Koprubasi is the main population
center of the study area. Main economic activities of the
region comprise poorly developed farming, and cattle
breeding with main products being olive, cotton, vegeta-
bles and fishing from Demirkopru Dam. The Koprubasi
Stream is the main drainage structure of the area that runs
from south to north and connects with Demirkopru Res-
ervoir. The Demirkopru Dam is a rock-filled structure,
which is constructed to the east of Koprubasi to provide
irrigation waters for the Lower Gediz Irrigation Scheme of
the State Hydraulic Works (DSI). Geomorphologically, the
study area is characterized by a horst that spans from west
to east with an elevation range of 250–1,650 m. The study
area demonstrates typical characteristics of inland Aegean
climate with mild winters and hot summers. Based on the
past 20 years of meteorological data, the mean precipita-
tion value of the study area is 750.3 mm; the highest
precipitation amounts occurring in December (Manisa
2004).
The basement of the area is mainly composed of
Paleozoic aged gneiss with low-grade metamorphism that
is widely observed in the Aegean Region. Several north-
west directed faults formed the basement rock, and this
zone is overlaid by the Neogene aged sediments in a non-
uniform fashion (Yılmaz 1981). The Quaternary aged
alluvium consists of silt, sand and gravel that are eroded
from Neogene rocks and Paleozoic basement rock. It
covers all rocks with discordance in central part of the
study area. The study area is mostly covered by Neogene
aged sediments, which could be divided into two groups:
(1) highly weathered conglomerate and sandstone series
and (2) claystone and clayey limestone series. The uranium
deposits are mostly observed within greenish yellow
sandstone and conglomerate series and was further found
out that gneiss is the main source of uranium deposits in the
study area (Kacmaz and Nakoman 2006).
The groundwater flow mechanism of the study area
could be analyzed in two major aquifer systems. The first
aquifer is formed from Neogene aged conglomerate and
sandstone series and demonstrates confined aquifer char-
acteristics in many parts of the area. The second aquifer is
formed from the alluvial sediments and exhibits unconfined
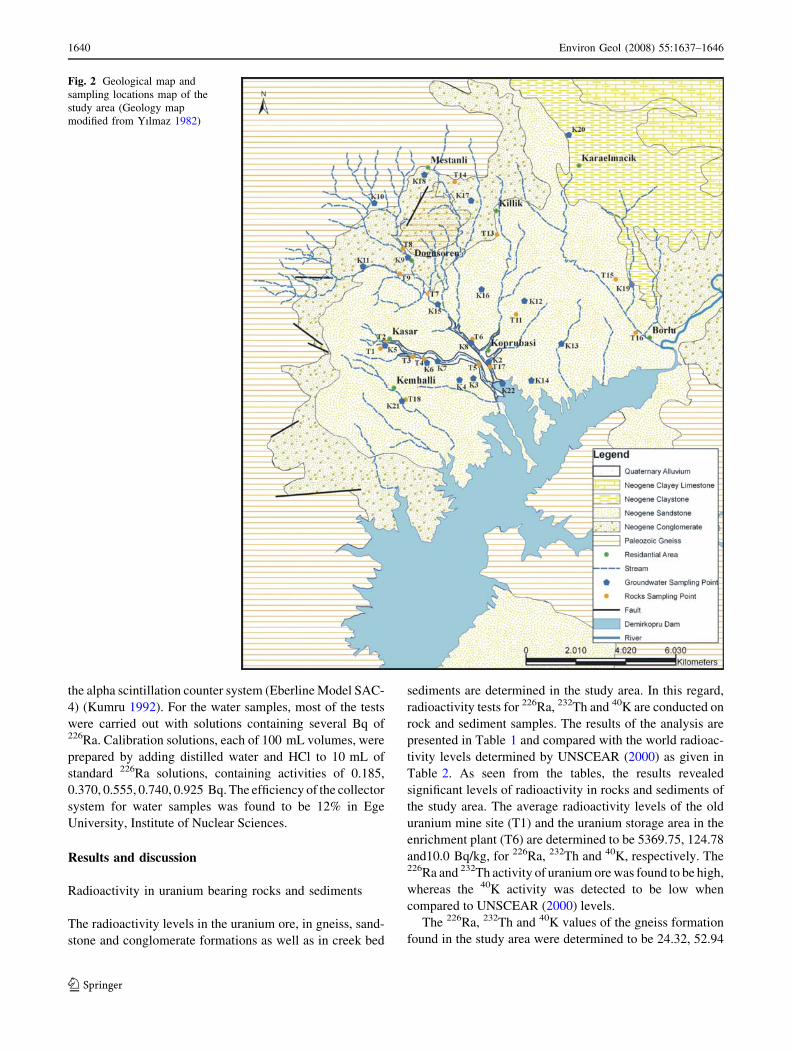
surfacial aquifer characteristics (Fig. 2). The confined
conglomerate and sandstone aquifer is the main aquifer of
the region, within which groundwater flows from northwest
to southeast towards Demirkopru Reservoir, and is in
hydraulic interaction with the basement strata. The source
of recharge to this aquifer is the infiltrating precipitation
from the outcropping recharge zones to the northwest of
the basin as well as the leakage from precipitation through
permeable and fractured zones. Several important drinking
and irrigation water supply wells are drilled in this main
aquifer that have depths ranging from 34 to 150 m with
flow rates of 3-5 L/s. The depth of groundwater level in the
main aquifer ranges between 17 and 37 m below ground
1638 Environ Geol (2008) 55:1637–1646
123
surface. The surface aquifer, on the other hand, has limited
supply potential and is typically used by local residents for
individual water supply purposes. Wells in this aquifer
could provide yields as high as 1–3 L/s during winter
months and less than 1 L/s during summer months. These
are typically hand-dug wells with depths ranging between 4
and 6 m, and water levels ranging between 1 and 3 m.
Sampling and experimental procedure
A total of 16 rock and sediment samples were taken from
Koprubasi and environs. In alluvial formation, the soil
samples were taken from a depth of 25 cm by using an
auger. In rocky formation, rock samples were taken from
rock surface representing various locations. A total of 21
water samples are taken from the groundwater wells and
the reservoir in wet season (February 2007). Groundwater
samples were taken after at least 10 minutes of pumping
when the temperature and the specific conductance are
stabilized. Two sets of water samples are taken from wells
and stored in 50 and 500 mL polyethylene bottles after
filtering through 0.45-lm membrane filters. To determine
the physical properties of samples, pH (WTW-pH330) and
electrical conductivity (EC) (WTW-EC330) values are
measured on the field.
For radioactivity measurements of soil and rocks, both
rock and soil samples were dried for 24 h at 105�C, cru-
shed and sieved, through 2 mm meshes. Then, 100 g of the
homogeneous samples was weighed and transferred to the
polypropylene beaker of 44 mm 9 54 mm. The samples
were conserved for a period of 1 month for 226Ra and 232Th
to reach equilibrium conditions with their radionuclide
daughters. The activity concentrations of 226Ra, 232Th and40K in the soil and rock samples were measured by gamma
spectrometer in Ege University, Institute of Nuclear Sci-
ences as described by Kumru and Balcı (1994). In this
method, the two radioactive daughters of 226Ra (214Bi and208TI) are used for quantitative and qualitative analysis
when equilibrium has been established. In this study, the
1.76-MeV peak of 214Bi was used for quantitative deter-
mination of uranium, the 2.62-MeV peak of 208Tl was used
for the quantitative determination of thorium and the 1.46-
MeV peak of radioactive potassium was used for the
quantitative determination of potassium.
For radioactivity measurements on water samples, the
radium activity measurement is made by using a collector
system that included a disintegrations directly measured by
Fig. 1 Location map of the
study area within Aegean region
Environ Geol (2008) 55:1637–1646 1639
123
the alpha scintillation counter system (Eberline Model SAC-
4) (Kumru 1992). For the water samples, most of the tests
were carried out with solutions containing several Bq of226Ra. Calibration solutions, each of 100 mL volumes, were
prepared by adding distilled water and HCl to 10 mL of
standard 226Ra solutions, containing activities of 0.185,
0.370, 0.555, 0.740, 0.925 Bq. The efficiency of the collector
system for water samples was found to be 12% in Ege
University, Institute of Nuclear Sciences.
Results and discussion
Radioactivity in uranium bearing rocks and sediments
The radioactivity levels in the uranium ore, in gneiss, sand-
stone and conglomerate formations as well as in creek bed
sediments are determined in the study area. In this regard,
radioactivity tests for 226Ra, 232Th and 40K are conducted on
rock and sediment samples. The results of the analysis are
presented in Table 1 and compared with the world radioac-
tivity levels determined by UNSCEAR (2000) as given in
Table 2. As seen from the tables, the results revealed
significant levels of radioactivity in rocks and sediments of
the study area. The average radioactivity levels of the old
uranium mine site (T1) and the uranium storage area in the
enrichment plant (T6) are determined to be 5369.75, 124.78
and10.0 Bq/kg, for 226Ra, 232Th and 40K, respectively. The226Ra and 232Th activity of uranium ore was found to be high,
whereas the 40K activity was detected to be low when
compared to UNSCEAR (2000) levels.
The 226Ra, 232Th and 40K values of the gneiss formation
found in the study area were determined to be 24.32, 52.94
Fig. 2 Geological map and
sampling locations map of the
study area (Geology map
modified from Yılmaz 1982)
1640 Environ Geol (2008) 55:1637–1646
123
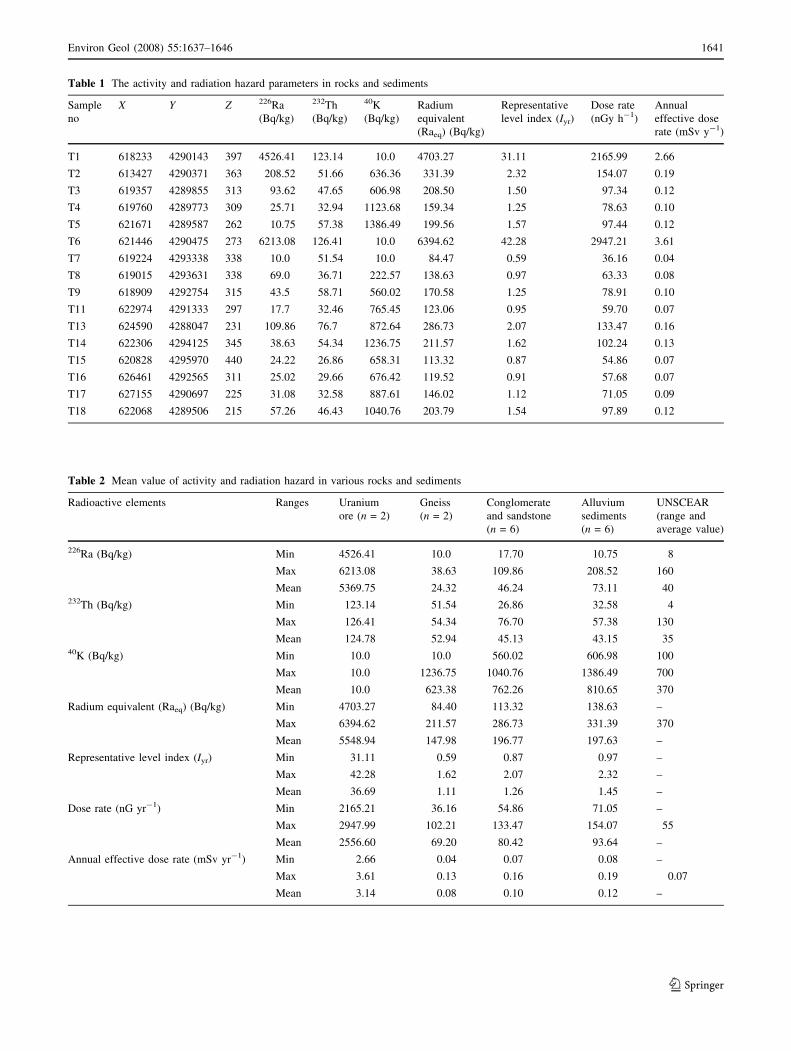
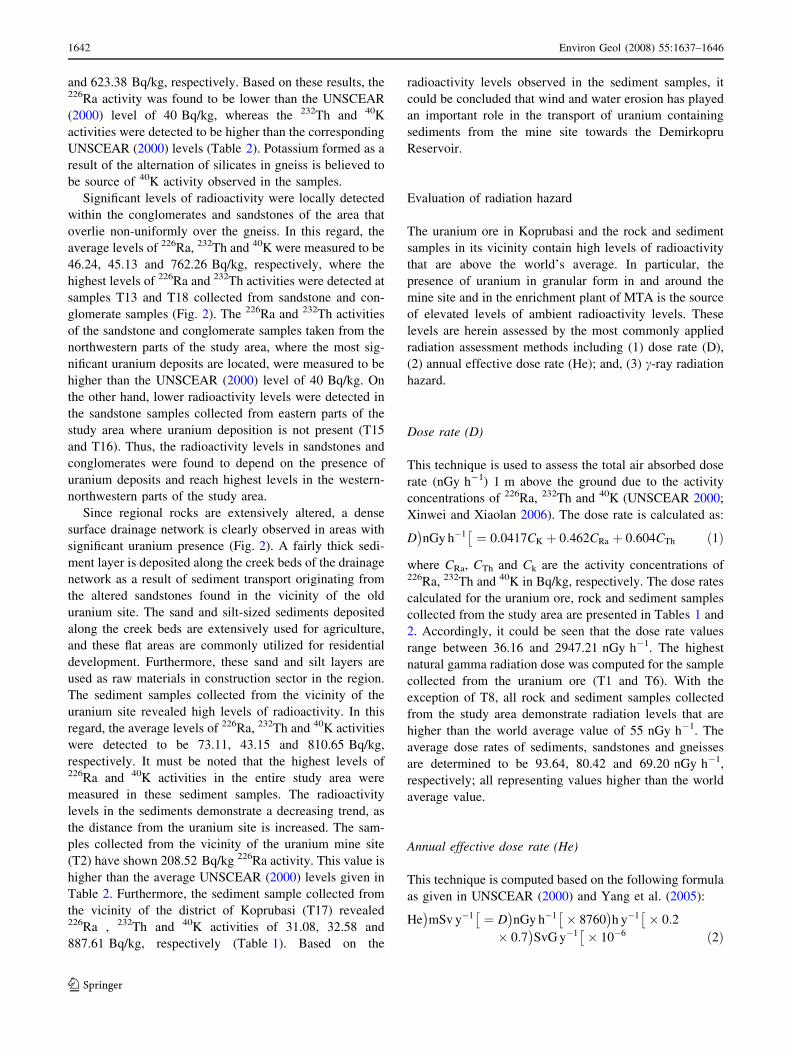
Table 1 The activity and radiation hazard parameters in rocks and sediments
Sample
no
X Y Z 226Ra
(Bq/kg)
232Th
(Bq/kg)
40K
(Bq/kg)
Radium
equivalent
(Raeq) (Bq/kg)
Representative
level index (Iyr)
Dose rate
(nGy h-1)
Annual
effective dose
rate (mSv y-1)
T1 618233 4290143 397 4526.41 123.14 10.0 4703.27 31.11 2165.99 2.66
T2 613427 4290371 363 208.52 51.66 636.36 331.39 2.32 154.07 0.19
T3 619357 4289855 313 93.62 47.65 606.98 208.50 1.50 97.34 0.12
T4 619760 4289773 309 25.71 32.94 1123.68 159.34 1.25 78.63 0.10
T5 621671 4289587 262 10.75 57.38 1386.49 199.56 1.57 97.44 0.12
T6 621446 4290475 273 6213.08 126.41 10.0 6394.62 42.28 2947.21 3.61
T7 619224 4293338 338 10.0 51.54 10.0 84.47 0.59 36.16 0.04
T8 619015 4293631 338 69.0 36.71 222.57 138.63 0.97 63.33 0.08
T9 618909 4292754 315 43.5 58.71 560.02 170.58 1.25 78.91 0.10
T11 622974 4291333 297 17.7 32.46 765.45 123.06 0.95 59.70 0.07
T13 624590 4288047 231 109.86 76.7 872.64 286.73 2.07 133.47 0.16
T14 622306 4294125 345 38.63 54.34 1236.75 211.57 1.62 102.24 0.13
T15 620828 4295970 440 24.22 26.86 658.31 113.32 0.87 54.86 0.07
T16 626461 4292565 311 25.02 29.66 676.42 119.52 0.91 57.68 0.07
T17 627155 4290697 225 31.08 32.58 887.61 146.02 1.12 71.05 0.09
T18 622068 4289506 215 57.26 46.43 1040.76 203.79 1.54 97.89 0.12
Table 2 Mean value of activity and radiation hazard in various rocks and sediments
Radioactive elements Ranges Uranium
ore (n = 2)
Gneiss
(n = 2)
Conglomerate
and sandstone
(n = 6)
Alluvium
sediments
(n = 6)
UNSCEAR
(range and
average value)
226Ra (Bq/kg) Min 4526.41 10.0 17.70 10.75 8
Max 6213.08 38.63 109.86 208.52 160
Mean 5369.75 24.32 46.24 73.11 40232Th (Bq/kg) Min 123.14 51.54 26.86 32.58 4
Max 126.41 54.34 76.70 57.38 130
Mean 124.78 52.94 45.13 43.15 3540K (Bq/kg) Min 10.0 10.0 560.02 606.98 100
Max 10.0 1236.75 1040.76 1386.49 700
Mean 10.0 623.38 762.26 810.65 370
Radium equivalent (Raeq) (Bq/kg) Min 4703.27 84.40 113.32 138.63 –
Max 6394.62 211.57 286.73 331.39 370
Mean 5548.94 147.98 196.77 197.63 –
Representative level index (Iyr) Min 31.11 0.59 0.87 0.97 –
Max 42.28 1.62 2.07 2.32 –
Mean 36.69 1.11 1.26 1.45 –
Dose rate (nG yr-1) Min 2165.21 36.16 54.86 71.05 –
Max 2947.99 102.21 133.47 154.07 55
Mean 2556.60 69.20 80.42 93.64 –
Annual effective dose rate (mSv yr-1) Min 2.66 0.04 0.07 0.08 –
Max 3.61 0.13 0.16 0.19 0.07
Mean 3.14 0.08 0.10 0.12 –
Environ Geol (2008) 55:1637–1646 1641
123
and 623.38 Bq/kg, respectively. Based on these results, the226Ra activity was found to be lower than the UNSCEAR
(2000) level of 40 Bq/kg, whereas the 232Th and 40K
activities were detected to be higher than the corresponding
UNSCEAR (2000) levels (Table 2). Potassium formed as a
result of the alternation of silicates in gneiss is believed to
be source of 40K activity observed in the samples.
Significant levels of radioactivity were locally detected
within the conglomerates and sandstones of the area that
overlie non-uniformly over the gneiss. In this regard, the
average levels of 226Ra, 232Th and 40K were measured to be
46.24, 45.13 and 762.26 Bq/kg, respectively, where the
highest levels of 226Ra and 232Th activities were detected at
samples T13 and T18 collected from sandstone and con-
glomerate samples (Fig. 2). The 226Ra and 232Th activities
of the sandstone and conglomerate samples taken from the
northwestern parts of the study area, where the most sig-
nificant uranium deposits are located, were measured to be
higher than the UNSCEAR (2000) level of 40 Bq/kg. On
the other hand, lower radioactivity levels were detected in
the sandstone samples collected from eastern parts of the
study area where uranium deposition is not present (T15
and T16). Thus, the radioactivity levels in sandstones and
conglomerates were found to depend on the presence of
uranium deposits and reach highest levels in the western-
northwestern parts of the study area.
Since regional rocks are extensively altered, a dense
surface drainage network is clearly observed in areas with
significant uranium presence (Fig. 2). A fairly thick sedi-
ment layer is deposited along the creek beds of the drainage
network as a result of sediment transport originating from
the altered sandstones found in the vicinity of the old
uranium site. The sand and silt-sized sediments deposited
along the creek beds are extensively used for agriculture,
and these flat areas are commonly utilized for residential
development. Furthermore, these sand and silt layers are
used as raw materials in construction sector in the region.
The sediment samples collected from the vicinity of the
uranium site revealed high levels of radioactivity. In this
regard, the average levels of 226Ra, 232Th and 40K activities
were detected to be 73.11, 43.15 and 810.65 Bq/kg,
respectively. It must be noted that the highest levels of226Ra and 40K activities in the entire study area were
measured in these sediment samples. The radioactivity
levels in the sediments demonstrate a decreasing trend, as
the distance from the uranium site is increased. The sam-
ples collected from the vicinity of the uranium mine site
(T2) have shown 208.52 Bq/kg 226Ra activity. This value is
higher than the average UNSCEAR (2000) levels given in
Table 2. Furthermore, the sediment sample collected from
the vicinity of the district of Koprubasi (T17) revealed226Ra , 232Th and 40K activities of 31.08, 32.58 and
887.61 Bq/kg, respectively (Table 1). Based on the
radioactivity levels observed in the sediment samples, it
could be concluded that wind and water erosion has played
an important role in the transport of uranium containing
sediments from the mine site towards the Demirkopru
Reservoir.
Evaluation of radiation hazard
The uranium ore in Koprubasi and the rock and sediment
samples in its vicinity contain high levels of radioactivity
that are above the world’s average. In particular, the
presence of uranium in granular form in and around the
mine site and in the enrichment plant of MTA is the source
of elevated levels of ambient radioactivity levels. These
levels are herein assessed by the most commonly applied
radiation assessment methods including (1) dose rate (D),
(2) annual effective dose rate (He); and, (3) c-ray radiation
hazard.
Dose rate (D)
This technique is used to assess the total air absorbed dose
rate (nGy h-1) 1 m above the ground due to the activity
concentrations of 226Ra, 232Th and 40K (UNSCEAR 2000;
Xinwei and Xiaolan 2006). The dose rate is calculated as:
D nGy h�1� �
¼ 0:0417CK þ 0:462CRa þ 0:604CTh ð1Þ
where CRa, CTh and Ck are the activity concentrations of226Ra, 232Th and 40K in Bq/kg, respectively. The dose rates
calculated for the uranium ore, rock and sediment samples
collected from the study area are presented in Tables 1 and
2. Accordingly, it could be seen that the dose rate values
range between 36.16 and 2947.21 nGy h-1. The highest
natural gamma radiation dose was computed for the sample
collected from the uranium ore (T1 and T6). With the
exception of T8, all rock and sediment samples collected
from the study area demonstrate radiation levels that are
higher than the world average value of 55 nGy h-1. The
average dose rates of sediments, sandstones and gneisses
are determined to be 93.64, 80.42 and 69.20 nGy h-1,
respectively; all representing values higher than the world
average value.
Annual effective dose rate (He)
This technique is computed based on the following formula
as given in UNSCEAR (2000) and Yang et al. (2005):
He mSv y�1� �
¼ D nGy h�1� �
� 8760 h y�1� �
� 0:2
� 0:7 SvG y�1� �
� 10�6 ð2Þ
1642 Environ Geol (2008) 55:1637–1646
123
The He values calculated for the uranium ore, rock and
sediment samples collected from the study area are pre-
sented in Tables 1 and 2. The annual effective dose rates in
air varied from 0.07 to 3.61 mSv y-1 with an average of
3.14 mSv y-1 in the uranium ore and a range of 0.10–
0.12 mSv y-1 in rock and sediment samples (Table 2). On
the other hand, the sediment samples collected from the
vicinity of the mine site has revealed an effective dose rate
of 0.12 mSv y-1. The annual effective dose rates in all
sediment samples are above the world average value of
0.07 mSv y-1. The major source of D and He in the study
area is the Ra versus Th originating from the mine site and
the 40K that is naturally found in regional rocks. In par-
ticular, the sediments collected from the old mine site, the
enrichment plant and the creek beds demonstrate high
levels of radiation levels that are above the world average.
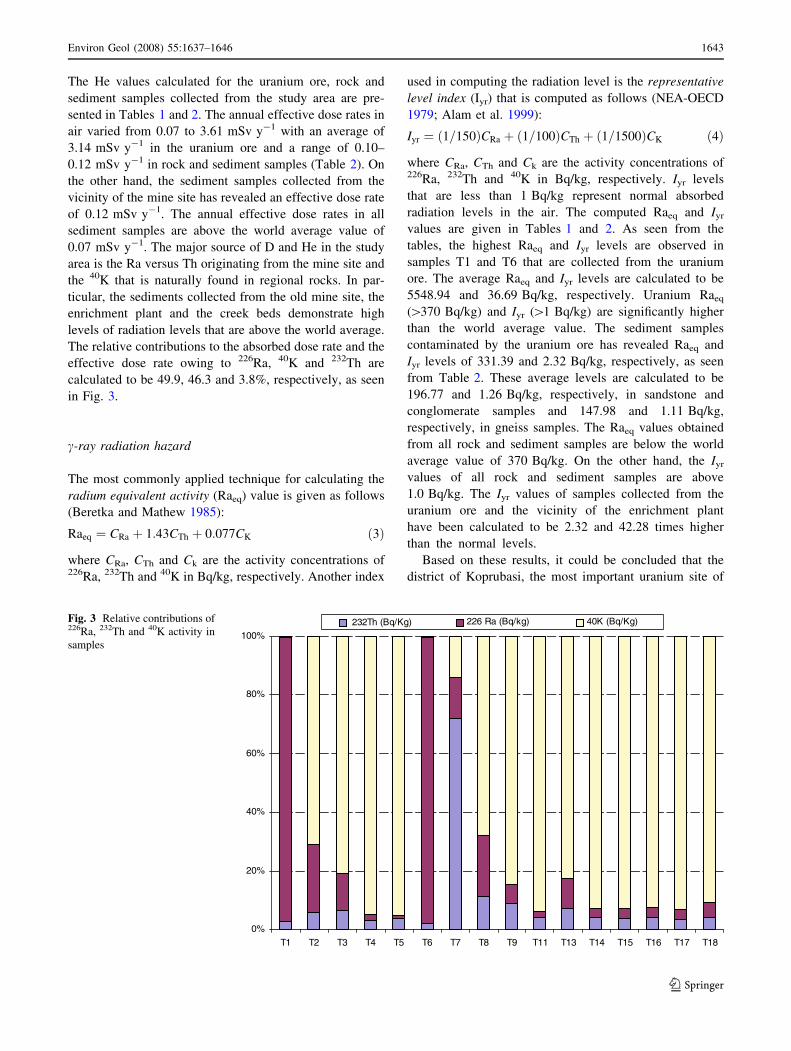
The relative contributions to the absorbed dose rate and the
effective dose rate owing to 226Ra, 40K and 232Th are
calculated to be 49.9, 46.3 and 3.8%, respectively, as seen
in Fig. 3.
c-ray radiation hazard
The most commonly applied technique for calculating the
radium equivalent activity (Raeq) value is given as follows
(Beretka and Mathew 1985):
Raeq ¼ CRa þ 1:43CTh þ 0:077CK ð3Þ
where CRa, CTh and Ck are the activity concentrations of226Ra, 232Th and 40K in Bq/kg, respectively. Another index
used in computing the radiation level is the representative
level index (Iyr) that is computed as follows (NEA-OECD
1979; Alam et al. 1999):
Iyr ¼ 1=150ð ÞCRa þ 1=100ð ÞCTh þ 1=1500ð ÞCK ð4Þ
where CRa, CTh and Ck are the activity concentrations of226Ra, 232Th and 40K in Bq/kg, respectively. Iyr levels
that are less than 1 Bq/kg represent normal absorbed
radiation levels in the air. The computed Raeq and Iyr
values are given in Tables 1 and 2. As seen from the
tables, the highest Raeq and Iyr levels are observed in
samples T1 and T6 that are collected from the uranium
ore. The average Raeq and Iyr levels are calculated to be
5548.94 and 36.69 Bq/kg, respectively. Uranium Raeq
([370 Bq/kg) and Iyr ([1 Bq/kg) are significantly higher
than the world average value. The sediment samples
contaminated by the uranium ore has revealed Raeq and
Iyr levels of 331.39 and 2.32 Bq/kg, respectively, as seen
from Table 2. These average levels are calculated to be
196.77 and 1.26 Bq/kg, respectively, in sandstone and
conglomerate samples and 147.98 and 1.11 Bq/kg,
respectively, in gneiss samples. The Raeq values obtained
from all rock and sediment samples are below the world
average value of 370 Bq/kg. On the other hand, the Iyr
values of all rock and sediment samples are above
1.0 Bq/kg. The Iyr values of samples collected from the
uranium ore and the vicinity of the enrichment plant
have been calculated to be 2.32 and 42.28 times higher
than the normal levels.
Based on these results, it could be concluded that the
district of Koprubasi, the most important uranium site of
0%
20%
40%
60%
80%
100%
T1 T2 T3 T4 T5 T6 T7 T8 T9 T11 T13 T14 T15 T16 T17 T18
232Th (Bq/Kg) 226 Ra (Bq/kg) 40K (Bq/Kg)Fig. 3 Relative contributions of226Ra, 232Th and 40K activity in
samples
Environ Geol (2008) 55:1637–1646 1643
123
Turkey, and its immediate vicinity contains above normal
levels of radiation originating from the old mine site as
well as in the regional rocks and sediments. In particular,
the c-ray radiation levels of the uranium ore, sediments and
rocks situated in the immediate vicinity of the old mine site
are significantly higher than the world average values.
Radioactivity in waters
As discussed in previous sections, the rocks and sediment
layers of the study area demonstrate aquifer properties and
bear groundwater that is utilized for drinking water pur-
poses as well as for agricultural irrigation. The high levels
of radioactivity in rocks and sediments are also crucial with
regard to determining the radioactivity levels in surface and
subsurface water resources of the study area. In this regard,
water samples are collected from the surfacial alluvial
aquifer (K5, K7, K8 and K15) that comprises creek sedi-
ments, from the sandstone aquifer (K2, K3, 4, 5, 8, 9, 10,
11, 12, 13, 14, 16, 17, 18, 19, 20 and 21) and from the
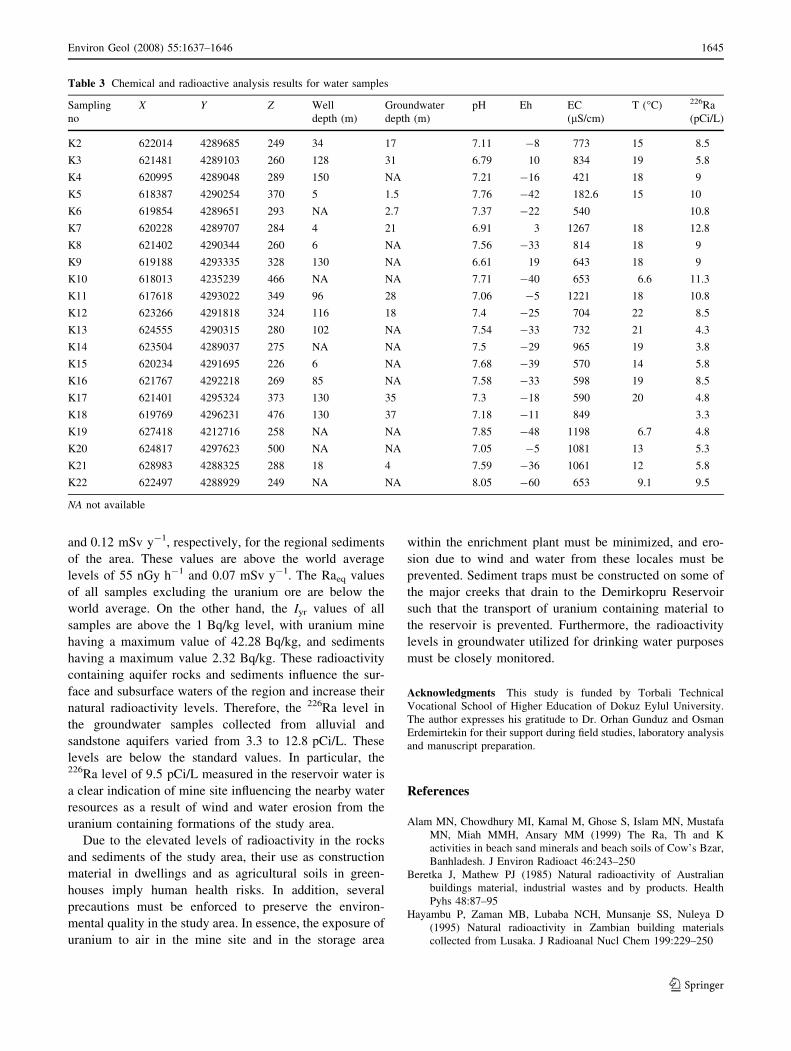
reservoir (K22). The results of the radioactivity levels in
these water samples are given in Table 3. Based on these
results, the pH values of groundwater samples collected
from sediments and sandstones are weakly acidic to neutral
(6.61 to 7.85), whereas the pH value of the reservoir waters
are basic (8.05). The Eh potential of all water samples
range between -60 and +10, with lowest Eh values being
measured in basic waters and highest values being mea-
sured in groundwater samples collected from the vicinity of
the uranium mine site (K3, K9 and K7). The electrical
conductivity values in groundwater samples collected from
both the surfacial aquifer and the sandstone aquifer range
between 182.6 and 1,221 lS/cm, with highest value
occurring within the sediments located next to the mine site
(K7). When the EC distribution in samples collected from
the sandstones are considered, it is observed that the
highest values are observed in the northwestern parts of
the study area where uranium presence is at its maximum.
The water temperatures, on the other hand, range between
6.6 and 21.6�C, with samples collected from the sediment
layers being generally colder than the samples collected
from the sandstones. With respect to physical characteris-
tics, it could be concluded that groundwater samples are
influenced from the uranium containing rocks and sedi-
ments as a result of rock–water interaction.
Being a decay series element of uranium, the radioactive
radium 226Ra analysis is conducted to detect the presence
of natural radioactivity in water samples, and the results of
these analyses are presented in Table 3. It is known that the
presence of radium in different forms in natural waters is
one of the major causes of radioactivity-originated cancers.
It accumulates in bone tissue and causes bone and liver
cancers (USEPA 1991). The international standard on
combined radium (226Ra + 228Ra) is set at 5 pCi/L,
whereas the maximum allowable limit for 226Ra is set at
15 pCi/L (USEPA 1991). In this regard, the 226Ra levels
range between 5.8 and 12.8 pCi/L in water samples col-
lected from sediments and between 3.3 and 11.3 pCi/L in
samples collected from sandstone and conglomerates. The226Ra level in the reservoir water was measured to be
9.5 pCi/L. These levels are below the standard values.
In particular, the K2 sample collected from the drinking
water supply well of the district of Koprubasi that is drilled
in the alluvial and sandstone layers had a 226Ra level of
8.5 pCi/L (Fig. 2). Sidhu and Breithart (1998) have com-
puted risk factors of 5E10-5 and 1E10-4, for 226Ra levels
of 5 and 10 pCi/L, respectively. These computations are
based on an average daily human intake of radium present
in water for an average of 2 L of drinking water per day
throughout his lifetime. Based on this assessment, 5 in
100,000 people will be exposed to cancer risk for 226Ra
level of 5 pCi/L, and 10 in 100,000 people for 226Ra level
of 10 pCi/L. Although no cases of radioactivity-originated
cancers are reported within the study area, its radioactivity
levels need to be monitored on a routine basis. Further-
more, the radium levels in surface and subsurface waters of
the study area vary as a function of the pH of water. Water
Eh potential show positive correlation with pH and 226Ra,
whereas Eh show negative correlation with electrical con-
ductivity value. The dissolved uranium is shown to
increase the 226Ra levels and gross alpha activity in waters.
In this regard, water resources are influenced from rock and
sediment radioactivity which is verified particularly in high
uranium bearing rocks and sediments. Finally, the presence
of radium in reservoir waters demonstrates the fact that the
eroded sediments from the old mine site and its vicinity
could negatively influence the quality of water in the
reservoir.
Conclusions
The 226Ra, 40K and 232Th values in the uranium ore and in
the regional aquifer rocks and sediments are above
the international standards at the Koprubasi site, that is the
most significant uranium mine in Turkey. Based on the
dose rate and the effective dose rate values calculated for
the samples collected from the rocks and sediments of the
area that are used to assess the presence of radiation dan-
ger, it has been found out that inactive uranium mine and
the storage area in the abandoned enrichment plant are
significant sources of radioactive level. The average dose
rate and the average effective dose rate values were cal-
culated to be 2556.60 nG y-1 and 3.14 mSv y-1,
respectively, for the uranium ore as well as 99.71 nG y-1
1644 Environ Geol (2008) 55:1637–1646
123
and 0.12 mSv y-1, respectively, for the regional sediments
of the area. These values are above the world average
levels of 55 nGy h-1 and 0.07 mSv y-1. The Raeq values
of all samples excluding the uranium ore are below the
world average. On the other hand, the Iyr values of all
samples are above the 1 Bq/kg level, with uranium mine
having a maximum value of 42.28 Bq/kg, and sediments
having a maximum value 2.32 Bq/kg. These radioactivity
containing aquifer rocks and sediments influence the sur-
face and subsurface waters of the region and increase their
natural radioactivity levels. Therefore, the 226Ra level in
the groundwater samples collected from alluvial and
sandstone aquifers varied from 3.3 to 12.8 pCi/L. These
levels are below the standard values. In particular, the226Ra level of 9.5 pCi/L measured in the reservoir water is
a clear indication of mine site influencing the nearby water
resources as a result of wind and water erosion from the
uranium containing formations of the study area.
Due to the elevated levels of radioactivity in the rocks
and sediments of the study area, their use as construction
material in dwellings and as agricultural soils in green-
houses imply human health risks. In addition, several
precautions must be enforced to preserve the environ-
mental quality in the study area. In essence, the exposure of
uranium to air in the mine site and in the storage area
within the enrichment plant must be minimized, and ero-
sion due to wind and water from these locales must be
prevented. Sediment traps must be constructed on some of
the major creeks that drain to the Demirkopru Reservoir
such that the transport of uranium containing material to
the reservoir is prevented. Furthermore, the radioactivity
levels in groundwater utilized for drinking water purposes
must be closely monitored.
Acknowledgments This study is funded by Torbali Technical
Vocational School of Higher Education of Dokuz Eylul University.
The author expresses his gratitude to Dr. Orhan Gunduz and Osman
Erdemirtekin for their support during field studies, laboratory analysis
and manuscript preparation.
References
Alam MN, Chowdhury MI, Kamal M, Ghose S, Islam MN, Mustafa
MN, Miah MMH, Ansary MM (1999) The Ra, Th and K
activities in beach sand minerals and beach soils of Cow’s Bzar,
Banhladesh. J Environ Radioact 46:243–250
Beretka J, Mathew PJ (1985) Natural radioactivity of Australian
buildings material, industrial wastes and by products. Health
Pyhs 48:87–95
Hayambu P, Zaman MB, Lubaba NCH, Munsanje SS, Nuleya D
(1995) Natural radioactivity in Zambian building materials
collected from Lusaka. J Radioanal Nucl Chem 199:229–250
Table 3 Chemical and radioactive analysis results for water samples
Sampling
no
X Y Z Well
depth (m)
Groundwater
depth (m)
pH Eh EC
(lS/cm)
T (�C) 226Ra
(pCi/L)
K2 622014 4289685 249 34 17 7.11 -8 773 15 8.5
K3 621481 4289103 260 128 31 6.79 10 834 19 5.8
K4 620995 4289048 289 150 NA 7.21 -16 421 18 9
K5 618387 4290254 370 5 1.5 7.76 -42 182.6 15 10
K6 619854 4289651 293 NA 2.7 7.37 -22 540 10.8
K7 620228 4289707 284 4 21 6.91 3 1267 18 12.8
K8 621402 4290344 260 6 NA 7.56 -33 814 18 9
K9 619188 4293335 328 130 NA 6.61 19 643 18 9
K10 618013 4235239 466 NA NA 7.71 -40 653 6.6 11.3
K11 617618 4293022 349 96 28 7.06 -5 1221 18 10.8
K12 623266 4291818 324 116 18 7.4 -25 704 22 8.5
K13 624555 4290315 280 102 NA 7.54 -33 732 21 4.3
K14 623504 4289037 275 NA NA 7.5 -29 965 19 3.8
K15 620234 4291695 226 6 NA 7.68 -39 570 14 5.8
K16 621767 4292218 269 85 NA 7.58 -33 598 19 8.5
K17 621401 4295324 373 130 35 7.3 -18 590 20 4.8
K18 619769 4296231 476 130 37 7.18 -11 849 3.3
K19 627418 4212716 258 NA NA 7.85 -48 1198 6.7 4.8
K20 624817 4297623 500 NA NA 7.05 -5 1081 13 5.3
K21 628983 4288325 288 18 4 7.59 -36 1061 12 5.8
K22 622497 4288929 249 NA NA 8.05 -60 653 9.1 9.5
NA not available
Environ Geol (2008) 55:1637–1646 1645
123
Kacmaz H, Nakoman ME (2006) The effects of mineralogical and
geochemical features of the gneisses of the formation of
Koprubasi (Manisa) uranium deposit. Sci Technol Bull Earth
Sci 48–49:149–158
Kumru MN (1992) Determination of radium-226 in environmental
samples by the collector chamber method. Appl Radiat Isot
43(8):1031–1034
Kumru MN, Balcı A (1994) Natural radioactivity analysis of seven
Black Sea Cores in Turkey. Turk J Nucl Sci 21(1):43–53
Manisa (2004) Manisa environment report, pp 613 (in Turkish)
NEA-OECD (1979) Nuclear Energy Agency, exposure to radiation
from natural radioactivity in building materials. Reported by
NEA Group of Experts, OECD, Paris
Sidhu KS, Breithart S (1998) Naturally occurring radium 226 and
radium 228 in water supplies of Michigan. Bull Environ Contam
Toxical 61:722–729
Singh S, Sharma DK, Dhar S, Kumar A, Kumar A (2006) Uranium,
radium and radon measurement in the environments of Nurpur
Area, Himachal Himalayas, India. Environ Monit Assess.
doi:10.1007/s10661-006-9313-7
Sroor A, Afifi SY, Abdel-Haleem AS, Salman AB, Andel-Sammad M
(2002) Environmental pollutant isotope measurements and
natural radioactivity assessment for North Tushki area, south-
western desert, Egypt. Appl Radiat Isot 57:427–436
United States Environmental Protection Agency (1986) Guidelines for
carcinogen risk assessment. Fed Regist 51(185):33994–34002
United States Environmental Protection Agency (1991) National
primary drinking water regulation radionuclides: proposed rule.
Fed Regist 56(138):34836–34862
UNSCEAR (2000) United Nations Committee on the effects of
atomic radiation report to the general assembly, Report vol I.
Sources and effects of ionizing radiation
TAEK (2004) Uranyum, Turkiye Atom Enerjisi Kurumu. Ankara
Xinwei L, Xiaolan Z (2006) Measurement of natural radioactivity in
sand samples collected from the Baoji Weihe Sands Park, China.
Environ Geol 50:977–982
Yang YW, Wu XM, Jiang ZY, Wang WX, Lu JG, Lin J, Wang LM,
Hsia YF (2005) Radioactivity concentration in soils of the
Xiazhuang granite area, China. Appl Radiat Isot 63:255–259
Yılmaz H (1982) Koprubası uranyum yataklarındaki dogal radyoaktif
dengesizlik hakkında. Turkiye Jeoloji Kurumu Bulteni C.25:91–
94
Yılmaz H (1981) Genesis of Uranium deposits in Neogene sedimen-
tary rocks overlying the Menderes Metamorphic massif, Turkey.
Chem Geol 31:185–210
Zepecza OS, Szabo Z (1986) Natural radioactivity in groundwater, a
review. National Water Summary. US Geological Survey Water
Supply Paper, pp 50–57
Woo NC, Choi MJ, Lee KS (2002) Assessment of groundwater
quality and contamination from uranium bearing black shale in
Goesan-Boeun Areas, Korean. Environ Geochem Health
24:261–273
1646 Environ Geol (2008) 55:1637–1646
123